applications of ab initio quantum chemistry to small...
TRANSCRIPT
Applications of ab initio quantum chemistry
to small organic molecules
A Thesis
submitted to the University of Lucknow
for the degree
of
Doctor of Philosophy in Physics
by
Alok Kumar Sachan
Under the Supervision of
Prof. Leena Sinha
Department of Physics University of Lucknow
Lucknow - 226 007 INDIA (2015)
CERTIFICATE
This is to certify that all the regulations necessary for the
submission of Ph.D. thesis entitled “Applications of ab initio
quantum chemistry to small organic molecules” by Alok Kumar
Sachan have been fully observed. The contents of this thesis have
not been presented anywhere else for the award of a Ph.D. degree.
(Prof. Leena Sinha) Professor Department of Physics University of Lucknow Lucknow - 226 007
(Prof. Kirti Sinha) Professor & Head
Department of Physics University of Lucknow
Lucknow - 226 007
CERTIFICATE
This is to certify that the work contained in the thesis entitled
“Applications of ab initio quantum chemistry to small organic
molecules” by Alok Kumar Sachan has been carried out under my
supervision and that this work has not been submitted elsewhere
for a Ph.D. degree.
(Prof. Leena Sinha) Professor Department of Physics University of Lucknow Lucknow - 226 007
Acknowledgements
The completion of my thesis entitled “Applications of ab initio quantum
chemistry to small organic molecules” brings a great sense of satisfaction
with it. I am very thankful to the almighty for his grace. My happiness at the
submission of my work can only be expressed in terms of my
acknowledgements of the help and guidance that I received at every step while
making efforts that have gone in this thesis.
First of all, I would like to express my thanks to my honoured supervisor, Prof.
Leena Sinha for giving me an opportunity to earn a Ph.D. under her expert
guidance. She has guided me step by step in the research process and is an
idyllic advisor that I can imagine. Her enlightening guidance and sympathetic
attitude exhibited during the entire course of this work. Her many new ways to
enrich the content have resulted various constructive ideas.
My gratitude also extends to Prof. Onkar Prasad, who deserves special
thanks as this thesis work would not have been possible without his kind
support and encouragement. His understanding, encouraging suggestions and
personal guidance have provided a good basis for the present work.
I would like to thank the Head of Physics Department Prof. Kirti Sinha
for allowing me to avail the facilities of department and constant
encouragement towards completion of work.
I wish to acknowledge my research fellows Mr. Satish Chand,
Mr. Shilendra K. Pathak, Ms. Ruchi Srivastava and Mr. Vikas K. Shukla for their
co-operation, fruitful discussions during the entire course of research work. I
sincerely wish to acknowledge the affection and support of my senior colleague
Dr. Amrendra Kumar in extending to me their full co-operation and sharing with
me from time to time their research experiences which proved very helpful
during the entire work.
I express my deepest sense of gratitude towards my mother and father
who have always been a source of inspiration and had been guiding my path. I
wish the special word of thanks for my wife Mrs. Sarita Sachan, and daughter
Samridhi Sachan for extending every care, moral support and affection to
enable this work to become a reality.
Last but not the least I wish to express my heartful indebtness to those
who helped me at different stages in various ways during the completion of
work.
(Alok Kumar Sachan)
LIST OF PUBLISHED PAPERS
1. “Electronic structure, Non-linear properties and Vibrational analysis of ortho,
meta and para-Hydroxybenzaldehyde by Density Functional Theory”,
Research Journal of Recent Sciences, Vol. 2 (2013) 150–157.
2. “Molecular structure, vibrational and electronic properties of 4-Phenyl-3H-
1,3-thiazol-2-ol using density functional theory and comparison of drug
efficacy of keto and enol forms by QSAR analysis”, Spetrochemica Acta A,
132 (2014) 568–581.
3. “Quantum Chemical study of Molecular structure, Non Linear Optical and
Vibrational Properties of pyridine and pentachloropyridine”, Journal of
Chemical and Pharmaceutical Research, 6 (3) (2014) 1434–1444.
4. “FT-IR, FT-Raman and UV spectroscopic investigation, electronic properties,
electric moments, and NBO analysis of anethole using quantum chemical
calculations”, Spetrochemica Acta Part A, 133 (2014) 165–177.
5. “Spectroscopic (FT-IR, FT-Raman, and UV–visible) and quantum chemical
studies on molecular geometry, Frontier molecular orbitals, NBO, NLO and
thermodynamic properties of 1- acetylindole”, Spectrochimica Acta Part A,
133 (2014) 626–638.
6. “A combined experimental and theoretical investigation of 2-Thienylboronic
acid: Conformational search, molecular structure, NBO, NLO and FT-IR, FT-
Raman, NMR and UV spectral analysis”, Journal of Molecular Structure,
1076 (2014) 639–650.
7. “Structural, vibrational, and electronic properties of Succinimide, N-Hydroxy
Succinimide and N-Methyl Succinimide by density functional theory: A
comparative study”, Journal of Chemical and Pharmaceutical Research,
2014, 6(11) 211–227.
8. “Experimental (FT-IR, FT-Raman, UV and NMR) and quantum chemical
studies on molecular structure, spectroscopic analysis, NLO, NBO and
reactivity descriptors of 3,5-Difluoroaniline”, Spectrochimica Acta Part A,
135 (2015) 283–295.
1
TABLE OF CONTENTS
Page Number
Chapter 1: Introduction 4-23
1.1 Introduction 1.2 Quantum Chemical Methods 1.3 Techniques used for the Study of Vibrational Properties
1.3.1 IR-Spectroscopy 1.3.2 FT-Raman Spectroscopy
1.4 UV-Vis Spectroscopy 1.5 NMR Spectroscopy 1.6 Compounds Studied References
Chapter 2: Theory 24-57
2.1 The Key Equation: The Schrodinger Equation 2.2 Born-Oppenheimer Approximation 2.3 The Basic Theory: Hartree-Fock(HF) Theory 2.3.1 The Wave-function in terms of Slater Determinant 2.3.2 The Fock Operator 2.3.3 The Hartree-Fock Hamiltonian 2.3.4 Concept of Basis Sets and its various types 2.3.5 Limitations/Shortcomings of Hartree-Fock Theory 2.4 Introduction of Electron-Electron Correlation 2.5 Density Functional Theory 2.5.1 Basis Functionals 2.5.2 Advanced Functionals 2.5.3 Hybrid Functionals 2.5.4 Advantages and Disadvantages of DFT 2.6 Elementary Theory of DFT 2.6.1 The Hohenberg-Kohn theorems 2.6.2 The Kohn-Sham equations 2.7 Application of Quantum Chemical Methods 2.7.1 Search for lowest energy conformer/Geometry Optimization 2.7.2 Wavenumber Calculations 2.7.3 Calculation of Electric moments 2.7.4 Prediction of Thermodynamic Properties 2.7.5 Calculation of UV spectra References

2
Chapter 3: Molecular structure, vibrational and electronic properties of 58-106
4-Phenyl-3H-1,3-thiazol-2-ol using density functional theory
and comparison of drug efficacy of keto and enol forms by
QSAR analysis
3.1 Introduction 3.2 Experimental and Computational Details 3.2.1 Sample & Instrumentation 3.2.2 Computational Details 3.2.3 Prediction of Raman intensities 3.3 Result and Discussion 3.3.1 Molecular geometry and PES sacn studies 3.3.2 Vibrational Analysis 3.3.2.1 Thiazole ring vibrations 3.3.2.2 Phenyl Ring vibrations 3.3.2.3 O-H vibrations 3.3.3 Electric moments 3.3.4 Electronic properties and UV-spectral analysis 3.3.5 NBO Analysis
3.3.6 Quantitative structure activity relationship (QSAR) properties: Keto and enol form
3.4 Conclusions References
Chapter 4: A combined experimental and theoretical investigation of 107-154
2-Thienylboronic acid: Conformational search, molecular
structure, NBO, NLO and FT-IR, FT-Raman, NMR and
UV spectral analysis
4.1 Introduction 4.2 Experimental and Computational Details 4.2.1 Sample and Instrumentation 4.2.2 Computational details 4.3 Results and Discussion 4.3.1 Conformer analysis and Molecular geometry 4.3.2 Vibrational Analysis 4.3.2.1 Boronic acid moiety (-B(OH)2) 4.3.2.2 Thienyl ring vibrations 4.3.3 Electric moments 4.3.4 UV-Vis studies and electronic properties 4.3.5 Natural bond orbital (NBO) analysis 4.3.6 1H-NMR Spectroscopic analysis 4.3.7 Thermodynamical Analysis 4.4 Conclusions References

3
Chapter 5: Structural, vibrational, and electronic properties of 155-191
Succinimide, N-Hydroxy Succinimide and N-Methyl
Succinimide by density functional theory: A
comparative study
5.1 Introduction 5.2 Computational and Experimental Details 5.3 Results and Discussion
5.3.1 Potential Energy Scan and Molecular Geometry 5.3.2 Electronic Properties 5.3.3 Electric moments 5.3.4 Thermo dynamical Properties 5.3.5 Vibrational Analysis 5.3.5.1 CH2 vibrations 5.3.5.2 CH3 vibrations 5.3.5.3 C=O vibrations 5.3.5.4 OH vibrations 5.4 Conclusions References
Chapter 6: Conclusions 192-199

4
Introduction
5
1.1 Introduction
‘ab initio’ quantum chemistry has emerged as a viable and powerful approach to
address the issues and problems related to the chemical systems. Quantum chemical
calculations offer the real promise of being able to complement experiment as a
means to uncover and explore new chemistry. It is used for predicting the properties
of new materials even those which are not synthesized in the laboratory, using
computer simulation technique. Though, computational cost increases greatly with
increasing system size and with the precision to be achieved. Improvement on the
performance of computers and or that of the theory has made computational
simulations an essential tool, also in material science. Nowadays progressively more
accurate results can be obtained in a reasonable time for even large and complicated
molecular systems. To obtain more accurate determinations of molecular properties,
to be exploited in different applications and to comprehend the physics of molecular
systems, still more reliable methods are needed. Some of the boundless properties
that can be calculated with tackle of quantum chemistry are (i) Calculation of
optimized ground state and transition-state structures (ii) Calculation of vibrational
wave-numbers, IR and Raman Spectra (iii) Characterization of the MOs – predictions
of reactivity (iv) Electric moments such as dipole moments, mean polarizabilities,
and first static hyperpolarizabilities (v) Prediction of electronic excitations and UV

6
spectrum (vi) NMR spectrum (vii) Reaction rates and cross sections (viii)
Thermodynamic parameters (ix) Charge distribution and unpaired spin densities.
The work reported in the thesis deals with the investigation of molecular, structural,
vibrational and energetic data analysis of some small biologically and
pharmaceutically important molecular systems, in gas phase, using Quantum
Chemical methods. Density Functional Theory (DFT) has been used to optimize the
most stable conformer and to explore the ground state properties of the molecules
under investigation. In order to obtain a comprehensive portrayal of molecular
dynamics, vibrational wave-number calculations have also been carried out at the
DFT level. The vibrational analysis also gives the detailed information about the intra
molecular vibrations in the characteristic region. The molecular properties such as
equilibrium ground state energy, dipole moment, polarizability and
hyperpolarizability along with the electrostatic potential maps, have also been used to
understand the activity of the molecules.
1.2 Quantum Chemical Methods
ab initio methods use first principles of quantum mechanics to calculate electronic
structure directly without using quantities derived from experiment. Quantum
chemical models stem from the Schrödinger equation first brought to light in the late
1920‟s. Molecules are considered as collections of nuclei and electrons, without
reference of any kind to chemical bonds. The solution to the Schrödinger equation is
7
in terms of the motions of electrons, is directly related to molecular structure and
energy among other observables, as well as contains information about bonding. As a
matter of fact, the Schrödinger equation cannot be solved in actuality, for any but a
one-electron system (i.e. for the hydrogen atom), and approximations are necessary to
deal with the many electron systems. Quantum chemical models differ from each
other in the form and nature of these approximations, and span a wide range, both in
terms of their ability, consistency and computational cost. There are two different
approaches to obtain the solution of the electronic Schrodinger equation - Wave
function based approach/methods and Density based theory.
Wave function based approaches expand the electronic wave-function as a sum
of Slater determinants and the atomic orbitals and their coefficients are optimized by
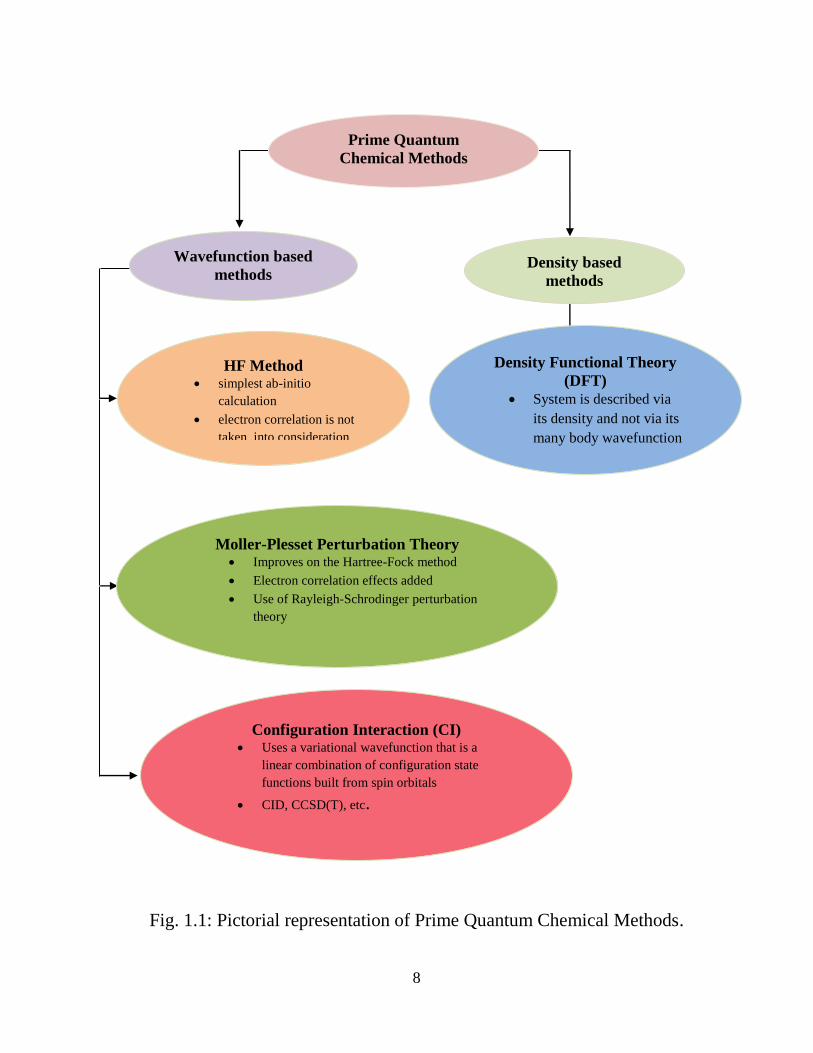
various numerical techniques. Fig. 1.1 shows different types of ab initio calculations
and their fundamental principle. The simplest and most fundamental ab initio
electronic structure calculation is the Hartree-Fock (HF) method. The Hartree-Fock
method was first put forwarded in the 1950‟s, and was established on the assumption
that the N-body wave function of the system can be approximated by a single Slater
determinant of N-spin orbitals. It provides respectable descriptions of equilibrium
geometries, possible conformations and also gives good results for many kinds of
thermochemical comparisons except the cases where transition metals are involved.
8
Fig. 1.1: Pictorial representation of Prime Quantum Chemical Methods.
Prime Quantum
Chemical Methods
Wavefunction based
methods
Density based
methods
HF Method simplest ab-initio
calculation
electron correlation is not
taken into consideration
Density Functional Theory
(DFT)
System is described via
its density and not via its
many body wavefunction
Moller-Plesset Perturbation Theory Improves on the Hartree-Fock method
Electron correlation effects added
Use of Rayleigh-Schrodinger perturbation
theory
Configuration Interaction (CI) Uses a variational wavefunction that is a
linear combination of configuration state
functions built from spin orbitals
CID, CCSD(T), etc.
9
As there is complete neglect of electron correlation, its usefulness is restricted. The
wave-function based approaches which incorporate electron correlation (Fig. 1.1) are
second-order Moller-Plesset perturbation theory [1]; coupled-cluster perturbation
theory, centering on the generally used CCS, CCSD, and CCSD(T) variants [2]; and
multi-reference perturbation methods, viz. Complete Active Space with second-order
perturbation theory (CASPT2) [3]. A different computational scaling exists for each
method depending upon the number of electrons and has its own advantages and
disadvantages.
Density functional theory is conceptually and computationally very similar to
Hartree-Fock theory but provides much better results and has consequently became a
very popular method. Use of Born-Oppenheimer (BO) approximation [5] makes the
Schrodinger equation much simpler to solve as the motions of electrons and nuclei
can be separated due to their different masses. Thus, quantum mechanical methods
(ab initio, DFT and semi-empirical) [6-10] are based on solving the time-independent
Schrodinger equation for the electrons of a molecular system as a function of the
positions of the nuclei. In classical atomistic models, atoms are regarded as basic
units, and the classical potential energy functions (force fields (FFs)) represent the
interactions between atoms. High-level ab initio and DFT calculations are
computationally demanding. In 1998, Nobel Prize in Chemistry awarded to W. Kohn
and J. Pople, lead to the dramatic development of computational quantum chemistry
10
and made it possible to study more interesting aspects of chemistry and chemical
reactions. This Nobel Prize recognition was not only based on the ability to solve the
quantum-mechanical equations to a decent degree of approximation for molecules,
but also on the fact that the field can now perform theoretical simulations of real
benefit, to the society. Density functional theory (DFT), formulated in 1964 by W.
Kohn and P. Hohenberg, has long been the basis of electronic structure calculations
of atoms from the density of the electron cloud surrounding them [4]. Density
functional theory (DFT) is primarily a theory of electronic ground state structure,
implied in terms of the electronic density distribution n(ρ). Since its inception, it has
become increasingly useful for calculation of the ground state energy of
molecules/solids/clusters, any system consisting of nuclei and electrons with or
without applied static perturbations. It is an alternative approach to the customary
methods of quantum chemistry which are implied in terms of the many electron wave
function ψ(ρ1,... ρN). Both Thomas-Fermi and Hartree-Fock Slater methods can be
regarded as ancestors of DFT. The incorporation of two Kohn-Sham equations in
year 1965, placed DFT on a firm theoretical footing. The first K-S theorem
demonstrates that there is one to one mapping between ground state properties of a
many electron system and its electron density. The second K-S theorem gave the
concept of energy functional for the system and proves that the true ground state
electron density minimizes this energy functional. To account for the forces electrons
11
have on each other as they move around the atomic nucleus, the K-S equations rely
on mathematical tools called exchange-correlation functionals. Presently, there are
many such functional available to describe the electronic properties of matter. The
simplest model is the local density approximation (LDA), which is based upon exact
exchange energy for a uniform electron gas. However, the correct form of the energy
functional is unknown and has to be fabricated by heuristic approximation. Initial
functionals like LDA were based primarily on behavior of the electron gas [11], and
were lacking in the preciseness required for chemical applications. Revolutions over
the past three decades [12-16] have led to the development of functionals capable of
remarkable accuracy and extent of applicability through the periodic table, while it is
essential to note that there remain limitations as well. At present, there are two
principal classes of functionals that have been extensively deployed and tested in
large-scale applications as well as small molecule benchmarks: gradient-corrected
(BLYP), and hybrid (B3LYP) functionals [13-16]. Gradient-corrected functionals
begin with the local-density approximation but add terms involving the gradient of
the electron density ( . Hybrid functionals also incorporate gradient corrections but
add an empirically built-in admixture of exact Hartree-Fock exchange.
The work presented in the thesis for calculations of molecular properties of
small organic molecules is based on the density functional theory. In any quantum
chemical calculation, the first step requires optimization of the molecular geometry. It
12
is customary to assume the system in the gas phase (isolated molecule). A practical
starting point for geometry optimization is to use x-ray diffraction data of the
molecules whenever possible. The wave functions and energy are computed for the
initial guess of the geometry, which is then modified iteratively until identification of
energy minimum and ensuring that the forces within the molecules to be zero. This
can often be difficult for non-rigid molecules, as there may be several energy minima,
and some effort may be required to find the global minimum. Using the optimized
structure (minimum energy) molecular properties like polarizability, electron affinity,
dipole moment and so forth the vibrational modes can also be calculated [17-26] by
computing the second derivative of the energy with respect to the pairs of the atomic
Cartesian coordinates. Simulation of infrared and Raman spectra, which also require
computation of dipole and polarizability derivatives, determination of force constants
provides a useful confirmation on the geometry optimization. Since an optimized
geometry corresponds to zero forces within the molecule, all leading force constants
must be positive and therefore should not result in any imaginary vibrational wave-
number.
1.3 Techniques used for the Study of Vibrational Properties
Vibrational spectroscopy is the communal term used to describe two analytical
techniques- infrared and Raman spectroscopy that provide information about intra
and inter molecular forces, molecular structure determination, atomic and molecular
13
energy levels, molecular composition, molecular geometries, interaction of
molecules, identification and characterization of new molecules etc. Experimental
techniques for instance IR, FT-IR and Raman spectroscopy have already their
efficacy in this framework [27-30].
1.3.1 IR- spectroscopy
Infrared spectroscopy is a dependable and conventional technique for characterization
and identification of materials for over long time. It deals with the analysis of
interaction of infrared light with a molecule. It is also regarded as an imperative
technique for studying the conformation as well as bonding characteristics. An
infrared spectrum is essentially the fingerprint of a compound with absorption peaks
corresponding to the frequencies with which a bond or group vibrates. A beam of
infrared light is passed through the sample, and when the frequency of the incident
infrared light is the same as the vibrational frequency of bond/group absorption
occurs. Therefore the transmitted light spectrum represents the molecular fingerprint
of the sample. As no two compounds can produce the exactly same spectrum,
infrared spectroscopy can be used in the qualitative analysis of every kind of material.
The size of peaks in the spectrum corresponds directly to the amount of material
present.
Now-a-days Fourier Transform Infrared (FT-IR) is used to record the infrared
spectrum. FT-IR spectrometry was developed to overcome the constraints confronted
14
with simple IR instruments. The slow scanning speed was the prime difficulty. A
method was desirable, which could measure all of the infrared frequencies
simultaneously, instead of individually. The problem was resolved with the use of
interferometer. The signal produced by interferometer has all of the infrared
frequencies coded into it. Moreover the signal can be measured very speedily. Beam-
splitter used in interferometers divides the incoming infrared beam into two optical
beams. One of these beams reflects off from a stationary mirror and one from a
movable mirror. The two beams recombine at the beam-splitter after reflecting off
from their respective mirrors. The signal which leaves the interferometer is the
interference of two beams as the path of one beam is of fixed length and the other
changes constantly due to the motion of moving mirror. The resulting signal an
“interferogram” has the exclusive property that every data point which constitutes the
signal holds the information about each infrared frequency coming from the source.
As a result all frequencies are being measured simultaneously as the interferogram is
measured. The decoding of each individual frequency from the interferogram is done
by the method of Fourier transform using a computer. FT-IR technique has made
many new sampling techniques feasible which were impossible by earlier technology
[31].
15
1.3.2 FT-Raman spectroscopy
Raman spectroscopy is a spectroscopic technique entrenched in the inelastic
scattering of monochromatic light, generally from a laser source. The FT Raman
spectroscopy has made possible the study of materials that was earlier impossible
because of fluorescence [32]. This method involves a beautiful interplay between
atomic positions, intermolecular forces and electron distribution and hence can
provide exquisite structural perception of a molecule [33]. The sample under
investigation is irradiated with a laser beam. The information about the energies of
molecular vibrations and rotations are contained in the scattered radiation produced
by the Raman effect and these in-turn are depended on the atoms or ions that
constitute the molecule, the chemical bonds between them, the symmetry of the
structure, and the physico-chemical environment.
The incident light consisting of photons strike the molecules of the sample. Most of
the photons are scattered without change in energy i.e. collision is elastic, when the
molecule gives up or takes up energy from/to the photons, they are scattered with
higher or lower energy/frequency. The changes in frequency are directly related with
the energy involved in the transition between initial and final states of the scattering
molecule. Raman spectroscopy has the advantage that it can be used to study solid,
liquid as well as gaseous samples.
16
1.4 UV-Vis spectroscopy
UV-Vis spectroscopy is a technique by which we can measure the wavelength and
intensity of absorption of ultraviolet and visible light by a sample. UV spectroscopy
is generally applied to molecules and inorganic complexes in solution. Photons of
ultraviolet and visible light are energetic enough to promote outer electrons to excited
or higher energy states. Chemical bonds formed by overlapping of atomic orbitals
result in bonding (low energy), anti-bonding (high energy), or non-bonding molecular
orbitals. Energy absorption is normally associated with transitions of the electrons
from the bonding orbitals to the anti-bonding orbitals. The difference in energy
between molecular bonding, anti-bonding and non-bonding orbitals range from 30 to
150 Kcal per mole. This energy lies in the ultraviolet region and the visible region of
the electromagnetic spectrum.
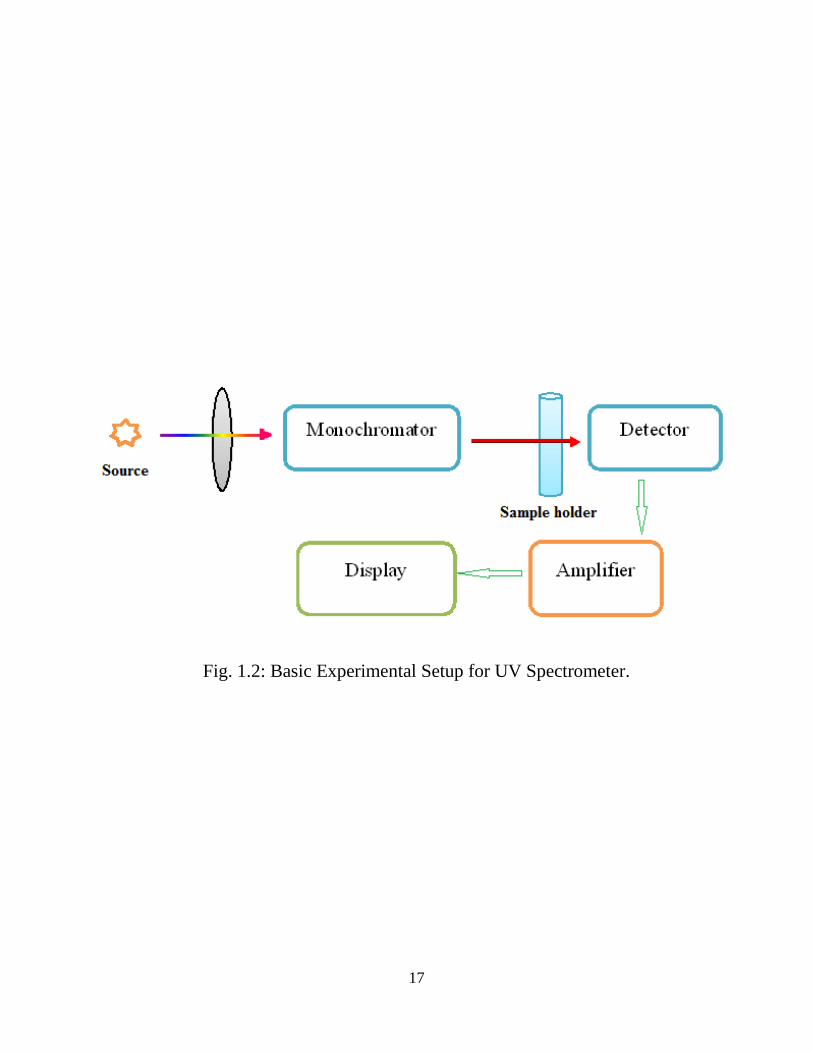
For UV/visible measurements, the experimental set up (Fig. 1.2) consists of a
hydrogen or deuterium/tungsten lamp. Prism/grating monochromator, selects the
wavelengths of these continuous light sources. Spectra are attained by scanning the
wavelength separator and thus quantitative measurements can be made from a
spectrum or at a single wavelength.
17
Fig. 1.2: Basic Experimental Setup for UV Spectrometer.
18
1.5 NMR Spectroscopy
Nuclear Magnetic Resonance (NMR) spectroscopy is a technique used for
determining the purity and molecular structure of a given compound. The principle of
NMR lies in the fact all nuclei are electrically charged and have an intrinsic spin. In
presence of an external magnetic field there is a possibility of energy transfer, making
spin to flip from the lower energy to a higher energy level. The energy transfer lies in
the range of radio frequencies and when the spin flips to its original level, the energy
is emitted at the same value of frequency. The signal that corresponds to this transfer
can be measured in several ways and handled in order to give an NMR spectrum for
the studied nucleus. The particular resonant frequency of the energy transition is
related to the actual magnetic field at the nucleus. The magnetic field is affected by
shielding of electrons and hence dependent on the chemical environment. Therefore,
the resonant frequency gives information about the nuclear chemical environment. In
general, higher the electronegativity difference between H atom and its surrounding
atoms, higher is the resonant frequency. The precise resonant frequency shift of each
nucleus depends on the magnetic field used. Hence chemical shift is defined as a
convenient parameter. Due to variations in the electron distribution, the variations of
nuclear magnetic resonance frequencies of the similar kind of nucleus, is called the
chemical shift. The size of the chemical shift is given with respect to a reference
sample usually Tetramethylsilane (TMS).
19
1.6 Compounds studied
The present thesis is based on the study of following compounds.
1. 4-Phenyl-3H-1,3-thiazol-2-ol (4P3HT)
2. 2-Thienylboronic acid (2TBA)
3. N-hydroxy Succinimide (NHS)
Molecular structure, vibrational and electronic properties of 4-Phenyl-3H-1,3-
thiazol-2-ol have been calculated using density functional theory and to compare the
drug efficacy of keto and enol forms, QSAR properties of both the forms have also
been computed and discussed in chapter 3. NLO behaviour of the molecule has been
investigated by the dipole moment, polarizability and first hyperpolarizability.
Theoretically calculated values of mean polarizability of both keto and enol forms are
found to be nearly same but the dipole moment and first static hyperpolarizability of
keto form are appreciably higher than enolic form. In chapter 4, Experimental FT-IR
and FT-Raman spectra of 2-Thienylboronic acid compound were compared with the
spectral data obtained by DFT/B3LYP method. Dipole moment, polarizability, first
static hyperpolarizability and molecular electrostatic potential surface map have been
calculated. Natural bond orbital (NBO) analysis has been performed to study the
stability of the molecule arising from charge delocalization. UV-Vis spectrum of the
2TBA compound was also recorded and electronic properties such as frontier orbitals
and energy gap were calculated by TD-DFT approach. The 1H nuclear magnetic
20
resonance (NMR) chemical shifts of the molecule were also calculated. A
comparative study of structure, energies and spectral analysis of Succinimide, N-
hydroxy-succinimide (NHS) and N-methyl-succinimide (NMS) has been carried out
in chapter 5, using density functional method (DFT/B3LYP) with 6-311++G(d,p) as
basis set. The thermodynamic properties of the studied compounds at different
temperatures were also calculated.
21
References
1. S. Sabeo, & P. Pulay, (1991) Annu. Rev. Phys. Chem. 44, 213-236.
2. R. J. Bartlett, (1989) J. Phys. Chem. 93, 1697-1708.
3. B. O. Roos, K. Andersson, M. P. Fulscher, P. A. Malmqvist, L. Serrano
Andres, K. Pierloot & M. Merchan, (1996) Adv. Chem. Phys. 93, 219-331.
4. K. Burke and friends. The ABC of DFT. Department of Chemistry,
University of California, Irvine, C A 92697 April 10, 2007.
5. M. Born, R. Oppenheimer, Ann. Phys. 84 (1927) 457.
6. W. J. Hehre, L. Radom, P. V. R. Schleyer, J. A. Pople, Ab Initio Molecular
Orbital Theory, John Wiley & Sons, Inc., New York, 1986.
7. A. Szabo, N. S. Ostlund, Modern Quantum Chemistry, Macmillan
Publishing Co., Inc., New York, 1982.
8. P. W. Atkins, Molecular Quantum Mechanics, 3rd
ed., Oxford University
Press, Oxford, 1996.
9. R. G. Parr, W. Yang, Density-Functional Theory of Atoms and Molecules,
The International Series of Monographs on Chemistry 16, Oxford University
Press, New York, 1989.
10. J. Sadlej, Semi-empirical methods of Quantum Chemistry, Halstead press,
New York, 1985.
11. L. J. Sham, & W. Kohn, (1964) Phys. Rev. 145, 561-567.
12. W. Kohn, A. D. Becke, & R.G. Parr, (1996) J. Phys. Chem. 100, 12974-
12980.
13. B. G. Johnson, P. M. W. Gill & J. A. Pople (1993) J. Chem. Phys. 98,
5612-5626.
14. A. D. Becke (1998) Phys. Rev. A 38, 3098-3100.
15. A. D. Becke (1993) J. Chem. Phys. 98, 5648-5652.
22
16. C. T. Lee, W. T. Yang & R. G. Parr (1988) Phys. Rev. B 37, 785-789.
17. L. Sinha, O. Prasad, V. Narayan and R. Srivastava, Journal of Molecular
Structure: Theochem 958 (2010) 33.
18. O. Prasad, L. Sinha and N. Kumar, J. At. Mol. Sci., 1, 3 (2010) 201.
19. O. Prasad, L. Sinha, N. Misra, V. Narayan, N. Kumar, J. Pathak, Journal of
Molecular Structure : Theochem 940 (2010) 82.
20. O. Prasad, L. Sinha, N. Misra, V. Narayan, N. Kumar, A. Kumar, Journal of
Applied Spectroscopy, 77 (2010) 468.
21. S. Ramalingam, S. Pandey, B. Narayan, S. Mohan, Spectrochimica Acta, 76
(2010) 84.
22. A. Dwivedi, S. A. Siddiqui, O. Prasad, L. Sinha, N. Misra, Journal of Applied
Spectroscopy, 76 (2009) 623.
23. S. A. Siddiqui, A. Dwivedi, P. K. Singh, T. Hasan, S. Jain, O. Prasad, N.
Misra, Journal of Structural Chemistry, 50 (2009) 411.
24. C. Jam, R. Pettit, O. F. Neilsen, V. S. Jaya Kumar, Joe I. Hubert, Spect.
Acta Part A, 70 (2008) 1208.
25. N. Misra, O. Prasad, L. Sinha, A. Pandey, Journal of Molecular Structure:
Theochem 822 (2007) 45.
26. A. Kumar, V. Narayan, O. Prasad, L. Sinha, Journal of Molecular
Structure 1022 (2012) 81-88.
27. P. Vandenabeele, D. M. Grimaaldi, H. G. M. Edwards and L. Moean,
Spectrochim. Acta Part A 59 (2003) 2221.
28. H. G. M. Edwards and D. W. Farwell, Spectrochim. Acta Part A 52 (1996)
1119.
29. R. H. Brody and H. G. M. Edwards, Spectrochim. Acta Part A 57 (2001)
1325.
23
30. J. Jehli, S. E. Jorge Villar, H. G. M. Edwards, J. Raman Spectrosc. 35 (2004)
761.
31. Introduction to Fourier Transform Infrared Spectrometry-Thermo Nicolet.
32. Y. Fuzimura, H. Kono, T. Nakajima, S.H. Lin J. Chem. Phys., 74 (1981)
3726.
33. Paul R. Carey, The Journal of Biological Chemistry, 274 (38), (1999) 26625-
26628.
34. S. Sebastian, N. Sundaraganesan, B. Karthikeiyan and V. Srinivasan,
Spectrochimica Acta Part A: Molecular and Biomolecular Spectroscopy
78(2), ( 2011) 590-600.
35. J. Karpagam, N. Sundaraganesan, S. Sebastian, S. Manoharanb and M.
Kurt, J. Raman Spectrosc., 41, (2010) 53-62.
36. V. Balachandran, K. Parimala, Journal of Molecular Structure, 1007 (11),
(2012) 136-145.
24
Theory
25
The work reported in the thesis is based on the experimental and theoretical
vibrational analysis and calculation of various molecular properties of small organic
molecules after the full geometry optimization using the most widely used quantum
chemical method - Density functional theory (DFT). Quantum chemistry is an
exciting field of research. Quantum chemistry involves the application of the
principles of quantum theory to chemical and biological systems. In this chapter
some elementary aspects of the theory of quantum chemistry and importance on
their practical implications has been presented. In quantum chemistry, we describe a
molecular system by a wave-function which can be obtained by solving the
Schrödinger equation. This equation basically enable us to relate the stationary states
of the system and its possible eigen-values to the Hamiltonian operator, with the
help of it we can obtain the energy associated with a wavefunction describing the
positions of the nuclei and electrons in the molecular system. But it is not
conceivable to solve the Schrodinger equation exactly and hence approximations
have to be made. The technique/method is called "ab initio" in which only the use
of fundamental constants of nature are made, to arrive at numerical predictions and
no use of empirical parameters are made. Despite the adoption of the necessary
estimates (approximations), ab initio theory has the theoretical advantage of
generality, and with the practical advantage is that we can predict its successes and
failures. The advantage of ab initio quantum chemistry is that it can envisage the
26
electronic and geometric structures of unknown/unidentified molecules. For those
molecules for which there is limited data, this technique can be very useful in the
interpretation of experimental data. For example, it is feasible to calculate structures
and relate the results with microwave experiments, or to calculate vibrational
frequencies and compare with FT-IR/FT-Raman data. Since ab initio calculations do
not depend on experimental data, calculations become a prime independent tool that
can substantiate or repudiate the analysis of experimental data. Gaussian 09 software
program [1] was used to conduct the calculations discussed in the present thesis. The
Gaussian package contains numerous ab initio and semi-empirical methods,
although the quantum chemical method used in the present thesis is DFT.
2.1 The Key Equation: The Schrodinger Equation
The time-dependent Schrödinger equation
Can be written in its time independent form, if the potential is a function of position
only and not of time, i.e. in the absence of time-dependent external forces such as
external electric and magnetic fields-
= ...... (2.1)
Now as the time independent non-relativistic Hamiltonian operator, E as the energy
of the system and the wave-function
27
The Hamiltonian is
= K + PV ...... (2.2)
the sum of a kinetic energy operator ( ) and a potential energy operator (V ).
contains two terms - the kinetic energy for the N electrons as well as the M nuclei
2
1
2
1 2
1
2
1ˆ
i
i
k ...... (2.3)
Similarly, potential energy V is sum of electron-nuclei columbic attraction, electron-
electron and nucleus-nucleus repulsion and is given by,
1 1 1 1
p
1V
i i ijiji Rrr ...... (2.4)
It is essential to recall that finding an exact solution to the Schrödinger
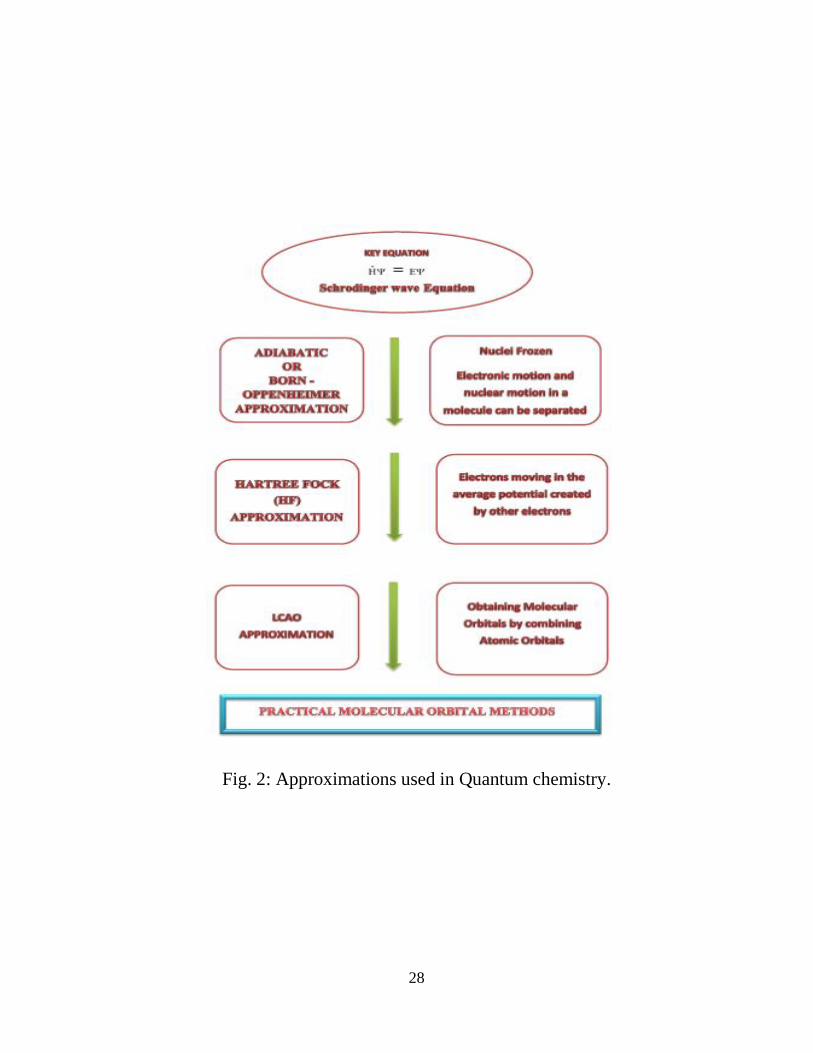
equation is not possible for any but the simplest atomic systems [2]. Therefore some
approximations (Fig. 2) must be made which are discussed in the succeeding sections.
2.2 Born-Oppenheimer Approximation
The Schrodinger equation for any complex system can be easily solved by the use of
the Born-Oppenheimer approximation, which considers that the electrons travel in the
electro-static field generated by a fixed geometry of the nuclei and therefore the
electronic motion and the nuclear motion in a molecule can be separated. The Born-
Oppenheimer approximation is quite reasonable approximation since the nuclei are
much more massive than the electrons.
28
Fig. 2: Approximations used in Quantum chemistry.
29
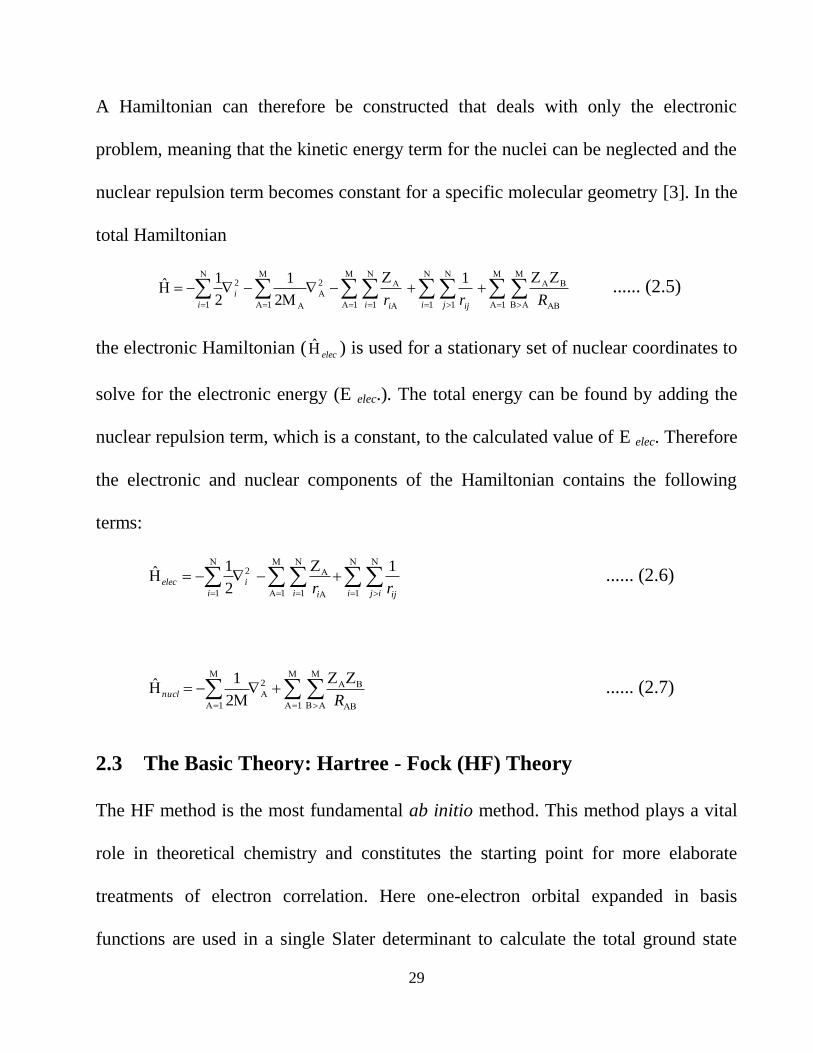
A Hamiltonian can therefore be constructed that deals with only the electronic
problem, meaning that the kinetic energy term for the nuclei can be neglected and the
nuclear repulsion term becomes constant for a specific molecular geometry [3]. In the
total Hamiltonian
1 111 1
2
1
2
1
1
2
1
2
1ˆ
i j iji i
i
i Rrr ...... (2.5)
the electronic Hamiltonian ( elec ) is used for a stationary set of nuclear coordinates to
solve for the electronic energy (E elec.). The total energy can be found by adding the
nuclear repulsion term, which is a constant, to the calculated value of E elec. Therefore
the electronic and nuclear components of the Hamiltonian contains the following
terms:
11 1
2
1
1
2
1ˆ
i ij iji i
i
i
elecrr
...... (2.6)
1
2
1 2
1ˆR
nucl ...... (2.7)
2.3 The Basic Theory: Hartree - Fock (HF) Theory
The HF method is the most fundamental ab initio method. This method plays a vital
role in theoretical chemistry and constitutes the starting point for more elaborate
treatments of electron correlation. Here one-electron orbital expanded in basis
functions are used in a single Slater determinant to calculate the total ground state

30
energy. In general electronic structure methods are based on the Born-Oppenheimer
approximation and molecular orbital theory. The Hartree-Fock method embraces
these two concepts with the variation principle and the simplest possible wave
function in the form of single slater determinant. The notion, suggested by Hartree,
was to consider electrons as non-interacting particles moving in the average potential
created by the rest of the electrons. An exact solution to the Schrödinger equation is
not possible for any but the smallest molecular systems. We have to use simplifying
assumptions and procedures do make an approximate solution possible for a large
range of molecules.
2.3.1 The Wave-function in terms of Slater Determinant
The electronic Hamiltonian depends only on the spatial coordinates of the electrons,
but to completely describe an electron it is necessary to specify its spin. This is done
by introducing two spin functions () and () corresponding to spin up and spin
down respectively. The spin orbitals, (x) includes both the spatial component, (r),
and the spin component.
The wave-function can then be represented by a combination of normalized
molecular orbitals represented by i,j....... [3]. The most straightforward way to
define as a combination of these molecular orbitals (MOs) is by forming the
Hartree product:

31
(P x1,x2…..xN) = I (x1)j (x2) ….k (xN) ...... (2.8)
But as a matter of fact it must satisfy the anti-symmetry principle, considering
electrons are indistinguishable particles and requires that the electronic wave-function
to change sign with respect to the interchange of the space and spin coordinates of
any of the two electrons [7]. The exchange of any of the two electrons in the Hartree
product (HP
) clearly distinguishes between two electrons. Therefore an anti-
symmetric function must be formed and the problem was solved by Slater by taking
the determinant of the molecular orbitals. Each electron is associated with each
orbital if the determinant is expanded.
(,....,, 21 xxx )-1/2
)()()(
)()()(
)()()(
222
111
xxx
xxx
xxx
kji
kji
kji
...... (2.9)
The factor (N!)-1/2
, is the normalization factor. The simplest trial function is a single
Slater determinant function in which N spin-orbitals are occupied by N electrons.
Therefore the prime aim is to find a set of one - electron functions (a) such that we
have a single determinant formed from these orbitals that yields the best possible
approximation to the ground state of the N electron system described by an electronic
Hamiltonian:
........210 ba ...... (2.10)
32
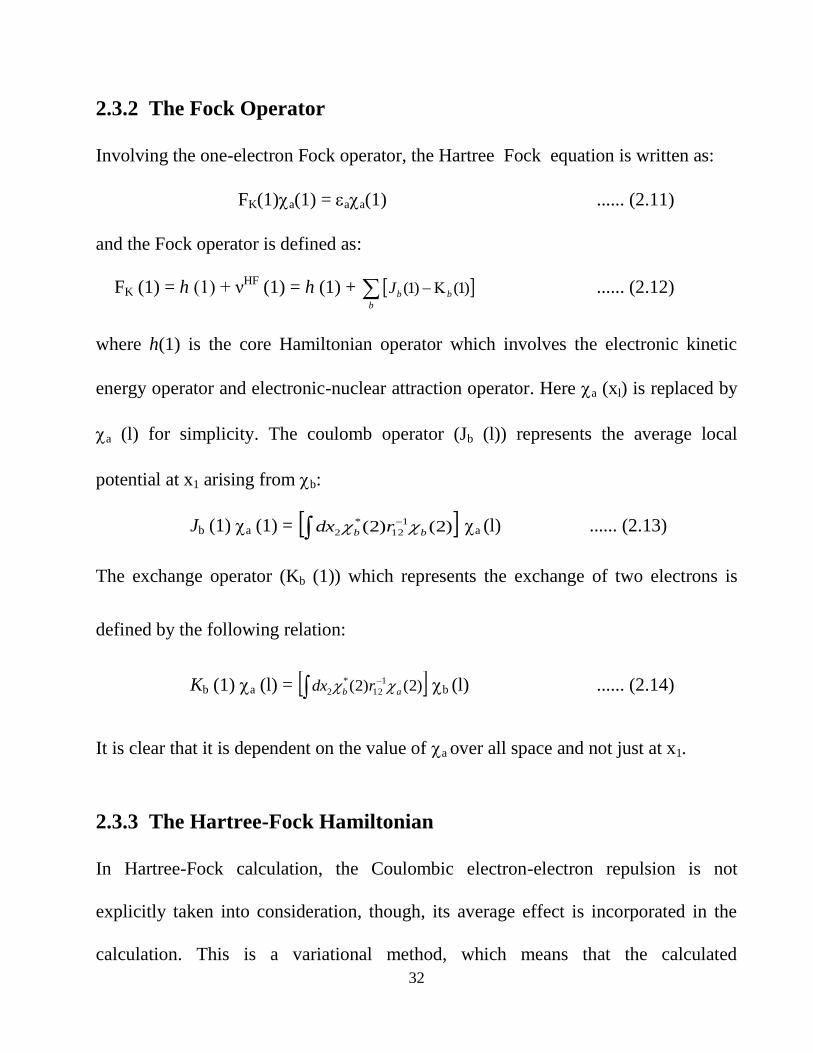
2.3.2 The Fock Operator
Involving the one-electron Fock operator, the Hartree Fock equation is written as:
FK(1)a(1) = aa(1) ...... (2.11)
and the Fock operator is defined as:
FK (1) = h (1) + νHF
(1) = h (1) + b
bbJ )1()1( ...... (2.12)
where h(1) is the core Hamiltonian operator which involves the electronic kinetic
energy operator and electronic-nuclear attraction operator. Here a (xl) is replaced by
a (l) for simplicity. The coulomb operator (Jb (l)) represents the average local
potential at x1 arising from b:
Jb (1) a (1) = )2()2( 1
12
*
2 bb rdx a (l) ...... (2.13)
The exchange operator (Kb (1)) which represents the exchange of two electrons is
defined by the following relation:
Kb (1) a (l) = )2()2( 1
12
*
2 ab rdx b (l) ...... (2.14)
It is clear that it is dependent on the value of a over all space and not just at x1.
2.3.3 The Hartree-Fock Hamiltonian
In Hartree-Fock calculation, the Coulombic electron-electron repulsion is not
explicitly taken into consideration, though, its average effect is incorporated in the
calculation. This is a variational method, which means that the calculated
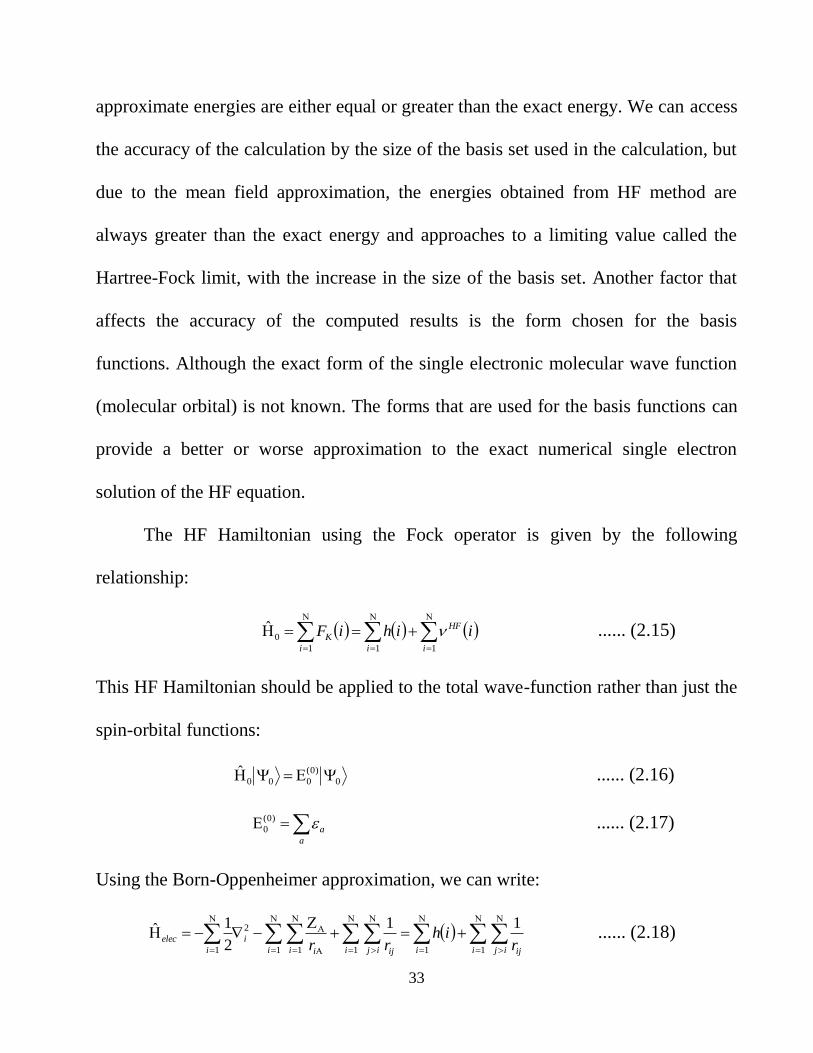
33
approximate energies are either equal or greater than the exact energy. We can access
the accuracy of the calculation by the size of the basis set used in the calculation, but
due to the mean field approximation, the energies obtained from HF method are
always greater than the exact energy and approaches to a limiting value called the
Hartree-Fock limit, with the increase in the size of the basis set. Another factor that
affects the accuracy of the computed results is the form chosen for the basis
functions. Although the exact form of the single electronic molecular wave function
(molecular orbital) is not known. The forms that are used for the basis functions can
provide a better or worse approximation to the exact numerical single electron
solution of the HF equation.
The HF Hamiltonian using the Fock operator is given by the following
relationship:
111
0ˆ
i
HF
ii
K iihiF ...... (2.15)
This HF Hamiltonian should be applied to the total wave-function rather than just the
spin-orbital functions:
0
)0(
000ˆ ...... (2.16)
a
a)0(
0 ...... (2.17)
Using the Born-Oppenheimer approximation, we can write:
1111 1
2
1
11
2
1ˆ
i ij ijii ij iji i i
i
i
elecr
ihrr
...... (2.18)
34
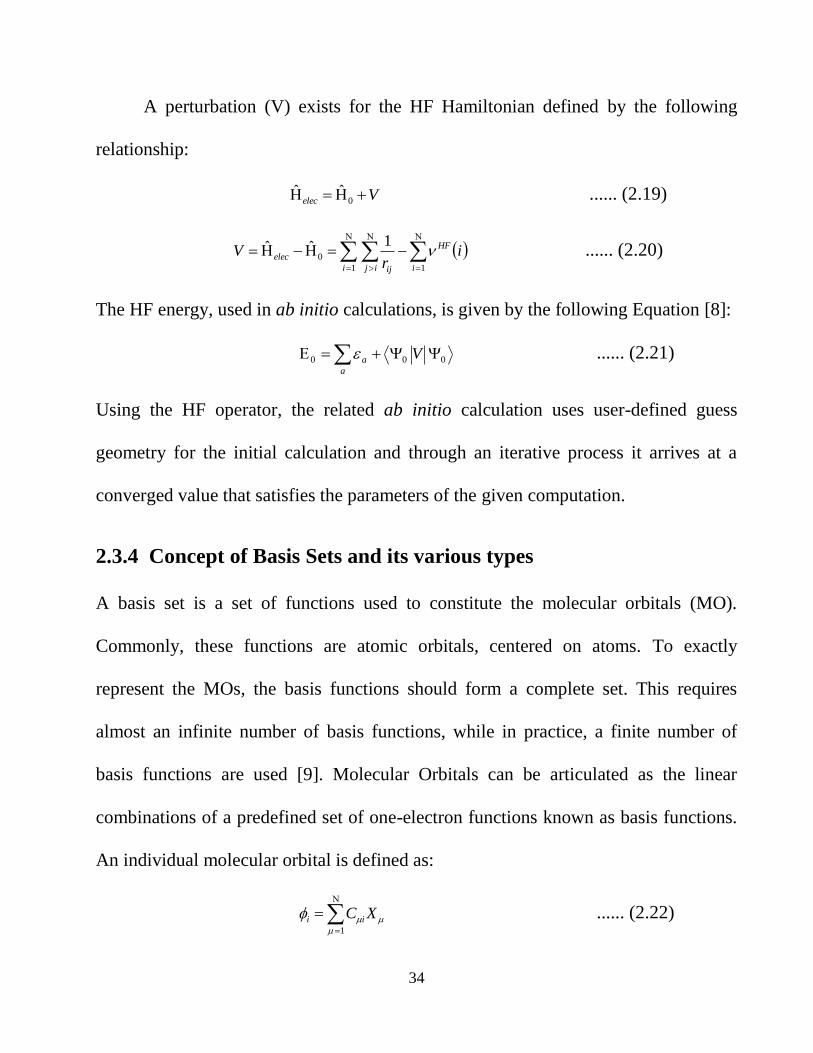
A perturbation (V) exists for the HF Hamiltonian defined by the following
relationship:
Velec 0ˆˆ ...... (2.19)
ir
Vi
HF
i ij ij
elec
11
0
1ˆˆ ...... (2.20)
The HF energy, used in ab initio calculations, is given by the following Equation [8]:
000 Va
a ...... (2.21)
Using the HF operator, the related ab initio calculation uses user-defined guess
geometry for the initial calculation and through an iterative process it arrives at a
converged value that satisfies the parameters of the given computation.
2.3.4 Concept of Basis Sets and its various types
A basis set is a set of functions used to constitute the molecular orbitals (MO).
Commonly, these functions are atomic orbitals, centered on atoms. To exactly
represent the MOs, the basis functions should form a complete set. This requires
almost an infinite number of basis functions, while in practice, a finite number of
basis functions are used [9]. Molecular Orbitals can be articulated as the linear
combinations of a predefined set of one-electron functions known as basis functions.
An individual molecular orbital is defined as:
XC ii
1
...... (2.22)

35
where Ci are known as MO expansion coefficients. The Xi ... XN (basis functions), are
usually normalized. Gaussian software package and most other ab initio programs use
Gaussian-type functions to form basis sets. Gaussian functions (Cartesian) have the
form:
2
),( arlmn ezycxrG
...... (2.23)
where r is composed of x, y, z and is a constant determining the size i.e. the radial
extent of the function, to find the constant of normalization (c) following relation is
used:
12 Gspaceall ...... (2.24)
The normalization constant therefore depends on ; l, m, and n. Linear combinations
of the primitive Gaussians as seen above are used to form the actual basis functions
called the contracted Gaussians which have the form:
p
p
pG ...... (2.25)
where σp are fixed constants within a given basis set. These functions are also
normalized. Therefore the molecular orbitals for a basis set can be described as:
p
ppiii GCC
...... (2.26)
It is necessary to understand basis sets because they are the foundation of
modern ab initio techniques [3]. The size and quality of the basis set used in an ab
initio calculation largely determines the quality of the final result. Many basis sets

36
have been optimized and tested for the accuracy. The minimal basis set contains one
Slater-Type Orbital (STO) per AO (atomic orbital). Each STO is further
approximated as a linear combination of N Gaussian functions, where the coefficients
are chosen in such a way to give the best least-squares fit to the STO. Most
commonly, the value of N is 3, which gives the basis set STO-3G. Therefore the
minimal basis set of STOs for a compound containing only first-row elements and
hydrogen is denoted by (2s lp/ls) [9].
A basis set can be improved by increasing the number of basis functions per
atom. Polarized basis sets allow for the addition of orbitals with angular momentum
beyond what is required for the ground state description of each atom; this allows for
flexibility in different bonding situations. The polarized basis set 6-31G* is a basis set
that adds d polarization functions on each non hydrogen atom. The 6-31G** basis set
adds p functions to the hydrogen‟s as well. The 6-31+G** basis set adds diffuse
functions (+) to the non-hydrogen atoms, which are important for systems with lone
pairs, anions and some excited states, as well as the polarization functions. The 6-31l
G** basis set is commonly used for electron correlation calculations on molecules
containing first-row atoms. The basis set, containing single zeta for the core and triple
zeta for the valence atomic orbitals is 6-311G**, which contains five d-type Gaussian
polarization functions on each non-hydrogen atom and three p-type polarization
functions on each hydrogen atom [10]. There are larger basis sets also which add

37
multiple polarization functions per atom for the triple zeta basis set [3] or additional
functions for the valence shell.
2.3.5 Limitations / Shortcomings of Hartree-Fock Theory
HF theory is only handy for as long as the initial predictions are concerned
because it does not take into account the instantaneous interactions between
electrons.
It is not adequate for modeling the energetics of reactions, bond dissociations,
or excited states [3].
Energies calculated using the HF method involve error in the range 0.5% - 1%
[9].
Most HF calculations give a computed energy greater than the Hartree - Fock
limit.
The region surrounding each electron in an atom, known as a Coulomb hole, is
an area in which the probability of finding another electron is small. The HF
method does include some correlation for the motions of electrons that have the
same spin.
Improving the basis set will not necessarily improve the results for HF calculations.
The calculated energy of a given molecule cannot improve past the Hartree-Fock
limit. Because of the variational principle, the energy calculated at the HF limit is
greater than the exact energy. Larger and larger basis sets will keep lowering the
38
energy until the HF limit is attained, and at this juncture, no further improvement may
be made. Therefore it is essential to move on to methods such as DFT and MP
methods that include electron correlation and can improve on the HF method.
2.4 Introduction of Electron-Electron Correlation
ab initio methods incorporating electron correlation have the following
characteristics-
The technique should be well defined and for any nuclear configuration, it
should lead to a unique energy and a continuous potential energy surface.
The results for a system of molecules infinitely separated from one another
must equal the sum of the results obtained for each individual molecule
calculated independently [3] or in other words it should be size consistent.
When applied to a two-electron system, it should be exact result.
It should be effective for large basis sets.
The resulting in a computed energy that is an upper bound to the correct energy
i.e. it should be variational.
It should give a satisfactory approximation to FCI (full configuration
interaction) result.
FCI method includes a mixing of al1 possible electronic states of a given molecule
and is the most complete non-relativistic treatment of molecular system possible
within the limitations imposed by a chosen basis set [3].
39
No technique satisfies al1 of these criteria. Most methods introduce approximations
with varying degrees of success [10-13].
2.5 Density Functional Theory
For the past 30 years, density functional theory has been the dominant method for
electronic structure calculations, particularly for single molecule computations. The
basic idea is that there is a one-to-one correspondence from the ground state electron
density to the ground state electronic wave-function. This gives us another method
for solving the electronic Schrödinger equation. Furthermore, the electron density is
only a function of three variables rather than the 3n (three for each of the n electrons)
variables that are present in the many-electron wave-function. In practice, this leads
to a much faster and simpler calculation. The nature of DFT means that it includes
some part of electron correlation [16] although the amount and type is functional
dependent and generally not well defined/known.
2.5.1 Basic Functionals
A significant problem in DFT is that the exact form of the functional (function of a
function) that maps the electron density to the electronic wavefunction is not known
for any system other than a free electron gas. Different approximations have been
used to provide the required functionals. For instance In the local density
approximation (LDA) the functional only depends on the value of the density at the

40
particular coordinate where the functional is evaluated. The LDA has been used
widely and advantageously in solid state physics but is an inadequate approximation
for molecular calculations.
The next level of complexity is to also include the gradient of the electron density at
the coordinate where the functional is evaluated. This is the generalized gradient
approximation (GGA) and has yielded good results for molecular ground state
geometries and energies.
In order to increase the accurateness and consistency of functionals, there has been
(and continues to be) much work dedicated to generating better functionals for
molecular systems.
2.5.2 Advanced Functionals
There are a variety of different functionals available in most computational chemistry
packages and are generally described by two parts, the „exchange’ functional and the
„correlation’ functional. For example, BLYP uses the exchange functional of Becke
(hence the „B‟) and the correlation function of Lee, Yang and Parr (hence the
abbreviation „LYP‟) [17].
2.5.3 Hybrid Functionals
Hybrid functionals try to overcome some of the deficiencies of „pure‟ DFT exchange
functionals by mixing in a component of the exact exchange energy from HF theory.
41
The most extensively used hybrid functional in molecular calculations is the
pervasive B3LYP functional [17-19]. This uses the exchange functional 'B', and the
LYP correlation functional along with 3 parameters controlling the amount of exact
HF exchange energy mixed in. Hybrid functionals are generally fitted to a training set
of molecules and so are not ab initio methods in the true sense as they include some
empirical input. One should be careful when using hybrid functionals to make sure
that they have been fitted to molecules that resemble the system.
2.5.4 Advantages and Disadvantages of DFT
DFT includes some component of electron correlation for much the same
computational cost as HF methods. This means that it is a highly efficient way of
performing a more advanced calculation on the system and that we can treat more
accurately systems that are too large for post-HF methods namely MP2, CCSD (T),
CISD methods. DFT methods (along with plane-wave basis sets) also allow us to use
electronic structure methods on the condensed phase (particularly crystalline or
metallic solids).
DFT methods are not systematically improvable like wave-function based methods
and so it is impossible to estimate the error associated with the calculations without
reference to experimental data or other types of calculation. The choice of functionals
is daunting and can have a real impact on the calculations.
42
There are difficulties in using DFT to describe intermolecular interactions, especially
those involving dispersion forces or systems in which dispersion forces compete with
other interactions (biomolecules).
2.6 Elementary Theory of DFT
2.6.1 The Hohenberg-Kohn theorems
The Hohenberg-Kohn theorem [20] states that if N interacting electrons move in an
external potential VX(r), the ground-state electron density ρ0(r) minimizes the
functional
E[ρ] = F[ρ] +∫ ρ (r)VX(r)dr ...... (2.27)
where F is a universal functional of ρ and the minimum value of the functional E is E0
the exact ground-state electronic energy.
Levy [21] gave a particularly simple proof of the Hohenberg-Kohn theorem which is
as follows:
A functional O is defined as
...... (2.28)
where the expectation value is found by searching over all wave-functions Ψ giving
the density ρ (r) and selecting the wave-function which minimizes the expectation
value of Ố.
|ˆ|)]([ min OrOrn
43
F[ρ(r )] is defined by
...... (2.29)
So that
ji ji
i
i rrF
1
2
1
2
1ˆ 2
...... (2.30)
Considering an N-electron ground state wave-function Ψ0 which yields a density ρ(r)
and minimizes |ˆ| F , then from the definition of the functional E
E [ρ(r)] = F [ρ(r)] +∫ ρ(r) VX(r)dr = < Ψ│ F + VX│Ψ > ...... (2.31)
Here the Hamiltonian is given by F + VX, and so E [ρ(r)] must obey the variational
principle,
E [ρ(r)] E 0 ...... (2.32)
This completes the first part of the proof, which places a lower bound on E [ρ(r)].
From the definition of F [ρ(r)] equation (2.29) we obtain
F [ρ0 (r)] < Ψ0│ F │Ψ0 > ...... (2.33)
Since Ψ0 is a trial wave-function yielding ρ0(r). Combining ∫ ρ(r)VX(r) dr with the
above equation gives
E [ρ0 (r)] E0 ...... (2.34)
|ˆ|)]([ min FrFrn
44
which in combination with equation (2.32) produces the key result
E [ρ0(r)] = E0 ...... (2.35)
completing the proof.
2.6.2 The Kohn-Sham equations
The HK theorems suggested and consequently proved the existence of the universal
functional F[ρ(r)] but gave no idea how to constitute it. The problem was resolved by
Kohn and Sham who suggested a possible track to build it. Kohn and Sham [12]
derived a coupled set of differential equations enabling the ground state density ρ0(r)
to be found. Kohn and Sham separated F [ρ(r)] into three distinct parts, so that the
functional E becomes
E[ρ(r)] = TS[ρ(r)]+ 2
1∫ ∫ '
)(r'(r)
rr
drdr
'+ Exc[ρ(r)]+∫ ρ(r)VX(r) dr ...... (2.36)
where Ts [ρ(r )] is defined as the kinetic energy of a non-interacting electron gas with
density ρ(r),
TS [ρ(r)] = 2
1
N
1i∫ψi
*(r) 2 ψi(r)dr ...... (2.37)
and not the kinetic energy of the real system. Equation (2.36) also defines the
exchange-correlation energy functional Exc[ρ]. Introducing a normalization constraint
on the electron density,
45
∫ ρ(r)dr = N,
we obtain
)(r
[E [ρ(r)] - ∫ ρ(r) dr] = 0 …… (2.38)
)(
)]([
r
rE
= …… (2.39)
Equation (2.39) can now be rewritten in terms of Veff(r) an effective potential,
)(
)]([
r
rTS
+ Veff(r) = …… (2.40)
where
Veff(r) =VX(r)+∫ '
)(r'
rr
dr'+VXC(r) …… (2.41)
and
VXC(r) =)(
)]([
r
rEXC
...... (2.42)
remarkably, non-interacting electrons moving in an external potential Veff(r) would
result in the same equation (2.40). To find the ground state energy (E0) and the
ground state density (ρ0), the one electron Schrödinger equation
46
(2
1 2
i +Veff(r) - i ) ψi(r) = 0 ...... (2.43)
must be solved using self-consistency with
ρ(r) =
N
1i
│ψi(r)│2, ...... (2.44)
and equations (2.40) and (2.41). A self-consistent solution is required due to the
dependence of Veff (r) on ρ(r). The above equations provide a theoretically exact
method for finding the ground state energy of an interacting system provided the
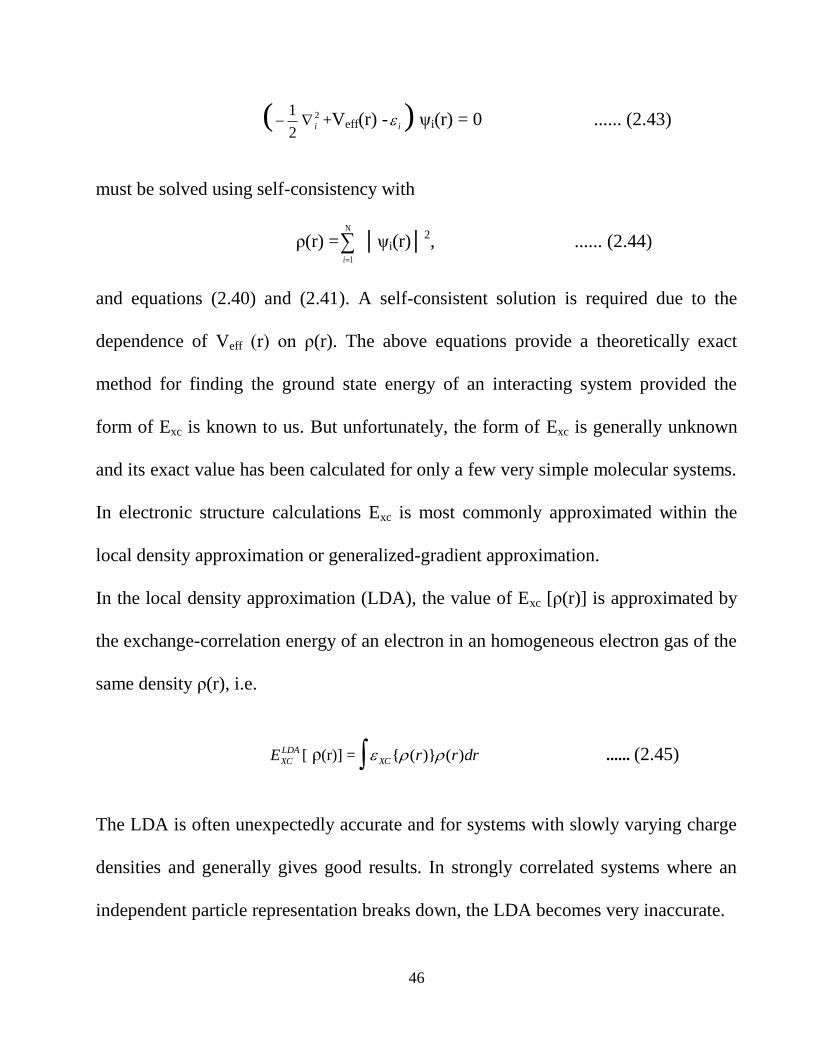
form of Exc is known to us. But unfortunately, the form of Exc is generally unknown
and its exact value has been calculated for only a few very simple molecular systems.
In electronic structure calculations Exc is most commonly approximated within the
local density approximation or generalized-gradient approximation.
In the local density approximation (LDA), the value of Exc [ρ(r)] is approximated by
the exchange-correlation energy of an electron in an homogeneous electron gas of the
same density ρ(r), i.e.
LDA
XCE [ ρ(r)] = ∫ drrrXC )()}({ ...... (2.45)
The LDA is often unexpectedly accurate and for systems with slowly varying charge
densities and generally gives good results. In strongly correlated systems where an
independent particle representation breaks down, the LDA becomes very inaccurate.

47
An obvious approach to improving the LDA is to include gradient corrections, by
making EXC a functional of the density and its gradient:
GGA
XCE [ ρ(r)]=∫ drrrXC )()}({ +∫ drrrFXC ])(),([ ...... (2.46)
Where FXC is a correction chosen to satisfy one or several known limits for EXC.
Clearly, there is no unique recipe for FXC, and several functionals have been proposed
in the literature. They do not always signify a systematic improvement over the LDA
and results must be carefully compared against experiment. The development of
improved functionals is currently a very active area of research.
2.7 Application of Quantum Chemical Methods
2.7.1 Search for lowest energy conformer / Geometry Optimization
Conformational search is one of the crucial tasks in the investigation of molecular
properties of a molecule. Geometry Optimization is the name for the process that
attempts to find the configuration of minimum energy of the molecule. A sensible
starting point for geometry optimization is to use experimental data i.e. the X-Ray
diffraction data of the molecules whenever possible. The energy and wave functions
are computed for the initial guess of the geometry, which is then modified iteratively
until (I) an energy minimum has been identified and (II) forces within the molecules
become zero. The structure we optimize may or may not agree to the lowest energy

48
structure. Particularly in the case of large molecules, the initial structure is can be
different from the lowest energy conformer. The lowest energy structure can be
obtained by building a large number of different conformations and minimizing each.
Different conformers can be generated by altering the rotatable torsional angles in the
molecule. Such conformational analysis can be done using Potential energy surface
(PES) scan. It offers considerable information on the available conformational space
of a molecule and helps ascertain the lowest energy conformation. A point on a PES
where the forces are zero is called a stationary point and these are the points generally
located during optimization procedure. We can categorize local or global minima or
transition states (TS) on the PES. TS are the saddle points on the potential energy
surface. Similar to minima, the saddle points are stationary points with all forces zero.
Contrasting minima, one of the second derivatives in the first order saddle is
negative. A starting input geometry is provided for geometry optimization and the
calculation proceeds to traverse the PES. The energy and the gradient are calculated
at each point and the distance and direction of the next step are determined. The force
constants are usually estimated at each point and these constants specify the curvature
of the surface at that point; this provides additional information useful to determining
the next step. Convergence criteria about the forces at a given point and the
displacement of the next step determine whether a stationary point has been obtained.
To establish whether the geometry optimization has found a minimum or TS, it is
49
required to perform wavenumber calculations. A TS is a point that joins two minima
on the PES, and is distinguished by one imaginary wave-number. The eigenvector
from the Hessian force constant matrix determines the nature of the imaginary
frequency and indicates a possible reaction coordinate. A minimum structure will
have no imaginary frequencies.
2.7.2 Wavenumber Calculations
IR and Raman spectra of molecules can be predicted for any optimized molecular
structure. The position and relative intensity of vibrational bands can be gathered
from the output of a wavenumber calculation. This information is independent of
experiment and can therefore be used as a tool to confirm peak positions in
experimental spectra or to predict peak positions and intensities when experimental
data is not available. While real potential is anharmonic calculated wavenumbers are
based on the harmonic potential model. This partially explains discrepancies between
calculated and experimental frequencies.
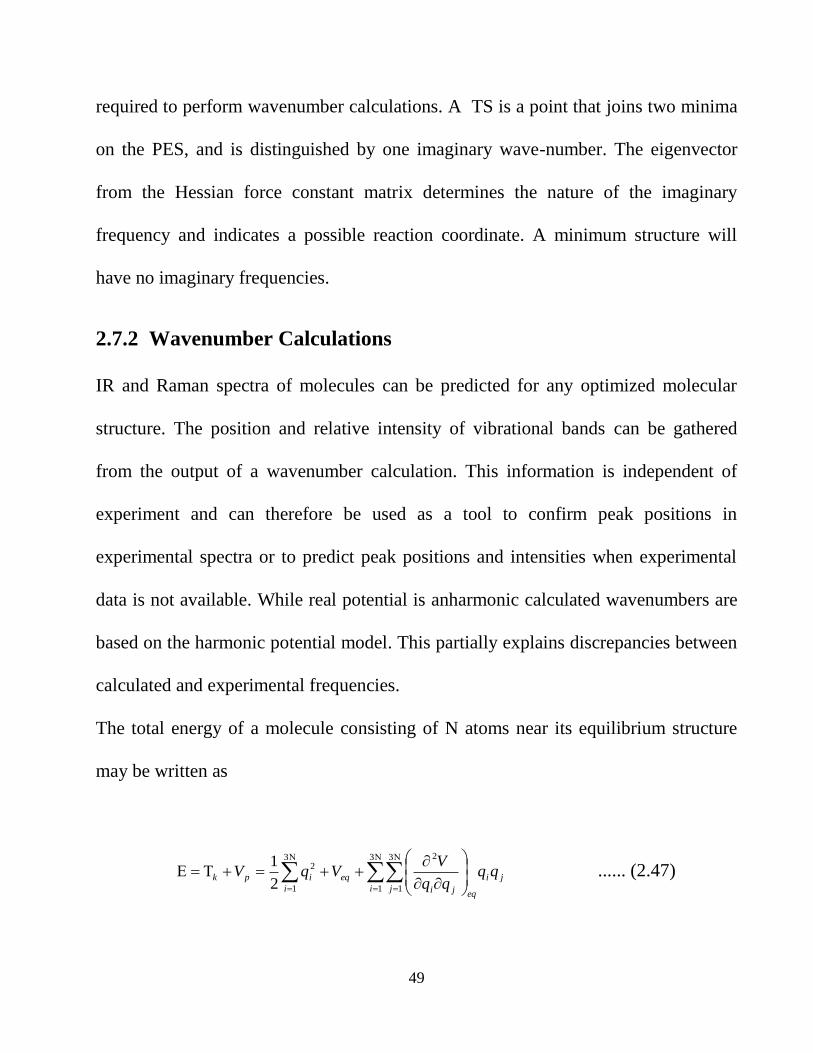
The total energy of a molecule consisting of N atoms near its equilibrium structure
may be written as
ji
eqi j ji
eq
i
ipk qqqq
VVqV
3
1
3
1
23
1
2
2
1 ...... (2.47)
50
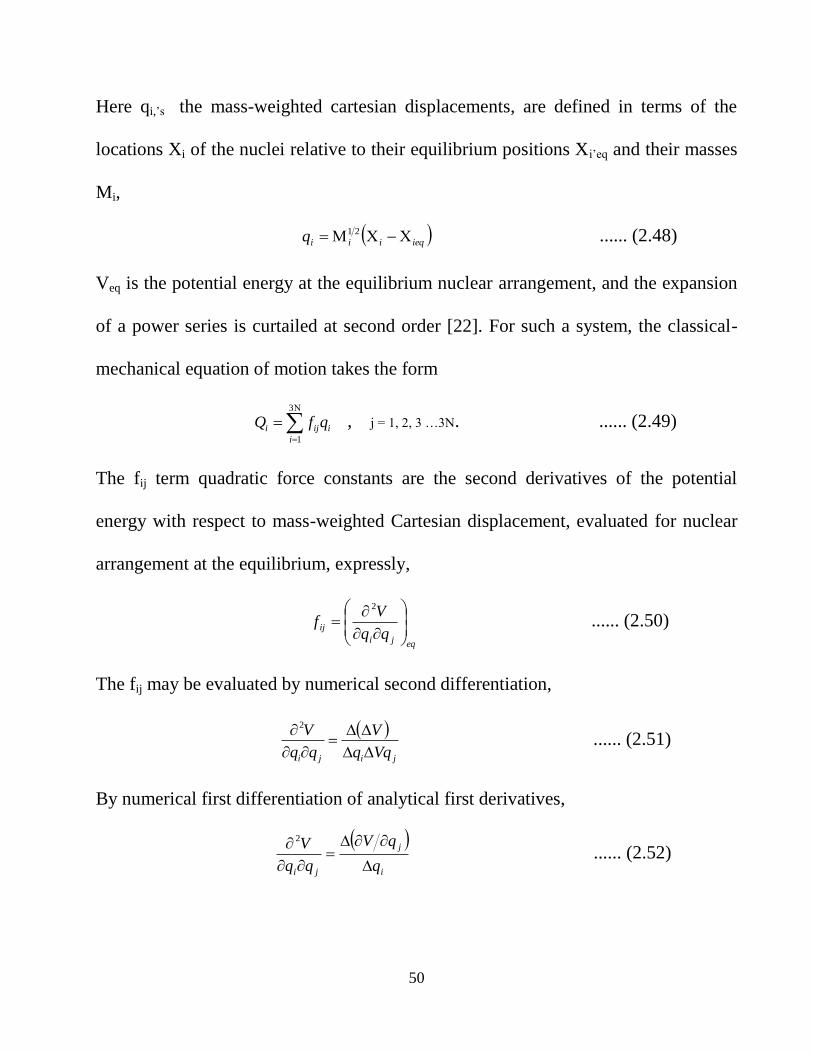
Here qi,‟s the mass-weighted cartesian displacements, are defined in terms of the
locations Xi of the nuclei relative to their equilibrium positions Xi‟eq and their masses
Mi,
ieqiiiq 21 ...... (2.48)
Veq is the potential energy at the equilibrium nuclear arrangement, and the expansion
of a power series is curtailed at second order [22]. For such a system, the classical-
mechanical equation of motion takes the form
i
i
iji qfQ
3
1
, j = 1, 2, 3 …3N. ...... (2.49)
The fij term quadratic force constants are the second derivatives of the potential
energy with respect to mass-weighted Cartesian displacement, evaluated for nuclear
arrangement at the equilibrium, expressly,
eqji
ijqq
Vf
2
...... (2.50)
The fij may be evaluated by numerical second differentiation,
jiji Vqq
V
V
2
...... (2.51)
By numerical first differentiation of analytical first derivatives,
i
j
ji q
qV
V
2
...... (2.52)
51
or by direct analytical second differentiation, Eq. (2.52). The selection of process
depends on the quantum mechanical model employed, that is, single-determinant or
post-Hartree-fock, and practical matters such as the size of the system.
Equation (2.49) may be solved by standard methods [23] to yield a set of 3N
normal-mode vibrational wave-numbers. Six of these (5 in the case of linear
molecules) will be zero as they correspond to translational and rotational (rather than
vibrational) degrees of freedom. Normal modes of vibration are described as simple
harmonic oscillations about a local energy minimum, representative of a system's
structure and its energy function for a purely harmonic potential, any motion can be
exactly expressed as a superposition of normal modes. In the present work the
computed vibrational wavenumbers, their IR and Raman intensities and the
meticulous description of each normal mode of vibration are carried out in terms of
the potential energy distribution. The theoretically calculated DFT wavenumbers, are
typically slightly higher than that of their experimental counterpart and thus proper
scaling factors [24,25] are employed to have better agreement with the experimental
wavenumbers.
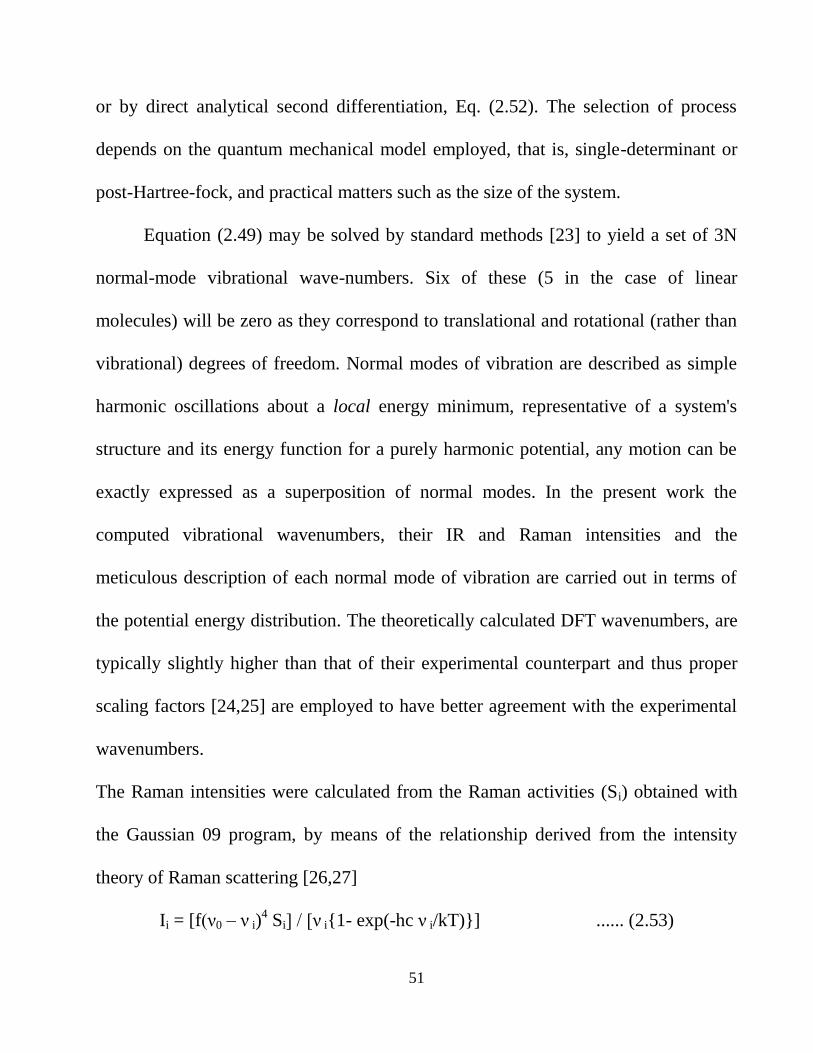
The Raman intensities were calculated from the Raman activities (Si) obtained with
the Gaussian 09 program, by means of the relationship derived from the intensity
theory of Raman scattering [26,27]
Ii = [f(ν0 – ν i)4 Si] / [ν i{1- exp(-hc ν i/kT)}] ...... (2.53)
52
Where ν0 being the exciting wavenumber in cm-1, νi the vibrational wave number of
ith
normal mode, h, c and k universal constants and f is a suitably chosen common
normalization factor for all peak intensities.
2.7.3 Calculation of Electric moments
The Gaussian 09 software was used to calculate the dipole moment (µ) and
polarizability (α) of the molecules, using the finite field (FF) approach. Using
Buckingham‟s definitions [28], the total dipole moment, polarizability and first static
hyperpolarizability in a Cartesian frame is defined by
µ = (µx2 + µy
2 +µz
2)
1/2 ...... (2.54)
<α> = 1/3 [αxx + αyy + αzz ] ...... (2.55)
The total intrinsic hyperpolarizability TOTAL [23] is define as
2/1222 )( zyxTOTAL ...... (2.56)
Where, x = xxx + xyy+ xzz ;
y = yyy+ yzz+ yxx ;
z = zzz+ zxx+ zyy;
2.7.4 Prediction of Thermodynamic Properties
The absolute entropy of a molecule is given as a sum of rotational, vibrational and
translational entropy [24,25] given by -
transvibrot SSSS ...... (2.57)

53
These terms can be evaluated by the following equations-
2/5)/ln()/2ln(2/3 2 PkThmkTRStrans
2/3))8/)(8/)(8//(ln()2/1()/ln( 22222232/1 kIhkIhkIhTRS zyxrrot
63
1
)}/exp(1ln{)}1)//(exp()/{(N
i
vib kThvikTihkTihRS
where N the number of atoms in a given molecule, R is the gas constant, h is
Planck‟s constant, m is the molecular mass, k is the Boltzmann constant, T is the
temperature, P is the pressure, σr is the symmetry number for rotation, I is the
moment of inertia, and υ is the vibrational frequency.
The heat capacity at constant pressure pC , is given by the equation-
63
1
2
})1)/exp()/()/exp()2/3()2/5( /({N
i
vibrottransp kTihkTihkTihRRRCCCC
where Crot, Cvib and Ctrans are contribution to heat capacity due to rotational motion,
vibrational and translation motion respectively.
2.7.5 Calculation of UV spectra
The UV-vis spectra have comprehensive features that are of limited use for
identification of sample but are very valuable for quantitative estimations about the
sample. The analyte concentration in solution can be determined by measuring the
absorbance at some wavelength and applying the Beer-Lambert Law stated as –
“When light passes through / reflected from the sample, the amount of light absorbed
is the difference between the incident (Io) and the transmitted (I) radiation. The light
54
absorbed is expressed as absorbance or transmittance. Transmittance and is defined
as-
Transmittance (T) = I / Io ...... (2.58)
%T = (I / Io) x 100 ...... (2.59)
If molar absorptivity is given by , the molar concentration of solution as c and r is
length of sample cell in cm then absorbance can be written as
A = - log T = c r ...... (2.60)
The relationship implies that larger the number of molecules capable of absorbing
light of given wavelength, the more is the extent of light absorption.
In the ultraviolet-visible region, the incident photon energy corresponds to
electronic excitations from occupied orbitals to unoccupied orbitals. The longest
wavelength absorbed by the molecule corresponds to the energy difference between
the ground state and the first excited state. For example a photon of energy which
corresponds to the difference in energy between the bonding π orbital and the
antibonding π* orbitals cause a π → π* transition.
55
References
1. M. J. Frisch, G. W. Trucks, H. B. Schlegel, G. E. Scuseria, M. A. Robb, J. R.
Cheeseman, G. Scalmani, V. Barone, B. Mennucci, G.A. Petersson, H.
Nakatsuji, M. Caricato, X. Li, H.P. Hratchian, A.F. Izmaylov, J. Bloino, G.
Zheng, J.L. Sonnenberg,M. Hada, M. Ehara, K. Toyota, R. Fukuda, J.
Hasegawa, M. Ishida, T. Nakajima, Y. Honda, O. Kitao, H. Nakai, T. Vreven,
J.A. Montgomery Jr., J.E. Peralta, F. Ogliaro, M. Bearpark, J.J. Heyd, E.
Brothers, K.N. Kudin, V.N. Staroverov, R. Kobayashi, J. Normand, K.
Raghavachari, A. Rendell, J.C. Burant, S.S. Iyengar, J. Tomasi, M.
Cossi, N. Rega, J.M. Millam, M. Klene, J.E. Knox, J.B. Cross, V. Bakken, C.
Adamo, J. Jaramillo, R. Gomperts, R.E. Stratmann, O. Yazyev, A.J. Austin, R.
Cammi, C. Pomelli, J.W. Ochterski, R.L. Martin, K. Morokuma, V.G.
Zakrzewski, G.A. Voth, P. Salvador, J.J. Dannenberg, S. Dapprich, A.D.
Daniels, Ö. Farkas, J.B. Foresman, J.V. Ortiz, J. Cioslowski, D.J. Fox,
Gaussian 09, Revision A.1, Gaussian, Inc., Wallingford CT (2009).
2. J. A. Pople and D. L. Beveridge, Approximate Molecular Orbital Theory,
McGraw-Hill, New York, (1970).
3. J. B. Foresman and A. Frisch, Exploring Chernistry with Electronic Structure
Methods, Gaussian Inc., Pittsburgh, (1993).
4. M. J. S. Dewer and W. Thiel, J. Am Chem. Soc., 99 (1977) 4899.
56
5. M. J. S. Dewer, E. G. Zoebisch, E. F. Healy, J. J. P. Stewart, J. Am. Chem. Soc.,
107 (1985) 3902.
6. J. P. P. Stewart, J. Comp. Chem., 10 (1989) 209.
7. A. Szabo and N.S. Ostland, Modern Quantum Chemistry, Introduction to
Advanced Electronic Structure Theory, Dover Publications, Inc. Mineola, N. Y.,
1st ed., (1996).
8. P. F. Bernath, Spectra of Atoms and Molecules, Oxford University Press, N.Y.,
(1995).
9. I. N. Levine, Quantum Chemistry, Prentice-Hall, Inc. Englewood Cliffs, New
Jersey, 4th ed, (1991).
10. C. Moller and M.S. Plesset, Phys. Rev., 16 (1934) 618.
11. J. Cizek, J. Chem. Phys., 15 (1960) 4256.
12. W. Kohn and L.J. Sham, J. Phys. Rev., A 140 (1965) 1133.
13. J.A. Pople, M. Head-Gordon and K. Raghavachari, J. Chem. Phys., 87 (1987)
5968.
14. Jr. E. G. Brame and J. Grasselli, Infrared and Raman Spectroscopy Part A,
Marcel Dekker Inc., New York, (1976).
15. T. Pasinszki and N. P. C. Westwood, J. Phys. Chem., A 102 (1998) 4939.
16. B. G. Johnson, P. M. W. Gill and J. A. Pople, J. Chem. Phys., 98 (1993) 5612.
17. R. G. Parr and W. Yang, Density-Functional Theory of Atom and
57
Molecules, Oxford University Press, Oxford, (1989).
18. A. D. Becke, J. Chem. Phys., 98 (1993) 1372.
19. C. Lee, W. Yang and R.G. Parr, Phys. Rev., B 37 (1988) 785.
20. P. Hohenberg and W. Kohn, Phys. Rev. B, 136 (1964) 864.
21. M. Levy Phys. Rev. A, 26 (1982) 1200.
22. Bernhard Schrader, Infrared & Raman Spectroscopy, VCH Pub., Inc., New
York, (1995).
23. E. M. Arnett and J. W. Larsen, J. Am. Chem. Soc., 91 (1969) 1438.
24. A. P. Scott and L. Random, J. Phys. Chem., 100 (1996) 16502.
25. P. Pulay, G. Fogarasi, G. Pongor, J. E. Boggs, and A. Vargha, J. Am. Chem.
Soc., 105 (1983) 7037.
26. G. Keresztury, S. Holly, J. Varga, G. Besenyei, A. Y. Wang, and J. R. During,
Spectrochim. Acta, 49 A (1993) 2007.
27. G. Keresztury, in Raman Spectroscopy: Theory-Handbook of Vibrational
Spectroscopy, (Eds. J.M. Chalmers and P. R. Griffith), John Wiley & Sons,
New York, 2002.
28. A. D. Buckingham, Adv. Chem. Phys., 12 (1967) 107.

58
Molecular structure, vibrational
& electronic properties of 4-
Phenyl-3H-1,3-thiazol-2-ol
using density functional
theory and comparison
of drug efficacy of
keto and enol forms
by QSAR analysis
59
3.1 Introduction
Thiazoles exhibit a variety of biological activity namely antibacterial, antifungal,
anti-HIV, anti-hypertension, anti-inflammatory, anticancer, anticonvulsant and
antidepressant [1-6], hence are valuable structural components in the field of
medicinal chemistry. In fact Thiazole moiety appears commonly in structures of
various natural products and biologically active compounds, like thiamine (vitamin-
B) and also is an integral part of most of the available antibiotics drugs such as
penicillin, micrococcin which have revolutionized the therapy of bacterial diseases
[7]. Phenyl and substituted phenyl-thiazoles are also common structures of a wide
range of biologically active natural products [8]. Recently it has been found that
phenyl-thiazole ring system provides a template for the design and synthesis of
antiviral agents which inhibit the flavi-viruses by targeting their E-protein [9].
Pharmaceutical importance of thiazoles and their derivatives drove us to investigate
the molecular structural properties, vibrational and energetic data of 4-Phenyl-3H-
1,3-thiazol-2-ol (4P3HT) with a long-term objective to achieve a better understanding
of the properties of such derivatives. 4P3HT can exist in two tautomeric forms – keto
and enol (Fig. 3.1). DFT/B3LYP/6-311++G(d,p) calculations show that the keto form
(Ground state energy -875.50601 a.u.) is more stable than enol form (Ground state
energy -875.48940a.u.). K. Pihlaja et. al. [10] have reported geometric and electronic
properties of 4-phenylthiazol-2(3H)-one (keto form), at the most elementary HF level
60
of theory which does not take into account the electronic correlation effects. The
work reported in this Chapter deals with the comprehensive investigation of
geometrical and electronic structure of enolic form of 4P3HT in ground as well as in
the first excited state. The significance of enol form lies in the fact that this form
ionizes into the enolate form under physiological conditions and increases the
interaction of the drug with the vis-à-vis receptors, functional proteins or enzymes.
To compare the drug efficacy of enolic and keto forms, QSAR properties of both
forms have also been computed and discussed. Experimentally observed spectral data
(FT-TR and FT-Raman) of the title compound is compared with the spectral data
obtained by DFT/B3LYP method. The molecular properties like dipole moment,
polarizability, first static hyperpolarizability and molecular electrostatic potential
surface, contour map have been calculated to get a better understanding of the
properties of the title molecule. Natural bond orbital (NBO) analysis has been applied
to study the stability of the molecule arising from charge delocalization. UV–Vis
spectrum of the title compound was also recorded and electronic properties, such as
frontier orbitals and band gap energies were calculated by TD-DFT approach.
3.2. Experimental and computational methods
3.2.1 Sample and instrumentation
The pure 4-Phenyl-3H-1,3-thiazol-2-ol (4P3HT) of spectral grade was purchased
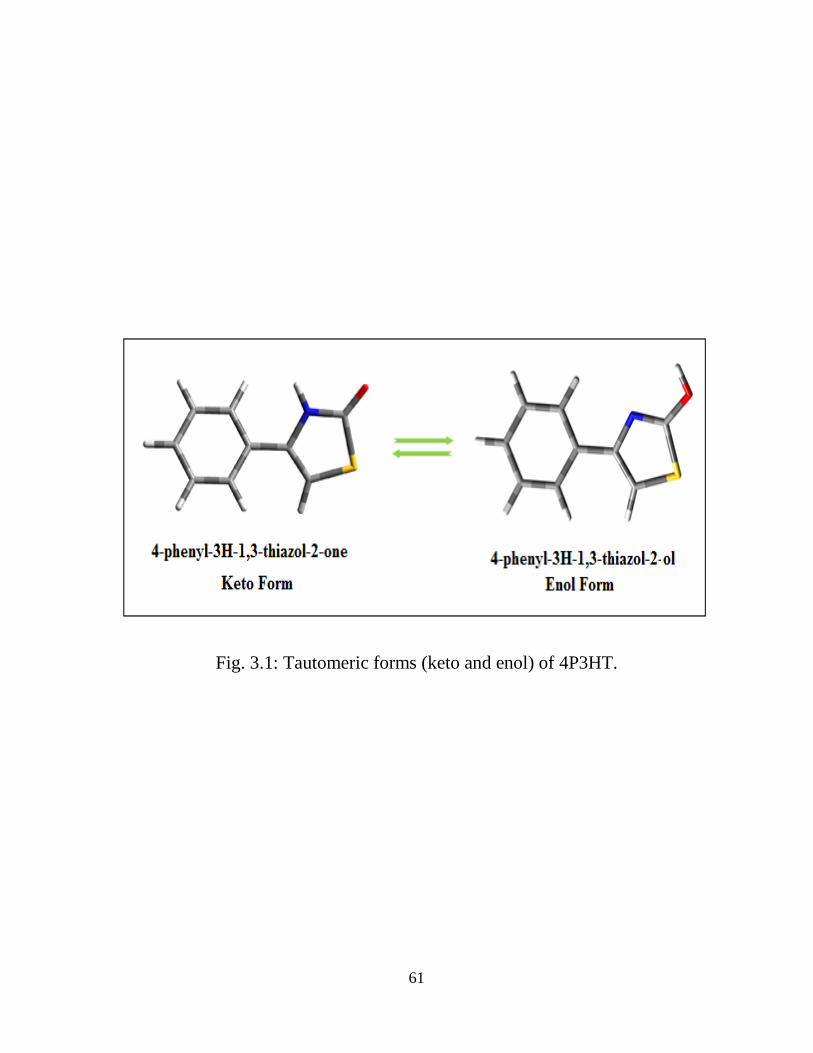
61
Fig. 3.1: Tautomeric forms (keto and enol) of 4P3HT.
62
from M/s Aldrich Chemical Co., as a white crystalline solid and was used as such
without any further purification. The sample was used to record FT-Raman and FT-
IR spectra. FT-IR and FT-Raman spectra were recorded on a Varian 7000 series
spectrometer in the region 4000–400 cm-1
with a spectral resolution of 0.5 cm-1
at
AIRF, Jawaharlal Nehru University, New Delhi. For Raman Spectra the 1064 nm
laser line of Nd:YAG laser was used as the exciting wavelength with an output power
of about 2 mW at the sample position. The spectrum was recorded in the range of
4000–100 cm-1
with a scanning speed of 10 cm-1
min-1
and the spectral resolution of
4.0 cm-1
. UV absorption spectra of 4P3HT were recorded in methanol and chloroform
using the Shimadzu 1800 UV–Vis recording spectrometer in the spectral region of
200–500 nm.
3.2.2 Computational details
Density functional theory [11] treated according to hybrid Becke‟s three parameter
and the Lee–Yang–Parr functional (B3LYP) [12–14] supplemented with polarized
triple-zeta 6-311++G(d,p) basis sets was used to study 4P3HT, as this quantum
chemical method provides a very good overall description of medium-sized
molecules. It has also been used to calculate the dipole moment, mean polarizability
and first static hyperpolarizability based on the finite field approach. All calculations
in this study have been performed with the Gaussian 09 program package [15] and
results were analysed with the Gaussview 5.0 molecular visualization program [16].
63
The most stable geometry of the molecule has been determined from the potential
energy scan by varying the S17-C15-O18-H19 and N16-C12-C3-C4 dihedral angles
at B3LYP/6-311++G(d,p) level of theory. 3-dimensional Potential energy surface
showing the variation of dihedral angles and their corresponding energies are given in
Fig. 3.2(a) and 3.2(b) and thus obtained stable conformers of the title molecule are
shown in Fig. 3.2(c). Geometrical structure corresponding to the lowest minima in the
potential energy surface (represented as conformer A in Fig. 3.2(c)) has been used for
the calculation of molecular properties and for the calculation of vibrational
wavenumbers. Optimized parameters of the title molecule are very close to the
experimental values reported by Garbarczyk et.al. [17] for N-phenylthioamide
thiazole-2. Positive value of all the calculated wavenumbers confirms the stability of
optimized geometry. An empirical uniform scaling factor of 0.983 up to 1700 cm-1
and 0.958 for greater than 1700 cm-1
[18,19] was used to offset the systematic errors
caused by basis set incompleteness, neglect of electron correlation and vibrational
anharmonicity [20]. Theoretical vibrational assignment of the title compound using
percentage potential energy distribution (PED) has been done with the MOLVIB
program (version V7.0-G77) written by T. Sundius [21-23]. The theoretical UV–Vis
spectrum has been computed by TD-DFT method with 6-311++G(d,p) basis set for
gas phase and solvent effect also has been taken into consideration by implementing
IEFPCM model at the same level of theory.
64
Natural bonding orbital (NBO) calculations [24] were performed using
Gaussian 09 package in order to understand various second order interactions
between the filled orbitals of one subsystem and vacant orbitals of another subsystem
which is a measure of the intermolecular delocalization or hyper conjugation. The
second order perturbation theory analysis of Fock matrix in NBO basis of 4P3HT was
carried out to evaluate the donor-acceptor interactions. The interactions result in a
loss of occupancy from the localized NBO of the idealized Lewis structure into an
empty non-Lewis orbital. For each donor (i) and acceptor (j), the stabilization energy
associated with the delocalization i→ j is estimated as
Where is the donor orbital occupancy, and are diagonal elements and F (i, j) is
the off diagonal NBO Fock matrix element. Natural bond orbital analysis provides an
efficient method for studying intra and intermolecular bonding as well as interaction
among bonds. It also provides a useful basis for investigating charge transfer or
conjugative interaction in molecular systems. The QSAR parameters of keto and
enolic form of 4P3HT have been calculated employing Hyperchem 8.0 software [25].
3.2.3 Prediction of Raman intensities
The Raman activities ( ) calculated with the Gaussian 09 program were
subsequently converted to relative Raman intensities ( ) using the following
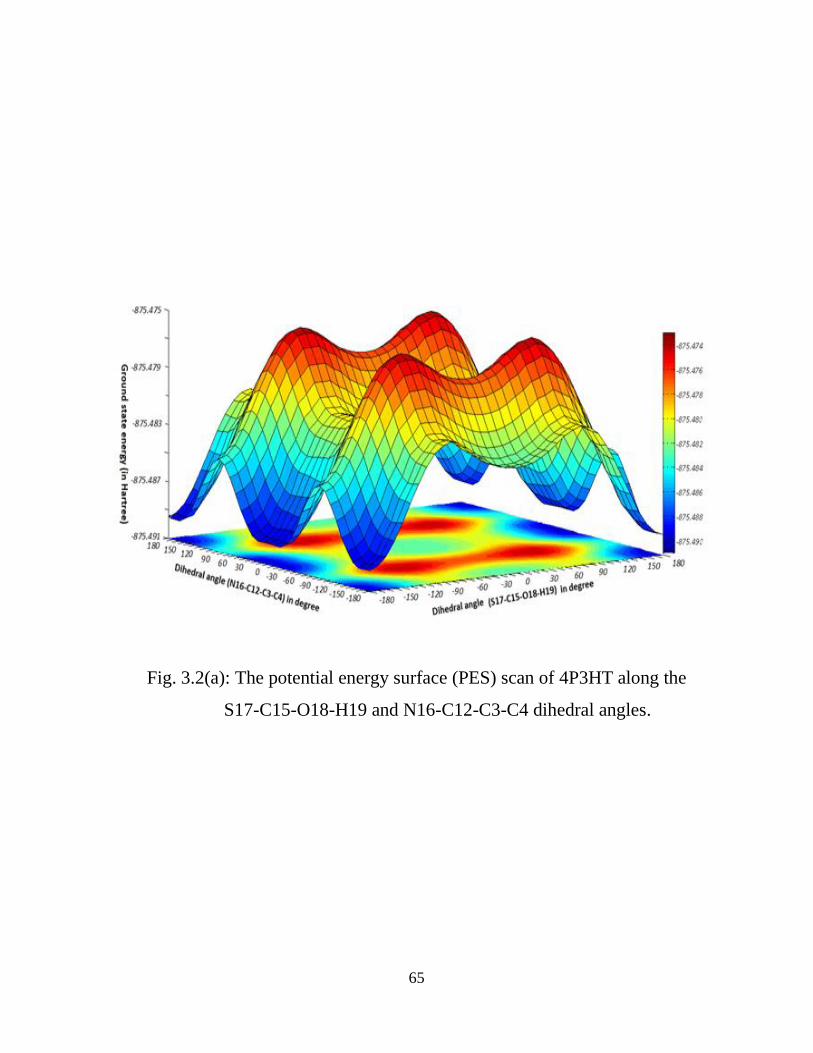
65
Fig. 3.2(a): The potential energy surface (PES) scan of 4P3HT along the
S17-C15-O18-H19 and N16-C12-C3-C4 dihedral angles.
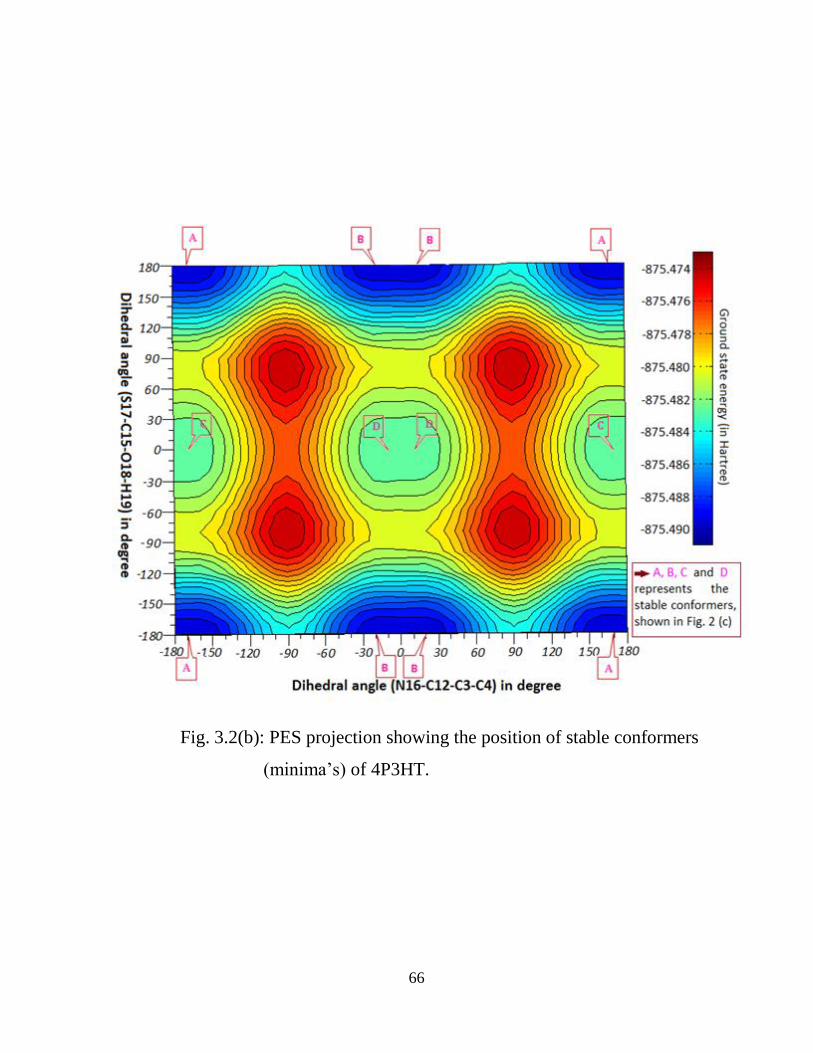
66
Fig. 3.2(b): PES projection showing the position of stable conformers
(minima‟s) of 4P3HT.
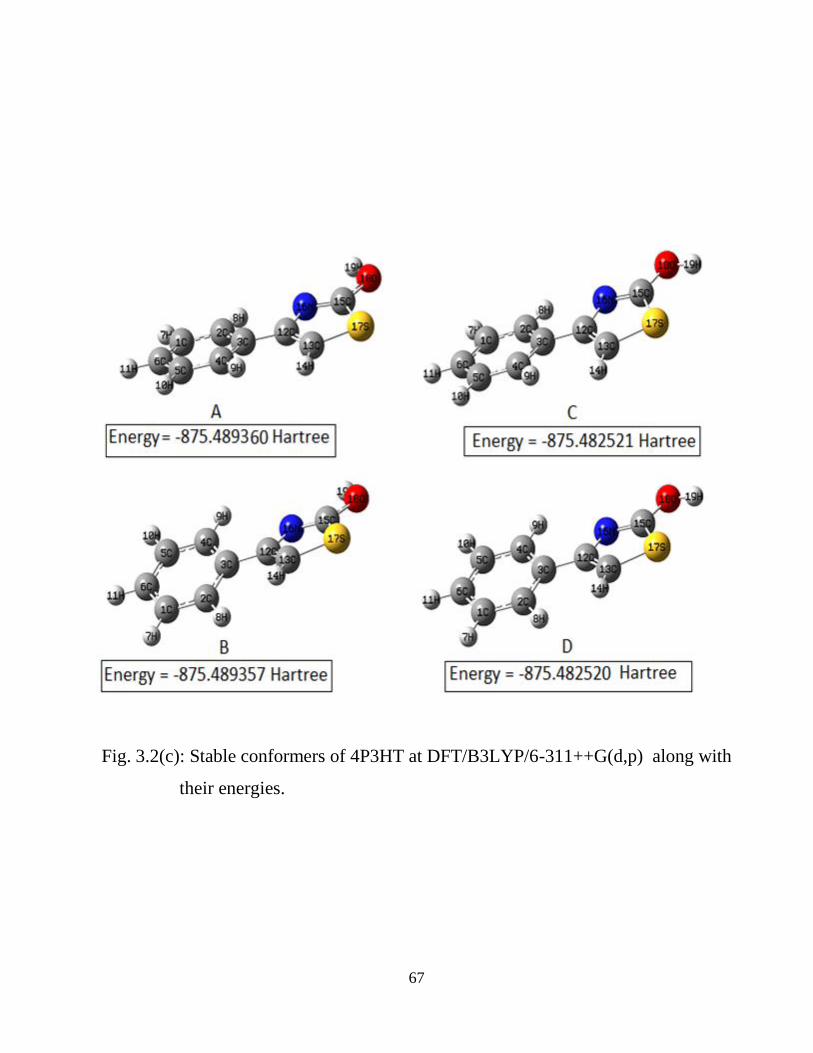
67
Fig. 3.2(c): Stable conformers of 4P3HT at DFT/B3LYP/6-311++G(d,p) along with
their energies.

68
relationship derived from the basic theory of Raman scattering [26-27].
⁄ ⁄
Where is the exciting frequency in cm-1
, the vibrational wave number of the ith
normal mode, h, c and are the fundamental constants and is a suitably chosen
common normalisation factor for all the peak intensities. The calculated Raman and
IR spectra were plotted using the pure Lorentzian band shape with a band width of
FWHM of 5 cm-1
.
3.3 Results and discussion
3.3.1 Molecular geometry and PES scan studies
To calculate the minimum energy structure of the molecule, potential energy surface
(PES) scan were performed at DFT/B3LYP/6-311++G(d,p) level of theory by
varying dihedral angles S17-C15-O18-H19 and N16-C12-C3-C4 in steps of 10o
from
-180o
to 180o
and all the geometrical parameters were simultaneously relaxed during
the scan except the two selected dihedral angles. Dihedral angle N16-C12-C3-C4 and
S17-C15-O18-H19 are the relevant torsional angles to gauge conformational
flexibility within the title molecule. The torsional profiles of PES scan are shown in
Fig. 3.2(a) and 3.2(b). Stable conformers (A, B, C, and D) corresponding to the
minima on potential energy surface are shown in Fig. 3.2(c) with their respective
ground state energies. Eigen values obtained from scan output reveals that, the
structure (A) positioning the dihedral N16-C12-C3-C4/S17-C15-O18-H19 at
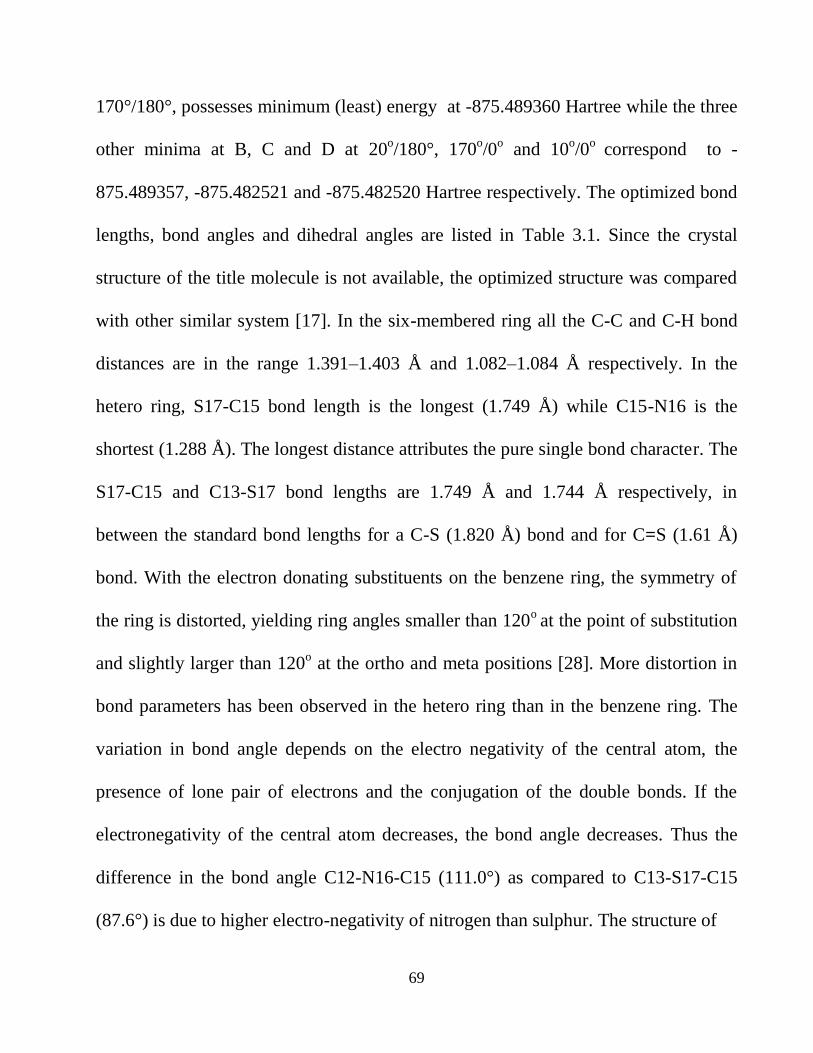
69
170°/180°, possesses minimum (least) energy at -875.489360 Hartree while the three
other minima at B, C and D at 20o/180°, 170
o/0
o and 10
o/0
o correspond to -
875.489357, -875.482521 and -875.482520 Hartree respectively. The optimized bond
lengths, bond angles and dihedral angles are listed in Table 3.1. Since the crystal
structure of the title molecule is not available, the optimized structure was compared
with other similar system [17]. In the six-membered ring all the C-C and C-H bond
distances are in the range 1.391–1.403 Å and 1.082–1.084 Å respectively. In the
hetero ring, S17-C15 bond length is the longest (1.749 Å) while C15-N16 is the
shortest (1.288 Å). The longest distance attributes the pure single bond character. The
S17-C15 and C13-S17 bond lengths are 1.749 Å and 1.744 Å respectively, in
between the standard bond lengths for a C-S (1.820 Å) bond and for C=S (1.61 Å)
bond. With the electron donating substituents on the benzene ring, the symmetry of
the ring is distorted, yielding ring angles smaller than 120o
at the point of substitution
and slightly larger than 120o at the ortho and meta positions [28]. More distortion in
bond parameters has been observed in the hetero ring than in the benzene ring. The
variation in bond angle depends on the electro negativity of the central atom, the
presence of lone pair of electrons and the conjugation of the double bonds. If the
electronegativity of the central atom decreases, the bond angle decreases. Thus the
difference in the bond angle C12-N16-C15 (111.0°) as compared to C13-S17-C15
(87.6°) is due to higher electro-negativity of nitrogen than sulphur. The structure of
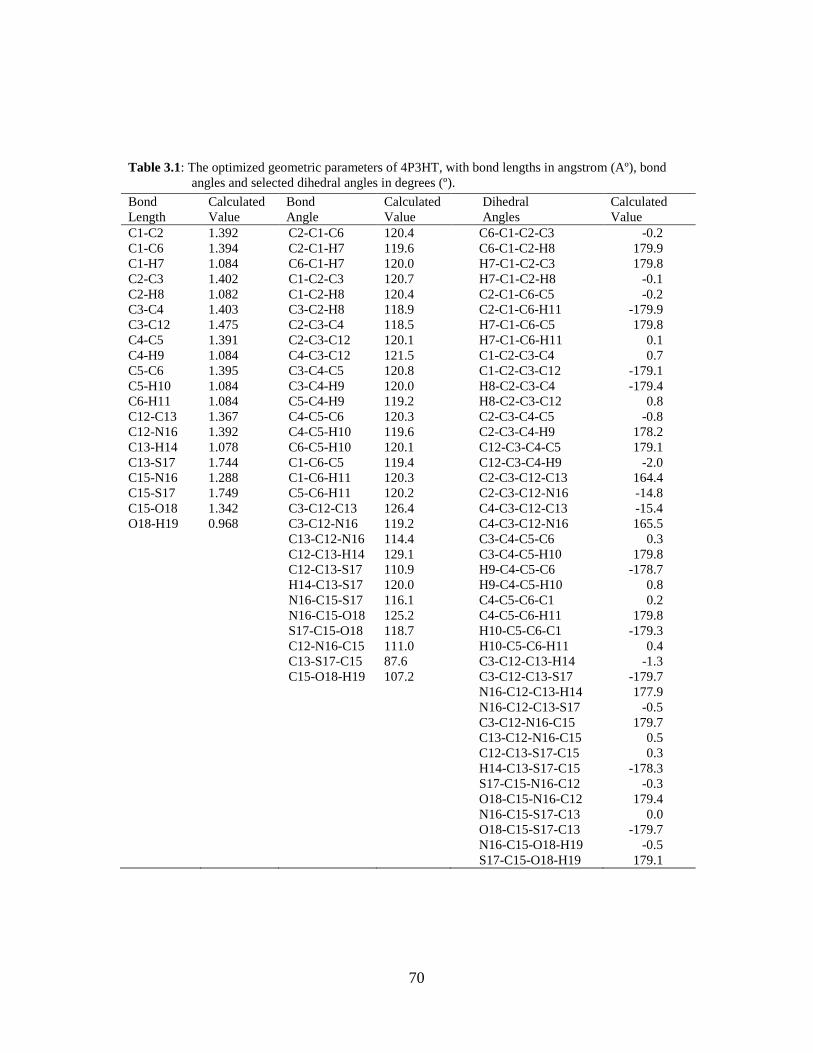
70
Table 3.1: The optimized geometric parameters of 4P3HT, with bond lengths in angstrom (Aº), bond
angles and selected dihedral angles in degrees (º).
Bond
Length
Calculated
Value
Bond
Angle
Calculated
Value
Dihedral
Angles
Calculated
Value
C1-C2 1.392 C2-C1-C6 120.4 C6-C1-C2-C3 -0.2
C1-C6 1.394 C2-C1-H7 119.6 C6-C1-C2-H8 179.9
C1-H7 1.084 C6-C1-H7 120.0 H7-C1-C2-C3 179.8
C2-C3 1.402 C1-C2-C3 120.7 H7-C1-C2-H8 -0.1
C2-H8 1.082 C1-C2-H8 120.4 C2-C1-C6-C5 -0.2
C3-C4 1.403 C3-C2-H8 118.9 C2-C1-C6-H11 -179.9
C3-C12 1.475 C2-C3-C4 118.5 H7-C1-C6-C5 179.8
C4-C5 1.391 C2-C3-C12 120.1 H7-C1-C6-H11 0.1
C4-H9 1.084 C4-C3-C12 121.5 C1-C2-C3-C4 0.7
C5-C6 1.395 C3-C4-C5 120.8 C1-C2-C3-C12 -179.1
C5-H10 1.084 C3-C4-H9 120.0 H8-C2-C3-C4 -179.4
C6-H11 1.084 C5-C4-H9 119.2 H8-C2-C3-C12 0.8
C12-C13 1.367 C4-C5-C6 120.3 C2-C3-C4-C5 -0.8
C12-N16 1.392 C4-C5-H10 119.6 C2-C3-C4-H9 178.2
C13-H14 1.078 C6-C5-H10 120.1 C12-C3-C4-C5 179.1
C13-S17 1.744 C1-C6-C5 119.4 C12-C3-C4-H9 -2.0
C15-N16 1.288 C1-C6-H11 120.3 C2-C3-C12-C13 164.4
C15-S17 1.749 C5-C6-H11 120.2 C2-C3-C12-N16 -14.8
C15-O18 1.342 C3-C12-C13 126.4 C4-C3-C12-C13 -15.4
O18-H19 0.968 C3-C12-N16 119.2 C4-C3-C12-N16 165.5
C13-C12-N16 114.4 C3-C4-C5-C6 0.3
C12-C13-H14 129.1 C3-C4-C5-H10 179.8
C12-C13-S17 110.9 H9-C4-C5-C6 -178.7
H14-C13-S17 120.0 H9-C4-C5-H10 0.8
N16-C15-S17 116.1 C4-C5-C6-C1 0.2
N16-C15-O18 125.2 C4-C5-C6-H11 179.8
S17-C15-O18 118.7 H10-C5-C6-C1 -179.3
C12-N16-C15 111.0 H10-C5-C6-H11 0.4
C13-S17-C15 87.6 C3-C12-C13-H14 -1.3
C15-O18-H19 107.2 C3-C12-C13-S17 -179.7
N16-C12-C13-H14 177.9
N16-C12-C13-S17 -0.5
C3-C12-N16-C15 179.7
C13-C12-N16-C15 0.5
C12-C13-S17-C15 0.3
H14-C13-S17-C15 -178.3
S17-C15-N16-C12 -0.3
O18-C15-N16-C12 179.4
N16-C15-S17-C13 0.0
O18-C15-S17-C13 -179.7
N16-C15-O18-H19 -0.5
S17-C15-O18-H19 179.1
71
title molecule deviates significantly from planar structure because the phenyl and
hetero rings are rotated around the C3-C12 axis to give a C4-C3-C12-N16 torsion
angle of 165.5°.
3.3.2 Vibrational analysis
The 4P3HT molecule consists of 19 atoms, which undergo 51 normal modes of
vibrations. The molecule possesses C1 symmetry. Vibrational spectral assignments
were performed at the B3LYP level with the triple split valence basis set 6-
311++G(d,p). A detailed vibrational description can be given by means of normal
coordinate analysis. The specific assignment to each wavenumber is attempted
through potential energy distribution (PED). For this purpose the full set of internal
coordinates are defined and given in Table 3.2. The local symmetry coordinates for
4P3HT were defined as recommended by Fogarasi and Pulay [29] and are presented
in Table 3.3. The method is useful for determining the mixing of other modes, but the
maximum contribution is accepted to be the most significant mode. Observed FT-IR
and FT-Raman bands with their relative intensities and calculated wave numbers and
assignments are given in Table 3.4. The experimental FT-Raman and FT-IR spectra
of 4P3HT have been presented in Fig. 3.3 while calculated (simulated) spectra are
given in Fig. 3.4. The title compound 4P3HT consists of a thiazole ring substituted
with phenyl ring and a hydroxyl group hence the vibrational modes are discussed
under three heads:
72
(i) Thiazole ring vibrations (ii) Phenyl ring vibrations (iii) O-H group
3.3.2.1 Thiazole ring vibrations
As the key moiety in 4P3HT is the thiazole moiety having the conjugated -C=C-N=C
system and two hetero atoms, vibrations of these hetero atoms are themselves
influenced and modified. It is worth here to discuss the C-S, C-N and C=N, C=C
vibrations under this head. The C-S stretching vibration cannot be identified easily as
it results in weak infrared bands, which is susceptible to coupling effects and is also
of variable intensity. In general C-S stretching vibration occurs in the region 700–600
cm-1
. The theoretically computed values in case of 4P3HT are at 821 and 698 cm-1
which are matched with the FT-IR bands at 832 and 683 cm-1
. The shifting of this
wavenumber to the higher side can be explained on the basis of Mulliken Population
analysis (MPA) (refer to Fig. 3.5). According to MPA the positive charge is
concentrated on sulphur atom and negative charge is concentrated on nitrogen atom
on the heterocyclic ring, consequently there is a strong attraction in thiazole ring.
NPA charges also show strong attraction due to opposite charges on sulphur and
nitrogen atoms. This results in reduction of bond length and thus shifting up of
vibrational wavenumbers of heterocyclic ring. The band occurring at 569/559 in FT-
IR/FT-Raman is assigned to C-S-C bending vibration; the calculated value for this
mode is at 571 cm-1
. V. Arjunan et.al. have observed this bending vibration at 526
cm-1
for 2-amino-4-methylbenzothiazole [30]. Another important vibration in
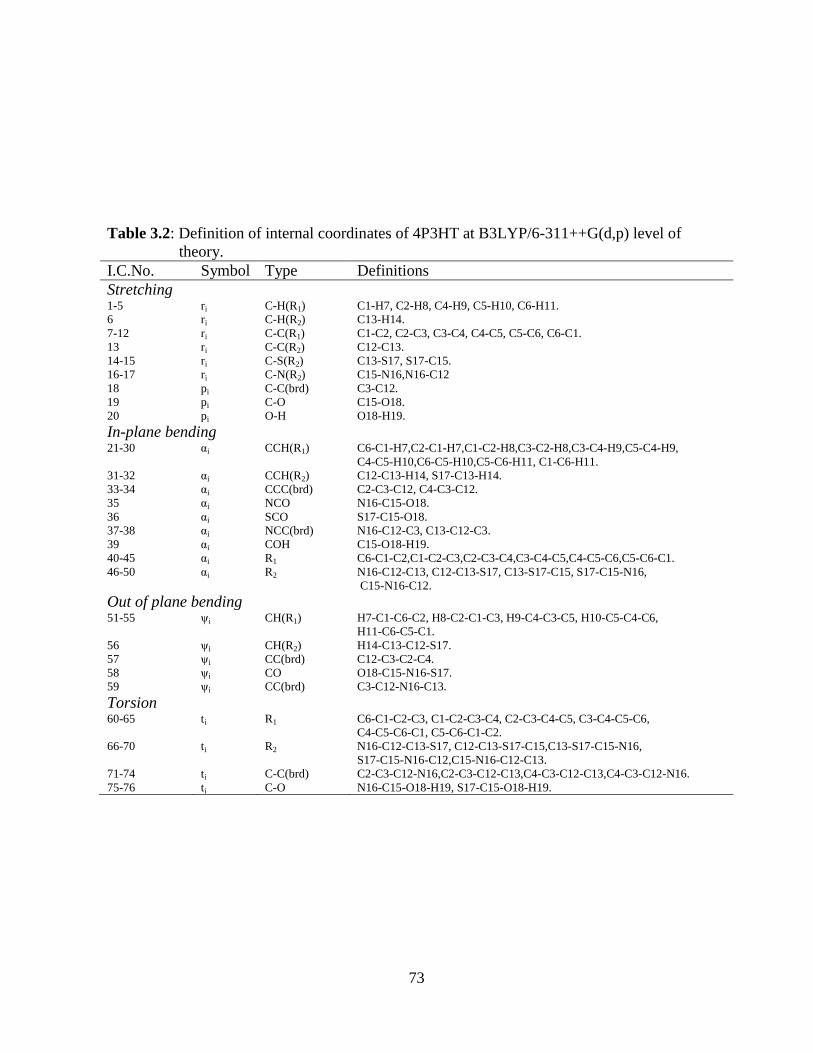
73
Table 3.2: Definition of internal coordinates of 4P3HT at B3LYP/6-311++G(d,p) level of
theory.
I.C.No. Symbol Type Definitions
Stretching 1-5 ri C-H(R1) C1-H7, C2-H8, C4-H9, C5-H10, C6-H11.
6 ri C-H(R2) C13-H14.
7-12 ri C-C(R1) C1-C2, C2-C3, C3-C4, C4-C5, C5-C6, C6-C1.
13 ri C-C(R2) C12-C13.
14-15 ri C-S(R2) C13-S17, S17-C15.
16-17 ri C-N(R2) C15-N16,N16-C12
18 pi C-C(brd) C3-C12.
19 pi C-O C15-O18.
20 pi O-H O18-H19.
In-plane bending 21-30 αi CCH(R1) C6-C1-H7,C2-C1-H7,C1-C2-H8,C3-C2-H8,C3-C4-H9,C5-C4-H9,
C4-C5-H10,C6-C5-H10,C5-C6-H11, C1-C6-H11.
31-32 αi CCH(R2) C12-C13-H14, S17-C13-H14.
33-34 αi CCC(brd) C2-C3-C12, C4-C3-C12.
35 αi NCO N16-C15-O18.
36 αi SCO S17-C15-O18.
37-38 αi NCC(brd) N16-C12-C3, C13-C12-C3.
39 αi COH C15-O18-H19.
40-45 αi R1 C6-C1-C2,C1-C2-C3,C2-C3-C4,C3-C4-C5,C4-C5-C6,C5-C6-C1.
46-50 αi R2 N16-C12-C13, C12-C13-S17, C13-S17-C15, S17-C15-N16,
C15-N16-C12.
Out of plane bending 51-55 ψi CH(R1) H7-C1-C6-C2, H8-C2-C1-C3, H9-C4-C3-C5, H10-C5-C4-C6,
H11-C6-C5-C1.
56 ψi CH(R2) H14-C13-C12-S17.
57 ψi CC(brd) C12-C3-C2-C4.
58 ψi CO O18-C15-N16-S17.
59 ψi CC(brd) C3-C12-N16-C13.
Torsion 60-65 ti R1 C6-C1-C2-C3, C1-C2-C3-C4, C2-C3-C4-C5, C3-C4-C5-C6,
C4-C5-C6-C1, C5-C6-C1-C2.
66-70 ti R2 N16-C12-C13-S17, C12-C13-S17-C15,C13-S17-C15-N16,
S17-C15-N16-C12,C15-N16-C12-C13.
71-74 ti C-C(brd) C2-C3-C12-N16,C2-C3-C12-C13,C4-C3-C12-C13,C4-C3-C12-N16.
75-76 ti C-O N16-C15-O18-H19, S17-C15-O18-H19.
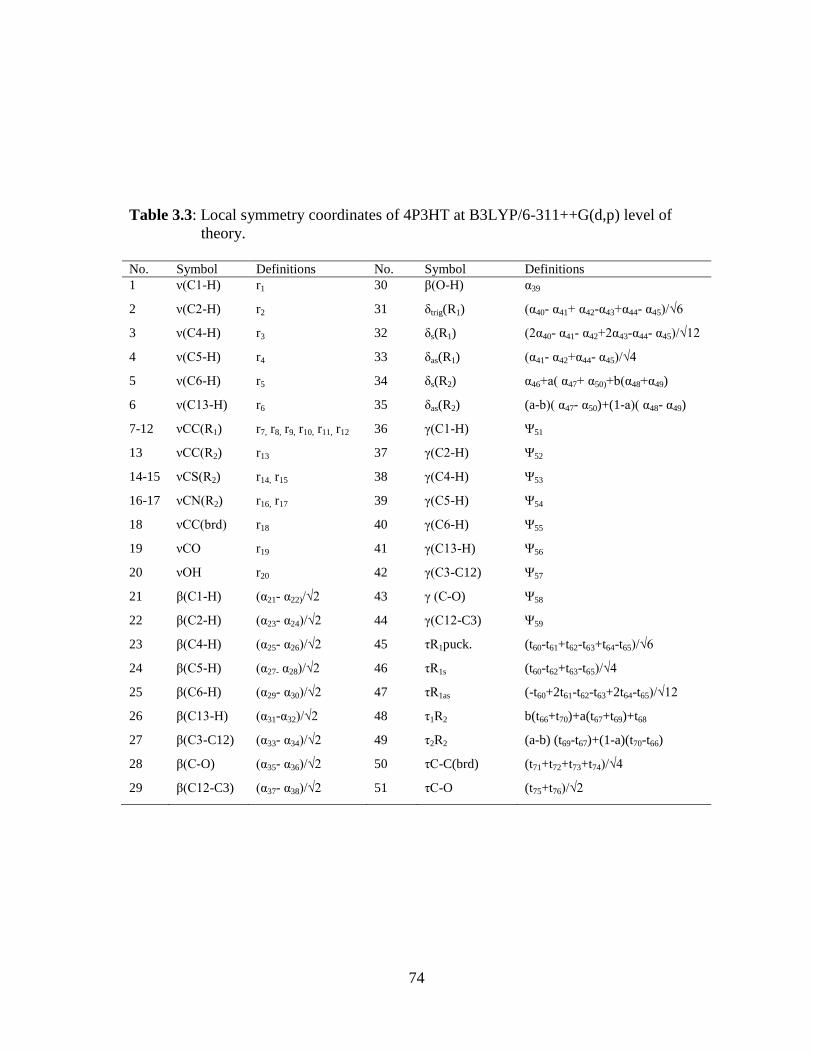
74
Table 3.3: Local symmetry coordinates of 4P3HT at B3LYP/6-311++G(d,p) level of
theory.
No. Symbol Definitions No. Symbol Definitions
1 ν(C1-H) r1 30 β(O-H) α39
2 ν(C2-H) r2 31 δtrig(R1) (α40- α41+ α42-α43+α44- α45)/√6
3 ν(C4-H) r3 32 δs(R1) (2α40- α41- α42+2α43-α44- α45)/√12
4 ν(C5-H) r4 33 δas(R1) (α41- α42+α44- α45)/√4
5 ν(C6-H) r5 34 δs(R2) α46+a( α47+ α50)+b(α48+α49)
6 ν(C13-H) r6 35 δas(R2) (a-b)( α47- α50)+(1-a)( α48- α49)
7-12 νCC(R1) r7, r8, r9, r10, r11, r12 36 γ(C1-H) Ψ51
13 νCC(R2) r13 37 γ(C2-H) Ψ52
14-15 νCS(R2) r14, r15 38 γ(C4-H) Ψ53
16-17 νCN(R2) r16, r17 39 γ(C5-H) Ψ54
18 νCC(brd) r18 40 γ(C6-H) Ψ55
19 νCO r19 41 γ(C13-H) Ψ56
20 νOH r20 42 γ(C3-C12) Ψ57
21 β(C1-H) (α21- α22)/√2 43 γ (C-O) Ψ58
22 β(C2-H) (α23- α24)/√2 44 γ(C12-C3) Ψ59
23 β(C4-H) (α25- α26)/√2 45 τR1puck. (t60-t61+t62-t63+t64-t65)/√6
24 β(C5-H) (α27- α28)/√2 46 τR1s (t60-t62+t63-t65)/√4
25 β(C6-H) (α29- α30)/√2 47 τR1as (-t60+2t61-t62-t63+2t64-t65)/√12
26 β(C13-H) (α31-α32)/√2 48 τ1R2 b(t66+t70)+a(t67+t69)+t68
27 β(C3-C12) (α33- α34)/√2 49 τ2R2 (a-b) (t69-t67)+(1-a)(t70-t66)
28 β(C-O) (α35- α36)/√2 50 τC-C(brd) (t71+t72+t73+t74)/√4
29 β(C12-C3) (α37- α38)/√2 51 τC-O (t75+t76)/√2
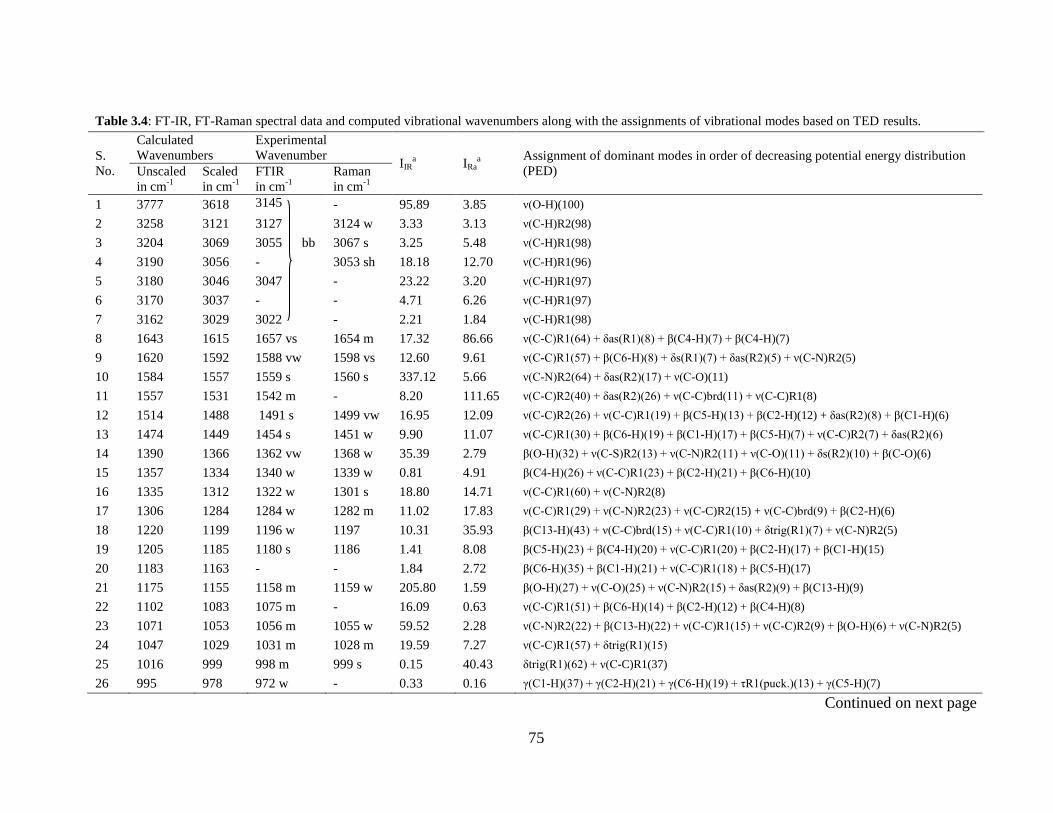
75
Table 3.4: FT-IR, FT-Raman spectral data and computed vibrational wavenumbers along with the assignments of vibrational modes based on TED results.
S.
No.
Calculated
Wavenumbers
Experimental
Wavenumber IIR
a IRa
a
Assignment of dominant modes in order of decreasing potential energy distribution
(PED) Unscaled
in cm-1
Scaled
in cm-1
FTIR
in cm-1
Raman
in cm-1
1 3777 3618 3145 - 95.89 3.85 ν(O-H)(100)
2 3258 3121 3127 3124 w 3.33 3.13 ν(C-H)R2(98)
3 3204 3069 3055 bb 3067 s 3.25 5.48 ν(C-H)R1(98)
4 3190 3056 - 3053 sh 18.18 12.70 ν(C-H)R1(96)
5 3180 3046 3047 - 23.22 3.20 ν(C-H)R1(97)
6 3170 3037 - - 4.71 6.26 ν(C-H)R1(97)
7 3162 3029 3022 - 2.21 1.84 ν(C-H)R1(98)
8 1643 1615 1657 vs 1654 m 17.32 86.66 ν(C-C)R1(64) + δas(R1)(8) + β(C4-H)(7) + β(C4-H)(7)
9 1620 1592 1588 vw 1598 vs 12.60 9.61 ν(C-C)R1(57) + β(C6-H)(8) + δs(R1)(7) + δas(R2)(5) + ν(C-N)R2(5)
10 1584 1557 1559 s 1560 s 337.12 5.66 ν(C-N)R2(64) + δas(R2)(17) + ν(C-O)(11)
11 1557 1531 1542 m - 8.20 111.65 ν(C-C)R2(40) + δas(R2)(26) + ν(C-C)brd(11) + ν(C-C)R1(8)
12 1514 1488 1491 s 1499 vw 16.95 12.09 ν(C-C)R2(26) + ν(C-C)R1(19) + β(C5-H)(13) + β(C2-H)(12) + δas(R2)(8) + β(C1-H)(6)
13 1474 1449 1454 s 1451 w 9.90 11.07 ν(C-C)R1(30) + β(C6-H)(19) + β(C1-H)(17) + β(C5-H)(7) + ν(C-C)R2(7) + δas(R2)(6)
14 1390 1366 1362 vw 1368 w 35.39 2.79 β(O-H)(32) + ν(C-S)R2(13) + ν(C-N)R2(11) + ν(C-O)(11) + δs(R2)(10) + β(C-O)(6)
15 1357 1334 1340 w 1339 w 0.81 4.91 β(C4-H)(26) + ν(C-C)R1(23) + β(C2-H)(21) + β(C6-H)(10)
16 1335 1312 1322 w 1301 s 18.80 14.71 ν(C-C)R1(60) + ν(C-N)R2(8)
17 1306 1284 1284 w 1282 m 11.02 17.83 ν(C-C)R1(29) + ν(C-N)R2(23) + ν(C-C)R2(15) + ν(C-C)brd(9) + β(C2-H)(6)
18 1220 1199 1196 w 1197 10.31 35.93 β(C13-H)(43) + ν(C-C)brd(15) + ν(C-C)R1(10) + δtrig(R1)(7) + ν(C-N)R2(5)
19 1205 1185 1180 s 1186 1.41 8.08 β(C5-H)(23) + β(C4-H)(20) + ν(C-C)R1(20) + β(C2-H)(17) + β(C1-H)(15)
20 1183 1163 - - 1.84 2.72 β(C6-H)(35) + β(C1-H)(21) + ν(C-C)R1(18) + β(C5-H)(17)
21 1175 1155 1158 m 1159 w 205.80 1.59 β(O-H)(27) + ν(C-O)(25) + ν(C-N)R2(15) + δas(R2)(9) + β(C13-H)(9)
22 1102 1083 1075 m - 16.09 0.63 ν(C-C)R1(51) + β(C6-H)(14) + β(C2-H)(12) + β(C4-H)(8)
23 1071 1053 1056 m 1055 w 59.52 2.28 ν(C-N)R2(22) + β(C13-H)(22) + ν(C-C)R1(15) + ν(C-C)R2(9) + β(O-H)(6) + ν(C-N)R2(5)
24 1047 1029 1031 m 1028 m 19.59 7.27 ν(C-C)R1(57) + δtrig(R1)(15)
25 1016 999 998 m 999 s 0.15 40.43 δtrig(R1)(62) + ν(C-C)R1(37)
26 995 978 972 w - 0.33 0.16 γ(C1-H)(37) + γ(C2-H)(21) + γ(C6-H)(19) + τR1(puck.)(13) + γ(C5-H)(7)
Continued on next page
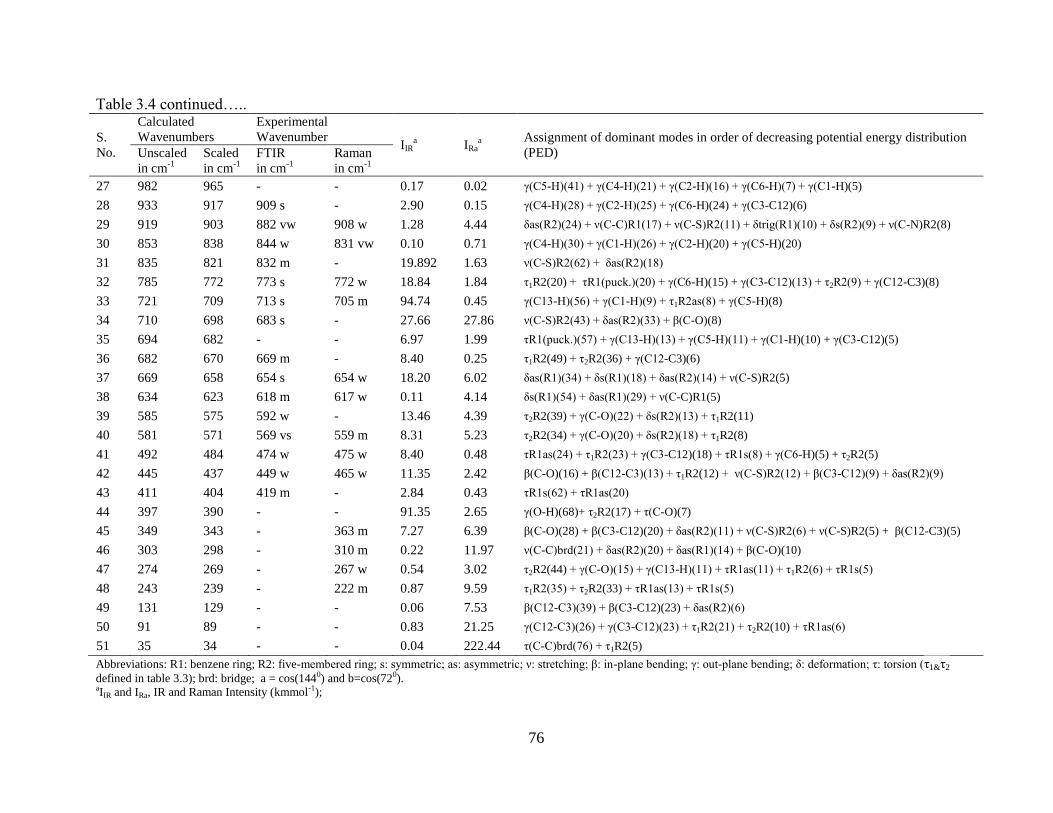
76
Table 3.4 continued…..
S.
No.
Calculated
Wavenumbers
Experimental
Wavenumber IIR
a IRa
a
Assignment of dominant modes in order of decreasing potential energy distribution
(PED) Unscaled
in cm-1
Scaled
in cm-1
FTIR
in cm-1
Raman
in cm-1
27 982 965 - - 0.17 0.02 γ(C5-H)(41) + γ(C4-H)(21) + γ(C2-H)(16) + γ(C6-H)(7) + γ(C1-H)(5)
28 933 917 909 s - 2.90 0.15 γ(C4-H)(28) + γ(C2-H)(25) + γ(C6-H)(24) + γ(C3-C12)(6)
29 919 903 882 vw 908 w 1.28 4.44 δas(R2)(24) + ν(C-C)R1(17) + ν(C-S)R2(11) + δtrig(R1)(10) + δs(R2)(9) + ν(C-N)R2(8)
30 853 838 844 w 831 vw 0.10 0.71 γ(C4-H)(30) + γ(C1-H)(26) + γ(C2-H)(20) + γ(C5-H)(20)
31 835 821 832 m - 19.892 1.63 ν(C-S)R2(62) + δas(R2)(18)
32 785 772 773 s 772 w 18.84 1.84 τ1R2(20) + τR1(puck.)(20) + γ(C6-H)(15) + γ(C3-C12)(13) + τ2R2(9) + γ(C12-C3)(8)
33 721 709 713 s 705 m 94.74 0.45 γ(C13-H)(56) + γ(C1-H)(9) + τ1R2as(8) + γ(C5-H)(8)
34 710 698 683 s - 27.66 27.86 ν(C-S)R2(43) + δas(R2)(33) + β(C-O)(8)
35 694 682 - - 6.97 1.99 τR1(puck.)(57) + γ(C13-H)(13) + γ(C5-H)(11) + γ(C1-H)(10) + γ(C3-C12)(5)
36 682 670 669 m - 8.40 0.25 τ1R2(49) + τ2R2(36) + γ(C12-C3)(6)
37 669 658 654 s 654 w 18.20 6.02 δas(R1)(34) + δs(R1)(18) + δas(R2)(14) + ν(C-S)R2(5)
38 634 623 618 m 617 w 0.11 4.14 δs(R1)(54) + δas(R1)(29) + ν(C-C)R1(5)
39 585 575 592 w - 13.46 4.39 τ2R2(39) + γ(C-O)(22) + δs(R2)(13) + τ1R2(11)
40 581 571 569 vs 559 m 8.31 5.23 τ2R2(34) + γ(C-O)(20) + δs(R2)(18) + τ1R2(8)
41 492 484 474 w 475 w 8.40 0.48 τR1as(24) + τ1R2(23) + γ(C3-C12)(18) + τR1s(8) + γ(C6-H)(5) + τ2R2(5)
42 445 437 449 w 465 w 11.35 2.42 β(C-O)(16) + β(C12-C3)(13) + τ1R2(12) + ν(C-S)R2(12) + β(C3-C12)(9) + δas(R2)(9)
43 411 404 419 m - 2.84 0.43 τR1s(62) + τR1as(20)
44 397 390 - - 91.35 2.65 γ(O-H)(68)+ τ2R2(17) + τ(C-O)(7)
45 349 343 - 363 m 7.27 6.39 β(C-O)(28) + β(C3-C12)(20) + δas(R2)(11) + ν(C-S)R2(6) + ν(C-S)R2(5) + β(C12-C3)(5)
46 303 298 - 310 m 0.22 11.97 ν(C-C)brd(21) + δas(R2)(20) + δas(R1)(14) + β(C-O)(10)
47 274 269 - 267 w 0.54 3.02 τ2R2(44) + γ(C-O)(15) + γ(C13-H)(11) + τR1as(11) + τ1R2(6) + τR1s(5)
48 243 239 - 222 m 0.87 9.59 τ1R2(35) + τ2R2(33) + τR1as(13) + τR1s(5)
49 131 129 - - 0.06 7.53 β(C12-C3)(39) + β(C3-C12)(23) + δas(R2)(6)
50 91 89 - - 0.83 21.25 γ(C12-C3)(26) + γ(C3-C12)(23) + τ1R2(21) + τ2R2(10) + τR1as(6)
51 35 34 - - 0.04 222.44 τ(C-C)brd(76) + τ1R2(5)
Abbreviations: R1: benzene ring; R2: five-membered ring; s: symmetric; as: asymmetric; ν: stretching; β: in-plane bending; γ: out-plane bending; δ: deformation; τ: torsion (τ1&τ2
defined in table 3.3); brd: bridge; a = cos(1440) and b=cos(720). aIIR and IRa, IR and Raman Intensity (kmmol-1);

77
Fig. 3.3: Experimental (FT-IR and FT-Raman) vibrational spectra of 4P3HT.
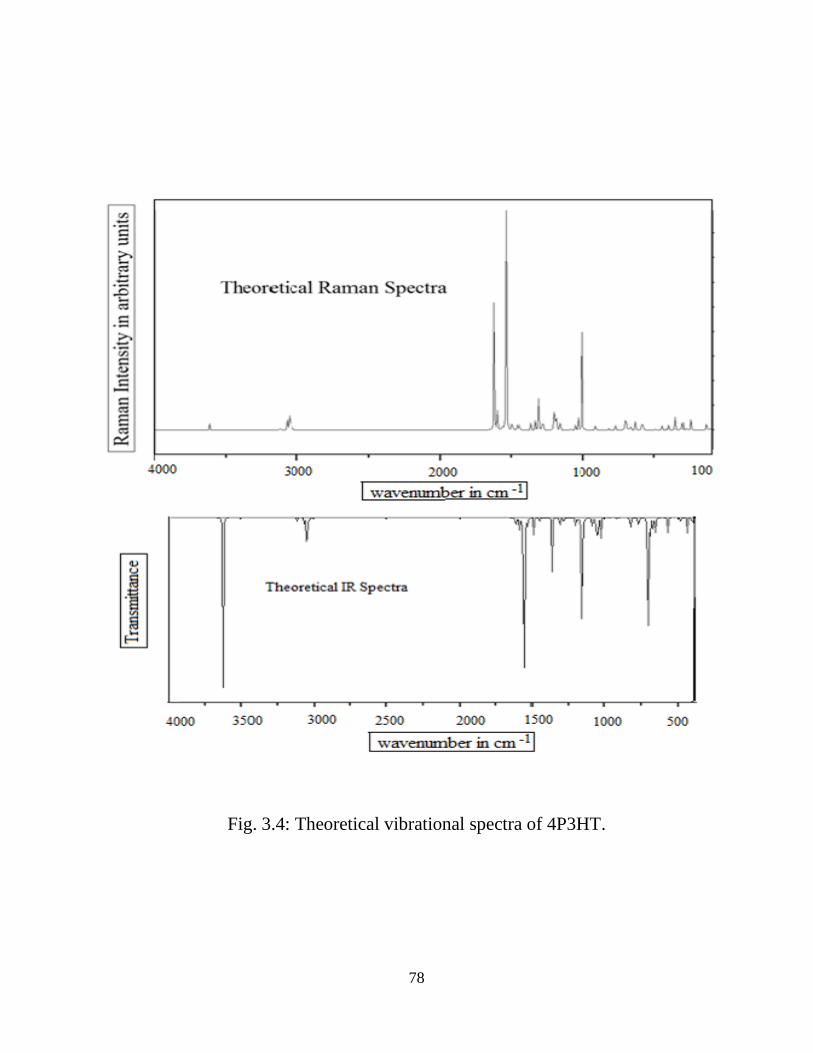
78
Fig. 3.4: Theoretical vibrational spectra of 4P3HT.
79
thiazole ring is the C-N stretching vibration. Identification of C-N vibrations is a very
difficult task because of the mixing of several bands in this region. Silverstein et. al.
[31] assigned C=N and C-N stretching vibrations in the range 1382–1266 cm−1
and
1250–1020 cm−1
respectively. However, molecular simulation program (Gauss View
5.0) and normal mode analysis of the molecule 4P3HT helped us to define the C-N
vibrations correctly. A very strong band observed at 1559 and 1560 cm-1
in FT-IR
and FT-Raman spectra respectively has been assigned to C=N stretching vibration
(64% P.E.D.). The mode calculated at 1284 cm-1
is the C-N stretching mode (23%
P.E.D.) which is in good agreement with experimental value. It is a mixed mode
having contribution from C-C stretch and C-H bending vibrations. The C=C-N in-
plane bending vibration is calculated as a mixed mode at 698 cm-1
.
3.3.2.2 Phenyl Ring vibrations
The phenyl ring spectral region predominantly involves the C-H, C-C and C=C
stretching, and C-C-C as well as H-C-C bending vibrations. The ring stretching
vibrations are very prominent, in the vibrational spectra of benzene and its
derivatives. Usually the carbon hydrogen stretching vibrations give rise to bands in
the region of 3100–3000 cm-1
in all aromatic compounds [32,33]. In the present study,
the bands in the region 3121–3029 cm-1
have been assigned to the ring C-H stretching
vibrations with more than 90% potential energy contribution. The C-H in-plane and
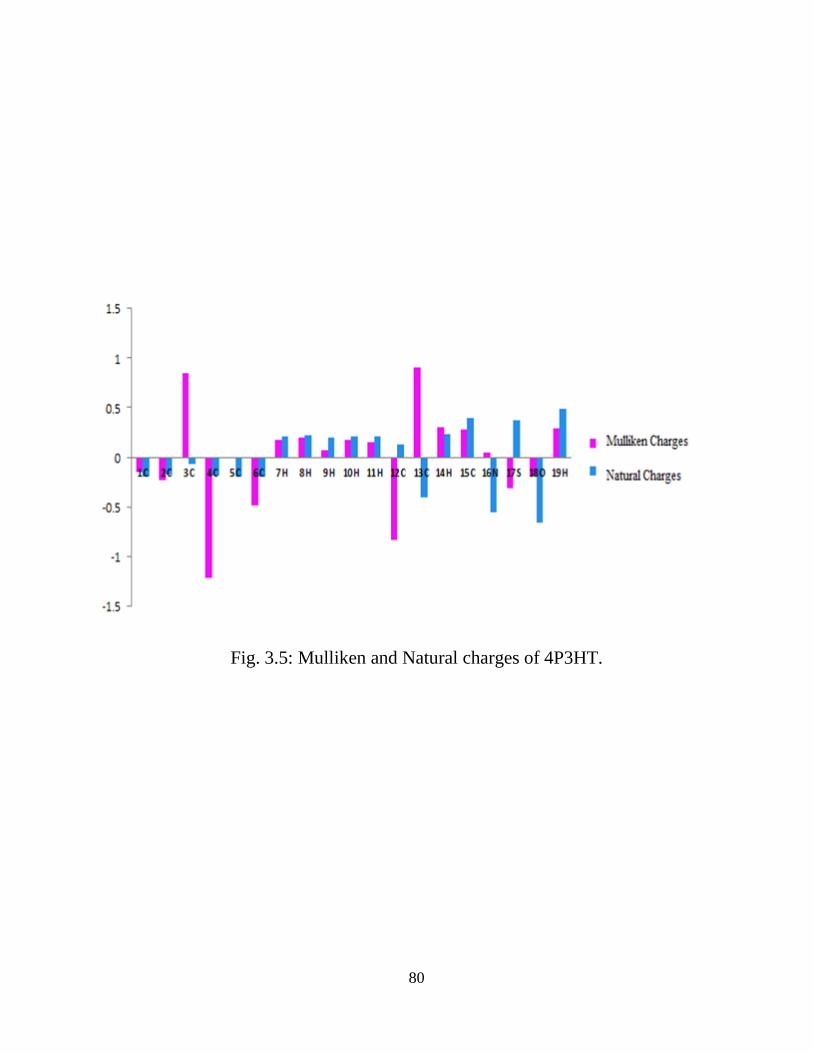
80
Fig. 3.5: Mulliken and Natural charges of 4P3HT.

81
out-of-plane bending vibrations generally lies in the range 1300–1000 cm-1
and 1000–
675 cm-1
[34-37], respectively. In this work, vibrations involving C-H in plane
bending are found in the region 1488–1053cm-1
. The computed wavenumbers at 999
cm-1
is identified as the trigonal ring bending mode and is in complete agreement with
FT-IR/FT-Raman peak at 998/999cm-1
. The wavenumber calculated at 682 cm-1
is
assigned to the ring puckering mode. A good agreement between the calculated and
experimentally observed wavenumbers has allowed us to establish a detailed and
precise assignment of normal mode wavenumbers in the entire spectral region.
3.3.2.3 O-H vibrations
A free hydroxyl group or a non-hydrogen bonded hydroxyl group absorbs in the
range 3700–3500 cm-1
. In hydrogen bonded structure, the O-H stretching results in a
broad band in the region 3300–2500 cm-1
[38]. In the FT-IR spectra of 4P3HT, there
is a broad band in the region 3300–2600 cm-1
containing the wavenumbers due to the
motion of O-H stretching and phenyl ring stretching vibrations. The scaled
wavenumber calculated at 3618 cm-1
in case of 4P3HT are identified as O-H
stretching with 100% contribution to P.E.D. The O-H group vibrations being the most
sensitive to the environment show marked shifts in the spectra of the hydrogen
bonded species. Several bands between 2400 and 2300 cm-1
found in the FT-IR
spectrum of 4P3HT are also characteristic of the hydrogen bonds. Present
calculations showed that there was a marked wavenumber downshift of O-H
82
stretching vibration which must be due to the presence of intermolecular interaction.
The bands identified at 1368 and 1159 cm-1
in the Raman spectrum are assigned to in-
plane O-H bending vibrations while the out-of-plane bending vibration is calculated
at 390 cm-1
. The characteristics band due to out-of-plane bending observed in the
range 450-350 cm-1
indicates the presence of hydrogen bonding [39]. Although the
crystal structure of 4P3HT is not available but above discussion asserts the existence
of hydrogen bonding in 4P3HT.
3.3.3 Electric moments
The B3LYP results of electronic dipole moment (μ), polarizability (α) and first order
hyperpolarizability (β) are listed in Table 3.5. The polarizability and first
hyperpolarizability calculated for 4P3HT is based on the finite-field approach. In
presence of an applied electric field, the energy of a system is a function of the
electric field. The first hyperpolarizability is a third rank tensor that can be described
by a 3×3×3 matrix. The 27 components of the matrix can be reduced to 10
components due to the Kleinman symmetry [40]. The components of β are defined as
the coefficients in the Taylor series expansion of the energy in the external electric
field. When the electric field is weak and homogeneous, this expansion becomes
E = E0– μiFi− 1/2 αijFiFj− 1/6 βijkFiFjFk+ . . .
where E0 is the energy of the unperturbed molecules, Fi is the field at the origin μi, αij
and βijk are the components of dipole moment, polarizability, and the first
83
hyperpolarizability, respectively. The total electric dipole moment (μ), the mean
polarizability <α>, and the total first order hyperpolarizability (βtotal), have been
calculated using the x, y, and z components of these electric moments. The calculated
value of mean polarizability and first hyperpolarizability are 137.105 a.u. or
20.3189×10⁻²⁴
e.s.u. and βtotal = 2.7871×10⁻³⁰
e.s.u. respectively. Urea is one of the
prototypical molecules used in the study of the NLO properties of molecular systems.
Therefore it is used frequently as a threshold value for comparative purposes. The
calculated value of β for the title compound is relatively fourteen times higher than
that of Urea and thus the 4P3HT molecule possesses considerable non-linear optical
properties. Theoretically calculated value of dipole moment is 0.5296 Debye.
Electric moments of keto form (4-Phenyl-3H-1,3-thiazol-2-one) at DFT/B3LYP/6-
311++G(d,p) have also been calculated. Theoretically calculated values of mean
polarizability of both keto and enol forms are found to be nearly same but the dipole
moment (5.0203 Debye) and first static hyperpolarizability (βtotal= 9.1802×10⁻³⁰
e.s.u.)
of keto form are appreciably higher than enolic form.
3.3.4 Electronic properties and UV-spectral analysis
The Frontier orbitals, highest occupied molecular orbital (HOMO) and lowest
unoccupied molecular orbital (LUMO) are important factors in quantum chemistry
[41] as these determine the way the molecule interacts with other species.
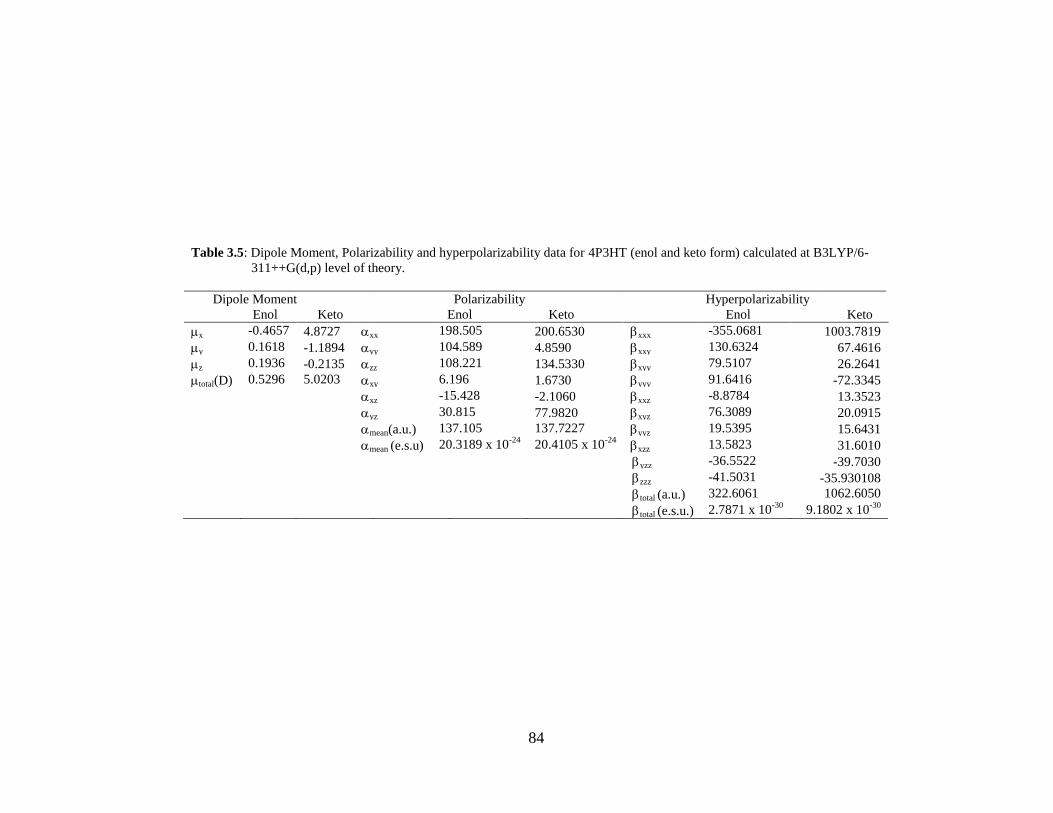
84
Table 3.5: Dipole Moment, Polarizability and hyperpolarizability data for 4P3HT (enol and keto form) calculated at B3LYP/6-
311++G(d,p) level of theory.
Dipole Moment Polarizability Hyperpolarizability
Enol Keto Enol Keto Enol Keto
x -0.4657 4.8727 xx 198.505 200.6530 xxx -355.0681 1003.7819
y 0.1618 -1.1894 yy 104.589 4.8590 xxy 130.6324 67.4616
z 0.1936 -0.2135 zz 108.221 134.5330 xyy 79.5107 26.2641
total(D) 0.5296 5.0203 xy 6.196 1.6730 yyy 91.6416 -72.3345
xz -15.428 -2.1060 xxz -8.8784 13.3523
yz 30.815 77.9820 xyz 76.3089 20.0915
mean(a.u.) 137.105 137.7227 yyz 19.5395 15.6431
mean (e.s.u) 20.3189 x 10⁻²⁴
20.4105 x 10⁻²⁴
xzz 13.5823 31.6010
yzz -36.5522 -39.7030
zzz -41.5031 -35.930108
total (a.u.) 322.6061 1062.6050
total (e.s.u.) 2.7871 x 10⁻³⁰
9.1802 x 10⁻³⁰
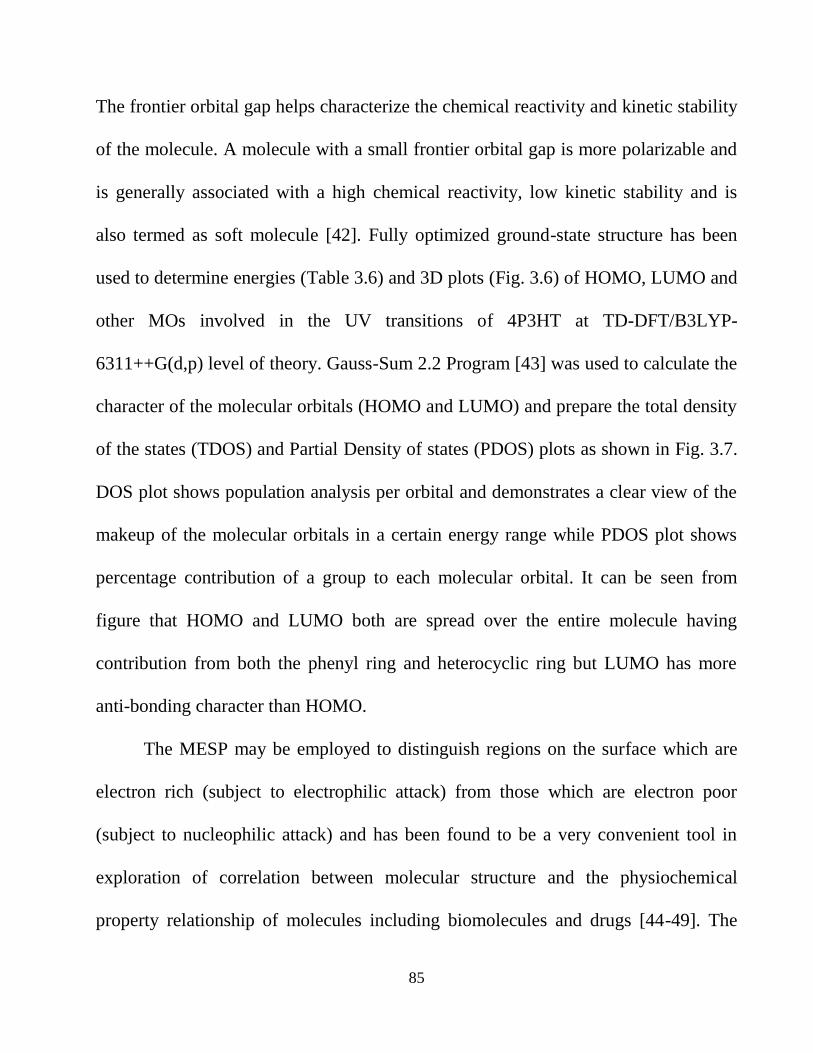
85
The frontier orbital gap helps characterize the chemical reactivity and kinetic stability
of the molecule. A molecule with a small frontier orbital gap is more polarizable and
is generally associated with a high chemical reactivity, low kinetic stability and is
also termed as soft molecule [42]. Fully optimized ground-state structure has been
used to determine energies (Table 3.6) and 3D plots (Fig. 3.6) of HOMO, LUMO and
other MOs involved in the UV transitions of 4P3HT at TD-DFT/B3LYP-
6311++G(d,p) level of theory. Gauss-Sum 2.2 Program [43] was used to calculate the
character of the molecular orbitals (HOMO and LUMO) and prepare the total density
of the states (TDOS) and Partial Density of states (PDOS) plots as shown in Fig. 3.7.
DOS plot shows population analysis per orbital and demonstrates a clear view of the
makeup of the molecular orbitals in a certain energy range while PDOS plot shows
percentage contribution of a group to each molecular orbital. It can be seen from
figure that HOMO and LUMO both are spread over the entire molecule having
contribution from both the phenyl ring and heterocyclic ring but LUMO has more
anti-bonding character than HOMO.
The MESP may be employed to distinguish regions on the surface which are
electron rich (subject to electrophilic attack) from those which are electron poor
(subject to nucleophilic attack) and has been found to be a very convenient tool in
exploration of correlation between molecular structure and the physiochemical
property relationship of molecules including biomolecules and drugs [44-49]. The
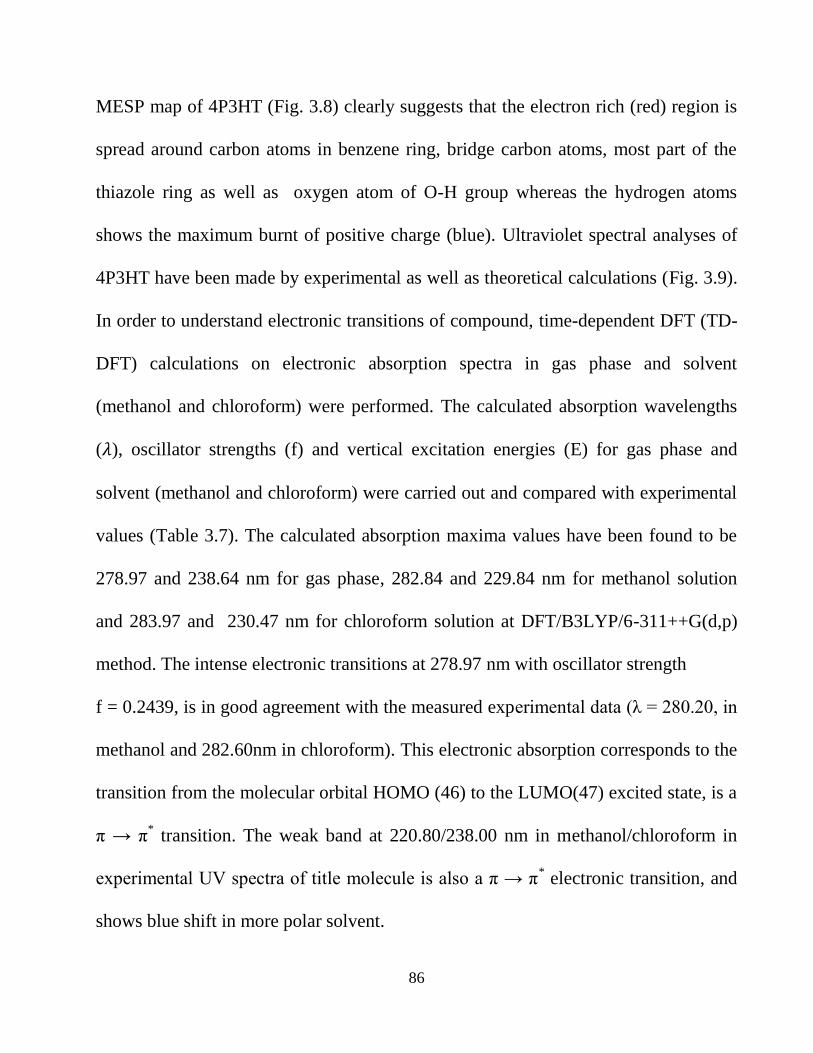
86
MESP map of 4P3HT (Fig. 3.8) clearly suggests that the electron rich (red) region is
spread around carbon atoms in benzene ring, bridge carbon atoms, most part of the
thiazole ring as well as oxygen atom of O-H group whereas the hydrogen atoms
shows the maximum burnt of positive charge (blue). Ultraviolet spectral analyses of
4P3HT have been made by experimental as well as theoretical calculations (Fig. 3.9).
In order to understand electronic transitions of compound, time-dependent DFT (TD-
DFT) calculations on electronic absorption spectra in gas phase and solvent
(methanol and chloroform) were performed. The calculated absorption wavelengths
( ), oscillator strengths (f) and vertical excitation energies (E) for gas phase and
solvent (methanol and chloroform) were carried out and compared with experimental
values (Table 3.7). The calculated absorption maxima values have been found to be
278.97 and 238.64 nm for gas phase, 282.84 and 229.84 nm for methanol solution
and 283.97 and 230.47 nm for chloroform solution at DFT/B3LYP/6-311++G(d,p)
method. The intense electronic transitions at 278.97 nm with oscillator strength
f = 0.2439, is in good agreement with the measured experimental data (λ = 280.20, in
methanol and 282.60nm in chloroform). This electronic absorption corresponds to the
transition from the molecular orbital HOMO (46) to the LUMO(47) excited state, is a
π → π* transition. The weak band at 220.80/238.00 nm in methanol/chloroform in
experimental UV spectra of title molecule is also a π → π* electronic transition, and
shows blue shift in more polar solvent.
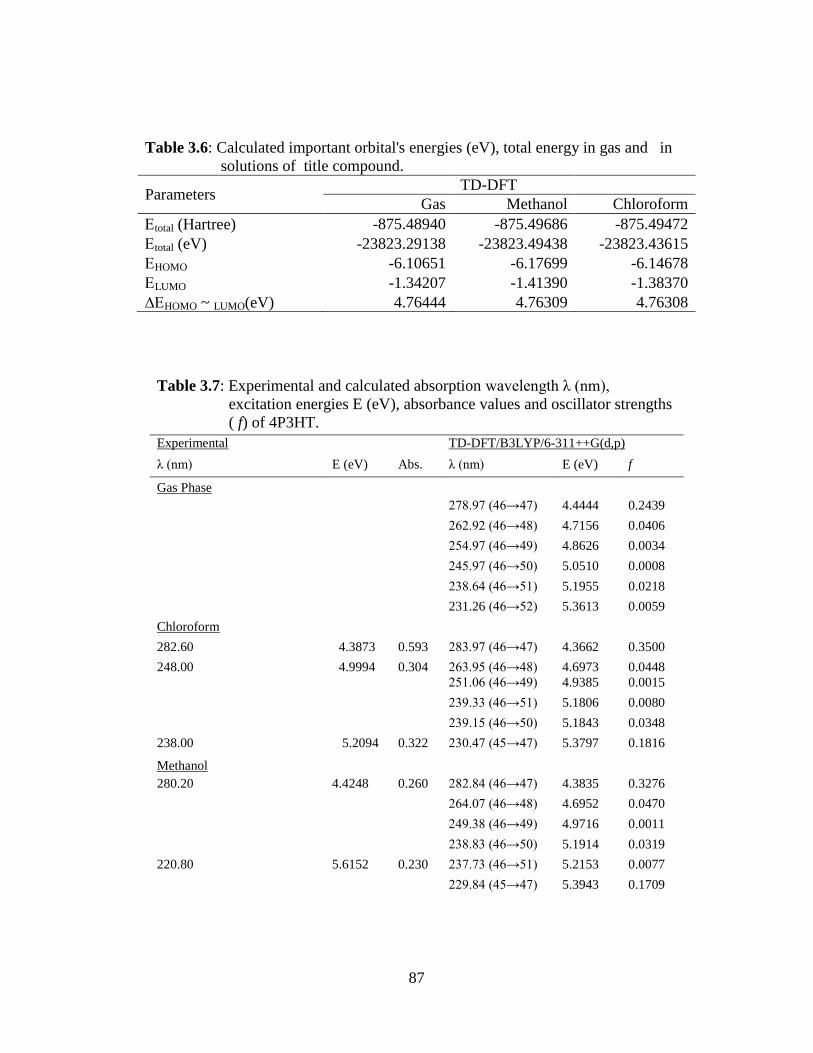
87
Table 3.6: Calculated important orbital's energies (eV), total energy in gas and in
solutions of title compound.
Parameters TD-DFT
Gas Methanol Chloroform
total(Hartree) -875.48940 -875.49686 -875.49472
total(eV) -23823.29138 -23823.49438 -23823.43615
HOMO -6.10651 -6.17699 -6.14678
LUMO -1.34207 -1.41390 -1.38370
HOMO ~ LUMO(eV) 4.76444 4.76309 4.76308
Table 3.7: Experimental and calculated absorption wavelength λ (nm),
excitation energies E (eV), absorbance values and oscillator strengths
( f) of 4P3HT.
Experimental TD-DFT/B3LYP/6-311++G(d,p)
λ (nm) E (eV) Abs. λ (nm) E (eV) f
Gas Phase
278.97 (46→47) 4.4444 0.2439
262.92 (46→48) 4.7156 0.0406
254.97 (46→49) 4.8626 0.0034
245.97 (46→50) 5.0510 0.0008
238.64 (46→51) 5.1955 0.0218
231.26 (46→52) 5.3613 0.0059
Chloroform
282.60 4.3873 0.593 283.97 (46→47) 4.3662 0.3500
248.00 4.9994 0.304 263.95 (46→48) 4.6973 0.0448
251.06 (46→49) 4.9385 0.0015
239.33 (46→51) 5.1806 0.0080
239.15 (46→50) 5.1843 0.0348
238.00 5.2094 0.322 230.47 (45→47) 5.3797 0.1816
Methanol
280.20 4.4248 0.260 282.84 (46→47) 4.3835 0.3276
264.07 (46→48) 4.6952 0.0470
249.38 (46→49) 4.9716 0.0011
238.83 (46→50) 5.1914 0.0319
220.80 5.6152 0.230 237.73 (46→51) 5.2153 0.0077
229.84 (45→47) 5.3943 0.1709
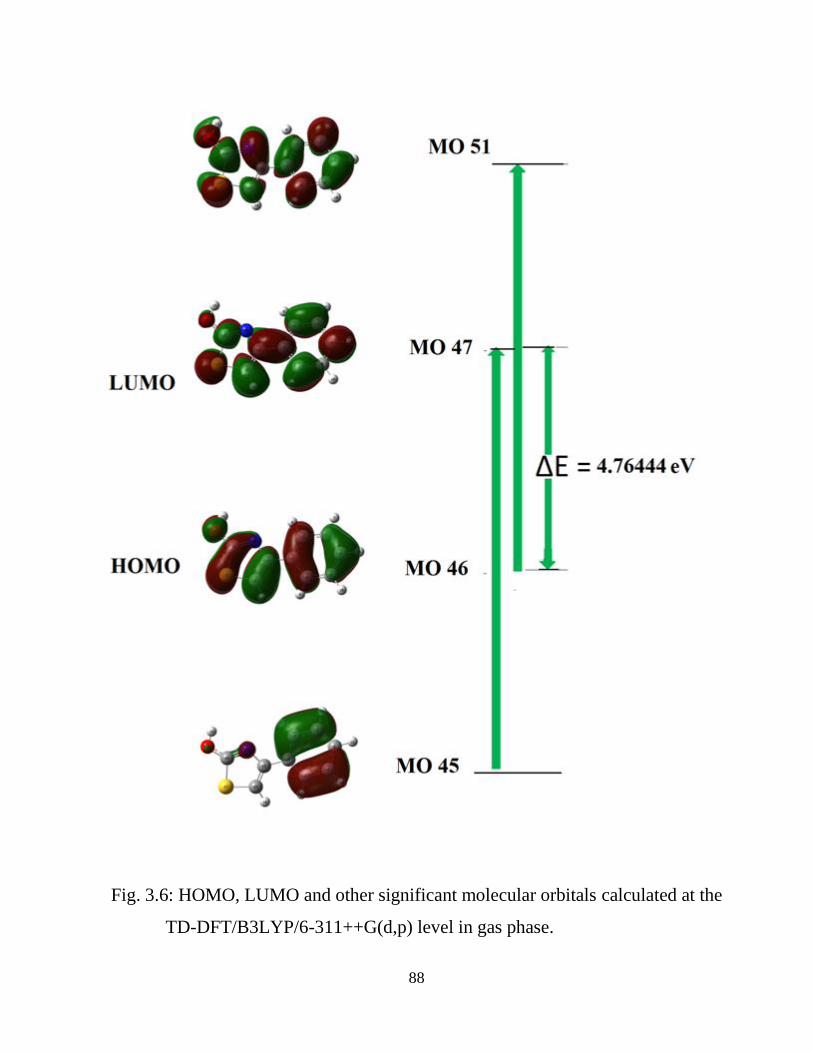
88
Fig. 3.6: HOMO, LUMO and other significant molecular orbitals calculated at the
TD-DFT/B3LYP/6-311++G(d,p) level in gas phase.
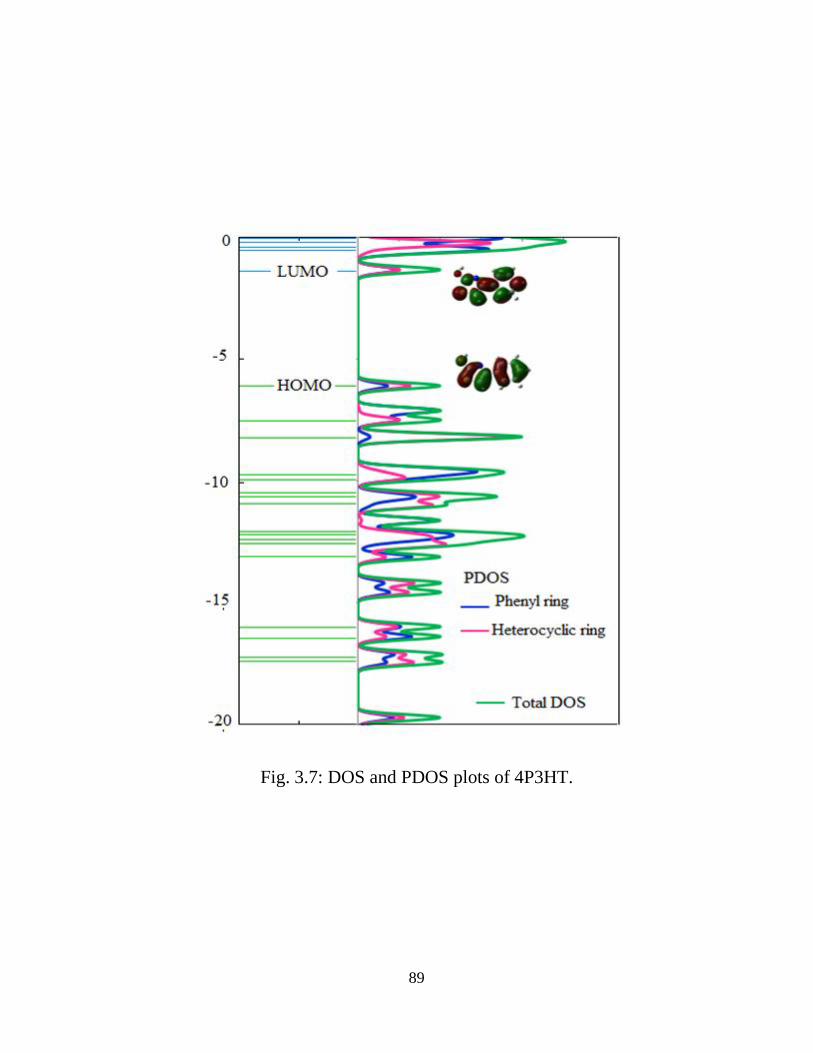
89
Fig. 3.7: DOS and PDOS plots of 4P3HT.
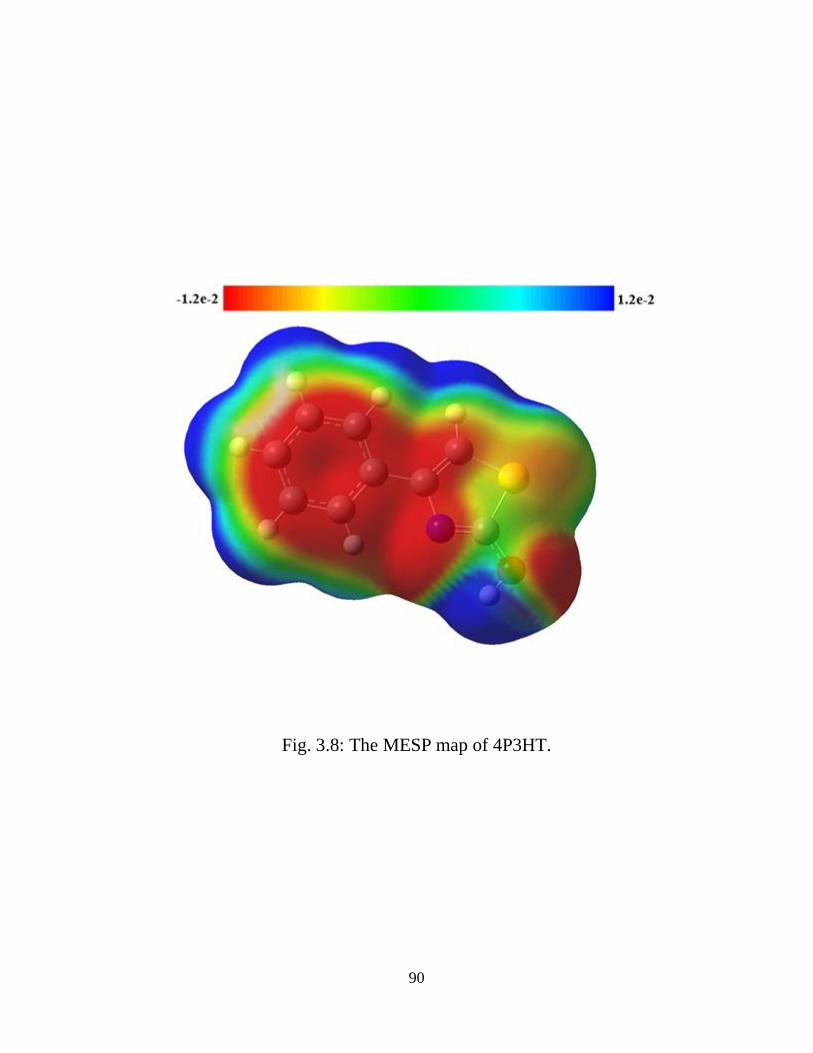
90
Fig. 3.8: The MESP map of 4P3HT.
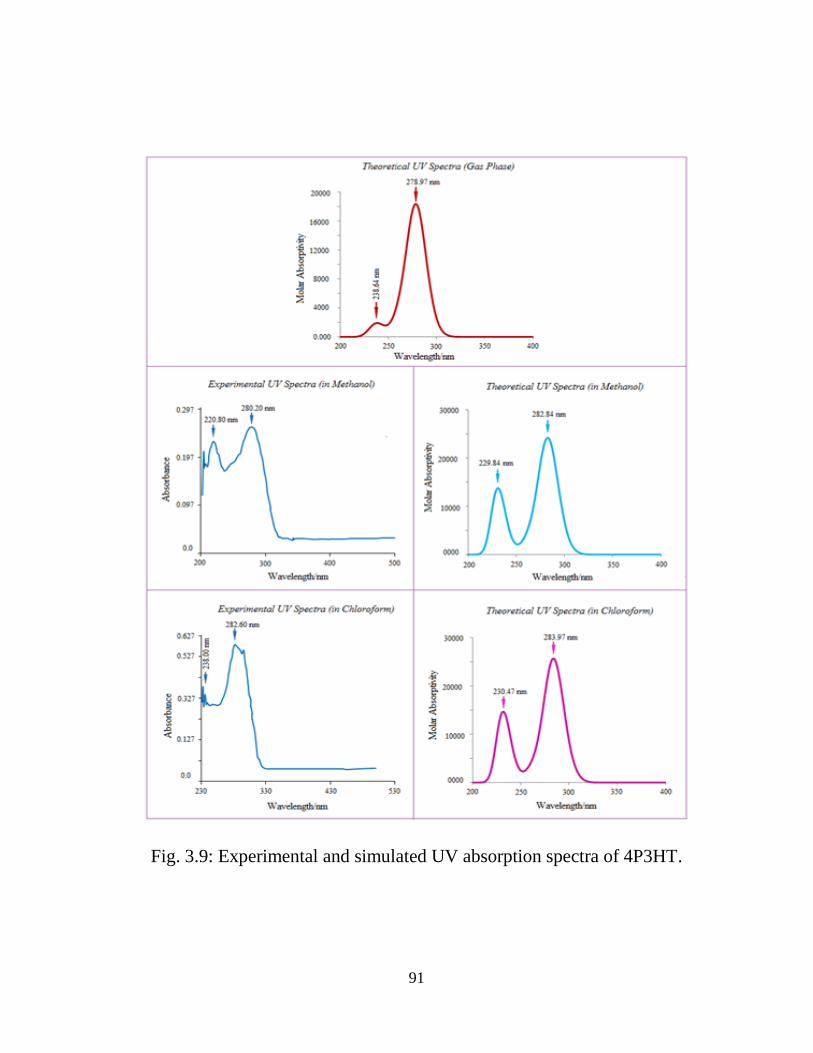
91
Fig. 3.9: Experimental and simulated UV absorption spectra of 4P3HT.
92
3.3.5 NBO analysis
The calculation pertaining to delocalization of the electron density between occupied
Lewis type (bond (or) lone pair) NBO orbitals and formally unoccupied (anti-bond
(or) Rydberg) non-Lewis NBO orbitals corresponding to a stabilizing donor–acceptor
interactions, have been performed at B3LYP/6-311++G(d,p) basis set. The energy of
these interactions can be estimated by the second order perturbation theory [50].
Table 3.8 lists the calculated second-order interaction energies (E(2)
) between the
donor-acceptor orbitals in 4P3HT. The larger E(2)
(energy of hyper-conjugative
interaction) value, the more intensive is the interaction between electron donors and
acceptors i.e., the more donation tendency from electron donors to electron acceptors
and the greater the extent of conjugation of the whole system. The intra-molecular
interaction formed by the orbital overlap between bonding (C-C) and (C-C) anti-
bonding orbital results in intra-molecular charge transfer (ICT) causing stabilization
of the system. These interactions are observed as increase in electron density (ED) in
C-C anti-bonding orbital that weakens the respective bonds. Table 3.8 clearly shows
that the strong intra-molecular hyper conjugative interaction of π electrons of (C1-
C6) with π*(C2-C3) and π*(C4-C5), of π (C2-C3) with π*(C1-C6) and π*(C4-C5)
and of π(C4-C5) with π*(C1-C6) and π*(C2-C3) of the ring. On the other hand, the
π(C2-C3) of phenyl ring conjugate to the anti-bonding π orbital (C12-C13) of
thiazole ring and π(C15-N16) to the π*(C12- C13) with energies 18.73 kcal/mol and

93
18.26 kcal/mol respectively, resulting in strong delocalization. A pair of interactions
in the title molecule involving the lone pairs LP S17(2) and LP O18(2),with that of
anti-bonding π (C15-N16) results in the stabilization of 29.46 kcal/mol and 35.90
kcal/mol, respectively. Several other types of valuable data, such as directionality,
hybridization, and partial charges, have been analysed from the NBO results.
The direction of the line of centers between the two nuclei is compared with
the hybrid direction to determine the bending of the bond, expressed as the deviation
angle (Dev.) between these two directions. The hybrid directionality and bond
bending analysis of natural hybrid orbitals (NHOs) offer indications of the substituent
effect and steric effect. It is evident from Table 3.9 that the C12 and C13 NHOs of σ
(C12-C13) are away from the line of centers by ~ 3°. In σ(C12-N16) and σ(C15-
N16), N16 NHOs show deviation of 4.9° and 3.9° with C12 and C15, the sulphur
(S17) NHOs in σ (C13-S17) and σ (C15-S17) show very large deviations of 9.7° and
9.5° with line of nuclear centres whereas C13 and C15 show deviation of 2.8° and
2.7° respectively. These deviations provide a strong charge transfer path within the
molecule.
3.3.6 Quantitative structure activity relationship (QSAR)
properties: Keto and enol form
QSAR [51] is the quantitative association of the biological activity to the structure of
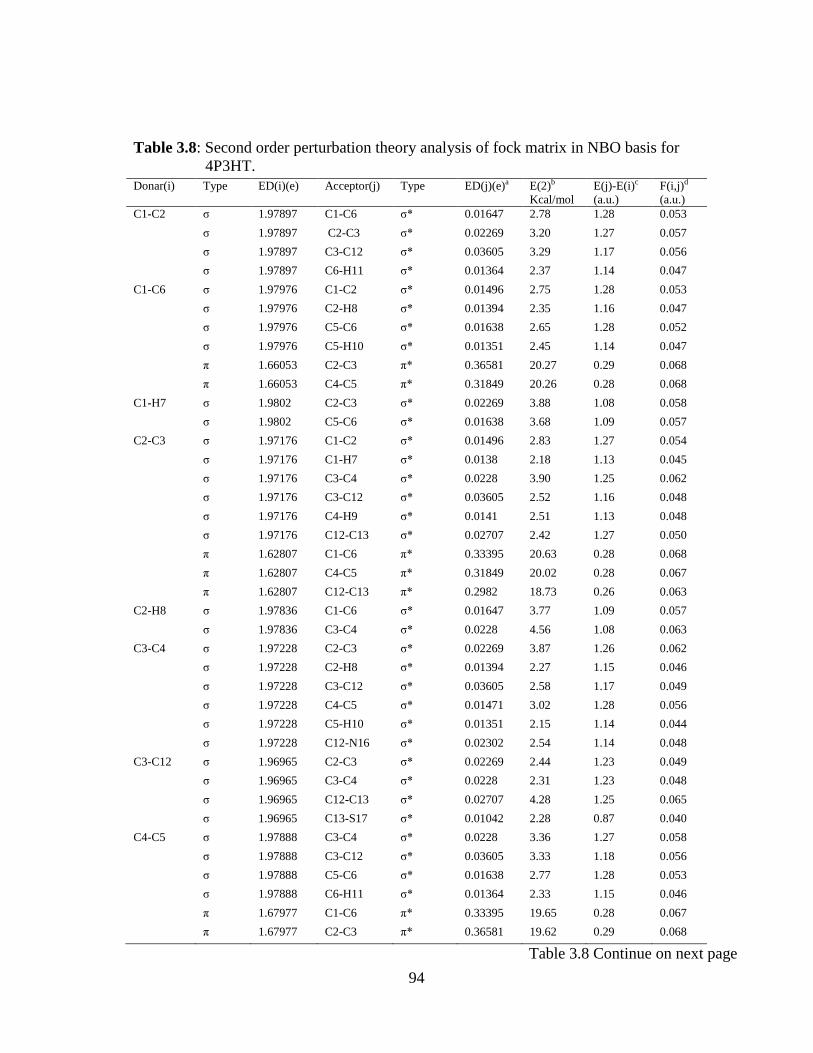
94
Table 3.8: Second order perturbation theory analysis of fock matrix in NBO basis for
4P3HT.
Donar(i) Type ED(i)(e) Acceptor(j) Type ED(j)(e)a E(2)b
Kcal/mol
E(j)-E(i)c
(a.u.)
F(i,j)d
(a.u.)
C1-C2 σ 1.97897 C1-C6 σ* 0.01647 2.78 1.28 0.053
σ 1.97897 C2-C3 σ* 0.02269 3.20 1.27 0.057
σ 1.97897 C3-C12 σ* 0.03605 3.29 1.17 0.056
σ 1.97897 C6-H11 σ* 0.01364 2.37 1.14 0.047
C1-C6 σ 1.97976 C1-C2 σ* 0.01496 2.75 1.28 0.053
σ 1.97976 C2-H8 σ* 0.01394 2.35 1.16 0.047
σ 1.97976 C5-C6 σ* 0.01638 2.65 1.28 0.052
σ 1.97976 C5-H10 σ* 0.01351 2.45 1.14 0.047
π 1.66053 C2-C3 π* 0.36581 20.27 0.29 0.068
π 1.66053 C4-C5 π* 0.31849 20.26 0.28 0.068
C1-H7 σ 1.9802 C2-C3 σ* 0.02269 3.88 1.08 0.058
σ 1.9802 C5-C6 σ* 0.01638 3.68 1.09 0.057
C2-C3 σ 1.97176 C1-C2 σ* 0.01496 2.83 1.27 0.054
σ 1.97176 C1-H7 σ* 0.0138 2.18 1.13 0.045
σ 1.97176 C3-C4 σ* 0.0228 3.90 1.25 0.062
σ 1.97176 C3-C12 σ* 0.03605 2.52 1.16 0.048
σ 1.97176 C4-H9 σ* 0.0141 2.51 1.13 0.048
σ 1.97176 C12-C13 σ* 0.02707 2.42 1.27 0.050
π 1.62807 C1-C6 π* 0.33395 20.63 0.28 0.068
π 1.62807 C4-C5 π* 0.31849 20.02 0.28 0.067
π 1.62807 C12-C13 π* 0.2982 18.73 0.26 0.063
C2-H8 σ 1.97836 C1-C6 σ* 0.01647 3.77 1.09 0.057
σ 1.97836 C3-C4 σ* 0.0228 4.56 1.08 0.063
C3-C4 σ 1.97228 C2-C3 σ* 0.02269 3.87 1.26 0.062
σ 1.97228 C2-H8 σ* 0.01394 2.27 1.15 0.046
σ 1.97228 C3-C12 σ* 0.03605 2.58 1.17 0.049
σ 1.97228 C4-C5 σ* 0.01471 3.02 1.28 0.056
σ 1.97228 C5-H10 σ* 0.01351 2.15 1.14 0.044
σ 1.97228 C12-N16 σ* 0.02302 2.54 1.14 0.048
C3-C12 σ 1.96965 C2-C3 σ* 0.02269 2.44 1.23 0.049
σ 1.96965 C3-C4 σ* 0.0228 2.31 1.23 0.048
σ 1.96965 C12-C13 σ* 0.02707 4.28 1.25 0.065
σ 1.96965 C13-S17 σ* 0.01042 2.28 0.87 0.040
C4-C5 σ 1.97888 C3-C4 σ* 0.0228 3.36 1.27 0.058
σ 1.97888 C3-C12 σ* 0.03605 3.33 1.18 0.056
σ 1.97888 C5-C6 σ* 0.01638 2.77 1.28 0.053
σ 1.97888 C6-H11 σ* 0.01364 2.33 1.15 0.046
π 1.67977 C1-C6 π* 0.33395 19.65 0.28 0.067
π 1.67977 C2-C3 π* 0.36581 19.62 0.29 0.068
Table 3.8 Continue on next page
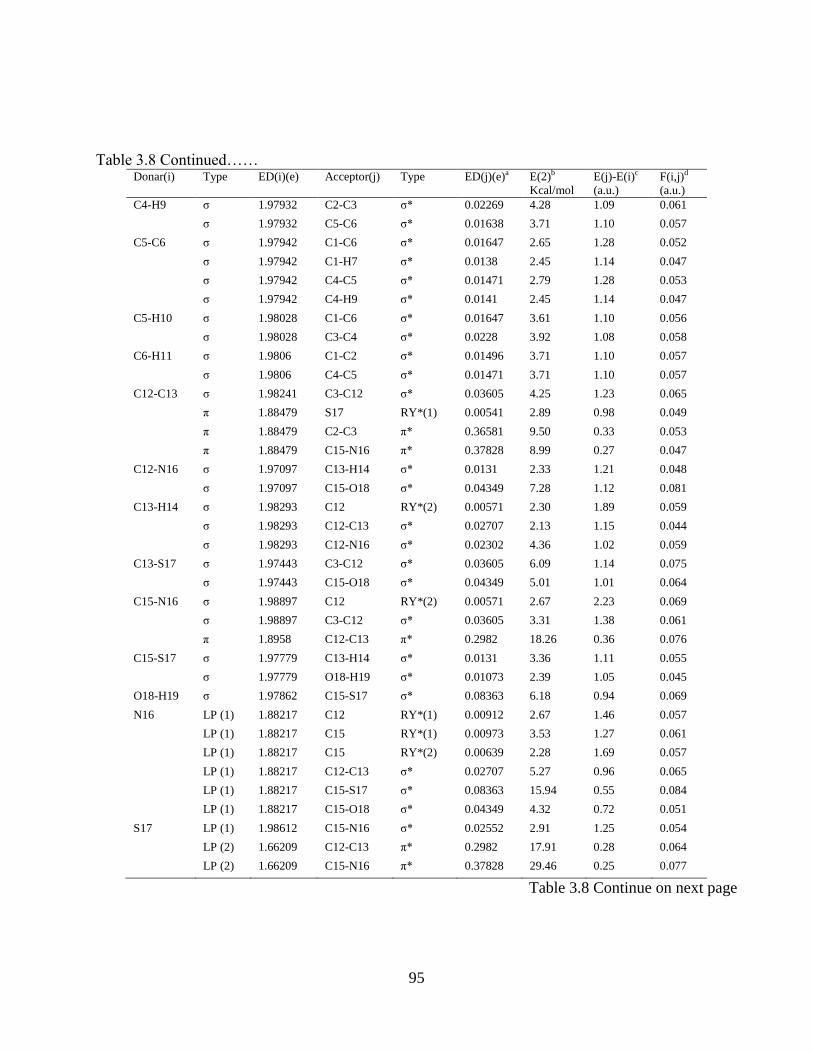
95
Table 3.8 Continued…… Donar(i) Type ED(i)(e) Acceptor(j) Type ED(j)(e)a E(2)b
Kcal/mol
E(j)-E(i)c
(a.u.)
F(i,j)d
(a.u.)
C4-H9 σ 1.97932 C2-C3 σ* 0.02269 4.28 1.09 0.061
σ 1.97932 C5-C6 σ* 0.01638 3.71 1.10 0.057
C5-C6 σ 1.97942 C1-C6 σ* 0.01647 2.65 1.28 0.052
σ 1.97942 C1-H7 σ* 0.0138 2.45 1.14 0.047
σ 1.97942 C4-C5 σ* 0.01471 2.79 1.28 0.053
σ 1.97942 C4-H9 σ* 0.0141 2.45 1.14 0.047
C5-H10 σ 1.98028 C1-C6 σ* 0.01647 3.61 1.10 0.056
σ 1.98028 C3-C4 σ* 0.0228 3.92 1.08 0.058
C6-H11 σ 1.9806 C1-C2 σ* 0.01496 3.71 1.10 0.057
σ 1.9806 C4-C5 σ* 0.01471 3.71 1.10 0.057
C12-C13 σ 1.98241 C3-C12 σ* 0.03605 4.25 1.23 0.065
π 1.88479 S17 RY*(1) 0.00541 2.89 0.98 0.049
π 1.88479 C2-C3 π* 0.36581 9.50 0.33 0.053
π 1.88479 C15-N16 π* 0.37828 8.99 0.27 0.047
C12-N16 σ 1.97097 C13-H14 σ* 0.0131 2.33 1.21 0.048
σ 1.97097 C15-O18 σ* 0.04349 7.28 1.12 0.081
C13-H14 σ 1.98293 C12 RY*(2) 0.00571 2.30 1.89 0.059
σ 1.98293 C12-C13 σ* 0.02707 2.13 1.15 0.044
σ 1.98293 C12-N16 σ* 0.02302 4.36 1.02 0.059
C13-S17 σ 1.97443 C3-C12 σ* 0.03605 6.09 1.14 0.075
σ 1.97443 C15-O18 σ* 0.04349 5.01 1.01 0.064
C15-N16 σ 1.98897 C12 RY*(2) 0.00571 2.67 2.23 0.069
σ 1.98897 C3-C12 σ* 0.03605 3.31 1.38 0.061
π 1.8958 C12-C13 π* 0.2982 18.26 0.36 0.076
C15-S17 σ 1.97779 C13-H14 σ* 0.0131 3.36 1.11 0.055
σ 1.97779 O18-H19 σ* 0.01073 2.39 1.05 0.045
O18-H19 σ 1.97862 C15-S17 σ* 0.08363 6.18 0.94 0.069
N16 LP (1) 1.88217 C12 RY*(1) 0.00912 2.67 1.46 0.057
LP (1) 1.88217 C15 RY*(1) 0.00973 3.53 1.27 0.061
LP (1) 1.88217 C15 RY*(2) 0.00639 2.28 1.69 0.057
LP (1) 1.88217 C12-C13 σ* 0.02707 5.27 0.96 0.065
LP (1) 1.88217 C15-S17 σ* 0.08363 15.94 0.55 0.084
LP (1) 1.88217 C15-O18 σ* 0.04349 4.32 0.72 0.051
S17 LP (1) 1.98612 C15-N16 σ* 0.02552 2.91 1.25 0.054
LP (2) 1.66209 C12-C13 π* 0.2982 17.91 0.28 0.064
LP (2) 1.66209 C15-N16 π* 0.37828 29.46 0.25 0.077
Table 3.8 Continue on next page

96
Table 3.8 Continued…… Donar(i) Type ED(i)(e) Acceptor(j) Type ED(j)(e)a E(2)b
Kcal/mol
E(j)-E(i)c
(a.u.)
F(i,j)d
(a.u.)
O18 LP (1) 1.97408 C15 RY*(1) 0.00973 2.82 1.53 0.059
LP (1) 1.97408 C15 RY*(4) 0.00461 2.56 1.90 0.063
LP (1) 1.97408 C15-N16 σ* 0.02552 6.95 1.21 0.082
LP (2) 1.85441 C15 RY*(5) 0.00319 2.27 1.42 0.053
LP (2) 1.85441 C15-N16 π* 0.37828 35.90 0.34 0.104
aED: Electron Density bE(2) means energy of hyperconjugative interactions. cEnergy difference between donor and acceptor i and j NBO orbitals. dF(i,j) is the Fock matrix element between i and j NBO orbitals.
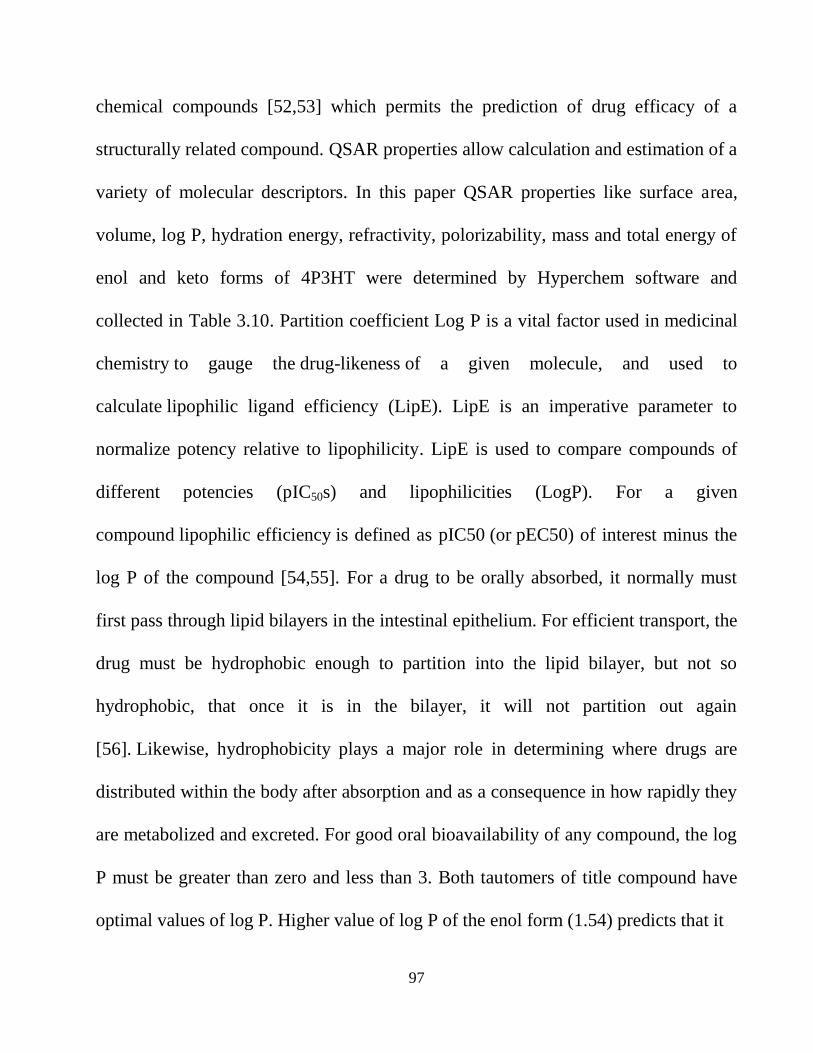
97
chemical compounds [52,53] which permits the prediction of drug efficacy of a
structurally related compound. QSAR properties allow calculation and estimation of a
variety of molecular descriptors. In this paper QSAR properties like surface area,
volume, log P, hydration energy, refractivity, polorizability, mass and total energy of
enol and keto forms of 4P3HT were determined by Hyperchem software and
collected in Table 3.10. Partition coefficient Log P is a vital factor used in medicinal
chemistry to gauge the drug-likeness of a given molecule, and used to
calculate lipophilic ligand efficiency (LipE). LipE is an imperative parameter to
normalize potency relative to lipophilicity. LipE is used to compare compounds of
different potencies (pIC50s) and lipophilicities (LogP). For a given
compound lipophilic efficiency is defined as pIC50 (or pEC50) of interest minus the
log P of the compound [54,55]. For a drug to be orally absorbed, it normally must
first pass through lipid bilayers in the intestinal epithelium. For efficient transport, the
drug must be hydrophobic enough to partition into the lipid bilayer, but not so
hydrophobic, that once it is in the bilayer, it will not partition out again
[56]. Likewise, hydrophobicity plays a major role in determining where drugs are
distributed within the body after absorption and as a consequence in how rapidly they
are metabolized and excreted. For good oral bioavailability of any compound, the log
P must be greater than zero and less than 3. Both tautomers of title compound have
optimal values of log P. Higher value of log P of the enol form (1.54) predicts that it
98
Table 3.9: NHO directionality and ''bond bending'' (deviations from
line of nuclear centres).
Bond (A-B) Deviation at A (°) Deviation at B (°)
C1-C2 1.5 1.1
C1-C6 1.1 ---
C3-C4 1.1 ---
C4-C5 --- 1.5
C4-H9 1.2 ---
C5-C6 1.1 ---
C12-C13 2.6 2.4
C12-N16 --- 4.9
C13-S17 2.8 9.7
C15-N16 --- 3.9
C15-S17 2.7 9.5
C15-O18 2.3 1.0
O18-H19 2.8 ---
Table 3.10: Comparison of QSAR properties of 4P3HT molecule in enol and keto form.
S. no. Parameters Enol form Keto Form
1. Molecular Surface Area( Grid)(Å2) 342.65 340.57
2. Molecular Volume(Å3) 524.49 524.21
3. Hydration Energy (Kcal/mol) -12.11 -5.61
4. Log(P) 1.54 0.50
5. Refractivity (Å3) 49.79 49.55
6. Molecular Mass (amu) 177.22 177.22
99
is more orally absorbent product than keto form (log P=0.50) and have important
capacity to be dependent on plasmatic proteins. The absolute value of hydration
energy is also found to be larger in enol form (12.11Kcal/mol) than in keto form
(5.61 Kcal/mol) of 4P3HT. This establishes the efficacy of enol form of the studied
title compound under physiological conditions and hence predicts its enhanced
interaction with the vis-à-vis receptors, functional proteins or enzymes.
3.4 Conclusions
In the present study, we have carried out the experimental and theoretical
spectroscopic analysis of 4P3HT for the first time, using FT-IR, FT-Raman and UV–
vis techniques and implements derived from the density functional theory. In general,
a good agreement between experimental and the calculated normal modes of
vibrations has been observed. The molecular geometry, vibrational frequencies,
infrared and Raman intensities of the molecules have been calculated by using DFT
(B3LYP) method with 6-311++G(d,p) basis sets. The MESP plot provides the visual
representation of the chemically active sites and comparative reactivity of atoms.
NBO analysis shows that the most important interactions in the title molecule having
lone pairs LP S17(2) and LP O18(2), with that of anti-bonding π (C15-N16) resulting
in the stabilization of 29.46 kcal/mol and 35.90 kcal/mol, respectively. NLO behavior
of the title molecule has been investigated by the dipole moment, polarizability and
first hyperpolarizability. Theoretically calculated values of mean polarizability of
100
both keto and enol forms are found to be nearly same but the dipole moment (5.0203
Debye) and first static hyperpolarizability (βtotal = 9.1802×10⁻³⁰
e.s.u.) of keto form are
appreciably higher than enolic form (0.5296 Debye, βtotal = 2.7871×10⁻³⁰
e.s.u.). The
calculated electronic properties show good correlation with the experimental UV-Vis
spectrum. QSAR analysis of both the keto and enol form establishes the efficacy of
enol form of the studied title compound under physiological conditions and hence
predicts its enhanced interaction with the vis-à-vis receptors, functional proteins or
enzymes.
101
References
1. N. Ulusoy, M. Kiraz, O. Kucukbasmaci, Monatsh. Chem. 133 (2002) 1305-
1315.
2. Z. A. Kaplancikli, G. T. Zitouni, G. Revial, K. Guven, Arch. pharm. Res. 27
(2004) 1081-1085.
3. M. S. Al-Saddi, H. M. Faidallah, S. A. F. Rostom, Arch. Pharm. Chem. Life
Sci. 341 (2008) 424-434.
4. K. A. Karpov, A. V. Nazarenko, B. V. Pekarevskii, V. M. Potekhin, Russ. J.
Appl. chem. 74 (2001) 998-1001.
5. T. Baselt, K. Rehse, Arch. der pharmazie. 24 (2008) 645-654.
6. H. N. Karade, B. N. Acharya, S. Manisha, M. P. Kaushik, Med. Chem. Res. 17
(2008) 19-29.
7. M. J. Rogers, E. Cundliffe, T. F. Mccutchan, Antimicrob. Agents
Chemother. 42 (1998) 715-716.
8. M. C. Bagley, J. W. Dale, E. A. Merritt & X. Xiong, Chem. Rev. 105 (2005)
685-714.
9. A. S. Mayhoub, M. Khaliq, C. Botting, Z. Li, R. J. Kuhn, M. Cushman, Bioorg.
Med. Chem. 19 (2011) 3845-3854.
10. K. Pihlaja, V. Ovcharenko, E.Kolehmainen, K. Laihia, W. M. F. Fabian, H.
Dehne, A. Perjéssy, M. Kleist, J. Teller and Z.Susteková, J. Chem. Soc., Perkin
Trans. 2 (2002) 329-336.
102
11. W.Kohn, L.J. Sham, Phys. Rev. 140 (1965) A1133-A1138.
12. A.D. Becke, J. Chem. Phys. 98 (1993) 5648-5652.
13. C. Lee, W. Yang, R.G. Parr, Phys. Rev. B 37 (1998) 785-789.
14. B. Miehlich, A. Savin, H. Stoll, H. Preuss, Chem. Phys. Lett. 157 (1989) 200-
206.
15. M.J. Frisch, G.W. Trucks, H.B. Schlegel, G.E. Scuseria, M.A. Robb, J.R.
Cheeseman, G. Scalmani, V. Barone, B. Mennucci, G.A. Petersson, H.
Nakatsuji, M. Caricato, X. Li, H.P. Hratchian, A.F. Izmaylov, J. Bloino, G.
Zheng, J.L. Sonnenberg, M. Hada, M. Ehara, K. Toyota, R. Fukuda, J.
Hasegawa, M. Ishida, T. Nakajima, Y. Honda, O. Kitao, H. Nakai, T.
Vreven, J.A. Montgomery, Jr., J.E. Peralta, F. Ogliaro, M. Bearpark, J.J.
Heyd, E. Brothers, K.N. Kudin, V.N. Staroverov, R. Kobayashi, J. Normand,
K. Raghavachari, A. Rendell, J.C. Burant, S.S. Iyengar, J. Tomasi, M. Cossi,
N. Rega, J.M. Millam, M. Klene, J.E. Knox, J.B. Cross, V. Bakken, C. Adamo,
J. Jaramillo, R. Gomperts, R.E. Stratmann, O. Yazyev, A.J. Austin, R.
Cammi, C. Pomelli, J.W. Ochterski, R.L. Martin, K. Morokuma, V.G.
Zakrzewski, G.A. Voth, P. Salvador, J.J. Dannenberg, S. Dapprich, A.D.
Daniels, O. Farkas, J.B. Foresman, J.V. Ortiz, J. Cioslowski, D.J. Fox,
Gaussian Inc., Wallingford, CT, 2009.
103
16. E. Frisch, H.P. Hratchian, R.D.Dennington II, T.A. Keith, J.Millam with B.
Nielsen, A.J. Holder, J. Hiscocks. Gaussian, Inc. GaussView Version 5.0.8,
2009.
17. J. Garbarczyk, G. Kamyszek, R. Boese, J. Mol. Struc. 479 (1999) 21-30.
18. M. Karabacak, M. Kurt, M. Cinar, A. Coruh, Mol. Phys. 107 (2009) 253-264.
19. N. Sundaraganesan, S. Ilakiamani, H. Saleem, P.M. Wojciechowski, D.
Michalska, Spectrochim.Acta A 61 (2005) 2995-3001.
20. J. B. Foresman, A. Frisch, Exploring Chemistry with Electronic Structure
Methods, second ed., Gaussian Inc., Pittsburgh, PA, 1996.
21. T. Sundius, J. Mol. Spectrosc. 82 (1980) 138-151.
22. T. Sundius, J. Mol.Struct. 218 (1990) 321-336.
23. T. Sundius, Vib. Spectrosc. 29 (2002) 89-95.
24. E.D. Glendening, C.R. Landis, F. Weinhold, WIREs Comput. Mol. Sci. 2
(2011) 1-42.
25. Hypercube, Inc., HyperChem Molecular System, USA, 2007.
26. G. Keresztury, S. Holly, J. Varga, G. Besenyei, A.Y. Wang, and J. R. Durig,
Spectrochem. Acta 49 (1993) 2007-2017.
27. G. Keresztury, Raman spectroscopy: theory, in: J.M. Chalmers, P.R. Griffith
(Eds.), Handbook of Vibrational Spectroscopy, John Wiley & Sons, New
York, 2002.
104
28. Y. Wang, S. Saebo, C. U. Pittman Jr., J. Mol. Struct.(Theochem.) 281 (1993)
91-98.
29. P. Pulay, G. Fogarasi, F. Pang, and J. E. Boggs, J. Am. Chem. Soc. 101 (1979)
2550-2560.
30. V. Arjunan, S. Sakiladevi, T Rani, C.V. Mythili, S. Mohan, Spectrochim.Acta
A 88 (2012) 220-231.
31. R. M. Silverstein, F. X. Webstor, Spectrometric Identification of Organic
Compounds, 6th
edition, Wiley, New York, 1998.
32. V. K. Rastogi, M. A. Palafox, R. P. Tanwar, L. Mittal, Spectrochim.Acta A 58
(2002) 1987-2004.
33. M. Silverstein, G. C. Basseler, C. Morill, Spectrometric Identification of
Organic Compounds, Wiley, New York, 1981.
34. V. Krishnakumar, N. Prabavathi, Spectrochim. Acta A 71 (2008) 449-457.
35. A. Altun, K. Golcuk, M. Kumru, J. Mol. Struct. (Theochem) 155 (2003) 637-
639.
36. V. Krishnakumar, R.J. Xavier, Spectrochim. Acta A 61 (2005) 253-258.
37. Y. Sun, Q. L. Hao, Z. X. Yu, W. J. Jiang, L. D. Lu, X. Wang, Spectrochim.
Acta A 73 (2009) 892-901.
38. B. Stuart, Infrared Spectroscopy: Fundamentals and Applications, Wiley India
Ed., 2010.
105
39. Y Erdogdu, M. T. Gulluoglu, Spectrochim.Acta A 74 (2009) 162-167.
40. D. A. Kleinman, Phys. Rev. 126 (1962) 1977-1979.
41. J. M. Seminario, Recent Developments and Applications of Modern Density
Functional Theory, Elsevier, Amsterdam,1996.
42. I. Fleming, Frontier Orbitals and Organic Chemical Reactions, John Wiley and
Sons, New York,1976.
43. N. M. O‟ Boyle, A. L. Tenderholt, K. M. Langer, J. Comput. Chem. 29 (2008)
839-845.
44. I. Alkorta, J. J. Perez, Int. J. Quantum. Chem. 57 (1996) 123-135.
45. E. Scrocco, J. Tomasi, in: P. Lowdin (Ed.), Advances in Quantum Chemistry,
Academic Press, New York, 1978.
46. F. J. Luque, M. Orozco, P. K. Bhadane, S.R. Gadre, J. Phys. Chem. 97 (1993)
9380-9384.
47. J. S. Murray, K. Sen, Molecular Electrostatic Potentials, Concepts and
Applications, Elsevier, Amsterdam, 1996.
48. R. K. Pathak, S. R. Gadre, J. Chem. Phys. 93 (1990) 1770-1774.
49. S. R. Gadre, I. H. Shrivastava, J. Chem. Phys. 94 (1991) 4384-4390.
50. I. Hubert Joe, I. Kostova, C. Ravikumar, M. Amalanathan, S. C. Pinzaru, J.
Raman Spectrosc. 40 (2009) 1033-1038.
51. C. Hansch, A. Leo and D.H. Hoekman, Exploring QSAR fundamentals and
106
Applications in Chemistry and Biology, American Chemical Society,
Washington, DC, USA, 1995
52. P. V. Khadikar, S. Karmarkar, V. K. Agrawal, M. Mandloi, S. Joshi, Natl.
Acad. Sci. Lett., 23( 3-4)(2000) 50-56.
53. Min Li, Dongbin Wei, Huimin Zhao, Yuguo Du, Chemosphere 95 (2014) 220-
226.
54. M.P. Edwards, D.A. Price, Annu. Rep. Med. Chem. 45 (2010) 381-391.
55. P.D. Leeson, B .Springthorpe, Nat. Rev. Drug Discov.6 (2007) 881-890.
56. H. Kubinyi, Farmaco (Sci.) 34 (3) (1979) 248-276.

107
A Combined experimental and
theoretical investigation of
2-Thienylboronicacid:
Conformational search,
molecular structure,
NBO, NLO and FT-IR,
FT-Raman, NMR and
UV spectral analysis
108
4.1 Introduction
Distinctive electronic and chemical properties of boronic acids have made this class
of compounds pertinent for application in a variety of biomedical field. As they
possess a vacant p-orbital they behave as organic Lewis acids. Under physiological
conditions boronic acids effortlessly adapt to anionic tetrahedral structure (sp3 boron)
from neutral and trigonal planar structure (sp2 boron). Broad reactivity profile,
stability and lack of apparent toxicity makes boronic acids a predominantly
fascinating class of synthetic intermediates. Low toxicity and eventual degradation
into the environment friendly boric acid, boronic acids can be viewed as „„green‟‟
compounds [1]. A wide variety of boronic acid derivatives of divergent biologically
important compounds have been synthesized as anti-metabolites for a possible two-
pronged attack on cancer [2-4]. In addition to inhibition of tumor growth, the use of
boron-10 neutron capture therapy [5] would be possible owing to the preferential
localization of boron compounds in tumor tissues. Boronic acid analogs have been
synthesized as transition state analogs for acyl transfer reactions [6] and inhibitors of
dihydrotase [7]. Recently Sun et al. [8] have developed a novel class of simple
materials for sensing monosaccharides by the functionalization of graphene oxide
with boronate-based fluorescence probes. The boronic acid moiety has also been
incorporated into amino acids and nucleosides as anti-tumor, anti-viral agents [9].
Boronic acid and its derivatives have been investigated by several authors. Molecular

109
structure of phenylboronic acid has been investigated by Rettig and Trotte [10]. IR
spectrum of phenylboronic acid and diphenyl phenylboronate has been reported by
Faniran et al. [11]. Theoretical and experimental analysis of 2-fluorophenylboronic
acid has been reported by Erdogdu et al. [12]. Kurt [13] investigated molecular
structure and vibrational spectra of the pentafluorophenylboronic by DFT and ab
initio Hartree–Fock calculations. Conformational analysis of 2-fluorophenylboronic
acid and a series of 2-X-phenylboranes (X = Cl, Br, NH2, PH2, OH and SH) have
been analyzed by Silla et al. [14]. Karabacak et al. [15,16] determined conformers
and spectroscopic features of 3-bromophenylboronic acid and 3,5-
difluorophenylboronic acid using experimental and theoretical techniques.
Pharmaceutical importance of boronic acid and its derivatives drove us to investigate
the molecular structural properties, vibrational and energetic data of 2TBA with a
long-term objective to achieve a better understanding of the properties of such
derivatives. The work reported in the present communication deals with the
comprehensive investigation of geometrical and electronic structure of 2TBA in the
ground state as well as in the first excited state along with infrared and Raman
vibrational spectroscopic analysis. UV–Vis spectrum of the title compound was also
recorded and electronic properties, such as frontier orbitals energies and their band
gap were calculated by TD-DFT approach. Experimentally observed spectral data
(FT-TR and FT-Raman) of the title compound is compared with the spectral data
110
obtained by DFT/B3LYP/6-311++G(d,p) method. The molecular properties like
MEPs, dipole moment, polarizability and first static hyperpolarizability have been
calculated to get a better understanding of the properties of the title molecule. NBO
analysis has been applied to study the stability of the molecule arising from charge
delocalization. 1H NMR chemical shifts of the molecule were calculated by GIAO
method and compared with experimental 1HNMR spectrum. Thermodynamical
properties such as heat capacity, entropy and enthalpy change at various temperatures
have also been calculated to reveal more characteristics of the title molecule.
4.2 Experimental & Computational Details
4.2.1 Sample & Instrumentation
The compound 2TBA in solid form was purchased from Sigma-Aldrich Company
(USA) with stated purity more than 95% and it was used as such without further
purification for spectroscopic measurements. The FT-Raman spectrum of 2TBA was
recorded using the 1064 nm line of Nd : YAG laser as excitation wavelength with an
output power of 2 mW at the 180° sample position in the region of 4000–100 cm
-1 on
a Varian 7000 series spectrometer at AIRF Jawaharlal Nehru University, New Delhi .
FT-IR spectrum of title compound was recorded at room temperature, with a spectral
resolution of 2.0 cm-1
in the range of 4000–400 cm-1
on a Perkin Elmer spectrometer
(version 10.03.06) using the KBr pellet technique at IIT Kanpur. JASCO UV (Model
111
V-670), UV‐Vis recording spectrometer was used for the UV absorption spectrum of
2TBA and examined in the range 500–200 nm. The UV pattern is taken from a 10‐5
molar solution of 2TBA dissolved in methanol. The 1H NMR spectra of 2TBA was
recorded in deuterated DMSO-d6 solvent on Brucker DRX 500 MHz NMR
spectrometer with sweep width of 9384.38 Hz and acquisition time 3.4917 sec at IIT
Kanpur.
4.2.2 Computational details
The geometry of the 2TBA was optimized using hybrid Becke‟s three parameter and
the Lee, Yang and Parr functional (B3LYP) [17-19] supplemented with polarized
triple-zeta 6-311++G(d,p) basis sets. Density functional theory (DFT) [20] which
provides a very good overall description of medium sized molecules was used to
study the title compound. All calculations have been performed with the Gaussian 09
program package [21] and results were analyzed with the Gaussview 5.0 molecular
visualization program [22]. Due to un-availability of the crystal structure of 2TBA
molecule, potential energy scan was performed to get the most stable geometry of
the studied molecule using B3LYP/6-31G(d) level of theory. Geometrical structure
corresponding to the lowest minima in the potential energy surface (PES) scan has
been further optimized at higher basis set (6-311++G(d,p) and thus obtained
optimized structure was used for further calculation of various molecular properties
and vibrational wavenumbers. Optimized parameters of the title molecule were
112
compared with other similar systems [23,24]. Positive value of all the calculated
wavenumbers confirms the stability of optimized geometry. An empirical uniform
scaling factor of 0.983 up to 1700 cm-1
and 0.958 for greater than 1700 cm-1
[25,26]
was used to offset the systematic errors caused by vibrational anharmonicity and
basis set incompleteness [27]. The Raman activities ( ) calculated with the Gaussian
09W program were subsequently converted to relative Raman intensities ( ) using
the following relationship derived from the basic theory of Raman scattering [28]
⁄ ⁄
where is the exciting frequency in cm-1
, the vibrational wave number of the ith
normal mode, h, c and k are the fundamental constants and f is a suitably chosen
common normalization factor for all the peak intensities.
Theoretical vibrational assignment of the title compound using percentage
potential energy distribution (PED) has been done with the MOLVIB program
(version V7.0-G77) written by T. Sundius [29-31]. The theoretical UV–Vis spectrum
has been computed by TD-DFT method with 6-311++G(d,p) basis set for gas phase
and solvent effect also has been taken into consideration by implementing IEFPCM
model at the same level of theory. Natural bonding orbital (NBO) analysis [32],
which an efficient tool for chemical interpretation of hyper-conjugative interaction
and electron density transfer, was performed using Gaussian 09 package. DFT level
113
computation is used to investigate the various second-order interactions between the
filled orbitals of one subsystem and vacant orbitals of another subsystem, which is a
measure of the delocalization or hyper-conjugation [33].
4.3 Result and discussion
4.3.1 Conformer analysis and Molecular geometry
To predict the most stable ground state conformer of the title molecule, PES scan
along various torsion angles were performed at DFT/B3LYP/6-31G(d) level of
theory. Initially, scan profile of the studied molecule about the dihedral S5-C1-B9-
O10 were explored from -180° to 180° in steps of 10°, simultaneously relaxing all
other the geometrical parameters during the scan. This torsional profile of PES scan
shown in Fig. 4.1(a) reveals two stable conformer represented as (I) and (III) with
ground state energy -729.02268 Hartree and -729.02277 Hartree respectively .
Value (0° and 180°) of the dihedral angle S5-C1-B9-O10 corresponding to both
stable conformers (I, III) represents planer orientation of both oxygen atoms of the
title molecule. Further 3D PES scan were performed on conformer III by varying
dihedral angles C1-B9-O10-H11and C1-B9-O12-H13 in steps of 10° from -180° to
180° and all the geometrical parameters were simultaneously relaxed during the scan
except two selected dihedral angles. Dihedral angles C1-B9-O10-H11 and C1-B9-
O12-H13 are the relevant torsional angles to check conformational flexibility within
the title molecule; corresponding torsional profiles of PES scan are shown in Fig.

114
Fig. 4.1(a): The potential energy curve of 2TBA along the S5-C1-B9-O10
dihedral angle, calculated at B3LYP/6-31G(d) level of theory.
115
4.1(b) and 4.1(c). Stable conformers corresponding to the minima points A (Trans-
Trans), B (Trans-Cis), C (Cis-Trans), and D (Cis-Cis) on PES (Fig. 4.1(c)) are shown
in Fig. 4.1(d) with their ground state energies. These nomenclature Trans and Cis is
according to the position of OH groups, whether they are directed away from or
toward the ring.
Eigen values obtained from scan output reveals that, the conformers B and C in
which both –OH groups are in trans-cis and cis-trans orientation are more stable than
conformer A and D with –OH groups in trans-trans and cis-cis orientation. As the
energy difference between B and C conformer is only 0.05 kcal/mol at
DFT/B3LYP/6-31G(d). Both the conformers were further optimized at DFT/
B3LYP/6-311++G(d,p), MP2/6-311++G(d,p) and dispersion-including DFT method
wB97X-D/6-311++G(d,p) to check the stability of conformers.
The ground state energy values for C conformer is calculated at three levels of
theories are -729.16346 Hatree (-457552.258 kcal/mol); -727.70908 (-456639.633
kcal/mol); and -729.02597 Hartree (-457465.985 kcal/mol) respectively whereas
energy values for B conformer are calculated to be -729.16369 Hatree (-457552.402
kcal/mol); -727.70999 (-456640.199 kcal/mol); and -729.02625 Hartree (-457466.159
kcal/mol) respectively. These calculations confirm the trans-cis conformer to be the
lowest energy conformer. The optimized molecular structure of 2TBA along with the
numbering scheme of the atoms is shown in Fig. 4.2.
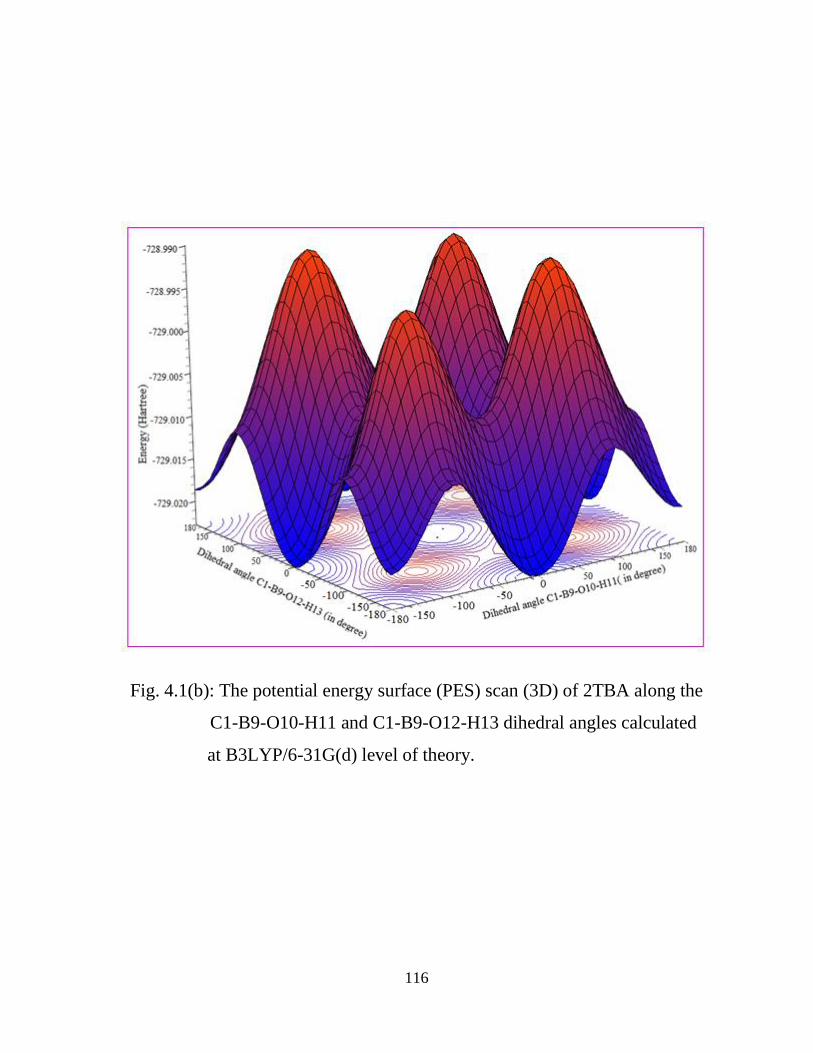
116
Fig. 4.1(b): The potential energy surface (PES) scan (3D) of 2TBA along the
C1-B9-O10-H11 and C1-B9-O12-H13 dihedral angles calculated
at B3LYP/6-31G(d) level of theory.
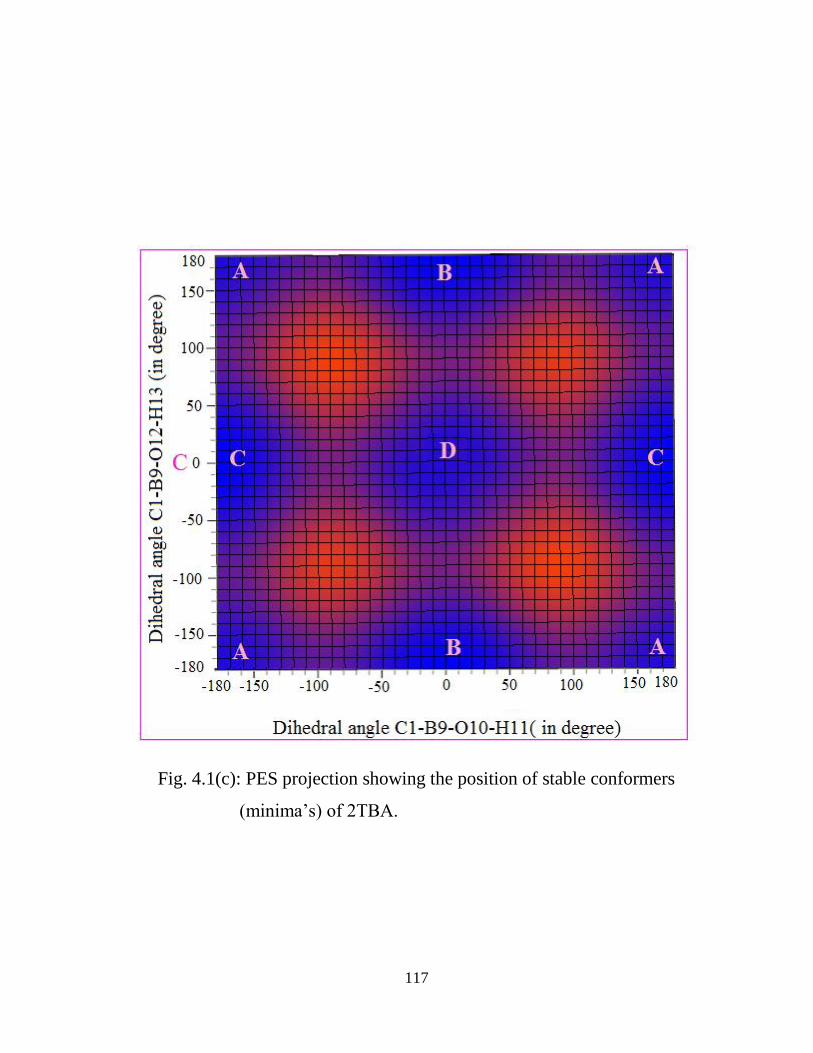
117
Fig. 4.1(c): PES projection showing the position of stable conformers
(minima‟s) of 2TBA.

118
Fig. 4.1(d): Stable conformers of 2TBA at DFT/B3LYP/6-311++G(d,p)
along with their energies.
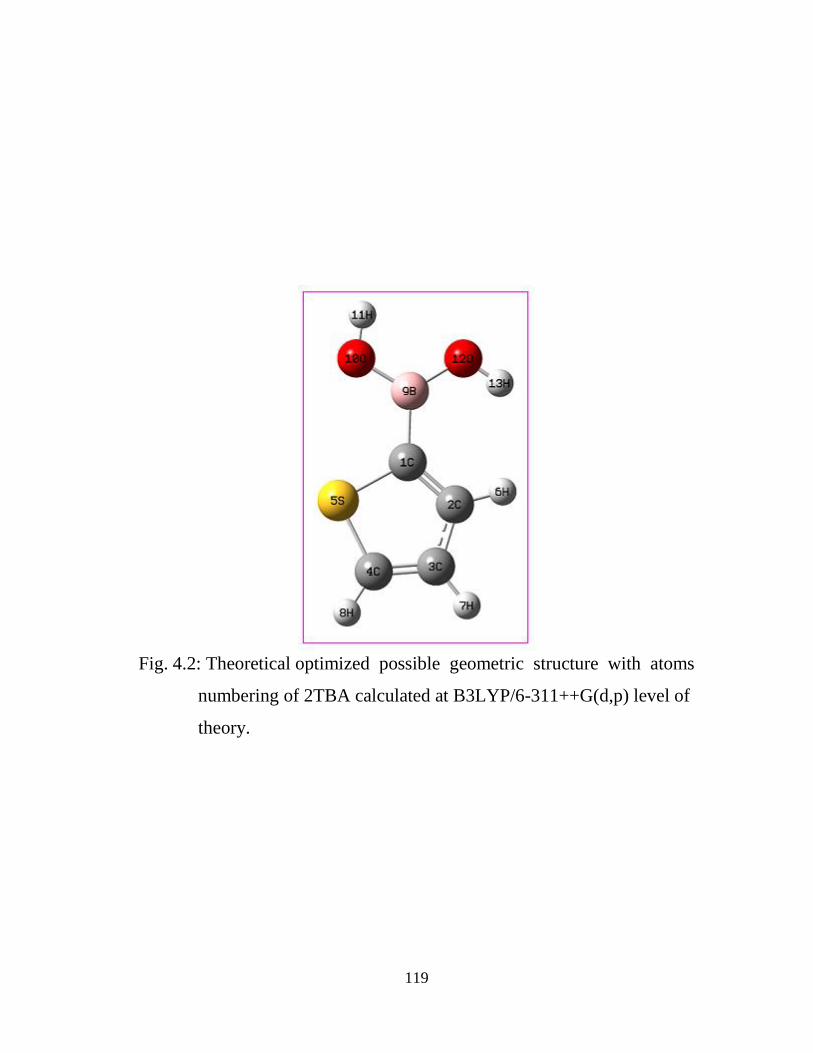
119
Fig. 4.2: Theoretical optimized possible geometric structure with atoms
numbering of 2TBA calculated at B3LYP/6-311++G(d,p) level of
theory.
120
The optimized geometrical parameters such as bond lengths, bond angles and
dihedral angles are listed in Table 4.1. Due to unavailability of the crystal structure of
title molecule, the optimized structure was compared with other systems having
similar moieties [23,24]. The bond length C2-C3 (1.420 Å) is longer than C1-C2
(1.379 Å) and C3-C4 (1.370 Å) which is due to partial double bond character of C2-
C3 bond, and is also justified by the experimental values.
The C1-S5 and C4-S5 bond lengths are 1.746 Å and 1.724 Å respectively, in
between the standard bond lengths for a C-S (1.820 Å) bond and for C=S (1.61 Å)
bond. Significant deviation of the O-B-O and C-B-O bond angles from the expected
120° angle (sp2 hybridized state of boron) is observed. A resonance interaction
between oxygen lone pairs and vacant p orbital of boron, may possibly forces both H
atoms of –B(OH)2 group to lie in the O-B-O plane. All of the calculated dihedral
angles of the optimized structure are found to be either 0° or 180° which indicates
planar structure of the title molecule. The calculated geometrical parameters are in
well agreement with corresponding experimental values.
4.3.2 Vibrational Analysis
The vibrational analysis of 2TBA was performed on the basis of the characteristic
vibrations of boronic acid moeity and thienyl ring modes. The title molecule consists
of 13 atoms, which undergo 33 normal modes of vibrations and it possesses C1

121
Table 4.1: The optimized geometric parameters and comparison with available
experimental results, bond lengths in angstrom (Aº), bond angles and
selected dihedral angles in degrees (º) for 2TBA. Bond Length B3LYP Exp.
a Bond Angle B3LYP Exp.
a Dihederal Angles B3LYP
C1-C2 1.379 1.369 C2-C1-S5 109.5 110.5 S5-C1-C2-C3 0.0
C1-S5 1.746 1.723 C2-C1-B9 129.5 122.0 S5-C1-C2-H6 -180.0
C1-B9 1.552 1.568 S5-C1-B9 121.0 - B9-C1-C2-C3 -180.0
C2-C3 1.420 1.407 C1-C2-C3 114.3 112.9 B9-C1-C2-H6 0.0
C2-H6 1.085 - C1-C2-H6 123.3 - C2-C1-S5-C4 0.0
C3-C4 1.370 1.360 C3-C2-H6 122.4 - B9-C1-S5-C4 180.0
C3-H7 1.082 - C2-C3-C4 112.1 113.3 C2-C1-B9-O10 -180.0
C4-S5 1.724 1.712 C2-C3-H7 124.3 - C2-C1-B9-O12 0.0
C4-H8 1.080 - C4-C3-H7 123.6 - S5-C1-B9-O10 0.0
B9-O10 1.366 1.362
C3-C4-S5 111.8 111.0 S5-C1-B9-O12 -180.0
B9-O12 1.374 1.378 C3-C4-H8 128.0 - C1-C2-C3-C4 0.0
O10-H11 0.963 0.75 S5-C4-H8 120.2 - C1-C2-C3-H7 180.0
O12-H13 0.960 0.75 C1-S5-C4 92.3 92.3 H6-C2-C3-C4 180.0
C1-B9-O10 118.9 118.9 H6-C2-C3-H7 0.0
C1-B9-O12 123.4 125 C2-C3-C4-S5 0.0
O10-B9-O12 117.7 116.3 C2-C3-C4-H8 180.0
B9-O10-H11 112.6 111 H7-C3-C4-S5 180.0
B9-O12-H13 114.9 111 H7-C3-C4-H8 0.0
C3-C4-S5-C1 0.0
H8-C4-S5-C1 -180.0
C1-B9-O10-H11 -180.0
O12-B9-O10-H11 0.0
C1-B9-O12-H13 0.0
O10-B9-O12-H13 -180.0
a: Refer to [23,24]
122
symmetry. Vibrational spectral assignments were performed at the B3LYP level with
the triple split valence basis set 6-311++G(d,p). The specific assignment to each
wavenumber has been attempted through potential energy distribution (PED). To
calculate PED of all normal modes, a set of 49 internal coordinates (Table 4.2) and 33
local symmetry coordinates for 2TBA were defined as recommended by Pulay et al.
[34] and provided here as supplementary material in Table 4.3. This method is
suitable for determining the mixing of other modes, but the maximum contribution is
believed to be the most significant mode. The recorded FT-IR and FT-Raman
spectrum of 2TBA along with comparative theoretical ones are shown in Fig. 4.3 and
4.4 respectively. Observed vibrational bands with their relative intensities, calculated
wavenumbers with their assignments are given in Table 4.4.
All over vibrational analysis of 2TBA are discussed under two heads (i) Boronic acid
moiety (-B(OH)2) (ii) five member (thienyl) ring vibrations.
4.3.2.1 Boronic acid moiety (–B(OH)2 )
The OH group gives rise to three normal mode vibrations (stretching, in plane
bending and out of plane bending vibrations). In boronic acids, the OH groups absorb
broadly near 3300–3200 cm-1
due to bonded O–H stretch. In the FT-IR spectrum of
2TBA molecule a very strong absorption band at 3219 cm-1
is assigned to the O–H
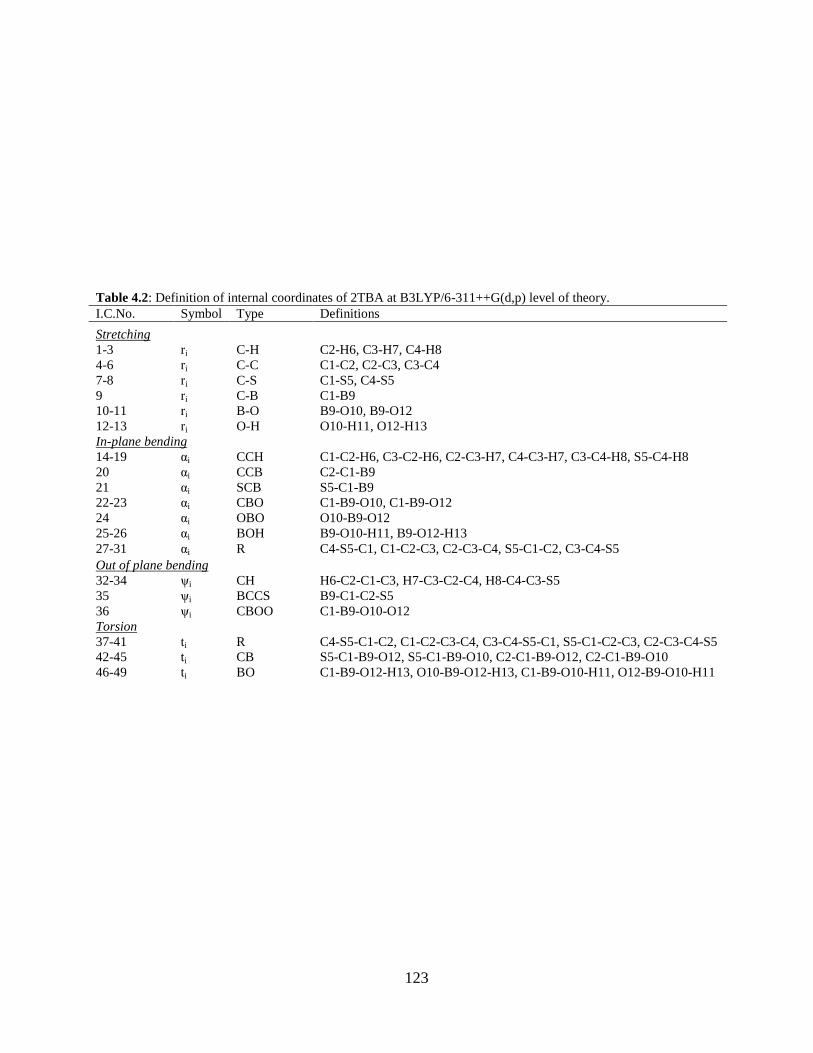
123
Table 4.2: Definition of internal coordinates of 2TBA at B3LYP/6-311++G(d,p) level of theory.
I.C.No. Symbol Type Definitions
Stretching
1-3 ri C-H C2-H6, C3-H7, C4-H8
4-6 ri C-C C1-C2, C2-C3, C3-C4
7-8 ri C-S C1-S5, C4-S5
9 ri C-B C1-B9
10-11 ri B-O B9-O10, B9-O12
12-13 ri O-H O10-H11, O12-H13
In-plane bending
14-19 αi CCH C1-C2-H6, C3-C2-H6, C2-C3-H7, C4-C3-H7, C3-C4-H8, S5-C4-H8
20 αi CCB C2-C1-B9
21 αi SCB S5-C1-B9
22-23 αi CBO C1-B9-O10, C1-B9-O12
24 αi OBO O10-B9-O12
25-26 αi BOH B9-O10-H11, B9-O12-H13
27-31 αi R C4-S5-C1, C1-C2-C3, C2-C3-C4, S5-C1-C2, C3-C4-S5
Out of plane bending
32-34 ψi CH H6-C2-C1-C3, H7-C3-C2-C4, H8-C4-C3-S5
35 ψi BCCS B9-C1-C2-S5
36 ψi CBOO C1-B9-O10-O12
Torsion
37-41 ti R C4-S5-C1-C2, C1-C2-C3-C4, C3-C4-S5-C1, S5-C1-C2-C3, C2-C3-C4-S5
42-45 ti CB S5-C1-B9-O12, S5-C1-B9-O10, C2-C1-B9-O12, C2-C1-B9-O10
46-49 ti BO C1-B9-O12-H13, O10-B9-O12-H13, C1-B9-O10-H11, O12-B9-O10-H11
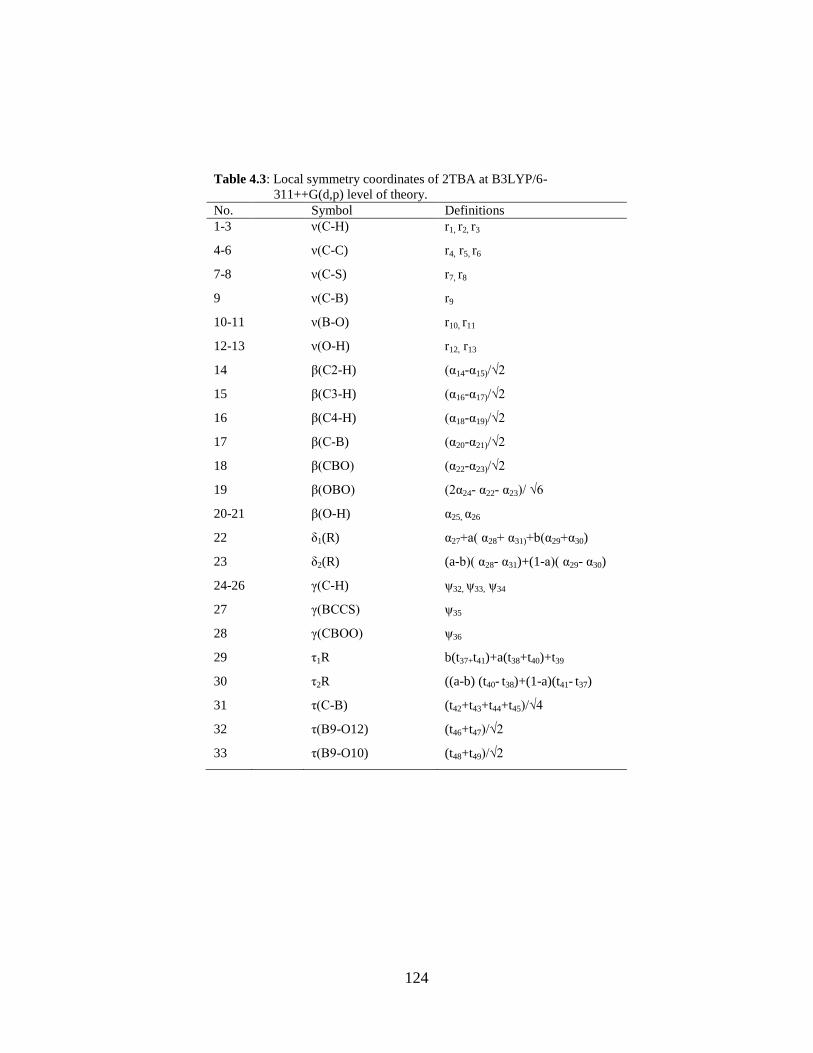
124
Table 4.3: Local symmetry coordinates of 2TBA at B3LYP/6-
311++G(d,p) level of theory.
No. Symbol Definitions
1-3 ν(C-H) r1, r2, r3
4-6 ν(C-C) r4, r5, r6
7-8 ν(C-S) r7, r8
9 ν(C-B) r9
10-11 ν(B-O) r10, r11
12-13 ν(O-H) r12, r13
14 β(C2-H) (α14-α15)/√2
15 β(C3-H) (α16-α17)/√2
16 β(C4-H) (α18-α19)/√2
17 β(C-B) (α20-α21)/√2
18 β(CBO) (α22-α23)/√2
19 β(OBO) (2α24- α22- α23)/ √6
20-21 β(O-H) α25, α26
22 δ1(R) α27+a( α28+ α31)+b(α29+α30)
23 δ2(R) (a-b)( α28- α31)+(1-a)( α29- α30)
24-26 γ(C-H) ψ32, ψ33, ψ34
27 γ(BCCS) ψ35
28 γ(CBOO) ψ36
29 τ1R b(t37+t41)+a(t38+t40)+t39
30 τ2R ((a-b) (t40- t38)+(1-a)(t41- t37)
31 τ(C-B) (t42+t43+t44+t45)/√4
32 τ(B9-O12) (t46+t47)/√2
33 τ(B9-O10) (t48+t49)/√2
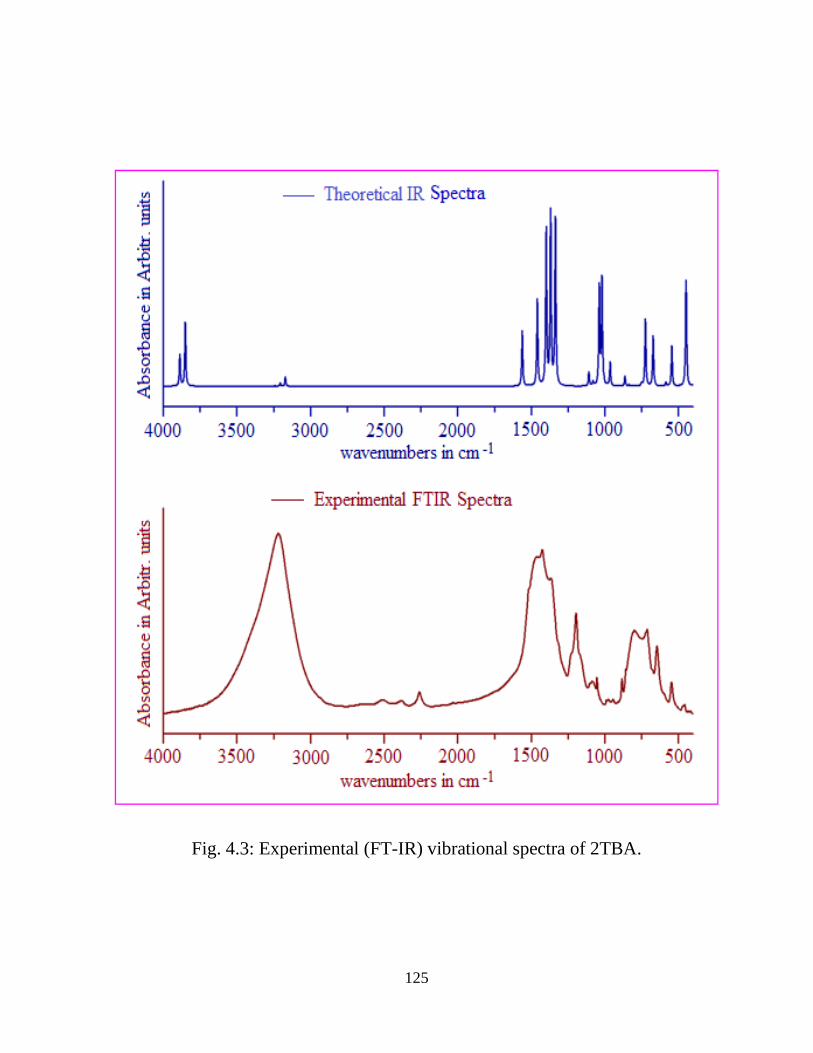
125
Fig. 4.3: Experimental (FT-IR) vibrational spectra of 2TBA.
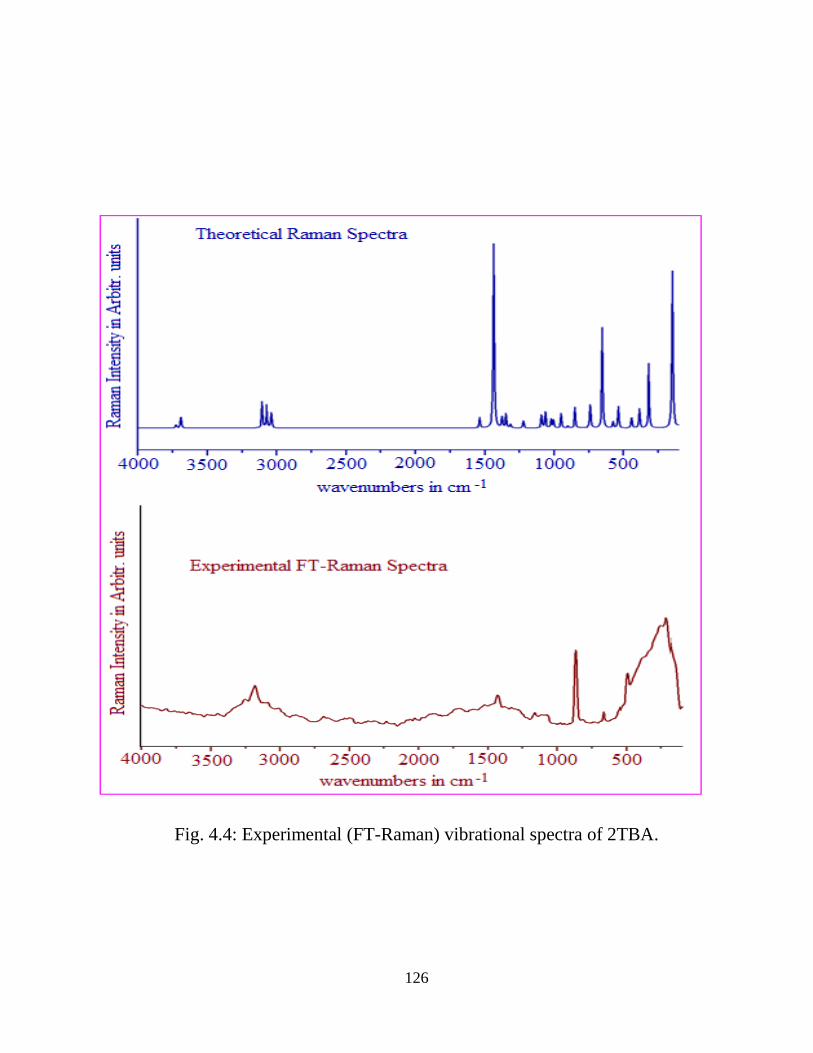
126
Fig. 4.4: Experimental (FT-Raman) vibrational spectra of 2TBA.
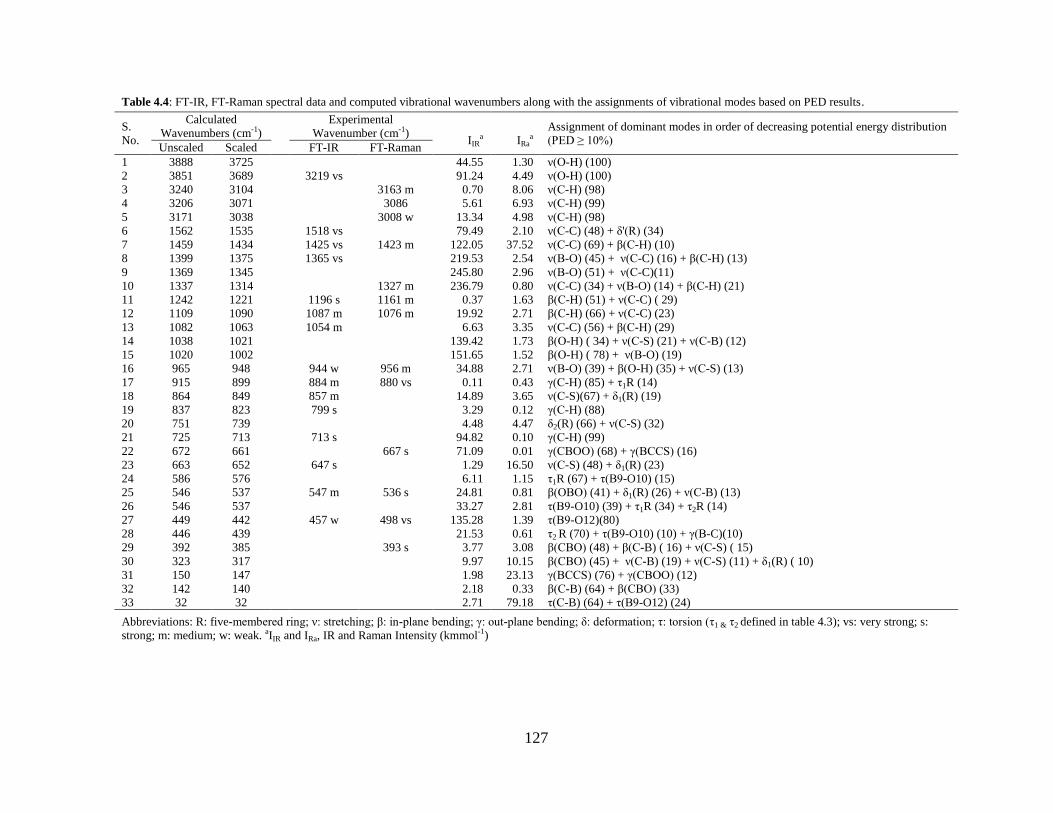
127
Table 4.4: FT-IR, FT-Raman spectral data and computed vibrational wavenumbers along with the assignments of vibrational modes based on PED results.
S.
No.
Calculated
Wavenumbers (cm-1)
Experimental
Wavenumber (cm-1)
IIRa
IRaa
Assignment of dominant modes in order of decreasing potential energy distribution
(PED ≥ 10%) Unscaled Scaled FT-IR FT-Raman
1 3888 3725
44.55 1.30 ν(O-H) (100)
2 3851 3689 3219 vs
91.24 4.49 ν(O-H) (100)
3 3240 3104
3163 m 0.70 8.06 ν(C-H) (98)
4 3206 3071
3086 5.61 6.93 ν(C-H) (99)
5 3171 3038
3008 w 13.34 4.98 ν(C-H) (98)
6 1562 1535 1518 vs
79.49 2.10 ν(C-C) (48) + δ'(R) (34)
7 1459 1434 1425 vs 1423 m 122.05 37.52 ν(C-C) (69) + β(C-H) (10)
8 1399 1375 1365 vs
219.53 2.54 ν(B-O) (45) + ν(C-C) (16) + β(C-H) (13)
9 1369 1345
245.80 2.96 ν(B-O) (51) + ν(C-C)(11)
10 1337 1314
1327 m 236.79 0.80 ν(C-C) (34) + ν(B-O) (14) + β(C-H) (21)
11 1242 1221 1196 s 1161 m 0.37 1.63 β(C-H) (51) + ν(C-C) ( 29)
12 1109 1090 1087 m 1076 m 19.92 2.71 β(C-H) (66) + ν(C-C) (23)
13 1082 1063 1054 m
6.63 3.35 ν(C-C) (56) + β(C-H) (29)
14 1038 1021
139.42 1.73 β(O-H) ( 34) + ν(C-S) (21) + ν(C-B) (12)
15 1020 1002
151.65 1.52 β(O-H) ( 78) + ν(B-O) (19)
16 965 948 944 w 956 m 34.88 2.71 ν(B-O) (39) + β(O-H) (35) + ν(C-S) (13)
17 915 899 884 m 880 vs 0.11 0.43 γ(C-H) (85) + τ1R (14)
18 864 849 857 m
14.89 3.65 ν(C-S)(67) + δ1(R) (19)
19 837 823 799 s
3.29 0.12 γ(C-H) (88)
20 751 739
4.48 4.47 δ2(R) (66) + ν(C-S) (32)
21 725 713 713 s
94.82 0.10 γ(C-H) (99)
22 672 661
667 s 71.09 0.01 γ(CBOO) (68) + γ(BCCS) (16)
23 663 652 647 s
1.29 16.50 ν(C-S) (48) + δ1(R) (23)
24 586 576
6.11 1.15 τ1R (67) + τ(B9-O10) (15)
25 546 537 547 m 536 s 24.81 0.81 β(OBO) (41) + δ1(R) (26) + ν(C-B) (13)
26 546 537
33.27 2.81 τ(B9-O10) (39) + τ1R (34) + τ2R (14)
27 449 442 457 w 498 vs 135.28 1.39 τ(B9-O12)(80)
28 446 439
21.53 0.61 τ2 R (70) + τ(B9-O10) (10) + γ(B-C)(10)
29 392 385
393 s 3.77 3.08 β(CBO) (48) + β(C-B) ( 16) + ν(C-S) ( 15)
30 323 317
9.97 10.15 β(CBO) (45) + ν(C-B) (19) + ν(C-S) (11) + δ1(R) ( 10)
31 150 147
1.98 23.13 γ(BCCS) (76) + γ(CBOO) (12)
32 142 140
2.18 0.33 β(C-B) (64) + β(CBO) (33)
33 32 32
2.71 79.18 τ(C-B) (64) + τ(B9-O12) (24)
Abbreviations: R: five-membered ring; ν: stretching; β: in-plane bending; γ: out-plane bending; δ: deformation; τ: torsion (τ1 & τ2 defined in table 4.3); vs: very strong; s:
strong; m: medium; w: weak. aIIR and IRa, IR and Raman Intensity (kmmol-1)
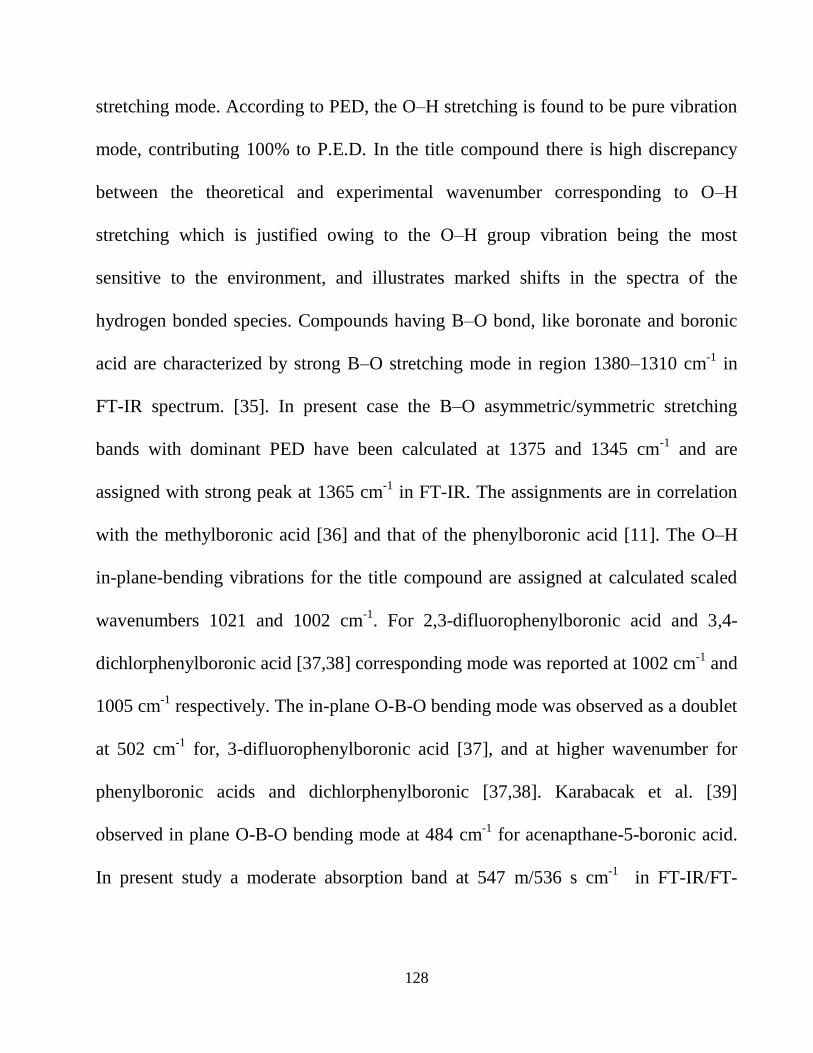
128
stretching mode. According to PED, the O–H stretching is found to be pure vibration
mode, contributing 100% to P.E.D. In the title compound there is high discrepancy
between the theoretical and experimental wavenumber corresponding to O–H
stretching which is justified owing to the O–H group vibration being the most
sensitive to the environment, and illustrates marked shifts in the spectra of the
hydrogen bonded species. Compounds having B–O bond, like boronate and boronic
acid are characterized by strong B–O stretching mode in region 1380–1310 cm-1
in
FT-IR spectrum. [35]. In present case the B–O asymmetric/symmetric stretching
bands with dominant PED have been calculated at 1375 and 1345 cm-1
and are
assigned with strong peak at 1365 cm-1
in FT-IR. The assignments are in correlation
with the methylboronic acid [36] and that of the phenylboronic acid [11]. The O–H
in-plane-bending vibrations for the title compound are assigned at calculated scaled
wavenumbers 1021 and 1002 cm-1
. For 2,3-difluorophenylboronic acid and 3,4-
dichlorphenylboronic acid [37,38] corresponding mode was reported at 1002 cm-1
and
1005 cm-1
respectively. The in-plane O-B-O bending mode was observed as a doublet
at 502 cm-1
for, 3-difluorophenylboronic acid [37], and at higher wavenumber for
phenylboronic acids and dichlorphenylboronic [37,38]. Karabacak et al. [39]
observed in plane O-B-O bending mode at 484 cm-1
for acenapthane-5-boronic acid.
In present study a moderate absorption band at 547 m/536 s cm-1
in FT-IR/FT-
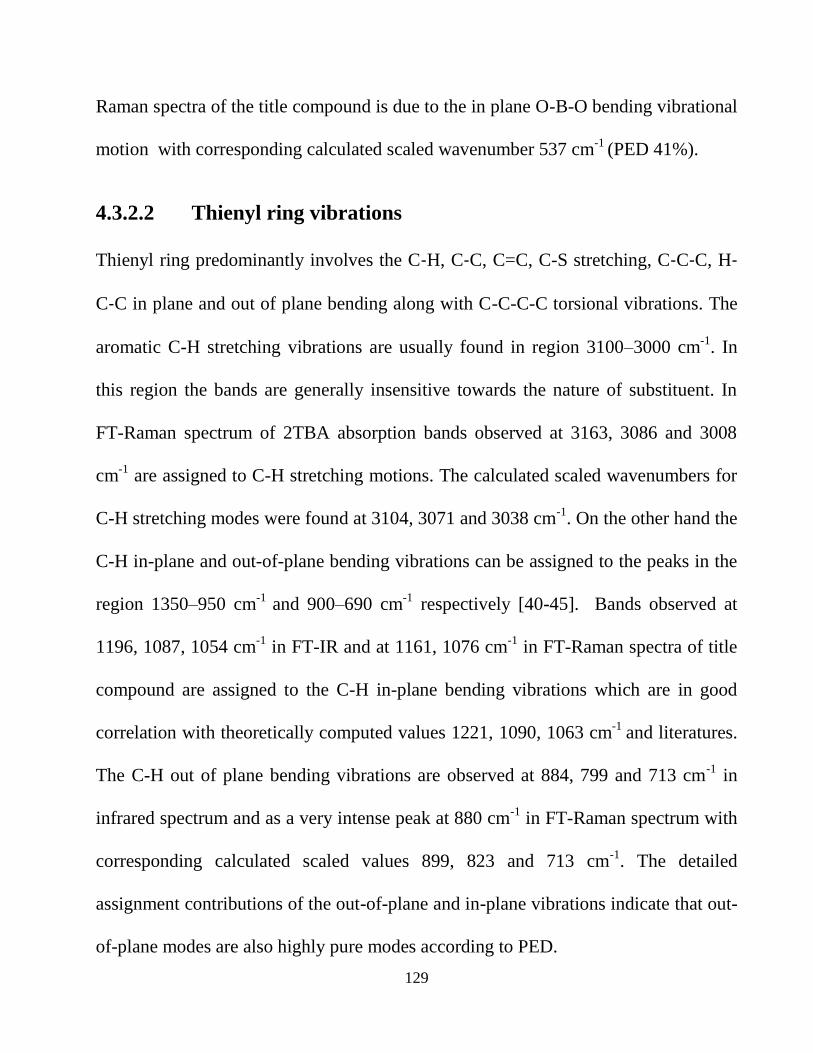
129
Raman spectra of the title compound is due to the in plane O-B-O bending vibrational
motion with corresponding calculated scaled wavenumber 537 cm-1
(PED 41%).
4.3.2.2 Thienyl ring vibrations
Thienyl ring predominantly involves the C-H, C-C, C=C, C-S stretching, C-C-C, H-
C-C in plane and out of plane bending along with C-C-C-C torsional vibrations. The
aromatic C-H stretching vibrations are usually found in region 3100–3000 cm-1
. In
this region the bands are generally insensitive towards the nature of substituent. In
FT-Raman spectrum of 2TBA absorption bands observed at 3163, 3086 and 3008
cm-1
are assigned to C-H stretching motions. The calculated scaled wavenumbers for
C-H stretching modes were found at 3104, 3071 and 3038 cm-1
. On the other hand the
C-H in-plane and out-of-plane bending vibrations can be assigned to the peaks in the
region 1350–950 cm-1
and 900–690 cm-1
respectively [40-45]. Bands observed at
1196, 1087, 1054 cm-1
in FT-IR and at 1161, 1076 cm-1
in FT-Raman spectra of title
compound are assigned to the C-H in-plane bending vibrations which are in good
correlation with theoretically computed values 1221, 1090, 1063 cm-1
and literatures.
The C-H out of plane bending vibrations are observed at 884, 799 and 713 cm-1
in
infrared spectrum and as a very intense peak at 880 cm-1
in FT-Raman spectrum with
corresponding calculated scaled values 899, 823 and 713 cm-1
. The detailed
assignment contributions of the out-of-plane and in-plane vibrations indicate that out-
of-plane modes are also highly pure modes according to PED.
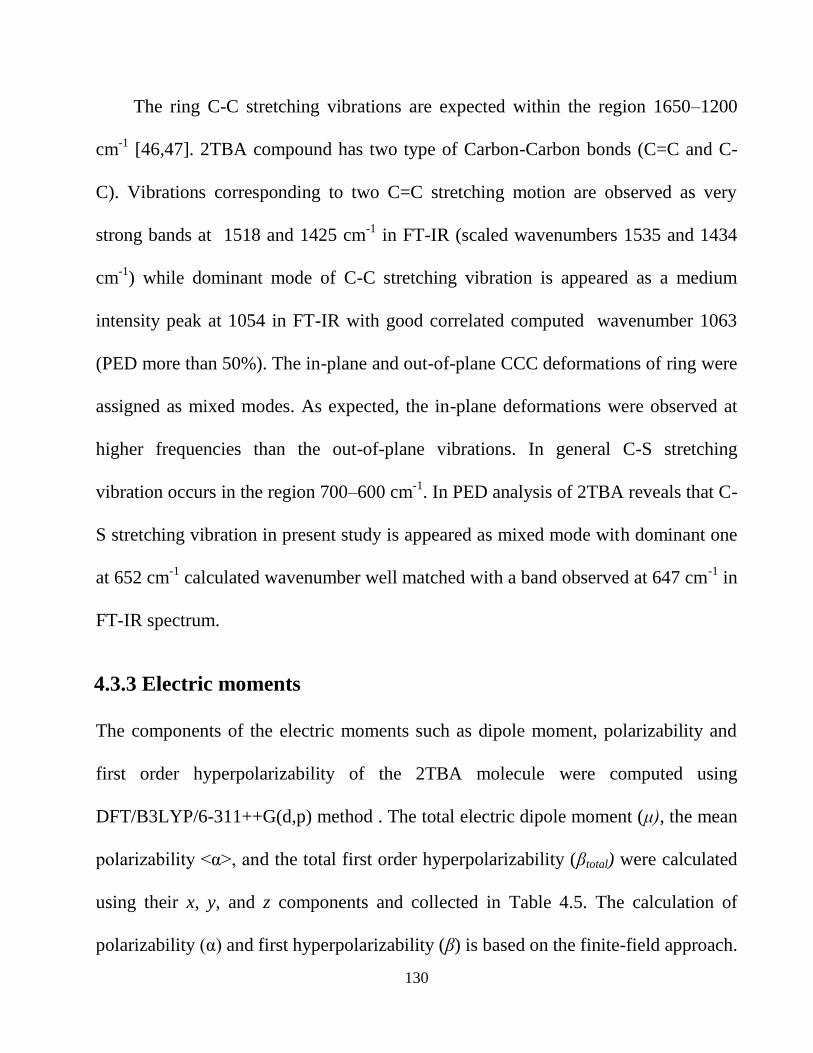
130
The ring C-C stretching vibrations are expected within the region 1650–1200
cm-1
[46,47]. 2TBA compound has two type of Carbon-Carbon bonds (C=C and C-
C). Vibrations corresponding to two C=C stretching motion are observed as very
strong bands at 1518 and 1425 cm-1
in FT-IR (scaled wavenumbers 1535 and 1434
cm-1
) while dominant mode of C-C stretching vibration is appeared as a medium
intensity peak at 1054 in FT-IR with good correlated computed wavenumber 1063
(PED more than 50%). The in-plane and out-of-plane CCC deformations of ring were
assigned as mixed modes. As expected, the in-plane deformations were observed at
higher frequencies than the out-of-plane vibrations. In general C-S stretching
vibration occurs in the region 700–600 cm-1
. In PED analysis of 2TBA reveals that C-
S stretching vibration in present study is appeared as mixed mode with dominant one
at 652 cm-1
calculated wavenumber well matched with a band observed at 647 cm-1
in
FT-IR spectrum.
4.3.3 Electric moments
The components of the electric moments such as dipole moment, polarizability and
first order hyperpolarizability of the 2TBA molecule were computed using
DFT/B3LYP/6-311++G(d,p) method . The total electric dipole moment (μ), the mean
polarizability <α>, and the total first order hyperpolarizability (βtotal) were calculated
using their x, y, and z components and collected in Table 4.5. The calculation of
polarizability (α) and first hyperpolarizability (β) is based on the finite-field approach.

131
In presence of an applied electric field, the energy of a system is a function of the
electric field. The first hyperpolarizability is a third rank tensor that can be described
by a 3×3×3 matrix. The 27 components of the matrix can be reduced to 10
components due to the Kleinman symmetry [48].
The calculated value of mean polarizability <α> and total first order
hyperpolarizability (βtotal) of 2TBA are 12.3083×10⁻²⁴
esu and 0.5835×10⁻³⁰
esu
respectively. Urea is one of the prototypical molecule used in the study of the NLO
properties of molecular systems. Therefore it was used frequently as a threshold value
for comparative purposes. The calculated value of β for the title compound is
relatively three times higher than that of Urea and therefore 2TBA molecule
possesses considerable NLO properties. Theoretically calculated value of dipole
moment is 1.9033 Debye.
4.3.4 UV-Vis studies and electronic properties
On the basis of a fully optimized ground-state structure, TD-DFT method has been
used to determine the low-lying excited states of 2TBA. The simulated UV spectra
and related properties such as the vertical excitation energies, oscillator strength (f)
and corresponding absorption wavelength have been computed (Table 4.6) and
compared with experimental UV spectra. The TD-DFT calculation predicts one
intense electronic transition at 240.32/242.56 nm with an oscillator strength
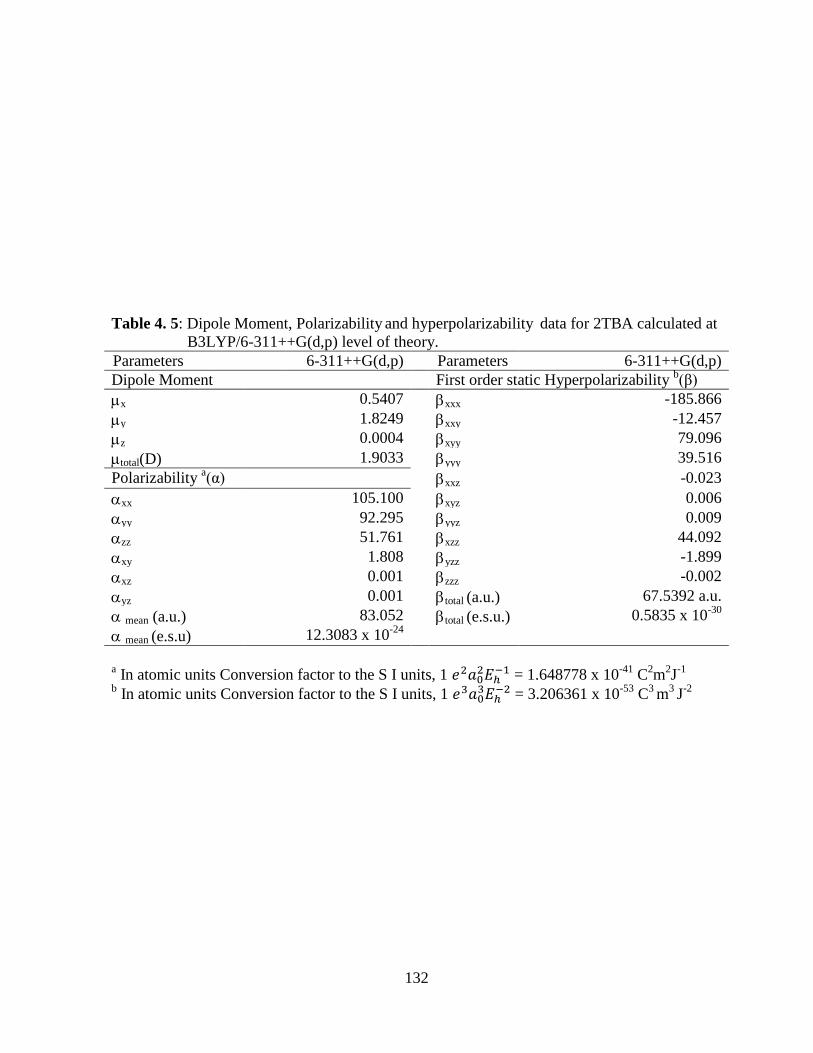
132
Table 4. 5: Dipole Moment, Polarizability and hyperpolarizability
data for 2TBA calculated at
B3LYP/6-311++G(d,p) level of theory.
Parameters 6-311++G(d,p) Parameters 6-311++G(d,p)
Dipole Moment First order static Hyperpolarizability b(β)
x 0.5407 xxx -185.866
y 1.8249 xxy -12.457
z 0.0004 xyy 79.096
total(D) 1.9033 yyy 39.516
Polarizability a(α) xxz -0.023
xx 105.100 xyz 0.006
yy 92.295 yyz 0.009
zz 51.761 xzz 44.092
xy 1.808 yzz -1.899
xz 0.001 zzz -0.002
yz 0.001 total (a.u.) 67.5392 a.u.
mean (a.u.) 83.052 total (e.s.u.) 0.5835 x 10⁻³⁰
mean (e.s.u) 12.3083 x 10⁻²⁴
a In atomic units Conversion factor to the S I units, 1
= 1.648778 x 10
-41 C
2m
2J
-1
b In atomic units Conversion factor to the S I units, 1
= 3.206361 x 10
-53 C
3 m
3 J
-2
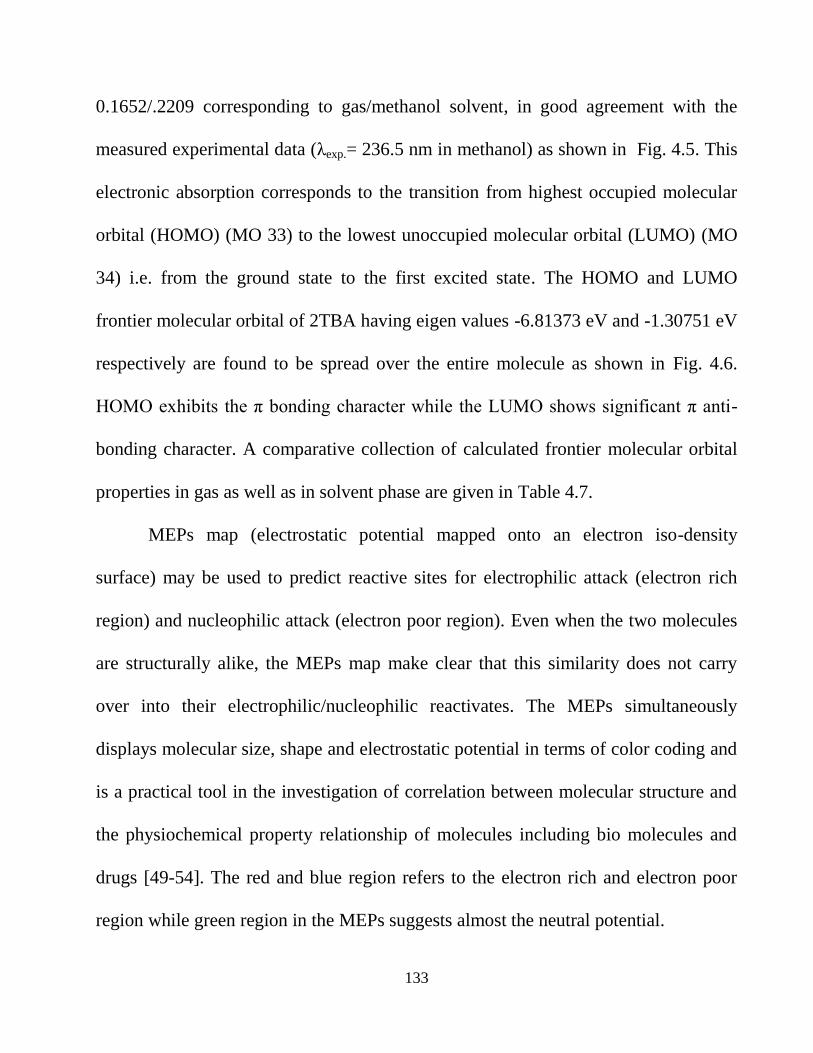
133
0.1652/.2209 corresponding to gas/methanol solvent, in good agreement with the
measured experimental data (λexp.= 236.5 nm in methanol) as shown in Fig. 4.5. This
electronic absorption corresponds to the transition from highest occupied molecular
orbital (HOMO) (MO 33) to the lowest unoccupied molecular orbital (LUMO) (MO
34) i.e. from the ground state to the first excited state. The HOMO and LUMO
frontier molecular orbital of 2TBA having eigen values -6.81373 eV and -1.30751 eV
respectively are found to be spread over the entire molecule as shown in Fig. 4.6.
HOMO exhibits the π bonding character while the LUMO shows significant π anti-
bonding character. A comparative collection of calculated frontier molecular orbital
properties in gas as well as in solvent phase are given in Table 4.7.
MEPs map (electrostatic potential mapped onto an electron iso-density
surface) may be used to predict reactive sites for electrophilic attack (electron rich
region) and nucleophilic attack (electron poor region). Even when the two molecules
are structurally alike, the MEPs map make clear that this similarity does not carry
over into their electrophilic/nucleophilic reactivates. The MEPs simultaneously
displays molecular size, shape and electrostatic potential in terms of color coding and
is a practical tool in the investigation of correlation between molecular structure and
the physiochemical property relationship of molecules including bio molecules and
drugs [49-54]. The red and blue region refers to the electron rich and electron poor
region while green region in the MEPs suggests almost the neutral potential.
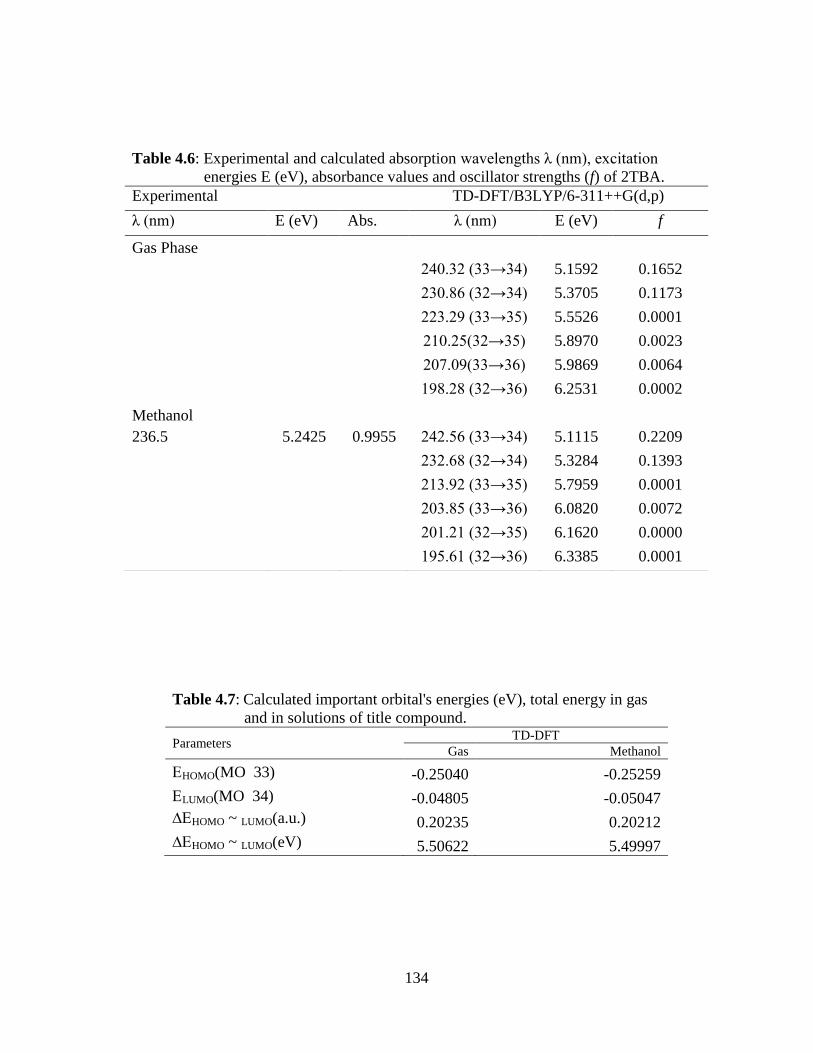
134
Table 4.6: Experimental and calculated absorption wavelengths λ (nm), excitation
energies E (eV), absorbance values and oscillator strengths (f) of 2TBA.
Experimental TD-DFT/B3LYP/6-311++G(d,p)
λ (nm) E (eV) Abs. λ (nm) E (eV) f
Gas Phase
240.32 (33→34) 5.1592 0.1652
230.86 (32→34) 5.3705 0.1173
223.29 (33→35) 5.5526 0.0001
210.25(32→35) 5.8970 0.0023
207.09(33→36) 5.9869 0.0064
198.28 (32→36) 6.2531 0.0002
Methanol
236.5 5.2425 0.9955 242.56 (33→34) 5.1115 0.2209
232.68 (32→34) 5.3284 0.1393
213.92 (33→35) 5.7959 0.0001
203.85 (33→36) 6.0820 0.0072
201.21 (32→35) 6.1620 0.0000
195.61 (32→36) 6.3385 0.0001
Table 4.7: Calculated important orbital's energies (eV), total energy in gas
and in solutions of title compound.
Parameters TD-DFT
Gas Methanol
HOMO(MO 33) -0.25040 -0.25259
LUMO(MO 34) -0.04805 -0.05047
HOMO ~ LUMO(a.u.) 0.20235 0.20212
HOMO ~ LUMO(eV) 5.50622 5.49997

135
Fig. 4.5: Experimental and simulated UV absorption spectra of 2TBA.
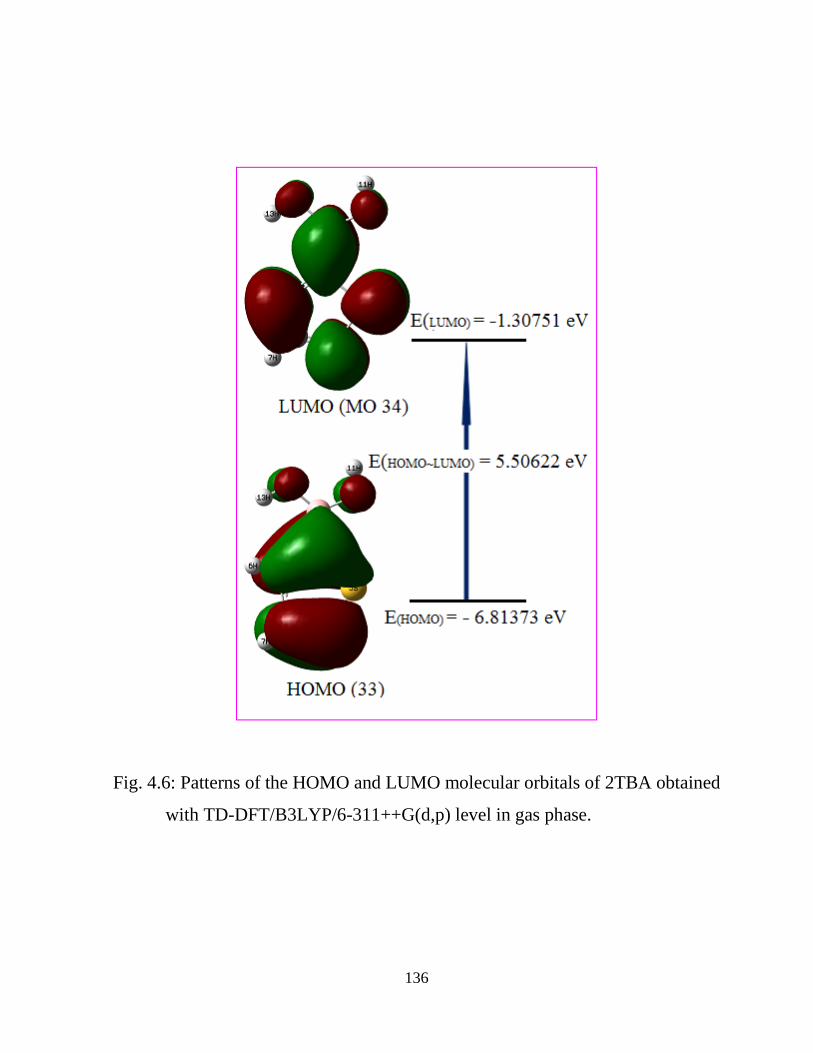
136
Fig. 4.6: Patterns of the HOMO and LUMO molecular orbitals of 2TBA obtained
with TD-DFT/B3LYP/6-311++G(d,p) level in gas phase.
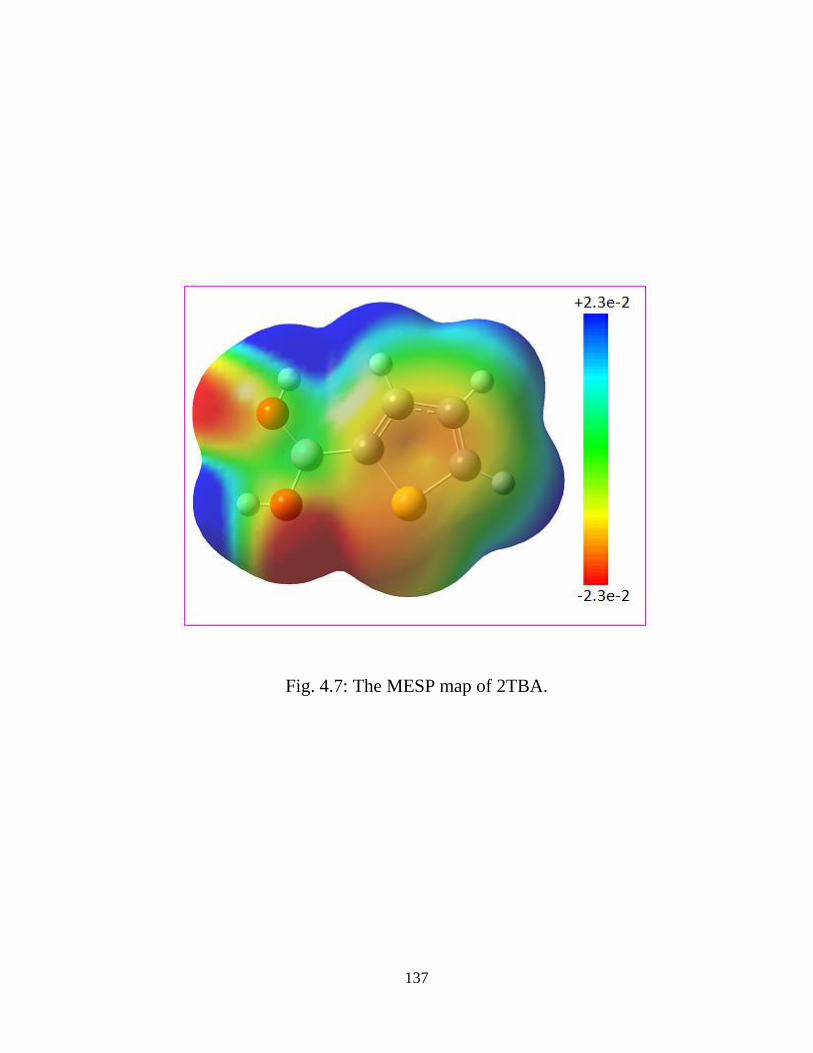
137
Fig. 4.7: The MESP map of 2TBA.
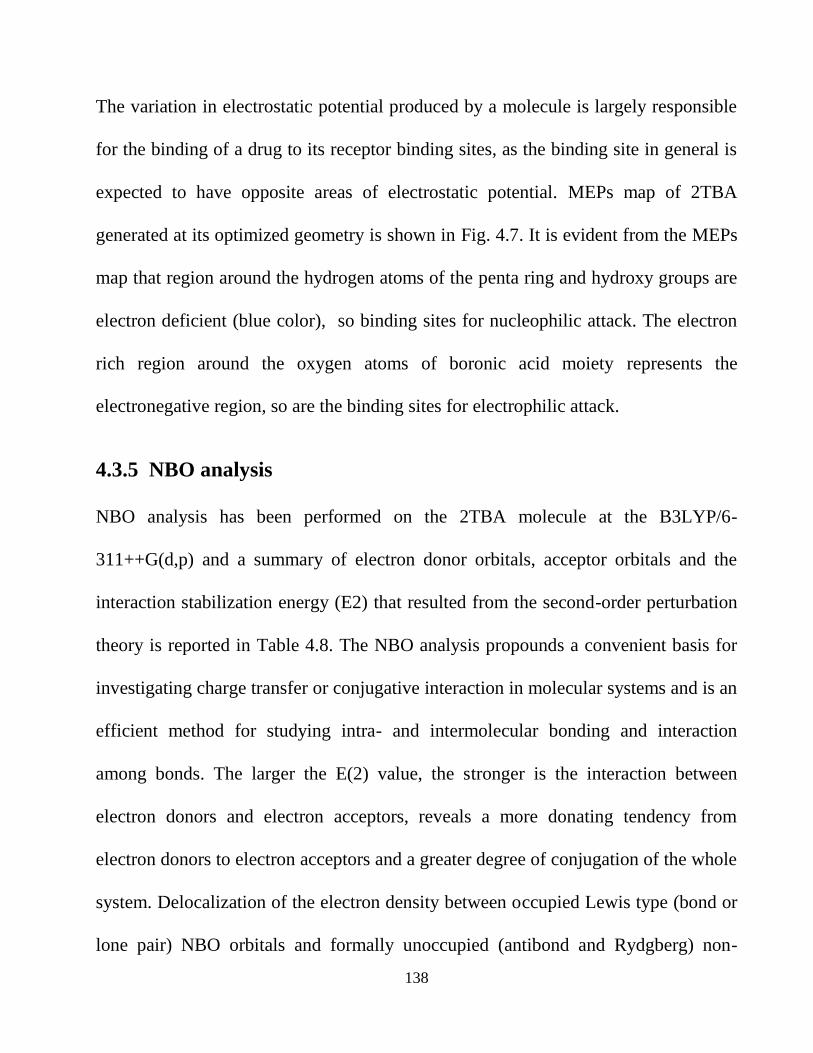
138
The variation in electrostatic potential produced by a molecule is largely responsible
for the binding of a drug to its receptor binding sites, as the binding site in general is
expected to have opposite areas of electrostatic potential. MEPs map of 2TBA
generated at its optimized geometry is shown in Fig. 4.7. It is evident from the MEPs
map that region around the hydrogen atoms of the penta ring and hydroxy groups are
electron deficient (blue color), so binding sites for nucleophilic attack. The electron
rich region around the oxygen atoms of boronic acid moiety represents the
electronegative region, so are the binding sites for electrophilic attack.
4.3.5 NBO analysis
NBO analysis has been performed on the 2TBA molecule at the B3LYP/6-
311++G(d,p) and a summary of electron donor orbitals, acceptor orbitals and the
interaction stabilization energy (E2) that resulted from the second-order perturbation
theory is reported in Table 4.8. The NBO analysis propounds a convenient basis for
investigating charge transfer or conjugative interaction in molecular systems and is an
efficient method for studying intra- and intermolecular bonding and interaction
among bonds. The larger the E(2) value, the stronger is the interaction between
electron donors and electron acceptors, reveals a more donating tendency from
electron donors to electron acceptors and a greater degree of conjugation of the whole
system. Delocalization of the electron density between occupied Lewis type (bond or
lone pair) NBO orbitals and formally unoccupied (antibond and Rydgberg) non-
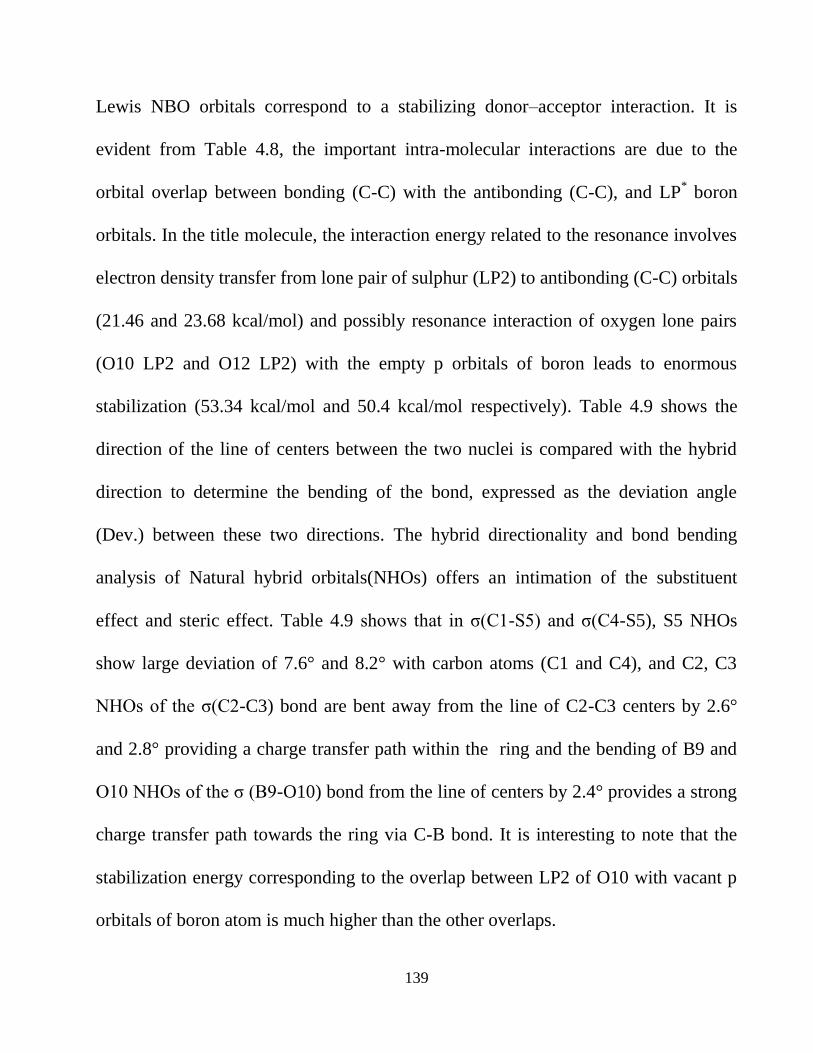
139
Lewis NBO orbitals correspond to a stabilizing donor–acceptor interaction. It is
evident from Table 4.8, the important intra-molecular interactions are due to the
orbital overlap between bonding (C-C) with the antibonding (C-C), and LP* boron
orbitals. In the title molecule, the interaction energy related to the resonance involves
electron density transfer from lone pair of sulphur (LP2) to antibonding (C-C) orbitals
(21.46 and 23.68 kcal/mol) and possibly resonance interaction of oxygen lone pairs
(O10 LP2 and O12 LP2) with the empty p orbitals of boron leads to enormous
stabilization (53.34 kcal/mol and 50.4 kcal/mol respectively). Table 4.9 shows the
direction of the line of centers between the two nuclei is compared with the hybrid
direction to determine the bending of the bond, expressed as the deviation angle
(Dev.) between these two directions. The hybrid directionality and bond bending
analysis of Natural hybrid orbitals(NHOs) offers an intimation of the substituent
effect and steric effect. Table 4.9 shows that in σ(C1-S5) and σ(C4-S5), S5 NHOs
show large deviation of 7.6° and 8.2° with carbon atoms (C1 and C4), and C2, C3
NHOs of the σ(C2-C3) bond are bent away from the line of C2-C3 centers by 2.6°
and 2.8° providing a charge transfer path within the ring and the bending of B9 and
O10 NHOs of the σ (B9-O10) bond from the line of centers by 2.4° provides a strong
charge transfer path towards the ring via C-B bond. It is interesting to note that the
stabilization energy corresponding to the overlap between LP2 of O10 with vacant p
orbitals of boron atom is much higher than the other overlaps.

140
Table 4.8: Second order perturbation theory analysis of fock matrix in NBO basis for 2TBA.
Donar(i) Type ED(i)(e) Acceptor(j) Type ED(j)(e)a
E(2)b
Kcal/mol
E(j)-E(i)c
(a.u.)
F(i,j)d
(a.u.)
C1-C2 σ 1.98229 C1-B9 σ* 0.02925 3.19 1.22 0.056
C1-C2 σ 1.98229 C2-C3 σ* 0.01671 2.79 1.27 0.053
C1-C2 σ 1.98229 C3-H7 σ* 0.01625 2.79 1.17 0.051
C1-C2 π 1.83403 B9 LP*( 1) 0.37897 18.93 0.28 0.069
C1-C2 π 1.83403 S5 RY*( 3) 0.00387 2.33 0.74 0.039
C1-C2 π 1.83403 C3-C4 π* 0.30914 15.33 0.28 0.061
C1-S5 σ 1.97648 C2-H6 σ* 0.01821 4.91 1.09 0.065
C1-S5 σ 1.97648 C4-H8 σ* 0.01315 3.06 1.1 0.052
C1-B9 σ 1.9742 C2 RY*(1) 0.00592 2.13 1.77 0.055
C1-B9 σ 1.9742 C1-C2 σ* 0.01927 3.67 1.17 0.059
C1-B9 σ 1.9742 C2-C3 σ* 0.01671 3.02 1.11 0.052
C2-C3 σ 1.9776 C1-C2 σ* 0.01927 2.95 1.28 0.055
C2-C3 σ 1.9776 C1-B9 σ* 0.02925 3.03 1.17 0.053
C2-C3 σ 1.9776 C3-C4 σ* 0.0149 2.6 1.27 0.051
C2-C3 σ 1.9776 C4-H8 σ* 0.01315 3.75 1.12 0.058
C2-H6 σ 1.97514 C1-S5 σ* 0.02817 4.94 0.76 0.055
C3-C4 σ 1.98559 C2-C3 σ* 0.01671 2.63 1.27 0.052
C3-C4 σ 1.98559 C2-H6 σ* 0.01821 3.09 1.17 0.054
C3-C4 π 1.84558 C1-C2 π* 0.33648 16.9 0.29 0.066
C3-H7 σ 1.97697 C1-C2 σ* 0.01927 2.11 1.13 0.044
C3-H7 σ 1.97697 C4-S5 σ* 0.01921 4.22 0.77 0.051
C4-S5 σ 1.98238 C3-H7 σ* 0.01625 4.43 1.11 0.063
C4-H8 σ 1.98541 C2-C3 σ* 0.01671 2.89 1.09 0.05
O10-H11 σ 1.98638 C1-B9 σ* 0.02925 2.22 1.22 0.047
O12-H13 σ 1.98601 B9 RY*(1) 0.01022 2.95 2 0.069
O12-H13 σ 1.98601 B9-O10 σ* 0.02028 3.09 1.22 0.055
S5 LP (1) 1.98455 C1-C2 σ* 0.01927 2.09 1.24 0.045
S5 LP (1) 1.98455 C3-C4 σ* 0.0149 2.07 1.23 0.045
S5 LP (2) 1.58939 C1-C2 π* 0.33648 21.46 0.26 0.068
S5 LP (2) 1.58939 C3-C4 π* 0.30914 23.68 0.25 0.071
O10 LP (1) 1.96858 B9 RY*(1) 0.01022 3.63 1.8 0.073
O10 LP (1) 1.96858 B9 RY*(2) 0.00563 2.68 1.69 0.06
O10 LP (1) 1.96858 B9-O12 σ* 0.0218 5.84 1.01 0.069
O10 LP (2) 1.8341 B9 LP*(1) 0.37897 53.34 0.33 0.124
O12 LP (1) 1.96732 B9 RY*(1) 0.01022 4.72 1.81 0.083
O12 LP (1) 1.96732 C1-B 9 σ* 0.02925 4.85 1.04 0.064
O12 LP (1) 1.96732 B9-O10 σ* 0.02028 3.18 1.03 0.051
O12 LP (2) 1.84541 B9 LP*(1) 0.37897 50.4 0.33 0.123
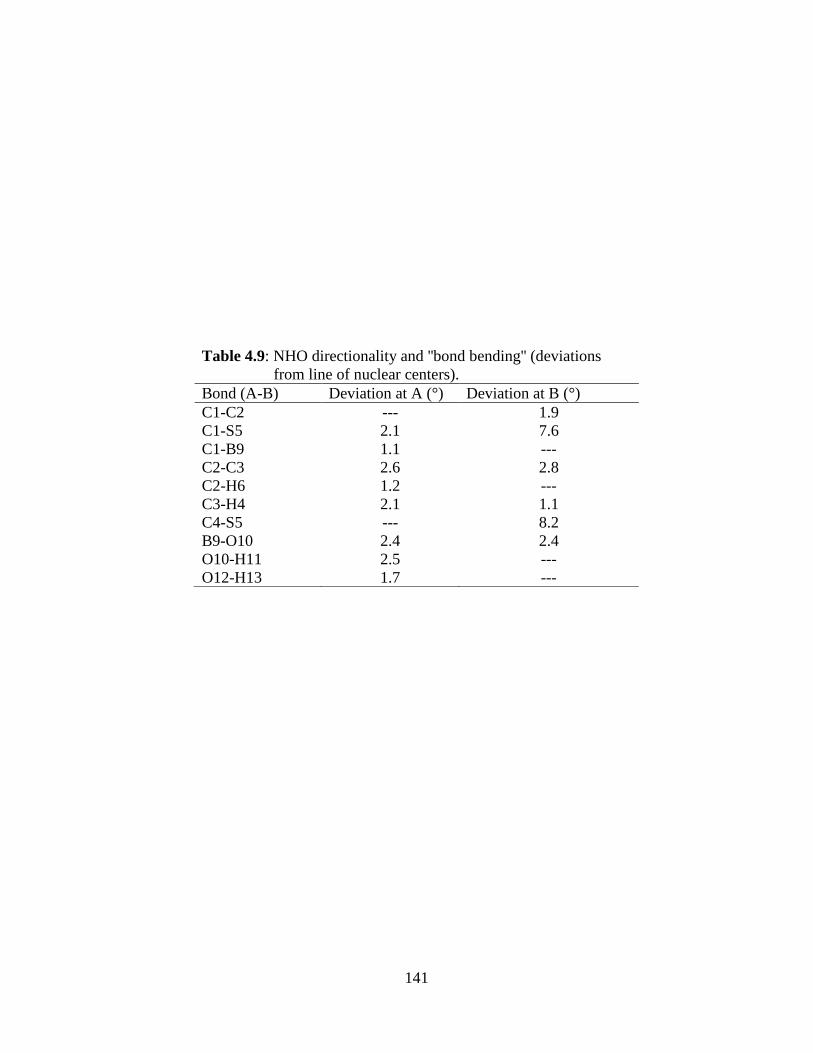
141
Table 4.9: NHO directionality and ''bond bending'' (deviations
from line of nuclear centers).
Bond (A-B) Deviation at A (°) Deviation at B (°)
C1-C2 --- 1.9
C1-S5 2.1 7.6
C1-B9 1.1 ---
C2-C3 2.6 2.8
C2-H6 1.2 ---
C3-H4 2.1 1.1
C4-S5 --- 8.2
B9-O10 2.4 2.4
O10-H11 2.5 ---
O12-H13 1.7 ---
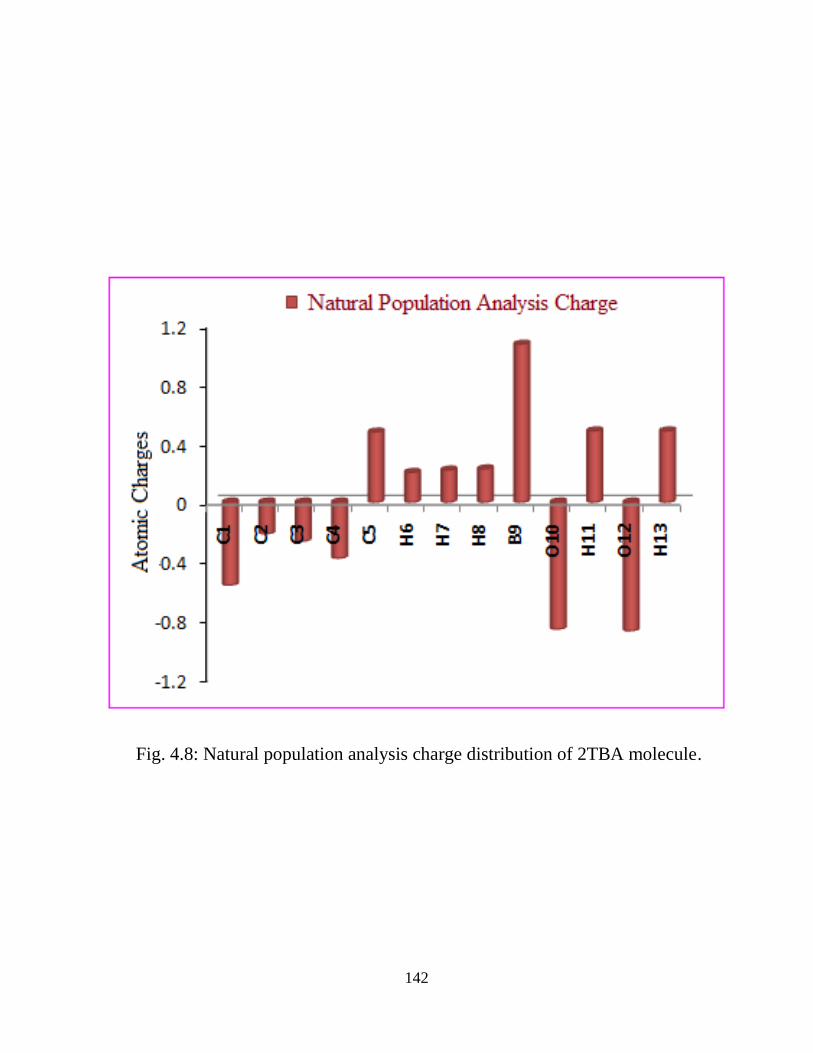
142
Fig. 4.8: Natural population analysis charge distribution of 2TBA molecule.
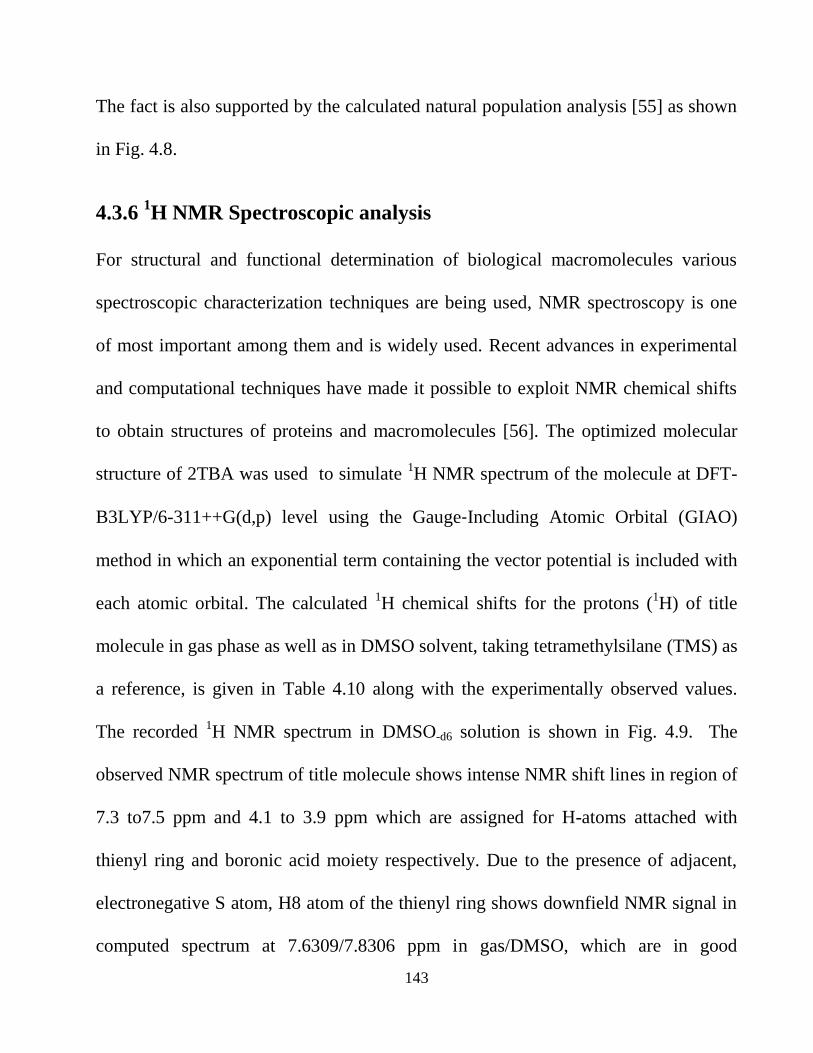
143
The fact is also supported by the calculated natural population analysis [55] as shown
in Fig. 4.8.
4.3.6 1H NMR Spectroscopic analysis
For structural and functional determination of biological macromolecules various
spectroscopic characterization techniques are being used, NMR spectroscopy is one
of most important among them and is widely used. Recent advances in experimental
and computational techniques have made it possible to exploit NMR chemical shifts
to obtain structures of proteins and macromolecules [56]. The optimized molecular
structure of 2TBA was used to simulate 1H NMR spectrum of the molecule at DFT-
B3LYP/6-311++G(d,p) level using the Gauge‐Including Atomic Orbital (GIAO)
method in which an exponential term containing the vector potential is included with
each atomic orbital. The calculated 1H chemical shifts for the protons (
1H) of title
molecule in gas phase as well as in DMSO solvent, taking tetramethylsilane (TMS) as
a reference, is given in Table 4.10 along with the experimentally observed values.
The recorded 1H NMR spectrum in DMSO-d6 solution is shown in Fig. 4.9. The
observed NMR spectrum of title molecule shows intense NMR shift lines in region of
7.3 to7.5 ppm and 4.1 to 3.9 ppm which are assigned for H-atoms attached with
thienyl ring and boronic acid moiety respectively. Due to the presence of adjacent,
electronegative S atom, H8 atom of the thienyl ring shows downfield NMR signal in
computed spectrum at 7.6309/7.8306 ppm in gas/DMSO, which are in good

144
agreement with a singlet experimental line at 7.5342 ppm. The doublet intense lines
at 7.4072–7.3907 ppm and 7.3437–7.3278 ppm are assigned to the chemical shifts of
H6 and H7 atom of the ring with corresponding calculated shifts as 7.2911/7.6720
ppm and 7.1024/7.3461 ppm respectively in gas/DMSO solvent. Both H atoms of the
boronic acid {–B(OH)2} moiety in 2TBA are found to be non-equivalent atoms so
gives distinct lines in 1H NMR spectrum. The strong singlet peaks at 3.8624 and
4.1256 ppm in experimental 1H NMR spectrum are assigned to the chemical shift of
H11 and H13 atom of boronic acid {–B(OH)2} moiety well which are in good
correlation with corresponding computed shifts at 3.5436/3.9929 ppm (H11) and
4.0252/4.6891 ppm (H13) in gas/DMSO. As 1H atom is generally localized on
periphery of the molecule and their chemical shifts would be more susceptible to
intermolecular interactions and as such the deviation between theoretical and
experimental values is justified.
4.3.7 Thermodynamical analysis
Thermodynamical properties plays significant role in various chemical and physical
phenomenon. Nowdays prediction of thermodynamical properties of chemical
systems by theoretical analysis becomes an important task for many researchers. In
the present communication statistical thermodynamic functions such as heat capacity
entropy (S) and enthalpy changes ( ) at different temperatures (100 to 700 K)
along with Zero point vibrational energy and rotational constants at standard
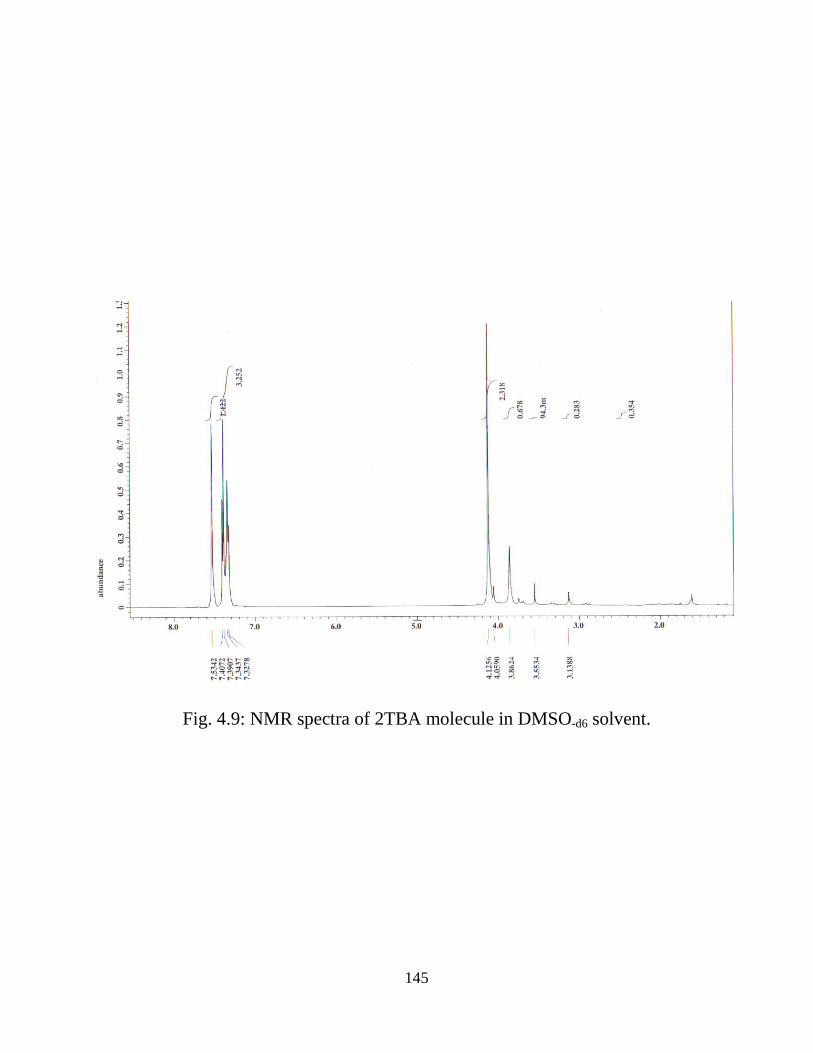
145
Fig. 4.9: NMR spectra of 2TBA molecule in DMSO-d6 solvent.
146
temperature (298.15K) for the title compound were obtained on the basis of
vibrational analysis, using DFT-B3LYP/6-311++G(d.p) method and listed in Table
4.11. The correlation between these thermodynamic properties and temperatures T is
shown in Fig. 4.10. As observed from the Table 4.11, values of heat capacity, entropy
and enthalpy increases with the increase of temperature from 100 to 700 K, which is
attributed to the enhancement of molecular vibrational intensities with the
temperature. The correlation equations between heat capacity, entropy, enthalpy
changes and temperatures were fitted by quadratic formulas and the corresponding
fitting factors (R2) for these thermodynamic properties are found to be 0.999, 1.000
and 0.9998, respectively. All the thermodynamic data may deliver useful information
for the further study on 2TBA molecule. These parameters are useful in thermo-
chemical field as they can be used to compute the other thermodynamic energies and
estimate directions of chemical reactions according to relationships of
thermodynamic functions and using second law of thermodynamics. It is worth to
mention that all thermodynamic calculations were done in gas phase and they could
not be used in solution.
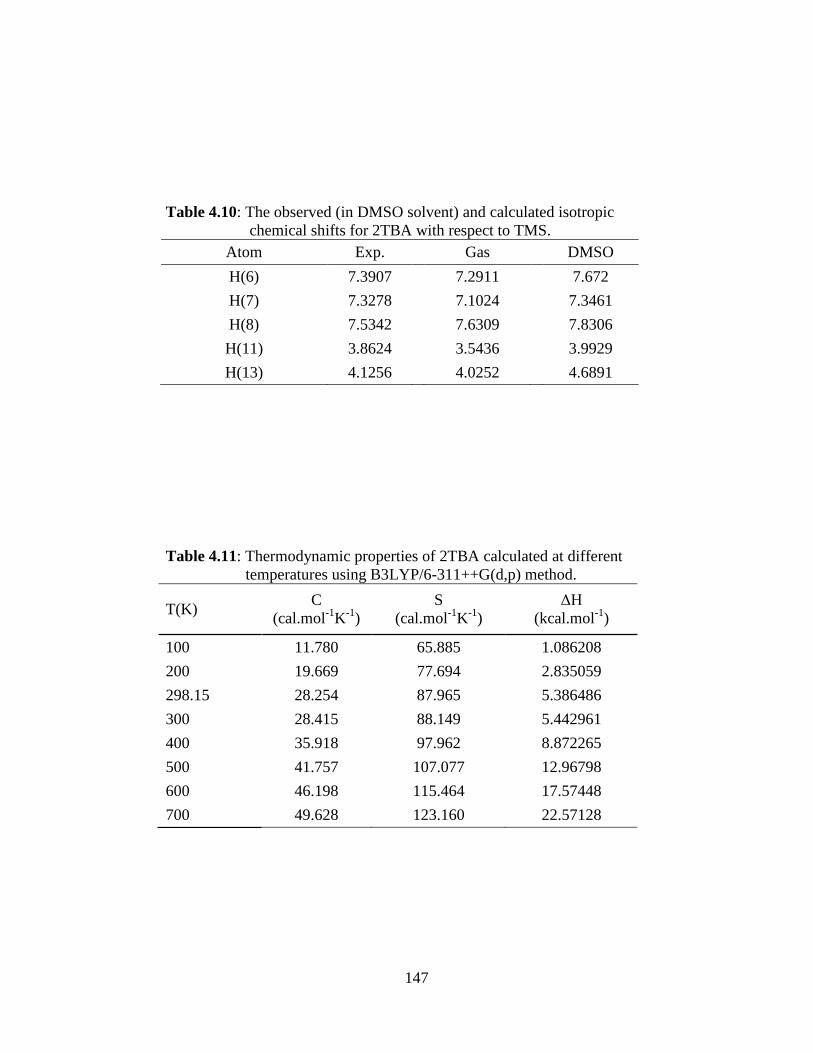
147
Table 4.10: The observed (in DMSO solvent) and calculated isotropic
chemical shifts for 2TBA with respect to TMS.
Atom Exp. Gas DMSO
H(6) 7.3907 7.2911 7.672
H(7) 7.3278 7.1024 7.3461
H(8) 7.5342 7.6309 7.8306
H(11) 3.8624 3.5436 3.9929
H(13) 4.1256 4.0252 4.6891
Table 4.11: Thermodynamic properties of 2TBA calculated at different
temperatures using B3LYP/6-311++G(d,p) method.
T(K) C
(cal.mol-1
K-1
)
S
(cal.mol-1
K-1
)
H
(kcal.mol-1
)
100 11.780 65.885 1.086208
200 19.669 77.694 2.835059
298.15 28.254 87.965 5.386486
300 28.415 88.149 5.442961
400 35.918 97.962 8.872265
500 41.757 107.077 12.96798
600 46.198 115.464 17.57448
700 49.628 123.160 22.57128
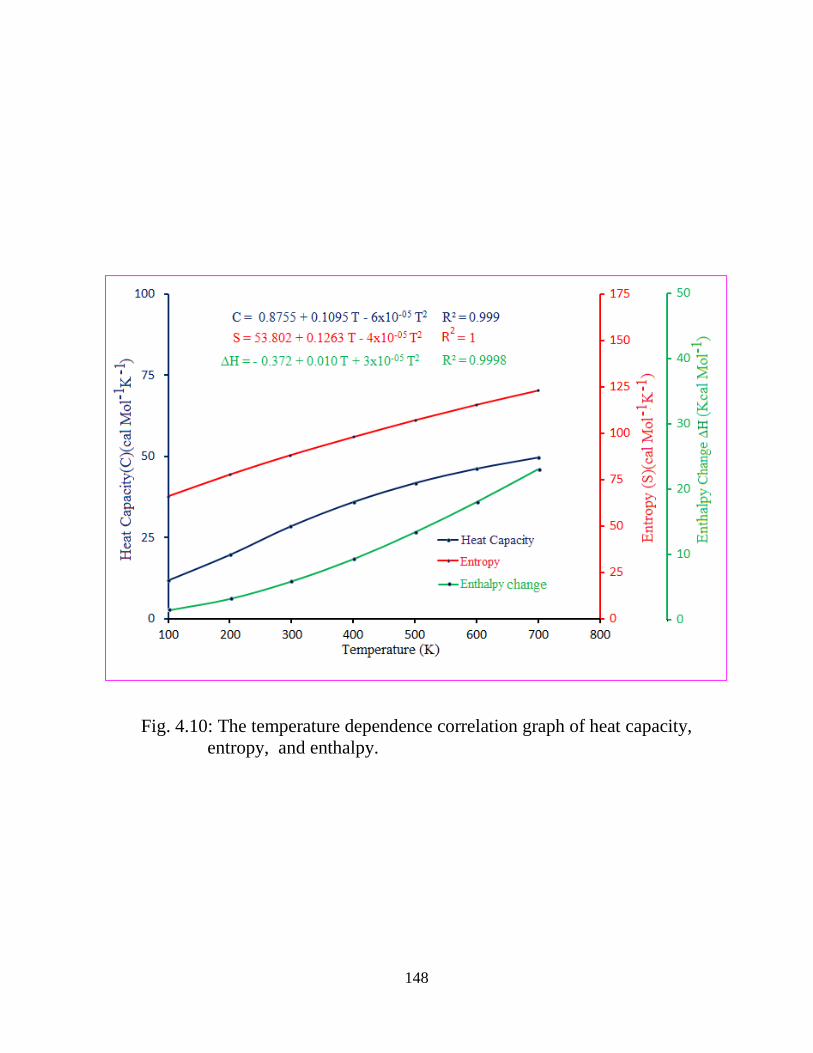
148
Fig. 4.10: The temperature dependence correlation graph of heat capacity,
entropy, and enthalpy.

149
4.4 Conclusion
In the present study, we have performed the experimental and theoretical analysis of
2TBA for the first time, using FT-IR, FT-Raman, H NMR and UV–Vis techniques
and tools of DFT. A comprehensive conformational analysis was carried out by
means of 2D as well as 3D potential energy scans. Out of four stable conformers,
Trans-Cis conformer is found to be the most stable conformer. Due to the absence of
experimental data on the structural parameters in the literature, theoretically
determined optimized geometric parameters were compared with the structurally
related compounds. Various modes of vibrations were unambiguously assigned using
the results of PED output obtained from the normal coordinate analysis. In general, a
satisfactory coherence between experimental and calculated normal modes of
vibrations has been observed. The mean polarizability and total first static
hyperpolarizability (βtotal ) of the molecule is found to be 12.3083×10⁻²⁴
esu and
0.5835×10⁻³⁰
esu respectively. The electronic properties are also calculated and
compared with the experimental UV–Vis spectrum. All the theoretical results show
good concurrence with experimental data.
150
References
1. G. Dennis, Hall: Structure, Properties, and Preparation of Boronic Acid
Derivatives overview of their Reactions and Applications, John Wiley & Sons
(2006) 1-99.
2. W. Tjarks, A.K.M. Anisuzzaman, L. Liu, S.H. Soloway, R.F. Barth, D.J.
Perkins, D.M. Adams, J. Med. Chem. 35 (1992) 16228-17861.
3. Y. Yamamoto, Pure Appl. Chem. 63 (1991) 423-426.
4. F. Alam, A.H. Soloway, R.F. Barth, N. Mafune, D.M. Adam, W.H. Knoth, J.
Med. Chem. 32 (1989) 2326-2230.
5. A.H. Soloway, R.G. Fairchild, Sci. Am. 262 (1990) 100-107.
6. D.A. Matthews, R.A. Alden, J.J. Birktoft, S.T. Freer, J. Kraut, J. Biol. Chem.
250 (1975) 7120-7126.
7. D.H. Kinder, S.K. Frank, M.M. Ames, J. Med. Chem. 33 (1990) 819-823.
8. X Sun, B. Zhu, D.K. Ji, Q. Chen, X.P. He, G.R. Chen, T.D. James. ACS Appl
Mater Interfaces. 6(13) (2014) 10078-10082.
9. X. Chen, G. Liang, D. Whitmire, J.P. Bowen, J. Phys. Org. Chem. 11 (1988)
378-386.
10. S.J. Rettig, J. Trotte, Can. J. Chem. 55 (1977) 3071-3075.
11. J.A. Faniran, H.F. Shurvell, Can. J. Chem. 46 (1968) 2089-2095.
151
12. Y. Erdogdu, M.T. Gulluoglu, M. Kurt, J. Raman Spectrosc. 40 (2009) 1615-
1623.
13. M. Kurt, J. Mol. Struct. 874 (2008) 159-169.
14. J.M. Silla, R. A. Cormanich, R,Rittner and Matheus P. Freitas, Beilstein J. Org.
Chem. 2013, 9, 1127-1134.
15. M. Karabacak, E. Kose, A. Atac, E.B. Sas, A.M. Asiri, M. Kurt, J. Mol. Struct.
1076 (2014) 358-372.
16. M. Karabacak, E. Kose, A. Atac, A.M. Asiri, M. Kurt, J. Mol. Struct. 1058
(2014) 79-96.
17. A.D. Becke, J. Chem. Phys. 98 (1993) 5648-5652.
18. C. Lee, W. Yang, R.G. Parr, Phys. Rev. B 37 (1998) 785-789.
19. B. Miehlich, A. Savin, H. Stoll, H. Preuss, Chem. Phys. Lett. 157 (1989) 200-
206.
20. W. Kohn, L.J. Sham, Phys. Rev. 140 (1965) A1133-A1138.
21. M.J. Frisch et al., Gaussian Inc., Wallingford, CT, 2009.
22. E. Frisch, H.P. Hratchian, R.D. Dennington II, T.A. Keith, J. Millam, B.
Nielsen, A.J. Holder, J. Hiscocks, Gaussian, Inc., GaussView Version 5.0.8,
2009.
23. R. Gosh, S.H. Simonsen, Acta Cryst. C49 (1993) 1031-1032.
24. S. J. Retting, J. Trotter, Can. J. Chem. 55 (1977)3071-3075.
152
25. M. Karabacak, M. Kurt, M. Cinar, A. Coruh, Mol. Phys. 107 (2009) 253-264.
26. N. Sundaraganesan, S. Ilakiamani, H. Saleem, P.M. Wojciechowski, D.
Michalska, Spectrochim. Acta A 61 (2005) 2995-3001.
27. J.B. Foresman, A. Frisch, Exploring Chemistry with Electronic Structure
Methods, second ed., Gaussian Inc., Pittsburgh, PA, 1996.
28. G. Keresztury, S. Holly, J. Varga, G. Besenyei, A.Y. Wang, J.R. Durig,
Spectrochim. Acta 49A (1993) 2007-2026.
29. T. Sundius, J. Mol. Spectrosc. 82 (1980) 138-151.
30. T. Sundius, J. Mol. Struct. 218 (1990) 321-336.
31. T. Sundius, Vib. Spectrosc. 29 (2002) 89-95.
32. E.D. Glendening, C.R. Landis, F. Weinhold, WIREs Comput. Mol. Sci. 2
(2011) 1-42.
33. H.W. Thomson, P. Torking ton, J. Chem. Soc. 171 (1945) 640-645.
34. P. Pulay, G. Fogarasi, F. Pang, and J. E. Boggs, J. Am. Chem. Soc. 101 (1979)
2550-2560.
35. B. Stuart, Infrared Spectroscopy: Fundamentals and Applications, Wiley India
Ed., 2010.
36. U. Rani, M. Karabacak, O. Tanrıverdi, M. Kurt, N. Sundaraganesan,
Spectrochimica Acta Part A 92 (2012) 67-77.
153
37. M. Karabacak, E. Kose, A. Atac, M.A. Cipiloglu, M. Kurt, Spectrochim. Acta
Part A 97 (2012) 892-908.
38. M. Kurt, T.R. Sertbakan, M. Ozduran, M. Karabacak, J. Mol. Struct. 921
(2009) 178-187.
39. M. Karabacak, L. Sinha, O. Prasad, A.M. Asiri, M. Cinar, Spectrochim. Acta A
115 (2013) 753-766.
40. D.L. Pavia, G.M. Lampman, G.S. Kriz, J.R. Vyvyan, Introduction to
Spectroscopy, BROOKS/COLE CENGAGE Learing, USA, 2009.
41. B.H. Stuart, Infrared Spectroscopy: fundamentals and Applications,
JohnWilley & Sons, England, 2004.
42. R.M. Silverstein, F.X. Webster, Spectroscopic Identification of Organic
Compound, sixth ed., John Willey & Sons, New York, 1998.
43. G. Varsanyi, Vibrational Spectra of Benzene Derivatives, Academic Pres, New
York 1969.
44. L.J. Bellamy, The Infrared Spectra of Complex Molecules, third ed., Wiley,
New York, 1975.
45. N.B. Colthup, L.H. Daly, E. Wiberley, Introduction to Infrared and Raman
Spectroscopy, Academic Press, New York, 1964.
46. O. Prasad, A. Kumar, V. Narayan, H. N. Mishra, R. K. Srivastava and L.
Sinha, J. Chem. Pharm. Res., 3 (2011) 668-677
154
47. M. Karabacak, Z. Cinar, M. Kurt, S. Sudha, N. Sundaraganesan, Spectrochim.
Acta A 85 (2012) 179-189.
48. D. A. Kleinman, Phys. Rev.126 (1962) 1977-1979.
49. J.S. Murray, K. Sen, Molecular Electrostatic Potentials, Concepts and
Applications, Elsevier, Amsterdam, 1996.
50. S.R. Ggadre and I.H. Shrivastava, Shapes and sizes of molecular anions via
topographical analysis of electrostatic potential, J. Chem. Phys. 94 (1991)
4384-4390.
51. I. Alkorta and J.J. Perez, Molecular polarization potential maps of the nucleic
acid bases, Int. J. Quant. Chem. 57 (1996) 123-135.
52. E. Scrocco and J. Tomasi, Advances in Quantum Chemistry, Vol. 2, P.
Lowdin, ed., Academic Press, New York, 1978.
53. F.J. Luque, M. Orozco, P.K. Bhadane, and S.R. Gadre, J. Phys. Chem. 97
(1993) 9380-9384.
54. J. Sponer and P. Hobza, Int. J. Quant. Chem. 57 (1996) 959-970.
55. A.E. Reed, R.B. Weinstock, F. Weinhold, J. Chem. Phys. 83 (1985) 735-746.
56. T. Schlick, Molecular Modeling and Simulation: An Interdisciplinary Guide,
Vol. 21, Second ed., Springer, New York, 2010.

155
Structural, vibrational and
electronic properties of
Succinimide, N-Hydroxy
Succinimide and N-Methyl
Succinimide by density
functional theory:
A comparative study
156
5.1 Introduction
Succinimide and its N-substituted derivatives are significant structural units in many
important compounds [1,2] including plant growth stimulators [3], additives for
lubricating oils [4], corrosion inhibitors [5], sychoanaleptic agents [6], drugs for
memory enhancement [7], antitumor representatives such as epipodophyllotoxin
glycoside [8,9]. N-hydroxy-succinimide (NHS) and its acylated derivatives are useful
reagents for the synthesis of peptides and antibiotics. NHS is also used for the
preparation of active esters and as an additive to suppress racemisation in peptide
coupling [10]. NHS can selectively deliver an attached moiety to mild nucleophilic
species (amino acids, amines and thiols) under relatively mild reaction conditions.
The scaffold may then be used as a basis for the separation and subsequent detection
of the nucleophile [11].
The work reported in this Chapter deals with the comprehensive comparative
study of the structural, electronic and vibrational properties of Succinimide, N-
Hydroxy-succinimide (NHS) and N-Methyl-succinimide (NMS) due to their
biological and medical importance. The structure and harmonic wave numbers were
determined and analyzed at the density functional theory (DFT) level employing the
basis set 6-311++G(d,p). The optimized geometry of all the three molecules and their
molecular properties such as equilibrium energy, frontier orbital energy gap,
molecular electrostatic potential (MESP) energy map, dipole moment, polarizability
157
and first static hyperpolarizability were calculated and discussed. A Complete
vibrational analysis of the molecules was performed by combining the experimental
IR spectroscopic data and the quantum chemical calculations. DFT based calculations
provide not only the qualitative but also the quantitative understanding of energy
distribution of each vibrational mode on the basis of potential energy distribution
(PED) [12-14]. The thermodynamic properties of the studied compounds at different
temperatures were also calculated.
5.2 Computational and Experimental Details
The molecular structure optimization of the three compound and corresponding
vibrational harmonic frequencies were calculated using DFT with Becke-3-Lee-
Yang-Parr (B3LYP) functionals [15,16] with 6-311++G(d,p) basis sets using
GAUSSIAN09W [17] program package. Initial geometry for the N-hydroxy-
succinimide (NHS) and N-methyl-succinimide (NMS) were generated from standard
geometrical parameters [18]. As Succinimide has no flexible side chain,
conformational search is not required as such for it. The structure of later two were
obtained with the help of potential energy surface scan at B3LYP level, adopting the
standard 6-31G(d) basis set. This geometry was then re-optimized at B3LYP level,
using basis set 6-311++G (d,p). The optimized geometrical parameters, rotational
constants, fundamental vibrational wavemunbers, IR intensity, molecular orbitals and
other thermodynamic parameters were calculated. The experimental FT-IR spectrum
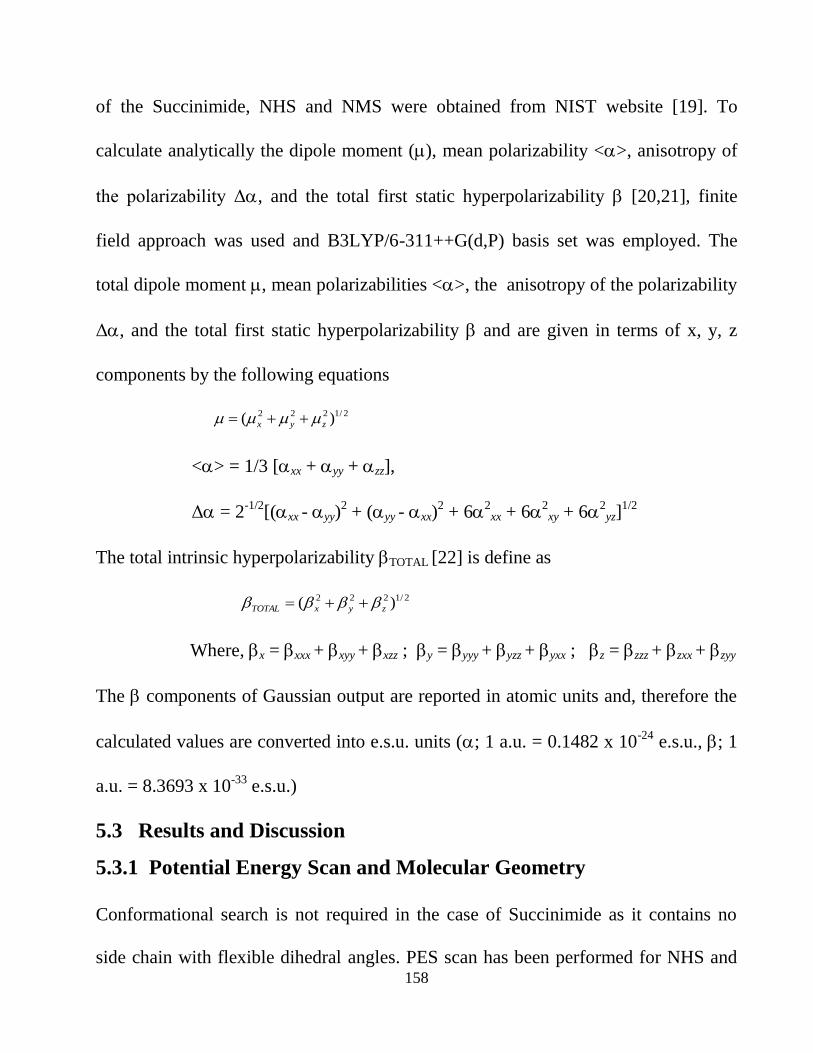
158
of the Succinimide, NHS and NMS were obtained from NIST website [19]. To
calculate analytically the dipole moment (), mean polarizability <>, anisotropy of
the polarizability , and the total first static hyperpolarizability [20,21], finite
field approach was used and B3LYP/6-311++G(d,P) basis set was employed. The
total dipole moment , mean polarizabilities <>, the anisotropy of the polarizability
, and the total first static hyperpolarizability and are given in terms of x, y, z
components by the following equations
2/1222 )( zyx
<> = 1/3 [xx + yy + zz],
= 2-1/2
[(xx - yy)2 + (yy - xx)
2 + 6
2xx + 6
2xy + 6
2yz]
1/2
The total intrinsic hyperpolarizability TOTAL [22] is define as
2/1222 )( zyxTOTAL
Where, x = xxx + xyy + xzz ; y = yyy + yzz + yxx ; z = zzz + zxx + zyy
The components of Gaussian output are reported in atomic units and, therefore the
calculated values are converted into e.s.u. units (; 1 a.u. = 0.1482 x 10⁻²⁴
e.s.u., ; 1
a.u. = 8.3693 x 10⁻³³
e.s.u.)
5.3 Results and Discussion
5.3.1 Potential Energy Scan and Molecular Geometry
Conformational search is not required in the case of Succinimide as it contains no
side chain with flexible dihedral angles. PES scan has been performed for NHS and
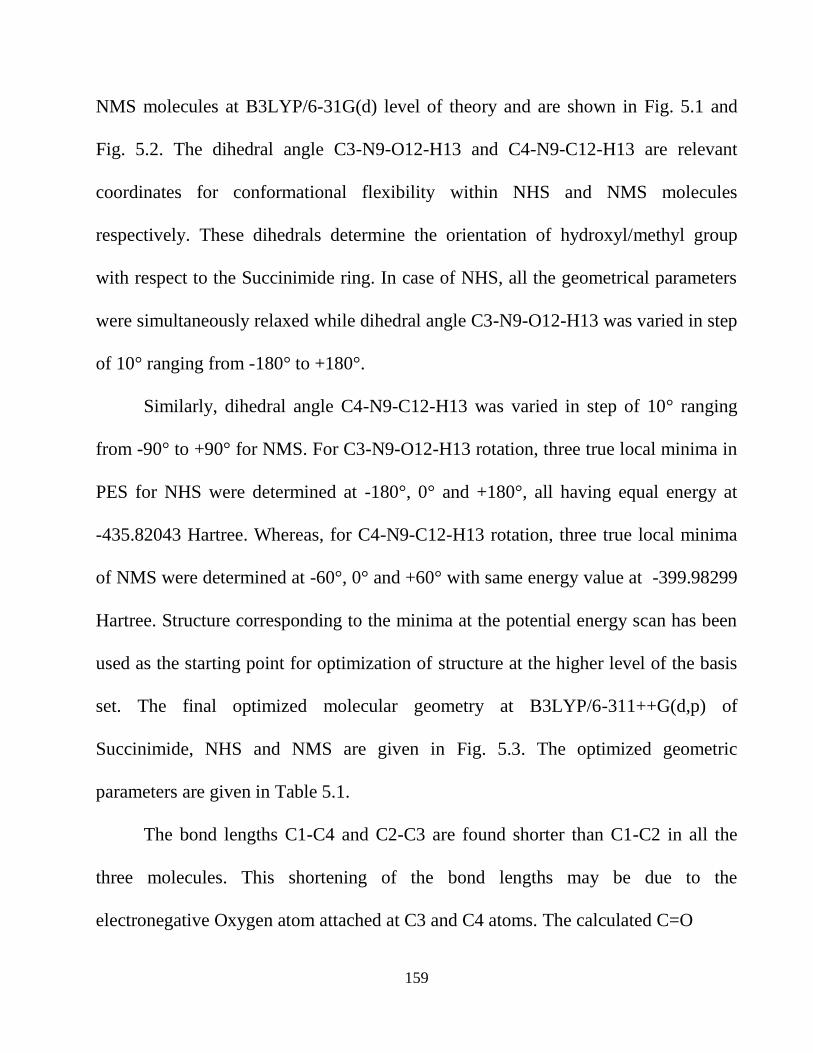
159
NMS molecules at B3LYP/6-31G(d) level of theory and are shown in Fig. 5.1 and
Fig. 5.2. The dihedral angle C3-N9-O12-H13 and C4-N9-C12-H13 are relevant
coordinates for conformational flexibility within NHS and NMS molecules
respectively. These dihedrals determine the orientation of hydroxyl/methyl group
with respect to the Succinimide ring. In case of NHS, all the geometrical parameters
were simultaneously relaxed while dihedral angle C3-N9-O12-H13 was varied in step
of 10° ranging from -180° to +180°.
Similarly, dihedral angle C4-N9-C12-H13 was varied in step of 10° ranging
from -90° to +90° for NMS. For C3-N9-O12-H13 rotation, three true local minima in
PES for NHS were determined at -180°, 0° and +180°, all having equal energy at
-435.82043 Hartree. Whereas, for C4-N9-C12-H13 rotation, three true local minima
of NMS were determined at -60°, 0° and +60° with same energy value at -399.98299
Hartree. Structure corresponding to the minima at the potential energy scan has been
used as the starting point for optimization of structure at the higher level of the basis
set. The final optimized molecular geometry at B3LYP/6-311++G(d,p) of
Succinimide, NHS and NMS are given in Fig. 5.3. The optimized geometric
parameters are given in Table 5.1.
The bond lengths C1-C4 and C2-C3 are found shorter than C1-C2 in all the
three molecules. This shortening of the bond lengths may be due to the
electronegative Oxygen atom attached at C3 and C4 atoms. The calculated C=O
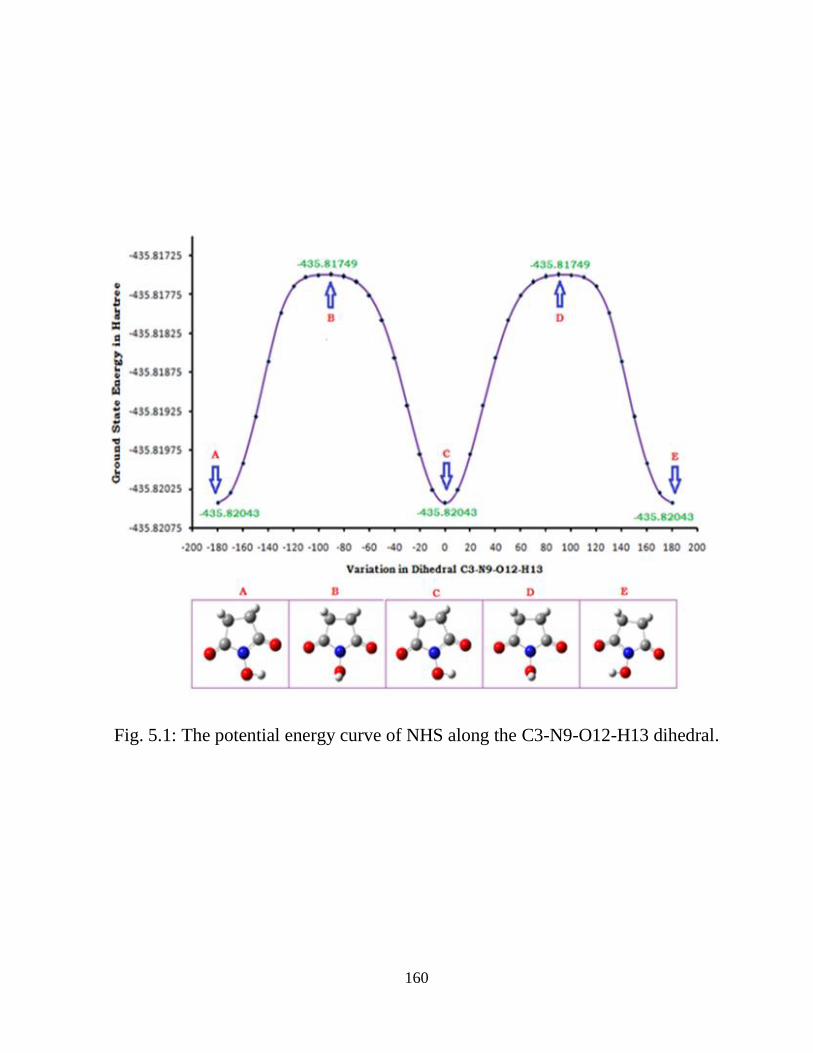
160
Fig. 5.1: The potential energy curve of NHS along the C3-N9-O12-H13 dihedral.
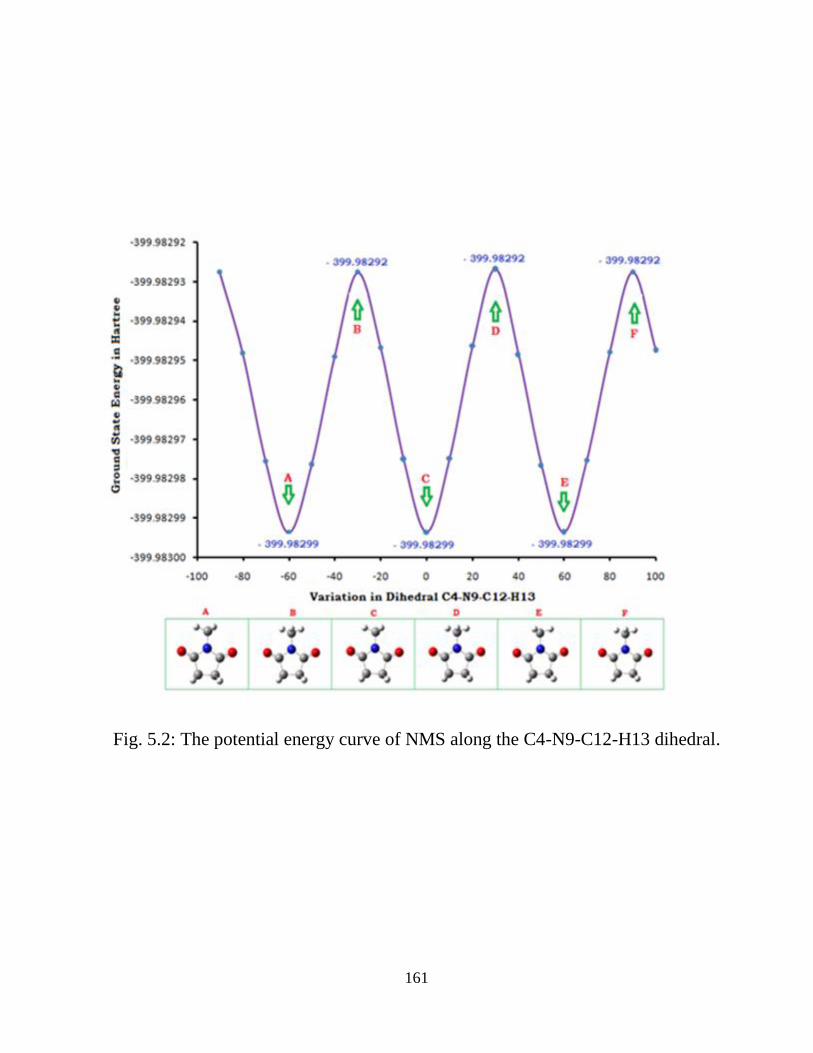
161
Fig. 5.2: The potential energy curve of NMS along the C4-N9-C12-H13 dihedral.
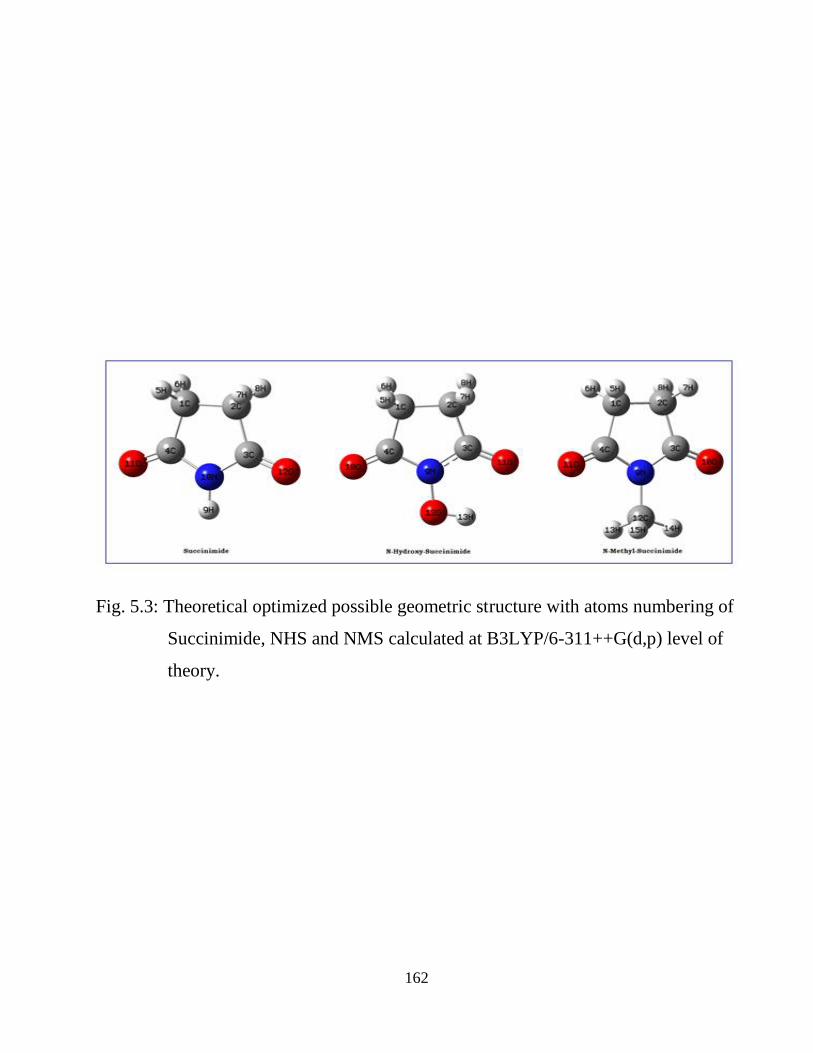
162
Fig. 5.3: Theoretical optimized possible geometric structure with atoms numbering of
Succinimide, NHS and NMS calculated at B3LYP/6-311++G(d,p) level of
theory.
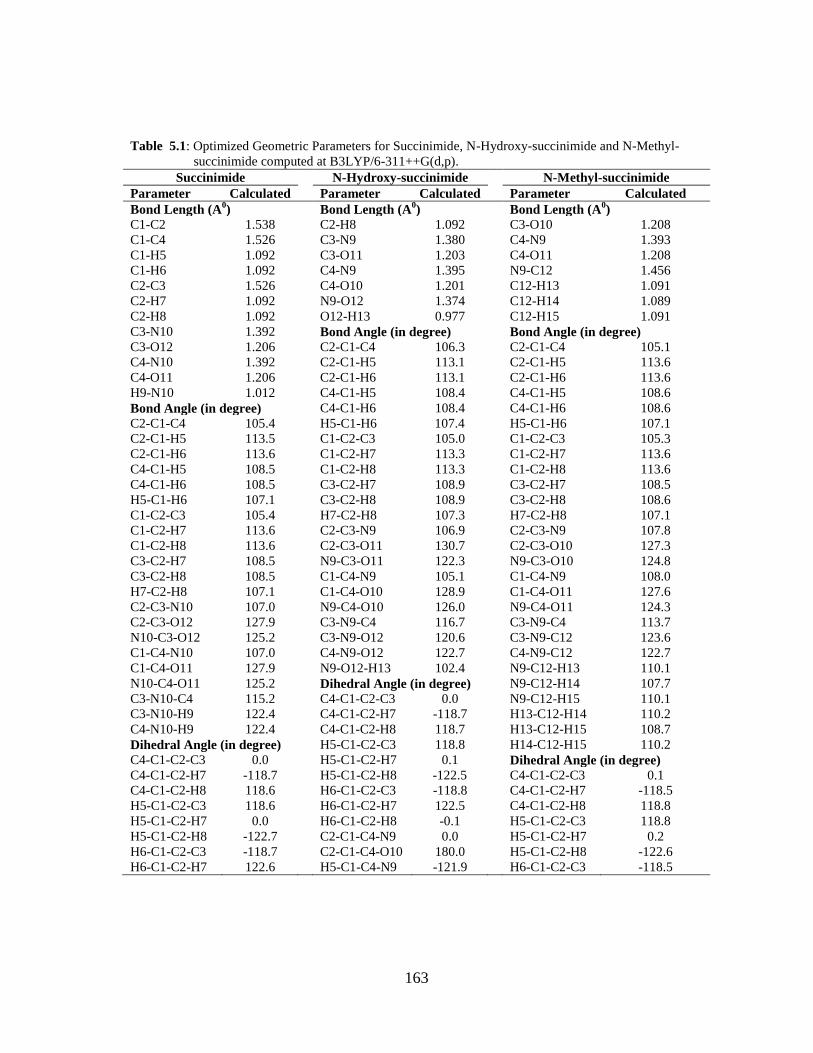
163
Table 5.1: Optimized Geometric Parameters for Succinimide, N-Hydroxy-succinimide and N-Methyl-
succinimide computed at B3LYP/6-311++G(d,p).
Succinimide
N-Hydroxy-succinimide
N-Methyl-succinimide
Parameter Calculated
Parameter Calculated
Parameter Calculated
Bond Length (A0)
Bond Length (A0)
Bond Length (A0)
C1-C2 1.538
C2-H8 1.092
C3-O10 1.208
C1-C4 1.526
C3-N9 1.380
C4-N9 1.393
C1-H5 1.092
C3-O11 1.203
C4-O11 1.208
C1-H6 1.092
C4-N9 1.395
N9-C12 1.456
C2-C3 1.526
C4-O10 1.201
C12-H13 1.091
C2-H7 1.092
N9-O12 1.374
C12-H14 1.089
C2-H8 1.092
O12-H13 0.977
C12-H15 1.091
C3-N10 1.392
Bond Angle (in degree)
Bond Angle (in degree)
C3-O12 1.206
C2-C1-C4 106.3
C2-C1-C4 105.1
C4-N10 1.392
C2-C1-H5 113.1
C2-C1-H5 113.6
C4-O11 1.206
C2-C1-H6 113.1
C2-C1-H6 113.6
H9-N10 1.012
C4-C1-H5 108.4
C4-C1-H5 108.6
Bond Angle (in degree)
C4-C1-H6 108.4
C4-C1-H6 108.6
C2-C1-C4 105.4
H5-C1-H6 107.4
H5-C1-H6 107.1
C2-C1-H5 113.5
C1-C2-C3 105.0
C1-C2-C3 105.3
C2-C1-H6 113.6
C1-C2-H7 113.3
C1-C2-H7 113.6
C4-C1-H5 108.5
C1-C2-H8 113.3
C1-C2-H8 113.6
C4-C1-H6 108.5
C3-C2-H7 108.9
C3-C2-H7 108.5
H5-C1-H6 107.1
C3-C2-H8 108.9
C3-C2-H8 108.6
C1-C2-C3 105.4
H7-C2-H8 107.3
H7-C2-H8 107.1
C1-C2-H7 113.6
C2-C3-N9 106.9
C2-C3-N9 107.8
C1-C2-H8 113.6
C2-C3-O11 130.7
C2-C3-O10 127.3
C3-C2-H7 108.5
N9-C3-O11 122.3
N9-C3-O10 124.8
C3-C2-H8 108.5
C1-C4-N9 105.1
C1-C4-N9 108.0
H7-C2-H8 107.1
C1-C4-O10 128.9
C1-C4-O11 127.6
C2-C3-N10 107.0
N9-C4-O10 126.0
N9-C4-O11 124.3
C2-C3-O12 127.9
C3-N9-C4 116.7
C3-N9-C4 113.7
N10-C3-O12 125.2
C3-N9-O12 120.6
C3-N9-C12 123.6
C1-C4-N10 107.0
C4-N9-O12 122.7
C4-N9-C12 122.7
C1-C4-O11 127.9
N9-O12-H13 102.4
N9-C12-H13 110.1
N10-C4-O11 125.2
Dihedral Angle (in degree)
N9-C12-H14 107.7
C3-N10-C4 115.2
C4-C1-C2-C3 0.0
N9-C12-H15 110.1
C3-N10-H9 122.4
C4-C1-C2-H7 -118.7
H13-C12-H14 110.2
C4-N10-H9 122.4
C4-C1-C2-H8 118.7
H13-C12-H15 108.7
Dihedral Angle (in degree)
H5-C1-C2-C3 118.8
H14-C12-H15 110.2
C4-C1-C2-C3 0.0
H5-C1-C2-H7 0.1
Dihedral Angle (in degree)
C4-C1-C2-H7 -118.7
H5-C1-C2-H8 -122.5
C4-C1-C2-C3 0.1
C4-C1-C2-H8 118.6
H6-C1-C2-C3 -118.8
C4-C1-C2-H7 -118.5
H5-C1-C2-C3 118.6
H6-C1-C2-H7 122.5
C4-C1-C2-H8 118.8
H5-C1-C2-H7 0.0
H6-C1-C2-H8 -0.1
H5-C1-C2-C3 118.8
H5-C1-C2-H8 -122.7
C2-C1-C4-N9 0.0
H5-C1-C2-H7 0.2
H6-C1-C2-C3 -118.7
C2-C1-C4-O10 180.0
H5-C1-C2-H8 -122.6
H6-C1-C2-H7 122.6
H5-C1-C4-N9 -121.9
H6-C1-C2-C3 -118.5
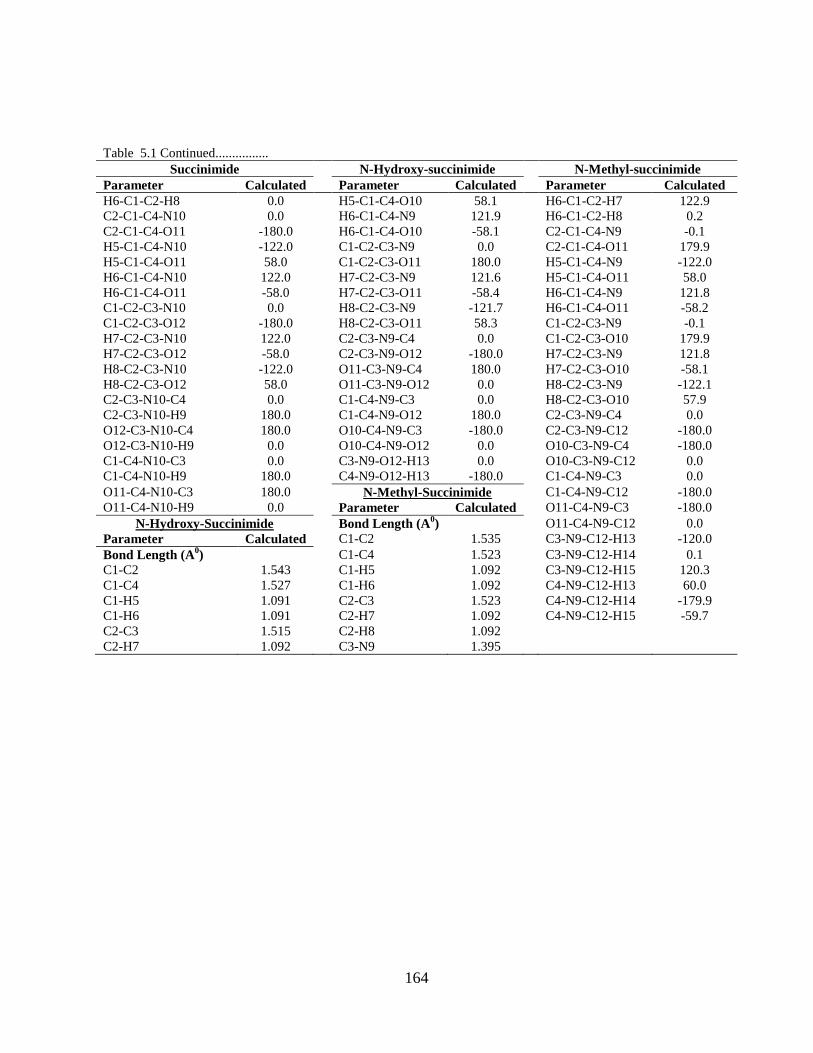
164
Table 5.1 Continued................
Succinimide
N-Hydroxy-succinimide
N-Methyl-succinimide
Parameter Calculated
Parameter Calculated
Parameter Calculated
H6-C1-C2-H8 0.0
H5-C1-C4-O10 58.1
H6-C1-C2-H7 122.9
C2-C1-C4-N10 0.0
H6-C1-C4-N9 121.9
H6-C1-C2-H8 0.2
C2-C1-C4-O11 -180.0
H6-C1-C4-O10 -58.1
C2-C1-C4-N9 -0.1
H5-C1-C4-N10 -122.0
C1-C2-C3-N9 0.0
C2-C1-C4-O11 179.9
H5-C1-C4-O11 58.0
C1-C2-C3-O11 180.0
H5-C1-C4-N9 -122.0
H6-C1-C4-N10 122.0
H7-C2-C3-N9 121.6
H5-C1-C4-O11 58.0
H6-C1-C4-O11 -58.0
H7-C2-C3-O11 -58.4
H6-C1-C4-N9 121.8
C1-C2-C3-N10 0.0
H8-C2-C3-N9 -121.7
H6-C1-C4-O11 -58.2
C1-C2-C3-O12 -180.0
H8-C2-C3-O11 58.3
C1-C2-C3-N9 -0.1
H7-C2-C3-N10 122.0
C2-C3-N9-C4 0.0
C1-C2-C3-O10 179.9
H7-C2-C3-O12 -58.0
C2-C3-N9-O12 -180.0
H7-C2-C3-N9 121.8
H8-C2-C3-N10 -122.0
O11-C3-N9-C4 180.0
H7-C2-C3-O10 -58.1
H8-C2-C3-O12 58.0
O11-C3-N9-O12 0.0
H8-C2-C3-N9 -122.1
C2-C3-N10-C4 0.0
C1-C4-N9-C3 0.0
H8-C2-C3-O10 57.9
C2-C3-N10-H9 180.0
C1-C4-N9-O12 180.0
C2-C3-N9-C4 0.0
O12-C3-N10-C4 180.0
O10-C4-N9-C3 -180.0
C2-C3-N9-C12 -180.0
O12-C3-N10-H9 0.0
O10-C4-N9-O12 0.0
O10-C3-N9-C4 -180.0
C1-C4-N10-C3 0.0
C3-N9-O12-H13 0.0
O10-C3-N9-C12 0.0
C1-C4-N10-H9 180.0
C4-N9-O12-H13 -180.0
C1-C4-N9-C3 0.0
O11-C4-N10-C3 180.0
N-Methyl-Succinimide
C1-C4-N9-C12 -180.0
O11-C4-N10-H9 0.0
Parameter Calculated
O11-C4-N9-C3 -180.0
N-Hydroxy-Succinimide
Bond Length (A0)
O11-C4-N9-C12 0.0
Parameter Calculated
C1-C2 1.535
C3-N9-C12-H13 -120.0
Bond Length (A0)
C1-C4 1.523
C3-N9-C12-H14 0.1
C1-C2 1.543
C1-H5 1.092
C3-N9-C12-H15 120.3
C1-C4 1.527
C1-H6 1.092
C4-N9-C12-H13 60.0
C1-H5 1.091
C2-C3 1.523
C4-N9-C12-H14 -179.9
C1-H6 1.091
C2-H7 1.092
C4-N9-C12-H15 -59.7
C2-C3 1.515
C2-H8 1.092
C2-H7 1.092
C3-N9 1.395
165
bond lengths in all the three molecules vary from 1.201-1.208 Å and are close to
standard values 1.220 Å [23,24]. The C-H bond lengths remained between 1.091 Å
and 1.092 Å in all three molecules under investigation. The calculated bond lengths
are in good agreement with those reported in [1]. The interior C-C-C angles in
Succinimide and the two derivatives vary from 105.0°-105.4° except the one C2-C1-
C4 (106.3°) in NHS. The calculated values of C-N-C angle in NMS (113.7°) are
found shorter than Succinimide and NHS which are 115.2° and 116.7° respectively.
In NHS, the angle O11-C3-N9 (122.3°) is found to be smaller than angle O10-C4-N9
(126.0°) which shows a strong possibility of hydrogen bonding between the partially
negative oxygen atom O11 of the carbonyl group and the hydrogen atom H13 of the
OH group attached to nitrogen N9.
5.3.2 Electronic Properties
The most important orbitals in a molecule are the frontier molecular orbitals, called
highest occupied molecular orbital (HOMO) and lowest unoccupied molecular orbital
(LUMO). These orbitals determine the way how molecule interacts with other
species. The frontier orbital gap helps to characterize the chemical reactivity and
kinetic stability of the molecule. A molecule with a small frontier orbital gap is more
polarizable and is generally associated with a high chemical reactivity and low kinetic
stability so termed as soft molecule [25].
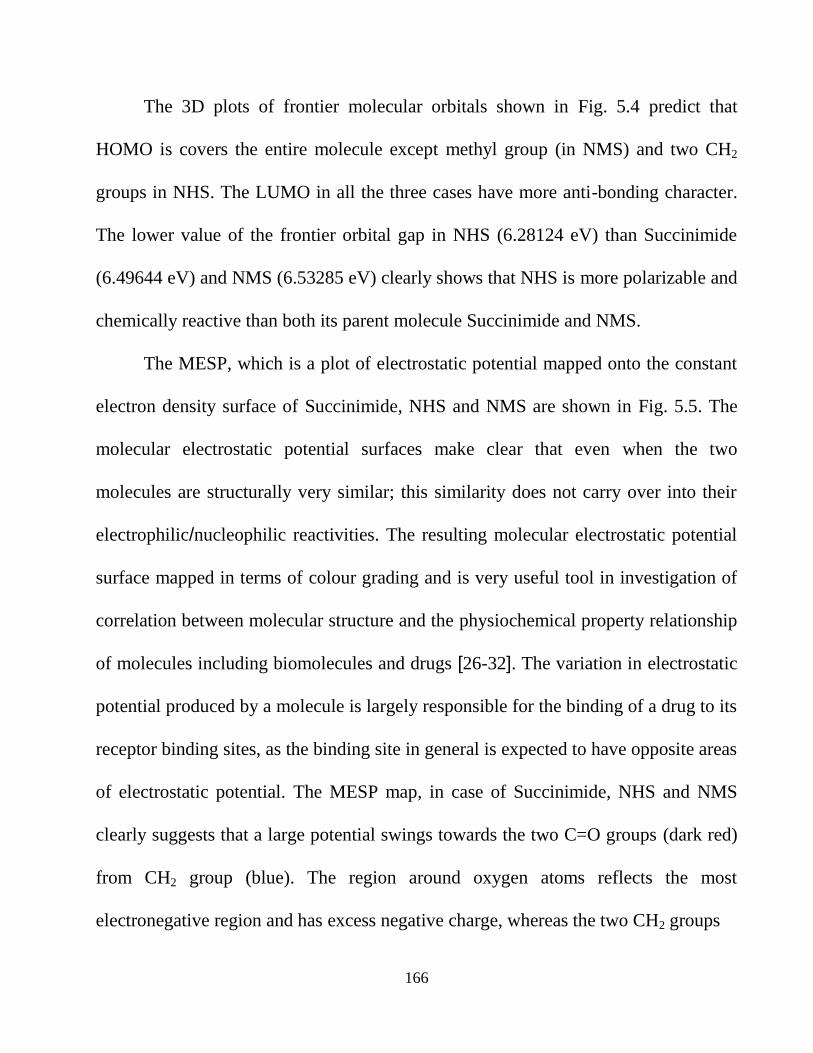
166
The 3D plots of frontier molecular orbitals shown in Fig. 5.4 predict that
HOMO is covers the entire molecule except methyl group (in NMS) and two CH2
groups in NHS. The LUMO in all the three cases have more anti-bonding character.
The lower value of the frontier orbital gap in NHS (6.28124 eV) than Succinimide
(6.49644 eV) and NMS (6.53285 eV) clearly shows that NHS is more polarizable and
chemically reactive than both its parent molecule Succinimide and NMS.
The MESP, which is a plot of electrostatic potential mapped onto the constant
electron density surface of Succinimide, NHS and NMS are shown in Fig. 5.5. The
molecular electrostatic potential surfaces make clear that even when the two
molecules are structurally very similar; this similarity does not carry over into their
electrophilic/nucleophilic reactivities. The resulting molecular electrostatic potential
surface mapped in terms of colour grading and is very useful tool in investigation of
correlation between molecular structure and the physiochemical property relationship
of molecules including biomolecules and drugs [26-32]. The variation in electrostatic
potential produced by a molecule is largely responsible for the binding of a drug to its
receptor binding sites, as the binding site in general is expected to have opposite areas
of electrostatic potential. The MESP map, in case of Succinimide, NHS and NMS
clearly suggests that a large potential swings towards the two C=O groups (dark red)
from CH2 group (blue). The region around oxygen atoms reflects the most
electronegative region and has excess negative charge, whereas the two CH2 groups
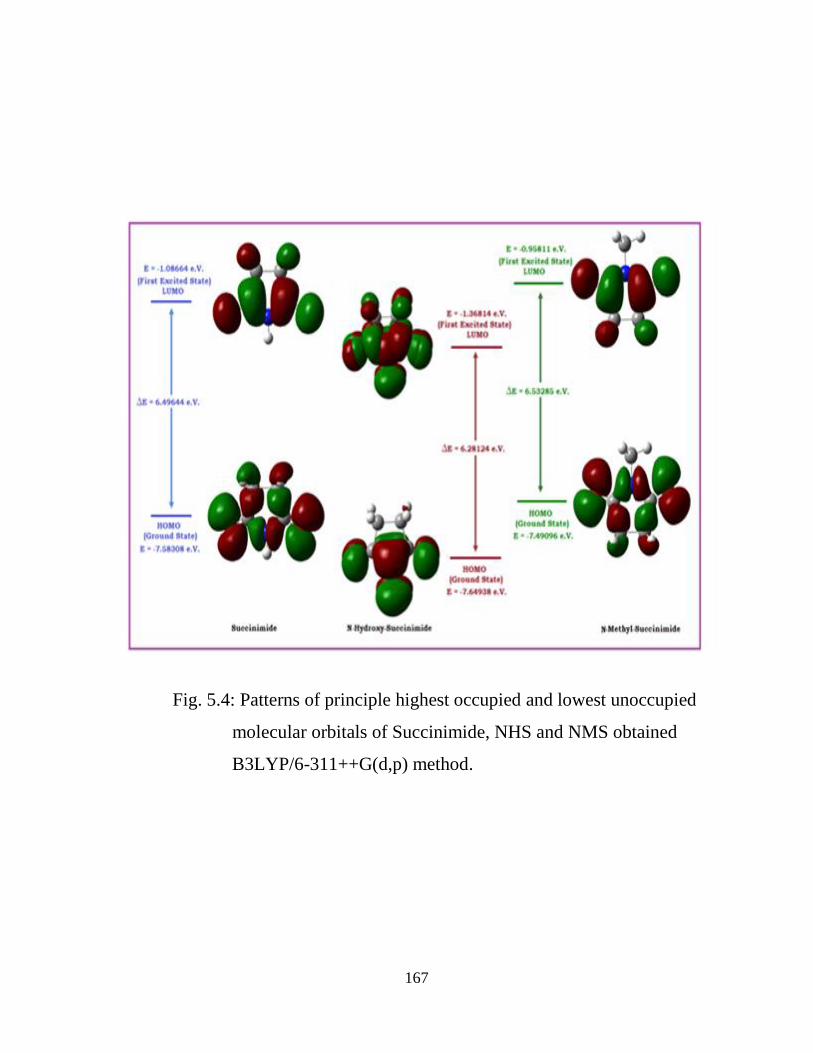
167
Fig. 5.4: Patterns of principle highest occupied and lowest unoccupied
molecular orbitals of Succinimide, NHS and NMS obtained
B3LYP/6-311++G(d,p) method.
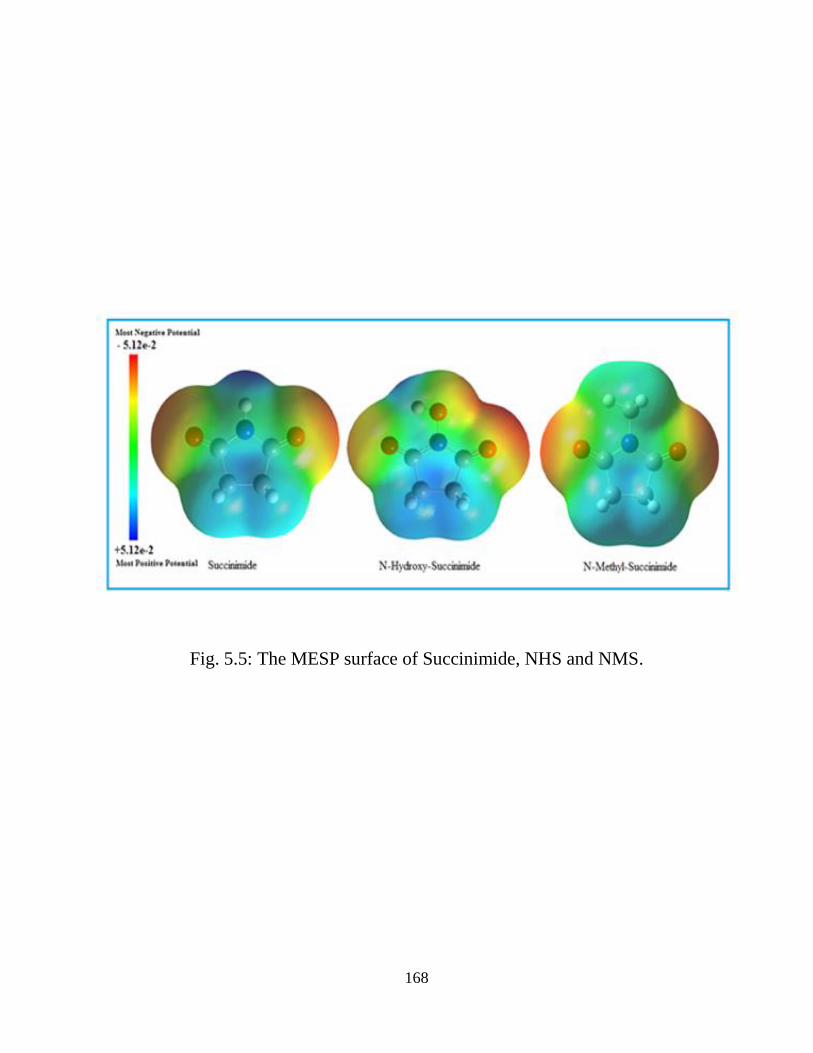
168
Fig. 5.5: The MESP surface of Succinimide, NHS and NMS.
169
bear the brunt of positive charge (blue region). The MESP of NHS reveals larger
electron rich area due to additional hydroxy group as compared to its parent molecule
Succinimide and NMS.
5.3.3 Electric moments
The dipole moment in a molecule is an important property that is mainly used to
study the intermolecular interactions involving the non-bonded type dipole-dipole
interactions, because higher the dipole moment, stronger will be the intermolecular
interactions. The calculated value of dipole moment in case of NHS is found to be
almost 2.27 times higher than that of the NMS and 1.64 times higher than that of
parent molecule Succinimide (Table 5.2). The lower frontier orbital energy gap and
high dipole moment for NHS shows its higher activity and lesser stability as
compared to Succinimide and NMS. The determination of electric polarizability and
hyperpolarizability is of fundamental importance to study the phenomenon induced
by intermolecular interactions, simulation studies and nonlinear optical effects. In the
absence of experimental data, the values of polarizability and hyperpolarizability
calculated at the same level of theory and the same basis set for the title molecules,
can provide a satisfactory comparison of these quantities. The mean polarizability of
NMS (10.3625×10⁻²⁴
e.s.u.) is found to be higher than that of Succinimide
(8.5869×10⁻²⁴
e.s.u.) and NHS (9.5257×10⁻²⁴
e.s.u.). Urea is one of the prototypical
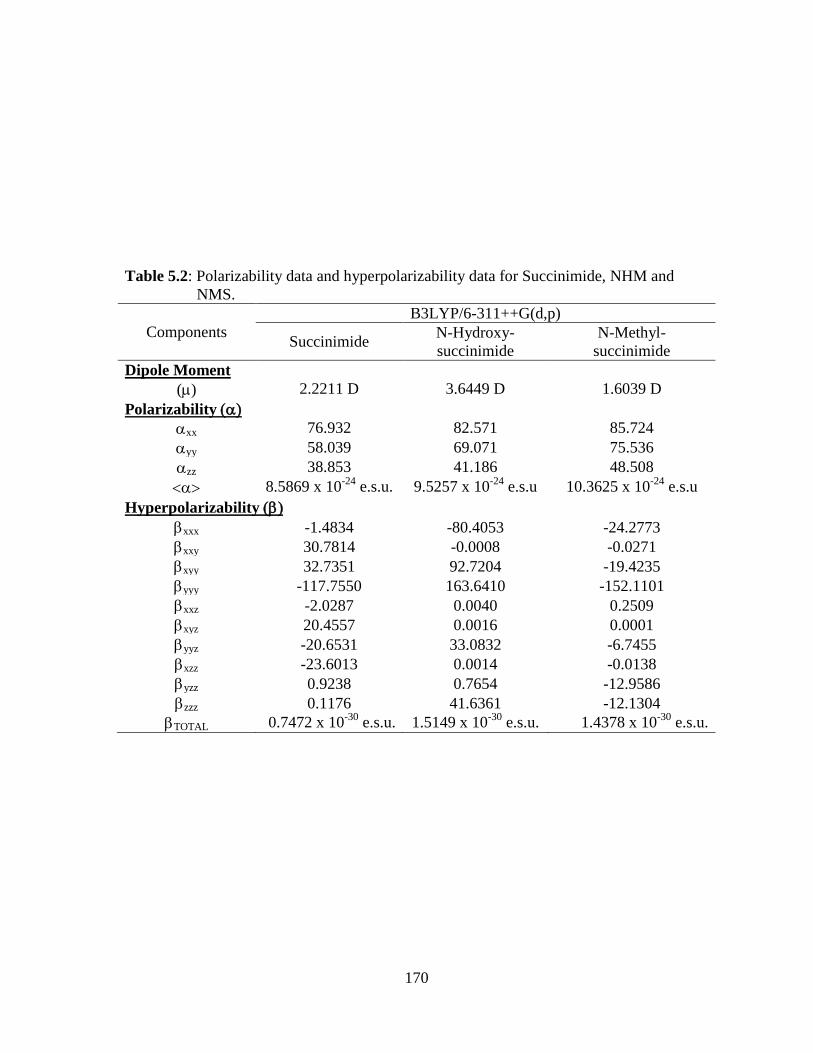
170
Table 5.2: Polarizability data and hyperpolarizability data for Succinimide, NHM and
NMS.
Components
B3LYP/6-311++G(d,p)
Succinimide N-Hydroxy-
succinimide
N-Methyl-
succinimide
Dipole Moment
() 2.2211 D 3.6449 D 1.6039 D
Polarizability
xx 76.932 82.571 85.724
yy 58.039 69.071 75.536
zz 38.853 41.186 48.508
8.5869 x 10⁻²⁴
e.s.u. 9.5257 x 10⁻²⁴
e.s.u 10.3625 x 10⁻²⁴
e.s.u
Hyperpolarizability
xxx -1.4834 -80.4053 -24.2773
xxy 30.7814 -0.0008 -0.0271
xyy 32.7351 92.7204 -19.4235
yyy -117.7550 163.6410 -152.1101
xxz -2.0287 0.0040 0.2509
xyz 20.4557 0.0016 0.0001
yyz -20.6531 33.0832 -6.7455
xzz -23.6013 0.0014 -0.0138
yzz 0.9238 0.7654 -12.9586
zzz 0.1176 41.6361 -12.1304
TOTAL 0.7472 x 10⁻³⁰
e.s.u. 1.5149 x 10⁻³⁰
e.s.u. 1.4378 x 10⁻³⁰
e.s.u.

171
molecules used in the study of the Non-linear optical properties of molecular systems.
Therefore, it is used frequently as a threshold value for comparative purposes. All the
three molecules under investigation (Succinimide/NHS/NMS) has large TOTAL value
(0.7472/1.5149/1.4378×10-30
e.s.u) than urea (almost 3.84/7.78/7.38 times greater
than urea), that indicates, they are good candidates for NLO material.
5.3.4 Thermodynamical Properties
The values of some thermodynamic parameter (such as zero-point vibrational energy,
thermal energy, specific heat capacity, rotational constant and entropy) at standard
temperature (298.15 K) for Succinimide, NHS and NMS molecules computed at
DFT/B3LYP with 6-311G++(d,p) methods are listed in Table 5.3. On the basis of
vibrational analysis, the standard statistical thermodynamic functions heat capacity
( ), entropy (
), and enthalpy change (Δ ) for the Succinimide, NHS and
NMS molecules were obtained from the theoretical harmonic frequencies and listed
in Table 5.4.
From Table 5.4, it can be observed that these thermodynamic functions are
increasing with temperature ranging from 100 to 700K due to the fact that the
molecular vibrational intensities increase with temperature [33,34]. The correlation
equations among heat capacities, entropies, enthalpy change and temperatures were
fitted by quadratic, linear and quadratic formulas. The corresponding fitting
equations, fitting factors (R2) for these thermodynamic properties and the correlation
172
graphics of Succinimide, NHS and NMS are shown in Fig. 5.6. All the
thermodynamic data supplied are helpful information for further study of
Succinimide, NHS and NMS. These can be used to compute the other thermodynamic
energies according to the relationships of thermodynamic functions and estimate
directions of chemical reactions according to the second law of thermodynamics in
thermo chemical field [35]. It is important to mention here that all thermodynamic
calculations were done in gas phase and they could not be used in solution.
5.3.5 Vibrational Analysis
DFT based calculations provide not only the qualitative but also the quantitative
understanding of energy distribution of each vibrational mode on the basis of
potential energy distribution (PED) and lead to an additional interpretation of the
vibrational spectroscopic data as demonstrated in studies conducted by various
groups [36-39]. For normal coordinate analysis of Succinimide, NHS and NMS, the
complete set of 41, 45 and 56 standard internal coordinates have been defined
respectively (Table 5. 5) [45,46] were used.
Using these internal coordinates, a non-redundant set of 30, 33, 39 (i.e. 3n-6)
local symmetry coordinates (Table 5.6) are constructed on the basis of
recommendations of the G. Fogarasi et al [40-41]. The theoretical vibrational
assignment of the title compounds using percentage potential energy distribution
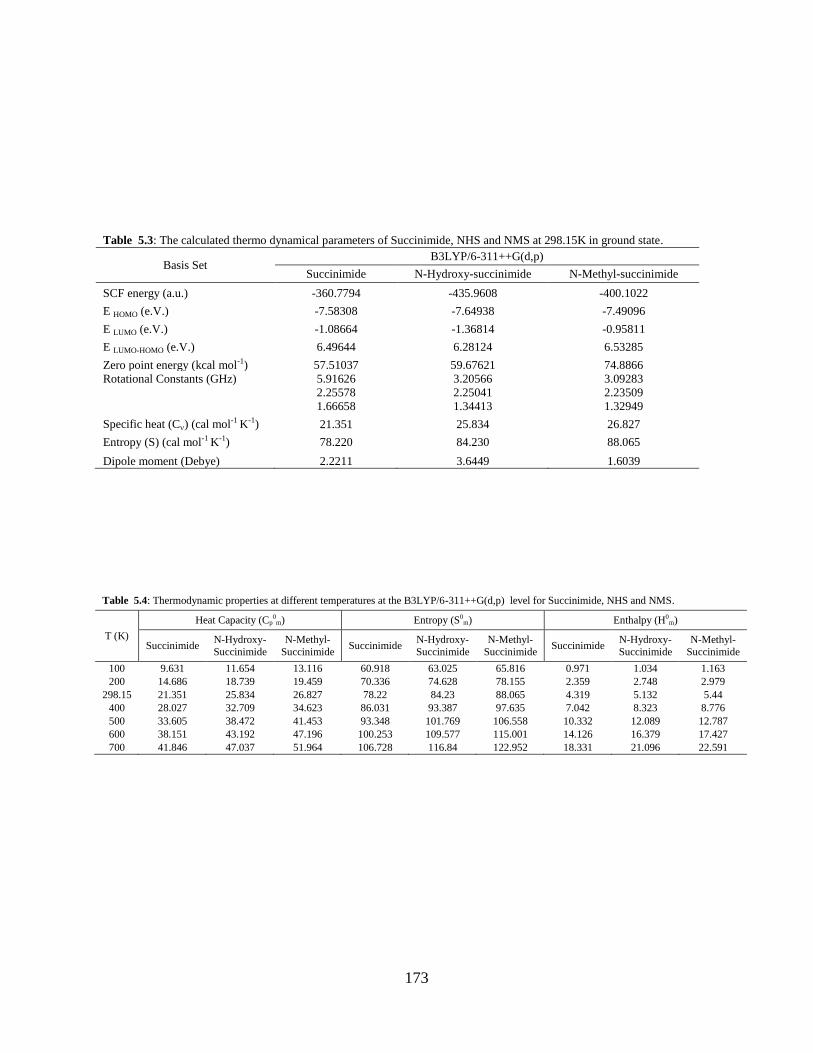
173
Table 5.3: The calculated thermo dynamical parameters of Succinimide, NHS and NMS at 298.15K in ground state.
Basis Set B3LYP/6-311++G(d,p)
Succinimide N-Hydroxy-succinimide N-Methyl-succinimide
SCF energy (a.u.) -360.7794 -435.9608 -400.1022
E HOMO (e.V.) -7.58308 -7.64938 -7.49096
E LUMO (e.V.) -1.08664 -1.36814 -0.95811
E LUMO-HOMO (e.V.) 6.49644 6.28124 6.53285
Zero point energy (kcal mol-1) 57.51037 59.67621 74.8866
Rotational Constants (GHz) 5.91626
2.25578
1.66658
3.20566
2.25041
1.34413
3.09283
2.23509
1.32949
Specific heat (C) (cal mol-1 K-1) 21.351 25.834 26.827
Entropy (S) (cal mol-1 K-1) 78.220 84.230 88.065
Dipole moment (Debye) 2.2211 3.6449 1.6039
Table 5.4: Thermodynamic properties at different temperatures at the B3LYP/6-311++G(d,p) level for Succinimide, NHS and NMS.
T (K)
Heat Capacity (Cp0
m) Entropy (S0m) Enthalpy (H0
m)
Succinimide N-Hydroxy-
Succinimide
N-Methyl-
Succinimide Succinimide
N-Hydroxy-
Succinimide
N-Methyl-
Succinimide Succinimide
N-Hydroxy-
Succinimide
N-Methyl-
Succinimide
100 9.631 11.654 13.116 60.918 63.025 65.816 0.971 1.034 1.163
200 14.686 18.739 19.459 70.336 74.628 78.155 2.359 2.748 2.979
298.15 21.351 25.834 26.827 78.22 84.23 88.065 4.319 5.132 5.44
400 28.027 32.709 34.623 86.031 93.387 97.635 7.042 8.323 8.776
500 33.605 38.472 41.453 93.348 101.769 106.558 10.332 12.089 12.787
600 38.151 43.192 47.196 100.253 109.577 115.001 14.126 16.379 17.427
700 41.846 47.037 51.964 106.728 116.84 122.952 18.331 21.096 22.591
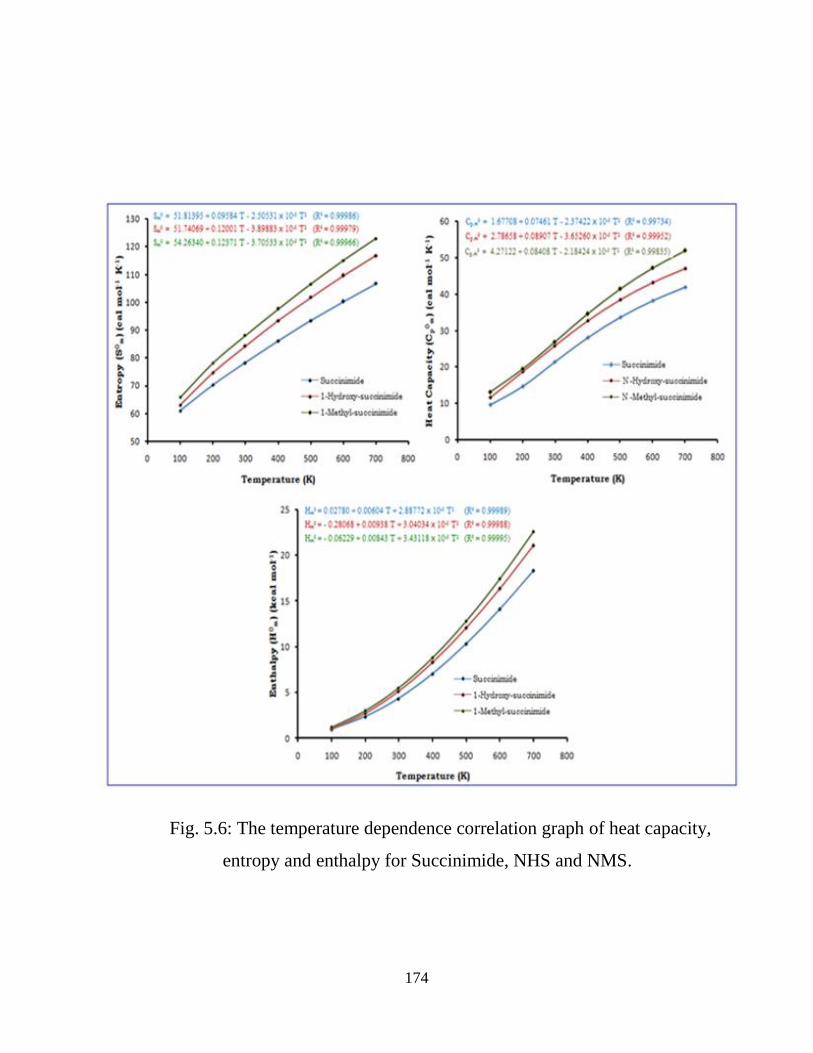
174
Fig. 5.6: The temperature dependence correlation graph of heat capacity,
entropy and enthalpy for Succinimide, NHS and NMS.
175
(PED) have been done with the MOLVIB program (version V7.0-G77) written by T.
Sundius [42-44]. In general, DFT harmonic treatments overestimate the observed
vibrational wavenumbers owing to neglecting of anharmonic corrections and
incompleteness of basis set. In this work, we have adopted the scaling approach to
offset the systematic errors, an empirical uniform scaling factor of 0.983 up to 1700
cm-1
and 0.958 for greater than 1700 cm-1
. The experimental and computed
vibrational wavenumbers, their IR intensities and the detailed description of normal
modes of vibration of title compounds Succinimide, NHS and NMS in terms of their
contribution to the potential energy are given in Table 5.7, 5.8 and 5.9 respectively.
The experimental and theoretical IR spectrum of title molecules are shown in Fig. 5.7
and 5.8 respectively. For complete vibrational analysis of all the three title molecules,
the vibrational modes are discussed here under five heads: (i) CH2 vibrations (iii) CH3
vibrations (iii) C=O stretch(iv) OH vibrations (v) Ring vibrations.
5.3.5.1 CH2 vibrations
All the three molecules (Succinimide, NHS and NMS) under investigation possess
two methylene groups which accounts for two stretching and four bending normal
modes. The four bending vibrations of methylene group found in the IR spectrum are
CH2 scissoring/rocking/wagging and twisting. The CH2 asymmetric stretching
vibrations are generally observed in the region 3000–2900 cm-1
, while the CH2
symmetric stretch appears between 2900 and 2800 cm-1
[47,48]. In the present work,
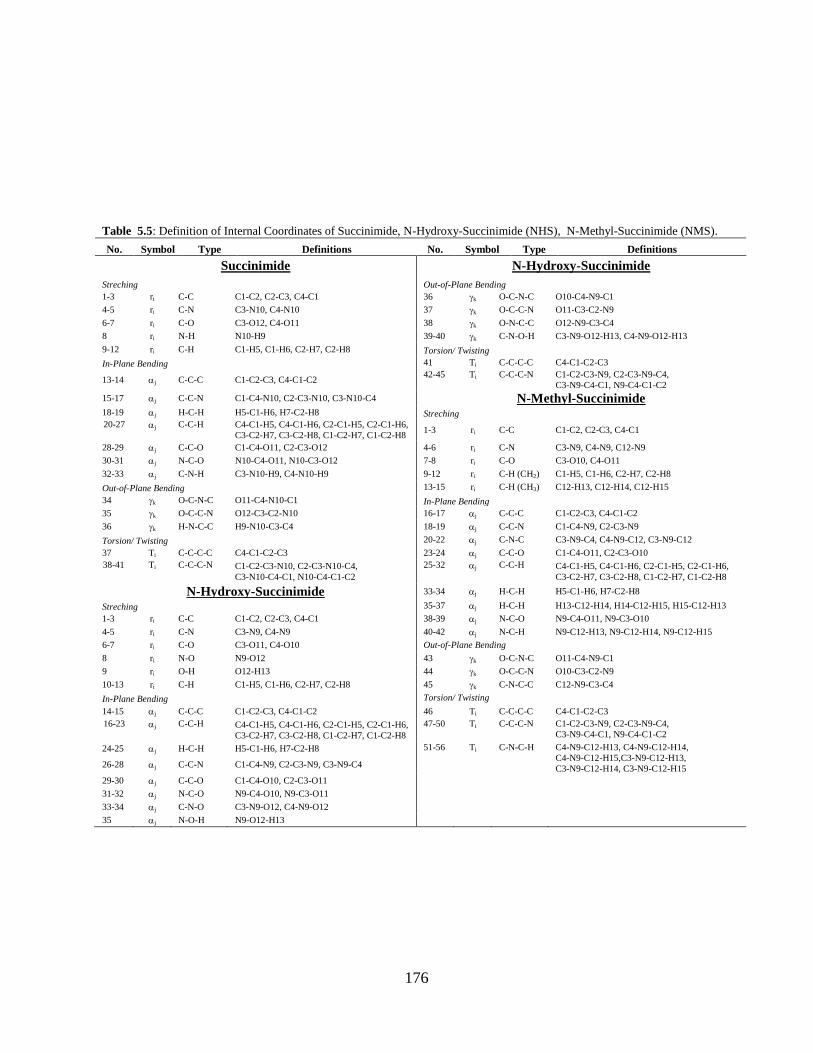
176
Table 5.5: Definition of Internal Coordinates of Succinimide, N-Hydroxy-Succinimide (NHS), N-Methyl-Succinimide (NMS).
No. Symbol Type Definitions No. Symbol Type Definitions
Succinimide N-Hydroxy-Succinimide
Streching Out-of-Plane Bending
1-3 ri C-C C1-C2, C2-C3, C4-C1 36 k O-C-N-C O10-C4-N9-C1
4-5 ri C-N C3-N10, C4-N10 37 k O-C-C-N O11-C3-C2-N9
6-7 ri C-O C3-O12, C4-O11 38 k O-N-C-C O12-N9-C3-C4
8 ri N-H N10-H9 39-40 k C-N-O-H C3-N9-O12-H13, C4-N9-O12-H13
9-12 ri C-H C1-H5, C1-H6, C2-H7, C2-H8 Torsion/ Twisting
In-Plane Bending 41 Ti C-C-C-C C4-C1-C2-C3
13-14 j C-C-C C1-C2-C3, C4-C1-C2 42-45 Ti C-C-C-N C1-C2-C3-N9, C2-C3-N9-C4,
C3-N9-C4-C1, N9-C4-C1-C2
15-17 j C-C-N C1-C4-N10, C2-C3-N10, C3-N10-C4 N-Methyl-Succinimide 18-19 j H-C-H H5-C1-H6, H7-C2-H8 Streching
20-27 j C-C-H C4-C1-H5, C4-C1-H6, C2-C1-H5, C2-C1-H6,
C3-C2-H7, C3-C2-H8, C1-C2-H7, C1-C2-H8 1-3 ri C-C C1-C2, C2-C3, C4-C1
28-29 j C-C-O C1-C4-O11, C2-C3-O12 4-6 ri C-N C3-N9, C4-N9, C12-N9
30-31 j N-C-O N10-C4-O11, N10-C3-O12 7-8 ri C-O C3-O10, C4-O11
32-33 j C-N-H C3-N10-H9, C4-N10-H9 9-12 ri C-H (CH2) C1-H5, C1-H6, C2-H7, C2-H8
Out-of-Plane Bending 13-15 ri C-H (CH3) C12-H13, C12-H14, C12-H15
34 k O-C-N-C O11-C4-N10-C1 In-Plane Bending
35 k O-C-C-N O12-C3-C2-N10 16-17 j C-C-C C1-C2-C3, C4-C1-C2
36 k H-N-C-C H9-N10-C3-C4 18-19 j C-C-N C1-C4-N9, C2-C3-N9
Torsion/ Twisting 20-22 j C-N-C C3-N9-C4, C4-N9-C12, C3-N9-C12
37 Ti C-C-C-C C4-C1-C2-C3 23-24 j C-C-O C1-C4-O11, C2-C3-O10
38-41 Ti C-C-C-N C1-C2-C3-N10, C2-C3-N10-C4,
C3-N10-C4-C1, N10-C4-C1-C2
25-32 j C-C-H C4-C1-H5, C4-C1-H6, C2-C1-H5, C2-C1-H6,
C3-C2-H7, C3-C2-H8, C1-C2-H7, C1-C2-H8
N-Hydroxy-Succinimide 33-34 j H-C-H H5-C1-H6, H7-C2-H8
Streching
35-37 j H-C-H H13-C12-H14, H14-C12-H15, H15-C12-H13
1-3 ri C-C C1-C2, C2-C3, C4-C1 38-39 j N-C-O N9-C4-O11, N9-C3-O10
4-5 ri C-N C3-N9, C4-N9 40-42 j N-C-H N9-C12-H13, N9-C12-H14, N9-C12-H15
6-7 ri C-O C3-O11, C4-O10 Out-of-Plane Bending
8 ri N-O N9-O12 43 k O-C-N-C O11-C4-N9-C1
9 ri O-H O12-H13 44 k O-C-C-N O10-C3-C2-N9
10-13 ri C-H C1-H5, C1-H6, C2-H7, C2-H8 45 k C-N-C-C C12-N9-C3-C4
In-Plane Bending
Torsion/ Twisting
14-15 j C-C-C C1-C2-C3, C4-C1-C2 46 Ti C-C-C-C C4-C1-C2-C3
16-23 j C-C-H C4-C1-H5, C4-C1-H6, C2-C1-H5, C2-C1-H6,
C3-C2-H7, C3-C2-H8, C1-C2-H7, C1-C2-H8
47-50 Ti C-C-C-N C1-C2-C3-N9, C2-C3-N9-C4,
C3-N9-C4-C1, N9-C4-C1-C2
24-25 j H-C-H H5-C1-H6, H7-C2-H8 51-56 Ti C-N-C-H C4-N9-C12-H13, C4-N9-C12-H14,
C4-N9-C12-H15,C3-N9-C12-H13,
C3-N9-C12-H14, C3-N9-C12-H15 26-28 j C-C-N C1-C4-N9, C2-C3-N9, C3-N9-C4
29-30 j C-C-O C1-C4-O10, C2-C3-O11
31-32 j N-C-O N9-C4-O10, N9-C3-O11
33-34 j C-N-O C3-N9-O12, C4-N9-O12
35 j N-O-H N9-O12-H13
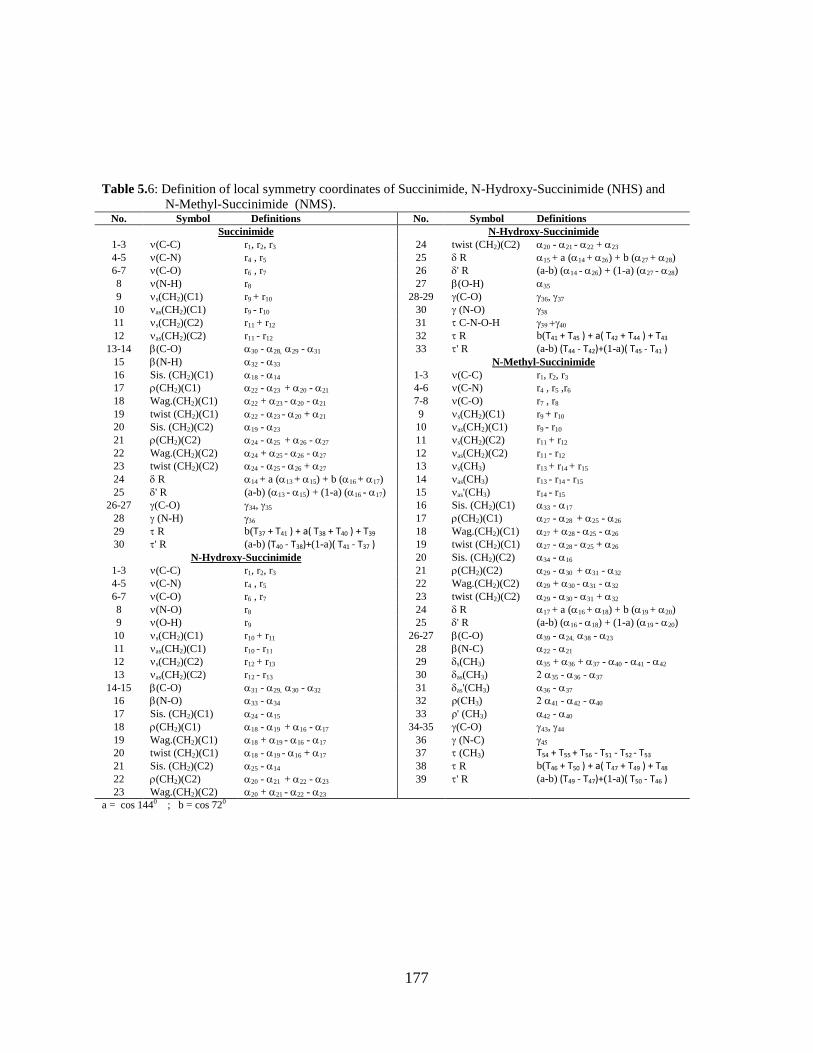
177
Table 5.6: Definition of local symmetry coordinates of Succinimide, N-Hydroxy-Succinimide (NHS) and
N-Methyl-Succinimide (NMS). No. Symbol Definitions No. Symbol Definitions
Succinimide N-Hydroxy-Succinimide
1-3 (C-C) r1, r2, r3 24 twist (CH2)(C2) 20 - 21 - 22 + 23
4-5 (C-N) r4 , r5 25 R 15 + a (14 + ) + b (27 + 28)
6-7 (C-O) r6 , r7 26 ' R (a-b) (14 - 26) + (1-a) (27 - 28)
8 (N-H) r8 27 (O-H) 35
9 s(CH2)(C1) r9 + r10 28-29 (C-O) 36, 37
10 as(CH2)(C1) r9 - r10 30 (N-O)
11 s(CH2)(C2) r11 + r12 31 C-N-O-H
12 as(CH2)(C2) r11 - r12 32 R b(T41 + T45 ) + a( T42 + T44 ) + T43
13-14 (C-O) 30 - 28, 29 - 31 33 'R (a-b) (T44 - T42)+(1-a)( T45 - T41 ) 15 (N-H) 32 - 33 N-Methyl-Succinimide
16 Sis. (CH2)(C1) 18 - 14 1-3 (C-C) r1, r2, r3
17 (CH2)(C1) 22 - 23 + 20 - 21 4-6 (C-N) r4 , r5 ,r6
18 Wag.(CH2)(C1) 22 + 23 - 20 - 21 7-8 (C-O) r7 , r8
19 twist (CH2)(C1) 22 - 23 - 20 + 21 9 s(CH2)(C1) r9 + r10
20 Sis. (CH2)(C2) 19 - 23 10 as(CH2)(C1) r9 - r10
21 (CH2)(C2) 24 - 25 + 26 - 27 11 s(CH2)(C2) r11 + r12
22 Wag.(CH2)(C2) 24 + 25 - 26 - 27 12 as(CH2)(C2) r11 - r12
23 twist (CH2)(C2) 24 - 25 - 26 + 27 13 s(CH3) r13 + r14 + r15
24 R 14 + a (13 + 15) + b (16 + 17) 14 as(CH3) r13 - r14 - r15
25 ' R (a-b) (13 - 15) + (1-a) (16 - 17) 15 as'(CH3) r14 - r15
26-27 (C-O) 34, 35 16 Sis. (CH2)(C1) 33 - 17
28 (N-H) 17 (CH2)(C1) 27 - 28 + 25 - 26
29 R b(T37 + T41 ) + a( T38 + T40 ) + T39 18 Wag.(CH2)(C1) 27 + 28 - 25 - 26
30 'R (a-b) (T40 - T38)+(1-a)( T41 - T37 ) 19 twist (CH2)(C1) 27 - 28 - 25 + 26
N-Hydroxy-Succinimide 20 Sis. (CH2)(C2) 34 - 16
1-3 (C-C) r1, r2, r3 21 (CH2)(C2) 29 - 30 + 31 - 32
4-5 (C-N) r4 , r5 22 Wag.(CH2)(C2) 29 + 30 - 31 - 32
6-7 (C-O) r6 , r7 23 twist (CH2)(C2) 29 - 30 - 31 + 32
8 (N-O) r8 24 R 17 + a (16 + 18) + b (19 + 20)
9 (O-H) r9 25 ' R (a-b) (16 - 18) + (1-a) (19 - 20)
10 s(CH2)(C1) r10 + r11 26-27 (C-O) 39 - 24, 38 - 23
11 as(CH2)(C1) r10 - r11 28 (N-C) 22 - 21
12 s(CH2)(C2) r12 + r13 29 s(CH3) 35 + 36 + 37 - 40 - 41 - 42
13 as(CH2)(C2) r12 - r13 30 as(CH3) 35 - 36 - 37
14-15 (C-O) 31 - 29, 30 - 32 31 as'(CH3) 36 - 37
16 (N-O) 33 - 34 32 ρ(CH3) 41 - 42 - 40
17 Sis. (CH2)(C1) 24 - 15 33 ρ' (CH3) 42 - 40
18 (CH2)(C1) 18 - 19 + 16 - 17 34-35 (C-O) 43, 44
19 Wag.(CH2)(C1) 18 + 19 - 16 - 17 36 (N-C)
20 twist (CH2)(C1) 18 - 19 - 16 + 17 37 (CH3) T54 + T55 + T56 - T51 - T52 - T53
21 Sis. (CH2)(C2) 25 - 14 38 R b(T46 + T50 ) + a( T47 + T49 ) + T48
22 (CH2)(C2) 20 - 21 + 22 - 23 39 'R (a-b) (T49 - T47)+(1-a)( T50 - T46 ) 23 Wag.(CH2)(C2) 20 + 21 - 22 - 23
a = cos 1440 ; b = cos 720
178
CH2 asymmetric stretching vibrations are observed at 2979, 3037 (FTIR) in
Succinimide and NHS molecules respectively. The calculated asymmetric CH2
stretching vibrations of the two methylene groups in Succinimide/NHS/NMS are
found at (2986, 2971)/(2988, 2973)/(2984, 2969) cm-1
by B3LYP method
respectively with more than 97% contribution to PED. Similarly, the calculated
symmetric CH2 stretching vibrations of the methylene groups are at (2946,
2939)/(2947, 2940)/(2945, 2938) cm-1
respectively. No bands could be assigned to
CH2 symmetric stretching vibrations in the experimental FT-IR spectra of any of the
title molecules. The general order for CH2 deformation are CH2(scis)>CH2(wag)>
CH2(twist)>CH2(rock). The two methylene scissoring modes in Succinimide/NHS /
NMS are calculated at (1454, 1434)/(1456, 1435)/(1456, 1436) cm-1
respectively with
more than 80% contribution to PED. These vibrations are well supported by the two
bands observed at 1462/1454 cm-1
(FTIR) in Succinimide/NHS molecules
respectively. From the theoretical calculations, the CH2 wagging modes are predicted
at (1225, 1149)/(1296, 1255)/(1293, 1255) cm-1
as a mixed mode with C-C stretch for
Succinimide/NHS/NMS. It shows a good correlation with the FTIR bands at 1155,
1310 cm-1
for Succinimide/NHS respectively. In NHS and NMS, CH2 twisting
vibrational modes are found as pure modes at (1222, 1148)/(1225, 1148) cm-1
,
whereas in Succinimide, they are found as a mixed mode with CH2wagging modes at
1225 and 1149 cm-1
.
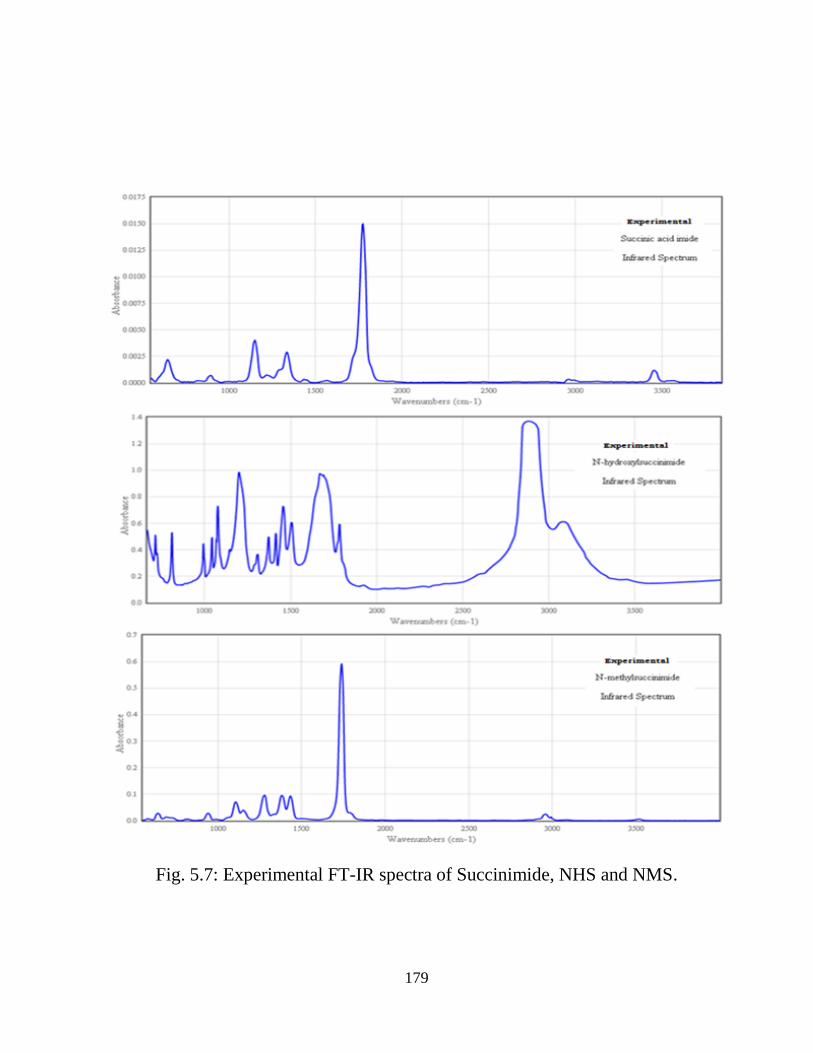
179
Fig. 5.7: Experimental FT-IR spectra of Succinimide, NHS and NMS.

180
Fig. 5.8: Theoretically simulated vibrational spectra of Succinimide, NHS and NMS.
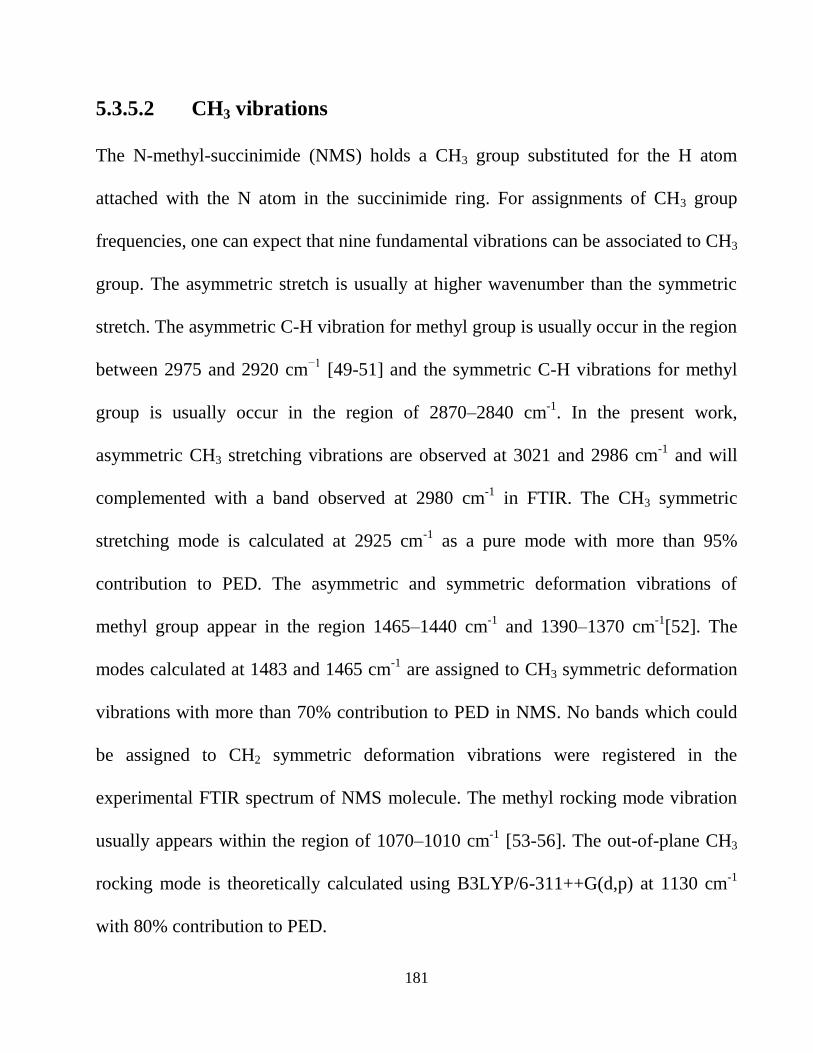
181
5.3.5.2 CH3 vibrations
The N-methyl-succinimide (NMS) holds a CH3 group substituted for the H atom
attached with the N atom in the succinimide ring. For assignments of CH3 group
frequencies, one can expect that nine fundamental vibrations can be associated to CH3
group. The asymmetric stretch is usually at higher wavenumber than the symmetric
stretch. The asymmetric C-H vibration for methyl group is usually occur in the region
between 2975 and 2920 cm−1
[49-51] and the symmetric C-H vibrations for methyl
group is usually occur in the region of 2870–2840 cm-1
. In the present work,
asymmetric CH3 stretching vibrations are observed at 3021 and 2986 cm-1
and will
complemented with a band observed at 2980 cm-1
in FTIR. The CH3 symmetric
stretching mode is calculated at 2925 cm-1
as a pure mode with more than 95%
contribution to PED. The asymmetric and symmetric deformation vibrations of
methyl group appear in the region 1465–1440 cm-1
and 1390–1370 cm-1
[52]. The
modes calculated at 1483 and 1465 cm-1
are assigned to CH3 symmetric deformation
vibrations with more than 70% contribution to PED in NMS. No bands which could
be assigned to CH2 symmetric deformation vibrations were registered in the
experimental FTIR spectrum of NMS molecule. The methyl rocking mode vibration
usually appears within the region of 1070–1010 cm-1
[53-56]. The out-of-plane CH3
rocking mode is theoretically calculated using B3LYP/6-311++G(d,p) at 1130 cm-1
with 80% contribution to PED.

182
5.3.5.3 C=O vibrations
The appearance of a strong band in IR spectra between 1790–1810 cm-1
show the
presence of carbonyl group in the molecule and is due to the C=O stretch [57]. The
frequency of the stretch due to carbonyl group mainly depends on the bond strength
which in turn depends upon inductive, conjugative, field and steric effects. As usual,
the modes calculated at higher wavenumber (1769/1771/1759 cm-1
) and the one at
lower wavenumber (1725/1692/1695 cm-1
) have been identified as the symmetric and
asymmetric stretching modes of two C=O groups for Succinimide/ NHS/NMS
respectively. The electron withdrawing nitrogen atom attached to carbonyl group
increases the strength of the C=O bonds causing the vibrations to occur at a relatively
higher value. For this reason, strong bands appear in FTIR of Succinimide/NHS/NMS
at 1735/1685/1702 cm-1
assigned to C=O stretch vibrations. The bands calculated at
557,531/565,552/570,565 cm-1
in case of Succinimide/ NHS/NMS respectively, are
identified as C=O out-of-plane bending modes and are supported by a weak intensity
band in FTIR at 556 cm-1
for NMS.
5.3.5.4 O-H vibrations
The title molecule, N-hydroxy-succinimide (NHS) holds a hydroxy group substituted
at the N atom in the Succinimide ring. The OH stretching vibrations are generally
observed in the region around 3200–3650 cm-1
. The characteristic peak calculated at
3481 cm-1
is pure O-H stretching vibration and contributes 100% to the P.E.D.
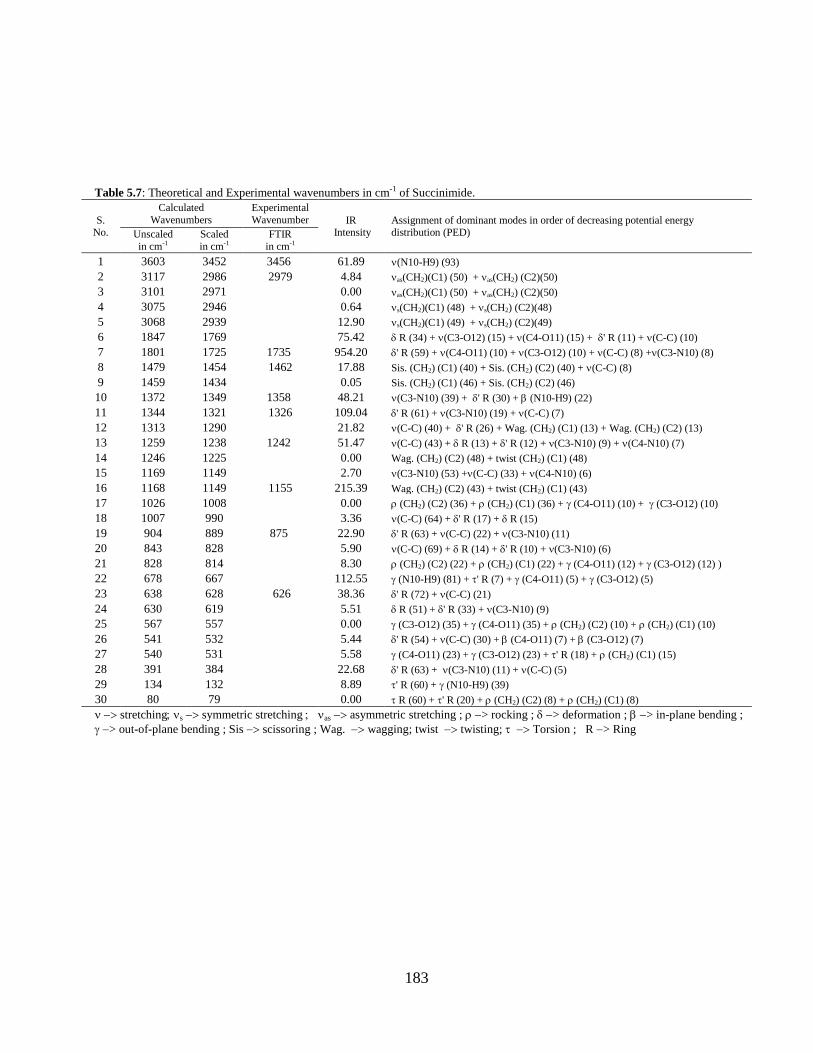
183
Table 5.7: Theoretical and Experimental wavenumbers in cm-1 of Succinimide.
S. No.
Calculated
Wavenumbers
Experimental
Wavenumber IR Intensity
Assignment of dominant modes in order of decreasing potential energy distribution (PED) Unscaled
in cm-1
Scaled
in cm-1
FTIR
in cm-1
1 3603 3452 3456 61.89 (N10-H9) (93)
2 3117 2986 2979 4.84 as(CH2)(C1) (50) + as(CH2) (C2)(50)
3 3101 2971 0.00 as(CH2)(C1) (50) + as(CH2) (C2)(50)
4 3075 2946 0.64 s(CH2)(C1) (48) + s(CH2) (C2)(48)
5 3068 2939 12.90 s(CH2)(C1) (49) + s(CH2) (C2)(49)
6 1847 1769 75.42 R (34) + (C3-O12) (15) + (C4-O11) (15) + ' R (11) + (C-C) (10)
7 1801 1725 1735 954.20 ' R (59) + (C4-O11) (10) + (C3-O12) (10) + (C-C) (8) +(C3-N10) (8)
8 1479 1454 1462 17.88 Sis. (CH2) (C1) (40) + Sis. (CH2) (C2) (40) + (C-C) (8)
9 1459 1434 0.05 Sis. (CH2) (C1) (46) + Sis. (CH2) (C2) (46)
10 1372 1349 1358 48.21 (C3-N10) (39) + ' R (30) + (N10-H9) (22)
11 1344 1321 1326 109.04 ' R (61) + (C3-N10) (19) + (C-C) (7)
12 1313 1290 21.82 (C-C) (40) + ' R (26) + Wag. (CH2) (C1) (13) + Wag. (CH2) (C2) (13)
13 1259 1238 1242 51.47 (C-C) (43) + R (13) + ' R (12) + (C3-N10) (9) + (C4-N10) (7)
14 1246 1225 0.00 Wag. (CH2) (C2) (48) + twist (CH2) (C1) (48)
15 1169 1149 2.70 (C3-N10) (53) +(C-C) (33) + (C4-N10) (6)
16 1168 1149 1155 215.39 Wag. (CH2) (C2) (43) + twist (CH2) (C1) (43)
17 1026 1008 0.00 (CH2) (C2) (36) + (CH2) (C1) (36) + (C4-O11) (10) + (C3-O12) (10)
18 1007 990 3.36 (C-C) (64) + ' R (17) + R (15)
19 904 889 875 22.90 ' R (63) + (C-C) (22) + (C3-N10) (11)
20 843 828 5.90 (C-C) (69) + R (14) + ' R (10) + (C3-N10) (6)
21 828 814 8.30 (CH2) (C2) (22) + (CH2) (C1) (22) + (C4-O11) (12) + (C3-O12) (12) )
22 678 667 112.55 (N10-H9) (81) + ' R (7) + (C4-O11) (5) + (C3-O12) (5)
23 638 628 626 38.36 ' R (72) + (C-C) (21)
24 630 619 5.51 R (51) + ' R (33) + (C3-N10) (9)
25 567 557 0.00 (C3-O12) (35) + (C4-O11) (35) + (CH2) (C2) (10) + (CH2) (C1) (10)
26 541 532 5.44 ' R (54) + (C-C) (30) + (C4-O11) (7) + (C3-O12) (7)
27 540 531 5.58 (C4-O11) (23) + (C3-O12) (23) + ' R (18) + (CH2) (C1) (15)
28 391 384 22.68 ' R (63) + (C3-N10) (11) + (C-C) (5)
29 134 132 8.89 ' R (60) + (N10-H9) (39)
30 80 79 0.00 R (60) + ' R (20) + (CH2) (C2) (8) + (CH2) (C1) (8)
stretchingssymmetric stretchingasasymmetric stretching ; > rocking ; > deformation ; > in-plane bending ;
> out-of-plane bending ; Sisscissoring ; Wag.wagging; twist twisting; Torsion ; R > Ring
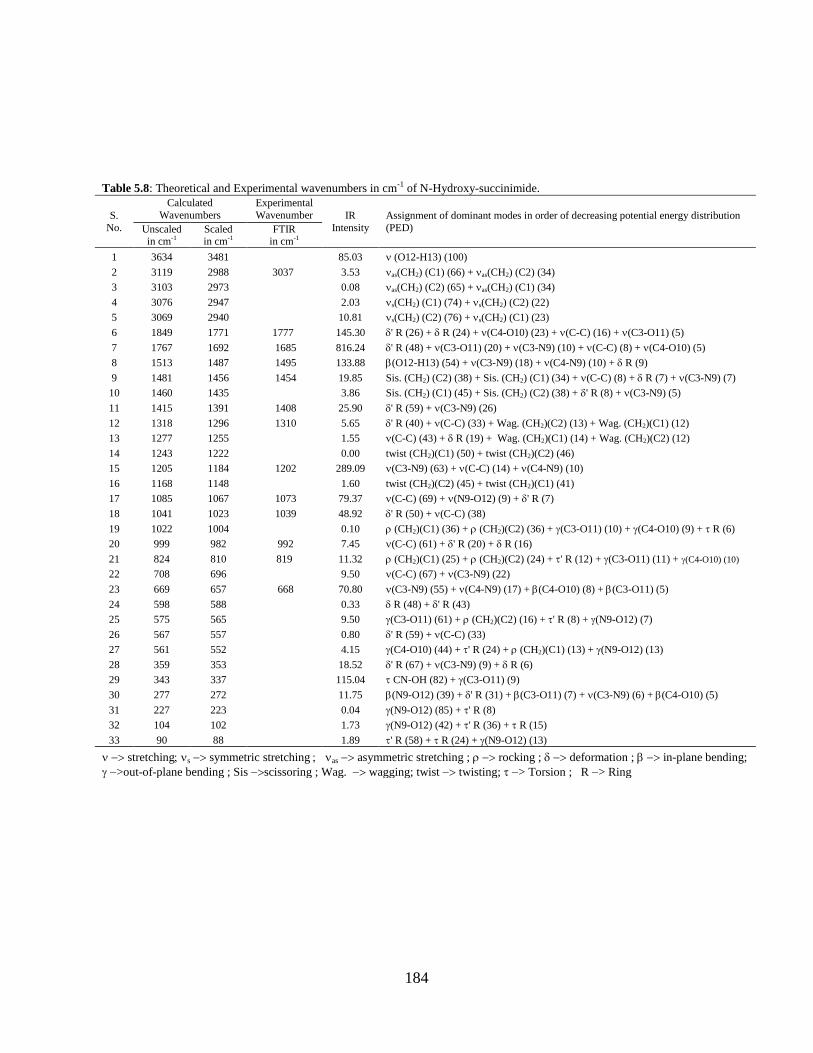
184
Table 5.8: Theoretical and Experimental wavenumbers in cm-1 of N-Hydroxy-succinimide.
S.
No.
Calculated
Wavenumbers
Experimental
Wavenumber IR
Intensity
Assignment of dominant modes in order of decreasing potential energy distribution
(PED) Unscaled in cm-1
Scaled in cm-1
FTIR in cm-1
1 3634 3481 85.03 (O12-H13) (100)
2 3119 2988 3037 3.53 as(CH2) (C1) (66) + as(CH2) (C2) (34)
3 3103 2973 0.08 as(CH2) (C2) (65) + as(CH2) (C1) (34)
4 3076 2947 2.03 s(CH2) (C1) (74) + s(CH2) (C2) (22)
5 3069 2940 10.81 s(CH2) (C2) (76) + s(CH2) (C1) (23)
6 1849 1771 1777 145.30 ' R (26) + R (24) + (C4-O10) (23) + (C-C) (16) + (C3-O11) (5)
7 1767 1692 1685 816.24 ' R (48) + (C3-O11) (20) + (C3-N9) (10) + (C-C) (8) + (C4-O10) (5)
8 1513 1487 1495 133.88 (O12-H13) (54) + (C3-N9) (18) + (C4-N9) (10) + R (9)
9 1481 1456 1454 19.85 Sis. (CH2) (C2) (38) + Sis. (CH2) (C1) (34) + (C-C) (8) + R (7) + (C3-N9) (7)
10 1460 1435 3.86 Sis. (CH2) (C1) (45) + Sis. (CH2) (C2) (38) + ' R (8) + (C3-N9) (5)
11 1415 1391 1408 25.90 ' R (59) + (C3-N9) (26)
12 1318 1296 1310 5.65 ' R (40) + (C-C) (33) + Wag. (CH2)(C2) (13) + Wag. (CH2)(C1) (12)
13 1277 1255 1.55 (C-C) (43) + R (19) + Wag. (CH2)(C1) (14) + Wag. (CH2)(C2) (12)
14 1243 1222 0.00 twist (CH2)(C1) (50) + twist (CH2)(C2) (46)
15 1205 1184 1202 289.09 (C3-N9) (63) + (C-C) (14) + (C4-N9) (10)
16 1168 1148 1.60 twist (CH2)(C2) (45) + twist (CH2)(C1) (41)
17 1085 1067 1073 79.37 (C-C) (69) + (N9-O12) (9) + ' R (7)
18 1041 1023 1039 48.92 ' R (50) + (C-C) (38)
19 1022 1004 0.10 (CH2)(C1) (36) + (CH2)(C2) (36) + (C3-O11) (10) + (C4-O10) (9) + R (6)
20 999 982 992 7.45 (C-C) (61) + ' R (20) + R (16)
21 824 810 819 11.32 (CH2)(C1) (25) + (CH2)(C2) (24) + ' R (12) + (C3-O11) (11) + (C4-O10) (10)
22 708 696 9.50 (C-C) (67) + (C3-N9) (22)
23 669 657 668 70.80 (C3-N9) (55) + (C4-N9) (17) + (C4-O10) (8) + (C3-O11) (5)
24 598 588 0.33 R (48) + ' R (43)
25 575 565 9.50 (C3-O11) (61) + (CH2)(C2) (16) + ' R (8) + (N9-O12) (7)
26 567 557 0.80 ' R (59) + (C-C) (33)
27 561 552 4.15 (C4-O10) (44) + ' R (24) + (CH2)(C1) (13) + (N9-O12) (13)
28 359 353 18.52 ' R (67) + (C3-N9) (9) + R (6)
29 343 337 115.04 CN-OH (82) + (C3-O11) (9)
30 277 272 11.75 (N9-O12) (39) + ' R (31) + (C3-O11) (7) + (C3-N9) (6) + (C4-O10) (5)
31 227 223 0.04 (N9-O12) (85) + ' R (8)
32 104 102 1.73 (N9-O12) (42) + ' R (36) + R (15)
33 90 88 1.89 ' R (58) + R (24) + (N9-O12) (13)
stretchingssymmetric stretchingasasymmetric stretching ; rocking ; deformation ; in-plane bending;
>out-of-plane bending ; Sisscissoring ; Wag.wagging; twisttwisting; > Torsion ; R > Ring
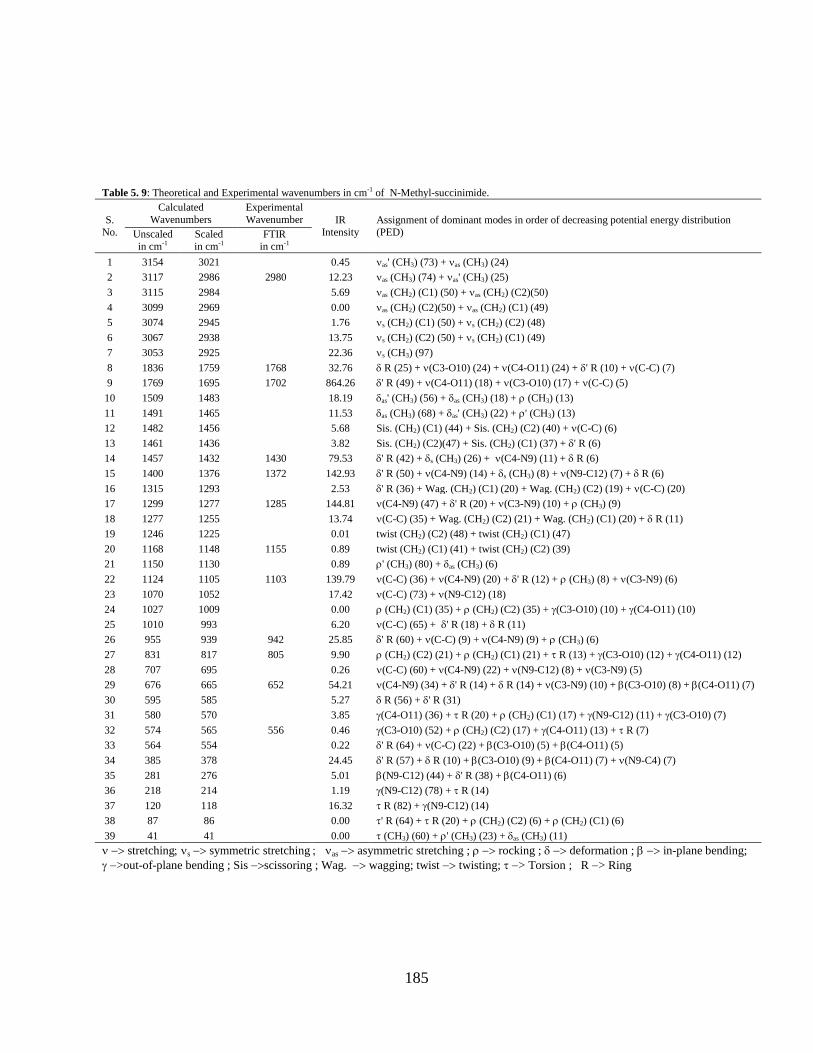
185
Table 5. 9: Theoretical and Experimental wavenumbers in cm-1 of N-Methyl-succinimide.
S.
No.
Calculated
Wavenumbers
Experimental
Wavenumber IR
Intensity
Assignment of dominant modes in order of decreasing potential energy distribution
(PED) Unscaled
in cm-1
Scaled
in cm-1
FTIR
in cm-1
1 3154 3021 0.45 as' (CH3) (73) + as (CH3) (24)
2 3117 2986 2980 12.23 as (CH3) (74) + as' (CH3) (25)
3 3115 2984 5.69 as (CH2) (C1) (50) + as (CH2) (C2)(50)
4 3099 2969 0.00 as (CH2) (C2)(50) + as (CH2) (C1) (49)
5 3074 2945 1.76 s (CH2) (C1) (50) + s (CH2) (C2) (48)
6 3067 2938 13.75 s (CH2) (C2) (50) + s (CH2) (C1) (49)
7 3053 2925 22.36 s (CH3) (97)
8 1836 1759 1768 32.76 R (25) + (C3-O10) (24) + (C4-O11) (24) + ' R (10) + (C-C) (7)
9 1769 1695 1702 864.26 ' R (49) + (C4-O11) (18) + (C3-O10) (17) + (C-C) (5)
10 1509 1483 18.19 as' (CH3) (56) + as (CH3) (18) + (CH3) (13)
11 1491 1465 11.53 as (CH3) (68) + as' (CH3) (22) + ' (CH3) (13)
12 1482 1456 5.68 Sis. (CH2) (C1) (44) + Sis. (CH2) (C2) (40) + (C-C) (6)
13 1461 1436 3.82 Sis. (CH2) (C2)(47) + Sis. (CH2) (C1) (37) + ' R (6)
14 1457 1432 1430 79.53 ' R (42) + s (CH3) (26) + (C4-N9) (11) + R (6)
15 1400 1376 1372 142.93 ' R (50) + (C4-N9) (14) + s (CH3) (8) + (N9-C12) (7) + R (6)
16 1315 1293 2.53 ' R (36) + Wag. (CH2) (C1) (20) + Wag. (CH2) (C2) (19) + (C-C) (20)
17 1299 1277 1285 144.81 (C4-N9) (47) + ' R (20) + (C3-N9) (10) + (CH3) (9)
18 1277 1255 13.74 (C-C) (35) + Wag. (CH2) (C2) (21) + Wag. (CH2) (C1) (20) + R (11)
19 1246 1225 0.01 twist (CH2) (C2) (48) + twist (CH2) (C1) (47)
20 1168 1148 1155 0.89 twist (CH2) (C1) (41) + twist (CH2) (C2) (39)
21 1150 1130 0.89 ' (CH3) (80) + as (CH3) (6)
22 1124 1105 1103 139.79 (C-C) (36) + (C4-N9) (20) + ' R (12) + (CH3) (8) + (C3-N9) (6)
23 1070 1052 17.42 (C-C) (73) + (N9-C12) (18)
24 1027 1009 0.00 (CH2) (C1) (35) + (CH2) (C2) (35) + (C3-O10) (10) + (C4-O11) (10)
25 1010 993 6.20 (C-C) (65) + ' R (18) + R (11)
26 955 939 942 25.85 ' R (60) + (C-C) (9) + (C4-N9) (9) + (CH3) (6)
27 831 817 805 9.90 (CH2) (C2) (21) + (CH2) (C1) (21) + R (13) + (C3-O10) (12) + (C4-O11) (12)
28 707 695 0.26 (C-C) (60) + (C4-N9) (22) + (N9-C12) (8) + (C3-N9) (5)
29 676 665 652 54.21 (C4-N9) (34) + ' R (14) + R (14) + (C3-N9) (10) + (C3-O10) (8) + (C4-O11) (7)
30 595 585 5.27 R (56) + ' R (31)
31 580 570 3.85 (C4-O11) (36) + R (20) + (CH2) (C1) (17) + (N9-C12) (11) + (C3-O10) (7)
32 574 565 556 0.46 (C3-O10) (52) + (CH2) (C2) (17) + (C4-O11) (13) + R (7)
33 564 554 0.22 ' R (64) + (C-C) (22) + (C3-O10) (5) + (C4-O11) (5)
34 385 378 24.45 ' R (57) + R (10) + (C3-O10) (9) + (C4-O11) (7) + (N9-C4) (7)
35 281 276 5.01 (N9-C12) (44) + ' R (38) + (C4-O11) (6)
36 218 214 1.19 (N9-C12) (78) + R (14)
37 120 118 16.32 R (82) + (N9-C12) (14)
38 87 86 0.00 ' R (64) + R (20) + (CH2) (C2) (6) + (CH2) (C1) (6)
39 41 41 0.00 (CH3) (60) + ' (CH3) (23) + as (CH3) (11)
stretchingssymmetric stretchingasasymmetric stretching ; rocking ; deformation ; in-plane bending;
>out-of-plane bending ; Sisscissoring ; Wag.wagging; twisttwisting; > Torsion ; R > Ring
186
The band observed at 1495 cm-1
in FTIR is assigned to OH in-plane bending
vibration in NHS while corresponding band calculated theoretically by B3LYP/6-
311++G(d,p) at wavenumber 1487 cm-1
. The OH twisting mode is calculated at 337
cm-1
and contributes 82% to the total P.E.D.
5.4 Conclusion
The comprehensive investigation of the ground state structural, spectral and
electronic properties of Succinimide, N-hydroxy-succinimide (NHS) and N-methyl-
succinimide (NMS) have been performed using B3LYP/6-311++G (d,p) level of
theory. The complete vibrational assignment and analysis of the fundamental modes
of all the three title molecules were carried out using theoretical and experimental
FTIR spectral data. The frontier orbital energy gap, dipole moment, MESP surface
and first static hyperpolarizability of Succinimide, NHS and NMS were also
calculated. The lower value of the frontier orbital gap in NHS (6.28124 eV) than
Succinimide (6.49644 eV) and NMS (6.53285 eV) clearly shows that NHS is more
polarizable and chemically reactive than its parent molecule Succinimide and NMS.
The MESP map shows the negative potential sites are on oxygen atoms as well as the
positive potential sites are around the hydrogen atoms. The thermodynamic properties
of the studied compounds at different temperatures were also calculated.

187
References
1. A. R. Katritzky, J.C. Yao, M. Qi, Y. Chou, D. J. Sikora, S. Davis. Ring
opening reactions of Succinimides, 1998, 18, 2677-2691.
2. M. K .Hargreaves, J. G. Pritchard, H. R. Dave. Chem. Rev. 1970, 70 439-
469.
3. J. Hudec, M. Polievka, S. Polacek, V. Macho, Czech., 1987, CS122, 237.
(Chem. Abstr.,1988, 108, 17770x).
4. R. H. Walsh, PCT Int. Appl., 1987,WO 87, 02,663 (Chem. Abstr., 107 (1987)
137365v).
5. S. L. Wang, G. R. Meyer, K. C. Brinkman, U. S.,1996, US 5024677 (Chem.
Abstr. 115 (1991)117603h).
6. E. Toja, C. Gorini, C. Zirotti, F. Barzaghi, G. Galliani, Eur. J. Med.
Chem.,1991, 26, 403-413.
7. G. Galliani, F. Barzaghi, C. Zirotti, E. Toja, Eur. Pat. Appl.1988, EP
296,979.(Chem. Abstr., 110 (1989) 173082w).
8. D. M. Vyas, M. G. Saulnier, J. F. Kadow, Eur. Pat. Appl., 1988, EP
291,957.(Chem. Abstr., 111 (1989) 23896w).
9. S. Souda, N. Ueda, S. Miyazawa, K. Tagami, S. Nomoto, M. Okita, N.
Shimomura, T.Kaneko, M. Fujimoto Eur. Pat. Appl. 1988, EP 268956.(Chem.
Abstr., 110 (1989) 23889a).

188
10. C. Govindan, Murrysville, Pa. US Pat. Appl., 1994, 260, 637. (PPG Industties,
Inc., Pittsburgh, Pa.(1996) 5.493,031).
11. M. L. Stolowitz, L. Beach, Calif, US Pat. Appl., 1987, 84, 325 (Bio-Affinity
Systems, Inc., Torrance, Calif(1989) 4,812,362).
12. A. Barth and C. Zscherp, What vibrations tell us about proteins, Q. Rev.
Biophys.,2002, 35, 369-430.
13. G. Dinorah, O. Lucia, M. Vieites, M. Boiani, M. Gonzalez, E.J. Baran, and H.
Cerecetto, Spectrochim. Acta Part A: Mol. BioMol. Spectrosc.,2007, 68,
341-348.
14. H.R.H. Ali, H.G.M. Edwards, J. Kendrick, and I.J. Scowen, Spectrochim.
Acta A: Mol. Bio Mol. Spectrosc.,2009, 72, 715-719.
15. A.D. Becke, J. Chem. Phys.,1993, 98 5648-5652.
16. C. Lee, W.T. Yang, R.G. Parr, Phys. Rev. B, 1988, 37, 785-789.
17. M.J. Frisch, G.W. Trucks, H.B. Schlegal, et al., GAUSSIAN 09. Revision A.
02, Gaussian, Inc., Wallingford, CT, 2009.
18. E.B. Wilson, Phys. Rev.,1934,45, 706-714.
19. http://webbook.nist.gov/chemistry/form-ser.html,2012.
20. D.A. Kleinman, Phys. Rev., 1962, 126, 1977-1979.
21. J. Pipek and P.Z. Mezey, J. Chem. Phys., 1989, 90 4916-4926.
22. A.D. Buckingham, Adv. Chem. Phys.,1967, 12,107-142.

189
23. M. Ladd, Introduction to Physical Chemistry, third ed., Cambridge
University Press, Cambridge, 1998.
24. F.H. Allen, O. Kennard, D.G. Watson, L. Brammer, A.G. Orpen, R. Taylor, J.
Chem. Soc., Perkin Trans. II,1987, S1-S19.
25. Fleming I., Frontier Orbitals and Organic Chemical Reactions, John Wiley
and Sons, New York, 1976
26. J. S. Murray and K. Sen, Molecular Electrostatic Potentials, Concepts and
Applications (Elsevier, Amsterdam, 1996).
27. I. Alkorta and J. J. Perez, Int. J. Quant. Chem., 1996, 57, 123-135.
28. E. Scrocco and J. Tomasi, in: Advances in Quantum Chemistry, ed. P.
Lowdin (Academic Press, New York, 1978).
29. F. J. Luque, M. Orozco, P. K. Bhadane, and S. R. Gadre, J. Phys. Chem.,
1993, 97, 9380-3984.
30. J. Sponer and P. Hobza, Int. J. Quant. Chem.,1996, 57, 959-970.
31. R. K. Pathak and S. R. Gadre, J. Chem. Phys., 1990, 93, 1770-1773.
32. S. R. Gadre and I. H. Shrivastava, J. Chem. Phys.,1991, 94, 4384-4390.
33. J.Bevan Ott., J.Boerio-Goates, Calculations from Statistical Thermodynamics,
Academic Press, 2000.
34. D. Sajan, L. Josepha, N. Vijayan, M. Karabacak, Spectrochim. Acta A, 2011,
81, 85-98.
190
35. R. Zhang, B. Dub, G. Sun, Y. Sun, Sprctrochim. Acta A,2010, 75, 1115-
1124.
36. P. M. Anbarasana, M. K. Subramanian, P. Senthilkumar, C. Mohanasundaram,
V. Ilangovan, N. Sundaraganesan, J. Chem. Pharm. Res., 2011, 3(1), 597-612
37. P. Singh, N. P. Singh and R. A. Yadav, J. Chem. Pharm. Res., 2011, 3(1),
737-755
38. R.K. Srivastava, V. Narayan, O. Prasad, L. Sinha, J. Chem. Pharm. Res.,
2012, 4(6), 3287-3296.
39. O Prasad, A. Kumar, N. Narayan, H.N. Mishra, R.K. Srivastava, L. Sinha, J.
Chem. Pharm. Res., 2011, 3(5), 668-677.
40. G. Fogarasi, P. Pulay, in: J.R. Durig (Ed.), Vibrational Spectra and Structure,
Elsevier, Amsterdam, 1985,14, 125 (Chapter 3).
41. G. Fogarasi, X. Zhou, P.W. Taylor, P. Pulay, J. Am. Chem. Soc., 1992,114,
8191-8201.
42. T.Sundius, J.Mol. Spectrosc.,1980, 82, 138-151.
43. T.Sundius, J.Mol.Struct., 1990,218, 321-336.
44. T.Sundius, Vib. Spectrosc.,2002, 29, 89-95.
45. M. Karabacak, M. Kurt, M. Cinar, A. Coruh, Mol. Phys.,2009, 107, 253-264.
46. N. Sundaraganesan, S. Ilakiamani, H.Saleem, P.M. Wojciechowski, D.
Michalska, Spectrochim. Acta A, 2005, 61, 2995-3001.

191
47. D. Sajan, J. Binoy, B. Pradeep, K. Venkatakrishnan, V.B. Kartha, I.H. Joe,
V.S.Jayakumar, Spectrochim. Acta A, 2004, 60, 173-180.
48. S. Gunasekaran, S.R. Varadhan, K. Manoharan, Asian J. Phys., 1993, 2, 165-
172.
49. D.N. Sathyanarayana, Vibrational Spectroscopy-Theory and Applications,
second ed., New age International (P) Limited Publishers, New Delhi, 2004.
50. G. Lithivinov, Proceedings of the 13th International Conference on Raman
spectroscopy, Weizburg, Germany,1992.
51. K. Furic, V. Mohacek, M. Bonifacic, I. Stefanic, Journal of Molecular
Structure (Theochem.),1992, 267, 39-44.
52. J. Mohan, Organic Spectroscopy-Principles Applications, Narosa Publishing
House, New Delhi, 2001.
53. B. Karthikeyan, Spectrochim. Acta A,2006, 64, 1083-1087.
54 N. Sundaraganesan, S. Ilakiamani, B. Dominic Joshua, Spectrochim. Acta A,
2007, 68, 680-687.
55. A. Altun, K. Golcuk, M. Kumru, J. Mol. Struct. (Theochem), 2003, 637,
155-169.
56. H. Endredi, F. Billes, G. Keresztury, J. Mol. Struct. (Theochem),2004, 677,
211-225.
57. P.S. Kalsi, Spectroscopy of Organic Compounds, Academic Press, New
York,2002

192
Conclusions
193
Ab initio calculations provide assets of detail that is not available from experiment
and a degree of assurance in the results that is not available from more empirical
approaches. For small sized molecules in the gas phase as well as in solution, ab
initio quantum chemical calculations can deliver results approaching benchmark
accuracy [1]. A significant range of applications have appeared in the past two
decades, and have shown impact on nearly every aspect of chemistry, biology, and
materials science. These are also very precious for many branches of modern material
science: solid state physics, chemistry, biology [2], earth science [3] etc. The
electronic structure of materials, in general sense determines all the molecular
properties accurately by ab initio calculations i.e. from fundamental quantum theory.
The most elementary type of ab initio electronic structure calculation is the Hartree-
Fock (HF) method but Density Functional Theory (DFT) has become a widely used
class of quantum chemical methods because of its ability to predict relatively accurate
molecular properties with relatively less computational cost [4-8]. The work
presented in this thesis is mainly focused on quantum mechanical studies on the
structure, spectroscopic and other molecular properties of three compounds viz. 4-
Phenyl-3H-1,3-thiazol-2-ol (4P3HT), 2-Thienylboronic acid (2TBA) and N-hydroxy-
succinimide (NHS).
In Chapter III, We have carried out comprehensive investigation of molecular
geometry and electronic structure in ground as well as in the first excited state of 4-
194
Phenyl-3H-1,3-thiazol-2-ol (enol) along with the experimental and theoretical
spectroscopic analysis for the first time, using FT-IR, FT-Raman and UV–Vis
techniques and implements derived from the density functional theory. The molecular
geometry, vibrational wave-numbers, infrared and Raman intensities of the molecules
have been calculated by using DFT (B3LYP) method with 6-311++G(d,p) basis sets.
In general, a good agreement between experimental and the calculated normal modes
of vibrations has been observed. NLO behavior of the molecule has been investigated
by the dipole moment, mean polarizability and first order static hyperpolarizability.
Theoretically calculated values of mean polarizability of both keto and enol forms are
found to be nearly same but the dipole moment (5.0203 Debye) and first static
hyperpolarizability (βtotal = 9.1802×10⁻³⁰
e.s.u.) of keto form are appreciably higher
than enolic form (0.5296 Debye, βtotal = 2.7871×10⁻³⁰
e.s.u.). UV–Vis spectrum of the
compound was also recorded and electronic properties such as frontier orbitals and
band gap energies were calculated by TD-DFT approach. The calculated electronic
properties show good correlation with the experimental UV–Vis spectrum. QSAR
analysis of both the keto and enol form establishes the efficacy of enol form of the
studied compound under physiological conditions and hence predicts its enhanced
interaction with the vis-à-vis receptors, functional proteins or enzymes.
Chapter IV, deals with the combined experimental and theoretical investigation
of 2-Thienylboronic acid. First of all a comprehensive conformational analysis was
195
carried out by means of 2D as well as 3D potential energy scans and trans-cis
conformer is found to be the most stable conformer. In this chapter we have also
performed the experimental and theoretical vibrational analysis of 2TBA for the first
time, using FT-IR, FT-Raman and UV–Vis techniques and tools of density functional
theory. Various modes of vibrations were unambiguously assigned using the results
of PED output obtained from the normal coordinate analysis. In general, a
satisfactory coherence between experimental and calculated normal modes of
vibrations has been observed. The mean polarizability and total first static
hyperpolarizability (βtotal ) of the molecule is found to be 12.3083×10⁻²⁴
esu and
0.5835×10⁻³⁰
esu respectively. The electronic properties are also calculated and
compared with the experimental UV–Vis spectrum. All the theoretical results show
good concurrence with experimental data.
In Chapter V, a comparative study of structure, energies and spectral analysis
of Succinimide, N-hydroxy-succinimide (NHS) and N-methyl-succinimide (NMS)
has been carried out using density functional method (DFT/B3LYP) with 6-
311++G(d,p) as basis set. The complete vibrational assignment and analysis of the
fundamental modes of all the three molecules were carried out using theoretical and
experimental FTIR spectral data. The frontier orbital energy gap, dipole moment,
MESP surface and first static hyperpolarizability of Succinimide, NHS and NMS
were also calculated. The lower value of the frontier orbital gap in NHS than

196
Succinimide and NMS obviously shows that NHS is more polarizable and chemically
reactive than its close relative molecule Succinimide and NMS. The correlations
between the statistical thermodynamics and temperature are also obtained. It is seen
that the heat capacities and entropies increase with the increasing temperature owing
to the fact that the intensities of the molecular vibrations increase with increasing
temperature.
The work reported in the thesis is principally based on the calculation of molecular
properties using DFT method. Although DFT is most widely used method but has its
own limitations. The experimental data, which have been used, also have their
fidelity within certain limits. It is not possible to improve DFT methods consistently,
like wave-function based methods and so it is not likely to assess the inaccuracy
coupled with the calculations without reference to experimental data or other types of
calculations. The choice of functional is astounding and can have a real bearing on
the calculations. DFT also suffers from the problem of self-interaction, even with
only one electron, the density of that electron interacts with the electron itself creating
an artificial repulsion of the electron produced by itself. The geometric differences
between the optimized structure and the structure in solid state are due to the fact
that the molecular conformation in the gas phase is slightly different from that in
the solid state, where inter-molecular interactions play an important role in
stabilizing the crystal structure. There are difficulties in using DFT to depict
197
intermolecular interactions, especially those involving dispersion forces or systems in
which dispersion forces participate with other interactions (biomolecules). In place of
three-dimensional systems, an isolated molecule is been used. This limitation does
not create serious problems but does lead to a transferal of few wavenumbers in the
calculated wave-numbers near zone center because of crystal field splitting.
Calculations on a three-dimensional system together with intermolecular interactions,
will fully interpret the vibrational modes, but the calculations become very
problematic, if we use a three-dimensional system because the size of the matrices
are inconveniently large and the number of non-bonded interactions become not only
large in number but also hard to visualize [9].
On the other hand there are still scope of challenging future research, which
should be mentioned here. Most of the work reported here is based on the FT-IR and
FT-Raman spectra. It is to be noted that the FT-IR and FT-Raman spectra have their
own limitations. Their interpretation may not be simple. When vibrational bands are
parted by insignificant energy, the information contained in them may be concealed
by overlapping. Presence of over tones and shifting of bands due to structural features
also limit the information. Unlike Infrared or Raman study, neutron scattering does
not involve electromagnetic interaction [10,11] and there is a restriction on selection
rules. It can give information on the entire range of vibrational spectra of a molecule
besides giving density-of states directly. It is particularly appropriate in the low
198
frequency spectral region for lattice modes and chain vibrations. In spite of these
drawbacks, they could be still applied with proficiency to a wide range of relevant
problems.
The future research scope involves the quantum chemical study of a series of
thiazol derivatives and hence to calculate quantum chemical and QSAR descriptors
that can be helpful in predicting structure activity relationship. Metabolites of boronic
acids and its derivatives can be studied through quantum chemical methods to have a
better understanding of action and activity of the compounds.
199
References
1. Martin, J. M. L. & de Oliveira, G. (1999) J. Chem.Phys. 111, 1843-1856.
2. M. D. Segall, J. Phys.: Condens. Matter 14 (2002) 2957.
3. G. A. de Wijs, G. Kresse, L. Vocadlo, D. Dobson, D. Alfe. M. J. Gillan, G. D.
Price, Nature 392 (1998) 805.
4. L. Sinha, O. Prasad, V. Narayan and S. R. Shukla, Molecular Simulation.
Vol. 37, No. 2, 153-163, 2011.
5. A.A. El-Emam, A. M. S. Al-Tamimi, K. A. Al-Rashood, H. N. Misra, V.
Narayan, O. Prasad, L. Sinha, Journal of Molecular Structure 1022(2012)49-
60.
6. A. Kumar, V. Narayan, O. Prasad, L. Sinha, Journal of Molecular Structure
1022 (2012) 81-88.
7. O. Prasad, L. sinha, J. Pathak andV.Narayan. Journal of At. Mol. Sci. Vol. 3,
No. 2, (2012)95-105
8. O. Prasad, L. Sinha, and N. Kumar,J. At. Mol. Sci. Vol. 1, No. 3, (2010) 201-
214.
9. G. Zerbi, Applied Spectroscopy Reviews 2 (1969) 193.
10. H. Boutin and S. Yip, Molecular spectroscopy with neutrons, MIT Press,
Cambridge (1968).
11. I. H. Hall, Structure of Crystalline Polymers, Elsevier Applied Science
Publisher (London and New York) (1984).