applications of advanced sampling methods for enhanced
TRANSCRIPT
Applications of Advanced Sampling Methods for Enhanced Conformational Sampling of Biomolecules
by
Srinivasaraghavan Kannan
A Thesis submitted in partial fulfillment of the requirements for the degree of
Doctor of Philosophy
in Bioinformatics
Approved, Thesis Committee
Prof. Dr. Martin Zacharias __________________________ Name and title of chair
Dr. Danilo Roccatano __________________________ Name and title of committee member
Prof. Dr. Stephan Frickenhaus
__________________________ Name and title of committee member
Date of Defense: May 18, 2009
School of Engineering and Science

iii
List of publications This thesis is based on the following publications: S. Kannan and M. Zacharias. (2007) Folding of a DNA hairpin loop structure in explicit solvent using replica-exchange molecular dynamics simulations. Biophys. J. 93, 3218-3228. S. Kannan and M. Zacharias. (2007) Enhanced sampling of peptide and protein conformations using replica exchange simulations with a peptide backbone biasing-potential. Proteins. 66, 697-706. S. Kannan and M. Zacharias. (2008) Folding simulations of Trp-cage mini protein in explicit solvent using biasing potential replica-exchange molecular dynamics simulations. Proteins. In press. S. Kannan and M. Zacharias. (2009) Application of BP-Rex MD simulations for loop modeling and refinement of homology modeled proteins in explicit solvent. (In preparation). Other publications: S. Kannan, K. Kohlhoff, and M. Zacharias. (2006) B-DNA under stress: Over and Un-Twisting of DNA during Molecular Dynamics Simulations. Biophys. J. 91, 2956-2965. S. Frickenhaus, S. Kannan and M. Zacharias. (2009) Efficient evaluation of sampling quality of molecular dynamics simulations by clustering of dihedral torsion angles and Sammon mapping. J. Comput. Chem. 30, 479 - 492. S. Kannan and M. Zacharias. (2009) Folding of Trp-cage Mini Protein Using Temperature and Biasing Potential Replica Exchange Molecular Dynamics Simulations. Int. J. Mol. Sci. 10, 1121-1137. S. Kannan and M. Zacharias. (2009) Simulated Annealing coupled Replica Exchange Molecular Dynamics - an efficient conformational sampling method. J. Struct. Bio. (in press). R.P. Bahadur, S. Kannan and M. Zacharias. (2009) Binding of the bacteriophage P22 N-peptide to the boxB RNA motif studied by molecular dynamics simulation. (submitted). R.P. Bahadur, S. Kannan and M. Zacharias. (2009) A knowledge based potential for RNA - Protein Docking. (In preparation).

iv
Acknowledgments I would like to express my gratitude to my PhD supervisor Prof. Dr. Martin Zacharias, for
his encouragement and his guidance throughout the period from my masters till PhD
studies. I am sure without his support I wouldn’t have been able to complete my studies.
I want thank him for sharing his ideas, for always being available for discussions (I can
always knock his door and discuss my doubts with him, without having an appointment)
and giving me the freedom to work independently. On a more personal level, Martin
Zacharias has always been a source of constant support. I am always grateful to him.
I thank Prof. Mathias Winterhalter for his encouragement and support during my
graduate studies at Jacobs University Bremen. I will cherish all his time invested in
helping me understand the newness of experimental biology. I am thankful for his
kindness and his valuable advises. I will always remember his help and support.
I would like to thank Prof. Dr. Stephan Frickenhaus and Dr. Danilo Roccatano, the
members of my examination committee for reviewing this thesis.
My thanks also goes to my colleagues of our computational biology group Dr. André
Barthel, Dr. Andreas May , Dr. Florian Sieker, Dr. Jeremy Curuksu, Dr. Ranjit Bahadur,
Dr. Sebastien Fiorucci, Sebatian Schneider and Simon Lewis for supporting me
whenever I needed some help.
I am thankful to Dr. Achim Gelessus for his technical support and for the computational
resource at CLAMV and Volkswagen stiftung for financial support.
With all of my heart I want to thank my parents, sisters and friends for their love, trust
and support.
My special thanks to Ramya for her kindness, support and especially for her patience
during these years.
On a more personal level I want to thank Praveen, Aparna, Sudharsan, and Rakina for the great time we spent together at Jacobs University.
v
Abstract The application of Classical Molecular Dynamics (MD) for the structure prediction of
Biomolecules is limited by the accuracy of current force fields and the simulation time
scale. Peptides and proteins can adopt several locally stable conformations separated
by high energy barriers. Conformational transitions between these stable states can
therefore be rare events even on the time scale of tens to hundreds of nanoseconds.
Out of the various methods proposed to tackle the sampling problem, Replica Exchange
Molecular Dynamics (Rex MD) is the most successful method to enhance the
conformational sampling of peptides and proteins. But this is limited to only small
systems, as the number of replicas required for Rex MD increases with increasing
system size. Therefore, during my PhD, I have developed an alternative “Hamiltonian”
replica-exchange method that focuses on the biomolecule backbone flexibility by
employing a specific biasing potential to promote backbone transitions as a replica
coordinate. The aim of this biasing potential is to reduce the energy barriers associated
with peptide backbone dihedral transitions. The level of biasing gradually changes along
the replicas such that frequent transitions are possible at high levels of biasing and thus
the system can escape from getting trapped in local energy minima. This thesis
discusses the development of this Biasing Potential Replica Exchange Molecular
Dynamics (BP-Rex MD) method in detail. Application of the method to study the
conformational sampling of various peptides, folding of a mini protein and also for
refinement and loop modeling of homology modeled proteins in explicit solvent shows
much better sampling of conformational space as compared to the standard MD
simulations. One of the main advantages of this BP-Rex MD simulation is that only the
biasing potential energy term enters into the exchange probability, meaning that the
number of required replicas is expected to scale approximately linearly with the number
of included backbone dihedral angles. Since exchanges between replicas are
independent of the number of solvent molecules, our method requires much fewer
replicas for efficient sampling compared to standard temperature Rex MD.
vi
Abbreviations 2D Two Dimensional
3D Three Dimensional
AMBER Assisted Model Building with Energy Refinement
BP-Rex MD Biasing Potential Replica Exchange Molecular Dynamics
C MD Continuous or Conventional or Standard or Classical or
Traditional Molecular Dynamics
CASPR Critical Assessment of Techniques for Protein Structure
Prediction
DNA Deoxyribonucleic acid
GB Generalized Born
H-Rex MD Hamiltonian Replica Exchange Molecular Dynamics
mRNA Messenger Ribonucleic acid
MC Monte Carlo
MD Molecular Dynamics
MMTSB Multiscale Modeling Tools for Structural Biology
NMR Nuclear Magnetic Resonance
OPLS Optimized Potentials for Liquid Simulations
PBC Periodic Boundary Conditions
PME Particle Mesh Ewald
PMF Potential of Mean Force
Rex MD Replica Exchange Molecular Dynamics
RNA Ribonucleic acid
T-Rex MD Temperature Replica Exchange Molecular Dynamics
VMD Visual Molecular Dynamics
WHAM Weighted Histogram Analysis Method
vii
Contents List of publications iii Acknowledgments iv Abstract v Abbreviations vi Contents vii List of Figures x List of Tables xii 1. Introduction 1
1.1 Nucleic acid structure ……………………………………………………… 3 1.2 Protein structure .…………………………………………………………… 4 1.3 Protein folding .……………………………………………………………… 9 1.4 Molecular Dynamics (MD) simulation .…………………………………… 11 1.5 Conformational sampling problem ……………………………………….. 16 1.6 Replica Exchange Molecular Dynamics (Rex-MD) …………………….. 17 1.7 Outline of the thesis ……………………………………………………….. 19 1.8 References …………………………………………………………………. 20
2. Folding of DNA hairpin loop structure in explicit solvent using replica exchange molecular dynamics simulations 24 2.1 Abstract ……………………………………………………………………… 24 2.2 Introduction .…………………….………………………………………….. 25 2.3 Materials and Methods …..………………………………………………… 28 2.4 Results and Discussion …………………….……………………………… 29
2.4.1. Conformational flexibility of single stranded DNA during continuous MD simulations ………….………………………………………….. 29
2.4.2. Hairpin structure formation during replica-exchange MD simulation ………………………..……….………………………………………. 31
viii
2.4.3. Accumulation of intermediates and mis-folded structures ……… 33 2.4.4. Analysis of intermediate structure with near-native loop structure
……………………….………………………………………………… 37 2.4.5. Temperature dependence of hairpin loop stability ………………. 40
2.5 Conclusions …………………..…………………………………….………. 42 2.6 References ….……………………………………………………….……… 45
3. Enhanced sampling of peptide and protein conformations using replica exchange simulations with a peptide backbone biasing potential 51 3.1 Abstract …………………………………………………………………... 51 3.2 Introduction .………………………………………………………………… 52 3.3 Methodology ……………………………………………………………….. 54
3.3.1. Test system and simulation conditions …………………………… 54 3.3.2. Biasing potential for peptide φ and ψ dihedral angles ………….. 55 3.3.3. Rex MD using a backbone dihedral angle biasing potential …… 57
3.4 Results ……..……………………………………………………………….. 58 3.4.1. Biasing potential replica exchange simulations on dipeptide test
cases .. ……………………………………………………………… 58 3.4.2. BP-Rex MD application to hexa-Ala-peptide ………….………… 61 3.4.3. Folding simulations on a beta-hairpin forming peptide …………. 66
3.5 Discussion ………………………………………………………………….. 68 3.6 References …………………………………………………………………. 72
4. Folding simulations of Trp-cage mini protein in explicit solvent using
biasing potential replica exchange molecular dynamics simulation 77 4.1 Abstract …………………………………………………………………….. 77 4.2 Introduction ………………………………………………………………… 78 4.3 Materials and Methods …………………………………………………… 80 4.4 Results and Discussion ………………………………………………….. 82
4.4.1. Comparison of continuous and BP-Rex MD simulations ……… 82 4.4.2. Folding energy landscape ………………………………………… 91 4.4.3. Packing of Trp-side chain and Asp-Arg salt bridge formation … 92 4.4.4. Role of water molecules …………………………………………… 95
4.5 Conclusions ……………………………………………………………….. 97 4.6 References ………………………………………………………………… 100

ix
5. Application of biasing potential replica exchange molecular dynamics simulation for refinement and loop modeling of proteins in explicit solvent 105 5.1 Abstract ……………………………………………………………………. 105 5.2 Introduction ………………………………………………………………... 106 5.3 Materials and Method ……………………………………………………. 110
5.3.1. Test sets ……….….………………………………………………. 110 5.3.2. Simulation details …………………………………………………. 110 5.3.3. Biasing Potential Replica Exchange Simulations ……………... 111
5.4 Results …………………………………………………………………...... 112 5.4.1. Loop modeling ……………………………………………………... 112 5.4.2. Phi/Psi analysis for 5znf loop …………………………………….. 115 5.4.3. Molecular Dynamics Refinement simulations …………………… 116
5.5 Discussion …………………………………………………………………. 119 5.6 References ………………………………………………………………… 121
6. Discussion and Outlook 129 Appendix 132
x
List of Figures 1.1 Schematic diagram of an amino acid …………………………………………. 4 1.2 Schematic diagram of a peptide bond formation ……………………………. 5 1.3 Diagram showing a polypeptide chain with backbone dihedral angles ……. 5 1.4 Ramachandran plot showing allowed combination of conformational angles 6 1.5 Schematic diagram of alpha helix structures …………………………………. 7 1.6 Schematic diagram of beta sheet structures …….……………………………. 8 1.7 Folding energy landscape …………………...…………………………………. 10 1.8 Pictorial representation of Rex-MD algorithm ………………………………… 18 2.1 Heavy atom Rmsd of sampled DNA conformations during continuous MD. 30 2.2 Heavy atom Rmsd of sampled DNA conformations during Rex-MD ……… 31 2.3 Superposition of folded and misfolded DNA hairpin structures ……………. 33 2.4 Cluster centroids of the Rex-MD simulations ………………………………… 34 2.5 Rmsd of loop and stem of sampled DNA conformations during Rex-MD … 35 2.6 2D-plot of loop Rmsd Vs. stem Rmsd of sampled DNA conformations during
Rex-MD …………………………………………………………………………… 36 2.7 Specific water binding to the hairpin loop motif in the DNA minor groove… 37 2.8 Folding intermediates of the DNA-tri-nucleotide hairpin loop ……………… 38 2.9 Temperature dependence of hairpin loop stability ………………………….. 41 3.1 Ramachandran plot of the sampled conformation of the alanine didpeptide
using 5 levels of biasing potential ……………………………………………... 59 3.2 Comparison of backbone dihedral angle of the sampled alanine dipeptide
conformations during continuous MD and BP-Rex MD simulations ………. 60 3.3 Comparison of backbone dihedral angle of the sampled threonine dipeptide
conformations during continuous MD and BP-Rex MD simulations ……… 61 3.4 Rmsd of sampled hexa-Ala conformations during continuous MD ….......... 62 3.5 Rmsd of sampled hexa-Ala conformations during BP-Rex MD ……..…….. 63 3.6 Accumulation of conformational cluster during continuous and BP-Rex MD 65 3.7 Rmsd of sampled chignolin peptide conformations during continuous MD and
BP-Rex MD simulations …………………………………………...……..…….. 66 3.8 Stereo view of folded chignolin peptide during BP-Rex MD ……………….. 67 4.1 Rmsd of sampled Trp-cage conformations during continuous MD and BP-Rex
MD simulations ………………………………………………………………….. 84 4.2 Cluster centroids of Trp-cage conformations during BP-Rex MD …………. 85
xi
4.3 Secondary structure plots of the sampled Trp-cage conformations during continuous MD and BP-Rex MD simulations ……………………………....... 87
4.4 Accumulation of secondary structures of sampled Trp-cage conformations during continuous MD and BP-Rex MD simulations ……………………....... 87
4.5 Cluster centroids and accumulation of conformational clusters …………… 89 4.6 Comparison of backbone dihedral angle of sampled Asp9 residue during
continuous MD and BP-Rex MD simulations ………………………………… 90 4.7 Free energy landscape of sampled Trp-cage conformations during BP-Rex
MD simulations ………………………………………………………………….. 91 4.8 Comparison of backbone and side chain dihedral angle of the Trp6 residue
during continuous MD and BP-Rex MD simulations ………………………… 93 4.9 Trp-Pro stacking and Asp-Arg salt bridge in near native Trp-cage structures
……………………………………………………………………………………. 94 4.10 Average number of water molecules during BP-Rex MD simulations …. 95 4.11 Location of bridging water molecules frequently found during BP-Rex MD
simulations ……………………………………………………………………… 96 5.1 Rmsd of sampled loop conformations during continuous MD and BP-Rex MD
simulations …………………………………………………………….……….. 112 5.2 Incorrect start structure and correctly folded loop structure of protein model
pdb1pft during BP-Rex MD simulation ……………………………………… 113 5.3 Incorrect start structure and correctly folded loop structure of protein model
pdb5znf during BP-Rex MD simulation ……………………………………… 115 5.4 Comparisons of backbone dihedral angle of the loop residues of protein
model pdb5znf during continuous MD and BP-Rex MD simulations …….. 116 5.5 Decoy start structure and best refined structure of protein model pdb1r69
during BP-Rex MD simulation ………………………………………………... 117 5.6 Rmsd of sampled conformations during continuous MD and BP-Rex MD
refinement simulations ……………………………………………….……….. 117 5.7 Decoy start structure and best refined structure of protein model pdb1pgx
during BP-Rex MD simulation ………………………………………………... 119

xii
List of Tables 3.1 Dihedral angle parameters for backbone dihedral angles Phi and Psi at
different biasing levels…………………………………………………………. 56 3.2 Distribution of peptide backbone conformational states observed during MD
simulations …………………………………………………………………….. 62 5.1 Test systems and results of loop modeling simulations …………….......... 114 5.2 Test systems and results of refinement simulations ………..………......... 118

xiii
To my parents
1
Chapter 1
Introduction Proteins are synthesized in the cell as linear chain molecules that fold into well defined
tertiary structures essential for their function. The prediction of the structure of proteins
and other biomolecules is a great challenge in bioinformatics and structural biology. The
prediction of structures and interactions of biology molecules at atomic level can help to
understand its functions and may allow the creation of macromolecules with new and
desired function. Although the protein folding problem i.e. “understanding of how the
amino acid sequence of a protein molecule folds into a complex three dimensional
structure” still remains as an unsolved issue, there are both experimental and
computational methods available to determine or model the three dimensional structure
of a biomolecule. Conventional experimental methods like high resolution X-ray
crystallography and NMR (nuclear magnetic resonance) spectroscopy can predict both
the complex structures (protein – protein, protein – ligand, protein – DNA) as well as the
isolated structures (protein, DNA). However, X – ray crystallography provides only a
static picture of the molecules and it is also not clear how the crystal environment
influences the structural details. The NMR spectroscopy method allows us to study the
average structure and only long time dynamics of biomolecules. Moreover, the use of
NMR is limited by the size of the biomolecules. Computer simulations have evolved as
an alternative method for the dynamics and structure prediction of biomolecules. In the
past several years numerous computer simulation methods have been proposed from
low resolution lattice-based to high resolution all-atom simulations. In the recent years
Molecular Dynamics [MD] simulations have become a powerful tool to study the
structure and dynamics of complex molecular systems in atomic detail. MD simulations
describe the time evolution of a molecular system by integrating Newton’s equation of
motion for all atoms. These motions are based on the physical interactions between
Introduction
2
particles of the system including explicit solvent molecules and ions in addition to the
biomolecule of interest. Because of its high time resolution and detailed atomic level
representation, these MD simulations have played an increasingly important role in
biology, biochemistry and biophysics.
The application of classical MD simulation for structure prediction is limited to
biomolecules that are small in size. Additionally, the time scale that a Classical
Molecular Dynamics simulation (C - MD) can cover is limited to the order of tens to
hundreds of nanoseconds. Biomolecules like peptides and proteins can adopt several
locally stable conformations. In a potential energy landscape these locally stable
conformations (low energy conformations) corresponds to local minima (minima with low
energy), and these local minima are separated from each other by high energy barriers.
Standard MD simulation at room temperature may be kinetically trapped in one of these
local minima and conformational transitions between stable states can therefore be rare
events even on the time scale of tens to hundreds of nanoseconds that have become
possible for peptide simulations.
Conformational sampling is a major bottleneck in MD simulations and it’s the subject of
my thesis. The main aim of my PhD is to develop a method to enhance the
conformational sampling of biomolecules during MD simulations. In the first part of my
PhD work, the Replica Exchange Molecular Dynamics (Rex MD) simulation, one of most
widely used method to enhance conformational sampling was used to study the
structure formation of a DNA hairpin loop with explicit solvent. Since the temperature
Rex MD simulations method is computationally expensive for larger systems (as the
number of required replicas (temperatures) is increasing with increasing system size) a
new Hamiltonian based replica exchange MD method was developed during second part
of my Ph.D. This newly developed Biasing Potential Replica Exchange Molecular
Dynamics (BP-Rex MD) simulation method focuses on the protein backbone flexibility
and employs a specific biasing potential to promote peptide backbone transitions as a
replica coordinate. The purpose of the biasing potential is to reduce the energy barriers
associated with peptide backbone dihedral transitions. The level of biasing is gradually
changed along the replicas such that frequent transitions are possible at high levels of
biasing and the system can escape from getting trapped in local energy minima. Since
exchanges between replicas are independent of the number of solvent molecules the
Introduction
3
method requires much fewer replicas for efficient sampling compared to standard
temperature Rex MD. The biasing potential Rex MD (BP-Rex MD) method was tested on
several dipeptides, one alpha and one beta peptide (all including explicit solvent) and its
sampling efficiency was compared with standard MD simulations. Then this BP-Rex MD
was used to study the folding of the Trp-cage mini-protein in explicit solvent. In the last
part of my PhD, BP-Rex MD method was applied for modeling of loops in homology
modeled proteins and to refine homology modeled proteins in explicit solvent.
1.1 Nucleic acid structure Nucleic acids play an essential role in many biological processes ranging from storage
and transfer of genetic information to active enzymatic functions in translation and
regulation of gene expression. Nucleic acids such as deoxyribonucleic acid (DNA) and
ribonucleic acid (RNA) are polymers of nucleotides linked in a chain by phosphodiester
bonds. Nucleotides have a distinctive structure composed of three components that are
covalently bound together. A phosphate group, a 5-carbon group (ribose in the case of
RNA and deoxyribose in the case of DNA) and a nitrogen-containing "base" - either a
pyrimidine (cytosine (C) and thymine (T) in DNA and cytosine (C) and uracil (U) in RNA)
or purine (Adenine (A) and guanine (G) ). DNA and RNA are synthesized in cells by
DNA polymerases and RNA polymerases. The process involves forming phosphodiester
bonds between the 3' carbon of one nucleotide and the 5' carbon of another nucleotide.
This leads to formation of the so-called "sugar-phosphate backbone". Most DNA exists
in the famous form of a double stranded helix, in which two linear strands of DNA are
wrapped around one another by complementary base pairing: Adenine forms two
hydrogen bonds with Thymine, and Guanine forms three hydrogen bonds with Cytosine.
The two strands of DNA are arranged antiparallel to one another. RNA’s are usually
single stranded, however many RNA molecules have secondary structure in which
intramolecular loops are formed by complementary base pairing as in DNA molecule.
Adenine forms hydrogen bonds with Uracil and Guanine forms hydrogen bonds with
Cytosine in the case of RNA.

Introduction
4
1.2 Protein structure Proteins are a particular type of biological molecules that can be found in every single
living being on the earth. Proteins constitute the working force of living beings,
performing almost every task that is complicated. They serve as passive building blocks
of many biological structures. As hormones they transmit information and signals
between cells and organs, as antibodies they defend the organisms against intruders, as
protein channels they control the transports through membrane and much more. Due to
its participation in almost every task that is essential for life, understanding its function is
highly important. Unlike nucleic acids the structure of a protein molecule is very complex
and its structure formation is more difficult to understand. Proteins are linear
heteropolymers made up of twenty different types of amino acids monomers. Each of
these amino acids has a fundamental design composed of a central carbon (also called
the alpha carbon - Cα ) bonded to: a hydrogen atom, a carboxyl group (-COOH), a amino
group (-NH2) and a unique side chain or R – group.
Figure 1.1: Schematic diagram of an amino acid. A central carbon atom (Cα) is attached to an
amino group (NH2), a carboxyl group (COOH), a hydrogen atom (H), and a side chain (R).
This unique side chain or R – group distinguishes one amino acid from another one and
dictates chemical properties for an amino acid. Based on the R – group amino acids can
be classified as being hydrophobic versus hydrophilic, and uncharged versus positively-
charged and negatively-charged. The amino acid sequence of a specific protein
molecule is determined by the gene that encodes it. First the gene is transcribed into a
messenger RNA (mRNA) and then this mRNA is translated into a protein by ribosome.
The sequence of amino acids that form a polypeptide is called the primary structure. The
polypeptides are formed by linking the carboxyl group of one amino acid to the amino
H
N
H
Cα
R
C’
OH
H
O

Introduction
5
acid group of another amino acid with a peptide bond. These peptide bonds are formed
via dehydration synthesis reaction between the carboxylic acid group (COOH) of amino
acid i to the amino group (NH2) of amino acid i + 1.
i i + 1 peptide bond
Figure 1.2: Schematic diagram of a peptide bond (C – N) formation between the carboxyl group
of amino acid i with amino group of amino acid i + 1.
The formation of a succession of peptide bonds generates a main chain or backbone
conformation from which the various side chains are projected. This repeating unit in a
main chain is called peptide units and is the basic building blocks of protein structures.
All the atoms in a peptide unit are fixed in a plane with the bond lengths and bond angles
very nearly the same in all peptide units in all proteins. And the only degrees of freedom
they have are rotations around these bonds the Cα – C’ and the N - Cα bonds. The angle
of rotation around the N - Cα bond is called PHI (φ) and the Cα – C’ bond is called PSI
(ψ) (figure 1.3).
Figure 1.3: diagram showing a polypeptide (Alanine dipeptide) chain, with backbone dihedral
angle φ (angle of rotation around N - Cα bond) and ψ (angle of rotation around Cα – C’ bond).
H
H N Cα
R
C’
OH
H O
+ H
H N Cα
H
C’
RO
OH
H
H N Cα
R
H
C
O
N
H
Cα
H
C’
R O
OH
Φ
ψC NCα
Cβ
C
N
Introduction
6
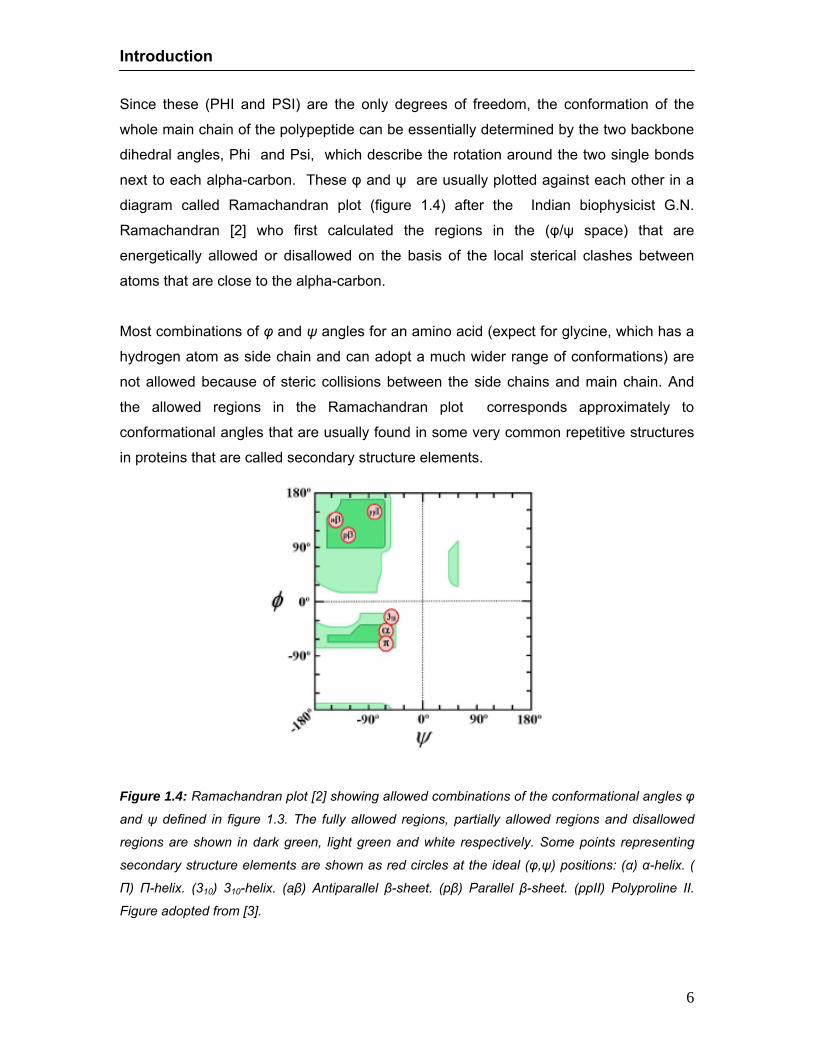
Since these (PHI and PSI) are the only degrees of freedom, the conformation of the
whole main chain of the polypeptide can be essentially determined by the two backbone
dihedral angles, Phi and Psi, which describe the rotation around the two single bonds
next to each alpha-carbon. These φ and ψ are usually plotted against each other in a
diagram called Ramachandran plot (figure 1.4) after the Indian biophysicist G.N.
Ramachandran [2] who first calculated the regions in the (φ/ψ space) that are
energetically allowed or disallowed on the basis of the local sterical clashes between
atoms that are close to the alpha-carbon.
Most combinations of φ and ψ angles for an amino acid (expect for glycine, which has a
hydrogen atom as side chain and can adopt a much wider range of conformations) are
not allowed because of steric collisions between the side chains and main chain. And
the allowed regions in the Ramachandran plot corresponds approximately to
conformational angles that are usually found in some very common repetitive structures
in proteins that are called secondary structure elements.
Figure 1.4: Ramachandran plot [2] showing allowed combinations of the conformational angles φ
and ψ defined in figure 1.3. The fully allowed regions, partially allowed regions and disallowed
regions are shown in dark green, light green and white respectively. Some points representing
secondary structure elements are shown as red circles at the ideal (φ,ψ) positions: (α) α-helix. (
Π) Π-helix. (310) 310-helix. (aβ) Antiparallel β-sheet. (pβ) Parallel β-sheet. (ppII) Polyproline II.
Figure adopted from [3].

Introduction
7
Statistical analysis of the experimentally determined protein structures shows a
particular combination of φ and ψ angles for some important secondary structure
elements in polypeptides [3] (figure 1.4): α -helix: (-57,-47), 310-helix (-49,-26), Π -helix (-
57,70), Polyproline II (-79,149), Parallel β sheet (-119,113) and antiparallel β sheet (-
139,135).
Certain arrangement of backbone geometries (angles) that are frequently found and are
stabilized by hydrogen bonds is called secondary structural elements. α - helices
(α,310,Π) and β – sheets (parallel and antiparallel) are the most common secondary
structure elements of proteins.
A B C
Figure 1.5: side (upper panel) and top view (lower panel) of the three helices found in protein
native structures. (a) 310 - helix, (b) α - helix, and (c) Π - helix. In all the three cases, the helices
shown are 11-residues long. In the side views (upper panel), the hydrogen bonds are depicted as
green dotted lines and the distance and number of turns spanned by 10 residues are indicated at
the right of the structures. In the top view the side chains (purple color) and hydrogen atoms are
shown explicitly, whereas in the side views, these are removed for visual convenience. Figure
adopted from ref [3].
α - helix is a coil like structure with 3.6 residues per turn in which the carbonyl (C=O) of
each i - th residue forms a hydrogen bond with the amino group (N-H) of the residue i +
4. 310 helix is also a coil like structure in which the carbonyl (C=O) of each i - th residue
forms a hydrogen bond with the amino group (N-H) of the residue i + 3, which is more

Introduction
8
tightly wound and therefore longer than an α - helix of the same chain length. In Π –
helix, hydrogen bonds are formed between the carbonyl (C=O) of each i - th residue with
the amino group (N-H) of the residue i + 5, and this Π - helix is wider and shorter than
an α -helix of same chain length. An α - helix in theory can be either right – handed or
left – handed depending on the screw direction of the chain. However most of the α -
helix that is observed in proteins is always right-handed, except that a short regions of
left- handed α - helices occurs occasionally.
A B
Figure 1.6: β - sheets in the pure (a) antiparallel (b) parallel versions. The side view is shown in
the right and top view is shown in the left side for both. In the top views the hydrogen bonds are
depicted as green dotted lines. In the side view the side chains (purple color balls) and α -
hydrogens are shown explicitly, whereas in the top views, these are removed for visual
convenience. Figure adopted from ref [3].
β - sheet is the second major secondary structural elements that are usually found in
native states of polypeptide chains. This structure is built up from a combination of
several regions of the polypeptide chain, in contrast to the α - helix, which is usually built
from one continuous region. These β - strands are usually from 5 to 10 residues long
and are in almost fully extended conformation with φ , ψ angles with in the broad
structurally allowed region in the upper left quadrant of the Ramachandran plot (figure
1.4). These β - strands are aligned adjacent to each other such that hydrogen bonds
can form between the C’=O groups of one β - strand and N – H groups on an adjacent β
- strand and vice versa. Two different arrangements of these single strands can form
different β - sheets. In antiparallel β - sheets the strands run in opposite direction and in

Introduction
9
parallel β - sheets the strands run in same direction. And the combination of mixed
parallel-antiparallel β - sheets can also be found.
In a protein molecule these various secondary structural elements α - helices and β -
sheets are connected by flexible parts of various lengths and irregular shape. These are
called loop regions and are usually at the surface of the molecule and are exposed to
solvents.
These secondary structure elements that are connected by loops are further stabilized
by hydrophobic interactions, disulfide bonds, electrostatic interactions, hydrogen bonds
and salt bridges constituting the final tertiary structure of proteins. These final tertiary
structures are nothing but the folded domain of proteins and can serve as modules for
building up large assemblies such as virus or muscle fibers or specific catalytic binding
sites. This tertiary structure of protein monomers associate and forms more complex
systems that are usually referred as quaternary structure of protein molecules.
1.3 Protein Folding The folded structure or native structure of a biomolecules is a prerequisite for its function
in the living cell. Since protein molecules are not manufactured in its folded
conformations, but are synthesized linearly in the ribosome it is possible to assume that
there could be some specific cellular machinery that is responsible for the complicated
folding process. Indeed in vivo, several proteins require such chaperone machinery to
adopt a correctly folded structure. However in the 1950’s, with a series of experiments
Anfinsen and coworkers [4] concluded that the global three dimensional structure of
many protein molecules could be reached reliably by the protein molecule using only the
information in the proteins amino acid sequence. It means there is a well defined, single
native state for most protein molecules and this structure is somehow found during the
folding process within the few microseconds up to minutes from the enormous number of
accessible configurations. In the late 1960’s Levinthal [5] argued that if in the course of
folding, a protein is required to sample all possible conformations and the conformations
of a given residue are independent of the conformations of the rest then the protein will
never fold into its native structure (in reasonable time). By a simple calculation he
showed, that within a reasonable time it’s impossible to find the native state of protein

Introduction
10
molecule by sampling all the possible conformations in the conformational space by
random search. He proposed that the folding process occurs along well-defined
pathways that take every protein molecule to the native structure, through unstable
intermediates. In late 1980’s a new view [6 - 9] of folding energy landscape ideas has
emerged based on statistical mechanics. According to this view folding occurs through
ensembles of microstates rather than through only few uniquely defined intermediates.
The main idea emerging from the statistical energy landscape theory is that the protein
folding landscape is depicted as a rugged funnel, contains traps in which the protein
temporarily resides on its way to the native structure. In the early stages of folding the
funnel guides the protein through many different sequences of traps towards the low
energy folded structure. Hence there is not a single pathway but there are multiple
routes for a protein molecule to reach its native state.
Figure 1.7: A rugged energy landscape with kinetic tarps, energy barriers, and some narrow
throughway paths to native. Folding can be multi-state. Figure taken from ref [10].
Recently Dill’s funnel landscape (figure 1.7) [10] explained how proteins could avoid
Levinthal’s paradox and fold quickly. He showed that “folding may proceed in two or
more kinetic phases, often with fast collapse to a compact ensemble followed by slow
reconfiguration of kinetically trapped compact non-native conformations into the native
structure”.

Introduction
11
1.4 Molecular Dynamics (MD) simulations The following sections explains the basics of Molecular dynamics simulations and force
field methods. With MD simulations one can calculate the realistic motions or dynamics
of a molecular system like a protein within short timescales from a few picoseconds to
nanoseconds. The motions are based on the physical interactions between particles of
the system including explicit solvent molecules and ions in addition to the biomolecules
of interest. The physical interactions are derived from a force field from which the
motions can be calculated via solving Newton’s equations of motion. Finally, the forces
can be calculated from potential energy terms that had been empirically adapted to
experimental data on specific properties of distinct small molecules. Obtaining the
dynamics of a system is an iterative procedure that during the first step the coordinates
of the particles gives the potential energy from which the forces and motions are then
calculated. Thus, the particle attains new positions further the new energy and so on.
Thus the MD simulations are in principle deterministic.
The classical force fields that control the motion of particles are more approximate
compared to a quantum mechanical treatment. Quantum mechanics requires calculating
wave function for the entire system (electron coordinates), but in molecular mechanics
(classical force fields) only the average effect of the electrons is considered. Force field
methods ignore the electronic motion and calculate the energy of a system as a function
of the nuclear positions alone (Born-Oppenheimer approximation). Though the quantum
mechanical calculations are the most accurate way to describe the atomic properties, in
some cases the molecular mechanics can provide answers that are as accurate as
quantum mechanics in a fraction of computer time. Molecular mechanics is based on a
simple model of interactions within a system with contributions from processes such as
bond stretching, bond angle and bond rotational motions and also consider the
interactions between non-bonded parts of the system. A typical force field equation for a
macromolecule consisting of N particles contains the following energy contributions:
(1)
elecvdwtorsionanglebondtotN EEEEEErV ++++==)(
Introduction
12
Where Etot is the total energy of a molecule, Ebond is the bond stretching energy term,
Eangle is the angle bending energy term, Etorsion is the torsional energy term, Evdw is the
van der Waals energy term and Eelec is the electrostatic energy term.
The Ebond, Eangle and Etorsion corresponds to bonded interaction and sum over the sets of
all bonds, angles and dihedral angles respectively. The Evdw and Eelec corresponds to the
non-bonded interactions such as Lennard-Jones and Columbic potential and sum over
all atom pairs (i,j) that are separated by three bonds or more.
Bond-stretching between two covalently bonded atoms (i,j) can be described by a
simple harmonic potential function
(2)
Where K i is the bond stretching force constant, 0,il is the reference bond length and il
is the actual bond length between two bonded atom i, j and these bond lengths are
defined for each type of atom pairs.
Bond-angle bending between three consecutively bonded atoms (i,j,k) can also be
described by a simple harmonic potential function, where atoms i-j and j-k are covalently
bonded.
(3)
Where Hi is the angle bending force constant, θi,0 is the equilibrium value for the bond
angle and θi is the actual value for the bond angle between the three atom i, j, k, and
these angles are defined for each type of atom triplets.
Dihedral angle potential energy term between four atoms (i,j,k,l) is usually expressed as
a cosine series expansion
(4)
( )20,
2ii
i llKEbonds
bond −= ∑
( )20,
2ii
i
anglesangle
HE θθ −= ∑
( ))cos(12
γ−+= ∑ ii nwnVE
torsionsdihedral
Introduction
13
Where nVi is the dihedral angle energy constant, ωi corresponds to the dihedral angle
for the quadruple of atoms i-j-k-l. n corresponds to the multiplicity and gives the number
of minima in the cosine function and γ the phase factor determines which dihedral angle
values correspond to these minima. nVi , n, γ are set for each type of atom quadruplets.
The non-bonded interactions are usually defined by van der Waals and Electrostatic
interactions. The van der Waals interactions between not directly connected atoms are
usually represented by a Lennard-Jones potetntial function.
(5)
Where Aij is the repulsive term coefficient, Bij is the attractive term coefficient and rij is the
distance between the two atoms i and j. Eij corresponds to the Lennard-Jones energy.
The electrostatic interactions are usually described by a simple Columbic potential
function
(6)
Where qi and qj correspond to the atomic charges of interacting atoms i and j,
respectively, and rij corresponds to the distance between the two atoms. ε0 is the
dielectric constant.
The equilibrium values of these bond lengths and bond angles and the corresponding
force constants used in the potential energy function defined in the force field are
obtained from either quantum mechanics, experimental measurement or through
empirical trail and error method.
Molecular Dynamics is a sampling method based on discrete time stepping for
integrating the Newton equation of motion for interacting bodies. The physical forces are
derived via:
(7)
∑∑= +=
⎥⎦⎤
⎢⎣⎡=
N
i
N
ijelec
ij
ji
rqqE
1 1 04πε
)( NrVF Δ−=
∑∑= += ⎥
⎥⎦
⎤
⎢⎢⎣
⎡⎟⎠⎞
⎜⎝⎛−⎟
⎠⎞
⎜⎝⎛=
N
i
N
ijvdw
ij
ij
ij
ijij
rB
rAE
1 1
612
4ε
Introduction
14
from the total potential energy V(rN) as a function of the positions (r) of N particles. Due
to the above-mentioned deterministic character in MD simulations forces have to be
calculated along equation (7) at every step from the whole energy term to evaluate the
movements of the particles in the system. Many integration algorithms exist, allowing for
varying accuracy at the cost of speed. One of the most commonly used algorithms for
integrating the equations of motion in a molecular dynamics simulation is so-called
Verlet algorithm [15]. It approximates particle positions, velocities and accelerations as
Taylor series expansions and calculates positions at time t + Δ t based on positions and
accelerations at time t and t - Δ t.
(8)
The velocities do not explicitly occur in the Verlet algorithm. In the present work the
leapfrog version [16] of the Verlet algorithm is used instead, where the velocities at a
time-step t + ½ Δ t are derived first from the velocities at time t - ½ Δ t and the
accelerations at time t via the following equations
(9)
Then the positions at time t + Δ t can be examined from
(10)
One advantage of the leap-frog version compared to the original Verlet algorithm is that
the velocities are explicitly included in the derivation of the positions from the forces. The
most demanding part of the calculations in a molecular dynamics simulation is the
calculations of the force and interaction energies for each particle in the system. The
valence bonds vibrate at high frequency and impose a small integration time step to a
simulation. Constrained dynamics can be employed to use larger time steps for avoiding
too long simulation time with sufficient accuracy. SHAKE algorithm [17] is often used to
constrain every X - H bond to their reference length so that the step duration can be
)()()(2)(
)(21)()()(
)(21)()()(
2
2
2
tatttrtrttr
tatttvtrttr
tatttvtrttr
Δ+Δ−−=Δ+
Δ+Δ−=Δ−
Δ+Δ+=Δ+
)t(amF =
ttrttrttv
Δ−Δ+
=Δ+)()()2
1(
Introduction
15
extended to 2 fs. It has been shown that the introduction of bond length constraints has
little effect on structure and dynamics in MD [18].
In molecular dynamics the systems are conservative which means that the total energy
of the system is constant. The energy term of the kinetic energy has also to be included
as
(11)
where kb is the Boltzmann constant, Nc the number of constraints and so 3N - Nc is the
total number of degrees of freedom. In this equation, velocities and temperature are
connected and are used to perform molecular dynamics under a constant temperature.
This allows for simulation of a canonical ensemble, which corresponds to a closed
system where the number of the particles, the volume and the temperature are kept
constant. The purpose of temperature regulation is to mimic physiological conditions or
performing simulations at a temperature significantly higher than room temperature to
artificially increase the protein’s flexibility, which may accelerate the simulation. To keep
the temperature constant a scaling factor λ is included to the system’s velocities in the
(above) equation (11) [19] so that the temperature difference between two steps
becomes
(12)
The system is artificially coupled to a heat bath with the designated temperature in a way
that surplus temperature is transferred from one system to the other and back to
maintain the temperature of the simulated system [20]. The coupling is carried out with
(13)
using the parameter τ , which determines the coupling strength between the bath, the
simulated system and the discrete length of the time step Δt. As a consequence the
temperature of the system is fluctuating around the reference temperature. Choosing an
appropriate value for τ (typically between 0.5 and 2 ps) allows for regulating the
temperature fluctuation. Molecular Mechanics calculations are sometimes carried out
∑=
−==N
ic
b
i
ikin NNTk
mpV
1
2
)3(22
||
( ) ( )∑=
−=−=ΔN
iii
b
i tTvvNkmT
1
222 )(1)(32
21 λλ
))(( tTTtT bath −Δ
=Δτ

Introduction
16
under vacuum conditions. A more realistic approach is to use the solvent explicitly. This
is done by soaking the molecule in box of solvent molecules. Several water models are
in use, in the present work the TIP3P water model [21] has been used. In this water
model, the water molecule is defined as a molecule with rigid triangular gemetory having
a partial charge at each angle referring to the two hydrogens and the intermediate
oxygen atom of a real water molecule. But the explicit description of water molecule
requires additional computational effort. Periodic Boundary Conditions (PBC) is normally
employed to model the bulk solvent. In infinite PBC, the simulation box is infinitely
replicated in all directions to form a lattice. In practice most molecular dynamics
simulations evaluate potentials using some cutoff scheme for computational efficiency.
In these cutoff schemes, each particle interacts with the nearest images of the other N-1
particles or only with those minimum images contained in a sphere of radius Rcutoff
centered at the particle. Usually the cutoff distance of less than half the length of box is
used. However for long range interactions such as electrostatic interactions, for which
the range exceeds half the box, size methods such as Particle Mesh Ewald summation
[22] or Ewald summation [23] are used.
1.5 Conformational Sampling problem The application of classical molecular dynamics (MD) simulations for structure prediction
of peptide and proteins is limited by the accuracy of current force fields and the
simulation time scale. Even on the time scale of tens to hundreds of nanoseconds,
simulations of large scale conformational motions of proteins (such as protein folding)
are rare events because of its nature of the potential energy landscape which is rugged (
the local energy minima are separated by high energy barriers). In C-MD (Traditional
MD) simulations the system gets trapped into these minima’s for longer time because of
the difficulty in crossing the high energy barriers between local minima, that results in
poor sampling conformational space. Conformational sampling is a major bottleneck in
MD simulations and it was the subject of many recent reviews. Various methods have
been proposed to overcome the conformational sampling problem during molecular
simulations [26, 27]. For example, simulated annealing techniques are frequently used to
effectively cross energy barriers at high simulation temperatures followed by slow
cooling of the simulation system to select low energy states [28]. However, high initial
temperatures used in simulated annealing approaches may interfere with the presence
Introduction
17
of explicit water molecules during MD simulations. Alternatively, potential scaling
methods have been suggested where the original potential is scaled down or replaced
by a soft core potential in order to lower barriers during energy minimization or a
molecular dynamics simulation [29-36]. One very promising method to enhance the
conformational sampling during MD simulations [37, 38] is the Replica Exchange method
(Rex - MD) or parallel tampering method.
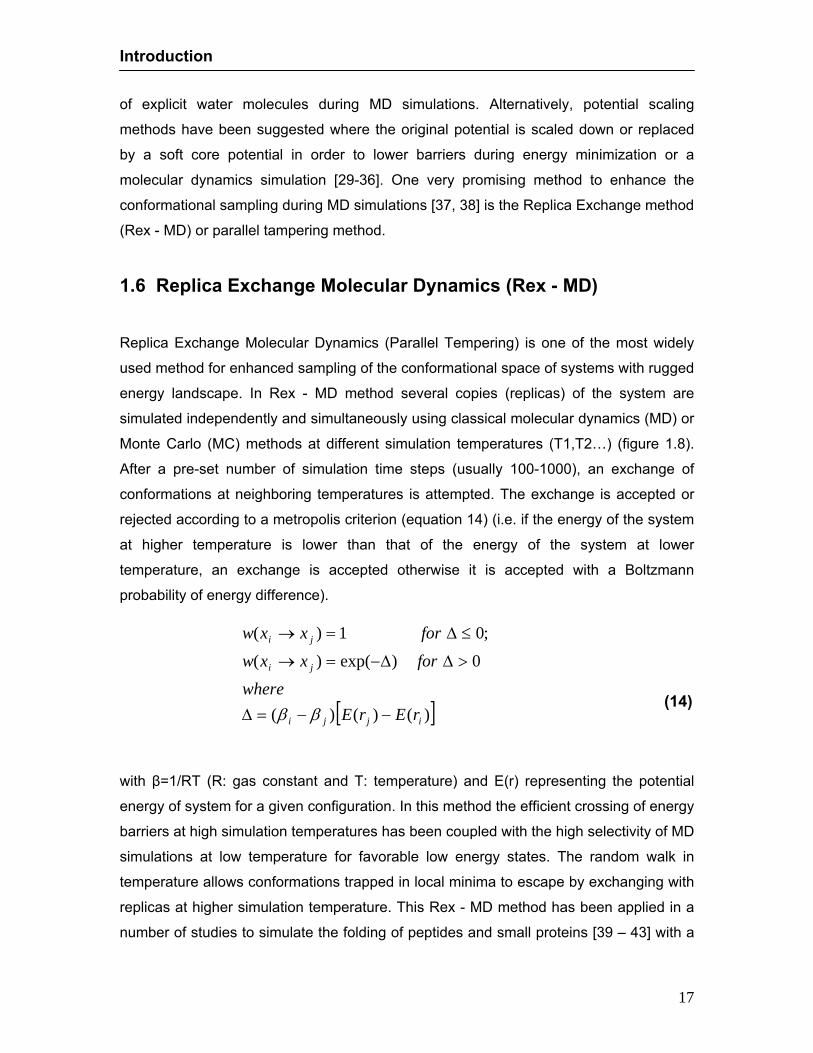
1.6 Replica Exchange Molecular Dynamics (Rex - MD) Replica Exchange Molecular Dynamics (Parallel Tempering) is one of the most widely
used method for enhanced sampling of the conformational space of systems with rugged
energy landscape. In Rex - MD method several copies (replicas) of the system are
simulated independently and simultaneously using classical molecular dynamics (MD) or
Monte Carlo (MC) methods at different simulation temperatures (T1,T2…) (figure 1.8).
After a pre-set number of simulation time steps (usually 100-1000), an exchange of
conformations at neighboring temperatures is attempted. The exchange is accepted or
rejected according to a metropolis criterion (equation 14) (i.e. if the energy of the system
at higher temperature is lower than that of the energy of the system at lower
temperature, an exchange is accepted otherwise it is accepted with a Boltzmann
probability of energy difference).
(14)
with β=1/RT (R: gas constant and T: temperature) and E(r) representing the potential
energy of system for a given configuration. In this method the efficient crossing of energy
barriers at high simulation temperatures has been coupled with the high selectivity of MD
simulations at low temperature for favorable low energy states. The random walk in
temperature allows conformations trapped in local minima to escape by exchanging with
replicas at higher simulation temperature. This Rex - MD method has been applied in a
number of studies to simulate the folding of peptides and small proteins [39 – 43] with a
[ ])()()(
0)exp()(
;01)(
ijji
ji
ji
rErEwhere
forxxw
forxxw
−−=Δ
>ΔΔ−=→
≤Δ=→
ββ

Introduction
18
demonstrated enhancement of the sampling of relevant conformational states compared
to long simulations at a single temperature. In order to obtain good sampling, one should
guarantee a relatively high exchange ratio, so that all structures are subjected to high
and low temperatures. Efficient exchange between replicas requires sufficient overlap of
the energies between neighboring replicas
Time (ns) Figure 1.8: Pictorial representation of Rex - MD algorithm, simulation time scale is in x-axis and
the temperatures are in y-axis. Arrow crossing indicates exchange between parallel simulations at
different temperatures.
The main drawback of the Rex - MD is that the number of replicas needed increases
with system size. The bigger the system, more the number of atoms, higher the potential
energy and more replicas are needed to ensure sufficient energy overlap in the given
temperature range. As a consequence, the number of required replicas grows
approximately with the square root of the number of particles in the system [44]. A larger
number of replicas in turn require also increased simulation times in order to allow
efficient “traveling” of replicas in temperature space.
T6
T5
T4
T3
T2
T1

Introduction
19
1.7 Outline of this thesis In this thesis an alternative “Hamiltonian” replica-exchange method has been developed
to enhance the conformational sampling of biomolecules during Molecular Dynamics
simulation, which was termed Biasing Potential Replica Exchange MD. This method
specifically focuses on the protein backbone flexibility and employs a specific biasing
potential to promote peptide backbone transitions as a replica coordinate. The purpose
of the biasing potential is to reduce the energy barriers associated with peptide
backbone dihedral transitions. The level of biasing is gradually changed along the
replicas such that frequent transitions are possible at high levels of biasing and the
system can escape from getting trapped in local energy minima.
In the first part of my thesis, the application of Temperature based Replica Exchange
Molecular Dynamics (T-Rex MD) simulations on folding of DNA hairpin loop in explicit
solvent is discussed (chapter 2). Comparison of this T-Rex MD with standard MD
simulations on folding of hairpin loop and the folding simulation studies are discussed in
detail in chapter 2. In the second part, the development of Biasing Potential Replica
Exchange Molecular Dynamics (BP-Rex MD) simulation method is described in detail
(chapter 3) and the comparison of this BP-Rex MD simulation with standard MD
simulations on enhance sampling of dipeptide conformations is discussed. The
application of BP-Rex MD simulation method for structure prediction of small alpha and
beta peptides are also discussed in chapter 3. Then in the chapter 4, the newly
developed BP-Rex MD Simulation method is used for folding simulation studies of Trp-
cage mini protein in explicit solvent. The folding simulation results are discussed in detail
and comparison to previous simulation studies are also discussed in chapter 4. In
chapter 5, the application of BP-Rex MD for loop modeling and refinement of protein
models are discussed in detail. The advantages and disadvantages of this BP-Rex MD
as well as the outlook of this project are discussed in the last chapter of this thesis.
Introduction
20
1.8 References
1. Branded, C., Tooze, J. Introduction to protein structure. (second edition). Garland
Publishing Inc. 1998.
2. Ramachandran, GN., Ramakrishnan, C. Stereochemistry of polypeptide chain
configurations. J. Mol. Biol. 1963;7:95-99.
3. Echenique, P. Introduction to protein folding for physicists. Contemporary
Physics. 2007;48:81-108.
4. Anfinsen, CB. Principles that govern the folding of protein chains, Science.
1973;181:223-230.
5. Levinthal, C. Are there pathways for protein folding? J. Chim. Phys. 1968;65:44 -
45.
6. Chan, HS., Dill, KA. Protein folding in the landscape perceptive: Chevron plots
and non-Arrhenius kinetics. Proteins : Struc. Funct. Genet. 1998;30:2-33.
7. Bryngelson, JD., Onuchic, JN., Socci, ND., Wolynes, PG. Funnels, pathways,
and the energy landscape of protein folding: a synthesis. Proteins 1995;21:167-
195.
8. Dobson, CM., Karplus, M. The fundamentals of protein folding: bringing
together theory and experiment. Curr Opin Struct Biol 1999;9:92-101.
9. Onuchic, JN., Luthey-Schulten, Z., Wolynes, PG. Theory of protein folding: the
energy landscape perspective. Annu Rev Phys Chem 1997;48:545-600.
10. Dill, KA., Chan, HS. From Levinthal to pathways to funnels. Nat Struct Biol
1997;4:10-19.
11. Jung, JW., Lee, W. Structure-based functional discovery of proteins: structural
proteomics. J Biochem Mol Biol 2004;37:28-34.
12. Nilges, M. Structure calculation from NMR data. Curr Opin Struct Biol
1996;6:617-623.
13. Wang, W., Donini, O., Reyes, CM., Kollman, PA., Biomolecular simulations:
recent developments in force fields, simulations of enzyme catalysis, protein-
ligand, protein-protein, and protein-nucleic acid noncovalent interactions, Annu
Rev Biophys Biomol Struct. 2001;30:211-243.
14. Karplus, M., McCammon, JA., Molecular dynamics simulations of biomolecules,
Nat Struct Biol. 2002;9:646-652.
Introduction
21
15. Verlet. Computer "experiments'' on classical fluids: I. Thermodynamical
properties of Lennard-Jones molecules. Phys. Rev. 1967;159:98-103.
16. Hockney, RW. The potential calculation and some applications. Methods
Comput.Phys. 1970;9:136–211.
17. Ryckaert, JP., Ciccotti, G., Berendsen, HJC. Numerical integration of the
Cartesian equation of motion of a system with constraints: molecular dynamics of
Nalkanes. J. of Computational Physics 1977;23:327-341.
18. van Gunstern, WF., Karplus, M. Effect of constraints on the dynamics of
macromolecules. Macromolecules. 1982;15:1528-1544.
19. Woodcock. Isothermal molecular dynamics calculations for liquid salts. Chem.
Phys. Letters 1971;10:257-261.
20. Berendsen, HJC., Postma, JPM., DiNola, A., Haak, JR. Molecular dynamics with
coupling to an external bath. J Chem. Phys. 1984;81: 3684-3690.
21. Jorgensen, WL., Chandrasekhar, JD., Madura, JD., Impey, RW., Klein, ML.
Comparison of simple potential functions for simulating liquid water. J Chem.
Phys. 1983;79: 926-935.
22. Ewald, PP. Die Berechnung optischer und elektrostatischer Gitterpotentiale. Ann.
Phys. 1921;64:253-287.
23. Darden, T., York, D., Pedersen, L. Particle mesh Ewald: An N·log(N) method for
Ewald sums in large systems. JChem Phys 1993;98:10089-10092.
24. Lei, H., Duan, Y. Improved sampling methods for molecular simulation. Curr Opin
Struct Biol 2007;17:187-191.
25. Liwo, A., Czaplewski, C., Oldziej, S., Scheraga, HA. Computational techniques
for efficient conformational sampling of proteins. Curr Opin Struct Biol
2008;18:134-139.
26. Kaihsu, T. Conformational sampling for the impatient. Biophys Chem
2004;107:213.
27. Gnanakaran, S., Nymeyer, H., Portman, J., Sanbonmatsu, KY., Garcia, AE.
Peptide folding simulations. Curr Opin Struct Biol. 2003;15:168.
28. Brunger, AT., Adams, PD., Rice, LM. New applications of simulated annealing in
X-ray crystallography and solution NMR. Structure 1997;5:325-336.
29. Kostrowicki, J., Scheraga, HA. Application of the diffusion equation method for
global optimization to oligopeptides. J Chem Phys 1992;96:7442-7449.
Introduction
22
30. Straatsma, TP., McCammon, JA. Treatment of rotational isomers III. The use of
biasing potentials, J Chem Phys 1994;101:5032-5039.
31. Huber, T., Torda, AE. van Gunsteren, WF. Structure optimization combining soft-
core interaction functions, the diffusion equation method and molecular
dynamics. J. Phys. Chem. A 1997;10:5926-5930.
32. Tappura, K., Lahtela-Kakkonen, M., Teleman, O. A new soft-core potential
function for molecular dynamics applied to the prediction of protein loop
conformations. J Comput Chem 2000;21, 388-397.
33. Tappura, K. Influence of rotational energy barriers to the conformational search
of protein loops in molecular dynamics and ranking the conformations. Proteins
Struct Funct Genet 2001;44:167-179.
34. Riemann, RN., Zacharias, M. Reversible scaling of dihedral angle barriers during
molecular dynamics to improve structure prediction of cyclic peptides. J Pept Res
2004;63:354-364.
35. Riemann, RN., Zacharias, M. Refinement of protein cores and protein-peptide
interfaces using a potential scaling approach. Prot Eng Des Select 2005;18:465-
476.
36. Hornak, V., Simmerling, C. Generation of accurate protein loop conformations
through low-barrier molecular dynamics. Proteins Struct Funct Bioinf
2003;51:577-590.
37. Okamoto, Y. Generalized-ensemble algorithms: enhanced sampling techniques
for Monte Carlo and molecular dynamics simulations. J Mol Graph Model
2004;22:425-439.
38. Sugita, Y., Okamoto, Y. Replica-exchange molecular dynamics method for
protein folding. Chem Phys Lett 1999;314:141-151.
39. Sanbonmatsu, KY., Garcia, AE. Structure of Met-enkephalin in explicit aqueous
solution using replica exchange molecular dynamics. Proteins Struct Funct Bioinf
2002;46:225.
40. Zhou, R., Berne, BJ. Can a continuum solvent model reproduce the free energy
landscape of a -hairpin folding in water? Proc Natl Acad Sci USA
2002;99:12777-12782.
41. Zhou, R. Free energy landscape of protein folding in water: explicit vs. implicit
solvent. Proteins Struct Funct Bioinf 2003;53:148-161.

Introduction
23
42. Nymeyer, H., Garcia, AE. Simulation of the folding equilibrium of -helical
peptides: a comparison of the generalized Born approximation with explicit
solvent. Proc Natl Acad Sci USA 2003;100:13934-13939.
43. Yoshida, K., Yamaguchi, T., Okamoto, Y. Replica-exchange molecular dynamics
simulation of small peptide in water and in ethanol. Chem Phys Lett
2005;41:2280-2284.
44. Rathore, N., Chopra, M., de Pablo, JJ. Optimal allocation of replicas in parallel
tempering simulations. J Chem Phys 2005;122:24111-24118.
45. Fukunishi, H., Watanabe, O., Takada, S. On the Hamiltonian replica exchange
method for efficient sampling of biomolecular systems: application to protein
structure prediction. J Chem Phys 2002;116:9058-9062.
46. Affentranger, R., Tavernelli, I., Di Iorio, EE. A Novel Hamiltonian Replica
Exchange MD Protocol to Enhance Protein Conformational Space Sampling J
Chem Theory Comput. 2006;2:217-228.
24
Chapter 2
Folding of a DNA hairpin loop structure in explicit solvent using replica-exchange molecular dynamics simulations Srinivasaraghavan Kannan and Martin Zacharias School of Engineering and Science, Jacobs University Bremen, Campus Ring 6, D-
28759 Bremen, Germany.
As published in : Biophysical Journal, 93, 3218-3228, 2007.
2.1 Abstract Hairpin loop structures are common motifs in folded nucleic acids. The 5’-GCGCAGC
sequence in DNA forms a characteristic and stable tri-nucleotide hairpin loop flanked by
a two base-pair stem helix. To better understand the structure formation of this hairpin
loop motif in atomic detail we employed replica-exchange molecular dynamics (Rex MD)
simulations starting from a single-stranded DNA conformation. In two independent 36 ns
Rex MD simulations conformations in very close agreement with the experimental
hairpin structure were sampled as dominant conformations (lowest free energy state)
during the final phase of the Rex MDs (~35% at the lowest temperature replica).
Simultaneous compaction and accumulation of folded structures was observed.
Comparison of the GCA tri-nucleotides from early stages of the simulations with the
folded topology indicated a variety of central loop conformations but also arrangements
DNA hairpin folding simulations study using T-Rex MD simulation
25
close to experiment that are sampled before the fully folded structure appeared. Most of
these intermediates included a stacking of the C2 and G3 bases which was further
stabilized by hydrogen bonding to the A5 base and a strongly bound water molecule
bridging the C2 and A5 in the DNA minor groove. The simulations suggest a folding
mechanism where these intermediates can rapidly proceed towards the fully folded
hairpin and emphasizes the importance of loop and stem nucleotide interactions for
hairpin folding. In one simulation a loop motif with G3 in syn-conformation (dihedral flip at
N-glycosidic bond) accumulated resulting in a mis-folded hairpin. Such conformations
may correspond to long-lived trapped states that have been postulated to account for the
slower folding kinetics of nucleic acid hairpins than expected for a semi-flexible polymer
of same size.
2.2 Introduction Hairpin loop structures in nucleic acids consist of a base paired stem structure and a
loop sequence with unpaired or non-Watson-Crick-paired nucleotides. These common
structural motifs can be of functional importance as ligand recognition elements or
folding initiation sites. A number of tri-nucleotide sequences at the center of palindromic
sequences in DNA can form compact and stable hairpin loops [1-11]. Formation of
stable DNA hairpin structures can influence supercoiling of DNA and DNA replication
and transcription [6,7,12-14]. It has been proposed that hairpin formation of triplet repeat
sequences during DNA replication could play a role for the expansion of such repeats
associated with several genetic diseases [15-20].
Hairpin loops with a central GNA trinucleotide motif (G, guanine; A, adenine; N, any
nucleotide) have been found to form particularly stable structures [1,8-11,20-22]. For
example, for the sequence 5’-GCGCAGC a melting transition for disruption of the hairpin
structure of 67 oC has been reported [8]. The thermodynamic stability of the GCA
trinucleotide loop, the influence of loop expansion and the influence of closing and
flanking sequences have been characterized extensively [1,3,8-11]. In addition,
structural studies using NMR spectroscopy have revealed a characteristic compact
folding topology for the GNA-loop [1,3] with a B-DNA form stem, a sheared G:A loop
closing base pair and the central loop base stacking on top of the G:A base pair pointing
towards the major groove. Several studies on base modifications allowed to elucidate
DNA hairpin folding simulations study using T-Rex MD simulation
26
the contribution of individual hydrogen bonds and other non-bonded contacts to the
folding stability [9-11]. However, the molecular mechanism of DNA hairpin structure
formation and characterization of possible stable intermediate states has so far not been
possible experimentally.
Due to the small size and characteristic fold DNA tri-nucleotide motifs are well suited for
theoretical and computational studies on loop structure and dynamics. DNA tri-
nucleotide hairpin loops have been investigated in multi-start energy minimization [23]
and conformational scanning search approaches [24] employing a generalized Born
(GB) type implicit solvent model to characterize possible stable conformational sub-
states. In principle molecular dynamics (MD) simulations are well suited to follow the
structure formation process of structural motifs in nucleic acids. However, the accessible
time scale and sampling efficiency strongly limits the usefulness of standard MD
simulations to study nucleic acid structure formation processes. Formation of hairpin
loops in DNA has been found to occur on the order of microseconds (depending on DNA
length and sequence) beyond current maximum MD simulation time scales [25-29].
Interestingly, the kinetics of nucleic acid hairpin folding can display non-Arrhenius
temperature dependence following multiple transition rates [25-29]. This might be due to
formation of transiently trapped misfolded states that follow different transition kinetics
towards the folded state [26, 29]. So far multiple MD simulations starting from thousands
of different start structures have been used to observe folding transitions of RNA
tetraloop structures with the central GCAA sequence that forms a characteristic RNA
structural motif [30-32]. In a very small fraction of the total number of simulations (19 out
of 10000 simulations) folding transitions to near native structures were observed [32].
Such simulation studies are very useful to characterize the rapid transition from a few
starting conformations to the folded form and to estimate the folding rate (and mean
folding time). However, without prior knowledge of the native folded structure it is not
possible to select those simulation events that lead to native structure formation. With
only a very small fraction of simulations resulting in near-native structures it is also not
possible to identify this state as the most favorable conformational state (with lowest free
energy).
In order to overcome the sampling limitations of standard MD methods we have
employed the replica-exchange MD simulation methodology (Rex MD) [33-35] in explicit
DNA hairpin folding simulations study using T-Rex MD simulation
27
solvent to study structure formation of the 5’-GCGCAGC motif in DNA. During Rex MD
simulations, several replicas of a system are simulated at different temperatures in
parallel allowing for exchanges between replicas at frequent intervals [33-35]. This
technique allows significantly improved sampling of conformational space and has
already been used for folding simulations and structure prediction of peptides and small
proteins [35-38] and the analysis of dinucleotide stacking in DNA [39-41] but so far much
less to study the dynamics of DNA oligonucleotides.
Two independent Rex MD simulations were started from single-stranded nucleic acid
conformations using different starting conditions and using 16 replicas ranging in
temperature from 315 K to 425 K. Both simulations lead to conformations in very close
agreement with the experimental hairpin loop structure as the final dominate state with
highest population at the replica run with the lowest temperature. Cluster analysis of
structures sampled at early and later stages during the simulations allowed to
characterize stable intermediate states accessible during the structure formation
process. The simulations indicate that the characteristic loop motif with a sheared
guanine:adenine (G:A) base pair and not fully formed stem base pairs can occur already
at an early stage of the simulations followed by a rapid subsequent formation of the stem
base pairs. In one of the two Rex MD simulations an alternative loop motif with the loop
guanine base in a syn-conformation (corresponds to an altered dihedral state around the
N-glycosidic sugar-base bond compared to the more common anti-conformation) was
formed and accumulated to some degree as a stable alternative loop structure. This
misfolded structure may correspond to a transiently trapped state that has to undergo
partial or complete unfolding in order to form the “correctly” folded structure and may
correspond to a fraction of slowly folding hairpins.
The paper is organized as follows. We first compare sampled DNA conformations during
continuous and Rex MD and analyze the accumulation of near-native folded DNA
hairpins during independent Rex MD simulations. In the following paragraphs the
accumulation of intermediates and mis-folded sampled conformations is analyzed to
suggest which intermediates contribute productively to the folding process. Finally, the
accumulation of near native structures over time and at different temperatures has been
investigated. The simulation results demonstrate that advanced sampling methods
based on current force fields and including explicit solvent and ions allowed the folding
DNA hairpin folding simulations study using T-Rex MD simulation
28
of stable DNA hairpin loop structures in close agreement with experiment and as the
dominant conformational state (of lowest free energy). The relatively modest
computational demand may allow us to systematically study the sequence dependence
of hairpin folding and the characterization of stable intermediate structure.
2.3 Materials and Methods Replica exchange molecular dynamics (Rex MD) simulations were started from an
extended single stranded DNA structure of the sequence 5’-GCGCAGC. The start
structure was generated using the Nucgen program of the Amber8 (Assisted Model
Building with Energy Restraints, [42]) program package with a B-DNA type geometry
followed by energy minimization. Initial positions of 6 K+ counter ions were placed using
the xleap module of the Amber8 package. The structure was solvated in an octahedral
box with 1127 TIP3P water molecules [43] leaving at least 10 Å between solute atoms
and the borders of the box. This corresponds to an ion concentration of ~200 mM.
Initial energy minimization (2500 steps) of the solvated systems was performed with the
sander module of the Amber8 package and using the parm99 force field [44]. Following
minimization the system was gradually heated from 50 to 300 K with positional restraints
(force constant: 50 kcal mol-1 Å-2) on DNA over a period of 0.25 ns allowing water
molecules and ions to move freely. A 9 Å cutoff for the short-range nonbonded
interactions was used in combination with the particle mesh Ewald option [45] using a
grid spacing of ~0.9 Å to account for long-range electrostatic interactions. The SETTLE
algorithm [46] was used to constrain bond vibrations involving hydrogen atoms, a time
step of 1 fs was used during Rex MD simulations (2 fs for standard MD). During
additional 0.25 ns the positional restraints were gradually reduced to allow finally
unrestrained MD simulation of all atoms over a subsequent equilibration time of 2 ns.
This procedure was repeated for the same starting structure using different randomly
assigned initial atom velocities.
The replica-exchange simulations were conduced under constant volume using 16
replicas. An exponentially increasing temperature series along the replicas was used
which gives approximately uniform acceptance ratios for exchanges between
neighboring replicas [37] with the following simulation temperatures (in Kelvin): 315.0,
DNA hairpin folding simulations study using T-Rex MD simulation
29
317.0, 320.6, 324.8, 329.6, 335.0, 341.0, 347.6, 354.8, 362.6, 371.0, 380.0, 389.6,
399.8, 410.6, 422.0. These simulation temperatures resulted in exchange probabilities
between neighboring replicas of ~20% (attempted exchanges every 750 steps). Both
Rex MD simulations A and B were continued for 36 ns. For comparison two standard
75ns MD simulations starting from the same start structure but different initial atomic
velocities were run at 330 K (same starting conformation as for Rex MD simulations).
An experimental high-resolution structure of the GCA tri-nucleotide loop is only available
in the context of two flanking T:A base pairs (pdb1ZHU) [3]. A reference structure for
comparison with the current simulation results (with the sequence 5’-GCGCAGC) was
constructed by iso-sterical replacement of the T:A base pairs (in the first structure of the
1ZHU entry) by G:C stem base pairs using the program Jumna [47]. The structure was
energy minimized (1000 steps) to remove any residual sterical clashes which resulted in
only very small changes from the experimental loop structure (Rmsd < 0.4 Å).
Cluster analysis was based on the pair-wise Cartesian Rmsd (only heavy atoms)
between conformations with an Rmsd cutoff of 2 Å and using the kclust program in the
MMTSB-tools [48]. The VMD (Visual molecular dynamics) program [49] was used for
visualization of trajectories and preparation of figures.
2.4 Results and Discussion 2.4.1 Conformational flexibility of single stranded DNA during continuous MD simulations Both continuous and replica-exchange (Rex) MD simulations were started from single
stranded 5’-GCGCAGC DNA molecules in a stacked B-type conformation with different
initial velocity assignments. This type of start structure was chosen since there is
experimental evidence that especially purine-rich single-stranded DNAs adopt stacked
structures in solution as dominant conformational states [50-53]. The 5’-GCGCAGC
sequence adopts a very stable GCA tri-nucleotide hairpin loop structure flanked by two
G:C Watson-Crick base pairs in solution that has been investigated using NMR
spectroscopy [1,3,8-11]. However, an experimental high-resolution structure of the GCA

DNA hairpin folding simulations study using T-Rex MD simulation
30
tri-nucleotide loop is only available in the context of two flanking T:A base pairs (pdb-
entry:1ZHU) [3].
Figure 2.1: Heavy atom root mean square deviation (Rmsd) of sampled DNA conformations (5’-
GCGCAGC) from folded hairpin structure (A) and single-stranded start structure (B) vs.
simulation time. Results are shown for two independent 75 ns simulations starting from the same
single-stranded DNA with different initial atomic velocity assignments (red and black curves,
respectively).
A reference structure for comparison with the current simulation results (with the
sequence 5’-GCGCAGC) was constructed by iso-sterical replacement of the two T:A
base pairs by corresponding G:C base pairs using the program Jumna [47] followed by a
short energy minimization (see Materials and Methods).
The dynamics and stability of the single stranded start conformation was first
investigated during two independent 75 ns standard MD simulations at 330 K started
with different initial atom velocities. An elevated simulation temperature slightly below
the expected hairpin melting temperature (~340 K) was chosen because it should
accelerate conformational transitions including those to the native structure compared to
simulations at room temperature. The generated DNA structures showed considerable
fluctuations with significant deviations from the start conformation (Figure 2.1). Structural
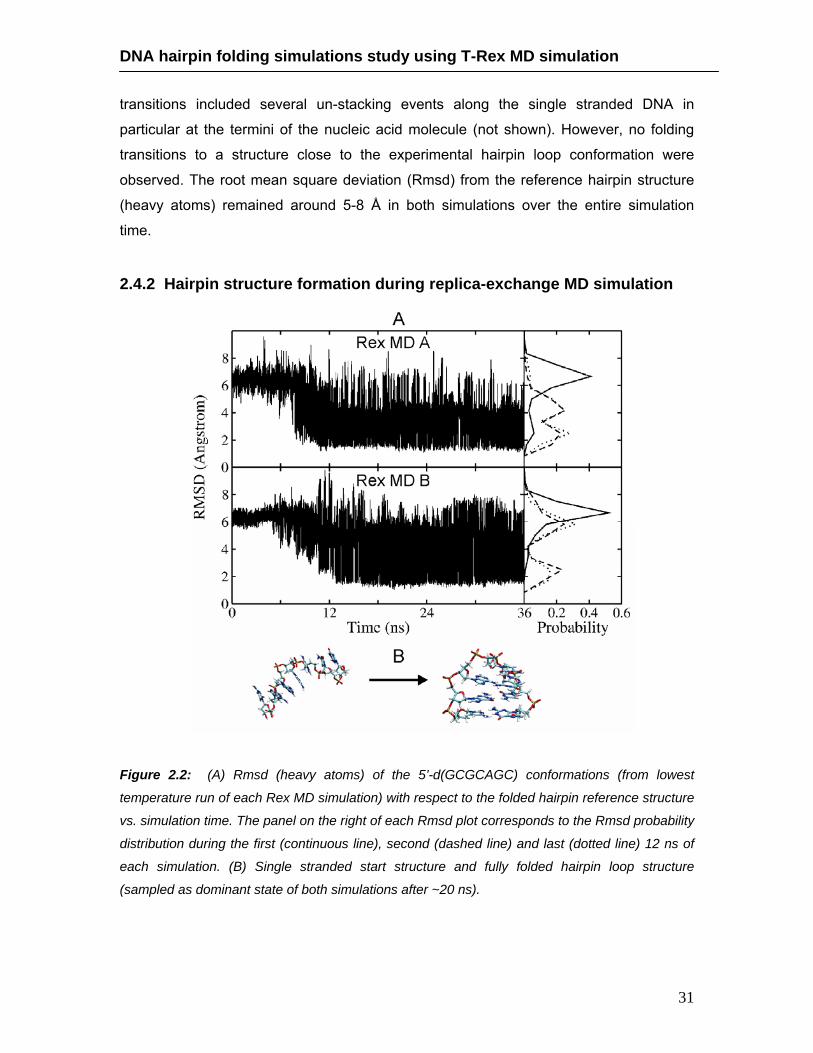
DNA hairpin folding simulations study using T-Rex MD simulation
31
transitions included several un-stacking events along the single stranded DNA in
particular at the termini of the nucleic acid molecule (not shown). However, no folding
transitions to a structure close to the experimental hairpin loop conformation were
observed. The root mean square deviation (Rmsd) from the reference hairpin structure
(heavy atoms) remained around 5-8 Å in both simulations over the entire simulation
time.
2.4.2 Hairpin structure formation during replica-exchange MD simulation
Figure 2.2: (A) Rmsd (heavy atoms) of the 5’-d(GCGCAGC) conformations (from lowest
temperature run of each Rex MD simulation) with respect to the folded hairpin reference structure
vs. simulation time. The panel on the right of each Rmsd plot corresponds to the Rmsd probability
distribution during the first (continuous line), second (dashed line) and last (dotted line) 12 ns of
each simulation. (B) Single stranded start structure and fully folded hairpin loop structure
(sampled as dominant state of both simulations after ~20 ns).
DNA hairpin folding simulations study using T-Rex MD simulation
32
During the Rex MD simulations the initial Rmsd from the experimental hairpin structure
was ~7 Å and started to decrease at around 5-7 ns in the lowest temperature replica run
(Figure 2.2). Already at a simulation time of ~9 ns and 12 ns during simulations A and B,
respectively, conformations with an Rmsd of ~2 Å from experiment were sampled. After
~15-20 ns simulation time conformations as close as 1.2-1.6 Å (heavy atoms) with
respect to the reference hairpin conformation were sampled as the dominant
conformational states (Figure 2.2). These structures show the same characteristic
arrangement of loop and stem bases and the same hydrogen (H-) bonding pattern as
the experimental structure of the GCA loop motif (Figure 2.3). The Rmsd probability
distributions at the various stages of the simulations (Figure 2.2) indicate that in the final
stage of both 36 ns Rex MD simulations conformations within an Rmsd of 2 Å from the
reference structure accounted for 35% (simulation A) and 40% (simulation B) of sampled
conformations, respectively. Comparison with the earlier stages of the simulation
showed that in both simulations the fraction of native-like conformations increased over
time with a dramatic difference between early and middle part of the simulation and only
a modest change during the final stage of both simulations (Figure 2.2).
Interestingly, in simulation A cluster analysis of the final part of the trajectory (lowest
temperature replica) indicated a significantly populated cluster of conformations
relatively close to the experimental tri-nucleotide hairpin structure (Rmsd ~ 2.5-3 Å,
~15% of sampled conformations) but with the G3 nucleotide in the syn-conformation
(Figure 2.3c) instead of the regular anti-conformation at the N-glycosidic bond (bond
between sugar and base). Such syn-conformations are frequently found in case of purin
bases in folded RNA structures (e.g. UNCG hairpins, [54, 55]). However, for the present
loop structure the syn-G3 conformation allows for stacking interactions with neighboring
bases but prevents formation of stable H-bonds with the A5 as seen in the sheared base-
pair arrangement of the native loop conformation (Figure 2.3a). Syn-G3 conformations
were also observed in simulation B, however, mainly during the first part of the
simulation (at least in the lowest temperature replica) lacking the base-paired stem and
no significant accumulation of completely folded hairpin loops (with a syn-G3). It
indicates that a “misfolded” tri-nucleotide loop with a syn-G3 once it has formed a
complete base paired stem structure corresponds to a long-lived trapped structure that
can only refold to the native-loop structure after complete unfolding of the stem region.
Hence, it is separated from the native-structure by a large energy barrier that even in a

DNA hairpin folding simulations study using T-Rex MD simulation
33
Rex MD simulation requires significantly longer simulation times (than the present 36 ns)
to completely disappear in the final conformational ensemble.
Figure 2.3: Comparison of an ensemble of NMR structures of the GCA tri-nucleotide loop (4
structures of pdb1zhu; sequence: 5’-dATGCAAT) (A) and 4 randomly selected structures
obtained during the final stage of the Rex MD simulation A (B) with a heavy atom RMSD of < 2 Å
from the folded reference hairpin structure. (C) Superposition of “misfolded” DNA hairpin
structures with the loop guanine (G3) in a syn-conformation and the loop adenine (A5) partially
stacked in the DNA minor groove.
This result suggests the possibility that such syn-conformations of nucleo-bases may
also form during other structure formation processes of nucleic acids (e.g. double-strand
formation) and may in general result in long-lived trapped mis-folded structures. It is also
consisted with the observation that hairpin formation is overall slower than expected
from estimated end-to-end contact formation of a semi-flexible polymer and may be
characterized by multiple rates due to the formation of long-lived trapped states [26, 29].
2.4.3 Accumulation of intermediates and mis-folded structures A variety of nucleic acid conformational states were sampled during the Rex MD
simulations. Cluster analysis was performed for conformations formed during the first,
second and third intervals (each 12 ns) of both simulations (a cluster represent
structures within an Rmsd of 2 Å from the cluster center).
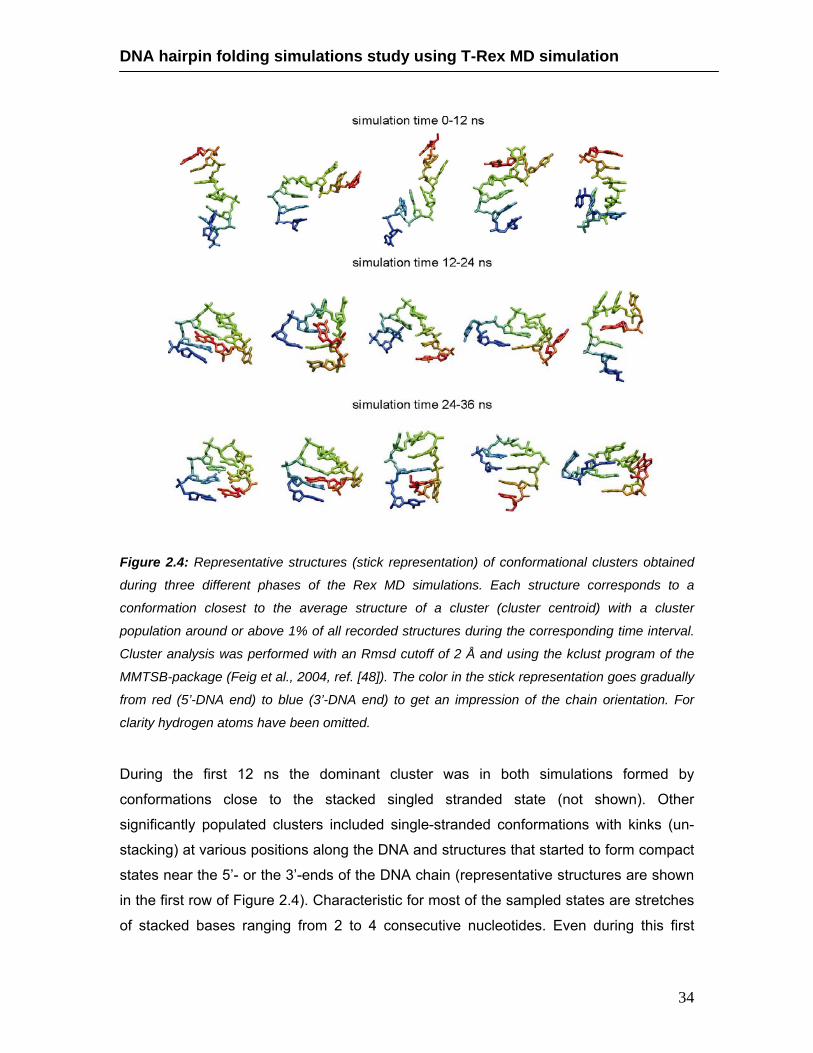
DNA hairpin folding simulations study using T-Rex MD simulation
34
Figure 2.4: Representative structures (stick representation) of conformational clusters obtained
during three different phases of the Rex MD simulations. Each structure corresponds to a
conformation closest to the average structure of a cluster (cluster centroid) with a cluster
population around or above 1% of all recorded structures during the corresponding time interval.
Cluster analysis was performed with an Rmsd cutoff of 2 Å and using the kclust program of the
MMTSB-package (Feig et al., 2004, ref. [48]). The color in the stick representation goes gradually
from red (5’-DNA end) to blue (3’-DNA end) to get an impression of the chain orientation. For
clarity hydrogen atoms have been omitted.
During the first 12 ns the dominant cluster was in both simulations formed by
conformations close to the stacked singled stranded state (not shown). Other
significantly populated clusters included single-stranded conformations with kinks (un-
stacking) at various positions along the DNA and structures that started to form compact
states near the 5’- or the 3’-ends of the DNA chain (representative structures are shown
in the first row of Figure 2.4). Characteristic for most of the sampled states are stretches
of stacked bases ranging from 2 to 4 consecutive nucleotides. Even during this first
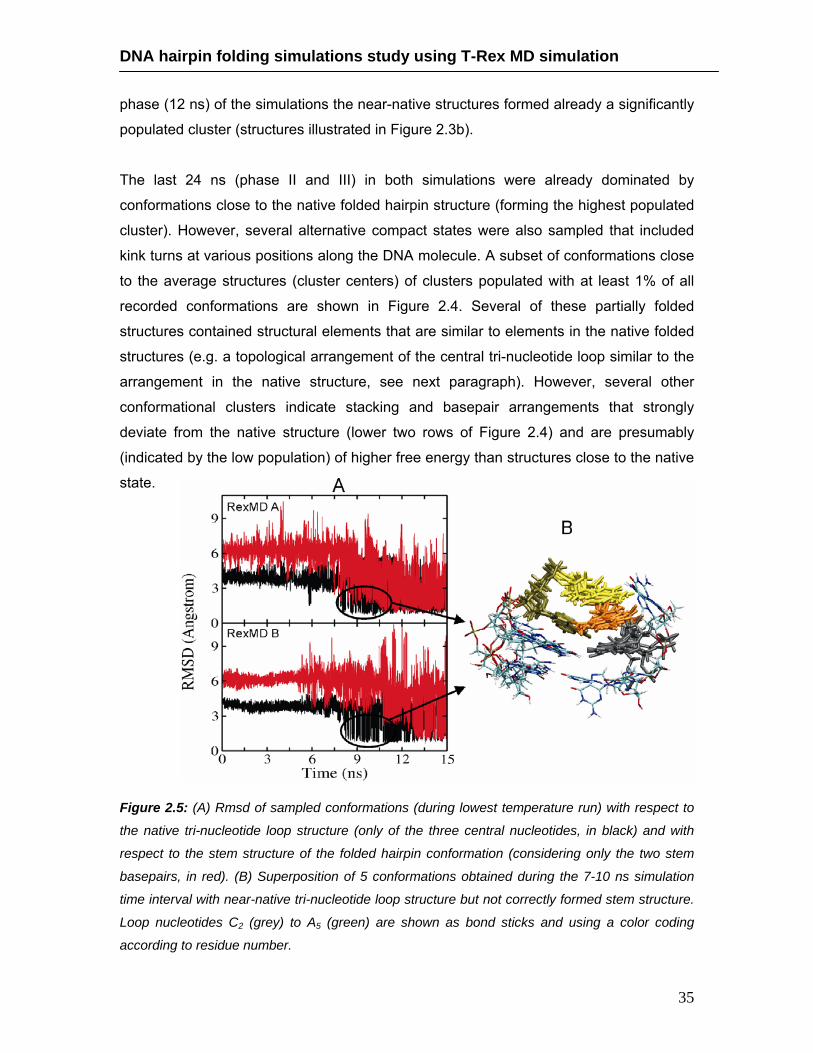
DNA hairpin folding simulations study using T-Rex MD simulation
35
phase (12 ns) of the simulations the near-native structures formed already a significantly
populated cluster (structures illustrated in Figure 2.3b).
The last 24 ns (phase II and III) in both simulations were already dominated by
conformations close to the native folded hairpin structure (forming the highest populated
cluster). However, several alternative compact states were also sampled that included
kink turns at various positions along the DNA molecule. A subset of conformations close
to the average structures (cluster centers) of clusters populated with at least 1% of all
recorded conformations are shown in Figure 2.4. Several of these partially folded
structures contained structural elements that are similar to elements in the native folded
structures (e.g. a topological arrangement of the central tri-nucleotide loop similar to the
arrangement in the native structure, see next paragraph). However, several other
conformational clusters indicate stacking and basepair arrangements that strongly
deviate from the native structure (lower two rows of Figure 2.4) and are presumably
(indicated by the low population) of higher free energy than structures close to the native
state.
Figure 2.5: (A) Rmsd of sampled conformations (during lowest temperature run) with respect to
the native tri-nucleotide loop structure (only of the three central nucleotides, in black) and with
respect to the stem structure of the folded hairpin conformation (considering only the two stem
basepairs, in red). (B) Superposition of 5 conformations obtained during the 7-10 ns simulation
time interval with near-native tri-nucleotide loop structure but not correctly formed stem structure.
Loop nucleotides C2 (grey) to A5 (green) are shown as bond sticks and using a color coding
according to residue number.
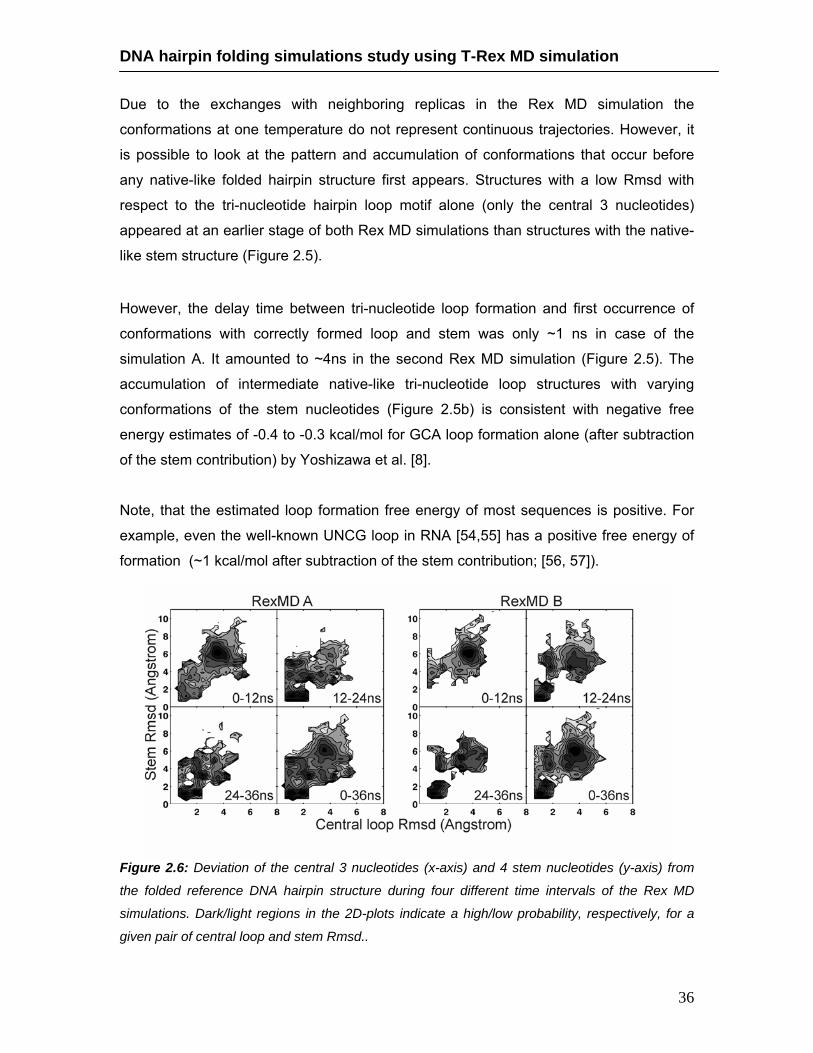
DNA hairpin folding simulations study using T-Rex MD simulation
36
Due to the exchanges with neighboring replicas in the Rex MD simulation the
conformations at one temperature do not represent continuous trajectories. However, it
is possible to look at the pattern and accumulation of conformations that occur before
any native-like folded hairpin structure first appears. Structures with a low Rmsd with
respect to the tri-nucleotide hairpin loop motif alone (only the central 3 nucleotides)
appeared at an earlier stage of both Rex MD simulations than structures with the native-
like stem structure (Figure 2.5).
However, the delay time between tri-nucleotide loop formation and first occurrence of
conformations with correctly formed loop and stem was only ~1 ns in case of the
simulation A. It amounted to ~4ns in the second Rex MD simulation (Figure 2.5). The
accumulation of intermediate native-like tri-nucleotide loop structures with varying
conformations of the stem nucleotides (Figure 2.5b) is consistent with negative free
energy estimates of -0.4 to -0.3 kcal/mol for GCA loop formation alone (after subtraction
of the stem contribution) by Yoshizawa et al. [8].
Note, that the estimated loop formation free energy of most sequences is positive. For
example, even the well-known UNCG loop in RNA [54,55] has a positive free energy of
formation (~1 kcal/mol after subtraction of the stem contribution; [56, 57]).
Figure 2.6: Deviation of the central 3 nucleotides (x-axis) and 4 stem nucleotides (y-axis) from
the folded reference DNA hairpin structure during four different time intervals of the Rex MD
simulations. Dark/light regions in the 2D-plots indicate a high/low probability, respectively, for a
given pair of central loop and stem Rmsd..
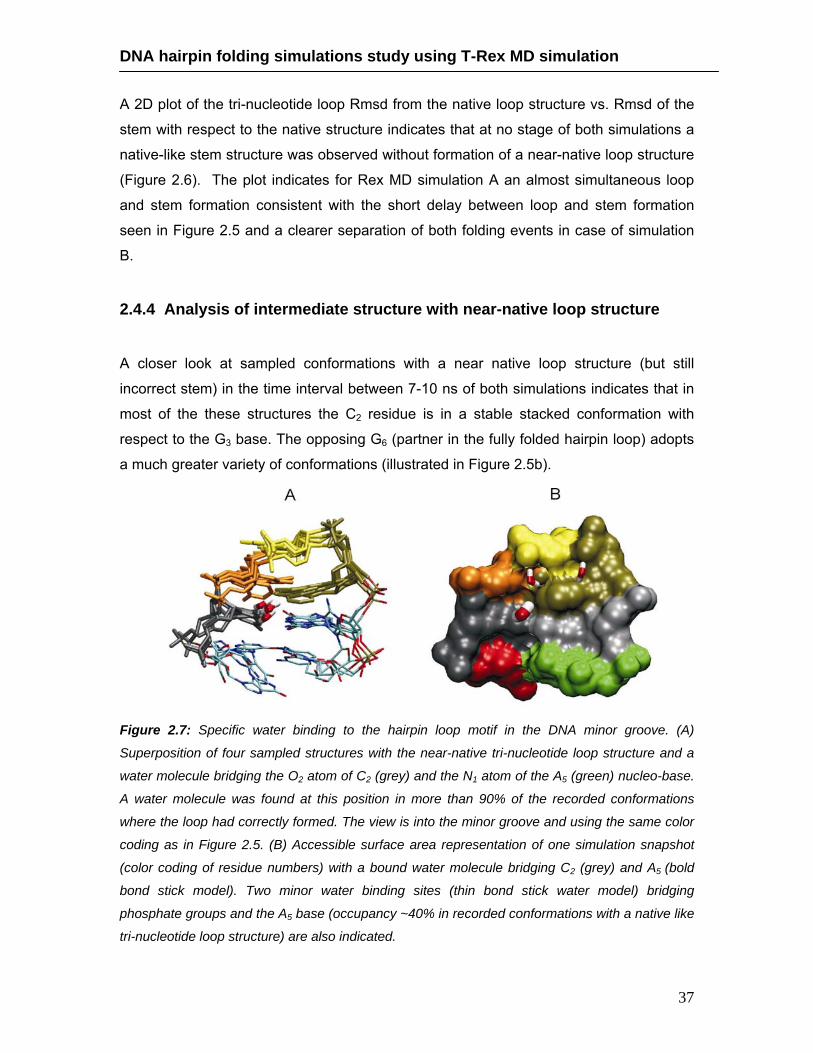
DNA hairpin folding simulations study using T-Rex MD simulation
37
A 2D plot of the tri-nucleotide loop Rmsd from the native loop structure vs. Rmsd of the
stem with respect to the native structure indicates that at no stage of both simulations a
native-like stem structure was observed without formation of a near-native loop structure
(Figure 2.6). The plot indicates for Rex MD simulation A an almost simultaneous loop
and stem formation consistent with the short delay between loop and stem formation
seen in Figure 2.5 and a clearer separation of both folding events in case of simulation
B.
2.4.4 Analysis of intermediate structure with near-native loop structure A closer look at sampled conformations with a near native loop structure (but still
incorrect stem) in the time interval between 7-10 ns of both simulations indicates that in
most of the these structures the C2 residue is in a stable stacked conformation with
respect to the G3 base. The opposing G6 (partner in the fully folded hairpin loop) adopts
a much greater variety of conformations (illustrated in Figure 2.5b).
Figure 2.7: Specific water binding to the hairpin loop motif in the DNA minor groove. (A)
Superposition of four sampled structures with the near-native tri-nucleotide loop structure and a
water molecule bridging the O2 atom of C2 (grey) and the N1 atom of the A5 (green) nucleo-base.
A water molecule was found at this position in more than 90% of the recorded conformations
where the loop had correctly formed. The view is into the minor groove and using the same color
coding as in Figure 2.5. (B) Accessible surface area representation of one simulation snapshot
(color coding of residue numbers) with a bound water molecule bridging C2 (grey) and A5 (bold
bond stick model). Two minor water binding sites (thin bond stick water model) bridging
phosphate groups and the A5 base (occupancy ~40% in recorded conformations with a native like
tri-nucleotide loop structure) are also indicated.
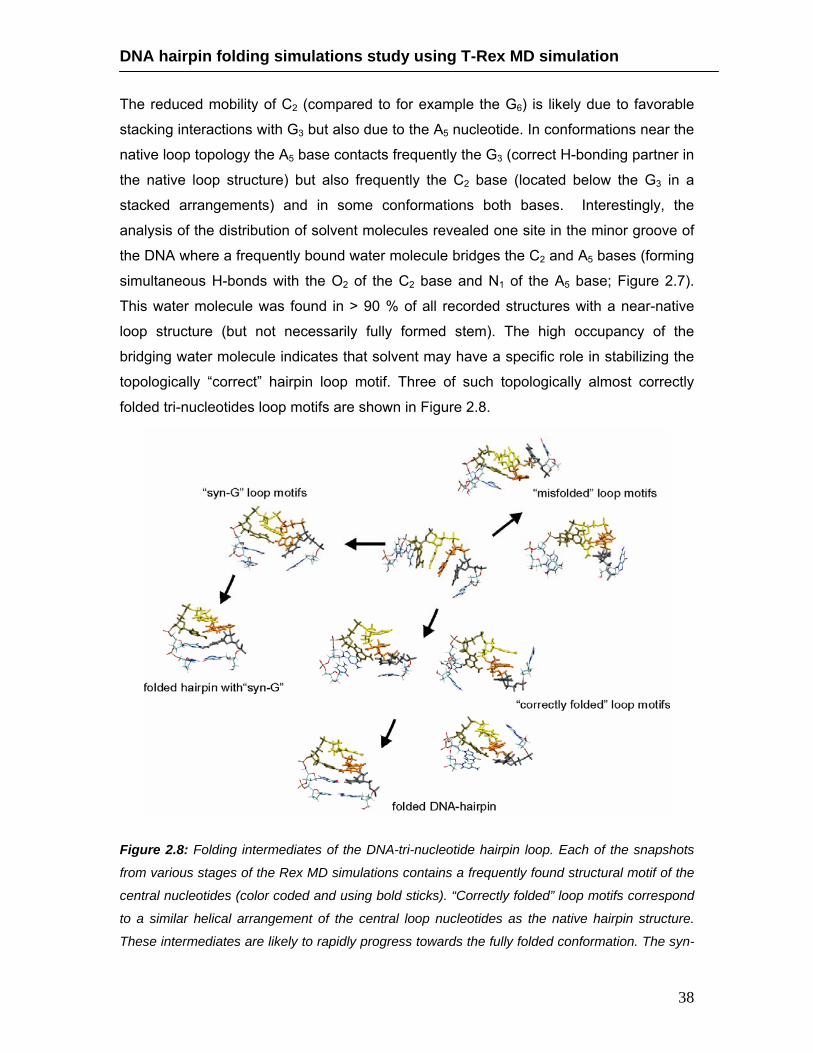
DNA hairpin folding simulations study using T-Rex MD simulation
38
The reduced mobility of C2 (compared to for example the G6) is likely due to favorable
stacking interactions with G3 but also due to the A5 nucleotide. In conformations near the
native loop topology the A5 base contacts frequently the G3 (correct H-bonding partner in
the native loop structure) but also frequently the C2 base (located below the G3 in a
stacked arrangements) and in some conformations both bases. Interestingly, the
analysis of the distribution of solvent molecules revealed one site in the minor groove of
the DNA where a frequently bound water molecule bridges the C2 and A5 bases (forming
simultaneous H-bonds with the O2 of the C2 base and N1 of the A5 base; Figure 2.7).
This water molecule was found in > 90 % of all recorded structures with a near-native
loop structure (but not necessarily fully formed stem). The high occupancy of the
bridging water molecule indicates that solvent may have a specific role in stabilizing the
topologically “correct” hairpin loop motif. Three of such topologically almost correctly
folded tri-nucleotides loop motifs are shown in Figure 2.8.
Figure 2.8: Folding intermediates of the DNA-tri-nucleotide hairpin loop. Each of the snapshots
from various stages of the Rex MD simulations contains a frequently found structural motif of the
central nucleotides (color coded and using bold sticks). “Correctly folded” loop motifs correspond
to a similar helical arrangement of the central loop nucleotides as the native hairpin structure.
These intermediates are likely to rapidly progress towards the fully folded conformation. The syn-

DNA hairpin folding simulations study using T-Rex MD simulation
39
G3 loop motif is sterically also compatible with a fully folded hairpin but it retains the mis-folded
helical arrangement of the central loop nucleotides. “Mis-folded loop” motifs strongly deviate from
the native tri-nucleotide loop structure (only a few examples are shown) and are unlikely to
progress rapidly towards a fully folded hairpin structure.
Apparently, during the folding process the stacking of C2, G3 (and probably also C4) and
the bridging water molecule in the minor groove are important to provide a stable
template for the A5 to search for the “correct” H-bonding partner during loop formation.
Vice versa the C2-G3 stacking is stabilized by H-bond formation of the A5 with C2 or both
C2 and G3. The importance of the C2-G3 stacking as indicated in the present simulation is
supported by the experimental observation that the stability and folding of GNC
trinucleotide loops is especially sensitive to the destabilization of C2-G3 interactions [9].
The introduction of a three-carbon linker between C2 and G3 that mimics the insertion of
one nucleoside (without a base), increases the distance between the bases and disturbs
the C2-G3 interactions and has a strongly destabilizing effect on loop formation (by ~1.6
kcal·mol-1) [9]. Insertion of the same linker at other positions in the loop has only a minor
effect on loop formation [9].
In Figure 2.8 near-native loop motifs that were observed shortly before the appearance
of the first near native folded hairpin loops (including the stem) are compared with
alternative “mis-folded” loop structures that cannot directly proceed towards the correctly
folded structure. An exception is the already mentioned loop motif with a syn-G3
conformation that is also sterically compatible with a progression towards a fully folded
hairpin structure (Figure 2.8) and provides at least favorable stacking interactions of the
loop bases (but not the native H-bonds as seen in the sheared G:A base pair). In the 2D
plot of the tri-nucleotide loop vs. stem Rmsd (Figure 2.6a) this conformational state in
case of simulation A shows also up as a second peak close to the peak that corresponds
to the native like state with a slightly larger Rmsd of the loop segment from experiment
compared to the native-like structure. Comparison of different time intervals of the
simulation indicates that the syn-conformation of the loop adenine results in a relatively
stable “trapped” and non-native hairpin loop structure. Since on the time scale of the
Rex MD simulations the population did not significantly change within the last ~20 ns this
non-native hairpin loop structure may have a similar low free energy as the native state.
This would likely been an artifact of the simulation force field since in the experimental

DNA hairpin folding simulations study using T-Rex MD simulation
40
structure of the GCA tri-nucleotide loop such a syn-G3 conformation is not observed.
However, it is also possible that the “refolding” to a conformation with an anti-G3
conformation requires the complete unfolding of the hairpin loop since for sterical
reasons the compact hairpin loop structure does not allow the transition to an anti-
conformation in the compact folded form. The Rex MD simulation in principle allows for
such transitions due to the replica-exchanges. Indeed, at the higher temperature replicas
single-stranded DNA conformations are significantly populated throughout the whole
simulations (Figure 2.9). However, in a Rex MD simulation stable trapped conformations
once formed do not disappear but can only evolve towards native-like structures by
“traveling” along the temperature coordinate to overcome energetic barriers. Due to the
thermodynamic stability of the alternative hairpin loop structure complete unfolding
towards a single stranded structure that allows for syn-anti-transitions even during the
Rex MD is a rare event and may require much longer simulation time scales to reach a
fully equilibrated probability distribution of sampled conformations. 2.4.5 Temperature dependence of hairpin loop stability The population of native-like structures during the simulations varies between different
stages of the simulations. However, in both simulations the accumulated fraction of near-
native DNA hairpin conformations (within 2 Å of the reference structure) at the lowest
temperature replica approaches ~35% (Figure 2.9). In a fully equilibrated simulation the
population at the lowest temperature is expected to be much higher because it is
significantly below the hairpin melting temperature. The fraction depends on the Rmsd
cutoff to distinguish between folded and unfolded structures (~45% if one chooses a
Rmsd-cutoff of 2.5 Å). This suggests that the hairpin folding free energy at the lowest
temperature replica (42 oC) is close to zero.
The experimental folding free energy from calorimetric studies for the same sequence is,
however, ΔGfold = -2.7 kcal·mol-1 (in 1M NaCl at 37 oC; with little changes in the melting
behavior at 0.1 M and 1 M NaCl, [8]). The RexMD simulations on the present time scale
clearly underestimate the fraction of native-like loop conformations at the lowest
temperature replica. In principle, it is possible to use the fraction of near-native hairpin
structures from all simulation temperatures (all replicas) to extract thermodynamic
quantities. However, beside of the possibility of insufficient convergence one needs also

DNA hairpin folding simulations study using T-Rex MD simulation
41
to keep in mind that inaccuracies of the force field and water model (designed for room
temperature simulations) are likely to have a significant impact at the higher simulation
temperatures.
Figure 2.9: Contribution of native-like hairpin loop structures (within an Rmsd of < 2.0 Å of the
folded reference structure) at various stages of the Rex MD simulations (indicated by different
plot textures). Contributions are given in % of the total ensemble at each replica simulation
temperature.
Nevertheless, the overall shape of the population curve looks similar for the different
time intervals and it is possible to extract the temperature at which the level of near-
native conformations has dropped to half of the lowest temperature level (melting
temperature). This results in a rough estimate of the melting temperature of ~340-350 K
(67-77 oC) quite close to the experimental melting temperature of 67 oC [8]. A van’t Hoff
analysis of the change in near-native population vs. temperature results in a ΔHfold ~ -10
kcal·mol-1. For monomolecular processes such as hairpin formation and assuming a two-
state unfolding-folding transition and no temperature dependence of ΔHfold one can
estimate ΔGfold(T) = ΔHfold (1-T/Tm) ~ -0.9 kcal·mol-1at 37 oC. The magnitude of the
calculated ΔHfold is ~3 times smaller than the experimental ΔHfold (-30.4 kcal·mol-1). The
discrepancy is due to an “under-estimation” of the population at near-native structures at
the low temperature replicas and/or an overestimation of the population of near native
structures at the higher temperature replicas. Insufficient conformational sampling but
DNA hairpin folding simulations study using T-Rex MD simulation
42
also force field artifacts especially at the higher simulation temperatures as discussed
above are likely reasons for the discrepancy. It should be emphasized that the present
simulations demonstrate that the force field approach is sufficiently accurate to generate
near-native DNA hairpin structures as most populated conformation at the lowest
simulation temperature. However, accurate description of the temperature dependence
of the conformer stability may require further force field improvement. It also indicates
that care should be taken if one combines ensembles generated at the various
temperatures of a Rex MD simulation to extract thermodynamic quantities due to
possible force field artifacts.
2.5 Conclusions Hairpin loop structures are an important structural motif in nucleic acids and have been
shown to play important roles in many biological processes. Understanding the structure
formation process of nucleic acid hairpin structures at atomic detail is of major
importance to fully understand the function of hairpins and the folding of larger nucleic
acids that contain hairpin motifs. We have used replica exchange MD simulations in
explicit solvent to study the structure formation of the stable GCA tri-nucleotide DNA
hairpin with a characteristic loop structure and flanked by two stem base-pairs.
The Rex MD simulations employed a completely flexible single-stranded DNA without
adding any restraints to bias the simulations towards a folded hairpin structure. This
goes beyond a previous systematic conformational search study on the same system
employing an implicit solvent model [23]. In this study only the central loop structure was
flexible assuming a base-paired stem structure. During two independent Rex MD
simulations folding of a single stranded start structure to conformations close to an
experimental hairpin structure as the dominant state was observed. In both simulations
the population of near-native structures reached ~35 % at the lowest temperature replica
after about 20 ns (Figure 2.9) with only small changes at later stages of the simulations.
However, the population of alternative (mis-folded) loop structures (e.g. with a syn-G3-
conformation) differed between both Rex MD simulations even at the final stages of the
simulations. This result indicates that an appropriate sampling of alternative
DNA hairpin folding simulations study using T-Rex MD simulation
43
conformations and the possible refolding of trapped intermediate structures towards a
correctly folded structure requires longer simulation times.
The analysis of intermediates at or shortly before the occurrence of fully folded hairpin
structures indicated the formation of near-native tri-nucleotide loop conformations
(without fully formed stem) and a variety of alternative intermediate structures. Folding to
the native hairpin structure appeared to occur almost simultaneously or quickly after the
formation of the near-native tri-nucleotide loop. This agrees qualitatively with results on
the structure formation of an RNA tetraloop (central GCAA sequence) by Sorin et al. [32]
using massively parallel independent MD simulations. In a small fraction of simulations
the authors observed hairpin folding. Both a sequential folding mechanism (first loop and
subsequent formation of stem base pairs) as well as compaction and simultaneous loop
formation were observed [32]. However, in contrast to the folding mechanism proposed
by Sorin et al. [32] for an RNA tetraloop in the present simulations no hydrophobic
collapse of the loop structure prior to loop formation was observed. The stable “folding
nucleus” was formed by the central DNA tri-nucleotide loop element. This could be due
to the fact that formation of the trinucleotide loop itself (without the stem) might be
thermodynamically slightly favored as proposed by Yoshizawa et al. [8].
In most of the present sampled conformations with a near-native tri-nucleotide loop
arrangement the C2 nucleotide adopted a stacked conformation with respect to the first
loop nucleotide (the G3 nucleotide of the GCA loop). This arrangement provides a
hydrogen-bonding interface for the A5 nucleotide of the loop to stabilize different loop
fine structures but an overall helical arrangement or topology of the three loop
nucleotides in close agreement with the native loop structure. This form can then rapidly
proceed towards the fully folded hairpin loop structure. It appears to be further stabilized
by a specifically bound water molecule at a cavity in the minor groove of the DNA that
bridges the O2 atom of the C2 base and the N1 of the A5 base. Water molecules were
also found to play a structural role during formation of RNA tetraloop structures by
stabilizing partially formed stem basepairs [32]. During folding of the DNA triloop the
water molecule that bridges C2 and A5 stabilizes a specific stacking arrangement of the
bases that form the native loop structure. The proposed folding mechanism is supported
by the experimental observation that the insertion of a three-carbon spacer in between
the C2 and G3 nucleotide (destabilization of C2-G3 interactions) has a strongly
DNA hairpin folding simulations study using T-Rex MD simulation
44
destabilizing effect on loop formation [9]. It is also consistent with time-resolved
fluorescence spectroscopy of single stranded DNA that indicates that interactions of loop
nucleotides and stem nucleotides can have a strong influence on the kinetics of hairpin
formation [29]. It is important to note that the present Rex MD simulations allow
characterizing populations of near-native hairpin conformations and accumulation of
intermediate structures. It is also possible to extract the order of appearance of such
intermediate structures. However, the folding kinetics that is the exact transition times
and transition rates between the various sampled structures cannot be determined.
Characterization of folding kinetics might be possible in future studies using very long
continuous MD simulations.
Hairpin formation in nucleic acids has been found to occur on a longer time scale than
expected from the expected end-to-end contact formation rates of a semi-flexible
polymer [25-28]. This has been attributed to the possible formation of trapped long-lived
intermediate states that slow down structure formation [27,28] and may also lead to
deviations from single-exponential kinetics of hairpin formation [29]. Consistent with this
experimental finding the simulations show many “misfolded” intermediates that are
unlikely to rapidly undergo direct transitions to the native loop structure. In addition,
accumulation of an alternative loop structure containing a syn-G3 conformation and an
otherwise similar loop structure with respect to the native structure was observed. This
loop structure also allowed formation of a fully folded structure with the G3 trapped in the
syn-conformation. Indeed, in one of the Rex MD simulations a significant fraction of the
sampled structures even at the final stage of the simulation contained a syn-G3. A slow
decrease of the population over simulation time indicates that the loop structure with a
syn-G3 may correspond to a stable (long lived) trapped conformation that requires
unfolding and refolding to proceed towards the native hairpin loop structure. The mis-
folding of nuleobases (especially of purines) at the N-glycosidic bond to form a syn-
conformation and trapping of stable misfolded structures as seen in the present
simulations might be of relevance for the folding of other nucleic acid structural motifs.
The current simulations indicate that it is possible to systematically study structure
formation processes of small nucleic acid structural motifs using MD simulations in
explicit solvent and advanced sampling methods. It can form the basis for systematic
studies on characterizing the sequence dependence of hairpin folding in nucleic acids
and to characterize possible stable intermediate structures.
DNA hairpin folding simulations study using T-Rex MD simulation
45
Acknowledgements: This study was performed using the computational resources of
the CLAMV (Computational Laboratory for Analysis, Modeling and Visualization) at
Jacobs University Bremen and supercomputer resources of the EMSL (Environmental
Molecular Science Laboratories) at the PNNL (Pacific Northwest National Laboratories,
USA; grant gc9593). The work was supported by a grant (I/80485) from the
VolkswagenStiftung to M.Z.
2.6 References
1. Hirao, I., G. Kawai, S. Yoshizawa, Y. Nishimura, Y. Ishido, K. Watanabe, and K.
Miura. 1994. Most compact hairpin-turn structure exerted by a short DNA
fragment, d(GCGAAGC) in solution: an extraordinarily stable structure resistant
to nuclease and heat. Nucleic. Acids. Res. 22:576–582.
2. Yu, A., J. Dill, and M. Mitas. 1995. The purine-rich trinucleotide repeat sequences
d(CAG)15 and d(GAC)15 form hairpins. Nucleic. Acids. Res. 23:4055-4057.
3. Zhu, L., S. H. Chou, and B. R. Reid. 1996. Structure of a single cytidine hairpin
loop formed by the DNA triplet GCA. Nat. Struct. Biol. 2:1012-1017.
4. Chou, S. H., L. Zhu, Z. Gao, J. W. Cheng, and B. R. Reid. 1996. Hairpin loops
consisting of single adenine residues closed by sheared A:A or G:G pairs formed
by DNA triplets AAA and GAG: solution structures of the d(GTACAAAGTAC)
hairpin. J. Mol. Biol. 264:981–1001.
5. Chou, S. H., Y. Y. Tseng, and S. W. Wang. 1999a. Stable sheared A:C pair in
DNA hairpins. J. Mol. Biol. 287:301–313.
6. Chou, S. H., Y. Y. Tseng, and B. Y. Chu. 1999b. Stable formation of a
pyrimidine-rich loop hairpin in a cruciform promoter. J. Mol. Biol. 292:309 –320.
7. Aslani, A. A., O. Mauffret, F. Sourgen, S. Neplaz, G. Maroun, E. Lescot, G.
Tevanian, and S. Fermandjian. 1996. The hairpin structure of a topoisomerase II
site DNA strand analysed by combined NMR and energy minimization methods.
J. Mol. Biol. 263:776-788.
DNA hairpin folding simulations study using T-Rex MD simulation
46
8. Yoshizawa, S., G. Kawai, K. Watanabe, K. Miura, and I. Hirao. 1997. GNA
trinucleotide loop sequences producing extraordinarily stable DNA minihairpins.
Biochemistry. 36:4761-4767.
9. Moody, E. M., and P. C. Bevilacqua. 2003a. Thermodynamic coupling of the loop
and stem in unusually stable DNA hairpins closed by CG base pairs. J. Am.
Chem. Soc. 125:2032-2033.
10. Moody, E. M., and P. C. Bevilacqua. 2003b. Folding of a stable DNA motif
involves a highly cooperative network of interactions. J. Am. Chem. Soc.
125:16285-16293.
11. Moody, E. M., and P. C. Bevilacqua. 2004. Structural and energetic
consequences of expanding a highly cooperative stable DNA hairpin loop. J. Am.
Chem. Soc. 126:9570-9577.
12. Glucksmann-Kuis, M. A., C. Malone, P. Markiewicz, and L. B. Rothman-Denes.
1992. Specific sequences and a hairpin structure in the template strand are
required for N4 virion RNA polymerase promoter recognition. Cell. 70:491–500.
13. Glucksmann-Kuis, M. A., X. Dai, P. Markiewicz, and L. B. Rothman-Denes. 1996.
E. coli SSB activates N4 virion RNA polymerase promoters by stabilizing a DNA
hairpin required for promoter recognition. Cell. 84:147–154.
14. Gellert, M. 2002. V(d)j recombination: rag proteins, repair factors, and regulation,
Annu. Rev. Biochem. 71:101-132.
15. Gacy, A. M., G. Geollner, N. Juranic, S. Macura, and C. T. McMurray. 1995.
Trinucleotide repeats that expand in human disease form hairpin structures in
vitro. Cell. 81:553-540.
16. Chen, X., S. V. Santhana-Mariappan, P. Catasti, R. Ratliff, R. K. Moyzis, A.
Laayoun, S. S. Smith, E. M. Bradbury, and G. Gupta. 1995. Hairpins are formed
by the single DNA strands of the fragile X triplet repeats: structure and biological
implications. Proc. Natl. Acad. Sci. U.S.A. 92:5199 –5203.
17. Mitas, M., A. Yu, J. Dill, and I. S. Haworth. 1995. The trinucleotide repeat
d(CGG)15 forms a heat-stable hairpin containing Gsyn:Ganti base pairs.
Biochem. 34:12803-12811.

DNA hairpin folding simulations study using T-Rex MD simulation
47
18. Gellibolian, R., A. Bacolla, and R. D. Wells. 1997. Triplet repeat instability and
DNA topology: An expansion model based on statistical mechanics. J. Biol.
Chem. 272:16793-16797.
19. Völker, J., N. Makube, G. E. Plum, H. H. Klump, and K. J. Breslauer. 2002.
Conformational energetics of stable and metastable states formed by DNA triplet
repeat oligonucleotides: implications for triplet expansion diseases. Proc. Natl.
Acad. Sci. USA. 99:14700-14705.
20. Pavia, A. M., and R. D. Sheardy. 2004. Influence of sequence context and length
on the structure and stability of triplet repeat DNA oligomers. Biochem. 43:14218-
14227.
21. Chou S. H., K. H. Chin, and A. H. Wang. 2003. Unusual DNA duplex and hairpin
motifs. Nucleic. Acids. Res. 31:2461-74.
22. Nakano, M., E. M. Moody, J. Liang, and P. C. Bevilacqua. 2002. Selection for
thermodynamically stable DNA tetraloops using temperature gradient gel
electrophoresis reveals four motifs: d(cGNNAg), d(cGNABg),d(cCNNGg), and
d(gCNNGc). Biochem. 41:14281-14292.
23. Zacharias, M. 2001. Conformational analysis of DNA-trinucleotide-hairpin-loop
structures using a continuum solvent model. Biophys. J. 80:2350-2363.
24. Villescas, G., and M. Zacharias. 2004. Efficient search on energy minima for
structure prediction of nucleic acid motifs. J. Biomol. Struct. Dyn. 22:355-364.
25. Ansari, A., S. V. Kuznetsov, and Y. Shen. 2001. Configurational diffusion down a
folding funnel describes the dynamics of DNA hairpins. Proc. Natl. Acad. Sci.
USA 98:7771-7776.
26. Ansari, A., and S. V. Kuznetsov. 2005. Is hairpin formation in single-stranded
polynucleotide diffusion-controlled? J. Phys. Chem. 109:12982-12989.
27. Wallace, M. I., L. Ying, S. Balasubramanian, and D. Klenerman. 2001. Non-
arrhenius kinetics for the loop closure of a DNA hairpin. Proc. Natl. Acad. Sci.
USA. 98:5584-5589.
28. Wang, X., and W. M. Nau. 2004. Kinetics of end-to-end collision in short single-
stranded nucleic acids. J. Am. Chem. Soc. 126:808-813.
DNA hairpin folding simulations study using T-Rex MD simulation
48
29. Kim, J., S. Doose, H. Neuweiler, and M. Sauer. 2006. The initial step of DNA
hairpin folding: a kinetic analysis using fluorescence correlation spectroscopy.
Nucleic. Acids. Res. 34:2516-2527.
30. Sorin, E. J., Y. M. Rhee, B. J. Nakatani, and V. S. Pande. 2003. Insights into
nucleic acid conformational dynamics from massively parallel stochastic
simulations. Biophys. J. 85:790–803.
31. Sorin, E. J., B. J. Nakatani, Y. M. Rhee, G., Jayachandran, V. Vishal, and V.S.
Pande. 2004. Does native state topology determine the RNA folding mechanism?
J. Mol. Biol. 337:789-797.
32. Sorin, E. J., Y. M. Rhee, and V.S. Pande. 2005. Does water play a structural role
in the folding of small nucleic acids? Biophys. J. 88:2516-2524.
33. Swendsen, R. H., and J. S. Wang. 1986. Replica Monte Carlo simulations of spin
glasses. Phys. Rev. Lett. 57:2607-2609.
34. Sugita, Y., and Y. Okamoto. 1999. Replica-exchange molecular dynamics
method for protein folding. Chem. Phys. Lett. 314:141-151.
35. Sanbonmatsu, K.Y., and A. E. Garcia. 2002. Structure of Met-enkephalin in
explicit aqueous solution using replica exchange molecular dynamics. Proteins:
Struct. Funct. Bioinf. 46:225-236.
36. Zhou, R., and B. J. Berne. 2002. Can a continuum solvent model reproduce the
free energy landscape of a -hairpin folding in water? Proc. Natl. Acad. Sci. USA.
99:12777-12782.
37. Zhou, R. 2004. Exploring the protein folding free energy landscape: coupling
replica exchange method with P3ME/RESPA algorithm. J. Mol. Graph. Model.
22: 451-463.
38. Yoshida, K., T. Yamaguchi, and Y. Okamoto. 2005. Replica-exchange molecular
dynamics simulation of small peptide in water and in ethanol. Chem. Phys. Lett.
41:2280-284.
39. Murata, K., Y. Sugita, and Y. Okamoto. 2004. Free energy calculations for DNA
base stacking by replica-exchange umbrella sampling. Chem. Phys. Lett. 385:1-
7.
DNA hairpin folding simulations study using T-Rex MD simulation
49
40. Murata, K., Y. Sugita, and Y. Okamoto. 2005. Molecular dynamics simulations of
DNA dimmers based on replica-exchange umbrella sampling I: test of sampling
efficiency. J. Theoret. Comput. Chem. 4:411-432.
41. Murata, K., Y. Sugita, and Y. Okamoto. 2005. Molecular dynamics simulations of
DNA dimmers based on replica-exchange umbrella sampling II: free energy
analysis. J. Theoret. Comput. Chem. 4:433-448.
42. Case, D. A., D. A. Pearlman, J. W. Caldwell, T. E. Cheatham III, W. S. Ross, C.
L. Simmerling, T. A. Darden, K. M. Merz, R. V. Stanton, A. L. Cheng, J. J.
Vincent, M. Crowley, V. Tsui, R. J. Radmer, Y. Duan, J. Pitera, I. Massova, G. L.
Seibel, U. C. Singh, P. K. Weiner, and P. A. Kollman. 2003. Amber 8. University
of California, San Francisco.
43. Jorgensen, W., J. Chandrasekhar, J. Madura, R. Impey, and M. Klein. 1983.
Comparison of simple potential finctions for simulating liquid water. J. Chem.
Phys. 79:926-935.
44. Duan Y., C. Wu, S. Chowdhury, M. C. Lee, G. Xiong, W. Zhang, R. Yang, P.
Cieplak, R. Luo, T. Lee, J. Caldwell, J. Wang, and P. Kollman. 2003. A point-
charge force field for molecular mechanics simulations of proteins based on
condensed-phase quantum mechanical calculations. J. Comput. Chem. 24:1999-
2012.
45. Essmann, U., L. Perera, M. L. Berkowitz, T. Darden, H. Lee, and L. Pedersen.
1995. A smooth particle mesh Ewald potential. J. Chem. Phys. 103:8577–8593.
46. Miyamoto, S., and P. A. Kollman. 1992. Settle: An analytical version of the
SHAKE and RATTLE algorithm for rigid water models. J. Comput. Chem. 13:952-
962.
47. Lavery, R., K. Zakrzewska, and H. Sklenar. 1995. JUMNA (junction minimization
of nucleic acids). Comput. Phys. Com. 91:135–158.
48. Feig, M., J. Karanicolas, and C. L. Brooks. 2004. MMTSB tool set: enhanced
sampling and multiscale modeling methods for applications in structural biology.
J. Mol. Graph. Model. 22:377-395.
49. Humphrey, W., A. Dalke, and K. Schulten. 1996. VMD: visual molecular
dynamics. J. Molec. Graph. 14:33-38.
DNA hairpin folding simulations study using T-Rex MD simulation
50
50. Luzzati, V., A. Mathis, F. Mason, and J. Witz. 1964. Structure transitions
observed in DNA and polyA in solution as a function of temperature and pH. J.
Mol. Biol. 10:28-41.
51. van Holde, K. E., J. Brahms, and A. M. Michelson. 1965. Base interactions of
nucleotide polymers in aqueous solution. J. Mol. Biol. 12:726-739.
52. Mills, J. B., E. Vacano, and P. J. Hagerman. 1999. Flexibility of single-stranded
DNA: Use of gapped duplex helices to determine the persistence length of
poly(dT) and poly(dA). J. Mol. Biol. 285:245-257.
53. Isakson, J., S. Acharya, J. Barman, P. Cheruka, and J. Chattopadhyaya. 2004.
Single-stranded adenine-rich DNA and RNA retain structural characteristics of
their respective double-stranded conformations and show directional differences
in stacking pattern. Biochem. 43:15996-16010.
54. Cheong, C., G. Varani, and I. Tinoco. 1990. Solution structure of an unusually
stable RNA hairpin, 5GGAC(UUCG)GUCC. Nature. 346:680-682.
55. Ennifar, E., A. Nikulin, S. Tishchenko, A. Serganov, N. Nevskaya, M. Garber, B.
Ehresmann, C. Ehresmann, S. Nikonov, and P. Dumas. 2000. The crystal
structure of UUCG tetraloop. J. Mol. Biol. 304:35-42.
56. Antao, V. P., S. Y. Lai, and I. Tinoco. 1991. A thermodynamic study of unusually
stable RNA and DNA hairpins. Nucleic. Acids. Res. 19:5901-5905.
57. Antao, V. P., and I. Tinoco. 1992. Thermodynamic parameters for loop formation
in RNA and DNA hairpin tetraloops. Nucleic. Acids. Res. 20:819-824.
51
Chapter 3
Enhanced sampling of peptide and protein conformations using replica - exchange simulations with a peptide backbone biasing-potential Srinivasaraghavan Kannan and Martin Zacharias School of Engineering and Science, International University Bremen, Campus Ring 6, D-
28759 Bremen, Germany
As published in : Proteins, 66, 697-706, 2007.
3.1 Abstract During replica exchange molecular dynamics (Rex MD) simulations several replicas of a
system are simulated at different temperatures in parallel allowing for exchange between
replicas at frequent intervals. This technique allows significantly improved sampling of
conformational space and is increasingly being used for structure prediction of peptides
and proteins. A drawback of the standard temperature Rex MD is the rapid increase of
the replica number with increasing system size to cover a desired temperature range. In
an effort to limit the number of replicas a new Hamiltonian-Rex MD method has been
developed that is specifically designed to enhance the sampling of peptide and protein
conformations by applying various levels of a backbone biasing potential for each replica
run. The biasing potential lowers the barrier for backbone dihedral transitions and
Development of BP-Rex MD method and its applications
52
promotes enhanced peptide backbone transitions along the replica coordinate. The
application on several peptide cases including in all cases explicit solvent indicates
significantly improved conformational sampling compared to standard MD simulations.
This was achieved with a very modest number of 5-7 replicas for each simulation system
making it ideally suited for peptide and protein folding simulations as well as refinement
of protein model structures in the presence of explicit solvent.
3.2 Introduction The application of classical molecular dynamics (MD) simulations for structure prediction
of peptides and proteins is limited by the accuracy of current force fields and the
simulation time scale. Peptides and proteins can adopt numerous locally stable
conformations separated by large energy barriers. Conformational transitions between
stable states can therefore be rare events even on the time scale of tens to hundreds of
nanoseconds that have become possible for peptide simulations [1-12]. Various
methods have been proposed to overcome the conformational sampling problem during
molecular simulations (reviewed in [12, 13]). For example, simulated annealing
techniques are frequently used to effectively cross energy barriers at high simulation
temperatures followed by slow cooling of the simulation system to select low energy
states [14]. However, high initial temperatures used in simulated annealing approaches
may interfere with the presence of explicit water molecules during MD simulations.
Alternatively, potential scaling methods have been suggested where the original
potential is scaled down or replaced by a soft core potential in order to lower barriers
during energy minimization or a molecular dynamics simulation [15-22]. In the locally
enhanced sampling method multiple conformational copies of a selected region of a
molecule are generated and a mean field from the copies is used during the simulation
to overcome barriers [23]. The parallel tempering or replica exchange molecular
dynamics (Rex MD) method is one of the most successful and now most widely used
methods to enhance conformational sampling in Monte Carlo (MC) [24-26] and MD
simulations [25,27-34]. In Rex MD simulations several copies (replicas) of the system
are simulated independently and simultaneously using classical MD or MC methods at
different simulation temperatures (or force fields: Hamiltonians). At preset intervals pairs
of replicas (neighbouring pairs) are exchanged with a specified transition probability. In
its original implementation temperature is used as a condition to be varied and
Development of BP-Rex MD method and its applications
53
exchanged among the replicas. The random walk in temperature allows conformations
trapped in locally stable states (at a low simulation temperature) to escape by
exchanging with replicas at higher simulation temperature. The Rex MD method has
been successfully applied in folding simulations of several peptides and mini-proteins
[30-34]. Unfortunately, efficient exchange between replicas requires sufficient overlap of
the energy distributions between neighbouring replicas. As a consequence the number
of required replicas grows approximately with the square root of the number of particles
in the system (to cover a desired temperature range) [36]. A larger number of replicas in
turn requires also increased simulation times in order to allow efficient “travelling” of
replicas in temperature space. One common approach to avoid an excessive increase in
the number of replicas in case of studying larger peptides or proteins is to eliminate the
solvent degrees of freedom by using an implicit solvent description (e.g. Generalized
Born (GB) model) [37]. However, it is not clear whether the accuracy of current implicit
solvent models is sufficient for a realistic description of the structure and dynamics of
peptides and proteins [31-33]. Hybrid explicit/implicit solvent models have been
suggested were the simulation of each replica is performed using an explicit solvent
description and for each exchange part of the solvent is replaced by a continuum [38].
Another approach employs separate coupling of solute and solvent to different heat
baths (target temperatures) [39]. Only the solute reference temperatures are varied for
each replica. Both methods reduce the effective system size compared at each
attempted replica exchange. However, the artificial temperature gradient at the solute-
solvent interface may cause artefacts in the latter methods. Instead of using the
simulation temperature as a replica coordinate it is also possible to use the force field or
Hamiltonian of the system as a replica-coordinate [36, 40-43]. Recently, a promising
“Hamiltonian”-Rex MD method has been suggested where the solute-solute, solute-
solvent and solvent-solvent interactions are separately (linearly) scaled for each replica
[42]. This approach can be used to “effectively” scale only the solute temperature along
the replica coordinate. In case of no scaling of the solvent-solvent interactions the replica
exchange probability becomes less dependent on the number of solvent degrees of
freedom and hence fewer replicas are required to cover a desired “effective”
temperature range compared to standard temperature replica exchange. A similar
approach where the nonbonded (Lennard-Jones and electrostatic) interactions within the
solute as well as between solute and solvent have been scaled to various degrees has
also been suggested [43].
Development of BP-Rex MD method and its applications
54
In the present study we propose an alternative “Hamiltonian” replica-exchange method
that focuses on the protein backbone flexibility and employs a specific biasing potential
to promote peptide backbone transitions as a replica coordinate. The purpose of the
biasing potential is to reduce the energy barriers associated with peptide backbone
dihedral transitions. The level of biasing is gradually changed along the replicas such
that frequent transitions are possible at high levels of biasing and the system can escape
from getting trapped in local energy minima. Since exchanges between replicas are
independent of the number of solvent molecules the method requires much fewer
replicas for efficient sampling compared to standard temperature Rex MD. The biasing
potential Rex MD (BP-Rex MD) method has been tested on several examples including
alanine and threonine dipeptides, a hexa-alanine (ALA6) system and one small beta-
hairpin protein with known structure (all including explicit solvent). In all cases much
better sampling of conformational space compared to standard MD simulations was
found. At the same time the approach required considerably fewer replicas (5-7) than
standard temperature Rex MD simulations.
3.3 Methodology 3.3.1 Test systems and simulation conditions The initial extended structures for the alanine (Ala) dipeptide (Ace-Ala-Nme), threonine
(Thr) dipeptide (Ace-Thr-Nme), poly-Ala (Ace-Ala6-Nme) and the chignolin hairpin
peptide (sequence: GYDPETGTWG) [44] were generated using the xleap module of the
Amber8 package [45]. The Ace and Nme groups represent N-terminal Acetyl and C-
terminal Methylamino capping groups, respectively. In all cases explicit TIP3P water
molecules [46] were added (alanine dipeptide: 560 waters; threonine dipeptide: 547
waters; hexa-Ala: 1046 waters; chignolin hairpin peptide: 1121 waters + 2 sodium
counter ions) to form truncated octahedral boxes using xleap. The parm03 force field
[47] was used for all simulations (without modifications). Each simulation system was
subjected to energy minimization (1000 steps) using the Sander module. During MD
simulation each peptide was initially harmonically restrained (25 kcal mol-1 Å-2) to the
energy minimized start coordinates (extended peptide structure) and the system was
heated up to 300K in steps of 100K followed by gradual removal of the positional
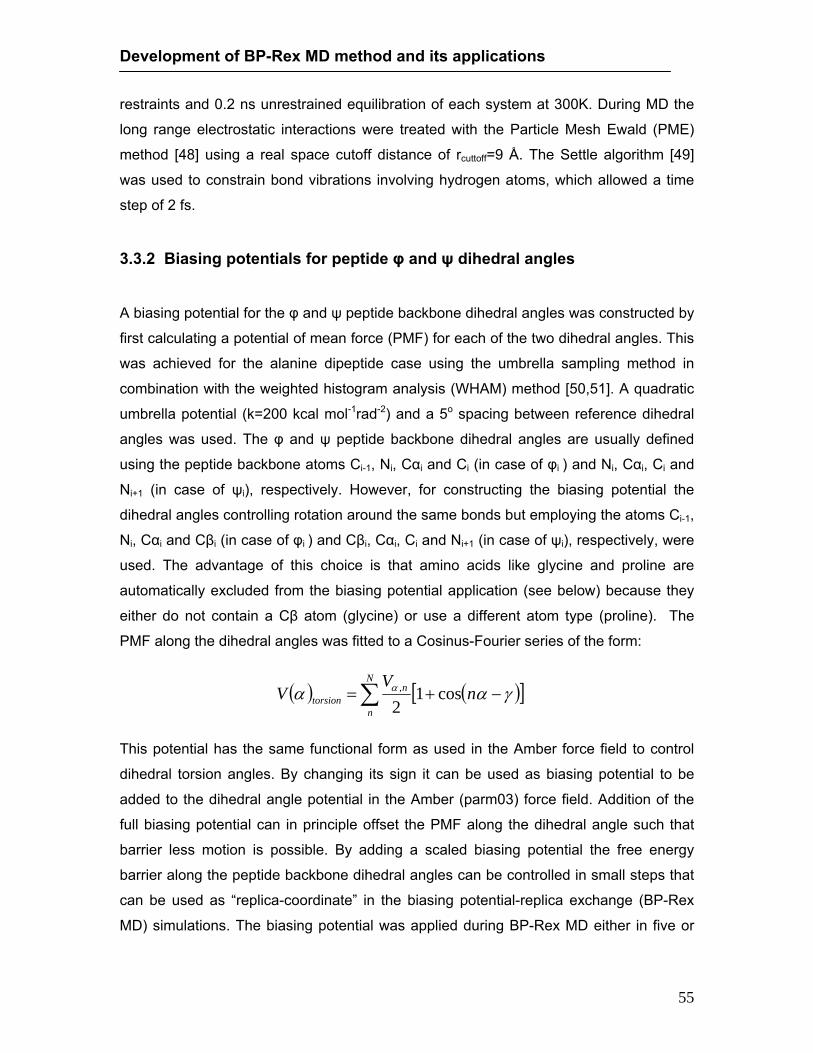
Development of BP-Rex MD method and its applications
55
restraints and 0.2 ns unrestrained equilibration of each system at 300K. During MD the
long range electrostatic interactions were treated with the Particle Mesh Ewald (PME)
method [48] using a real space cutoff distance of rcuttoff=9 Å. The Settle algorithm [49]
was used to constrain bond vibrations involving hydrogen atoms, which allowed a time
step of 2 fs.
3.3.2 Biasing potentials for peptide φ and ψ dihedral angles A biasing potential for the φ and ψ peptide backbone dihedral angles was constructed by
first calculating a potential of mean force (PMF) for each of the two dihedral angles. This
was achieved for the alanine dipeptide case using the umbrella sampling method in
combination with the weighted histogram analysis (WHAM) method [50,51]. A quadratic
umbrella potential (k=200 kcal mol-1rad-2) and a 5o spacing between reference dihedral
angles was used. The φ and ψ peptide backbone dihedral angles are usually defined
using the peptide backbone atoms Ci-1, Ni, Cαi and Ci (in case of φi ) and Ni, Cαi, Ci and
Ni+1 (in case of ψi), respectively. However, for constructing the biasing potential the
dihedral angles controlling rotation around the same bonds but employing the atoms Ci-1,
Ni, Cαi and Cβi (in case of φi ) and Cβi, Cαi, Ci and Ni+1 (in case of ψi), respectively, were
used. The advantage of this choice is that amino acids like glycine and proline are
automatically excluded from the biasing potential application (see below) because they
either do not contain a Cβ atom (glycine) or use a different atom type (proline). The
PMF along the dihedral angles was fitted to a Cosinus-Fourier series of the form:
This potential has the same functional form as used in the Amber force field to control
dihedral torsion angles. By changing its sign it can be used as biasing potential to be
added to the dihedral angle potential in the Amber (parm03) force field. Addition of the
full biasing potential can in principle offset the PMF along the dihedral angle such that
barrier less motion is possible. By adding a scaled biasing potential the free energy
barrier along the peptide backbone dihedral angles can be controlled in small steps that
can be used as “replica-coordinate” in the biasing potential-replica exchange (BP-Rex
MD) simulations. The biasing potential was applied during BP-Rex MD either in five or
( ) ( )[ ]∑ −+=N
n
ntorsion n
VV γαα α cos1
2,
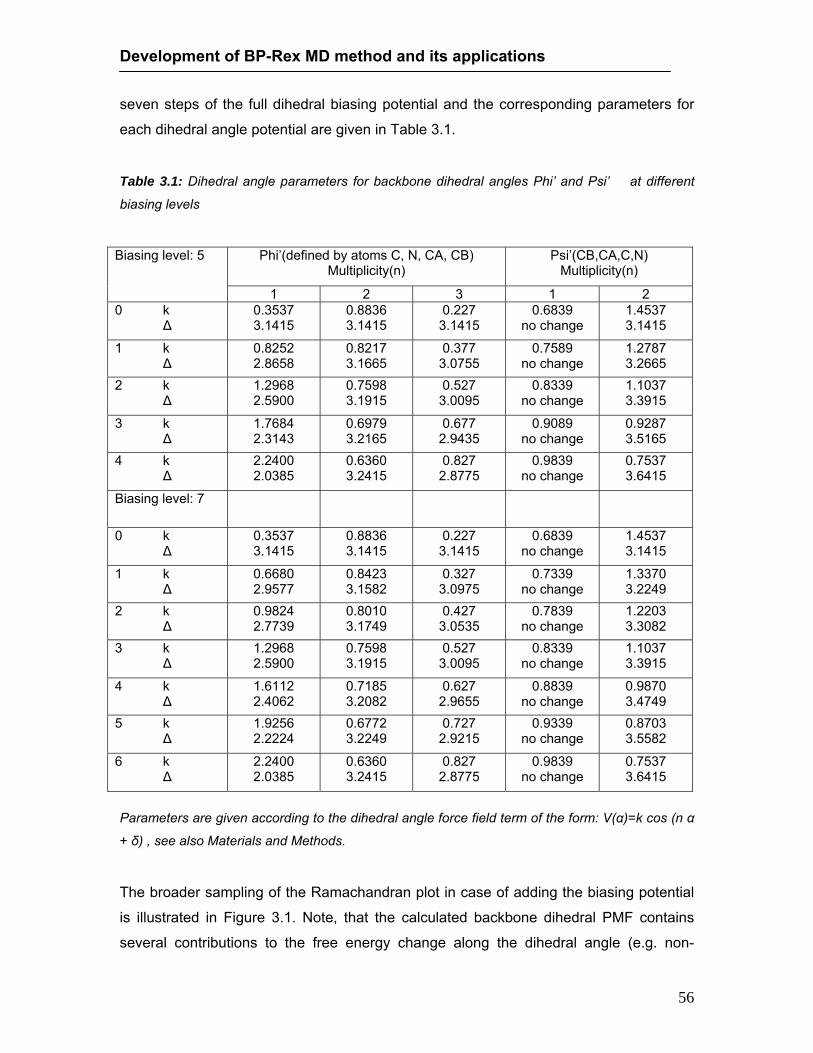
Development of BP-Rex MD method and its applications
56
seven steps of the full dihedral biasing potential and the corresponding parameters for
each dihedral angle potential are given in Table 3.1.
Table 3.1: Dihedral angle parameters for backbone dihedral angles Phi’ and Psi’ at different
biasing levels
Phi’(defined by atoms C, N, CA, CB)
Multiplicity(n) Psi’(CB,CA,C,N)
Multiplicity(n) Biasing level: 5 1 2 3 1 2 0 k Δ
0.3537 3.1415
0.8836 3.1415
0.227 3.1415
0.6839 no change
1.4537 3.1415
1 k Δ
0.8252 2.8658
0.8217 3.1665
0.377 3.0755
0.7589 no change
1.2787 3.2665
2 k Δ
1.2968 2.5900
0.7598 3.1915
0.527 3.0095
0.8339 no change
1.1037 3.3915
3 k Δ
1.7684 2.3143
0.6979 3.2165
0.677 2.9435
0.9089 no change
0.9287 3.5165
4 k Δ
2.2400 2.0385
0.6360 3.2415
0.827 2.8775
0.9839 no change
0.7537 3.6415
Biasing level: 7
0 k Δ
0.3537 3.1415
0.8836 3.1415
0.227 3.1415
0.6839 no change
1.4537 3.1415
1 k Δ
0.6680 2.9577
0.8423 3.1582
0.327 3.0975
0.7339 no change
1.3370 3.2249
2 k Δ
0.9824 2.7739
0.8010 3.1749
0.427 3.0535
0.7839 no change
1.2203 3.3082
3 k Δ
1.2968 2.5900
0.7598 3.1915
0.527 3.0095
0.8339 no change
1.1037 3.3915
4 k Δ
1.6112 2.4062
0.7185 3.2082
0.627 2.9655
0.8839 no change
0.9870 3.4749
5 k Δ
1.9256 2.2224
0.6772 3.2249
0.727 2.9215
0.9339 no change
0.8703 3.5582
6 k Δ
2.2400 2.0385
0.6360 3.2415
0.827 2.8775
0.9839 no change
0.7537 3.6415
Parameters are given according to the dihedral angle force field term of the form: V(α)=k cos (n α
+ δ) , see also Materials and Methods.
The broader sampling of the Ramachandran plot in case of adding the biasing potential
is illustrated in Figure 3.1. Note, that the calculated backbone dihedral PMF contains
several contributions to the free energy change along the dihedral angle (e.g. non-

Development of BP-Rex MD method and its applications
57
bonded interactions, solute-solvent contributions etc.) and is not equivalent to just the
dihedral angle dependent term in the original force field. Simple removal of the Amber
dihedral angle term still results in significant energy barriers for the peptide backbone
angles (this is for example nicely illustrated in Straastma & McCammon [16]).
3.3.3 Rex MD using a backbone dihedral angle biasing potential In standard Rex MD, copies or replicas of the system are simulated at different
temperature (T0,T1,T2,….TN). Each replica evolves independently and after 500-1000
MD-steps (~1 ps) an exchange of pairs of neighboring replica is attempted according to
the Metropolis criterion:
with β=1/RT (R: gas constant and T: temperature) and E(r) representing the potential
energy of system for a given configuration. It has been recognized that temperature
(represented as Boltzmann factor β) and energy (or Hamiltonian of the system) are
equivalent in the Metropolis criterion [36]. Hence, instead of modifying the temperature it
is also possible to scale the force field (or part of it) along the replica coordinate. In the
present biasing potential replica exchange method a biasing potential to allow backbone
dihedral angle barrier crossing has been added to the force field (last paragraph). Each
replica runs at a different level of added biasing potential (the first replica runs with the
original force field, see Table 3.1 for the parameters for each biasing level). Exchanges
at every 250 steps (0.5 ps) or 500 steps (1ps) between neighboring biasing levels were
attempted according to [25, 36]:
[ ])()()(
0)exp()(
;01)(
ijji
ji
ji
rErEwhere
forxxw
forxxw
−−=Δ
>ΔΔ−=→
≤Δ=→
ββ
( ) ( )[ ])()()()(
0)exp()(
;01)(
ii
ji
ij
jj
ji
ji
rErErErEwhere
forxxw
forxxw
−−−=Δ
>ΔΔ−=→
≤Δ=→
β

Development of BP-Rex MD method and its applications
58
Here, the Metropolis criterion involves only a single β or temperature (in the present
study 300K) and the energy difference between neighboring configurations using the
force field for replica j (Ej) minus the same difference using force field for replica i (Ei). An
advantage compared to temperature Rex MD is the fact the energy differences are only
affected by the force field term that changes upon going from one replica to another
replica run. Hence, the exchange probability is only affected by the backbone dihedral
angle terms and not affected by solvent-solvent and solute-solvent (and many other
solute-solute) contributions. For the present simulations with 5-7 replicas the acceptance
probability for replica exchanges was in the range of 40-60 % for all systems. In the
present study the biasing potential was applied to all φ and ψ peptide backbone dihedral
angles (except glycine and proline, see above). Note, however, that it is also possible to
limit the biasing potential to protein or peptide segments.
3.4 Results 3.4.1 Biasing potential replica exchange simulations on dipeptide test cases Potentials of mean force (PMF) for the φ and ψ peptide backbone dihedral angles of the
alanine dipeptide in explicit water were obtained using the umbrella sampling approach
in combination with the WHAM method. The PMF was used to create a biasing potential
(see Methods) that was added to the force field description of the peptide in order to
lower energy barriers for peptide backbone dihedral angle transitions. During replica
exchange simulations different levels of the biasing potential were added and the
corresponding force field parameters to control the backbone dihedral angle potential in
the Amber force field are given in Table 3.1. The sampling of the φ and ψ peptide
backbone dihedral angles at various biasing levels is illustrated in Figure 3.1 during a 1
ns BP-Rex MD simulation on the alanine dipeptide in explicit water. With the original force field (Figure 3.1a) during 1 ns simulation time (at 300 K) the
sampling is dominated by regions in the Ramachandran plot that correspond to α-helical
(φ: -160o to -50o; ψ: -60o to +30o), β-strand (φ: -180o to -110o; ψ: +110o to +180o) as well
a PII (polyproline, φ: -110o to -40o; ψ: +110o to +180o) states and a few rarely sampled
alternative states. With increasing levels of the added biasing potential the regions in

Development of BP-Rex MD method and its applications
59
between α-helical and β-strand/PII-regimes are sampled and also other transition regions
of the Ramachandran plot (Figure 3.1b-e).
Figure 3.1: Comparison of backbone dihedral angle sampling of the alanine dipeptide using 5
dihedral angle biasing potential levels (Table 3.1) during 1 ns biasing potential (BP)-Rex MD
simulation (at 300 K). Each dot in the Ramachandran plots corresponds to a φ-ψ-pair of a
sampled conformation (conformations were recorded every 1 ps).
Note, that a uniform sampling of the φ and ψ space was not achieved, presumably, due
to inaccuracies of the calculated PMFs (PMFs for φ and ψ were calculated
independently) or the fitting to a Cosine-series. However, for the present RexMD method
a uniform sampling of the Ramachandran plot at the full level of the biasing potential is
not required. It is not even desirable because parts of the Ramachandran plot
correspond to peptide conformations with severe sterical atom overlap. These
conformations should be avoided also in the replicas that run in the presence of the
biasing potential since such “unphysical” conformations do not correspond to transition
regions and have also little chance to be accepted in the run (replica) with the original

Development of BP-Rex MD method and its applications
60
force field. The main purpose of the biasing potential during replica exchange
simulations is to lower energy barriers for backbone dihedral transitions and enhance
sampling at the transition regions between favorable peptide substates (Figure 3.1). To
demonstrate the efficiency of the biasing potential replica exchange approach the
sampling of the φ and ψ dihedral angles for alanine dipeptide during 1 ns BP-Rex MD
with 5 replicas (Figure 3.2a) was compared to a 1 ns MD and 10 ns MD simulation
(Figures 3.2b,c), respectively, using the same start structure (extended conformation, all
at 300 K simualtion temperature).
Figure 3.2: Comparison of backbone dihedral angle sampling of the alanine dipeptide during 1 ns
BP-Rex MD (at 300 K) with 5 replicas (5 levels of the dihedral angle biasing potential, see
Methods and Table 3.1) (A), during 1 ns conventional MD (B) and during 10 ns conventional MD
(C). For the BP-Rex MD only the sampling for the replica at the original force field is shown. Each
dot in the Ramachandran plots corresponds to a φ-ψ-pair recorded every 1ps (A, B) or 10 ps (C)
to achieve the same total number of dots for each case. During the BP-Rex MD replica-exchanges were attempted every 500 steps (1 ps)
between the biasing potential levels given in Table 3.1 (5-Replica-level-case). The
sampling given in Figure 3.2 was obtained for the reference replica with the original force
field (no biasing potential). During a 1ns MD simulation the conventional MD approach
sampled only the region of the Ramachanran plot close to the initial structure (Figure
3.2b, e.g. the sampling result depends strongly on the start conditions). The sampling of
the Ramachandran plot during the 1 ns BP-Rex MD was very similar to the sampling
obtained from a longer MD simulation of 10 ns (compare Figure 3.2a and 3.2c). Note,
however, that the total MD simulation time for the replica exchange simulation amounts
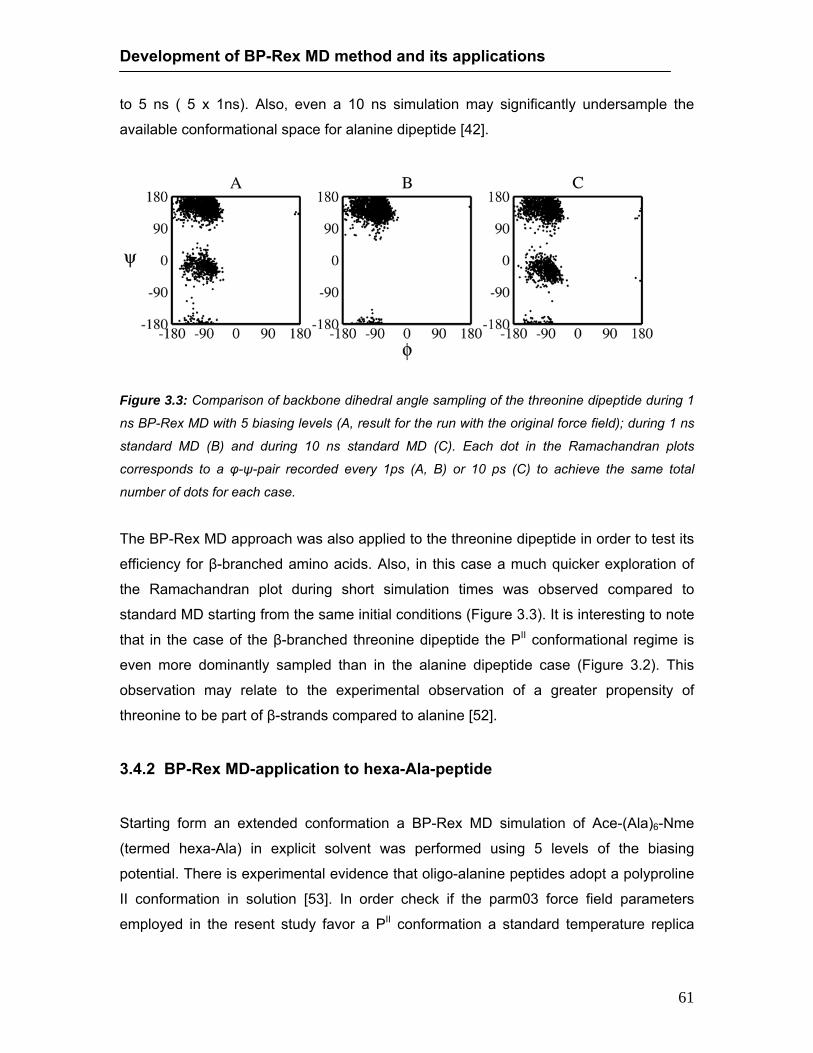
Development of BP-Rex MD method and its applications
61
to 5 ns ( 5 x 1ns). Also, even a 10 ns simulation may significantly undersample the
available conformational space for alanine dipeptide [42].
Figure 3.3: Comparison of backbone dihedral angle sampling of the threonine dipeptide during 1
ns BP-Rex MD with 5 biasing levels (A, result for the run with the original force field); during 1 ns
standard MD (B) and during 10 ns standard MD (C). Each dot in the Ramachandran plots
corresponds to a φ-ψ-pair recorded every 1ps (A, B) or 10 ps (C) to achieve the same total
number of dots for each case.
The BP-Rex MD approach was also applied to the threonine dipeptide in order to test its
efficiency for β-branched amino acids. Also, in this case a much quicker exploration of
the Ramachandran plot during short simulation times was observed compared to
standard MD starting from the same initial conditions (Figure 3.3). It is interesting to note
that in the case of the β-branched threonine dipeptide the PII conformational regime is
even more dominantly sampled than in the alanine dipeptide case (Figure 3.2). This
observation may relate to the experimental observation of a greater propensity of
threonine to be part of β-strands compared to alanine [52].
3.4.2 BP-Rex MD-application to hexa-Ala-peptide
Starting form an extended conformation a BP-Rex MD simulation of Ace-(Ala)6-Nme
(termed hexa-Ala) in explicit solvent was performed using 5 levels of the biasing
potential. There is experimental evidence that oligo-alanine peptides adopt a polyproline
II conformation in solution [53]. In order check if the parm03 force field parameters
employed in the resent study favor a PII conformation a standard temperature replica

Development of BP-Rex MD method and its applications
62
exchange simulation with 16 replicas was performed (~6 ns, simulation temperatures:
300K, 303K, 306.6K, 310.8K, 316.2K, 321K, 327.6K, 334.2K, 341.4K, 349.2K, 357.6K,
366.6K, 376.6K, 386.4K, 397.2K, 408.6K). The above temperature spacing resulted in
an exchange acceptance ratio of ~30%. As a second control a long MD reference
simulation (300K, 15 ns) starting from the same extended hexa-Ala structure was
performed. Table 3.2: Distribution of peptide backbone conformational states observed during MD
simulations
secondary Alanine dipeptide Hexa-Ala (Ace-(Ala)6-Nme) Structure 5 ns standard MD BP-Rex MD Standard MD Temp. Rex MD
Alpha (R)(αR) 41.2 51.9 53.8 45.6 Beta (β) 15.6 10.5 8.4 9.2 PII 32.2 26.8 29.2 29.6 Alpha(L)( αL) 2.0 0.2 0.58 2.4
Numbers are given as percentages. The numbers given for the Hexa-Ala case are from 5 ns
simulation time. The types of secondary structures are defined as Alpha (R) (αR-helical; φ: -160o
to -50o; ψ: -60o to +30o), Beta (β-strand; φ: -180o to -110o; ψ: +110o to +180o), PII (polyproline; φ: -
110o to -40o; ψ: +110o to +180o) and Alpha(L)(αL-helical; φ: +20o to +70o; ψ: -30o to +70o)
Figure 3.4: Root-mean-square deviation (Rmsd of Cα-atoms) of sampled hexa-Ala (Ace-(Ala)6-
Nme) conformations from a standard α-helix vs simulation time. (A) Hexa-Ala-Rmsd obtained
during 15 ns standard MD at 300K; (B) same for a BP-Rex MD (for the replica run with the
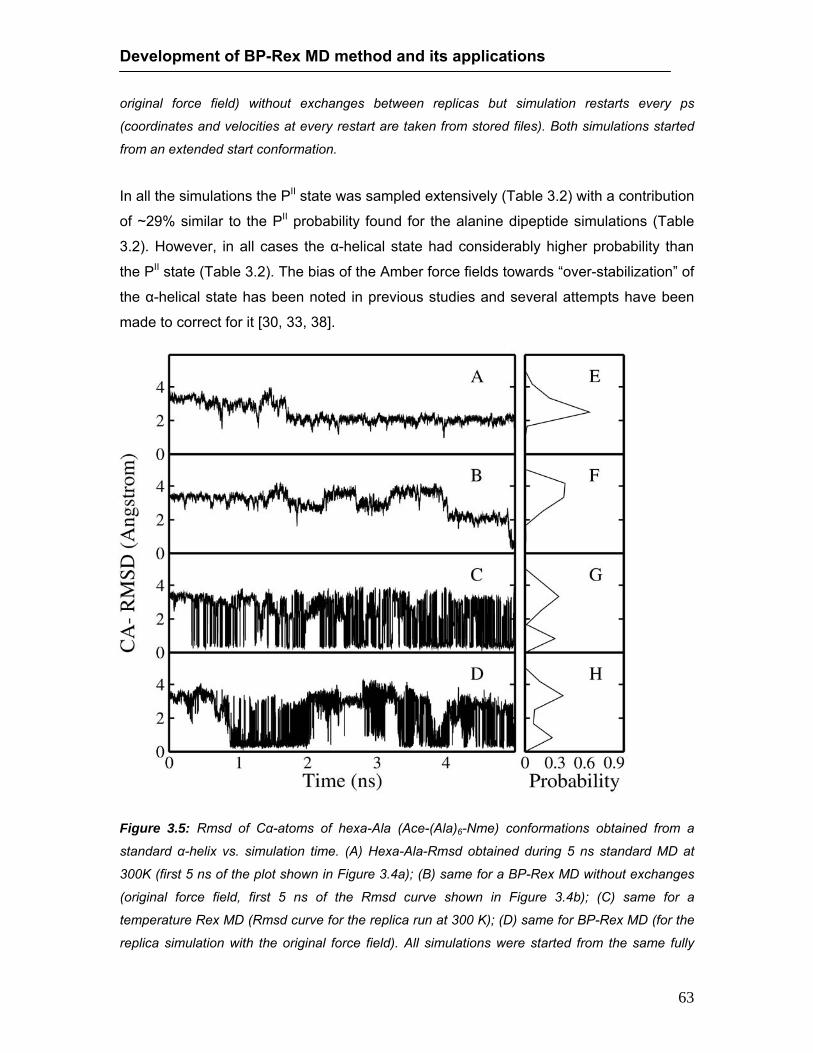
Development of BP-Rex MD method and its applications
63
original force field) without exchanges between replicas but simulation restarts every ps
(coordinates and velocities at every restart are taken from stored files). Both simulations started
from an extended start conformation.
In all the simulations the PII state was sampled extensively (Table 3.2) with a contribution
of ~29% similar to the PII probability found for the alanine dipeptide simulations (Table
3.2). However, in all cases the α-helical state had considerably higher probability than
the PII state (Table 3.2). The bias of the Amber force fields towards “over-stabilization” of
the α-helical state has been noted in previous studies and several attempts have been
made to correct for it [30, 33, 38].
Figure 3.5: Rmsd of Cα-atoms of hexa-Ala (Ace-(Ala)6-Nme) conformations obtained from a
standard α-helix vs. simulation time. (A) Hexa-Ala-Rmsd obtained during 5 ns standard MD at
300K (first 5 ns of the plot shown in Figure 3.4a); (B) same for a BP-Rex MD without exchanges
(original force field, first 5 ns of the Rmsd curve shown in Figure 3.4b); (C) same for a
temperature Rex MD (Rmsd curve for the replica run at 300 K); (D) same for BP-Rex MD (for the
replica simulation with the original force field). All simulations were started from the same fully
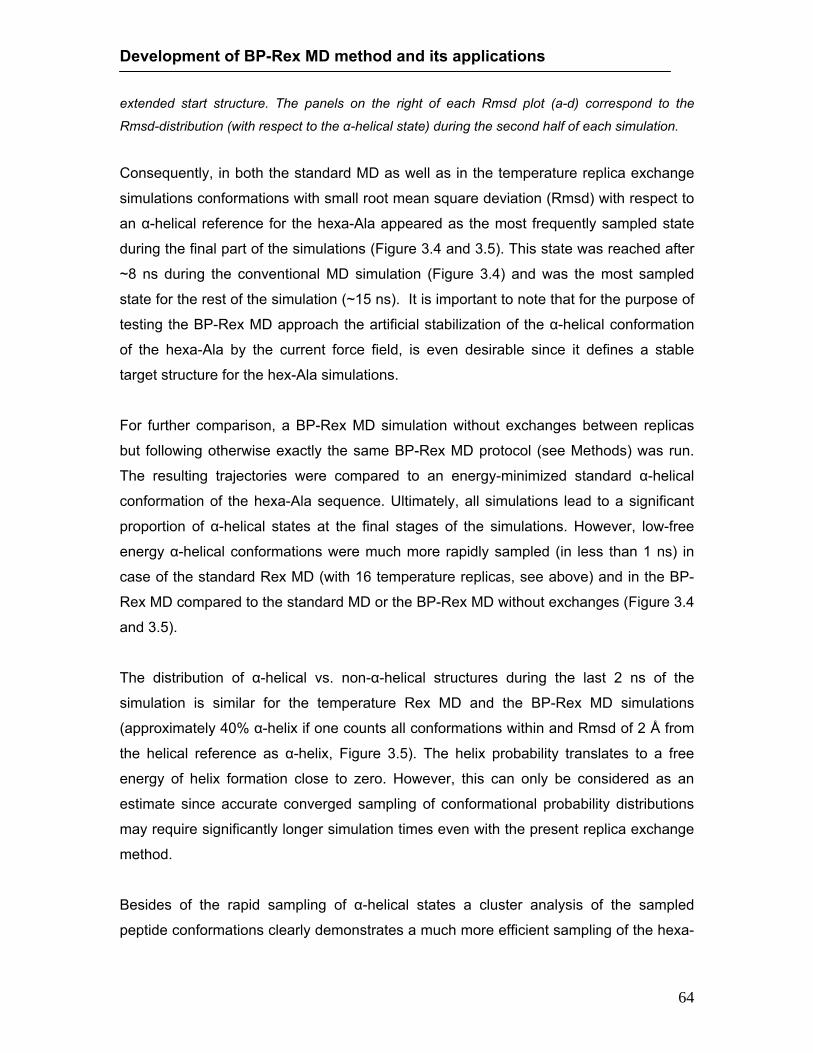
Development of BP-Rex MD method and its applications
64
extended start structure. The panels on the right of each Rmsd plot (a-d) correspond to the
Rmsd-distribution (with respect to the α-helical state) during the second half of each simulation.
Consequently, in both the standard MD as well as in the temperature replica exchange
simulations conformations with small root mean square deviation (Rmsd) with respect to
an α-helical reference for the hexa-Ala appeared as the most frequently sampled state
during the final part of the simulations (Figure 3.4 and 3.5). This state was reached after
~8 ns during the conventional MD simulation (Figure 3.4) and was the most sampled
state for the rest of the simulation (~15 ns). It is important to note that for the purpose of
testing the BP-Rex MD approach the artificial stabilization of the α-helical conformation
of the hexa-Ala by the current force field, is even desirable since it defines a stable
target structure for the hex-Ala simulations.
For further comparison, a BP-Rex MD simulation without exchanges between replicas
but following otherwise exactly the same BP-Rex MD protocol (see Methods) was run.
The resulting trajectories were compared to an energy-minimized standard α-helical
conformation of the hexa-Ala sequence. Ultimately, all simulations lead to a significant
proportion of α-helical states at the final stages of the simulations. However, low-free
energy α-helical conformations were much more rapidly sampled (in less than 1 ns) in
case of the standard Rex MD (with 16 temperature replicas, see above) and in the BP-
Rex MD compared to the standard MD or the BP-Rex MD without exchanges (Figure 3.4
and 3.5).
The distribution of α-helical vs. non-α-helical structures during the last 2 ns of the
simulation is similar for the temperature Rex MD and the BP-Rex MD simulations
(approximately 40% α-helix if one counts all conformations within and Rmsd of 2 Å from
the helical reference as α-helix, Figure 3.5). The helix probability translates to a free
energy of helix formation close to zero. However, this can only be considered as an
estimate since accurate converged sampling of conformational probability distributions
may require significantly longer simulation times even with the present replica exchange
method.
Besides of the rapid sampling of α-helical states a cluster analysis of the sampled
peptide conformations clearly demonstrates a much more efficient sampling of the hexa-
Development of BP-Rex MD method and its applications
65
Ala conformations using the BP-Rex MD (or temperature Rex MD) compared to
standard continuous MD simulations (Figure 3.6). Cluster analysis was based on the
pair-wise Cartesian (backbone) Rmsd between conformations with an Rmsd cutoff of 2
Å and using the kclust program in MMPBS-tools [53]. Both the BP-Rex MD and the
temperature Rex MD covered approximately twice the number of distinct conformational
clusters after a few nanoseconds of simulations time (Figure 3.6a). Besides a dominant
cluster representing the α-helical state two alternative states that were also significantly
populated correspond to β-hairpin type structures with the turn located at different
positions along the sequence (not shown).
Figure 3.6: Accumulation of conformational clusters during standard MD simulations (circles and
dashed lines) and BP-Rex MD simulations (continuous lines) of hexa-Ala (A) and chignolin (B)
peptides. In case of hexa-Ala the result of temperature Rex MD is also shown (stars and dotted
lines). Cluster analysis was performed on all recorded structures up to the simulation time given
on the x-axis using the program kclust of the MMTSb tools [54] and a 2 Å RmsdCα exclusion
cutoff for the distance of conformations to each cluster center. The number of accumulated
distinct clusters is plotted vs. simulation time.

Development of BP-Rex MD method and its applications
66
3.4.3 Folding simulations on a beta-hairpin forming peptide The efficiency of the BP-Rex MD approach was further evaluated on the chignolin
peptide, one of the smallest β-hairpin peptides known to be stable in solution [44]. The
structure of this protein was recently determined by NMR experiments [44]. It has also
been demonstrated that extensive conventional temperature Rex MD simulations (using
16 replicas) of more than 100 ns including ~890 water explicit molecules can lead to a
folded structure very similar to the experimental NMR structure [10].
Figure 3.7: Rmsd of sampled chignolin peptide conformations from the experimental NMR
structure (first entry of pdb1ua0) vs simulation time starting from a fully extended peptide
structure. (A) Heavy atom-Rmsd obtained during 20 ns standard MD at 300K; (B) same for a BP-
Rex MD without exchanges (original force field); (C) same for a BP-Rex MD (Rmsd curve for the
replica with the original force field); (D) same as C but showing the Cα-Rmsd. The panels on the
right of each Rmsd plot correspond to the Rmsd-distribution (with respect to experimental
structure) during the second half of each simulation.

Development of BP-Rex MD method and its applications
67
A BP-Rex MD with 7 biasing potential levels was used to study this peptide in explicit
solvent simulations with more than 1100 water molecules starting from an extended
conformation. Within ~5-10 ns transitions to a conformation with a backbone Rmsd of
~1.9 Å (heavy atom Rmsd: 2.8 Å) with respect to the
A
B
Figure 3.8: (A) Stereo view of the extended chignolin peptide start structure (atom color code,
only heavy atoms are shown). The Rmsd (heavy atoms) of the start structure from the
experimental structure (pdb1ua0) was 6. 3 Å. (B) Stereo view of a folded chignolin peptide

Development of BP-Rex MD method and its applications
68
structure (atom color code) obtained after ~15 ns BP-Rex MD with a heavy atom Rmsd of 1.7 Å
from experiment superimposed on the experimental structure (yellow).
experimental NMR structure [44] (first structure of NMR ensemble in (protein data bank
entry) pdb1UA0) appeared (Figure 3.7). After ~15 ns increased sampling of
conformations with a backbone Rmsd <1 Å (heavy atom Rmsd: ~1.5 Å) was observed
(Figure 3.7). The superposition of a snapshot from the last part of the BP-Rex MD
simulation onto the experimental structure indicates very close agreement (Figure 3.8b)
and a large scale conformational transition with respect to the extended start structure
(Figure 3.8a).
Note, that the average pair-wise Rmsd between the NMR models is in the same order of
~1 Å (pdb1UA0). This indicates that the level of agreement with experiment as observed
during the simulation is within the uncertainties of the NMR structure determination.
Around 40 % of the conformations sampled during the last 5 ns of the BP-Rex MD are
within a backbone Rmsd of 1.5 Å from the reference structure. This fraction is slowly
increasing over time indicating that for obtaining a converged probability distribution
longer simulations might be necessary. In none of the control simulations (standard MD
at 300K or Rex MD without exchanges) peptide conformations within 1.5 Å from the
reference structure were observed indicating that time scales beyond 20 ns are required
to reach a folded state for this peptide in standard MD approaches (control simulations
beyond 40 ns still did not lead to folded structures, not shown).
Similar to the previous example (hexa-Ala) a cluster analysis of the simulations (Figure
3.6b) indicates rapid increase in the number of sampled distinct conformational states
(clusters) already during the early phase of the BP-Rex MD simulation whereas very
limited coverage and much slower appearance of new distinct clusters during the entire
simulation time (20 ns) was observed for the conventional MD simulation (Figure 3.6).
3.5 Discussion Replica exchange MD simulations are frequently used to enhance the conformational
sampling during molecular dynamics simulations [7-12,27,29-34]. A drawback of the
conventional temperature Rex MD is the rapid increase of the number of replicas with
Development of BP-Rex MD method and its applications
69
increasing system size in order to cover a desired temperature range [36]. The ratio of
the standard deviation of the system potential energy (a measure of the energy
fluctuation) vs. average energy decreases with the square-root of the system size.
Hence, to achieve sufficient overlap of the energy distributions between replicas run at
different temperatures (required to achieve a reasonable exchange acceptance ratio) the
temperature “spacing” between neighbouring replicas is required to decrease with
system size. Another drawback of large numbers of replicas is the need to run longer
simulations (or more exchanges) to allow sufficient “travelling” or exchanges between
high and low temperature replicas compared to a small number of replicas. Especially in
case of simulations that include a large number of explicit water molecules the rapid
increase of the number of replicas in temperature Rex MD simulations limits the
applicability to peptide or small protein systems. To decrease the number of replicas
during Rex MD simulations separate temperature coupling of solute and solvent degrees
of freedom has been used with the solvent temperature kept at the reference
temperature [39]. A hybrid explict/implicit solvent Rex MD approach has been developed
where all replicas are run in the presence of explicit solvent but for the evaluation of the
exchange probability part of the water is replaced by a continuum description [38].
Another alternative is to scale the potential energy function (Hamiltonian) along the
replicas [36,40-43]. Promising Hamiltonian replica exchange approaches have been
developed that scale nonbonded interactions (Lennard-Jones and electrostatic
interactions) within the solute and between solute and solvent to various degrees [42,
43]. A critical issue in the application of such Hamiltonian replica exchange methods is
the choice and magnitude of force field energy terms to be scaled along the replicas.
In the present study a new type of Hamiltonian-Rex MD method has been presented that
employs varying levels of biasing potential for the φ and ψ peptide backbone dihedral
angles along the system replicas. The biasing potential lowers the barrier for backbone
dihedral transitions and promotes an increased tendency for peptide backbone
transitions along the replica coordinate. Such backbone biasing potentials have been
used successfully in previous simulation studies on oligo-Ala peptides [16] and on cyclic
peptides [20] and proteins [19] (in single conventional simulations). In these applications
the peptide backbone dihedral potential was scaled or a biasing potential was applied
during an early stage of a simulation and gradually transformed to the original potential
during a single MD simulation. This is similar to a simulated annealing simulation were
Development of BP-Rex MD method and its applications
70
typically one starts form a high simulation temperature and gradually reduce the
temperature to a low value with the drawback that the result of the simulation depends
strongly on the system and speed of temperature decrease during the annealing run.
The φ and ψ dihedral angles are the main conformational determinants of the main chain
conformation of peptides and proteins and correspond to soft degrees of freedom for the
peptide structure with relatively small transition energy barriers. In contrast to
temperature Rex MD and other Hamiltonian-Rex MD approaches the present BP-Rex
MD method employes structural knowledge on peptides and proteins to design a replica
coordinate most appropriate for enhanced peptide/protein conformational sampling
because it focusses on a soft degree of freedom of a peptide or protein.
Only between 5 and 7 replicas were necessary for the hexa-Ala-peptide and the hairpin
forming peptide (chignolin), respectively, including between 600 (hexa Ala) and 1100
(chignolin) explicit water molecules to achieve folding of these peptides in explicit solvent
to conformations in close agreement with experimental structures (or a stable structure
for the Amber force field in case of the hexa-Ala peptide). The relatively high replica-
exchange acceptance probability of 40-60% (compared to ~30% in case of most
temperature replica simulations) for these systems indicates that an optimization of the
approach with respect to the number of replicas may result in even smaller number of
replicas for typical peptide simulation systems. Temperature replica exchange
simulations on the same systems required 16 replicas in case of the hexa-Ala system
(present study) and 16 replicas in a case of a published study on the chignolin peptide
[10] including less water molecules than the present study.
In contrast to the standard temperature Rex MD, for the present BP-Rex MD the number
of required replicas is independent of the number of water molecules included during the
simulation. Only the biasing potential energy term enters into the exchange probability
meaning that the number of required replicas is expected to scale approximately linearly
with the number of included backbone dihedral angles. A drawback compared to
standard Rex MD methods, however, is the fact that the present BP-Rex MD is restricted
to peptide or protein simulations and per se not generally applicable to any organic or
bio-molecule of interest. Also, for each peptide force field a specific biasing potential
needs to be constructed to apply the current method. However, it is in principle also
possible for other types of biomolecules to identify the most important variables that
Development of BP-Rex MD method and its applications
71
control the biomolecule structure and to construct an appropriate biasing potential.
Another advantage is that the replica exchange sampling can be easily focussed to parts
of a protein (e.g. a loop region) keeping the “unbiased” (original) backbone dihedral
angle potential for the rest of the protein in all replicas. For example, comparative protein
modeling based on sequence similarity of a protein to a protein with known structure
often relies on a non-uniform similarity along the sequence alignment. Parts of the
protein can be modelled with high confidence and other regions (e.g. loop regions with
low target-template similarity) have to be modelled by ab initio methods. In this case
enhanced sampling of parts of proteins under realistic conditions (in the presence of
explicit water molecules) is desired during refinement steps of comparative protein
modeling or at protein-protein and protein-ligand interfaces.
Instead of independent biasing potentials for peptide backbone dihedral angles it is also
possible to apply a similar approach to a collective degree of freedom (e.g. a
combination of dihedral angles). The present BP-Rex MD method is ideally suited to
refine model proteins by focussing the biasing potential during BP-Rex MD to critical
protein segments. This further limits the number of required replicas. Other applications
of the present BP-Rex MD could include improved sampling of peptide backbone
conformations during ab initio protein or peptide folding simulations. It is also straight
forward to extend the method to include enhanced conformational transition of side
chain conformations by constructing an appropriate biasing potential for amino acid side
chain transitions.
Acknowledgements: This work was performed using the computational resources of
the CLAMV (Computer Laboratories for Animation, Modeling and Visualization) at IUB
and supercomputer resources of the EMSL (Environmental Molecular Science
Laboratories) at the PNNL (Pacific Northwest National Laboratories; grant gc11-2002).
S.K. is supported by the BIOlogical RECognition graduate program at IUB and by a
grant from the VolkswagenStiftung to M.Z.

Development of BP-Rex MD method and its applications
72
3.6 References
1. Daura X, Jaun B, Seebach D, van Gunsteren WF, Mark AE. Reversible peptide
folding in solution by molecular dynamics simulation. J Mol Biol 1998;280:925-
932.
2. Duan, Y, Kollman, PA. Pathways to a protein folding intermediate observed in a
1-microsecond simulation in aqueous solution. Science 1998;282:740–744.
3. Roccatano D, Amadei A, Nola N Di, Berendsen HJ. A molecular dynamics study
of the 41-56 β-hairpin from b1 domain of protein G. Protein Sci 1999;10:2130.
4. Pande VS, Roshkar DS. Molecular dynamics simulations of unfolding and
refolding of a β-hairpin fragment of protein G. Proc Natl Acad Sci USA
1999;96:9062.
5. Garcia AE, Sanbonmatsu KY. Exploring the energy landscape of a β-hairpin in
explicit solvent. Proteins Struct Funct Bioinf 2001;42:345.
6. Simmerling C, Strockbine B, Roitberg AE. All-atom structure prediction and
folding simulations of a stable protein. J Am Chem Soc 2002;124:11258-11259.
7. Zhou R, Berne BJ, Germain R. The free energy landscape for β-hairpin folding in
explicit water. Proc Natl Acad Sci USA 2001;98:14931.
8. Rao F, Caflisch A. Replica exchange molecular dynamics simulations of
reversible folding. J Chem Phys 2003;119: 4035-4042.
9. Roccatano D, Nau WM, Zacharias M. Structural and dynamic properties of the
CAGQW peptide in water: A molecular dynamics simulation study using different
force fields. J Phys Chem 2004;108:18734-18742
10. Seibert, MM, Patriksson, A, Hess, B, van der Spoel, D. Reproducible Polypeptide
Folding and Structure Prediction using Molecular Dynamics Simulations. J Mol
Biol 2005;354: 173–183
11. Nguyen P, Stock G, Mittag E, Hu C-K, Li MS. Free energy landscape and folding
mechanism of a β-hairpin in explicit water: A replica exchange molecular
dynamics study. Proteins 2006;61:795.
12. Gnanakaran S, Nymeyer H, Portman J, Sanbonmatsu KY, Garcia AE. Peptide
folding simulations. Curr Opin Struct Biol. 2003;15:168.
13. Kaihsu T. Conformational sampling for the impatient. Biophys Chem
2004;107:213.

Development of BP-Rex MD method and its applications
73
14. Brunger, AT, Adams, PD, Rice, LM New applications of simulated annealing in X-
ray crystallography and solution NMR. Structure 1997;5:325-336.
15. Kostrowicki J, Scheraga HA. 1992. Application of the diffusion equation method
for global optimization to oligopeptides. J Chem Phys 96:7442-7449.
16. Straatsma TP, McCammon JA. 1994. Treatment of rotational isomers III. The use
of biasing potentials, J Chem Phys 101:5032-5039.
17. Huber, T., Torda, A.E. and van Gunsteren, W.F. Structure optimization
combining soft-core interaction functions, the diffusion equation method and
molecular dynamics. J Phys Chem A 1997;10:5926-5930.
18. Tappura K, Lahtela-Kakkonen M, Teleman O. A new soft-core potential function
for molecular dynamics applied to the prediction of protein loop conformations. J
Comput Chem 2000;21:388-397.
19. Tappura K. Influence of rotational energy barriers to the conformational search of
protein loops in molecular dynamics and ranking the conformations. Proteins
Struct Funct Genet 2001;44:167-179.
20. Riemann RN, Zacharias M. Reversible scaling of dihedral angle barriers during
molecular dynamics to improve structure prediction of cyclic peptides. J Pept Res
2004;63:354-364.
21. Riemann, RN, Zacharias M. Refinement of protein cores and protein-peptide
interfaces using a potential scaling approach. Prot Eng Des Select 2005;18:465-
476.
22. Hornak V, Simmerling C. Generation of accurate protein loop conformations
through low-barrier molecular dynamics. Proteins Struct Funct Bioinf
2003;51:577-590.
23. Simmerling C, Miller JL, Kollman PA. J Am Chem Soc 1998;120:7149-7158.
24. Swendsen RH, Wang JS. Replica Monte Carlo simulations of spin glasses. Phys
Rev Lett 1986;57:2607-2609.
25. Okamoto Y. Generalized-ensemble algorithms: enhanced sampling techniques
for Monte Carlo and molecular dynamics simulations. J Mol Graph Model
2004;22:425-439.
26. Predescu C, Predescu M, Ciobanu CVJ. On the Efficiency of Exchange in
Parallel Tempering Monte Carlo Simulations J Phys Chem B 2005;109:4189-
4196.

Development of BP-Rex MD method and its applications
74
27. Sugita Y, Okamoto Y. Replica-exchange molecular dynamics method for protein
folding. Chem Phys Lett 1999;314:141-151.
28. Okabe T, Kawata M, Okamoto Y, Mikami M. Replica-exchange Monte Carlo
method for the isobaric–isothermal ensemble. Chem Phys Lett 2001;335:435–
439
29. Mitsutake A, Sugita Y, Okamoto Y. Generalized-ensemble algorithms for
molecular simulations of biopolymers. Biopolymers 2001;60:96-123.
30. Sanbonmatsu KY, Garcia AE. Structure of Met-enkephalin in explicit aqueous
solution using replica exchange molecular dynamics. Proteins Struct Funct Bioinf
2002;46:225.
31. Zhou R, Berne BJ. Can a continuum solvent model reproduce the free energy
landscape of a -hairpin folding in water? Proc Natl Acad Sci USA
2002;99:12777-12782.
32. Zhou R. Free energy landscape of protein folding in water: explicit vs. implicit
solvent. Proteins Struct Funct Bioinf 2003;53:148-161.
33. Nymeyer H, Garcia AE. Simulation of the folding equilibrium of -helical
peptides: a comparison of the generalized Born approximation with explicit
solvent. Proc Natl Acad Sci USA 2003;100:13934-13939.
34. Yoshida K, Yamaguchi T, Okamoto Y. Replica-exchange molecular dynamics
simulation of small peptide in water and in ethanol. Chem Phys Lett
2005;41:2280-284
35. Rathore N, Chopra M, de Pablo JJ. Optimal allocation of replicas in parallel
tempering simulations. J Chem Phys 2005;122:24111-24118.
36. Fukunishi H, Watanabe O, Takada S. On the Hamiltonian replica exchange
method for efficient sampling of biomolecular systems: application to protein
structure prediction. J Chem Phys 2002;116:9058-906.
37. Bashford D, Case DA. Generalized Born models of macromolecular solvation
effects. Annu Rev Phys Chem 2000;51:129-152.
38. Okur A, Wickstrom L, Layten M, Geney R; Song K, Hornak V, Simmerling, CJ.
Improved efficiency of replica exchange simulations through use of a hybrid
explicit/implicit solvation model. Chem Theory and Comput 2006;2:420-433.
39. Cheng, X, Cui, G,Hornak, V, Simmerling, C. Modified Replica Exchange
Simulation Methods for Local Structure Refinement. J Phys Chem B
2005;109:8220-8230.
Development of BP-Rex MD method and its applications
75
40. Jang S, Shin S, Pak Y. Replica-exchange method using the generalized effective
potential. Phys Rev Lett 2003;91:58305-58309.
41. Zhu Z, Tuckerman ME, Samuelson SO, Martyna GJ. Using Novel Variable
Transformations to Enhance Conformational Sampling in Molecular Dynamics.
Phys Rev Lett 2002;88:100201
42. Liu P, Kim B, Friesner RA, Berne BA. Replica exchange with solute tempering: A
method for sampling biological systems in explicit water. Proc Natl Acad Sci
2005;102:13749-13754
43. Affentranger R., Tavernelli I, Di Iorio EE. A Novel Hamiltonian Replica Exchange
MD Protocol to Enhance Protein Conformational Space Sampling J Chem
Theory Comput. 2006;2:217-228.
44. Honda S, Yamasaki K, Sawada Y, Morii H. 10 residue folded peptide designed
by segment statistics, Struct Fold Des 2004;12:1507–1518.
45. Case, D., Pearlman, DA, Caldwell, JW, Cheatham III, TE, Ross, WS, Simmerling,
CL, Darden, TA, Merz, KM, Stanton, RV, Cheng, AL, Vincent, JJ, Crowley, M,
Tsui, V, Radmer, RJ, Duan, Y, Pitera, J, Massova, I, Seibel, GL, Singh, UC,
Weiner, PK, Kollman, PA. Amber 8. University of California, 2003, San
Francisco.
46. Jorgensen WL, Chandrasekhar J, Madura JD, Impey RW, Klein ML. Comparison
of simple potential functions for simulating liquid water. J Chem Phys
1983;79:926-935.
47. Duan, Y, Wu A, Chowdhury, CS, Lee, MC, Xiong, G, Zhang, W, Yang, R,.
Cieplak, P, Luo, R, Lee T, Caldwell J, Wang J, Kollman P. A point-charge force
field for molecular mechanics simulations of proteins based on condensed-phase
quantum mechanical calculations. J Comput Chem 2003;24:1999-2012.
48. Darden T, York D, Pedersen L. Particle mesh Ewald: An N·log(N) method for
Ewald sums in large systems. J Chem Phys 1993;98:10089-10092.
49. Miyamoto S, Kollman PA. Settle: An analytical version of the SHAKE and
RATTLE algorithm for rigid water models. J Comput Chem 1992;13:952-962.
50. Kumar SD, Bouzida R, Swendsen H, Kollman PA, Rosenberg JM. The weighted
histogram analysis method for free-energy calculations on biomolecules. I. The
method. J Comput Chem 1992;13:1011-1021.
51. Grossfield A. 2003. http://dasher.wustl.edu/alan

Development of BP-Rex MD method and its applications
76
52. Chou, PY. In prediction of protein structure and the principles of protein
conformation. 1989, ed. G.D. Fasman, Plenum Press, New York, pp. 549-586.
53. Shi Z, Olson CA, Rose GD, Baldwin RL, Kallenbach NR. Polyproline II structure
in a sequence of seven alanine residues. Proc Natl Acad Sci USA;2002;99:9190-
9195.
54. Feig M, Karanicolas J, and Brooks CL. MMTSB tool set: enhanced sampling and
multiscale modeling methods for applications in structural biology. J Mol Graph
Model 2004;22:377-395.
77
Chapter 4
Folding simulations of Trp-cage mini protein in explicit solvent using biasing potential replica-exchange molecular dynamics simulations Srinivasaraghavan Kannan and Martin Zacharias School of Engineering and Science, Jacobs University Bremen, Campus Ring 6, D-
28759 Bremen, Germany
As published in: Proteins, 2009. (In press).
4.1 Abstract Replica exchange molecular dynamics (Rex MD) simulations are frequently used for
studying structure formation and dynamics of peptides and proteins. A significant
drawback of standard temperature Rex MD is, however, the rapid increase of the replica
number with increasing system size to cover a desired temperature range. A recently
developed Hamiltonian Rex MD method has been used to study folding of the Trp-cage
protein. It employs a biasing potential that lowers the backbone dihedral barriers and
promotes peptide backbone transitions along the replica coordinate. In two independent
applications of the biasing potential Rex MD (BP-Rex MD) method including explicit
solvent and starting from a completely unfolded structure the formation of near-native
conformations was observed after 30-40 ns simulation time. The conformation
representing the most populated cluster at the final simulation stage had a backbone
Trp-cage mini protein folding studies using BP-Rex MD simulation
78
root mean square deviation of ~1.3 Å from the experimental structure. This was
achieved with a very modest number of 5 replicas making it well suited for peptide and
protein folding and refinement studies including explicit solvent. In contrast, during 5
independent continuous 70 ns MD simulations formation of collapsed states but no near
native structure formation was observed. The simulations predict a largely collapsed
state with a significant helical propensity for the helical domain of the Trp-cage protein
already in the unfolded state. Hydrogen bonded bridging water molecules were identified
that could play an active role by stabilizing the arrangement of the helical domain with
respect to the rest of the chain already in intermediate states of the protein.
4.2 Introduction Understanding the mechanism of protein and peptide structure formation is of long-
standing interest for structural biology. In principle molecular dynamics (MD) simulations
allow studying the protein folding process at atomic detail including the characterization
of folding pathways and intermediate states. However, peptides and proteins can adopt
numerous locally stable conformations that are separated by large energy barriers.
Transitions between these stable states are rare events even on the time scale of tens to
hundreds of nanoseconds that have become possible for peptide simulations [1-6].
Various methods like simulated annealing [7] potential scaling [8-15] , locally enhanced
sampling[16], parallel tempering [17-19], have been proposed to overcome the
conformational sampling problem during molecular simulations (reviewed in [5, 6]).
The parallel tempering or replica exchange molecular dynamics (Rex MD) method is one
of the most successful and most widely used methods to enhance conformational
sampling in molecular simulations [17-28]. In Rex MD simulations, several copies
(replicas) of the system are simulated independently and simultaneously using classical
MD or MC methods at different simulation temperatures (or force fields: Hamiltonians).
At preset intervals, pairs of replicas (neighboring pairs) are exchanged with a specified
transition probability. In most Rex MD simulations the temperature is used as a
parameter that varies among the replicas (T-Rex MD). The random walk in temperature
allows conformations trapped in locally stable states (at a low simulation temperature) to
escape by exchanging with replicas at higher simulation temperature. Efficient exchange
between neighboring replicas requires overlap of the potential energies sampled at
Trp-cage mini protein folding studies using BP-Rex MD simulation
79
neighboring simulation temperatures. As a consequence, the number of required
replicas grows approximately with the square root of the number of particles in the
system (to cover a desired temperature range) [29]. In addition, a larger number of
replicas in turn requires also increased simulation times in order to allow efficient
”diffusion” of replicas in temperature space.
Instead of using the simulation temperature as a replica coordinate, it is also possible to
use the force field or Hamiltonian of the system as a replica-coordinate [29-34].
Recently, we have proposed a Hamiltonian replica exchange method termed Biasing
Potential – Replica Exchange (BP-Rex MD) method that focuses on the protein
backbone transitions as a replica coordinate. The purpose of the biasing potential is to
reduce the energy barriers associated with peptide backbone dihedral transitions. The
level of biasing is gradually changed along the replicas such that frequent transitions are
possible at high levels of biasing and the system can escape from getting trapped in
local energy minima. Since exchanges between replicas are independent of the number
of solvent molecules, the method requires much fewer replicas for efficient sampling
compared with standard temperature Rex MD. The application of BP-Rex MD on small
peptides showed improved sampling of conformational space with fewer replicas (only 5-
7) as compared to standard temperature Rex MD simulations [35].
In order to evaluate the BP-Rex MD methodology on a protein molecule we have applied
it to the folding of the Trp-cage mini-protein in explicit solvent. Trp-cage, is a 20 residue
mini-protein designed by Neidigh et al [36] based on the C-terminal fragment of the 39-
residue exendin-4 peptide. The structure of this protein was determined by NMR
spectroscopy [36]. The Trp-cage protein contains different types of secondary structure
and a well structured hydrophobic core where the indole side chain of a Trp residue is
buried between the rings of two Pro residues. Its folding behavior has been investigated
by various experimental methods. Qui et al [37] suggested a two-state folding
mechanism based on laser temperature jump spectroscopy. Studies by Ahmed et al.
[38] using UV- resonance Raman spectroscopy measurements indicated a more
complicated folding mechanism through an intermediate molten globule state. The same
study provided evidence for α-helical structure even in the denatured state of the Trp-
cage protein. Recently, Mok et.al [39] found extensive hydrophobic contacts even in the
Trp-cage mini protein folding studies using BP-Rex MD simulation
80
unfolded state employing photochemically induced dynamic nuclear polarization
(CINDP)-NMR pulse-labeling experiments.
The folding of the Trp-cage protein has already been studied successfully using implicit
solvation models and either conventional MD simulations [40-43] or T-Rex MD [44].
However, it is not clear whether the accuracy of current implicit solvent models is
generally sufficient for a realistic description of the structure and dynamics of peptides
and proteins [23-25]. In addition, the Trp-cage protein has also been employed as a
model structure in explicit solvent folding simulations using several different force fields
and performing either multiple standard simulations or employing T-Rex MD simulations.
For example, Zhou [45] used T-Rex MD in explicit solvent employing 50 replicas for 5 ns
starting from the native Trp-cage structure. The simulations using the OPLS force field
indicated a melting temperature near 440 K. Juraszek et al. [46] used a transition path
sampling method for the study of the Trp-cage folding mechanism. However, the explicit
solvent T-Rex MD simulations using 64 replicas starting from an unfolded structure did
not reach the native state within 36ns simulation time (per replica). Similar, Beck et al.
[47] also performed explicit solvent Rex MD simulations using 71 replicas for 10ns per
replica starting form a non native structure without observing transitions to a completely
folded structure. In a more recent T-Rex MD simulation study, Paschak et al. [48, 49]
achieved folding of the Trp-cage protein starting from an extended chain using 40
replicas within 100ns simulation time per replica. However, the predicted melting
temperature of 440 K was again significantly higher than the experimental melting
temperature.
Overall, despite the use of considerable computational resources to perform the T-Rex
MD simulations on the Trp-cage protein in explicit solvent only a fraction of the
simulation studies resulted in successful folding starting from a completely unfolded
conformation.
4.3 Materials and Methods An initial extended structure for the Trp-cage protein was generated using the xleap
module of the Amber9 package [51]. The structure was allowed to relax by a short MD
simulation (vacuum) of 20 ps at 300 K and subsequent energy minimization using the

Trp-cage mini protein folding studies using BP-Rex MD simulation
81
sander module. Explicit TIP3P water molecules [52] were added (1773) to form a
truncated octahedral boxes using xleap. One Cl- ion was added to neutralize the system.
The parm03 force field [53] was used for all simulations. The simulation system was
subjected to energy minimization (1000 steps) using the sander module. During MD
simulation, the protein was initially harmonically restrained (25 kcal mol-1 Ǻ-2) to the
energy minimized start coordinates, and the system was heated up to 325 K in three
steps followed by gradual removal of the positional restraints and a 2ns unrestrained
equilibration at 325 K. The resulting system was used as starting structure for both BP-
Rex MD and all conventional MD simulations. During all MD simulations the long range
electrostatic interactions were treated with the particle mesh Ewald (PME) method [54]
using a real space cutoff distance of cutoff=9Ǻ. The Settle algorithm [55] was used to
constrain bond vibrations involving hydrogen atoms, which allowed a time step of 2 fs.
In standard temperature (T-) Rex MD, copies or replicas of the system are simulated at
different temperature (T0,T1,T2,….TN). Each replica evolves independently and after
preset time intervals exchanges of pairs of neighboring replica are attempted according
to a Metropolis criterion:
with β=1/RT (R: gas constant and T: temperature) and E(r) representing the potential
energy of system for a given configuration. It has been recognized that temperature
(represented as Boltzmann factor β) and energy (or Hamiltonian of the system) are
equivalent in the Metropolis criterion. The BP-Rex MD method is a Hamiltonian Rex MD
methods that employs a biasing potential for the Φ and Ψ peptide backbone dihedral
angles [35]. The biasing potential is based on a potential of mean force (PMF) for each
of the two dihedral angles calculated for a model peptide (alanine dipeptide) in explicit
solvent [35]. Addition of the biasing potential during a simulation lowers the energy
barriers for backbone dihedral transitions in a peptide or protein. In a BP-Rex MD
simulation different biasing potential levels are applied in each replica (one reference
replica runs without any biasing potential) and replica exchanges between neighboring
[ ])()()(
0)exp()(
;01)(
ijji
ji
ji
rErEwhere
forxxw
forxxw
−−=Δ
>ΔΔ−=→
≤Δ=→
ββ
Trp-cage mini protein folding studies using BP-Rex MD simulation
82
biasing levels were attempted every 1000 MD steps (2ps) and accepted or rejected
according to a Metropolis criterion [18].
Here, the Metropolis criterion involves only a single β or temperature (in the present
study 325K) and the energy difference between neighboring configurations using the
force field for replica j (Ej) minus the same difference using force field for replica i (Ei). An
advantage compared to temperature Rex MD is the fact the energy differences are only
affected by the force field term that changes upon going from one replica to another
replica run. For the present simulations we used 5 replicas and the same biasing
potential and biasing levels as given in Table I of reference [35]. The acceptance
probability for replica exchanges was in the range of 30-40%.
Two sets of BP-Rex MD simulations and five independent standard MD simulations at
325K were carried out (using different initial random velocities and starting from the
extended conformation). In addition, two control MD simulations starting from the folded
structure (first entry of pdb1L2Y) in explicit solvent were conducted at 325K. Cluster
analysis of sampled conformation was performed using the kclust program in the
MMTSB-tools [56] and structures were visualized using VMD [57].
4.4 Results and Discussion
4.4.1 Comparison of continuous and BP-Rex MD simulations Five continuous MD simulations were started from a Trp-cage protein structure
generated using the Amber leap module and assigning different initial velocities. In order
to enhance conformational transitions a simulation temperature of 325 K was chosen
which is slightly higher than the experimentally determined melting temperature of the
Trp-cage protein. However, even at this temperature a population of ~35% folded
( ) ( )[ ])()()()(
0)exp()(
;01)(
ij
jj
ii
ji
ji
ji
rErErErEwhere
forxxw
forxxw
−−−=Δ
>ΔΔ−=→
≤Δ=→
β
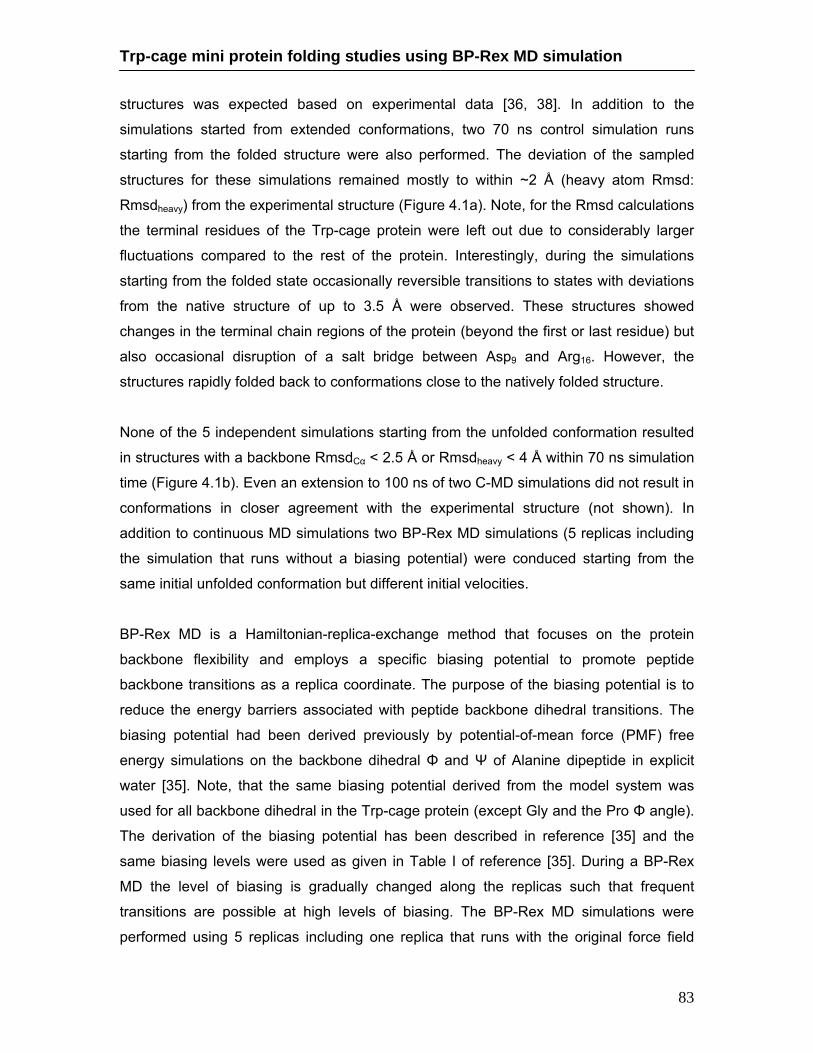
Trp-cage mini protein folding studies using BP-Rex MD simulation
83
structures was expected based on experimental data [36, 38]. In addition to the
simulations started from extended conformations, two 70 ns control simulation runs
starting from the folded structure were also performed. The deviation of the sampled
structures for these simulations remained mostly to within ~2 Å (heavy atom Rmsd:
Rmsdheavy) from the experimental structure (Figure 4.1a). Note, for the Rmsd calculations
the terminal residues of the Trp-cage protein were left out due to considerably larger
fluctuations compared to the rest of the protein. Interestingly, during the simulations
starting from the folded state occasionally reversible transitions to states with deviations
from the native structure of up to 3.5 Å were observed. These structures showed
changes in the terminal chain regions of the protein (beyond the first or last residue) but
also occasional disruption of a salt bridge between Asp9 and Arg16. However, the
structures rapidly folded back to conformations close to the natively folded structure.
None of the 5 independent simulations starting from the unfolded conformation resulted
in structures with a backbone RmsdCα < 2.5 Å or Rmsdheavy < 4 Å within 70 ns simulation
time (Figure 4.1b). Even an extension to 100 ns of two C-MD simulations did not result in
conformations in closer agreement with the experimental structure (not shown). In
addition to continuous MD simulations two BP-Rex MD simulations (5 replicas including
the simulation that runs without a biasing potential) were conduced starting from the
same initial unfolded conformation but different initial velocities.
BP-Rex MD is a Hamiltonian-replica-exchange method that focuses on the protein
backbone flexibility and employs a specific biasing potential to promote peptide
backbone transitions as a replica coordinate. The purpose of the biasing potential is to
reduce the energy barriers associated with peptide backbone dihedral transitions. The
biasing potential had been derived previously by potential-of-mean force (PMF) free
energy simulations on the backbone dihedral Φ and Ψ of Alanine dipeptide in explicit
water [35]. Note, that the same biasing potential derived from the model system was
used for all backbone dihedral in the Trp-cage protein (except Gly and the Pro Φ angle).
The derivation of the biasing potential has been described in reference [35] and the
same biasing levels were used as given in Table I of reference [35]. During a BP-Rex
MD the level of biasing is gradually changed along the replicas such that frequent
transitions are possible at high levels of biasing. The BP-Rex MD simulations were
performed using 5 replicas including one replica that runs with the original force field

Trp-cage mini protein folding studies using BP-Rex MD simulation
84
(see Methods). Exchanges were attempted at every 2ps between neighboring biasing
levels and extended to up to 70ns (35000 attempted exchanges) with an acceptance
rate of 30-40%.
Figure 4.1: Root-mean-square deviation (Rmsd of heavy-atoms) of sampled Trp-Cage
conformations in explicit solvent from the native structure (1st entry of pdb1L2Y) vs. simulation
time. (A) Continuous MD simulations starting from the experimental structure (red and black lines
correspond to 2 different sets of initial atomic velocities). (B) Heavy atom Rmsd of five
independent C-MD simulations starting from an extended Trp-cage structure with different initial
atomic velocities. (C) Heavy atom Rmsd of conformations sampled during the first BP-Rex MD
started from an extended conformation (for the replica run with the original force field). (D) same
as in C but for the second BP-Rex MD simulation. (E) Same as in C but following a starting
conformation including exchanges in the replicas that resulted in a folded structure.
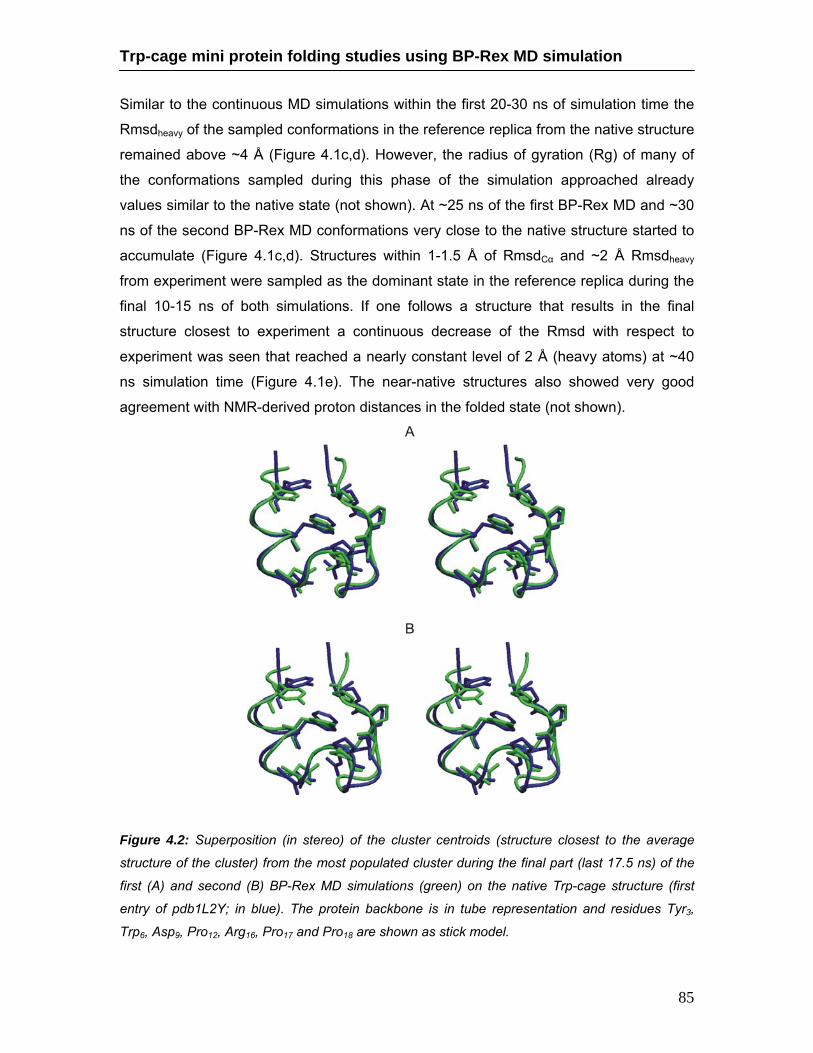
Trp-cage mini protein folding studies using BP-Rex MD simulation
85
Similar to the continuous MD simulations within the first 20-30 ns of simulation time the
Rmsdheavy of the sampled conformations in the reference replica from the native structure
remained above ~4 Å (Figure 4.1c,d). However, the radius of gyration (Rg) of many of
the conformations sampled during this phase of the simulation approached already
values similar to the native state (not shown). At ~25 ns of the first BP-Rex MD and ~30
ns of the second BP-Rex MD conformations very close to the native structure started to
accumulate (Figure 4.1c,d). Structures within 1-1.5 Å of RmsdCα and ~2 Å Rmsdheavy
from experiment were sampled as the dominant state in the reference replica during the
final 10-15 ns of both simulations. If one follows a structure that results in the final
structure closest to experiment a continuous decrease of the Rmsd with respect to
experiment was seen that reached a nearly constant level of 2 Å (heavy atoms) at ~40
ns simulation time (Figure 4.1e). The near-native structures also showed very good
agreement with NMR-derived proton distances in the folded state (not shown).
Figure 4.2: Superposition (in stereo) of the cluster centroids (structure closest to the average
structure of the cluster) from the most populated cluster during the final part (last 17.5 ns) of the
first (A) and second (B) BP-Rex MD simulations (green) on the native Trp-cage structure (first
entry of pdb1L2Y; in blue). The protein backbone is in tube representation and residues Tyr3,
Trp6, Asp9, Pro12, Arg16, Pro17 and Pro18 are shown as stick model.

Trp-cage mini protein folding studies using BP-Rex MD simulation
86
The centroid (conformer closest to the center of a cluster) representing the most
populated state of the final phase of the simulation had an RmsdCα of 1.2 and 1.3 Å,
respectively, from the experimental structure (Figure 4.2). However, structures with an
RmsdCα as close as 0.4 Å from the experimental structure were sampled during the final
phase of the BP-Rex MD simulations. The population of the cluster representing near
native Trp-cage structures reached 35% and 40% in the first and second BP-Rex MD
simulation. This result suggests a folding temperature slightly below the present
simulation temperature (325 K) in good qualitative agreement with experiment but
differing from a reported folding transition temperature of 440 K using the Amber parm94
force field and T-Rex MD [48]. The parm03 used in the present study corresponds to a
refined parm94 force field with for example a reduced bias for stabilizing helical
structures [53]. It should be emphasized that the good agreement with experiment of the
present simulations might be fortuitous and that longer BP-Rex MD simulations may
result in a further accumulation of folded structures and in turn shift the folding/unfolding
transition to higher temperatures. However, it has also been estimated that a Trp-cage
folding transition of 440 K corresponds to additional ~1.3 kcal mol-1 in favor of the folded
form at the present simulation temperature [49]. In the present study the predicted
folding free energy at the simulation temperature is close to zero (close to 50% folded
structures). A calculated ~1.3 kcal mol-1 contribution in favor of the folded form (parm94)
corresponds to just ~0.07 kcal mol-1 per Trp-cage residue and may well be due to
differences of the parm94 vs. parm03 force fields. The result also indicates that accurate
prediction of the folding/unfolding transition temperature from simulations might be
challenging because even small force field differences and associated small free energy
differences may result in considerable changes of the transition temperatures.
In addition to the sampling of collapsed structures with an Rg close to the native state,
part of the native secondary structure was also observed in the C-MD simulations and
already in early stages of the BP-Rex MD simulations starting from extended structures
(Figure 4.3). In particular the α-helix formed by residues 2-8 in the folded Trp-cage
protein was formed at least transiently in most of the C-MD simulations and in the BP-
Rex MD along the formation of a collapsed state but preceding the sampling of
structures close to the native tertiary Trp-cage structure.

Trp-cage mini protein folding studies using BP-Rex MD simulation
87
Figure 4.3: Secondary structure (calculated using a Gromacs tool [59]; blue: α-helix, yellow: β-
strand, grey: 310-helix) along the protein chain (y-axis) vs. simulation time for two independent C-
MD simulations (left panels) and both BP-Rex MD simulations (right panels, for the conformations
sampled in the reference replica).
Figure 4.4: Accumulation of α-helical (continuous lines) and 310 helical structure (dashed line)
during first (A), second (B), third (C) and fourth (D) quarter of all C-MD simulations (red) and in
the reference replica of the BP-Rex MD simulations (black).
Trp-cage mini protein folding studies using BP-Rex MD simulation
88
However, the formation of the 310-helix that connects the α-helix and the poly-pro motif in
the Trp-cage protein accumulated only during the BP-Rex MD (Figure 4.3 and Figure
4.4). Comparison of the average occurrence of helical structures along the chain during
different phases of the simulations showed clearly that during BP-Rex MD sampling of
conformations with near-native secondary structure occurred significantly earlier than in
the C-MD simulations. For example, already during the second quarter of the BP-Rex
MD (17-35 ns) the average α-helix content at residues 2-8 reached a level similar to the
final stage of the simulation (Figure 4.4). After about half the total simulation length a
significant level of 310-helix was also sampled in the BP-Rex MD but not in the C-MD
simulations.
To further compare the sampling efficiency a cluster analysis of structures sampled in
the BP-Rex MD reference replica and during the C-MD simulations was performed. The
conformational cluster analysis was based on the pair-wise Cartesian (Cα) Rmsd
between conformations with an Rmsd cutoff of 2 Å and using the kclust program in the
MMTSB-tools [56]. Both BP-Rex MD simulations accumulated significantly more (factor
2-3) distinct conformational states during the simulation time than the combined 5
independent C-MD simulations together (Figure 4.5b). This result demonstrates that the
5-replica BP-Rex MD method not only samples more low energy structures much closer
to experiment but also a much broader range of distinct conformational states compared
to 5 independent C-MD simulations. This result is in line with previous studies on peptide
systems [35]. It is interesting to compare some of the dominant conformations sampled
during different phases of the BP-Rex MD simulations (Figure 4.5a). Even during the first
quarter of the simulations some of the dominant conformational cluster centroids
represent relatively compact states. During the second and third quarter of the
simulations all three most populated clusters represent compact conformations and in
the two most populated conformational clusters the N-terminal α-helix has formed
correctly but the rest of the backbone structure varies considerably between cluster
centroids (Figure 4.5a). During the final part of the simulations all three most populated
clusters represent conformations with a near native N-terminal α-helix but only the
cluster that is closest to the native structure contains the 310-helix and the correctly
folded core of the Trp-cage protein (Figure 4.5a).

Trp-cage mini protein folding studies using BP-Rex MD simulation
89
Figure 4.5: (A) Cluster centroids (structure closest to the average structure of the cluster in
cartoon representation) of the three most populated clusters from three simulation phases of the
first BP-Rex MD simulation (in the reference replica). (B) Accumulation of conformational clusters
during continuous MD simulations and BP-Rex MD simulations. Cluster analysis was performed
on recorded structures up to the simulation time given on the x-axis using the program kclust of
the MMTSB tools [56] and a 2 Å RmsdCα exclusion cutoff for the distance of conformations
relative to each cluster center. In case of the BP-Rex MD simulation all structures recorded for
the reference replica were considered. For the C-MD case every fifth structure of the combined
ensemble of all five C-MD simulations was included. Since the number of recorded structures
increases linearly with time all clusters with more then 50 members were included for the first
time interval (0-17.5 ns) and 100, 150 and 200 members for the second, third and complete time
intervals, respectively.
In order to understand why the BP-Rex MD methodology achieves a more rapid
sampling of near-native Trp-cage structures it is interesting to compare the backbone
dihedral sampling during C-MD and BP-Rex MD simulations. One key residue for
Trp-cage mini protein folding studies using BP-Rex MD simulation
90
controlling the tertiary arrangement of secondary structure elements in the Trp-cage
protein is Asp9 at the end of the α-helix. Effective sampling of various conformational
states at this residue influences the sampling of the relative arrangement of the α-helix
and the 310 helix and the poly-Pro-motif that follows the 310-segment.
Figure 4.6: Comparison of backbone dihedral angle sampling at the Asp9 residue during C-MD
simulations (A), reference replica of the first BP-Rex MD simulation and of a trajectory that
resulted in a folded conformation (C, including exchanges between different biasing levels, see
also Figure 4.1E). Each dot in the Ramachandran plots corresponds to a Φ-Ψ-pair recorded
every 10 ps (same total number of dots for each case).
If one compares the Φ/Ψ Ramachandran plot of Asp9 for the C-MD simulations and the
reference replica of the BP-Rex MD simulations overall quite similar sampling of possible
backbone dihedral states was observed (Figure 4.6a, b). However, if one looks at the
sampling of a trajectory that resulted in the structure in closest agreement with
experiment (following the exchanges of this conformer among the replicas along the
complete simulation) the sampled dihedral states differed from the sampling in a C-MD
simulation. This due to the fact that this trajectory includes not only sampling in the
replica that was controlled by the original force field but also exchanged to replica runs
that included a biasing potential. The biasing potential allowed sampling of states
infrequently visited in the reference replica. It included for example Φ/Ψ regions that
correspond to turn conformations (Figure 4.6c) but also includes more frequent sampling
of transition regions in between parts of the Ramachandran plot specific for extended
structures and α-helical states. This broader sampling of backbone states in the replicas
including a biasing potential allowed more backbone transitions compared to the C-MD
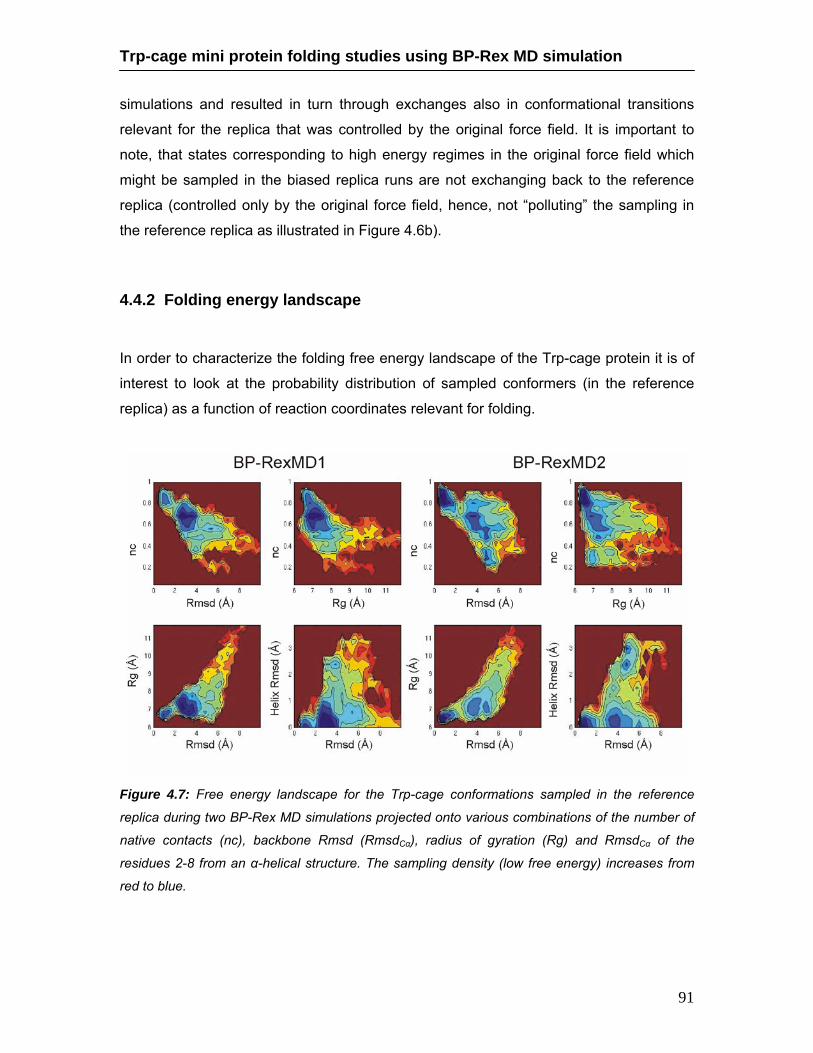
Trp-cage mini protein folding studies using BP-Rex MD simulation
91
simulations and resulted in turn through exchanges also in conformational transitions
relevant for the replica that was controlled by the original force field. It is important to
note, that states corresponding to high energy regimes in the original force field which
might be sampled in the biased replica runs are not exchanging back to the reference
replica (controlled only by the original force field, hence, not “polluting” the sampling in
the reference replica as illustrated in Figure 4.6b).
4.4.2 Folding energy landscape
In order to characterize the folding free energy landscape of the Trp-cage protein it is of
interest to look at the probability distribution of sampled conformers (in the reference
replica) as a function of reaction coordinates relevant for folding.
Figure 4.7: Free energy landscape for the Trp-cage conformations sampled in the reference
replica during two BP-Rex MD simulations projected onto various combinations of the number of
native contacts (nc), backbone Rmsd (RmsdCα), radius of gyration (Rg) and RmsdCα of the
residues 2-8 from an α-helical structure. The sampling density (low free energy) increases from
red to blue.

Trp-cage mini protein folding studies using BP-Rex MD simulation
92
Figure 4.7 shows 2-dimensional free energy contour maps (logarithm of the probability
distributions in units of RT) using the sampled fraction of native contacts (nc), total
RmsdCα, RmsdCα of the α-helix and Rg as folding coordinates. Native contacts are
defined as Cα-Cα atom pairs of non-neighboring amino acids within 6.5 Å. The free
energy maps for both independent BP-Rex MD simulations look qualitatively very
similar. As expected there is a clear correlation between total RmsdCα and fraction of
native contacts (Figure 4.7 top left corner). Interestingly, both simulations indicate a
fraction of sampled conformers with approximately 80 % native contacts but an RmsdCα
of 3-4 Å from experiment separated from the sampled near native structures (with almost
100 % native contacts and an RmsdCα around 1 Å. There is also free energy barrier
between the region close to the native states and unfolded structures with RmsdCα > 2 Å
or fraction nc < 60%. The barrier is also observed in the other maps (e.g. nc vs. Rg or
Rg vs. RmsdCα) but overall slightly less pronounced for the second BP-Rex MD
simulation. Interestingly, most of the sampled non-native structures have an Rg = 7-10 Å
only slightly larger than the native structure (Rg = 7 Å). This agrees well with recent
experiments by Mok et al. [39] which indicate a mostly collapsed unfolded state with
average hydrodynamic radius of 8 Å (only slightly higher than the hydrodynamic radius
of the native state ~7 Å [39]). However, the observation of mostly collapsed states during
the simulations may also be influenced by the limited size of the simulation box that may
promote or tend to stabilize compact conformations (low Rg) during simulations. The
map for the RmsdCα of the α-helix vs. total RmsdCα clearly shows that structures were
sampled with almost perfectly formed α-helix, low Rg but without formation of the
complete native tertiary structure (total RmsdCα < 2 Å). However, conformations without
the α-helix but a total RmsdCα not too far from the folded state were also populated in
both simulations (Figure 4.7 bottom right corner).
4.4.3 Packing of Trp-side chain and Asp-Arg salt bridge formation In the native NMR Trp-Cage structure the Trp6 residue is completely buried inside the
cage formed by the Tyr and Pro residues. Correct packing of this structurally important
Trp side chain is one of the main rate limiting step in the folding process [43]. Figure 4.8
illustrates the sampling of Trp6 backbone and side chain dihedral angles during the first
17.5 ns of the C-MD and BP-Rex MD simulations. Already during this first quarter of the
simulations both BP-Rex MD simulations show very similar sampling of backbone
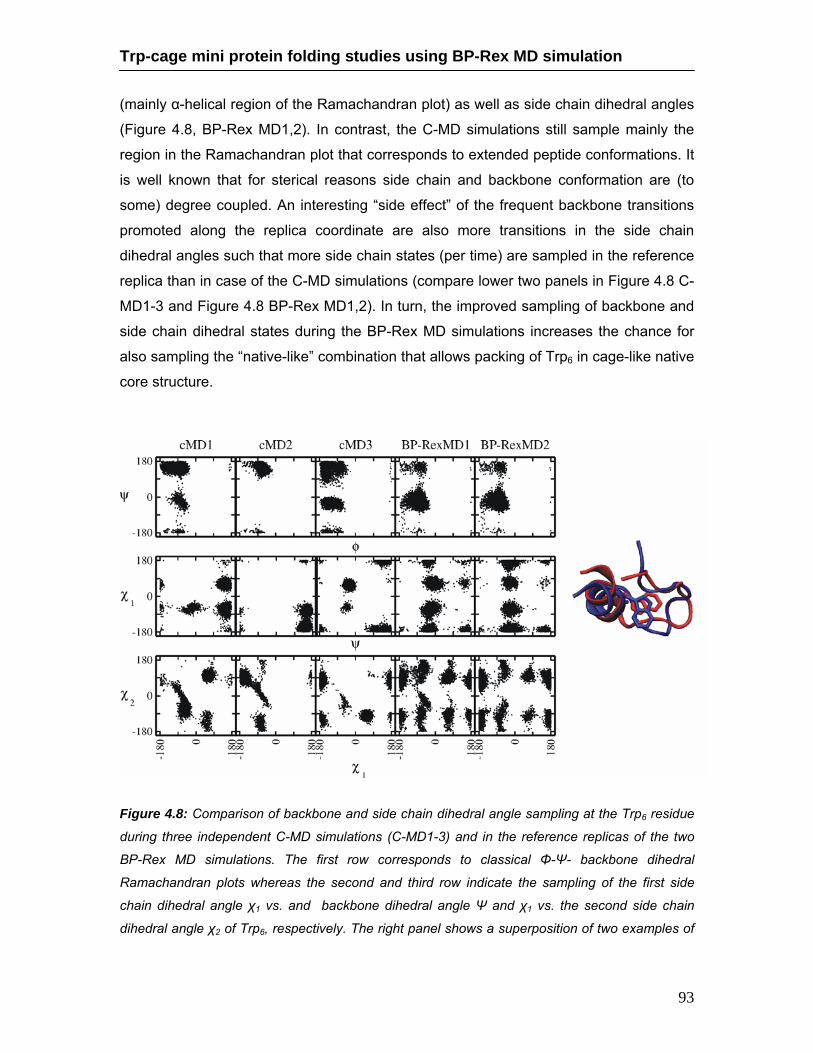
Trp-cage mini protein folding studies using BP-Rex MD simulation
93
(mainly α-helical region of the Ramachandran plot) as well as side chain dihedral angles
(Figure 4.8, BP-Rex MD1,2). In contrast, the C-MD simulations still sample mainly the
region in the Ramachandran plot that corresponds to extended peptide conformations. It
is well known that for sterical reasons side chain and backbone conformation are (to
some) degree coupled. An interesting “side effect” of the frequent backbone transitions
promoted along the replica coordinate are also more transitions in the side chain
dihedral angles such that more side chain states (per time) are sampled in the reference
replica than in case of the C-MD simulations (compare lower two panels in Figure 4.8 C-
MD1-3 and Figure 4.8 BP-Rex MD1,2). In turn, the improved sampling of backbone and
side chain dihedral states during the BP-Rex MD simulations increases the chance for
also sampling the “native-like” combination that allows packing of Trp6 in cage-like native
core structure.
Figure 4.8: Comparison of backbone and side chain dihedral angle sampling at the Trp6 residue
during three independent C-MD simulations (C-MD1-3) and in the reference replicas of the two
BP-Rex MD simulations. The first row corresponds to classical Φ-Ψ- backbone dihedral
Ramachandran plots whereas the second and third row indicate the sampling of the first side
chain dihedral angle χ1 vs. and backbone dihedral angle Ψ and χ1 vs. the second side chain
dihedral angle χ2 of Trp6, respectively. The right panel shows a superposition of two examples of
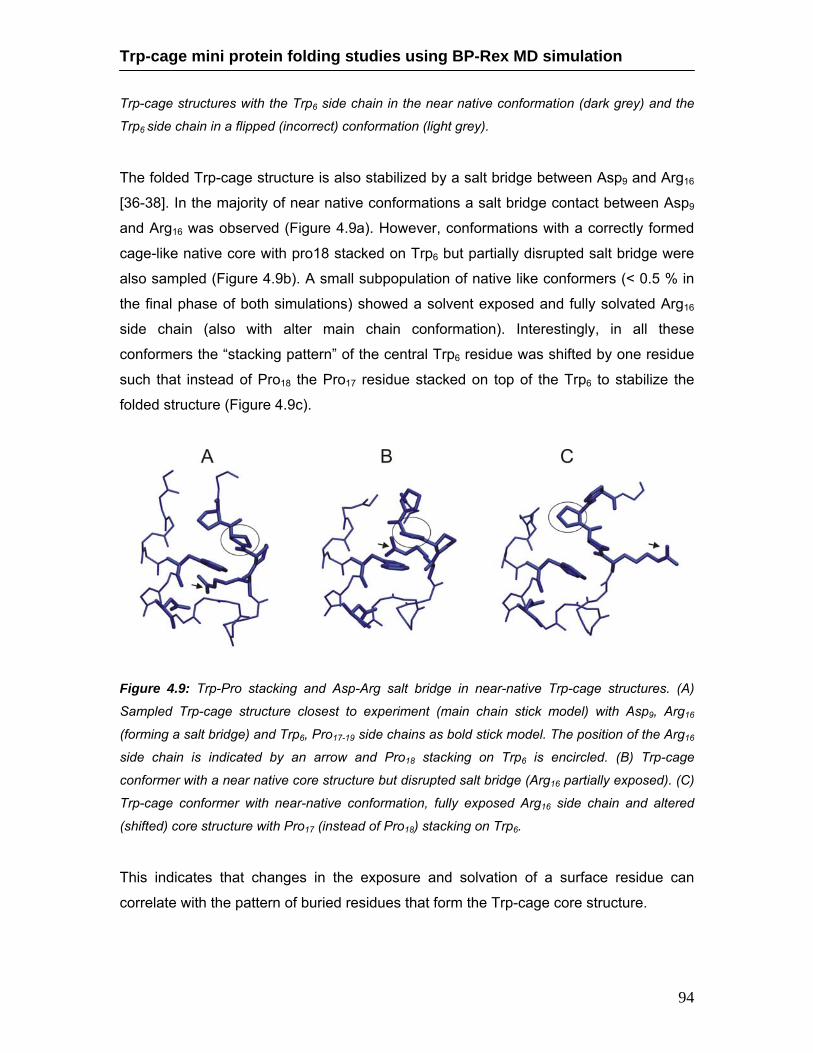
Trp-cage mini protein folding studies using BP-Rex MD simulation
94
Trp-cage structures with the Trp6 side chain in the near native conformation (dark grey) and the
Trp6 side chain in a flipped (incorrect) conformation (light grey).
The folded Trp-cage structure is also stabilized by a salt bridge between Asp9 and Arg16
[36-38]. In the majority of near native conformations a salt bridge contact between Asp9
and Arg16 was observed (Figure 4.9a). However, conformations with a correctly formed
cage-like native core with pro18 stacked on Trp6 but partially disrupted salt bridge were
also sampled (Figure 4.9b). A small subpopulation of native like conformers (< 0.5 % in
the final phase of both simulations) showed a solvent exposed and fully solvated Arg16
side chain (also with alter main chain conformation). Interestingly, in all these
conformers the “stacking pattern” of the central Trp6 residue was shifted by one residue
such that instead of Pro18 the Pro17 residue stacked on top of the Trp6 to stabilize the
folded structure (Figure 4.9c).
Figure 4.9: Trp-Pro stacking and Asp-Arg salt bridge in near-native Trp-cage structures. (A)
Sampled Trp-cage structure closest to experiment (main chain stick model) with Asp9, Arg16
(forming a salt bridge) and Trp6, Pro17-19 side chains as bold stick model. The position of the Arg16
side chain is indicated by an arrow and Pro18 stacking on Trp6 is encircled. (B) Trp-cage
conformer with a near native core structure but disrupted salt bridge (Arg16 partially exposed). (C)
Trp-cage conformer with near-native conformation, fully exposed Arg16 side chain and altered
(shifted) core structure with Pro17 (instead of Pro18) stacking on Trp6.
This indicates that changes in the exposure and solvation of a surface residue can
correlate with the pattern of buried residues that form the Trp-cage core structure.

Trp-cage mini protein folding studies using BP-Rex MD simulation
95
4.4.4 Role of water molecules Hydrophobic core formation is one of the main contributions for the stability of the Trp-
cage structure [43]. Core formation is considered to be the limiting factor in the folding
process, as it requires the correct orientation of the Trp6-side chain and also expulsion of
water molecules from the core. To further understand the role of water molecules during
the structure formation process the number of water molecules that are within 3.5Å of
every amino acid at four stages of the simulation have been analyzed. Interestingly, only
a small fraction of residues showed a significant reduction of the number of contacting
water molecules during the structure formation process.
Figure 4.10: Average number of water molecules within 3.5 Å of any atom of a given Trp-cage
amino acid residue during the two different BP-Rex MD simulation time frames (for the reference
replica with the original force field).
As expected for Trp6 a significant reduction of the number of close water molecules from
~10 at an early stage of the simulation to ~5 at the final simulation phase was observed
(Figure 4.10). Additional residues with significant reduction of water contacts are Gly11
and Pro18, whereas other residues become only partially buried during folding and still
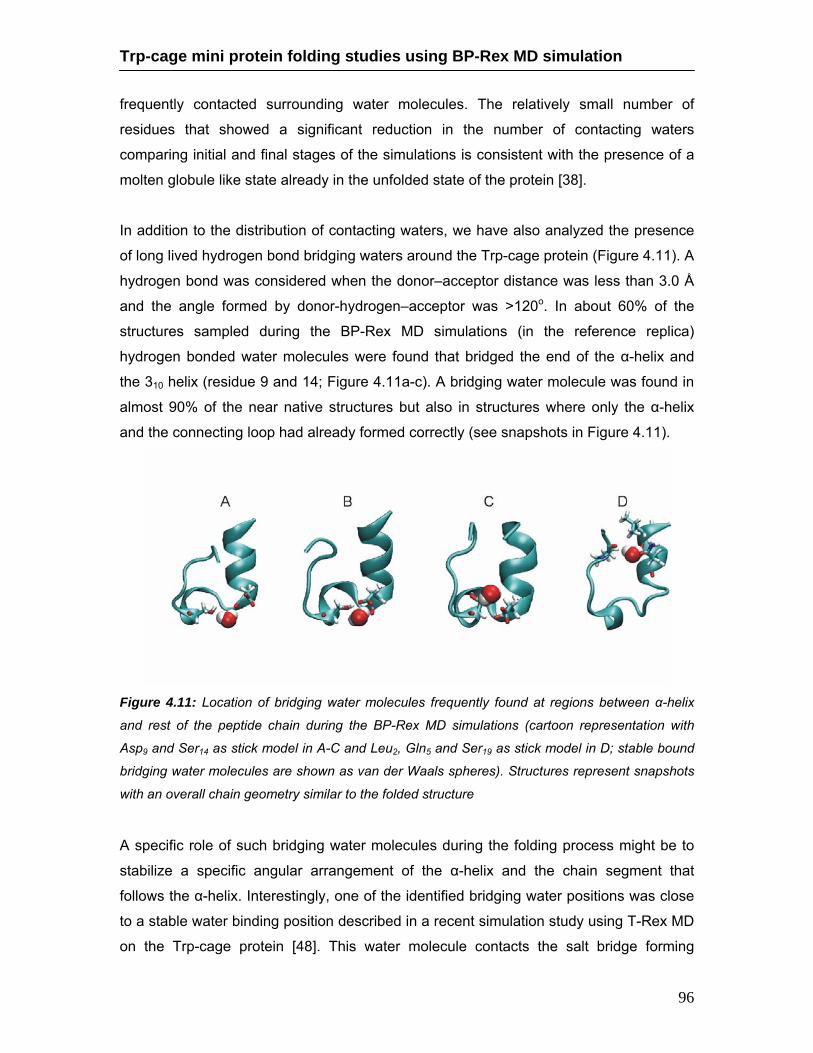
Trp-cage mini protein folding studies using BP-Rex MD simulation
96
frequently contacted surrounding water molecules. The relatively small number of
residues that showed a significant reduction in the number of contacting waters
comparing initial and final stages of the simulations is consistent with the presence of a
molten globule like state already in the unfolded state of the protein [38].
In addition to the distribution of contacting waters, we have also analyzed the presence
of long lived hydrogen bond bridging waters around the Trp-cage protein (Figure 4.11). A
hydrogen bond was considered when the donor–acceptor distance was less than 3.0 Å
and the angle formed by donor-hydrogen–acceptor was >120o. In about 60% of the
structures sampled during the BP-Rex MD simulations (in the reference replica)
hydrogen bonded water molecules were found that bridged the end of the α-helix and
the 310 helix (residue 9 and 14; Figure 4.11a-c). A bridging water molecule was found in
almost 90% of the near native structures but also in structures where only the α-helix
and the connecting loop had already formed correctly (see snapshots in Figure 4.11).
Figure 4.11: Location of bridging water molecules frequently found at regions between α-helix
and rest of the peptide chain during the BP-Rex MD simulations (cartoon representation with
Asp9 and Ser14 as stick model in A-C and Leu2, Gln5 and Ser19 as stick model in D; stable bound
bridging water molecules are shown as van der Waals spheres). Structures represent snapshots
with an overall chain geometry similar to the folded structure
A specific role of such bridging water molecules during the folding process might be to
stabilize a specific angular arrangement of the α-helix and the chain segment that
follows the α-helix. Interestingly, one of the identified bridging water positions was close
to a stable water binding position described in a recent simulation study using T-Rex MD
on the Trp-cage protein [48]. This water molecule contacts the salt bridge forming
Trp-cage mini protein folding studies using BP-Rex MD simulation
97
residues Asp9 and Arg16 as well as the Ser12 side chain (Figure 4.11c). Another half-
buried water molecule was found that contacted Leu2, Gln5 and Ser19 (bridging the N-
terminal α-helix and the C-terminus, Figure 4.11d) which has also been described in
reference [48]. However, this water binding position was occupied in only around 40% of
the folded Trp-cage structures. Another frequently observed water molecule was
identified that connected the Trp6 side chain and the 310 helical structure (not shown).
4.5 Conclusions
Limited conformational sampling of peptide and protein conformations on currently
accessible time scales is still a major bottleneck of MD simulations. The standard T-Rex
MD method is one of the most widely used methods to enhance the conformational
sampling but it is limited to peptides or small proteins. It is due to the rapid increase in
the number of required replicas and increasing simulation time (to allow for sufficient
exchanges among all replicas) with increasing system size. This is a particular problem
in case of simulations that involve explicit solvent molecules. Recently, we have
proposed a new Hamiltonian replica exchange method (BP-Rex MD) and demonstrated
enhanced conformational sampling of peptide conformations during BP-Rex MD
simulations [35]. The BP-Rex MD method employs a specific biasing potential to
promote peptide backbone transitions as a replica coordinate. In order to evaluate the
method on a protein-like system it was applied in the current work to investigate the
folding of the Trp-cage protein during two independent simulations in explicit solvent.
The BP-Rex MD simulations were performed with only 5 replicas (original potential and 4
levels of biasing). In both simulations conformations very close to the native state
(RmsdCα of the cluster centroid that represents the average structure of the most
dominant conformational cluster sampled during the final part of the BP-Rex MD in the
reference replica was < 1.5 Å with respect to the native structure) were sampled after
35-40 ns. In contrast, in none of the five independent conventional MD simulations
folding to near native structures was observed during 70 ns. Furthermore, the number of
distinct conformational clusters in both BP-Rex MD simulations was significantly higher
than in the combined ensemble of all 5 C-MD trajectories.
Trp-cage mini protein folding studies using BP-Rex MD simulation
98
Previous explicit solvent T-Rex MD simulation studies required much larger
computational resources [48] and frequently failed to sample near-native structures
when starting from an extended chain [46, 47]. It should be emphasized, however, that
this may not be due to the use of the T-Rex MD simulation method but due to the use of
a different force field. The use of a different force field [e.g. OPLS, 58] compared to the
present Amber parm03 may create a more frustrated free energy landscape or may
favor Trp-cage structures that significantly differ from the experimental structure.
Recently, Piana & Laio used bias-change meta-dynamics to simulate structure formation
of the Trp-cage protein [50] using time-dependent biasing potentials in 5 collective
variables as replica coordinates. This H-Rex MD simulations required only 8 replicas to
sampled folded Trp-cage conformations within 40 ns simulation time and starting from
an extended chain conformation (however, generated by starting from the native Trp-
cage structure). The biasing potential employed in the study by Piana & Laio employed
several terms to bias hydrogen bond formation and other interactions in the system.
Similar to the present H-Rex MD method it showed very promising results, however, a
drawback could be the time dependence of the applied biasing potentials that depending
on the degree of biasing variation over time may not allow an equilibrium sampling and
exchange between replicas.
Our simulation results on the mechanism of Trp-cage folding are in good qualitative
agreement with available experimental results and with previous simulation studies.
During the simulations an initial collapse at an early stage of the simulation was
observed (during C-MD as well as BP-Rex MD simulations). The analysis of the
distribution of sampled conformers with respect to various possible folding coordinates
revealed a conformational barrier (a region with reduced sampling) that separated the
initially collapsed states from the fully folded native structure. Experimental studies using
CINDP-NMR spectroscopy suggested unfolded Trp-cage structures with hydrodynamic
radius of ~8 Å similar to the range of Rg (7-10 Å) we found for the fraction of unfolded
conformations (see Figure 4.7). Experimental studies employing UV-resonance Raman
spectroscopy suggested the presence of α-helical structure even in the unfolded Trp-
cage structures which agrees with the present simulation results of a significant fraction
of helical segments even in the absence of a fully folded native structure. In contrast to
earlier T-Rex MD simulations, the partial formation of the 310 helix characteristic for the

Trp-cage mini protein folding studies using BP-Rex MD simulation
99
fully folded native Trp-cage structure [45, 48] was observed in the present BP-Rex MD
simulations in the finally sampled near-native structures.
The process of packing the Trp6 side chain in its correct orientation and correct
hydrophobic core formation is correlated with the water expulsion from the protein
surface. It is key event for the formation of the folded structure. Interestingly, the
enhanced sampling of peptide backbone transitions during the BP-Rex MD simulation
also resulted in better sampling of the possible side chain conformations of Trp6
especially in the early phase of the simulations such that the formation of the near-native
Trp-Cage structure was possible after ~40 ns simulation time in the BP-Rex MD
simulations.
During the simulations several strongly bound water molecules especially near the end
of the α-helix served to stabilize the geometry of the chain following the α-helix. These
water molecules could play an active role during the folding process such that they
stabilize a protein backbone arrangement overall similar to the native fold (angular
orientations of the chain segment following the α-helix similar to native arrangement). An
advantage of BP-Rex MD compared to temperature Rex MD is the fact the energy
differences are only affected by the force field term that changes upon going from one
replica to another replica run. Hence, the exchange probability is only affected by the
backbone dihedral angle terms and not affected by solvent-solvent and solute-solvent
(and many other solute-solute) contributions. The number of required replicas should
only grow with the number of dihedral angles involved in application of the biasing
potential. The study demonstrated that the BP-Rex MD method allows for an efficient
sampling of Trp-Cage conformations in explicit solvent with considerably fewer replicas
compared to T-Rex MD simulations and sampling of significantly more relevant states in
the reference run than the combined sampling of 5 independent C-MD simulations of the
same length.
Another advantage of the BP-Rex MD method is that in can be easily focused to parts of
a protein (e.g. a loop region) keeping the “unbiased” (original) backbone dihedral angle
potential for the rest of the protein in all replicas. This opens the possibility to specifically
enhance the sampling of only parts of a protein under realistic simulation conditions and
using only few replicas (e.g. for the refinement of loop regions with low target-template
similarity during comparative protein modeling).
Trp-cage mini protein folding studies using BP-Rex MD simulation
100
Acknowledgements: This work was performed using the computational resources of
the CLAMV (Computer Laboratories for Animation, Modeling and Visualization) at
Jacobs University Bremen and supercomputer resources of the EMSL (Environmental
Molecular Science Laboratories) at the PNNL (Pacific Northwest National Laboratories).
S.K. is supported by a grant (I/80485) from the VolkswagenStiftung to M.Z.
4.6 References
1. Daura X, Jaun B, Seebach D, van Gunsteren WF, Mark AE. Reversible peptide
folding in solution by molecular dynamics simulation. J Mol Biol 1998;280:925-
932.
2. Duan Y, Kollman PA. Pathways to a protein folding intermediate observed in a 1-
microsecond simulation in aqueous solution. Science 1998;282:740–744.
3. Roccatano D, Nau WM, Zacharias M. Structural and dynamic properties of the
CAGQW peptide in water: A molecular dynamics simulation study using different
force fields. J Phys Chem 2004;108:18734-18742
4. Seibert MM, Patriksson A, Hess B, van der Spoel D. Reproducible Polypeptide
Folding and Structure Prediction using Molecular Dynamics Simulations. J Mol
Biol 2005;354:173–183
5. Gnanakaran S, Nymeyer H, Portman J, Sanbonmatsu KY, Garcia AE. Peptide
folding simulations. Curr Opin Struct Biol 2003;15:168-174.
6. Kaihsu T. Conformational sampling for the impatient. Biophys Chem
2004;107:213-220.
7. Brunger AT, Adams PD, Rice LM. New applications of simulated annealing in X-
ray crystallography and solution NMR. Structure 1997;5:325-336.
8. Kostrowicki J, Scheraga HA. Application of the diffusion equation method for
global optimization to oligopeptides. J Chem Phys 1992;96:7442-7449.
9. Straatsma TP, McCammon JA. Treatment of rotational isomers III. The use of
biasing potentials, J Chem Phys 1994.;101:5032-5039.
10. Huber T, Torda AE, van Gunsteren WF. Structure optimization combining soft-
core interaction functions, the diffusion equation method and molecular
dynamics. J Phys Chem A 1997;10:5926-5930.
Trp-cage mini protein folding studies using BP-Rex MD simulation
101
11. Tappura K, Lahtela-Kakkonen M, Teleman O. A new soft-core potential function
for molecular dynamics applied to the prediction of protein loop conformations. J
Comput Chem 2000;21:388-397.
12. Tappura K. Influence of rotational energy barriers to the conformational search of
protein loops in molecular dynamics and ranking the conformations. Proteins
Struct Funct Genet 2001;44:167-179.
13. Riemann RN, Zacharias M. Reversible scaling of dihedral angle barriers during
molecular dynamics to improve structure prediction of cyclic peptides. J Pept Res
2004;63:354-364.
14. Riemann RN, Zacharias M. Refinement of protein cores and protein-peptide
interfaces using a potential scaling approach. Prot Eng Des Select 2005;18:465-
476.
15. Hornak V, Simmerling C. Generation of accurate protein loop conformations
through low-barrier molecular dynamics. Proteins Struct Funct Bioinf
2003;51:577-590.
16. Simmerling C, Miller JL, Kollman PA. Combined Locally Enhanced Sampling and
Particle Mesh Ewald as a Strategy To Locate the Experimental Structure of a
Nonhelical Nucleic Acid. J Am Chem Soc 1998;120:7149-7158.
17. Swendsen RH, Wang JS. Replica Monte Carlo simulations of spin glasses. Phys
Rev Lett 1986;57:2607-2609.
18. Okamoto Y. Generalized-ensemble algorithms: enhanced sampling techniques
for Monte Carlo and molecular dynamics simulations. J Mol Graph Model
2004;22:425-439.
19. Predescu C, Predescu M, Ciobanu CVJ. On the Efficiency of Exchange in
Parallel Tempering Monte Carlo Simulations. J Phys Chem B 2005;109:4189-
4196.
20. Sugita Y, Okamoto Y. Replica-exchange molecular dynamics method for protein
folding. Chem Phys Lett 1999;314:141-151.
21. Mitsutake A, Sugita Y, Okamoto Y. Generalized-ensemble algorithms for
molecular simulations of biopolymers. Biopolymers 2001;60:96-123.
22. Sanbonmatsu KY, Garcia AE. Structure of Met-enkephalin in explicit aqueous
solution using replica exchange molecular dynamics. Proteins Struct Funct Bioinf
2002;46:225.
Trp-cage mini protein folding studies using BP-Rex MD simulation
102
23. Zhou R, Berne BJ. Can a continuum solvent model reproduce the free energy
landscape of a -hairpin folding in water?. Proc Natl Acad Sci USA
2002;99:12777-12782.
24. Zhou R. Free energy landscape of protein folding in water: explicit vs. implicit
solvent. Proteins Struct Funct Bioinf 2003;53:148-161.
25. Nymeyer H, Garcia AE. Simulation of the folding equilibrium of -helical
peptides: a comparison of the generalized Born approximation with explicit
solvent. Proc Natl Acad Sci USA 2003;100:13934-13939.
26. Yoshida K, Yamaguchi T, Okamoto Y. Replica-exchange molecular dynamics
simulation of small peptide in water and in ethanol. Chem Phys Lett
2005;41:2280-284
27. Rao F, Caflisch A. Replica exchange molecular dynamics simulations of
reversible folding. J Chem Phys 2003;119:4035-4042.
28. Nguyen P, Stock G, Mittag E, Hu C-K, Li MS. Free energy landscape and folding
mechanism of a β-hairpin in explicit water: A replica exchange molecular
dynamics study. Proteins 2006;61:795-808.
29. Rathore N, Chopra M, de Pablo JJ. Optimal allocation of replicas in parallel
tempering simulations. J Chem Phys 2005;122:24111-24118.
30. Cheng X, Cui G, Hornak V, Simmerling C. Modified Replica Exchange Simulation
Methods for Local Structure Refinement. J Phys Chem B 2005;109:8220-8230.
31. Jang S, Shin S, Pak Y. Replica-exchange method using the generalized effective
potential. Phys Rev Lett 2003;91:58305-58309.
32. Zhu Z, Tuckerman ME, Samuelson SO, Martyna GJ. Using Novel Variable
Transformations to Enhance Conformational Sampling in Molecular Dynamics.
Phys Rev Lett 2002;88:100201-100205.
33. Liu P, Kim B, Friesner RA, Berne BA. Replica exchange with solute tempering: A
method for sampling biological systems in explicit water. Proc Natl Acad Sci
2005;102:13749-13754.
34. Affentranger R, Tavernelli I, Di Iorio EE. A Novel Hamiltonian Replica Exchange
MD Protocol to Enhance Protein Conformational Space Sampling. J Chem
Theory Comput. 2006;2:217-228.
35. Kannan S, Zacharias M. Enhanced sampling of peptide and protein
conformations using replica exchange simulations with a peptide backbone
biasing-potential. Proteins 2007;66:697-706.
Trp-cage mini protein folding studies using BP-Rex MD simulation
103
36. Neidigh JW, Fesinmeyer MR, Andersen HN. Designing a 20-residue protein.
Nat Struct Biol 2002;9:425-430.
37. Qiu L, Pabit SA, Roitberg AE, Hagen SJ. Smaller and faster: the 20-residue
Trp-cage protein folds in 4 micros. J Am Chem Soc 2002;124:12952-12953.
38. Ahmed Z, Beta IA, Mikhonin AV, Asher SA. UV-resonance Raman thermal
unfolding study of Trp-cage shows that it is not a simple two-state miniprotein. J
Am Chem Soc 2005;127:10943-10950.
39. Mok KH, Kuhn LT, Goez M, Day IJ, Lin JC, Andersen NH, Hore PJ. A pre-
existing hydrophobic collapse in the unfolded state of an ultrafast folding protein.
Nature 2007;447:106-109.
40. Simmerling C, Strockbine B, Roitberg AE. All-atom structure prediction and
folding simulations of a stable protein. J Am Chem Soc 2002;124:11258-11259.
41. Snow CD, Zagrovic B, Pande VS. The Trp cage: folding kinetics and unfolded
state topology via molecular dynamics simulations. J Am Chem Soc 2002;124:
14548-14549.
42. Chowdhury S, Lee MC, Xiong G, Duan Y. Ab initio folding simulation of the Trp-
cage mini-protein approaches NMR resolution. J Mol Biol 2003;327:711-717.
43. Chowdhury S, Lee MC, and Duan Y. Characterizing the Rate-Limiting Step of
Trp-Cage Folding by All-Atom Molecular Dynamics Simulations. J Phys Chem B,
2004;108:13855 -13865.
44. Pitera JW, Swope W. Understanding folding and design: replica-exchange
simulations of "Trp-cage" miniproteins. Proc Natl Acad Sci U S A 2003;100:
7587-7592.
45. Zhou R. Trp-cage: folding free energy landscape in explicit water. Proc Natl Acad
Sci U S A 2003;100:13280-13285.
46. Juraszek J, Bolhuis PG. Sampling the multiple folding mechanisms of Trp-cage
in explicit solvent. Proc Natl Acad Sci U S A 2006;103:15859-15864.
47. Beck DA, White GW, Daggett V. Exploring the energy landscape of protein
folding using replica-exchange and conventional molecular dynamics
simulations. J Struct Biol 2007;157:514-523.
48. Paschek D, Nymeyer H, Garcia AE. Replica exchange simulation of reversible
folding/unfolding of the Trp-cage miniprotein in explicit solvent: on the structure
and possible role of internal water. J Struct Biol 2007;157:524-533.
Trp-cage mini protein folding studies using BP-Rex MD simulation
104
49. Paschek D, Hempel S, Garcia AE. Computing the stability diagram of the Trp-
cage miniprotein. Proc Natl Acad Sci USA 2008;105:17754-17759.
50. Piana S, Laio A. A bias-exchange approach to protein folding. J Phys Chem B
2007;111:4553-4559.
51. Case D, Pearlman DA, Caldwell JW, Cheatham III TE, Ross WS, Simmerling CL,
Darden TA, Merz KM, Stanton RV, Cheng AL, Vincent JJ, Crowley M, Tsui V,
Radmer RJ, Duan Y, Pitera J, Massova I, Seibel GL, Singh UC, Weiner PK,
Kollman PA. Amber 8. University of California, 2003, San Francisco.
52. Jorgensen WL, Chandrasekhar J, Madura JD, Impey RW, Klein ML. Comparison
of simple potential functions for simulating liquid water. J Chem Phys
1983;79:926-935.
53. Duan Y, Wu A, Chowdhury CS, Lee MC, Xiong G, Zhang W, Yang R,. Cieplak P,
Luo R, Lee T, Caldwell J, Wang J, Kollman P. A point-charge force field for
molecular mechanics simulations of proteins based on condensed-phase
quantum mechanical calculations. J Comput Chem 2003;24:1999-2012.
54. Darden T, York D, Pedersen L. Particle mesh Ewald: An N·log(N) method for
Ewald sums in large systems. J Chem Phys 1993;98:10089-10092.
55. Miyamoto S, Kollman PA. Settle: An analytical version of the SHAKE and
RATTLE algorithm for rigid water models. J Comput Chem 1992;13:952-962.
56. Feig M, Karanicolas J, Brooks CL. MMTSB tool set: enhanced sampling and
multiscale modeling methods for applications in structural biology. J Mol Graph
Model 2004;22:377-395.
57. Humphrey W, Dalke A. Schulten K. VMD - Visual Molecular Dynamics. J Molec
Graphics 1996;14:33-38.
58. Kaminski GA, Friesner RA, Tirado-Rives J, Jorgensen WL. Evaluation and
Reparametrization of the OPLS-AA Force Field for Proteins via Comparison with
Accurate Quantum Chemical Calculations on Peptides. J Phys Chem 2001;
105:6474-6487.
59. Van der Spoel D, Lindahl E, Hess B, Groenhof G, Mark AE, Berendsen HJC.
GROMACS: Fast, Flexible and Free. J Comp Chem 2005;26:1701-1718.

105
Chapter 5
Application of BP-Rex MD for refinement and loop modeling of proteins in explicit solvent Srinivasaraghavan Kannan and Martin Zacharias School of Engineering and Science, Jacobs University Bremen, Campus Ring 6, D-
28759 Bremen, Germany
(In preparation)
5.1 Abstract Comparative protein modeling of a target protein based on sequence similarity to a
protein with known structure is widely used to provide structural models of proteins.
Frequently, the quality of the target- template sequence alignment is non-uniform along
the sequence: parts can be modeled with a high confidence, whereas other parts differ
strongly from the template. In principle, molecular dynamics (MD) simulations can be
used to refine protein model structures and also to model loops in homology modeled
protein structures, but it is limited by the currently accessible simulation time scales. In
the current work we have used a recently developed biasing potential replica exchange
(BP-Rex) MD method to refine and to model loops in homology modeled protein
structure at atomic resolution including explicit solvent. In standard Rex MD simulations
several replicas of a system are run in parallel at different temperatures allowing
exchanges at preset time intervals. In a BP-Rex MD simulation replicas are controlled by
various levels of a biasing potential to reduce the energy barriers associated with

Refinement and loop modeling of proteins using BP-Rex MD simulation
106
peptide backbone dihedral transitions. The method requires much fewer replicas for
efficient sampling compared with standard temperature Rex MD. Starting from incorrect
loop conformations this BP-Rex MD method samples the correct loop conformations as
dominant conformations in all the cases. Application of BP-Rex MD to several protein
loops indicates improved conformational sampling of backbone dihedral angle of loop
residues compared to conventional MD simulations. BP-Rex MD refinement simulations
on several test cases starting from decoy structures deviating significantly from the
native structure resulted in final structures in much closer agreement with experiment
compared to conventional MD simulations.
5.2 Introduction Knowledge of the three-dimensional (3D) structure of protein molecules is essential to
understand its function. Experimental structure determination is time consuming and
costly and the structure of only a limited number of proteins relative to the total number
of protein sequences has so far been solved. The enormous recent progress in high-
throughput genome sequencing further increases the gap between the number of known
protein sequences and known structures. Comparative modeling techniques are
increasingly being used to generate model structures for many proteins with sequence
similarity to a known template structure [1]. Template based comparative (or homology)
modeling methods are so far the most reliable modeling approach for generating protein
model structures [1–12 ]. However the prediction accuracy of these comparative based
methods is limited by the availability of well-suited template structures, the accuracy of
the target – template sequence alignment, and the modeling of segments with low (or
no) similarity to a template [3,12,13]. Often homology models of proteins are accurate
for parts of the protein with high sequence similarities to a template but often fail for
flexible regions such as loops that connect the two conserved secondary structure
elements. Even within a family of homologous proteins structural and functional variation
can arise as a consequence of structural differences which are often found on exposed
loop regions. Thus loops often determine the functional specificity of a given protein
frame work and can contribute to the active and binding sites of protein [14]. So structure
prediction of loops in modeled structures and atomic level structural refinement of whole
protein models is necessary for applications in drug design or guiding experimental
studies [12, 13, 15, 16].

Refinement and loop modeling of proteins using BP-Rex MD simulation
107
Loop modeling is defined as construction of 3D atomic models for short protein
segments that connect regular secondary structure elements. Several methods have
been developed to predict loop conformations. Although a comprehensive review of all
these methods is beyond the scope of the article (see references for more details) an
overview on the available approaches will be given in the following paragraphs.
Generally, loop modeling methods can be classified into knowledge-based methods, de
novo or ab initio methods and combined approaches.
Basis of knowledge-based approaches is a search in databases of experimental protein
structures as a source of loop conformations [17-24]. Possible loop conformations for a
given protein segment are evaluated by using rule-based filters, with evaluating criteria
such as geometric fit (e.g. distance of the loop termini), sequence similarity to the target
segment and inclusion of knowledge-based potentials. The de novo structure prediction
approaches perform conformational searches or generate loop conformations from
scratch and these searches are guided by force field energy functions or other types of
scoring functions [25-40] with a variety of treatments of electrostatics and solvation
[41,42,43]. Knowledge-based potentials have also been used in combination with
conformational sampling methods, as well as energy functions that combine molecular
mechanics force-field terms with statistical potentials [21,44,45,46]. The database
methods are limited by the exponential increase in the number of geometrically possible
conformations as a function of loop length [44]. Loop models generated using databases
method may require also extensive optimization for loops longer than four residues
because a discrete loop template may not exactly close the loop. Systematic de novo
search methods encounter similar difficulties because the number of putative loop
conformations or size of the conformational space increases with increasing loop length
[7].
Similar to modeling of protein segments the atomic – resolution refinement of protein
structures built by comparative modeling requires both large scale conformational
sampling and accurate atomic energy functions. Progress has been made using various
knowledge based potentials that are augmented by energy terms motivated by
consideration of important physical interactions and sampling is often facilitated by low
resolution initial conformational searches [47, 48]. Baker and coworkers [48] for example
reported encouraging results for 5 of 16 small proteins using a refinement protocol in
which multiple rounds of random torsion-angle perturbation and Monte Carlo (MC)
Refinement and loop modeling of proteins using BP-Rex MD simulation
108
relaxation were performed on low-resolution models built from a set of sequence
homologues of the target protein using the Rosetta approach. Another method based on
fragment assembly and MC simulation is Tasser [49], which has been applied to the
refinement structures determined by NMR spectroscopy [50]. Recently, these ab initio
approaches have also been applied to the refinement of homology models. Misura et al.
[51] attempted to refine a series of homology models using Rosetta in combination with
evolutionarily derived distance constraints. The authors found in 22 out of 39 cases a
model that is closer to the native structure than the template over the aligned regions
within the 10 lowest-energy models. However, the method is computationally very
intensive with the refinement of one model requiring 90 CPU days. In addition to the
approaches outlined earlier, a number of methods that employ statistical potentials or
empirical scoring functions to select the near-native models from an ensemble of
homology models have also been described [52 -69].
In principle Molecular Dynamics guided by a molecular mechanics force field should be
potentially useful for structure refinement and loop modeling [70-75]. Well converged MD
simulations include conformational entropy effects and could serve as tool for
conformational search of the loop region and also for atomic resolution refinement of
protein model [26]. However, early studies on application of MD simulations for structure
prediction and refinement had not been successful, mainly due to insufficient sampling of
protein conformational space. At room temperature affordable MD simulations can be
kinetically trapped and explore only the basin of attraction near the starting structures.
Several methods have been proposed to over come the barrier crossing problems.
Viktor and Simmerling [26, 28] have used low barrier MD simulations to generate
accurate loop conformations. Kirsi [27] used adjustable – barrier dihedral potentials for
conformational search of protein loops during MD simulations. Hao and Mark [70] carried
out standard MD simulations in explicit water for the refinement of homology modeled
structures. Though still a significant deviation of simulated structures from the
experimental structures was observed, simulations of tens to hundreds of nanoseconds
resulted on average in final conformations in closer agreement with experiment than the
start structures.
The replica exchange MD (Rex MD) simulation method is an advanced sampling
methodology widely used for enhancing the conformational sampling of biomolecules

Refinement and loop modeling of proteins using BP-Rex MD simulation
109
[76-79]. In Rex MD simulations, several copies (replicas) of the system are simulated
independently and simultaneously using classical MD or MC methods at different
simulation temperatures (or force fields: Hamiltonians). At preset intervals, pairs of
replicas (neighboring pairs) are exchanged with a specified transition probability. In most
Rex MD simulations the temperature is used as a parameter that varies among the
replicas (T-Rex MD). The random walk in temperature allows conformations trapped in
locally stable states (at a low simulation temperature) to escape by exchanging with
replicas at higher simulation temperature. The T-Rex MD simulations with Generalized
Born model has also used for the prediction of loop conformations (34, 35). In addition,
Rex MD was used to refine NMR structures in implicit solvent and including structural
restraints it used for the refinement of CASPR target proteins [81,83]. Recently, Jiang et
al. [82] have used T-Rex MD simulations with a statistical potential for refinement of
homology modeled proteins in explicit solvent. Although T-Rex MD performed better
than standard MD simulations, the authors suggested using much a boarder
temperature range and longer simulations to improve the sampling efficiency.
The main drawback of T-Rex MD simulations is that the number of required replicas to
cover the desired temperature range increases rapidly with the system size [80]. In turn
it also requires longer simulations times (with increasing system size) to reach the same
level of random walk (diffusion) of replicas through all simulation temperatures.
Especially for proteins in explicit solvent this requires rapidly increasing computational
resources. Recently, we have proposed Biasing Potential Replica Exchange (BP-Rex
MD) method that specifically lowers barriers for peptide backbone transitions along the
replicas [84-86]. This method requires fewer replicas than T-Rex MD even in the
presence of explicit solvent. In the current work we have applied BP-Rex MD simulations
for modeling of loops in protein structures and to refine modeled proteins in explicit
solvent. Starting from protein decoy start structures the BP-Rex MD method resulted in
final structures closer to experiment than refinement by standard MD simulations.
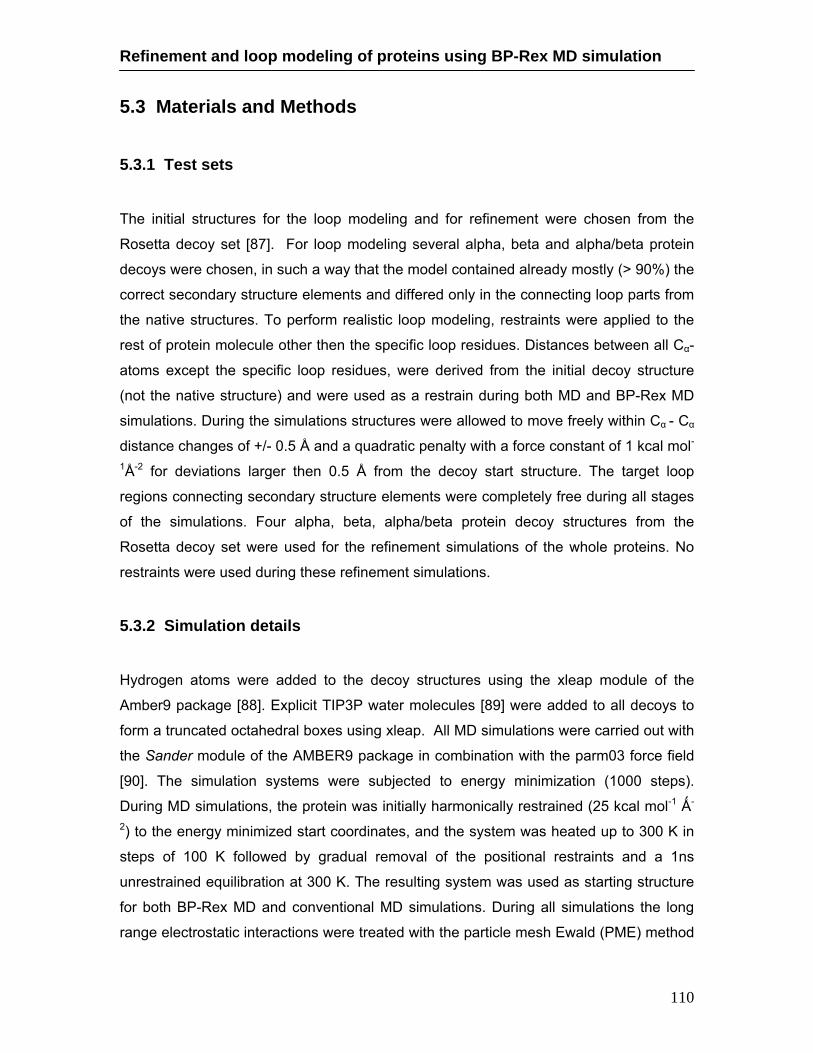
Refinement and loop modeling of proteins using BP-Rex MD simulation
110
5.3 Materials and Methods
5.3.1 Test sets The initial structures for the loop modeling and for refinement were chosen from the
Rosetta decoy set [87]. For loop modeling several alpha, beta and alpha/beta protein
decoys were chosen, in such a way that the model contained already mostly (> 90%) the
correct secondary structure elements and differed only in the connecting loop parts from
the native structures. To perform realistic loop modeling, restraints were applied to the
rest of protein molecule other then the specific loop residues. Distances between all Cα-
atoms except the specific loop residues, were derived from the initial decoy structure
(not the native structure) and were used as a restrain during both MD and BP-Rex MD
simulations. During the simulations structures were allowed to move freely within Cα - Cα
distance changes of +/- 0.5 Å and a quadratic penalty with a force constant of 1 kcal mol-
1Å-2 for deviations larger then 0.5 Å from the decoy start structure. The target loop
regions connecting secondary structure elements were completely free during all stages
of the simulations. Four alpha, beta, alpha/beta protein decoy structures from the
Rosetta decoy set were used for the refinement simulations of the whole proteins. No
restraints were used during these refinement simulations.
5.3.2 Simulation details Hydrogen atoms were added to the decoy structures using the xleap module of the
Amber9 package [88]. Explicit TIP3P water molecules [89] were added to all decoys to
form a truncated octahedral boxes using xleap. All MD simulations were carried out with
the Sander module of the AMBER9 package in combination with the parm03 force field
[90]. The simulation systems were subjected to energy minimization (1000 steps).
During MD simulations, the protein was initially harmonically restrained (25 kcal mol-1 Ǻ-
2) to the energy minimized start coordinates, and the system was heated up to 300 K in
steps of 100 K followed by gradual removal of the positional restraints and a 1ns
unrestrained equilibration at 300 K. The resulting system was used as starting structure
for both BP-Rex MD and conventional MD simulations. During all simulations the long
range electrostatic interactions were treated with the particle mesh Ewald (PME) method

Refinement and loop modeling of proteins using BP-Rex MD simulation
111
[91] using a real space cutoff distance of cutoff=9Ǻ. The Settle algorithm [92] was used
to constrain bond vibrations involving hydrogen atoms, which allowed a time step of 2 fs.
5.3.3 Biasing Potential Replica-Exchange Simulations The BP-Rex MD method is a Hamiltonian Rex MD method that employs a biasing
potential for the Φ and Ψ peptide backbone dihedral angles [84]. The biasing potential is
based on a potential of mean force (PMF) for each of the two dihedral angles calculated
for a model peptide (alanine dipeptide) in explicit solvent [84]. Addition of the biasing
potential during a simulation lowers the energy barriers for backbone dihedral transitions
in a peptide or protein. The biasing potential had been derived previously by potential-of-
mean force (PMF) free energy simulations on the backbone dihedral Φ and Ψ of Alanine
dipeptide in explicit water [84]. During a BP-Rex MD the level of biasing is gradually
changed along the replicas such that frequent transitions are possible at high levels of
biasing. Note, that the same biasing potential derived from the model system was used
for all backbone dihedral in the protein (except Gly and the Pro Φ angle). In a BP-Rex
MD simulation different biasing potential levels are applied in each replica (one
reference replica runs without any biasing potential) and replica exchanges between
neighboring biasing levels were attempted every 1000 MD steps (2ps) and accepted or
rejected according to a Metropolis criterion [93] (5000 attempted exchanges in 10 ns)
with an acceptance rate of 30-40%. An advantage compared to T-Rex MD is the fact
that the energy differences are only affected by the force field term that changes upon
going from one replica to another replica run. For the present simulations we used 5
replicas, and the acceptance probability for replica exchanges was in the range of 30-
40%.
For each case two sets of BP-Rex MD simulations and two independent standard MD
simulations at 300K were carried out using two different starting decoy conformations. In
the case of loop modeling distance restraints were used during both MD and BP-Rex
MD simulations (no restraints during full refinement).

Refinement and loop modeling of proteins using BP-Rex MD simulation
112
5.4 Results 5.4.1 Loop modeling Molecular Dynamics loop modeling simulations were performed on three alpha helical
proteins, two beta proteins and one alpha – beta protein model structure. The protein
structures contained loop structures ranging in size between 7 and 13 residues. For all
the cases two different starting structures were used. Decoy start structures were
obtained from the Rosetta protein decoy set [34] and contained already almost correctly
folded secondary structures (>90 % according to the DSSP program) with the main
structural variation due to loop regions that connect secondary structure elements. In
order to stabilize the near-native secondary structure and also the spatial arrangement
of secondary structure elements distance restraints (between backbone Cα atoms) were
included during both MD, and BP-Rex MD simulations to prevent the system from
unfolding or sampling states far away from the folded structure (see Methods for details).
Figure 5.1: Root-mean-square deviation (Rmsd of heavy-atoms) of sampled loop conformations
1pft (left panels) 5znf (right panels) in explicit solvent from the native structure vs. simulation time
for continuous MD simulations (top panels) and BP-Rex MD simulation (bottom panels, for
conformations sampled in referenced replica) starting from incorrect loop structure. The distance restraints were derived from the decoy start structures without inclusion of
any knowledge of the native structure. The distance restraints were sufficiently soft to
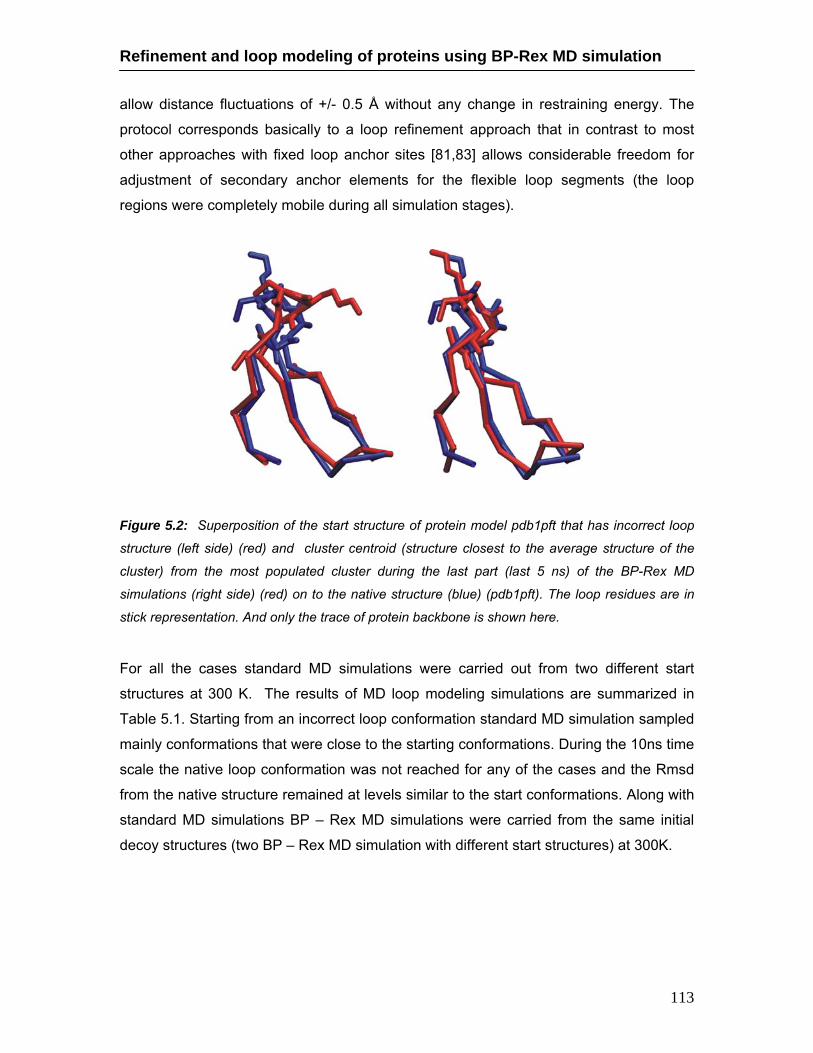
Refinement and loop modeling of proteins using BP-Rex MD simulation
113
allow distance fluctuations of +/- 0.5 Å without any change in restraining energy. The
protocol corresponds basically to a loop refinement approach that in contrast to most
other approaches with fixed loop anchor sites [81,83] allows considerable freedom for
adjustment of secondary anchor elements for the flexible loop segments (the loop
regions were completely mobile during all simulation stages).
Figure 5.2: Superposition of the start structure of protein model pdb1pft that has incorrect loop
structure (left side) (red) and cluster centroid (structure closest to the average structure of the
cluster) from the most populated cluster during the last part (last 5 ns) of the BP-Rex MD
simulations (right side) (red) on to the native structure (blue) (pdb1pft). The loop residues are in
stick representation. And only the trace of protein backbone is shown here.
For all the cases standard MD simulations were carried out from two different start
structures at 300 K. The results of MD loop modeling simulations are summarized in
Table 5.1. Starting from an incorrect loop conformation standard MD simulation sampled
mainly conformations that were close to the starting conformations. During the 10ns time
scale the native loop conformation was not reached for any of the cases and the Rmsd
from the native structure remained at levels similar to the start conformations. Along with
standard MD simulations BP – Rex MD simulations were carried from the same initial
decoy structures (two BP – Rex MD simulation with different start structures) at 300K.

Refinement and loop modeling of proteins using BP-Rex MD simulation
114
Table 5.1: Test systems and results of loop modeling simulations.
Continuous MD BP-Rex MD Protein-code
Secondary structure Nres
N loop
resa
Initial Rmsd Rmsd
low Rmsd avg
Rmsd low
Rmsd avg
2.5 (4.9)
1.5 (4.0)
2.1 (4.6)
0.1 (0.6)
0.4 (1.6) 1ERD
(M – 1) Alpha 29 15-19 / 5 2.6
(5.5) 1.6
(4.2) 2.5
(5.3) 0.2
(1.0) 1.4
(2.0) 2.0
(3.9) 1.4
(3.2) 1.9
(3.8) 0.2
(1.9) 1.0
(2.4) 1ERD (M – 2) Alpha 29 7 –
10 / 4 1.9 (3.7)
1.3 (3.3)
1.8 (4.0)
0.3 (2.0)
1.1 (2.9)
1.3 (2.6)
1.0 (2.1)
1.2 (2.5)
0.2 (0.9)
0.7 (1.7) 1PFT Beta 22 13 –
17 / 5 1.2 (2.9)
1.1 (1.9)
1.5 (2.8)
0.2 (1.0)
1.1 (2.1)
1.5 ( 4.5)
0.3 (2.6)
0.7 (3.1)
0.06 (1.0)
0.3 (2.2) 5ZNF Alpha /
beta 25 5 – 8 / 4 0.7
(2.7) 0.3
(2.2) 0.4
(2.6) 0.05 (1.1)
0.3 (2.1)
2.0 (3.3)
0.8 (1.8)
1.4 (2.5)
0.16 (1.3)
0.7 (1.9) 1RES Alpha 35 9 –
14 / 7 1.8 (3.2)
0.7 (1.6)
1.3 (2.7)
0.15 (1.2)
0.8 (2.0)
1.5 (2.8)
0.8 (2.0)
1.2 (2.5)
0.3 (0.8)
0.5 (1.5) 1PGX Alpha /
beta 57 37 – 40 / 4 1.4
(2.6) 0.9
(2.0) 1.3
(2.4) 0.1
(0.9) 0.7
(1.9) a – start and end residue of the loop part / total length of the loop.
The Rmsd (loop - Cα atom) are averaged over the last 5ns simulation time. Values in the
brackets correspond to the heavy atom rmsd of loop atoms.
Starting from incorrect loop conformations BP-Rex MD simulations sampled loop
conformations close to the correct loop conformations in most of the cases. The rmsd of
sampled loop conformations showed a decrease in Rmsd by 1.5 – 2 Å in all the cases.
The results are summarized in Table 5.1. The Rmsd was calculated by superimposing
the whole protein on to its native structure and the Rmsd of the loop part was calculated.
In none of the loop modeling cases transition to near native loop structures were
observed during the continuous MD simulations.

Refinement and loop modeling of proteins using BP-Rex MD simulation
115
Figure 5.3: Superposition of the start structure of protein model pdb5znf that has incorrect loop
structure (left side) (red) and cluster centroid (structure closest to the average structure of the
cluster) from the most populated cluster during the last part (last 5 ns) of the BP-Rex MD
simulations (right side) (red) on to the native structure (blue) (pdb5znf). The loop residues are in
stick representation and the protein model is shown as cartoon representation.
The protein pdb5znf is a 24 residue alpha/beta protein consisting of one alpha helix and
two beta strands that are connected by two loops. The initial decoy structure had an
incorrect conformation for the loop1 (Figure 5.3, left side, red). The C-MD simulation
sampled conformations are close to its starting incorrect structure and no transition to
the correct loop structure occurred during the 10ns time scale (Figure 5.1). With BP-Rex
MD already at ~5ns time the sampled loop conformations had loop heavy - rmsd < 2 Å
(Figure 5.1). During the simulation the BP-Rex method frequently flips between correct
and incorrect loop conformations. And at the end of the simulations the correct loop
conformation became the dominant conformation Figure 5.3 (right side, red).
5.4.2 Phi/Psi analysis for 5znf loop
Transition from incorrect loop conformation to the correct loop conformation often
requires flipping of backbone dihedrals of the loop residues. Figure 5.4. illustrates the
sampling of backbone dihedral angles of several loop residues during C-MD and BP-Rex
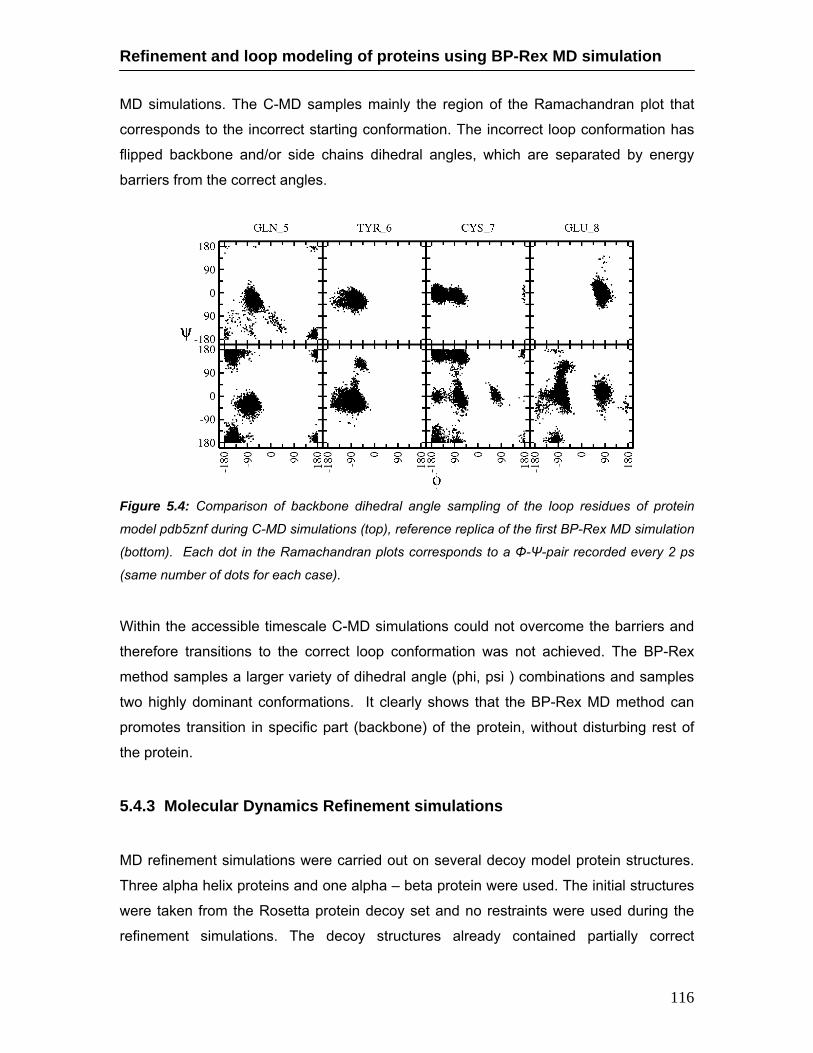
Refinement and loop modeling of proteins using BP-Rex MD simulation
116
MD simulations. The C-MD samples mainly the region of the Ramachandran plot that
corresponds to the incorrect starting conformation. The incorrect loop conformation has
flipped backbone and/or side chains dihedral angles, which are separated by energy
barriers from the correct angles.
Figure 5.4: Comparison of backbone dihedral angle sampling of the loop residues of protein
model pdb5znf during C-MD simulations (top), reference replica of the first BP-Rex MD simulation
(bottom). Each dot in the Ramachandran plots corresponds to a Φ-Ψ-pair recorded every 2 ps
(same number of dots for each case).
Within the accessible timescale C-MD simulations could not overcome the barriers and
therefore transitions to the correct loop conformation was not achieved. The BP-Rex
method samples a larger variety of dihedral angle (phi, psi ) combinations and samples
two highly dominant conformations. It clearly shows that the BP-Rex MD method can
promotes transition in specific part (backbone) of the protein, without disturbing rest of
the protein.
5.4.3 Molecular Dynamics Refinement simulations MD refinement simulations were carried out on several decoy model protein structures.
Three alpha helix proteins and one alpha – beta protein were used. The initial structures
were taken from the Rosetta protein decoy set and no restraints were used during the
refinement simulations. The decoy structures already contained partially correct
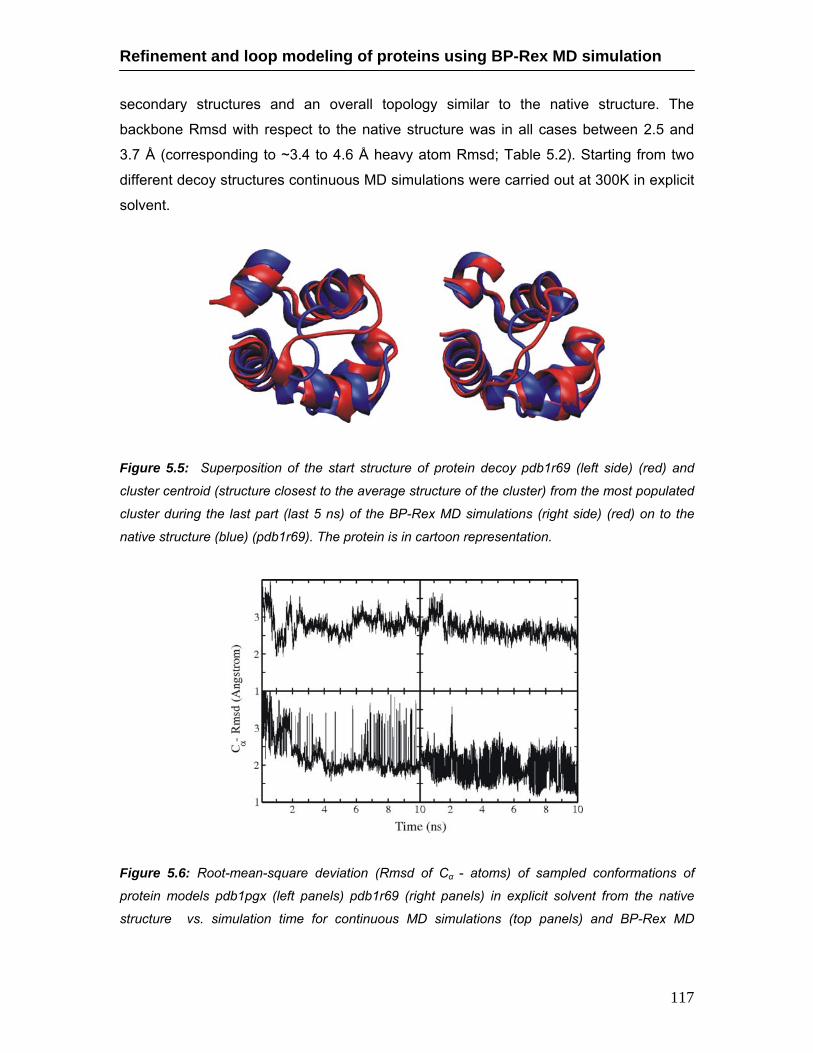
Refinement and loop modeling of proteins using BP-Rex MD simulation
117
secondary structures and an overall topology similar to the native structure. The
backbone Rmsd with respect to the native structure was in all cases between 2.5 and
3.7 Å (corresponding to ~3.4 to 4.6 Å heavy atom Rmsd; Table 5.2). Starting from two
different decoy structures continuous MD simulations were carried out at 300K in explicit
solvent.
Figure 5.5: Superposition of the start structure of protein decoy pdb1r69 (left side) (red) and
cluster centroid (structure closest to the average structure of the cluster) from the most populated
cluster during the last part (last 5 ns) of the BP-Rex MD simulations (right side) (red) on to the
native structure (blue) (pdb1r69). The protein is in cartoon representation.
Figure 5.6: Root-mean-square deviation (Rmsd of Cα - atoms) of sampled conformations of
protein models pdb1pgx (left panels) pdb1r69 (right panels) in explicit solvent from the native
structure vs. simulation time for continuous MD simulations (top panels) and BP-Rex MD
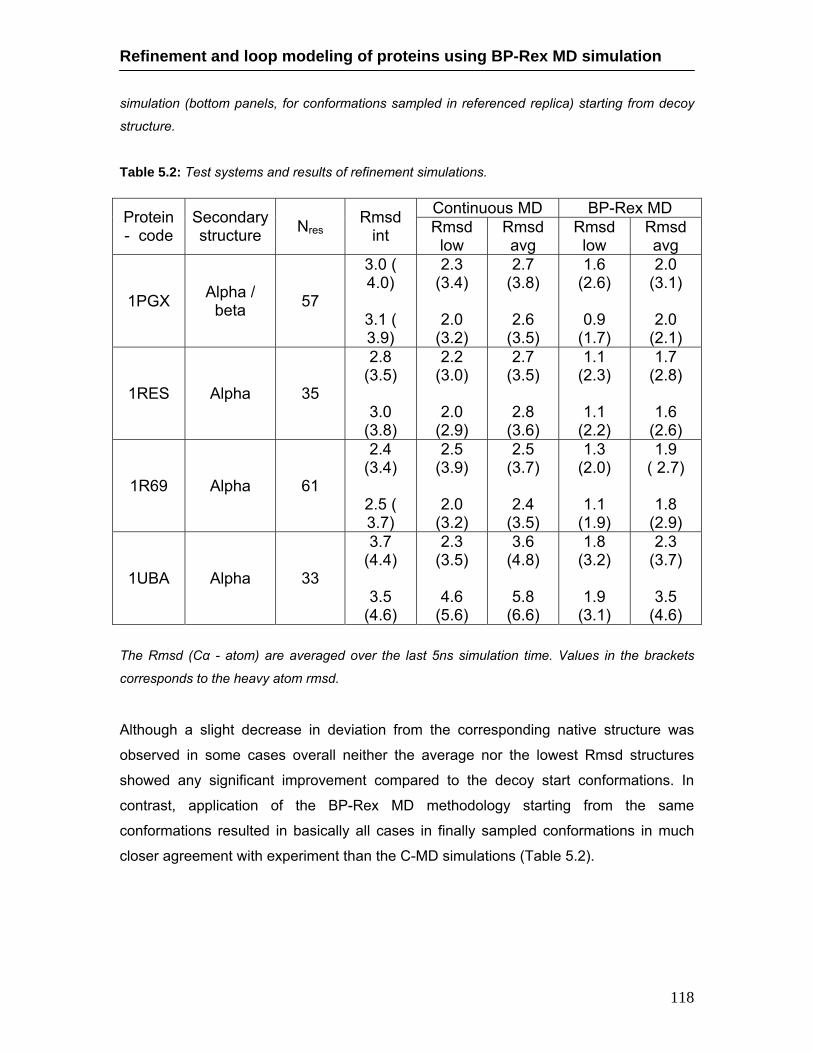
Refinement and loop modeling of proteins using BP-Rex MD simulation
118
simulation (bottom panels, for conformations sampled in referenced replica) starting from decoy
structure.
Table 5.2: Test systems and results of refinement simulations.
Continuous MD BP-Rex MD Protein - code
Secondary structure Nres
Rmsd int Rmsd
low Rmsd avg
Rmsd low
Rmsd avg
1PGX
Alpha / beta 57
3.0 ( 4.0)
3.1 ( 3.9)
2.3 (3.4)
2.0
(3.2)
2.7 (3.8)
2.6
(3.5)
1.6 (2.6)
0.9
(1.7)
2.0 (3.1)
2.0
(2.1)
1RES
Alpha 35
2.8 (3.5)
3.0
(3.8)
2.2 (3.0)
2.0
(2.9)
2.7 (3.5)
2.8
(3.6)
1.1 (2.3)
1.1
(2.2)
1.7 (2.8)
1.6
(2.6)
1R69
Alpha 61
2.4 (3.4)
2.5 ( 3.7)
2.5 (3.9)
2.0
(3.2)
2.5 (3.7)
2.4
(3.5)
1.3 (2.0)
1.1
(1.9)
1.9 ( 2.7)
1.8
(2.9)
1UBA
Alpha 33
3.7 (4.4)
3.5
(4.6)
2.3 (3.5)
4.6
(5.6)
3.6 (4.8)
5.8
(6.6)
1.8 (3.2)
1.9
(3.1)
2.3 (3.7)
3.5
(4.6)
The Rmsd (Cα - atom) are averaged over the last 5ns simulation time. Values in the brackets
corresponds to the heavy atom rmsd.
Although a slight decrease in deviation from the corresponding native structure was
observed in some cases overall neither the average nor the lowest Rmsd structures
showed any significant improvement compared to the decoy start conformations. In
contrast, application of the BP-Rex MD methodology starting from the same
conformations resulted in basically all cases in finally sampled conformations in much
closer agreement with experiment than the C-MD simulations (Table 5.2).
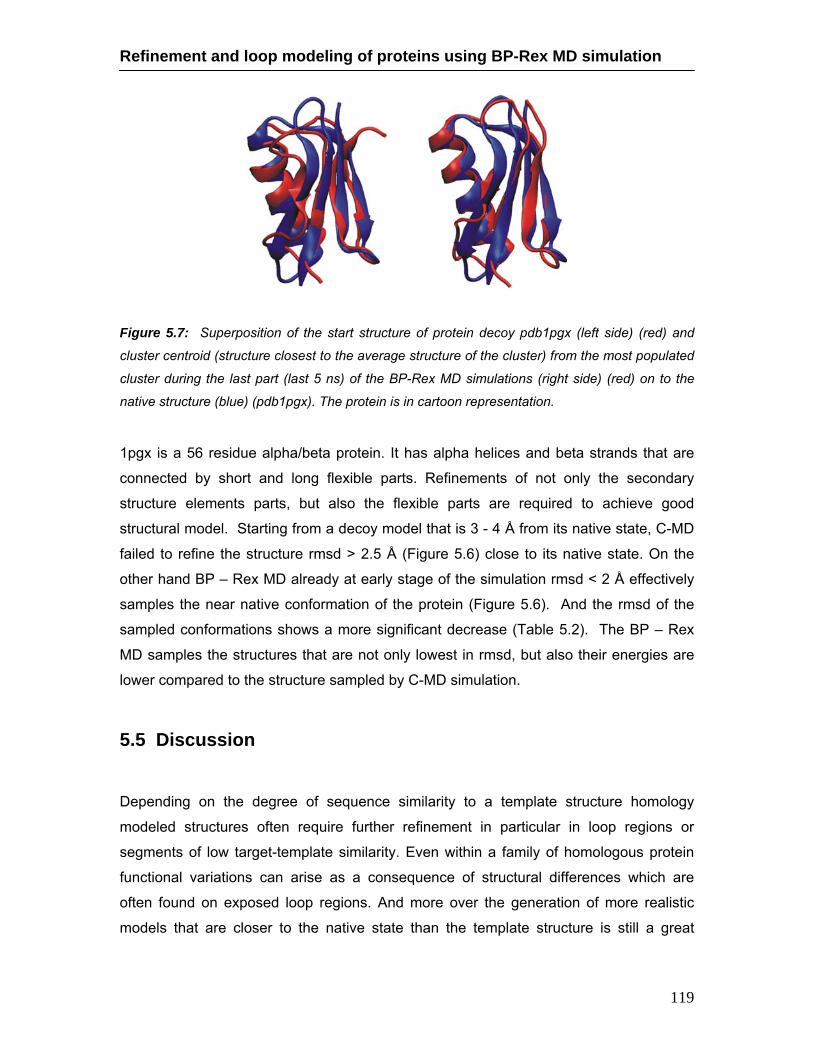
Refinement and loop modeling of proteins using BP-Rex MD simulation
119
Figure 5.7: Superposition of the start structure of protein decoy pdb1pgx (left side) (red) and
cluster centroid (structure closest to the average structure of the cluster) from the most populated
cluster during the last part (last 5 ns) of the BP-Rex MD simulations (right side) (red) on to the
native structure (blue) (pdb1pgx). The protein is in cartoon representation.
1pgx is a 56 residue alpha/beta protein. It has alpha helices and beta strands that are
connected by short and long flexible parts. Refinements of not only the secondary
structure elements parts, but also the flexible parts are required to achieve good
structural model. Starting from a decoy model that is 3 - 4 Å from its native state, C-MD
failed to refine the structure rmsd > 2.5 Å (Figure 5.6) close to its native state. On the
other hand BP – Rex MD already at early stage of the simulation rmsd < 2 Å effectively
samples the near native conformation of the protein (Figure 5.6). And the rmsd of the
sampled conformations shows a more significant decrease (Table 5.2). The BP – Rex
MD samples the structures that are not only lowest in rmsd, but also their energies are
lower compared to the structure sampled by C-MD simulation.
5.5 Discussion Depending on the degree of sequence similarity to a template structure homology
modeled structures often require further refinement in particular in loop regions or
segments of low target-template similarity. Even within a family of homologous protein
functional variations can arise as a consequence of structural differences which are
often found on exposed loop regions. And more over the generation of more realistic
models that are closer to the native state than the template structure is still a great
Refinement and loop modeling of proteins using BP-Rex MD simulation
120
challenge. Accurate modeling of loops and refinement of homology modeled proteins at
atomic resolution is necessary to better use of these models. Preferably, refinement
should be performed in explicit solvent to represent the aqueous environment of the
protein as realistically as possible. Molecular Dynamics simulations have already been
used to refine homology modeled proteins. Mark et al. has shown that simulations in the
order of 10 – 100ns are required to achieve reasonable refinement if the starting
structure is not too far from its native structure. Replica Exchange Molecular Dynamics
simulation is the most widely used and one of the successful method to enhance the
conformational sampling of biomolecules. And refinement of medium size proteins with
or with out restraints using this method shows good improvement compared to standard
MD simulations. However they suggested using longer simulation time and boarder
range of temperatures for better sampling of longer loops and flexible parts. However
with T-Rex MD the number of required replicas is increasing with increasing system size
and that in turn requires longer simulation time.
In the current work this method was applied to model loops in homology modeled
proteins and also to refine homology modeled proteins in explicit solvent. The BP-Rex
MD method employs a specific biasing potential to promote peptide backbone transitions
as a replica coordinate. The BP-Rex MD simulations were performed with only 5 replicas
(original potential and 4 levels of biasing) at 300K and standard MD simulations were
carried out at 300K. In contrast to standard MD simulations where transition to near-
native loop conformations were not observed in any of loop modeling cases, this BP-Rex
MD method sampled correct loop conformations in almost all the cases. Already at a
simulation time of ~5ns conformations close to the correct loop conformations were
sampled in most of the cases, afterwards these conformations close to the near-native
loop conformations were sampled as the dominant conformational states. Analysis of
backbone dihedral (Phi, Psi) angle of the loop residues of protein model pdb5znf clearly
shows that the sampling of correct loop conformations requires flipping of the backbone
dihedrals of the loop residues. Since the BP-Rex MD method specifically promotes the
backbone dihedral transition, this method samples the correct loop conformation by
easily flipping the backbone dihedrals of the loop residues without distributing rest of the
protein. In the case of refinement the BP – Rex MD simulation sampled structures close
to their native structure in contrast to the conventional MD simulations where sampling of
near-native conformations was not observed in any of the cases. Moreover cluster
Refinement and loop modeling of proteins using BP-Rex MD simulation
121
analysis of conformations sampled during the last part of the BP-Rex MD simulations (in
the reference replica) shows that the cluster centroid that represents the average
structure of the most dominant conformational cluster represent the conformation very
close to the native structure.
Over all the BP – Rex MD was quite efficient as compared to the standard MD
simulations in both the loop modeling and refinement cases. One of the main
advantages of the BP-Rex MD method is that this replica exchange sampling can be
easily focused to parts of a protein keeping the original backbone dihedral potential for
the rest of a protein in all replicas. This method can be easily used to study the
conformational transitions in protein molecules by focusing only a part of a protein that
undergoes such conformational change.
5.5 References
1. Marti-Renom, MA,Stuart, A.C., Fiser A., Sanchez, R., Melo F., Sali, A.
Comparative protein structure modeling of genes and genomes. Annu Rev
Biophys Biomol Struct 2000;29:291-325.
2. Baker, D. Sali, A. Protein structure prediction and structural genomics. Science
2001;294:93-96.
3. Vitkup, D., Melamud, E., Moult, J., Sander, C. Completeness in structural
genomics. Nat Struct Biol 2001;8:559-566.
4. Zhang, Y. Progress and challenges in protein structure prediction. Curr Opin
Struct Biol 2008;18:342-348.
5. Zhang, Y., Skolnick, J. The protein structure prediction problem could be solved
using the current PDB library. Proc Natl Acad Sci U S A 2005;102:1029-1034.
6. Ginalski, K. Comparative modeling for protein structure prediction. Curr Opin
Struct Biol 2006; 16: 172-177
7. Rohl, CA., Strauss, C.E., Chivian, D., Baker, D. Modeling structurally variable
regions in homologous proteins with rosetta. Proteins 2004;55:656-677.
8. Zhang, Y., Arakaki, A.K., Skolnick, J. TASSER: an automated method for the
prediction of protein tertiary structures in CASP6. Proteins 2005;61 Suppl 7:91-
98
Refinement and loop modeling of proteins using BP-Rex MD simulation
122
9. Zhang, Y., Skolnick, J. TM-align: a protein structure alignment algorithm based
on the TM-score. Nucleic Acids Res 2005;33:2302-2309.
10. Fiser, A., Sali, A. Modeller: generation and refinement of homology-based protein
structure models. Methods Enzymol 2003;374:461-491.
11. Kryshtafovych, A., Venclovas, C., Fidelis, K., Moult, J. Progress over the first
decade of CASP experiments. Proteins 2005;61 Suppl 7:225-236.
12. Venclovas, C., Zemla, A., Fidelis, K., Moult, J. Assessment of progress over the
CASP experiments. Proteins 2003;53 Suppl 6:585-595.
13. Tress, M., Ezkurdia, I., Grana, O., Lopez, G., Valencia, A. Assessment of
predictions submitted for the CASP6 comparative modeling category. Proteins
2005;61 Suppl 7:27-45.
14. Rossi, KA., Weigelt, CA., Nayeem, A., Krystek, Jr. Loopholes and missing links
in protein modeling. Protein Sci 2007;16:1999-2012.
15. Valencia, A. Protein refinement: a new challenge for CASP in its 10th
anniversary. Bioinformatics 2005;21: 277.
16. Moult, JA. decade of CASP: progress, bottlenecks and prognosis in protein
structure prediction. Curr Opin Struct Biol 2005;15:285-289.
17. Jones, TA., Thirup, S. Using known substructures in protein model building and
crystallography. EMBO J 1986; 5: 819-822.
18. Martin, ACR, Thornton, J.M. Structural families in loops of homologous proteins:
automatic classification, modeling and application to antibodies. J Mol Biol
1996;263:800-815.
19. Oliva, B., Bates, PA, Querol, E, Avilés, FX, Sternberg, MJE. An automated
classification of the structure of protein loops. J Mol Biol 1997; 266: 814-830.
20. Rufino, SD., Donate, LE, Canard, LHJ, Blundell, TL. Predicting the conformation
class of short and medium size loops connecting regular secondary structures:
application to comparative modeling. J Mol Biol 1997; 267: 352-367
21. Van Vlijmen WWT, Karplus M. PDB-based protein loop prediction: parameters
for selection and methods for optimization. J Mol Biol 1997; 257: 975-1001
22. Wojcik J, Mornon J-P, Chomilier J. New efficient statistical sequence-dependent
structure prediction of short to medium-sized protein loops based on an
exhaustive loop classification. J Mol Biol 1999; 289: 1469-1490
23. Deane CM, Blundell TL. CODA: a combined algorithm for predicting the
structurally variable regions of protein models. Protein Sci 2001; 10: 599-612
Refinement and loop modeling of proteins using BP-Rex MD simulation
123
24. Burke DF, Deane CM. Improved protein loop prediction from sequence alone.
Protein Eng 2001; 7: 473-478.
25. Bruccoleri RE, Karplus M. Conformational sampling using high-temperature
molecular dynamics. Biopolymers 1990; 29: 1847-1862.
26. Hornak, V. and C. Simmerling Generation of accurate protein loop conformations
through low-barrier molecular dynamics. Proteins 2003;51:577-590.
27. Tappura, K. Influence of rotational energy barriers to the conformational search
of protein loops in molecular dynamics and ranking the conformations. Proteins
2001;44:167-179.
28. Hornak, V. and C. Simmerling Development of softcore potential functions for
overcoming steric barriers in molecular dynamics simulations. J Mol Graph Model
2004;22:405-413.
29. Carlacci, L. and S. W. Englander The loop problem in proteins: a Monte Carlo
simulated annealing approach. Biopolymers 1993;33:1271-1286.
30. Bruccoleri, R. E. Ab initio loop modeling and its application to homology
modeling. Methods Mol Biol 2000;143:247-264.
31. Jacobson, M. P., D. L. Pincus, C. S. Rapp, T. J. Day, B. Honig, D. E. Shaw and
R. A. Friesner A hierarchical approach to all-atom protein loop prediction.
Proteins 2004;55:351-367.
32. Levefelt, C. and D. Lundh A fold-recognition approach to loop modeling. J Mol
Model 2006;12:125-139.
33. Zhu, K., D. L. Pincus, S. Zhao and R. A. Friesner Long loop prediction using the
protein local optimization program. Proteins 2006;65:438-452.
34. Felts, A. K., E. Gallicchio, D. Chekmarev, K. A. Paris, R. A. Friesner and R. M.
Levy Prediction of Protein Loop Conformations using the AGBNP Implicit Solvent
Model and Torsion Angle Sampling. J Chem Theory Comput 2008;4:855-868.
35. Olson, M. A., M. Feig and C. L. Brooks, 3rd Prediction of protein loop
conformations using multiscale modeling methods with physical energy scoring
functions. J Comput Chem 2008;29:820-831.
36. Sellers, B. D., K. Zhu, S. Zhao, R. A. Friesner and M. P. Jacobson Toward better
refinement of comparative models: predicting loops in inexact environments.
Proteins 2008;72:959-971.
37. Soto, C. S., M. Fasnacht, J. Zhu, L. Forrest and B. Honig Loop modeling:
Sampling, filtering, and scoring. Proteins 2008;70:834-843.
Refinement and loop modeling of proteins using BP-Rex MD simulation
124
38. Tosatto, S. C., E. Bindewald, J. Hesser and R. Manner A divide and conquer
approach to fast loop modeling. Protein Eng 2002;15:279-286.
39. Zheng, Q., R. Rosenfeld, C. DeLisi and D. J. Kyle Multiple copy sampling in
protein loop modeling: computational efficiency and sensitivity to dihedral angle
perturbations. Protein Sci 1994;3:493-506.
40. Zhu, K., D. L. Pincus, S. Zhao and R. A. Friesner Long loop prediction using the
protein local optimization program. Proteins 2006;65:438-452.
41. Rapp, C. S. and R. A. Friesner Prediction of loop geometries using a generalized
born model of solvation effects. Proteins 1999;35:173-183.
42. Xiang Z, Soto CS, Honig B. Evaluating conformational free energies: the colony
energy and its application to the problem of loop prediction. Proc Natl Acad Sci
USA 2002; 99: 7432-7437.
43. de Bakker PIW, DePristo MA, Burke DF, Blundell TL. Ab initio construction of
polypeptide fragments: accuracy of loop decoy discrimination by an all-atom
statistical potential ant the AMBER force field with the Generalized Born solvation
model. Proteins 2003; 51: 21-40.
44. John B,Sali A. Comparative protein structure modeling by iterative alignment,
model building and model assessment. Nucleic Acids Res 2003; 31: 3982-3992.
45. Rai BK,bFiser A. Multiple mapping method: a novel approach to the sequence-to-
structure alignment problem in comparative protein structure modeling. Proteins
2006; 63: 644-661.
46. Martin AC, Cheetham JC, Rees AR. Modeling antibody hypervariable loops:
combined algorithm. Proc Natl Acad Sci USA. 1989; 86: 9268-9272.
47. Zhang Y, Skolnick J. Automated structure prediction of weakly homologous
proteins on a genomic scale. Proc Natl Acad Sci USA 2004; 101: 7594-7599.
48. Bradley P,Misura KMS,Baker D. Toward high-resolution de novo structure
prediction for small proteins. Science 2005; 309: 1868-1871
49. Zhang Y,Arakaki AK,Skolnick JR. TASSER: an automated method for the
prediction of protein tertiary structures in CASP6. Proteins 2005; 61: 91-98.
50. Lee SY,Zhang Y,Skolnick J. TASSER-based refinement of NMR structures.
Proteins 2006; 63: 451-456.
51. Misura KMS,Chivian D,Rohl CA,Kim DE,Baker D. Physically realistic homology
models built with ROSETTA can be more accurate than their templates. Proc
Natl Acad Sci USA 2006; 103: 5361-5366.
Refinement and loop modeling of proteins using BP-Rex MD simulation
125
52. Wu, D., R. Jernigan and Z. Wu Refinement of NMR-determined protein
structures with database derived mean-force potentials. Proteins 2007;68:232-
242.
53. Han, R., A. Leo-Macias, D. Zerbino, U. Bastolla, B. Contreras-Moreira and A. R.
Ortiz An efficient conformational sampling method for homology modeling.
Proteins 2008;71:175-188.
54. Jagielska, A., L. Wroblewska and J. Skolnick Protein model refinement using an
optimized physics-based all-atom force field. Proc Natl Acad Sci U S A
2008;105:8268-8273.
55. Lu, H. and J. Skolnick Application of statistical potentials to protein structure
refinement from low resolution ab initio models. Biopolymers 2003;70:575-584.
56. Cui, F., R. Jernigan and Z. Wu Refinement of NMR-determined protein structures
with database derived distance constraints. J Bioinform Comput Biol
2005;3:1315-1329.
57. Fiser, A. and A. Sali Modeller: generation and refinement of homology-based
protein structure models. Methods Enzymol 2003;374:461-491.
58. Kidera, A. and N. Go Refinement of protein dynamic structure: normal mode
refinement. Proc Natl Acad Sci U S A 1990;87:3718-3722.
59. Hollup, S. M., W. R. Taylor and I. Jonassen Structural fragments in protein model
refinement. Protein Pept Lett 2008;15:964-971.
60. Jonassen, I., D. Klose and W. R. Taylor Protein model refinement using
structural fragment tessellation. Comput Biol Chem 2006;30:360-366.
61. Kairys, V., M. K. Gilson and M. X. Fernandes Using protein homology models for
structure-based studies: approaches to model refinement. ScientificWorldJournal
2006;6:1542-1554.
62. Kmiecik, S., D. Gront and A. Kolinski Towards the high-resolution protein
structure prediction. Fast refinement of reduced models with all-atom force field.
BMC Struct Biol 2007;7:43.
63. Misura, K. M. and D. Baker Progress and challenges in high-resolution
refinement of protein structure models. Proteins 2005;59:15-29.
64. Riemann, R. N. and M. Zacharias Refinement of protein cores and protein-
peptide interfaces using a potential scaling approach. Protein Eng Des Sel
2005;18:465-476.

Refinement and loop modeling of proteins using BP-Rex MD simulation
126
65. Stumpff-Kane, A. W., K. Maksimiak, M. S. Lee and M. Feig Sampling of near-
native protein conformations during protein structure refinement using a coarse-
grained model, normal modes, and molecular dynamics simulations. Proteins
2008;70:1345-1356.
66. Subramaniam, S., D. K. Tcheng and J. M. Fenton A knowledge-based method
for protein structure refinement and prediction. Proc Int Conf Intell Syst Mol Biol
1996;4:218-229.
67. Topf, M., M. L. Baker, M. A. Marti-Renom, W. Chiu and A. Sali Refinement of
protein structures by iterative comparative modeling and CryoEM density fitting. J
Mol Biol 2006;357:1655-1668.
68. Wroblewska, L., A. Jagielska and J. Skolnick Development of a physics-based
force field for the scoring and refinement of protein models. Biophys J
2008;94:3227-3240.
69. Zhu, J., L. Xie and B. Honig Structural refinement of protein segments containing
secondary structure elements: Local sampling, knowledge-based potentials, and
clustering. Proteins 2006;65:463-479.
70. Fan, H. and A. E. Mark Refinement of homology-based protein structures by
molecular dynamics simulation techniques. Protein Sci 2004;13:211-220.
71. Fan, H. and A. E. Mark Relative stability of protein structures determined by X-
ray crystallography or NMR spectroscopy: a molecular dynamics simulation
study. Proteins 2003;53:111-120.
72. Fan, H. and A. E. Mark Mimicking the action of folding chaperones in molecular
dynamics simulations: Application to the refinement of homology-based protein
structures. Protein Sci 2004;13:992-999.
73. Fan, H. and A. E. Mark Mimicking the action of GroEL in molecular dynamics
simulations: application to the refinement of protein structures. Protein Sci
2006;15:441-448.
74. Linge, J. P., M. A. Williams, C. A. Spronk, A. M. Bonvin and M. Nilges
Refinement of protein structures in explicit solvent. Proteins 2003;50:496-506.
75. Chopra, G., C. M. Summa and M. Levitt Solvent dramatically affects protein
structure refinement. Proc Natl Acad Sci U S A 2008;105:20239-20244.
76. Swendsen RH, Wang JS. Replica Monte Carlo simulations of spin glasses. Phys
Rev Lett 1986;57:2607-2609.
Refinement and loop modeling of proteins using BP-Rex MD simulation
127
77. Okamoto Y. Generalized-ensemble algorithms: enhanced sampling techniques
for Monte Carlo and molecular dynamics simulations. J Mol Graph Model
2004;22:425-439.
78. Sugita Y, Okamoto Y. Replica-exchange molecular dynamics method for protein
folding. Chem Phys Lett 1999;314:141-151.
79. Mitsutake A, Sugita Y, Okamoto Y. Generalized-ensemble algorithms for
molecular simulations of biopolymers. Biopolymers 2001;60:96-123.
80. Rathore N, Chopra M, de Pablo JJ. Optimal allocation of replicas in parallel
tempering simulations. J Chem Phys 2005;122:24111-24118.
81. Chen, J. and C. L. Brooks, 3rd Can molecular dynamics simulations provide
high-resolution refinement of protein structure? Proteins 2007;67:922-930.
82. Zhu, J., H. Fan, X. Periole, B. Honig and A. E. Mark Refining homology models
by combining replica-exchange molecular dynamics and statistical potentials.
Proteins 2008;72:1171-1188.
83. Cheng, X., G. Cui, V. Hornak and C. Simmerling Modified replica exchange
simulation methods for local structure refinement. J Phys Chem B
2005;109:8220-8230.
84. Kannan S, Zacharias M. Enhanced sampling of peptide and protein
conformations using replica exchange simulations with a peptide backbone
biasing-potential. Proteins 2007;66:697-706.
85. Frickenhaus, S., S. Kannan and M. Zacharias Efficient evaluation of sampling
quality of molecular dynamics simulations by clustering of dihedral torsion angles
and Sammon mapping. J Comput Chem 2009;30:479-492.
86. Kannan S, Zacharias M. Folding simulations of Trp-cage mini protein in explicit
solvent using biasing potential replica-exchange molecular dynamics simulations.
Proteins 2009. (in press).
87. Tsai, J., Bonneau, R., Morozov, AV., Kuhlman, B., Rohl, CA., Baker, D., 2003.
An improved protein decoy set for testing energy functions for protein structure
prediction. Proteins. 53, 76–87.
88. Case D, Pearlman DA, Caldwell JW, Cheatham III TE, Ross WS, Simmerling CL,
Darden TA, Merz KM, Stanton RV, Cheng AL, Vincent JJ, Crowley M, Tsui V,
Radmer RJ, Duan Y, Pitera J, Massova I, Seibel GL, Singh UC, Weiner PK,
Kollman PA. Amber 8. University of California, 2003, San Francisco.
Refinement and loop modeling of proteins using BP-Rex MD simulation
128
89. Jorgensen WL, Chandrasekhar J, Madura JD, Impey RW, Klein ML. Comparison
of simple potential functions for simulating liquid water. J Chem Phys
1983;79:926-935.
90. Duan Y, Wu A, Chowdhury CS, Lee MC, Xiong G, Zhang W, Yang R,. Cieplak P,
Luo R, Lee T, Caldwell J, Wang J, Kollman P. A point-charge force field for
molecular mechanics simulations of proteins based on condensed-phase
quantum mechanical calculations. J Comput Chem 2003;24:1999-2012.
91. Darden T, York D, Pedersen L. Particle mesh Ewald: An N·log(N) method for
Ewald sums in large systems. J Chem Phys 1993;98:10089-10092.
92. Miyamoto S, Kollman PA. Settle: An analytical version of the SHAKE and
RATTLE algorithm for rigid water models. J Comput Chem 1992;13:952-962.
93. Okamoto Y. Generalized-ensemble algorithms: enhanced sampling techniques
for Monte Carlo and molecular dynamics simulations. J Mol Graph Model
2004;22:425-439.
94. Feig M, Karanicolas J, Brooks CL. MMTSB tool set: enhanced sampling and
multiscale modeling methods for applications in structural biology. J Mol Graph
Model 2004;22:377-395.
95. Humphrey W, Dalke A. Schulten K. VMD - Visual Molecular Dynamics. J Molec
Graphics 1996;14:33-38.
129
Chapter 6
Discussion and Outlook Realistic computer simulation of the structure formation process of biomolecules is a
great challenge of molecular biophysics and structural biology. In principle, MD
simulations allow studying the structure formation process at atomic detail. However
limited sampling of biomolecules conformations on currently accessible time scales
prevents the applicability of conventional Molecular Dynamics (C-MD) simulations for
larger systems. Several methods that have been proposed to overcome the
conformational sampling problem that are either computationally expensive or doesn’t
treat the solvent molecules explicitly. Although the hairpin folding study (chapter 2)
clearly shows the enhanced sampling efficiency of temperature based Replica Exchange
Molecular Dynamics (T-Rex MD) simulation method compared to standard MD
simulations, T-Rex MD is limited to biomolecules that are small in size. Due to the rapid
increase in the number of required replicas with increasing system size to cover a
desired temperature range, longer simulations (or more exchanges) are required to allow
sufficient “traveling” or exchanges between high and low temperature replicas. To
enhance the conformational sampling of biomolecules, I have developed a new
Hamiltonian replica exchange method named Biasing Potential Replica Exchange
Molecular Dynamics (BP-Rex MD). This replica method employs varying levels of
biasing potential for the φ and ψ peptide backbone dihedral angles along the system
replicas. The biasing potential lowers the barrier for backbone dihedral transitions and
promotes an increased tendency for peptide backbone transitions along the replica
coordinate. Application of this method from the dipeptide to the folding of a mini protein
(Trp-cage) and to the refinement of protein models indicates the enhanced sampling
efficiency of this method compared to the standard MD simulations. Only 5 replicas were
required from structure prediction of small peptides, to folding of a mini protein; and for
Discussion and Outlook
130
refinement and loop modeling of homology modeled proteins by considering the solvent
molecules explicitly. Cluster analysis shows that BP-Rex MD with 5 replicas samples as
many distinct conformational clusters as the temperature Rex MD samples with 16
temperatures (replicas) (in the case of alpha helix folding, chapter 3). BP-Rex MD (again
with 5 replica) samples significantly more relevant states in the reference replica run
than the combined sampling of 5 independent c-MD simulations of the same length (in
the case of Trp-cage folding, chapter 4). All these studies demonstrated that the BP-Rex
MD method allows for an efficient sampling of peptide and protein conformations in
explicit solvent with considerably fewer replicas (5 replicas) compared to T-Rex MD
simulations and standard MD simulations.
In future, this method could be developed further and also could be applied for various
applications that require enhanced sampling of conformational space.
One possible application of this method could be to study the conformational transitions
in protein molecules. There are several protein molecules for which the structure of
active and inactive or open and closed forms are available. However little is known about
the transitions pathways between these two conformations. Since traditional
experiments cannot capture these events, computer simulations provides the only
possibility to obtain these conformational transition pathways at atomic detail. As
standard MD will fail because of kinetic trapping problem, BP-Rex MD can be used to
focus only a part of a protein that undergoes such conformational change and by
keeping the “unbiased” (original) backbone dihedral angle potential for the rest of the
protein in all replicas.
A main drawback compared to standard Rex MD methods is the fact that the biasing
potential used in this method is restricted to peptide or protein systems and not
applicable to any organic or bio-molecule of interest. Additionally, the biasing potential is
restricted to only the amber ff03 forcefield. For each peptide force field, a specific biasing
potential needs to be constructed to apply the current method.
Optimization of the current biasing potentials could further increase the sampling
efficiency of this BP-Rex MD method. Since in the current work, the biasing potential
was constructed using one dimensional potential of mean force (PMF) for each of the
Discussion and Outlook
131
dihedral angles (separate PMF for phi and psi), in principle it could be possible to
construct a two-dimensional PMF for each combination of dihedral angles. Another
possibility would be a trial and error method to optimize the biasing potential values.
One more possibility in the direction of method development could be to extend this
method for other types of biomolecules by identifying the most important variables that
control the biomolecule structure and to construct an appropriate biasing potential. For
example, this method can be applied for nucleic acids by constructing a specific biasing
potential for nucleic acids dihedrals.
Enhanched sampling of side chain conformations are often necessary to refine
protein-protein interfaces and also for the refinement of docked protein complex. It is
straight forward to extend BP-Rex MD method to include enhanced conformational
transition of side chain conformations by constructing an appropriate biasing potential
for amino acid side chain transitions.
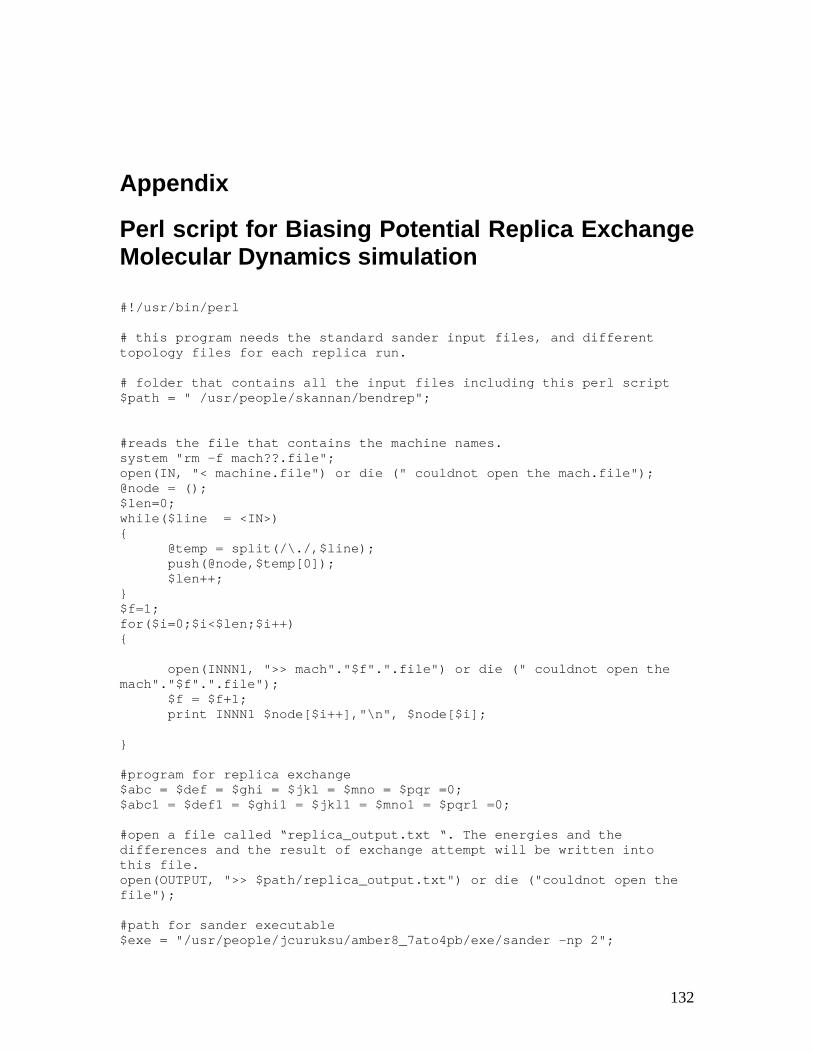
132
Appendix Perl script for Biasing Potential Replica Exchange Molecular Dynamics simulation #!/usr/bin/perl # this program needs the standard sander input files, and different topology files for each replica run. # folder that contains all the input files including this perl script $path = " /usr/people/skannan/bendrep"; #reads the file that contains the machine names. system "rm -f mach??.file"; open(IN, "< machine.file") or die (" couldnot open the mach.file"); @node = (); $len=0; while($line = <IN>) { @temp = split(/\./,$line); push(@node,$temp[0]); $len++; } $f=1; for($i=0;$i<$len;$i++) { open(INNN1, ">> mach"."$f".".file") or die (" couldnot open the mach"."$f".".file"); $f = $f+1; print INNN1 $node[$i++],"\n", $node[$i]; } #program for replica exchange $abc = $def = $ghi = $jkl = $mno = $pqr =0; $abc1 = $def1 = $ghi1 = $jkl1 = $mno1 = $pqr1 =0; #open a file called “replica_output.txt “. The energies and the differences and the result of exchange attempt will be written into this file. open(OUTPUT, ">> $path/replica_output.txt") or die ("couldnot open the file"); #path for sander executable $exe = "/usr/people/jcuruksu/amber8_7ato4pb/exe/sander -np 2";

133
#path for mpi executable $mpi = "/usr/people/mzacharias/mpich-1.2.5..10/bin/mpirun "; #the number of replicas; $rep = 5; #number of exchanges $exchng = 5; $count = 0; $clust=0; #loop to start the sander program while($count < $exchng ) { $clust=0; #login into each machine and start the sander program there for($sim=1;$sim<$rep+1;$sim++) { chomp($node[$clust]); unless (defined($pid[$sim] = fork)) { die " connot fork" ; } unless($pid[$sim]) { $bin = " ssh $node[$clust] $mpi -machinefile $path/mach"."$sim".".file $exe -O -i $path/md.in -p $path/pa"."$sim"."5.top -c $path/og"."$sim"."_"."$rep".".crd -o $path/og"."$sim"."_"."$rep".".out -r $path/"."$sim"."_"."$rep".".crd "; #print $bin, "\n"; exec " $bin "; exit; } $clust = $clust+2; } #wait for all the sander jobs to get over for($sim=1;$sim<$rep+1;$sim++) { waitpid($pid[$sim],0); } #print out the current simulation time $val = ($count*500)+500; print OUTPUT "time: \t\t ", $val,"\n"; #loop to convert the output coordinates into trajectory format and append it to previous frame. And also to save the output files for future use if necessary for($sim=1;$sim<$rep+1;$sim++) { $name = "$sim"."og_"."$rep".".trj"; system "perl crd2trj.pl $sim"."_"."$rep".".crd >> $name"; system " cat og"."$sim"."_"."$rep".".out >> o"."$sim"."_"."$rep".".out"; }
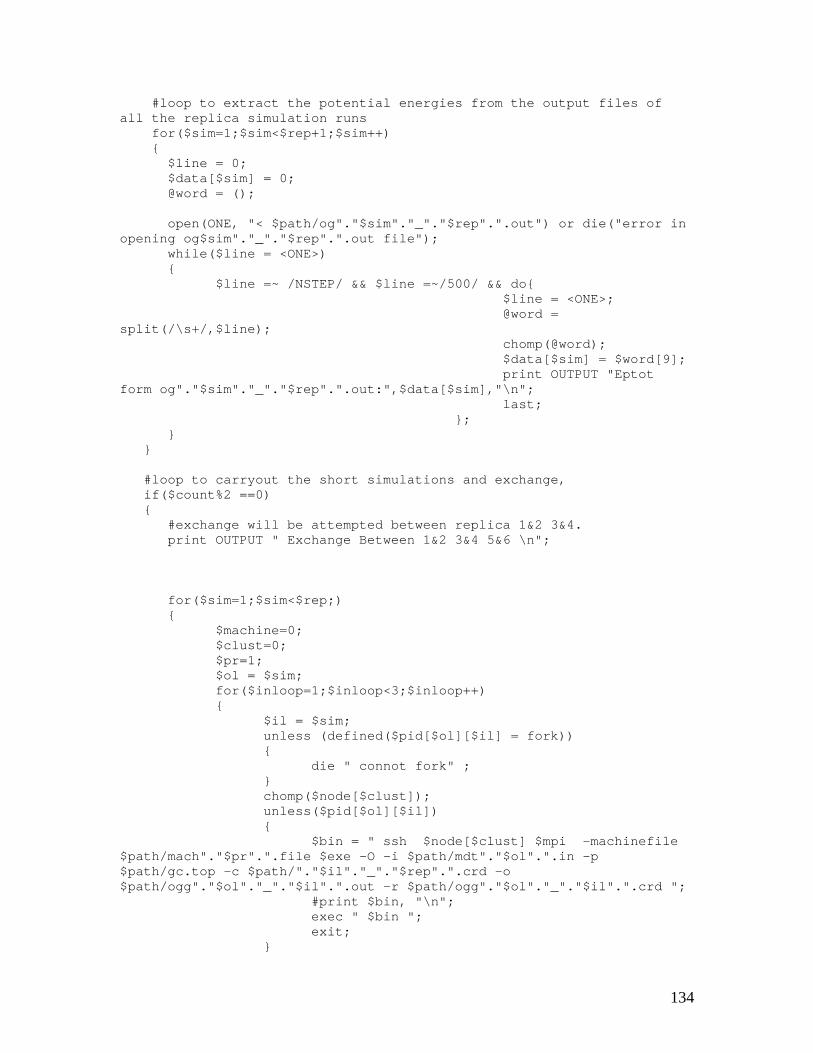
134
#loop to extract the potential energies from the output files of all the replica simulation runs for($sim=1;$sim<$rep+1;$sim++) { $line = 0; $data[$sim] = 0; @word = (); open(ONE, "< $path/og"."$sim"."_"."$rep".".out") or die("error in opening og$sim"."_"."$rep".".out file"); while($line = <ONE>) { $line =~ /NSTEP/ && $line =~/500/ && do{ $line = <ONE>; @word = split(/\s+/,$line); chomp(@word); $data[$sim] = $word[9]; print OUTPUT "Eptot form og"."$sim"."_"."$rep".".out:",$data[$sim],"\n"; last; }; } } #loop to carryout the short simulations and exchange, if($count%2 ==0) { #exchange will be attempted between replica 1&2 3&4. print OUTPUT " Exchange Between 1&2 3&4 5&6 \n"; for($sim=1;$sim<$rep;) { $machine=0; $clust=0; $pr=1; $ol = $sim; for($inloop=1;$inloop<3;$inloop++) { $il = $sim; unless (defined($pid[$ol][$il] = fork)) { die " connot fork" ; } chomp($node[$clust]); unless($pid[$ol][$il]) { $bin = " ssh $node[$clust] $mpi -machinefile $path/mach"."$pr".".file $exe -O -i $path/mdt"."$ol".".in -p $path/gc.top -c $path/"."$il"."_"."$rep".".crd -o $path/ogg"."$ol"."_"."$il".".out -r $path/ogg"."$ol"."_"."$il".".crd "; #print $bin, "\n"; exec " $bin "; exit; }
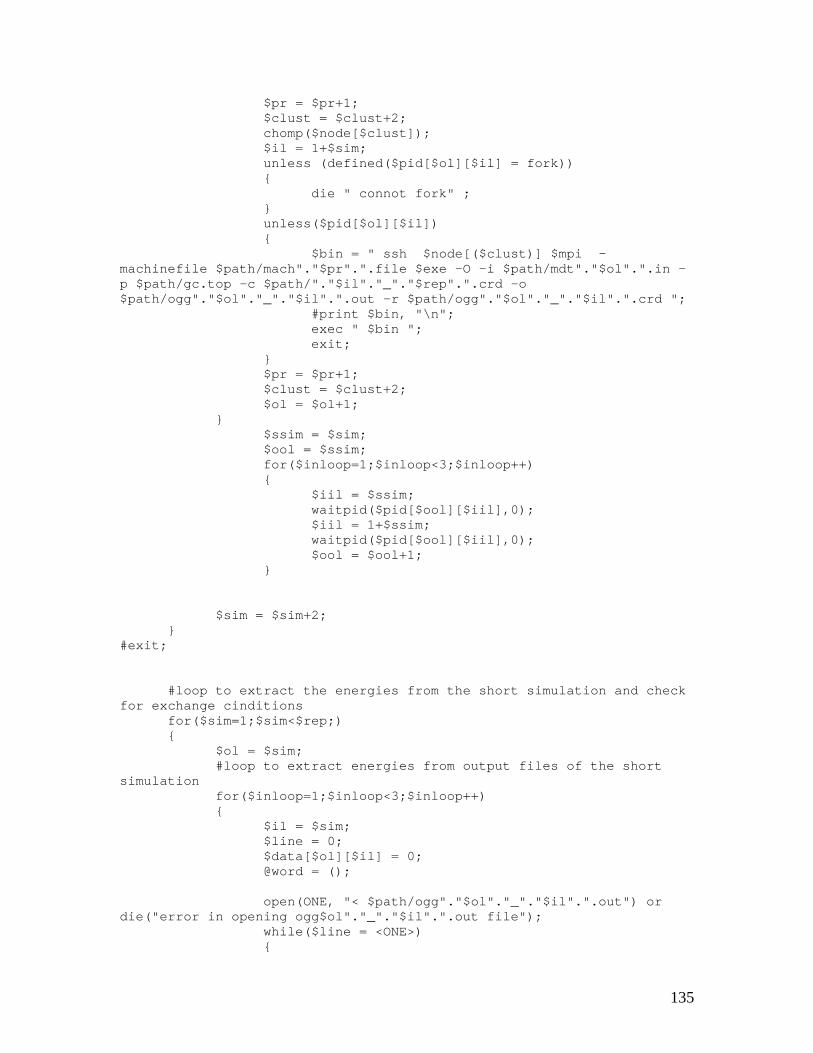
135
$pr = $pr+1; $clust = $clust+2; chomp($node[$clust]); $il = 1+$sim; unless (defined($pid[$ol][$il] = fork)) { die " connot fork" ; } unless($pid[$ol][$il]) { $bin = " ssh $node[($clust)] $mpi -machinefile $path/mach"."$pr".".file $exe -O -i $path/mdt"."$ol".".in -p $path/gc.top -c $path/"."$il"."_"."$rep".".crd -o $path/ogg"."$ol"."_"."$il".".out -r $path/ogg"."$ol"."_"."$il".".crd "; #print $bin, "\n"; exec " $bin "; exit; } $pr = $pr+1; $clust = $clust+2; $ol = $ol+1; } $ssim = $sim; $ool = $ssim; for($inloop=1;$inloop<3;$inloop++) { $iil = $ssim; waitpid($pid[$ool][$iil],0); $iil = 1+$ssim; waitpid($pid[$ool][$iil],0); $ool = $ool+1; } $sim = $sim+2; } #exit; #loop to extract the energies from the short simulation and check for exchange cinditions for($sim=1;$sim<$rep;) { $ol = $sim; #loop to extract energies from output files of the short simulation for($inloop=1;$inloop<3;$inloop++) { $il = $sim; $line = 0; $data[$ol][$il] = 0; @word = (); open(ONE, "< $path/ogg"."$ol"."_"."$il".".out") or die("error in opening ogg$ol"."_"."$il".".out file"); while($line = <ONE>) {

136
$line =~ /NSTEP/ && $line =~/1/ && do{ $line = <ONE>; @word = split(/\s+/,$line); chomp(@word); $data[$ol][$il] = $word[9]; print OUTPUT "Eptot form ogg"."$ol"."_"."$il".".out:",$data[$ol][$il],"\n"; last; }; } close(ONE);$line=0;@word=(); $il = 1+$sim; open(ONE, "< $path/ogg"."$ol"."_"."$il".".out") or die("error in opening ogg$ol"."_"."$il".".out file"); while($line = <ONE>) { $line =~ /NSTEP/ && $line =~/1/ && do{ $line = <ONE>; @word = split(/\s+/,$line); chomp(@word); $data[$ol][$il] = $word[9]; print OUTPUT "Eptot form ogg"."$ol"."_"."$il".".out:",$data[$ol][$il],"\n"; last; }; } #system "cat s_"."$ol"."_noe.dat >> "."$ol"."_"."$il"."_noe.dat"; #system "rm -f s_"."$ol"."_noe.dat"; $ol = $ol+1; } $sim = $sim+2; } #loop to compare the energies and make the exchange for($sim=1;$sim<$rep;) { $ol = $sim; $il = $sim; $k = $il+1; $diff[$il][$k] = $data[$il][$k] - $data[$il][$il]; $diff[$k][$il] = $data[$k][$k] - $data[$k][$il]; #$r = 1.9877; #$t = 300; $RT = 0.59616950; $differ[$il][$k] =$diff[$il][$k] - $diff[$k][$il]; $div[$il][$k] = $differ[$il][$k]/$RT; $bol[$il][$k] = exp(-$div[$il][$k]); $eval[$il][$k] = rand 1; print OUTPUT "diff"."$il"."$k".": $differ[$il][$k] \n"; print OUTPUT "bol"."$il"."$k".": $bol[$il][$k] \n"; print OUTPUT "random no"."$il"."$k"." : $eval[$il][$k] \n";

137
if($bol[$il][$k] < $eval[$il][$k]) { system "mv -f "."$il"."_"."$rep".".crd og"."$il"."_"."$rep".".crd"; system "mv -f "."$k"."_"."$rep".".crd og"."$k"."_"."$rep".".crd"; print OUTPUT "$il"."$k"." not xchangd \n"; } else { system "mv -f "."$il"."_"."$rep".".crd og"."$k"."_"."$rep".".crd"; system "mv -f "."$k"."_"."$rep".".crd og"."$il"."_"."$rep".".crd"; print OUTPUT "$il"."$k"." not xchangd \n"; } $sim = $sim+2; } $k = $k+1; system "mv -f "."$k"."_"."$rep".".crd og"."$k"."_"."$rep".".crd"; } else { #exchange will be attempted between replica 2&3 4&5.
print OUTPUT " Exchange Between 2&3 4&5 6&7 \n"; for($sim=2;$sim<$rep;) { $machine=0; $clust=0; $pr =1; $ol = $sim; for($inloop=1;$inloop<3;$inloop++) { $il = $sim; unless (defined($pid[$ol][$il] = fork)) { die " connot fork" ; } chomp($node[$clust]); unless($pid[$ol][$il]) { $bin = " rsh -n $node[$clust] $mpi -machinefile $path/mach"."$pr".".file $exe -O -i $path/mdt"."$ol".".in -p $path/gc.top -c $path/"."$il"."_"."$rep".".crd -o $path/ogg"."$ol"."_"."$il".".out -r $path/ogg"."$ol"."_"."$il".".crd "; print $bin, "\n"; exec " $bin "; exit; } $pr = $pr+1; $clust = $clust+2;

138
chomp($node[$clust]); $il = 1+$sim; unless (defined($pid[$ol][$il] = fork)) { die " connot fork" ; } unless($pid[$ol][$il]) { $bin = " rsh -n $node[($clust)] $mpi -machinefile $path/mach"."$pr".".file $exe -O -i $path/mdt"."$ol".".in -p $path/gc.top -c $path/"."$il"."_"."$rep".".crd -o $path/ogg"."$ol"."_"."$il".".out -r $path/ogg"."$ol"."_"."$il".".crd "; print $bin, "\n"; exec " $bin "; exit; } $pr = $pr+1; $clust = $clust+2; $ol = $ol+1; } $ssim = $sim; $ool = $ssim; for($inloop=1;$inloop<3;$inloop++) { $iil = $ssim; waitpid($pid[$ool][$iil],0); $iil = 1+$ssim; waitpid($pid[$ool][$iil],0); $ool = $ool+1; } $sim = $sim+2; } #exit; #$l = 1; for($sim=2;$sim<$rep;) { $ol = $sim; for($inloop=1;$inloop<3;$inloop++) { $il = $sim; $line = 0; $data[$ol][$il] = 0; @word = (); open(ONE, "< $path/ogg"."$ol"."_"."$il".".out") or die("error in opening ogg$ol"."_"."$il".".out file"); while($line = <ONE>) { $line =~ /NSTEP/ && $line =~/1/ && do{ $line = <ONE>;
139
@word = split(/\s+/,$line); chomp(@word); $data[$ol][$il] = $word[9]; print OUTPUT "Eptot form ogg"."$ol"."_"."$il".".out:",$data[$ol][$il],"\n"; last; }; } close(ONE);$line=0;@word=(); $il = 1+$sim; open(ONE, "< $path/ogg"."$ol"."_"."$il".".out") or die("error in opening ogg$ol"."_"."$il".".out file"); while($line = <ONE>) { $line =~ /NSTEP/ && $line =~/1/ && do{ $line = <ONE>; @word = split(/\s+/,$line); chomp(@word); $data[$ol][$il] = $word[9]; print OUTPUT "Eptot form ogg"."$ol"."_"."$il".".out:",$data[$ol][$il],"\n"; last; }; } #system "cat s_"."$ol"."_noe.dat >> "."$ol"."_"."$il"."_noe.dat"; #system "rm -f s_"."$ol"."_noe.dat"; $ol = $ol+1; } $sim = $sim+2; } for($sim=2;$sim<$rep;) { $ol = $sim; $il = $sim; $k = $il+1; $diff[$il][$k] = $data[$il][$k] - $data[$il][$il]; $diff[$k][$il] = $data[$k][$k] - $data[$k][$il]; #$r = 1.9877; #$t = 300; $RT = 0.59616950; $differ[$il][$k] =$diff[$il][$k] - $diff[$k][$il]; $div[$il][$k] = $differ[$il][$k]/$RT; $bol[$il][$k] = exp(-$div[$il][$k]); $eval[$il][$k] = rand 1; print OUTPUT "diff"."$il"."$k".": $diff[$il][$k] \n"; print OUTPUT "bol"."$il"."$k".": $bol[$il][$k] \n"; print OUTPUT "random no"."$il"."$k"." : $eval[$il][$k] \n"; if($bol[$il][$k] < $eval[$il][$k]) {
140
system "mv -f "."$il"."_"."$rep".".crd og"."$il"."_"."$rep".".crd"; system "mv -f "."$k"."_"."$rep".".crd og"."$k"."_"."$rep".".crd"; print OUTPUT "$il"."$k"." not xchangd \n"; } else { system "mv -f "."$il"."_"."$rep".".crd og"."$k"."_"."$rep".".crd"; system "mv -f "."$k"."_"."$rep".".crd og"."$il"."_"."$rep".".crd"; print OUTPUT "$il"."$k"." not xchangd \n"; } $sim = $sim+2; } $k = 1; system "mv -f "."$k"."_"."$rep".".crd og"."$k"."_"."$rep".".crd"; } $count = $count+1; }