applications of artificial intelligence in e-commerce and
TRANSCRIPT

HAL Id: tel-01892576https://tel.archives-ouvertes.fr/tel-01892576
Submitted on 10 Oct 2018
HAL is a multi-disciplinary open accessarchive for the deposit and dissemination of sci-entific research documents, whether they are pub-lished or not. The documents may come fromteaching and research institutions in France orabroad, or from public or private research centers.
L’archive ouverte pluridisciplinaire HAL, estdestinée au dépôt et à la diffusion de documentsscientifiques de niveau recherche, publiés ou non,émanant des établissements d’enseignement et derecherche français ou étrangers, des laboratoirespublics ou privés.
Applications of artificial intelligence in e-commerce andfinanceYang Jiao
To cite this version:Yang Jiao. Applications of artificial intelligence in e-commerce and finance. Artificial Intelligence[cs.AI]. Institut National des Télécommunications, 2018. English. �NNT : 2018TELE0002�. �tel-01892576�

Spécialité : Informatique
Ecole doctorale : Informatique, Télécommunications et Electronique de Paris
Présentée par
Yang JIAO
Pour obtenir le grade de DOCTEUR DE TELECOM SUDPARIS
Applications of Artificial Intelligence in E-Commerce and Finance
Soutenue le 7 Septembre 2018 Devant le jury composé de : Directeur de thèse : Walid BENAMEUR - Professeur – Télécom SudParis Encadrant de thèse : Jérémie JAKUBOWICZ – Maître de conférence – Télécom SudParis Rapporteurs : Arthur CHARPENTIER – Professeur – Université de Rennes Romuald ELIE – Professeur – Université Paris-Est Examinateurs : Bruno GOUTORBE – Chercheur – Cdiscount.com Amel BOUZEGHOUB – Professeure – Télécom SudParis N° NNT : 2018TELE0002


“I visualize a time when we will be to robots what dogs are to humans, and I’m rooting for
the machines”
Claude Shannon

CHAPITRE 1
REMERCIEMENTS
A l’issue de la redaction de cette these, je suis convaincu que la these est loin d’etre un travail
solitaire. En effet, je n’aurais jamais pu realiser ce travail doctoral sans le soutien d’un grand
nombre de personnes.
En premier lieu, je tiens a exprimer mes remerciements les plus sinceres a mes directeurs de
these monsieur Jeremie Jakubowicz et monsieur Matthieu Cornec, pour m’avoir encadre sur ce
sujet de recherche, pour leur disponibilite et pour leur patience et gentillesse tout au long de ce
parcours.
Je souhaiterais aussi exprimer ma plus grande gratitude a monsieur Bruno Goutorbe pour
m’avoir guide sur plusieurs projets que j’ai effectues au sein de Cdiscount ainsi que ses multiples
encouragements, notamment lors de la phase finale de cette redaction.
Je remercie egalement mes chers collegues a Cdiscount pour leur accueil chaleureux a chaque
fois que j’ai sollicite leur aide ainsi que leur bonne humeur et des discussions tres interessantes
au tour de la machine cafe : Christelle Grauer, Romain Savidan, Maxime Danini, Yoann Diguet,
Philippe Bruneau, Maxime Danini, Maxime Blanchet, Pierre Deneuville, Sebastian Romano,
Thomas Lentali, Thomas Cozien, Michel Povlovitsch Seixas, Pierre Anquetil, Damien Garaud,
Stefan Duprey, Pierre Anquetil, Aziza Echaıb, Marjolaine Didier, Remy Baudou,Nicolas Per-
ekrestow, Xiaolei Zheng, Emmanuel Gosse, Louis Albert, Charles-Antoine Souplet.
J’ai suivi des seminaires varies a l’Universite de Bordeaux dont j’ai beaucoup appris ainsi
je tiens a remercier les organisateurs pour ces evenements tres educatifs : Adrian Richou, Boris
Detienne et Alexandre Genadot.
Mes remerciements vont aussi a Nabil Abdellaoui, Sameh Faidi, et Arto Antikainen pour
notre participation ensemble aux concours data science et pour le brainstorming que nous avons
mene. Ces travaux collaboratifs m’ont permis de progresser enormement et d’ouvrir des nouvelles
4

REMERCIEMENTS
perspectives de la science de donnee. Je remercie aussi Axel Reichwein, Paul Lhoste, Jingyi Wang,
Vincent Testet, Giorgio Bona, Thierry Silbermann et Pablo Raman Sanchez Chisvert pour notre
succes d’equipe au Workshop d’Airbus et pour nos discussions passionnantes.
Je remercie enfin mes amis et ma famille qui m’ont beaucoup soutenus pendant la these.
Sans eux, rien n’aurait ete possible.
5

Resume
L’Intelligence Artificielle est presente dans tous les aspects de notre vie a l’ere du Big Data. Elle
a entraıne des changements revolutionnaires dans divers secteurs, dont le commerce electronique
et la finance. Dans cette these, nous presentons quatre applications de l’IA qui ameliorent les
biens et services existants, permettent l’automatisation et augmentent considerablement l’effi-
cacite de nombreuses taches dans les deux domaines. Tout d’abord, nous ameliorons le service
de recherche de produits offert par la plupart des sites de commerce electronique en utilisant
un nouveau systeme de ponderation des termes pour mieux evaluer l’importance des termes
dans une requete de recherche. Ensuite, nous construisons un modele predictif sur les ventes
quotidiennes en utilisant une approche de prevision des series temporelles et tirons parti des
resultats prevus pour classer les resultats de recherche de produits afin de maximiser les revenus
d’une entreprise. Ensuite, nous proposons la difficulte de la classification des produits en ligne
et analysons les solutions gagnantes, consistant en des algorithmes de classification a la pointe
de la technologie, sur notre ensemble de donnees reelles. Enfin, nous combinons les competences
acquises precedemment a partir de la prediction et de la classification des ventes basees sur les
series temporelles pour predire l’une des series temporelles les plus difficiles mais aussi les plus
attrayantes : le stock. Nous effectuons une etude approfondie sur chaque titre de l’indice S&P
500 en utilisant quatre algorithmes de classification a la pointe de la technologie et nous publions
des resultats tres prometteurs.
5

Abstract
Artificial Intelligence has penetrated into every aspect of our lives in this era of Big Data. It
has brought revolutionary changes upon various sectors including e-commerce and finance. In
this thesis, we present four applications of AI which improve existing goods and services, en-
ables automation and greatly increase the efficiency of many tasks in both domains. Firstly,
we improve the product search service offered by most e-commerce sites by using a novel term
weighting scheme to better assess term importance within a search query. Then we build a pre-
dictive model on daily sales using a time series forecasting approach and leverage the predicted
results to rank product search results in order to maximize the revenue of a company. Next,
we present the product categorization challenge we hold online and analyze the winning solu-
tions, consisting of the state-of-the-art classification algorithms, on our real dataset. Finally, we
combine skills acquired previously from time series based sales prediction and classification to
predict one of the most difficult but also the most attractive time series: stock. We perform an
extensive study on every single stocks of S&P 500 index using four state-of-the-art classification
algorithms and report very promising results.
6

Dedicated to my parents
and my wife

TABLE OF CONTENTS
1 Remerciements 4
Resume 5
Abstract 6
List of Figures 9
List of Tables 11
2 Introduction 14
2.1 Background and motivations . . . . . . . . . . . . . . . . . . . . . . . . . . . . . 15
2.2 Organization of this thesis . . . . . . . . . . . . . . . . . . . . . . . . . . . . . . . 18
3 Literature review 19
3.1 Semantic search and term weighting . . . . . . . . . . . . . . . . . . . . . . . . . 20
3.2 Search result ranking . . . . . . . . . . . . . . . . . . . . . . . . . . . . . . . . . . 21
3.3 Product categorization . . . . . . . . . . . . . . . . . . . . . . . . . . . . . . . . . 22
3.4 Stock prediction . . . . . . . . . . . . . . . . . . . . . . . . . . . . . . . . . . . . 23
4 An entropy-based term weighting scheme and its application in e-commerce
search engines 25
4.1 Introduction . . . . . . . . . . . . . . . . . . . . . . . . . . . . . . . . . . . . . . . 27
4.2 Problem framework . . . . . . . . . . . . . . . . . . . . . . . . . . . . . . . . . . . 28
4.2.1 Purchase data description . . . . . . . . . . . . . . . . . . . . . . . . . . . 28
4.2.2 Ranking with purchase data using similar queries . . . . . . . . . . . . . . 29
4.3 Our entropy based term weighting scheme . . . . . . . . . . . . . . . . . . . . . . 30
7

TABLE OF CONTENTS
4.3.1 Importance of a term . . . . . . . . . . . . . . . . . . . . . . . . . . . . . 30
4.3.2 Mathematical framework of entropy based term weighting . . . . . . . . . 31
4.4 Application of the proposed scheme and experimental evaluation . . . . . . . . . 33
4.4.1 Entropy-based query similarity metrics . . . . . . . . . . . . . . . . . . . . 33
4.4.2 Experiment setting . . . . . . . . . . . . . . . . . . . . . . . . . . . . . . . 34
4.4.3 Evaluation metric . . . . . . . . . . . . . . . . . . . . . . . . . . . . . . . 34
4.4.4 Results and analysis . . . . . . . . . . . . . . . . . . . . . . . . . . . . . . 34
4.5 Conclusion and future work . . . . . . . . . . . . . . . . . . . . . . . . . . . . . . 36
5 Reranking strategies based on fine-grained business user events benchmarked
on a large e-commerce data set 38
5.1 Introduction . . . . . . . . . . . . . . . . . . . . . . . . . . . . . . . . . . . . . . . 40
5.2 Data set . . . . . . . . . . . . . . . . . . . . . . . . . . . . . . . . . . . . . . . . . 41
5.3 Reranking strategies . . . . . . . . . . . . . . . . . . . . . . . . . . . . . . . . . . 42
5.3.1 Reranking by multivariate auto-regression . . . . . . . . . . . . . . . . . . 44
5.3.2 Granger causality test . . . . . . . . . . . . . . . . . . . . . . . . . . . . . 45
5.4 Evaluation metric . . . . . . . . . . . . . . . . . . . . . . . . . . . . . . . . . . . . 46
5.5 Results and discussion . . . . . . . . . . . . . . . . . . . . . . . . . . . . . . . . . 47
5.5.1 Analysis of the coefficients of the VAR model . . . . . . . . . . . . . . . . 48
5.6 Conclusion . . . . . . . . . . . . . . . . . . . . . . . . . . . . . . . . . . . . . . . 50
6 The Cdiscount 2015 datascience.net challenge: a large e-commerce data set
released to benchmark classification methods 51
6.1 Introduction . . . . . . . . . . . . . . . . . . . . . . . . . . . . . . . . . . . . . . . 53
6.2 Data set . . . . . . . . . . . . . . . . . . . . . . . . . . . . . . . . . . . . . . . . . 53
6.3 Description of the challenge . . . . . . . . . . . . . . . . . . . . . . . . . . . . . . 56
6.4 Analysis of the winning contributions . . . . . . . . . . . . . . . . . . . . . . . . . 57
6.5 Teaching materials . . . . . . . . . . . . . . . . . . . . . . . . . . . . . . . . . . . 60
6.6 Conclusion . . . . . . . . . . . . . . . . . . . . . . . . . . . . . . . . . . . . . . . 60
7 Predicting stock movement direction with machine learning: an extensive
study on S&P 500 stocks 62
7.1 Introduction . . . . . . . . . . . . . . . . . . . . . . . . . . . . . . . . . . . . . . . 64
7.2 Related Works . . . . . . . . . . . . . . . . . . . . . . . . . . . . . . . . . . . . . 66
7.3 Data Description . . . . . . . . . . . . . . . . . . . . . . . . . . . . . . . . . . . . 67
7.4 Problem Formulation . . . . . . . . . . . . . . . . . . . . . . . . . . . . . . . . . . 68
8

7.5 Time Series Feature Engineering . . . . . . . . . . . . . . . . . . . . . . . . . . . 69
7.6 Experiment Setup . . . . . . . . . . . . . . . . . . . . . . . . . . . . . . . . . . . 71
7.6.1 Data Pipeline . . . . . . . . . . . . . . . . . . . . . . . . . . . . . . . . . . 71
7.6.2 Validation Scheme . . . . . . . . . . . . . . . . . . . . . . . . . . . . . . . 71
7.7 Results and Analysis . . . . . . . . . . . . . . . . . . . . . . . . . . . . . . . . . . 73
7.7.1 Whether stocks are self predictable? . . . . . . . . . . . . . . . . . . . . . 73
7.7.2 What features can we use to predict stock movement direction? . . . . . . 75
7.7.3 What is the best model for stock movement direction prediction? . . . . . 76
7.7.4 What is the best validation scheme? . . . . . . . . . . . . . . . . . . . . . 77
7.7.5 Are there stocks more easily predictable than others? . . . . . . . . . . . 77
7.7.6 Is it possible to predict the S&P 500 index movement direction? . . . . . 79
7.8 Conlcusion and future directions . . . . . . . . . . . . . . . . . . . . . . . . . . . 79
8 Conclusion and Future Works 81
8.1 Summary . . . . . . . . . . . . . . . . . . . . . . . . . . . . . . . . . . . . . . . . 82
8.2 Future works . . . . . . . . . . . . . . . . . . . . . . . . . . . . . . . . . . . . . . 84
Bibliography 87
9

LIST OF FIGURES
2.1 Some onsite product search engines in French market 1 . . . . . . . . . . . . . . . 16
2.2 Hedge funds performance comparison. Source: Eurekahedge . . . . . . . . . . . . 18
4.1 Term purchase distributions of ‘hp‘ and “3050a”. On the one hand, the purchase
distribution of “hp” is extremely dispersed, which is indicated by the diversity of
colors in the pie chart (a). Hence a high entropy is assigned to “hp”. “3050a”,
on the other hand, has a relatively concentrated purchase distribution (b), which
explains its low entropy value. . . . . . . . . . . . . . . . . . . . . . . . . . . . . . 32
4.2 Performance comparison of entropy-based weighting and tf-idf weighting using
different basic similarity metrics. X-axis is the number of allowed recommen-
dations, corresponding to the parameter r of (4.7). Y-axis is the Precision@r
value. . . . . . . . . . . . . . . . . . . . . . . . . . . . . . . . . . . . . . . . . . . 35
5.1 (a) Distribution of the purchases by query; (b) cumulative percentage of purchases
associated with queries (queries generating most purchases first). . . . . . . . . . 42
5.2 Examples of times series of number of clicks, add-to-basket and purchases per day
related to two different products following the user query ‘printer’. . . . . . . . . 43
5.3 Average percent revenue generated by the top k products (relative to the list of
28 products) of each reranking algorithm. . . . . . . . . . . . . . . . . . . . . . . 48
5.4 Normalized coefficients of the VAR model related to the number of purchases,
averaged over pairs of {query,product} and testing days, function of time lag.
Shaded areas show one standard error around the mean. . . . . . . . . . . . . . 49
10
LIST OF FIGURES
6.1 (a) Size distribution of the categories: size corresponds to the number of products
belonging to a category (e.g., the point shown by an arrow indicates that there are
slightly more than 100 categories which contain only 2 products). (b) Cumulative
percentage of products held by the categories, sorted by the number of products
they contain. (c) Recurrence distribution of the brands: recurrence corresponds
to the number of products associated with a brand (e.g., the point shown by an
arrow indicates that more than 3,000 brands are represented by a single product
in the catalogue). (d) Recurrence distribution of the words of the vocabulary
used in descriptions: recurrence corresponds to the number of products wherein
a word of the vocabulary appears (e.g., the point shown by an arrow indicates
that about 105 words of the vocabulary appear in exactly 4 distinct products). . 55
6.2 (a) Recurrence distribution of the brands: recurrence corresponds to the num-
ber of distinct categories containing at least one product associated with a given
brand. (b) Recurrence distribution of the words of the vocabulary used in product
descriptions: recurrence corresponds to the number of distinct categories contain-
ing at least one product wherein a given word of the vocabulary appears. . . . . 56
6.3 Size distribution of the categories in the testing set: size corresponds to the
number of products belonging to a category. . . . . . . . . . . . . . . . . . . . . . 57
7.1 Daily return of Apple, Amazon and Microsoft . . . . . . . . . . . . . . . . . . . . 68
7.2 Data pipeline . . . . . . . . . . . . . . . . . . . . . . . . . . . . . . . . . . . . . . 72
7.3 Sequential split scheme. . . . . . . . . . . . . . . . . . . . . . . . . . . . . . . . . 73
7.4 Cross Validation Split. . . . . . . . . . . . . . . . . . . . . . . . . . . . . . . . . . 73
7.5 Train-Validation Split. . . . . . . . . . . . . . . . . . . . . . . . . . . . . . . . . . 73
7.6 Histogram of AUC using Random Forest . . . . . . . . . . . . . . . . . . . . . . . 74
7.7 Histogram of AUC using Random Forest using different index features . . . . . . 76
11

LIST OF TABLES
4.1 A sample of purchase data log . . . . . . . . . . . . . . . . . . . . . . . . . . . . . 31
4.2 Purchase distributions of terms . . . . . . . . . . . . . . . . . . . . . . . . . . . . 31
4.3 Examples of term entropy . . . . . . . . . . . . . . . . . . . . . . . . . . . . . . . 36
4.4 Examples of entropy-based term weighting with λ = 2 and tf-idf term weighting.
Both schemes are normalized on the weight of “sony” in order to have a relative
view of term importance. . . . . . . . . . . . . . . . . . . . . . . . . . . . . . . . 36
4.5 Similarities with “sony black ps4” on different metrics . . . . . . . . . . . . . . . 36
5.1 Summary of the final data used in this study . . . . . . . . . . . . . . . . . . . . 42
5.2 Evaluation scores of the reranking algorithms according to the revenue@k metric. 47
6.1 Fields of the data set and examples of products (with associated image). Note
that the description can end with an ellipsis. . . . . . . . . . . . . . . . . . . . . 54
6.2 Key numbers on the data set. . . . . . . . . . . . . . . . . . . . . . . . . . . . . . 54
6.3 Summary of the winning contributions. . . . . . . . . . . . . . . . . . . . . . . . 58
7.1 Data summary . . . . . . . . . . . . . . . . . . . . . . . . . . . . . . . . . . . . . 67
7.2 8 global market index used as environment indicators . . . . . . . . . . . . . . . . 68
7.3 Apple (APPL)’s lag features with step 1 to 3 . . . . . . . . . . . . . . . . . . . . 70
7.4 Prediction evaluation of 483 stocks using random forest with sequential validation
scheme. . . . . . . . . . . . . . . . . . . . . . . . . . . . . . . . . . . . . . . . . . 74
7.5 Prediction evaluation of 483 stocks using random forest with sequential validation
scheme. . . . . . . . . . . . . . . . . . . . . . . . . . . . . . . . . . . . . . . . . . 75
7.6 Grid Searched Model Parameters . . . . . . . . . . . . . . . . . . . . . . . . . . . 76
7.7 Prediction performance on different classification models. . . . . . . . . . . . . . 77
12

LIST OF TABLES
7.8 Validation Schemes Comparison . . . . . . . . . . . . . . . . . . . . . . . . . . . . 77
7.9 Prediction performance of top 10 stocks . . . . . . . . . . . . . . . . . . . . . . . 78
7.10 Evaluations on selected top 10 stocks using logistic regression . . . . . . . . . . . 78
7.11 Evaluations on selected top 10 stocks using logistic regression . . . . . . . . . . . 78
7.12 Prediction performance on different classification models. . . . . . . . . . . . . . 79
13

CHAPTER 2
INTRODUCTION
Can machines think?
Alan Turing
2.1 Background and motivations . . . . . . . . . . . . . . . . . . . . . . . . . . . . . 15
2.2 Organization of this thesis . . . . . . . . . . . . . . . . . . . . . . . . . . . . . . . 18
14

INTRODUCTION
2.1 Background and motivations
Artificial Intelligence promises to improve existing goods and services, and, by enabling
automation of many tasks, to greatly increase the efficiency with which they are produced.
Although “AI is still in its infancy” 1, there seems to be a significant amount of entry and
experimentation across numerous sectors. Within the business sphere, AI is poised to have a
transformational impact. Although it has already been deployed in thousands of companies
around the globe, most big opportunities have not yet been tapped. According to a study
conducted by International Data Corporation 2, the industries that will invest the most in AI are
banking and retail. Therefore, it is of particular interest to conduct studies on AI applications in
those two industries, more specifically, in finance and e-commerce which are two most technology-
driven branches of both industries.
E-commerce, as a newcomer to the world, became possible only when the Internet opened to
commercial use in early 90s. However it rapidly revolutionized the traditional commerce tunnel
by allowing consumers to exchange goods and services with no barriers of time nor distance. Over
the past decade, it has rapidly grown enabling customers to purchase any product with a click
of a button. And nowadays, it has become an integral part our daily lives. In 2016, e-commerce
sales reached 1.86 trillion US dollars, accounted for 8.7 percent of all retail sales worldwide
and is projected to grow to 4.48 trillion US dollars in 2021, which represents 15.5 percent
of all retail sales 3. Nowadays, existing major platforms have evolved into large B2C and/or
C2C marketplace having large inventories with up to tens of millions of products. Therefore,
a key component for the success of such platforms is their ability to quickly and accurately
retrieve the desired products for the customers within such large inventory. Product search and
categorization, powered by AI, are two crucial services provided by these sites dealing with this
issue.
Search engines are essential for consumers to be able to make sense of these large collections of
products available online. The first stage in the consumer buying process is commonly recognized
to be that of the information search. The ability to collect product information and make
comparisons between the different product offerings from different providers, possibly across
national and currency boundaries, is often viewed as one of the main services offered by e-
commerce websites. Therefore, onsite product search engine has become a salient part for
most major e-commerce companies, as show in Figure 2.1 5. Major e-commerce website usually
provide users with a simple interface with a search bar inviting them to formulate queries using
1. https://drive.tech/en/stream-content/artificial-intelligence-is-still-in-its-infancy2. https://www.idc.com/getdoc.jsp?containerId=prUS418786163. https://www.statista.com/statistics/534123/e-commerce-share-of-retail-sales-worldwide/5. Screens captured on the 23rd June 2016
15

INTRODUCTION
(a) Amazon’s search engine
(b) Cdiscount’s search engine
(c) Darty’s search engine
(d) Fnac’s search engine
Figure 2.1 – Some onsite product search engines in French market 4
characteristics of the product they are interested in.
Despite of its importance to e-commerce sites, product search still has room for improvement.
It has been reported that there exists a mismatch between user issued queries and seller provided
product description where both use different terms to describe the same concepts (Li et al.,
2014; Nurmi et al., 2008). Thus, there is an urgent need for better semantic matching methods.
Moreover, product search is quite different from other entity finding task such like books, people,
groups etc. First, product search engines only operate within a single domain. Second, user
queries in product search consist of free-form text as opposed to the semi-structured queries
with additional type or relational constraints being used. Third, products are often associated
with significant amount of user data, such as purchase history and review, which could provide
additional information to the search algorithm.
Furthermore, products of e-commerce are generally organized into a hierarchical taxonomy
of multilevel hierarchical categories. Product classification is the task of automatically predict-
ing a taxonomy path for a product in a predefined taxonomy hierarchy. It is a backbone for
successful marketing and sale of products listed on several online stores like Amazon 6, eBay 7,
Cdiscount 8 etc. Since a large number of business users list their products and expect to find
buyers for their products, it is crucial that the products are listed in accurate categories. In
6. https://www.amazon.com/7. http://www.ebay.com/8. https://www.cdiscount.com/
16

INTRODUCTION
addition, it also plays a vital role in customer oriented services like search and recommenda-
tion. Description, title, images etc. are all useful sources to extract relevant features to classify
products. Major actors like Amazon, e-Bay, Cdiscount among others use different taxonomies
to organize products making it hard and labor-intensive for sellers to categorize the products.
Sometimes sellers are encouraged to find similar products to those they sell and adopt this cat-
egory to their products. However, this mechanism leads to two main problems: (1) it takes a
lot of time for a merchant to categorize items and (2) such taggings can be inconsistent since
different sellers might categorize the same product differently. To solve these problems, ideally
one would like to have an automated procedure, which can classify any product into a given
product taxonomy. Such process will both alleviate human labor and further improve product
categorization consistency in e-commerce websites.
As for the financial sector, it plays an important role on the economical and social organi-
zation of modern society and has existed since the dawn of human activity, much longer than
e-commerce has. Since Adam Smith, it has been governed by the Efficient Market Hypothesis -
“There is no other proposition in economics which has more solid empirical evidence supporting
it than the Efficient Market Hypothesis”, as said by Jensen (Jensen, 1978). However, for the
last decades, this concept has been challenged and the recent development of AI has irreversibly
broken the balance. Numerai 9, a hedge fund created in 2015, uses artificial intelligence to make
trading decisions. Instead of developing the algorithms themselves, they’ve outsourced the task
to thousands of anonymous data scientists, who compete to create the best algorithms and
win cryptocurrencies for their efforts. Many other companies like Numerai, also referred to as
FinTech, have emerged over the past few years and are having a huge impact on the finance in-
dustry. Meanwhile, with the large amount of transactional data publicly accessible, researchers
are also provided with this unique opportunity to compete with professional traders without
prior knowledge nor experience in trading.
As a result, driven by the irresistible temptation of potential benefits, financial giants such
as Goldman Sachs and many of the biggest hedge funds are all switching to AI-driven systems
that can foresee market trends and make trades better than humans 10. It has been reported
that Goldman Sachs’ US cash equities trading desk in its New York headquarters employed
600 traders in 2000, but today, only two remains with the machines doing the rest 11. From a
global scale, around 9% of all funds 12, managing $197 billion, rely now on AI models built by
9. https://numer.ai/10. https://fr.scribd.com/document/341347760/AI-REPORT-GOLDMAN-SACHS-FT-Artificial-Intelligence11. https://www.technologyreview.com/s/603431/as-goldman-embraces-automation-even-the-masters-of-the-
universe-are-threatened/12. https://www.wired.com/2016/01/the-rise-of-the-artificially-intelligent-hedge-fund/
17

INTRODUCTION
data scientists. A recent study performed by investment research firm Eurekahedge 13 tracked
the performance of 23 hedge funds utilizing AI from 2010-2016, finding that they outperformed
those managed by more traditional quants and generalized hedge funds, as shown in Figure 2.2.
Figure 2.2 – Hedge funds performance comparison. Source: Eurekahedge
Confronted with those aforementioned challenges, driven by the increasingly demand and
motivated by the power of AI, this thesis aims to reveal, in a preliminary way, the potential im-
pact of artificial intelligence in e-commerce and finance fields through a few concrete applications
and to shed some light on the future development of those fields in this era of Big Data.
2.2 Organization of this thesis
The rest of this thesis is organized as follows. Chapter 3 is focusing on reviewing related
works of topics discussed in this thesis, including semantic search, search result ranking, product
categorization and stock prediction. Chapter 3 - 6 present our work on addressing those afore-
mentioned four problems. In Chapter 3, we present a novel term weighting scheme to better
assess text similarity thus improve the product search accuracy. In Chapter 5, we use a time
series model to predict daily sales of products and used a search result reranking algorithm based
on sale prediction to increase the revenue of the company. In Chapter 6, we describe the product
categorization competition we held on an online platform and present some state-of-the-art solu-
tions regarding to our real-world problem. In Chapter 7, we follow our study on time series and
present our work on predicting S&P stocks using various machine learning algorithms. Finally,
Chapter 8 gives a summary of this thesis as well as discusses on directions for future work.
13. http://www.eurekahedge.com/
18

CHAPTER 3
LITERATURE REVIEW
A year spent in artificial intelligence
is enough to make one believe in God.
Alan Perlis
3.1 Semantic search and term weighting . . . . . . . . . . . . . . . . . . . . . . . . . 20
3.2 Search result ranking . . . . . . . . . . . . . . . . . . . . . . . . . . . . . . . . . . 21
3.3 Product categorization . . . . . . . . . . . . . . . . . . . . . . . . . . . . . . . . . 22
3.4 Stock prediction . . . . . . . . . . . . . . . . . . . . . . . . . . . . . . . . . . . . 23
19

LITERATURE REVIEW
3.1 Semantic search and term weighting
Today, Google and other search engines are smarter than ever and has penetrated into every
aspect of our lives. They look after tracks we leave on the Internet and use artificial intelligence
to process those data and rank information to our own taste. But the Internet was not always
so easy to navigate. There was a time when you had to know the exact wording of some content
to be able find it. Accurately interpreting the meaning of a search query has been and still is a
major topic for researchers in the field of semantic search.
Term weighting, by placing high weight on terms containing important information within a
search query, is one of the techniques to improve query interpretation accuracy, which, in return,
improves the over-all accuracy of a search engine. Term weighting is built upon the Vector Space
Model (Salton and McGill, 1986), where each document is represented by a bag of words vector
with one component in the vector for each dictionary term. The term weighting scheme tf-
idf (Sparck Jones, 2004) is a commonly used scheme in Information Retrieval. The “idf” part
of the scheme is based on the assumption that rare terms are more relevant than frequent ones.
Such assumption, although relevant in a large amount of situations (Roul et al., 2014; Paik, 2013),
does not always hold in the context of e-commerce. Therefore in Chapter 4, we present a novel
term weighting scheme tailored to the need of e-commerce companies. Our proposed scheme
is based on in-depth analysis of user purchase record. Using such user feedback information,
implicit or explicit, has been commonly acknowledged to be able to boost the performance of
search engines (Baeza-Yates and Maarek, 2012; Balakrishnan and Zhang, 2014). As a result,
various types of user-system interactions have been incorporated to improve search experience of
users (Ruthven, 2008). Query log is an important source of information as it provides signals of
what people are searching for and what they have found appealing through some user interaction
data. Various types of information revealing user interest can be exploited:
1. Time. The amount of time a user spend on a web page is often used to filter out irrelevant
clicks. It is reasonable to incorporate the dwell into account to better interpret events
like clicks (Kim et al., 2000; Kelly and Belkin, 2004; Ramachandran, 2005).
2. Click sequence. Clearly users do not click at random, but make a (somewhat) informed
choice. While click-through data is typically noisy and clicks are not “perfect” rele-
vance judgments, the clicks are likely to convey some information (Agichtein et al., 2006;
Veilumuthu and Ramachandran, 2007; Craswell and Szummer, 2007).
3. Click position. Clicks often suffer from positional bias where highly ranked items get
more clicks than poorly ranked ones regardless of their relevance to the given search.
Click position can thus help us to better interpret the click stream registered in the log
20

LITERATURE REVIEW
database (Joachims, 2002; Xue et al., 2004; Agichtein et al., 2006).
4. Click through rate (CTR). Click through rate is the ratio of total clicks over total im-
pressions. It’s often used in online advertisement domain to measure the effectiveness
of an ad. It’s also shown to be useful in log data analysis to improve search engine
performance (Ramachandran, 2005; McDonnell, 2014).
It is also worth noticing that these logs have also been shown to be useful for a multitude of
applications outside of search result ranking. For example, in spelling correction (Ahmad and
Kondrak, 2005), user behavior modeling (Dupret and Piwowarski, 2008; Guo et al., 2009; Wang
et al., 2010).
Furthermore, eye tracking data (Buscher et al., 2012; Cutrell and Guan, 2007; Li et al.,
2015; Buscher et al., 2010) and cursor movement (Chen et al., 2001; Rodden et al., 2008; White
and Buscher, 2012) constitute an additional information source to improve the search query
interpretation accuracy, thus user experience overall.
3.2 Search result ranking
While semantic search and term weighting are crucial for a search engine to understand
user’s search intention and retrieve accurately relevant information, how to rank those results
to better fit the business objective of a company is another essential issue, especially in the
domain of e-commerce. For example, when a user search for “Television”, it is indeed important
to correctly get all the televisions from our product database, but the issue of choosing which
one to be placed ahead has not been tackled yet while having a significant financial implication
for the business.
Some previous studies have already addressed such issue using click data and have shown
promising results in improving document search (Joachims et al., 2005; Agichtein et al., 2006)
and image search (Jain and Varma, 2011) performance. In Chapter 4, we exploit purchase data
improve product search performance via a collaborative filtering framework. We further, In
Chapter 5, propose a more sophisticated reranking strategy built upon the prediction on daily
sales of a product using time series prediction. However, when click data is largely used to
decide which search result to present, a particular attention needs to be paid on positional bias.
The probability of an item being clicked depends not only on its relevance, but on its position
in the results page. The effect of such bias has been confirmed in numerous papers (Craswell
et al., 2008; Yue et al., 2010). Moreover, input search query can often be ambiguous to some
extent, which makes the system even more difficult to infer the user’s search intention. In fact,
when the user’s actual information need is uncertain, relevance estimations may be misguided,
21

LITERATURE REVIEW
leading to a complete retrieval failure and the abandonment of the query (Chen and Karger,
2006), which is crucial for most business. How relevant the document is in light of the multiple
possible information needs underlying the search query (Sparck-Jones et al., 2007) and in light
of the other retrieved documents (Clarke et al., 2009) should also be taken into account for
ranking purpose. As for evaluating ranking performance, various metrics have been proposed.
Some commonly used ones include precision@k, MAP, NDCG (Wiener, 1956; Croft et al., 2010)
along with their derivatives (Liu et al., 2007; Voorhees, 2003). However they are not tailored to
our e-commerce scenario where the objective is often to maximize the revenue generated through
search engine. Therefore in our study, in Chapter 5 a novel metric revenue@k is proposed. It
measures average percent revenue generated by the top k displayed products.
3.3 Product categorization
Categorization or classification is the problem of identifying to which of a set of categories,
a new observation belongs, on the basis of a training set of data containing observations whose
category membership is known. The problem has been widely studied in the domain of data
science and artificial intelligence and has many applications already changing our daily lives,
such as email spam classification (Pantel et al., 1998; Blanzieri and Bryl, 2008; Yu and Xu, 2008)
and disease prediction (Cruz and Wishart, 2006; Kaundal et al., 2006; Chen et al., 2017).
On-line retailers are also interested in such technology and are attempted to automatically
put their products into the correct category to increase their visibility and, in return, improve
user engagement and satisfaction. In Chapter 6, we present our challenge to the data science
community to use the state-of-the-art algorithms predicting the category of a product based
on its textual description and image on a large dataset retrieved from Cdiscount. Text based
and image based classification are subjects actively followed by researchers of related fields.
In (Yang and Liu, 1999), various kinds of text classification algorithms are reviewed. Many of
the classification algorithms have been implemented in different software systems and are pub-
licly available such as BOW toolkit (McCallum, 1996), Mallet (McCallum, 2002), NLTK (Bird,
2006) and WEKA 1. Probabilistic classifiers, such as Naive Bayes, have gained a lot of popularity
recently and have shown to perform remarkably well (Joachims, 1996; Koller and Sahami, 1997;
Larkey and Croft, 1996; Sahami et al., 1998) where Bayes rule is used to classify new examples
and select the class that is most likely has generated the example (McCallum et al., 1998).
Support Vector Machine is another family of classification algorithms that has been commonly
used in text classification. Initially introduced in (Cortes and Vapnik, 1995; Vapnik and Kotz,
1. http://www.cs.waikato.ac.nz/ml/weka
22

LITERATURE REVIEW
1982), SVM is robust against high dimensionality which makes it popular in classifying text,
indeed in text mining dimension can be as large as multiple dictionaries of languages (Hotho
et al., 2005; Joachims, 1998).K-Nearest-Neighbors has also been observed in some studies to
classify textual data (Han et al., 2001; Rezaeiye et al., 2014; Sebastiani, 2002). Decision tree
along with its derivatives Random Forest and Boosted Trees are also commonly used in text
classification and often report highest accuracy among other models (Johnson et al., 2002; Xu
et al., 2012; Schapire and Singer, 2000). All of those aforementioned algorithms can be found in
our top competitors solution presented in Chapter 6 and combining various models together is
another way to further improve the accuracy of classification as reported in Chapter 6. Image
based classification can also be beneficial for e-commerce companies and a recent classification
competition launched by Cdiscount was solely based on product images 2. With the recently de-
velopment of deep learning, promising results have been reported in various studies (Chan et al.,
2015; Krizhevsky et al., 2012). Particularly, in (Ciregan et al., 2012), the author built a deep
neural network and was the first to achieve a near human performance of classification accuracy
on the public MNIST dataset. With this recently launched competition, we are expecting to see
further improvement on the state-of-the-art image classification research.
3.4 Stock prediction
Stock market has long been characterized by its dynamic, complicated, and non-stationary
nature (Fama, 1965). Market movements are dependent upon various factors ranging from polit-
ical events, firms policies, economic background, commodity prices, exchange rates, movements
of other stock markets to psychology of investors (Gidofalvi and Elkan, 2001; Committee, 2013).
In addition, the Efficient Market Hypothesis (Peters, 1996) assumes that asset prices are
fair and adjust quickly to reflect all past and present information, which implies that future
stock price movements are independent from pending and past information and should therefore
follow a random walk pattern. If this hypothesis were true, then any attempts to predict the
market would be fruitless (Taylor, 2008). If there is to be one “father” of the EMH, this man
is Eugene Fama, who remains an outspoken proponent of the hypothesis to this day (Fama,
1965; Malkiel and Fama, 1970; Fama, 1991). The hypothesis has been tested extensively across
various markets. The results are, however, sometimes contradictory. Many early work support
the random walk model (Alexander, 1961). “There is no other proposition in economics which
has more solid empirical evidence supporting it than the Efficient Market Hypothesis”, as said
by Jensen (Jensen, 1978). However, modern studies (Fama, 1991; Gallagher and Taylor, 2002)
2. https://www.kaggle.com/c/cdiscount-image-classification-challenge
23

LITERATURE REVIEW
on stock markets reject the random walk behavior of stock prices and a substantial number of
market inefficiencies or “anomalies” has been documented (Palan, 2004).
Besides the efficient market hypothesis, there are two schools of thought regarding stock
market predictions: fundamental analysis and technical analysis. Fundamental analysis (Dechow
et al., 2001) consists of evaluating the intrinsic value of a stock by examining the financial
condition of a company. However, the proponents of the EMH argue that the intrinsic value of
a stock is always equal to its current price. Technical analysis, on the other hand, is a study of
the market itself. Technical analysts believe market action tells everything, so price and trading
volume time series are enough for prediction tasks. Since market driving forces (i.e., human
psychologies) hardly change, the prices are then considered to be recurrent and predictable
since history always repeats itself.
Recently development on Artificial Intelligence has drawn attention from both practitioners
and researchers of stock market. Artificial neural network is one of the most promising model
used by researchers to predict stock movement (Guresen et al., 2011; Bahrammirzaee, 2010;
Naeini et al., 2010; Ticknor, 2013), because, theoretically ANN can approximate any nonlinear
function to an arbitrary degree of accuracy with a suitable number of hidden units (Hornik et al.,
1989). Other models including SVM (Lin et al., 2013; Sands et al., 2015; Kazem et al., 2013;
Yuan, 2013), Random Forest (Ballings et al., 2015; Patel et al., 2015; Khaidem et al., 2016) etc.
have also been extensively studied for the stock prediction tasks. Attempts combining various
approaches to improve prediction accuracy have also been made (Huang et al., 2008; Lee, 2009;
Zbikowski, 2015; Patel et al., 2015) resulting in promising results.
In addition, social media offers a powerful outlet for people’s thoughts and feelings. It
is an enormous ever-growing source of texts ranging from everyday observations to involved
discussions. Using sentiment analysis to extract emotions and opinions from text will serve
as another importance source of information and has been pursued actively by researchers of
the field (Medhat et al., 2014; Nguyen et al., 2015; Kearney and Liu, 2014; Azar and Lo, 2016).
Taking Twitter as an example, in (Skuza and Romanowski, 2015), Twitter messages are retrieved
in real time using Twitter Streaming API and a classification model built on Naive Bayes
algorithm is proposed to predict future stock price based on analysis of twitter data. The author
in (Pagolu et al., 2016) applied sentiment analysis and various supervised machine learning
algorithms to tweets extracted from twitter API and analyzed the correlation between stock
market movement of company and sentiments in tweets. Both results are promising.
24

CHAPTER 4
AN ENTROPY-BASED TERM WEIGHTING SCHEME AND ITS
APPLICATION IN E-COMMERCE SEARCH ENGINES
E-commerce search engines play a crucial role for large online retailers.
Indeed, a large number of purchases are derived from searches. It is now
widely acknowledged that pure content based indexation techniques are less
efficient than hybrid approaches taking user feedback into account to rerank
the output. Purchase data is a valuable source of feedback, arguably less noisy
than other sources, such as clicks: the fact that money is spent, is interpreted
as a strong signal of interest for the purchased object. Unfortunately, a large
portion of queries, which we refer to as “rare queries”, have unavailable or
insufficient associated purchase information. In that case, following ideas from
neighborhood-based collaborative filtering, we introduce a similarity function
between queries. The main contribution of this paper consists in defining a new
weighting scheme based on entropy that seems to work well in practice. This
claim is backed up by numerical experiments where the proposed entropy based
approach outperforms tf-idf weighting on real e-commerce purchase data.
25

AN ENTROPY-BASED TERM WEIGHTING SCHEME AND ITS APPLICATION INE-COMMERCE SEARCH ENGINES
4.1 Introduction . . . . . . . . . . . . . . . . . . . . . . . . . . . . . . . . . . . . . . . 27
4.2 Problem framework . . . . . . . . . . . . . . . . . . . . . . . . . . . . . . . . . . . 28
4.2.1 Purchase data description . . . . . . . . . . . . . . . . . . . . . . . . . . . 28
4.2.2 Ranking with purchase data using similar queries . . . . . . . . . . . . . . 29
4.3 Our entropy based term weighting scheme . . . . . . . . . . . . . . . . . . . . . . 30
4.3.1 Importance of a term . . . . . . . . . . . . . . . . . . . . . . . . . . . . . 30
4.3.2 Mathematical framework of entropy based term weighting . . . . . . . . . 31
4.4 Application of the proposed scheme and experimental evaluation . . . . . . . . . 33
4.4.1 Entropy-based query similarity metrics . . . . . . . . . . . . . . . . . . . . 33
4.4.2 Experiment setting . . . . . . . . . . . . . . . . . . . . . . . . . . . . . . . 34
4.4.3 Evaluation metric . . . . . . . . . . . . . . . . . . . . . . . . . . . . . . . 34
4.4.4 Results and analysis . . . . . . . . . . . . . . . . . . . . . . . . . . . . . . 34
4.5 Conclusion and future work . . . . . . . . . . . . . . . . . . . . . . . . . . . . . . 36
26

AN ENTROPY-BASED TERM WEIGHTING SCHEME AND ITS APPLICATION INE-COMMERCE SEARCH ENGINES
4.1 Introduction
The majority of e-retailers rely on a search engine for the customers’ sake to find the most
relevant products. Therefore search engines have become a vital tool for the e-commerce in-
dustry. A now widely acknowledged procedure to boost the performance of a search engine
consists in incorporating users feedback information in its design (Baeza-Yates and Maarek,
2012; Balakrishnan and Zhang, 2014). In particular, in the context of e-commerce, purchase
data is a useful feedback. They are a collection of pairs having the form 〈query, product〉,
where product corresponds a purchase made just after query has been submitted, if any. It is
indeed arguably less noisy than other feedback sources, such as clicks because it involves mon-
etary transactions (Parikh and Sundaresan, 2008). However, purchase data can be challenging
to exploit, for mainly two reasons. Firstly, the vast majority of queries are unique, i.e. they do
not appear elsewhere in the database. Secondly, a given user at a given time rarely buys many
products: purchase data are extremely sparse (a few products among millions are associated to
a given query).
In order to deal with such highly valuable but sparse data, a certain amount of regularization
is needed. A popular way of performing such regularization is the so-called “collaborative
filtering” (Herlocker et al., 1999). Roughly speaking, it consists in suggesting products not only
associated with the given query, but also associated with other similar queries. The starting
point is therefore a similarity function between two queries. There are basically two ways of
comparing queries. The first way is to compare queries via the products purchased after them.
For instance, query “Apple tablet” and query “Ipad” are similar in the sense that they usually
yield the same purchases; although their content, i.e. the terms they are made of, are not similar.
The second way is to compare their constituting terms. In this line of thoughts, it is important
not to give the same weight to each term. Indeed, some terms are more informative than others.
For instance query “sony black ps4” is closer to query “promo ps4” than to query “sony black
smartphone”, even though the it is not the order implied by the number of common words. In
this example, giving more weight to the term “ps4” than to the term “sony” or “black” can solve
the problem. This weighting is meaningful, as the term “ps4” is arguably more informative than
the term “sony”, as it, alone, can limit considerably the relevant products range while “black”
and “sony” can be used to describe a wide range of other products.
The weighting scheme tf-idf (Rajaraman and Ullman, 2011) is a commonly used scheme in
Information Retrieval. The “idf” part of the scheme is based on the assumption that rare terms
are more relevant than frequent ones. Our claim is that the tf-idf scheme, although relevant in
a large amount of situations (Roul et al., 2014; Paik, 2013), is not relevant in the context we
27

AN ENTROPY-BASED TERM WEIGHTING SCHEME AND ITS APPLICATION INE-COMMERCE SEARCH ENGINES
are interested in. In the tf-idf scheme, rare terms mean terms that do not appear frequently
in the database, whatever the purchases associated to them. For instance, the term “ps4”, that
appears relatively frequently in the database, because the product “Playstation 4” is popular, is
not considered as important as the term “color”, which appears a little bit less in our database.
We are interested in exact figures at this stage but more on conceptual matters. Let us argue
that “color” is less informative than “ps4”. Should one recommend a product based on the sole
query “color” it would be a daunting task to make a good guess of what the user has in mind;
whereas for “ps4”, there is a good chance that the user is interested in a product related to
“Playstation 4”. In our proposed method, contrarily to the tf-idf weighting, we believe that the
importance of a term should not solely be based on its number of occurrences, but should be
mainly based on the diversity of purchases it has lead to. More precisely, we advocate that when
the same term used in a large variety of purchases, it is less important than another term which
is systematically associated to the very same purchase. Shannon entropy is a quantitative way to
measure how much diverse a given term is. This is the reason why our proposed weighting scheme
is based on entropy. We claim that this entropy-based weighting scheme gives interesting results
in practice, compared to tf-idf; at least on our database. Notice that both methods are distinct
not only on the exact formula used to compute the weights but also and more importantly on
a conceptual ground, since tf-idf only uses the query database, while the entropy weighting
scheme uses both query and product.
The main contribution of this paper is to present a novel term weighting scheme suitable for
e-commerce context and to the best of our knowledge, no such term weighting scheme has ever
been proposed.
The rest of this paper is organized as follows. We first present the problem framework in
Section 4.2. Then in Section 4.3, we introduce our entropy based term weighting scheme with
its mathematical framework. Its application in e-commerce is described in Section 4.4 based on
real-world data. Finally, in Section 7.8 we provide conclusions and directions of our future work.
4.2 Problem framework
4.2.1 Purchase data description
E-commerce purchase data is a valuable source of feedback information. Our purchase data
is use consists of a set of 〈q, p〉 pairs where q is the last searched query before purchasing the
product p. The entire data is further split into two sets: D as training set with cardinality D
and T as test set with cardinality T . In addition, the product catalog of our database is denoted
by P.
28

AN ENTROPY-BASED TERM WEIGHTING SCHEME AND ITS APPLICATION INE-COMMERCE SEARCH ENGINES
Along with search query log, purchase data is capable of revealing the purchase intention
of searchers. It is thus logical to re-rank the items that searchers really want to buy at top
positions. However, a few challenges come along with purchase and need to be addressed.
1. Sparsity. Every query is related to a very small percentage of the product catalog. Indeed,
the frequency of the queries is very small in comparison with the size of the product catalog.
2. Power-law distribution of query frequency. Very few distinct queries are very commonly
seen and explain a large amount of purchases while a large number of very rare queries still
account for a significant amount of purchases. This power law distribution of e-commerce
query frequency has also been reported in (Parikh and Sundaresan, 2008). Furthermore,
those rare or so called long tail queries are not less important than the frequent or so called
short head ones for an e-commerce company (Goel et al., 2010).
3. New query. Queries without historical purchase data occur in a daily basis. Studies an anther
e-commerce company show that a query-log of one day contains over 20% of new queries
relative to a 4-months query log (Hasan et al., 2011). This observation is also confirmed on
our data set.
In order to deal with these challenges, we used a collaborative filtering (Herlocker et al., 1999)
based framework, commonly used in product recommendation systems, that we shall describe
in the sequel.
4.2.2 Ranking with purchase data using similar queries
In our context of product searching, the idea of collaborative filtering is quite simple: if two
queries are similar, we can use the purchases of one query to improve the product ranking of
the other query. The ranking function we use is formulated in equation (4.1).
r(q, p) = α log s(q, p) + (1− α)∑q′
sim(q, q′) log s(q′, p) (4.1)
where s(q, p) denotes the number of purchases on product p using q as the last search query and
the parameter α can be further tuned on training set. In order to apply this formula, one has
to come up with a quantitative way to measure query similarity.
For frequent queries, the component ps(q, p) in (4.1) is usually sufficient to generate high
quality rankings, without the aid of similar queries. Moreover the Pearson coefficient on purchase
data can further be applied to measure similarity between two frequent queries and two queries
are similar if they share many common purchases. It can, indeed, identify similar queries with
no terms in common, like “ipad” and “apple tablet”, but it is not applicable on new queries
since no previous knowledge is available for those queries.
29

AN ENTROPY-BASED TERM WEIGHTING SCHEME AND ITS APPLICATION INE-COMMERCE SEARCH ENGINES
Lexical similarity, also called term matching, is commonly used in the field of information
retrieval. By regarding each query as a bag of words, a straightforward way to compute query
similarity is to normalize the number of terms that occur in both queries. Let {q} denote the set
of terms composing the query q. Some commonly used similarity metrics are listed as follows.
1. simDice(q, q′) = 2|{q} ∩ {q′}|/(|{q}|+ |{q′}|)
2. simJaccard(q, q′) = |{q} ∩ {q′}|/|{q} ∪ {q′}|
3. simOverlap(q, q′) = |{q} ∩ {q′}|/min(|{q}|, |{q′}|)
4. simCosine(q, q′) = |{q} ∩ {q′}|/
√|{q}| × |{q′}|
However those similarity metrics work poorly for short text segments (Metzler et al., 2007)
which is the our case since e-commerce search query length is around three in average. We
will describe in the next section our proposed term weighting scheme to improve those lexical
similarity metrics.
4.3 Our entropy based term weighting scheme
4.3.1 Importance of a term
Consider the search query “apple ipad” was just entered. The term “ipad” clearly carries
most of the information contained in this query, as it alone can tell us what product is expected
while the term “apple” can almost be considered as superfluous. When computing query simi-
larities, we should consider queries sharing the term “ipad” be more similar to the query than
those sharing the term “apple”. Therefore “apple ipad” should be more similar to “ipad 128g”
than “apple fuji”. Notice that all three queries occur commonly on large e-retailers.
A convenient way to assess the importance of a term is to use the so-called tf-idf (Term Fre-
quency - Inverse Document Frequency) term weighting scheme (Rajaraman and Ullman, 2011),
which is universally applied in document retrieval. It is generally based on two assumptions.
1. idf assumption: rare terms are more relevant than frequent terms.
2. tf assumption: multiple occurrences of a term in a document are more relevant than single
occurrence.
This scheme is perfectly relevant for large size documents, however, it is less relevant for e-
commerce queries which are composed of three terms in average. Moreover, it is quite clear
already that the “tf” component, i.e. the frequency within document/query, is nearly useless
for e-commerce queries: a user rarely repeat a term in a query. Thus a term importance is solely
based on its frequency in database. However in e-commerce query log, the best-seller products
are highly demanded which makes the terms describing those product very frequent in database,
30

AN ENTROPY-BASED TERM WEIGHTING SCHEME AND ITS APPLICATION INE-COMMERCE SEARCH ENGINES
such like “ps4”, “fifa” etc. Those terms are thus heavily penalized by tf-idf weighting scheme
while they still carry valuable information on what products are expected.
In the context of e-commerce, search engine users usually have a purchase intention in mind.
The term importance could be related to its ability of telling us the searcher’s purchase intention.
Terms used in purchasing very various range of products should be less important than those
used in purchasing a very narrow range of products. Therefore our basic idea is not to judge
the importance of a term by its number of occurrences in the database, but by how dispersed
are the purchases associated to it.
To turn this idea into a quantitative way, we employ the notion of Shannon’s Entropy of a
discrete random variable (Cover and Thomas, 1991), which we shall explicitly describe in the
sequel.
4.3.2 Mathematical framework of entropy based term weighting
Recall the notion of Shannon’s Entropy of a discrete probability distribution (Cover and
Thomas, 1991). Given a probability distribution π on a finite set I, the Shannon Entropy is
defined as:
H(π)def= −
∑i∈I
πi log πi (4.2)
Now, to each term t, associate the following probability distribution, referred to as term
purchase distribution:
πt =1
Zt
∑〈q,p〉∈DN
I{t ∈ q}δp (4.3)
where δp denotes the probability distribution with all its mass on product p and Zt, corresponding
to the number of purchases associated to t is a normalization term such that πt be a probability
distribution over P.
For a term t, its entropy H(t) is then defined as
H(t)def= H(πt) (4.4)
As a specific example, table 4.1 shows a small sample of purchase log and the table 4.2
describes purchase distributions of the related terms.
Query Product
hp printer p1
hp printer p2
hp 3050a p1
hp pc p3
Table 4.1 – A sample of purchase data log
p1 p2 p3
hp 12
14
14
printer 12
12 0
3050a 1 0 0pc 0 0 1
Table 4.2 – Purchase distributions of terms
31

AN ENTROPY-BASED TERM WEIGHTING SCHEME AND ITS APPLICATION INE-COMMERCE SEARCH ENGINES
The entropy of terms in the previous sample can be calculated as follows.
H(hp) = −12 log(1
2)− 2× 14 log(1
4) = 32 × log 2
H(printer) = −2× 12 log 1
2 = log 2
H(3050a) = − log 1 = 0
H(pc) = − log 1 = 0
(4.5)
In average, frequent terms have higher entropy values than rare ones since the maximum
entropy of a term is the logarithm of its frequency. Nevertheless, term frequency is not the
determinant factor of its entropy. In fact, among frequent terms, those with dispersed purchase
distribution have higher entropy values than those with concentrated one. For instance, purchase
distribution of “hp” and “3050a” generated using our training set are presented in figure 4.1
with pie chart. We can clearly see that the purchase distribution of “hp” is extremely dispersed
while that of “3050a” is relatively concentrated, which explains the higher entropy value of the
former.
(a)H(hp) = 5.79 (b) H(3050a) = 1.05
Figure 4.1 – Term purchase distributions of ‘hp‘ and “3050a”.On the one hand, the purchase distribution of “hp” is extremely dispersed, which is indicated bythe diversity of colors in the pie chart (a). Hence a high entropy is assigned to “hp”. “3050a”,on the other hand, has a relatively concentrated purchase distribution (b), which explains itslow entropy value.
So far, we have seen that term importance is inversely related to its entropy. We further
apply an exponential transformation on entropy to quantify importance of a term with the
following term weighting scheme.
wentropy(t) = exp(−λ×H(t)) (4.6)
The smoothing parameter λ can be further tuned by cross validation on training set. It is worth
noticing that our weighting scheme takes values in (0, 1]. The lowest weight occurs on terms
32

AN ENTROPY-BASED TERM WEIGHTING SCHEME AND ITS APPLICATION INE-COMMERCE SEARCH ENGINES
with extremely dispersed purchase distribution. In our data set, “femme” and “homme”, i.e.
“woman” and “man” in English, have the lowest weights since a very large range of diverse
products are associated to them.
In what follows, we shall show our our proposed term weighting can be used to improve
query similarity metric and to be applied in e-commerce product search.
4.4 Application of the proposed scheme and experimental eval-
uation
4.4.1 Entropy-based query similarity metrics
Query similarity metric is the key element of our collaborative filtering framework employed
in (4.1). It is well acknowledged that lexical similarity metrics performs poorly when queries
in question are extremely short (Metzler et al., 2007), which is precisely our case where the
average length of a search query in e-commerce is around three. Techniques based on query
reformulation are proposed in various papers (Yang et al., 2014; Parikh et al., 2013) to rewrite
a query into a more meaningful form before any further processing. Our proposed approach
keeps the original form of a query and assigns different weights to different terms based on their
term entropy defined previously in order to highlight the most important ones in a query so
that query similarity relies mainly on the most important terms. Roughly speaking, for a given
pair of queries q and q′, our entropy based weighting consists in normalizing∑
t∈q∩q′wentropy(t)
instead of |{q} ∩ {q′}| in lexical similarity metrics. For example, recall that Jaccard similarity
metric is simJaccard(q, q′) = |{q} ∩ {q′}|/|{q} ∪ {q′}|, then the corresponding entropy weighted
Dice similarity metric is defined as
simEntJaccard
(q, q′)def=
∑t∈q∩q′
wentropy(t)∑t∈q∪q′
wentropy(t)
Similarly, computation of entropy weighted similarity metrics of Dice, Overlap and Cosine is
straightforward.
In our numerical experiments, we implemented all those four entropy weighted similarity
metrics into our ranking function (4.1).
In order to demonstrate the effectiveness of our entropy based term weighting scheme, we
conducted numerical experiments on real e-commerce data. We shall begin by presenting our
experiment setting, then follow by introducing the evaluation metric we use to compare different
algorithms. Experiment results will also be analyzed in detail latter in this section.
33

AN ENTROPY-BASED TERM WEIGHTING SCHEME AND ITS APPLICATION INE-COMMERCE SEARCH ENGINES
4.4.2 Experiment setting
We extracted purchase data from a major e-commerce company for a given period. The
entire purchase set was further split into a training set of 1,000,000 samples and a test set of
100,000 samples. Each sample consists of a 〈q, p〉 pair, where q is the last searched query before
purchasing the product p. As we worked on a French corpus, each query was passed through
a query pre-processing procedure. It consists of French accent removal, stop-words removal,
special character replacement by space, lower-casing and stemming. We used Porter’s stemmer
(Porter, 2001) to aggregate syntactically similar queries. It allows to alleviate term plurality
and French gender mismatching issue. For example the term “cheres” is stemmed to “cher” and
“tables” is stemmed to “tabl”. It helped to reduce about 5% of our term dictionary size and
thus increased the accuracy of our term weighting scheme.
4.4.3 Evaluation metric
We employed our ranking function (4.1) to rank all the products for each query in the test
data after tuning the parameters α using training set. In our experiments, the optimal α is
found at 0.8.
In order to compare performance of different ranking functions, there are several well known
metrics (Croft et al., 2010): MAP, NDCG, or simply the Precision@r metric which is the one
we use. In our context where a test set T consisting of pairs “query/product”, 〈q, p〉 is given,
the metric is defined by:
Precision@r(fr) =1
T
∑〈q,p〉∈T
r∑i=1
I{fr(q)i = p} (4.7)
where fr is a function returning the top ranked r products by ranking function (4.1) for each
input query q. Notice that Precision@r depends on r. Consequently, it may happen that a given
search engine performs better at a given r but worse at another r′. In that case, using integrated
metrics such as MAP can help. However, it is going to turn out in our experiments that such a
sophistication is not needed.
4.4.4 Results and analysis
We implemented four similarity metrics, Jaccard, Cosine, Dice and Overlap using two term
weighting schemes: tf-idf and our proposed entropy based in ranking function (4.1). Notice that
the tf term, i.e. the term frequency within query, is nearly useless for e-commerce queries: a
user rarely repeat a term in a query. In consequence, the tf-idf term weighting scheme takes the
34

AN ENTROPY-BASED TERM WEIGHTING SCHEME AND ITS APPLICATION INE-COMMERCE SEARCH ENGINES
following form.
wtfidf (t) = log(D
|{(q, p) ∈ D : t ∈ q}|)
Experimental results using Precision@r metric with different values of r are presented in figure
4.2. We observe that entropy-based term weighting outperforms tf-idf on all similarity metrics
implemented at all values of r.
(a)Jaccard (b) Dice
(c) Cosine (d) Overlap
Figure 4.2 – Performance comparison of entropy-based weighting and tf-idf weighting using dif-ferent basic similarity metrics. X-axis is the number of allowed recommendations, correspondingto the parameter r of (4.7). Y-axis is the Precision@r value.
Some detailed analysis are conducted. Comparing to tf-idf which assigns constantly higher
weight to rare terms and lower weight to frequent terms, our entropy based term weighting
scheme share some common points but also differs in some others. Rare terms have, in average,
a low entropy value thus high importance since the maximum entropy value of a term positively
depends on term frequency. But if a frequent term has a relatively concentrated distribution such
like “galaxy3”, it can still have a relatively low entropy value, thus high importance. Only terms
with high frequency and dispersed purchases are considered not important. Some examples are
presented in table 4.3.
Moreover since terms describing best-sellers occur quite often, high frequency terms could be
more important than less frequent ones. For example, the term “ps4” is more frequent than the
35

AN ENTROPY-BASED TERM WEIGHTING SCHEME AND ITS APPLICATION INE-COMMERCE SEARCH ENGINES
Term Entropy Explanationhp 5.8 high freq., dispersed purchases
galaxy3 0.69 high freq., concentrated purchasescn046a 0.5 Low frequency
Table 4.3 – Examples of term entropy
term “black” in our query log, however the former is clearly more informative than the latter
about what products the user is looking for, see table 4.4.
term: t wentropy(t) wtfidf (t)
term: sony 1 1term: ps4 840 1.25
term: black 8.05 1.30term: promo 4.95 1.57
term: smartphone 8.2 1.4
Table 4.4 – Examples of entropy-based term weighting with λ = 2 and tf-idf term weighting.Both schemes are normalized on the weight of “sony” in order to have a relative view of termimportance.
sony black ps4 Jaccard tf-idf entropy
sony black smartphone 0.5 0.46 0.01promo ps4 0.25 0.24 0.98
Table 4.5 – Similarities with “sony black ps4” on different metrics
Let us take the query “sony black ps4” as an example. It is more similar to “sony black
smartphone” than to “promo ps4” using tf-idf, in accordance to table 4.5, which is controversy
to our intuition. Entropy-based weighting reveals that “ps4” is far more informative than others
as most queries containing “ps4” end up with purchasing a play station 4. Thus “promo ps4”
is considered as very similar to “sony black ps4” regardless of the number of terms in common.
4.5 Conclusion and future work
We have seen in this paper that the measuring similarities between queries was an important
issue, at the core of higher level tools, such as collaborative filtering. After having reviewed a
popular weighting scheme, namely tf-idf, which is based on the idea that corpus-wise rarest terms
are the most important, we introduced a brand new weighting scheme. This novel weighting
scheme is based on the idea that the importance of a term cannot be decided on its number
of occurrences in the database alone. Rather, term importance, as we defined it, is based
on how concentrated were the purchases it lead to. This notion was implemented through the
36

AN ENTROPY-BASED TERM WEIGHTING SCHEME AND ITS APPLICATION INE-COMMERCE SEARCH ENGINES
computation of term entropy that we defined in this paper. Numerical experiments, performed on
real-world purchase data, showed encouraging results of our entropy-based term weighting over
tf-idf. Detailed analysis were also conducted to explain the obtained results. Many questions still
remain open. The term weighting scheme we defined in this paper is indifferent to the containing
query, such that the same term has the same importance in different queries. Therefore we may
consider it as a global term weighting scheme. By weighting each term conditionally to its
containing query, a local term weighting scheme could be envisaged in the aid of the notion:
conditional entropy. This idea will be carried on in our future work.
37

CHAPTER 5
RERANKING STRATEGIES BASED ON FINE-GRAINED BUSINESS
USER EVENTS BENCHMARKED ON A LARGE E-COMMERCE
DATA SET
As traditional search engines based on the text content often fail to ef-
ficiently display the products that the customers really desire, web
companies commonly resort to reranking techniques in order to improve the
products’ relevance given a user query. For that matter, one may take advan-
tage of fine-grained past user events it is now feasible to collect and process,
such as the clicks, add-to-basket or purchases. We use a real-world data set of
such events collected over a five-month period on a leading e-commerce com-
pany in order to benchmark reranking algorithms. A simple strategy consists
in reordering products according to the clicks they gather. We also propose
a more sophisticated method, based on an autoregressive model to predict
the number of purchases from past events. Since we work with retail data,
we assert that the most relevant and objective performance metric is the per-
cent revenue generated by the top reranked products, rather than subjective
criteria based on relevance scores assigned manually. By evaluating in this
way the algorithms against our database of purchase events, we find that the
top four products displayed by a state-of-the-art search engine capture on av-
erage about 25% of the revenue; reordering products according to the clicks
they gather increases this percentage to about 48%; the autoregressive method
reaches approximately 55%. An analysis of the coefficients of the autoregres-
sive model shows that the past user events lose most of their predicting power
after 2–3 days.
38

RERANKING STRATEGIES BASED ON FINE-GRAINED BUSINESS USER EVENTSBENCHMARKED ON A LARGE E-COMMERCE DATA SET
5.1 Introduction . . . . . . . . . . . . . . . . . . . . . . . . . . . . . . . . . . . . . . . 40
5.2 Data set . . . . . . . . . . . . . . . . . . . . . . . . . . . . . . . . . . . . . . . . . 41
5.3 Reranking strategies . . . . . . . . . . . . . . . . . . . . . . . . . . . . . . . . . . 42
5.3.1 Reranking by multivariate auto-regression . . . . . . . . . . . . . . . . . . 44
5.3.2 Granger causality test . . . . . . . . . . . . . . . . . . . . . . . . . . . . . 45
5.4 Evaluation metric . . . . . . . . . . . . . . . . . . . . . . . . . . . . . . . . . . . . 46
5.5 Results and discussion . . . . . . . . . . . . . . . . . . . . . . . . . . . . . . . . . 47
5.5.1 Analysis of the coefficients of the VAR model . . . . . . . . . . . . . . . . 48
5.6 Conclusion . . . . . . . . . . . . . . . . . . . . . . . . . . . . . . . . . . . . . . . 50
39

RERANKING STRATEGIES BASED ON FINE-GRAINED BUSINESS USER EVENTSBENCHMARKED ON A LARGE E-COMMERCE DATA SET
5.1 Introduction
The recent growth of on-line retail industry has made on-site product search engine a salient
part of e-commerce companies. Product search is not only a problem of significant commercial
importance, it also raises fundamental research questions at the intersection of natural language
processing, machine learning and information retrieval. The catalog of products of the largest
companies can reach millions – if not tens of millions – of items, while user queries are typically
made of very few words carrying limited semantic content. This greatly hampers the performance
of traditional search engines based on text retrieval, in terms of conversion of the displayed results
to purchases. Many companies thus opt for strategies to rerank the products using additional
sources of information, in order to achieve better user satisfaction and larger revenue.
Fortunately, sophisticated tracking systems and ‘big data’ technologies now make it feasible
to collect, store and process all user paths of the form:
query→ click on product→ add-to-basket→ purchase,
over the whole site. It is then straightforward to build indicators with a granularity at the
product level following a user query: e.g., number of clicks, add-to-basket and purchases per
date. These numbers can directly serve the reranking purpose, if one argues that relevant
products are simply those most likely to be viewed or purchased. This purely user behavior-
based point of view leads to simple and objective reranking strategies, but it is not exempt from
criticism. For instance, some products (such as erotic items) are likely to attract many curiosity
clicks, and could therefore end up polluting many otherwise unrelated queries. Nevertheless,
we believe that the use of past user events has the potential to improve conversion rates on
e-commerce websites.
Previous studies discussed reranking strategies based on click data to improve retrieval of
relevant web documents (Joachims et al., 2005; Agichtein et al., 2006) or images (Jain and
Varma, 2011). Jiao et al. (2015) exploited purchase data to improve product search performance
via a collaborative filtering framework. In the present work we had access to a real-world
data set of click, add-to-basket and purchase events collected over a five-month period from
Cdiscount, a leading French e-commerce company. Based on this, our objective is to quantify the
improvements brought by reranking strategies on top of a state-of-the-art semantic search engine
using the BM25 statistics (Robertson et al., 1995). The most straightforward strategy consists
in re-ordering products according to the clicks they gather over a fixed period after a user query:
this follows the philosophy of previous works, applied to different contexts (Joachims et al.,
2005; Agichtein et al., 2006; Jain and Varma, 2011). We further propose a more sophisticated
40

RERANKING STRATEGIES BASED ON FINE-GRAINED BUSINESS USER EVENTSBENCHMARKED ON A LARGE E-COMMERCE DATA SET
method that combines the three aforementioned types of event within an autoregressive model
to predict the number of purchases. To the best of our knowledge, this work represents the first
effort to benchmark reranking algorithms on real-world data set within an e-commerce context,
and that exploits all the major types of implicit user feedback for that matter.
As for the performance metric on which the algorithms shall be evaluated, we believe that
it is unnecessary for it to rely on subjective, human assigned relevance scores (as in, eg, Liu
et al., 2007; Voorhees, 2003) Since we work with retail data, we argue that the most relevant
and objective performance metric is the average percent revenue generated by the top k dis-
played products, or revenue@k, which can be seen as a natural extension of the widely used
precision@k (Wiener, 1956). The data large e-commerce companies have at their disposal are
largely sufficient to compute meaningful estimates of revenue@k.
The rest of this paper is organized as follows. Section 5.2 describes the data set used in this
study. Section 5.3 introduces reranking strategies, which include BM25 similarity (Robertson
et al., 1995), crude methods based on collected clicks, purchases or revenue, and our proposed
autoregressive model fitted on all types of event. Section 5.4 deals with the evaluation metric,
revenue@k. Section 5.5 gives the results and discussion related to the benchmarking of reranking
methods on the data set.
5.2 Data set
The raw data set was provided by Cdiscount, a leading online retailer in the French market:
it consists of navigation logs and sale records over a period of 150 days from July 1st, 2015
to November 27, 2015, and contains several millions of distinct user queries per month. As
can be expected, purchases are extremely unevenly distributed amongst the queries: Fig. 5.1a
shows a long tail of queries concentrating a large number of purchases approximately following
a power law. We focus this work on the top 1000 queries, which generate a significant part of
all purchases made through the search engine (Fig. 5.1b).
The raw data contain a large amount of information related to user navigation through
the website. We pruned and simplified the data structure in the following way. First, we only
considered three types of event related to a product following a typed query: click, add-to-basket
and purchase. “Negative” feedback events such as remove-from-basket or purchase abandon
could also provide useful information, but we believe they would only marginally improve the
reranking strategies. Second, we processed navigation sessions containing multiple searches by
assigning the last typed query to each observed event: we thus obtained a list of more than
21 million pairs {query,product} labeled with a time stamp and an event tag: click, add-to-
41

RERANKING STRATEGIES BASED ON FINE-GRAINED BUSINESS USER EVENTSBENCHMARKED ON A LARGE E-COMMERCE DATA SET
Figure 5.1 – (a) Distribution of the purchases by query; (b) cumulative percentage of purchasesassociated with queries (queries generating most purchases first).
Table 5.1 – Summary of the final data used in this study
150 days1000 distinct queries
746,884 distinct products21,450,377 user events1
1clicks, add-to-basket, purchases
basket or purchase (see Table 5.1 for a summary of the final data set). It is then straightforward
to count the number of each type of event associated with a given query and product at the
desired temporal granularity: an example is given in Fig. 5.2.
5.3 Reranking strategies
Queries typed by users in e-commerce search engines are typically extremely short and carry
little semantic content (Singh et al., 2012). Traditional engines looking for products whose
description best match the queries’ keywords often fail to display the relevant products, i.e.
those most likely to be purchased, because there are too many matches. For example, it is
difficult to distinguish semantically amongst iPhone 4, iPhone 5 and iPhone 6 with respect
to the query ‘iPhone’. This is a particularly salient point, because customers are less and less
inclined to crawl through pages of results until they reach the product they desire (Spink et al.,
2002b) and, given the number of e-commerce actors, may simply turn to a competitor.
Many web companies thus resort to reranking strategies, wherein additional information
(such as popularity, price or sales) is integrated to reorder the displayed items. The ecommerce-
specific data presented in section 5.2 prove of valuable help for that matter: as mentioned in the
42

RERANKING STRATEGIES BASED ON FINE-GRAINED BUSINESS USER EVENTSBENCHMARKED ON A LARGE E-COMMERCE DATA SET
Figure 5.2 – Examples of times series of number of clicks, add-to-basket and purchases per dayrelated to two different products following the user query ‘printer’.
43

RERANKING STRATEGIES BASED ON FINE-GRAINED BUSINESS USER EVENTSBENCHMARKED ON A LARGE E-COMMERCE DATA SET
introduction, one can follow previous works (Joachims et al., 2005; Agichtein et al., 2006; Jain
and Varma, 2011) and simply use clicks gathered by products. We also included for comparison
a random and a BM25 (Robertson et al., 1995) ordering, and we finally implemented a more
sophisticated method based on an autoregressive model.
Specifically, for a given user query, we started with the list of top 28 products returned
by Cdiscount internal search engine. We then defined the following strategies to reorder these
products:
1. random reordering, which any method should outperform.
2. BM25 : BM25 (Robertson et al., 1995) is considered as a state-of-the-art similarity metric,
so we used it as reference text-based ranking technique.
3. reranking by click : products are ordered by decreasing number of views collected after the
query over a recent period. Previous works used user clicks to better retrieve relevant web
documents or images (Joachims et al., 2005; Agichtein et al., 2006; Jain and Varma, 2011),
so it is natural to extend this approach to the e-commerce context.
4. reranking by multivariate auto-regression: products are ordered by decreasing revenue, de-
duced from an autoregressive model fitted on the three types of event described in section 5.2.
The model is described in detail in the next section.
5.3.1 Reranking by multivariate auto-regression
Several points should be raised to justify the choice of a more sophisticated reranking model.
First, since e-commerce business is more interested in maximizing the revenue than the number
of views, the former quantity should guide the reranking strategy. However, the number of
purchases is a weak signal (Fig. 5.2 and Table 5.1) so it is not optimal to use it as a sole
predictor for the revenue; it is desirable to make use of the number of clicks and add-to-basket
as well, as these signals are much stronger and highly correlated to the purchases (Fig. 5.2).
Finally, one may apply a temporal weighting scheme to penalize old signal rather than define a
fixed period window; such a weighting scheme should ideally reflect the autocorrelation structure
of the data, and not a priori subjective choices.
These considerations led us to select the vector autoregression (VAR) model (Hamilton,
1994) in order to predict the number of purchases of a product following a given query from
past time-series of clicks, add-to-basket and purchases. Specifically, we start with the following
44

RERANKING STRATEGIES BASED ON FINE-GRAINED BUSINESS USER EVENTSBENCHMARKED ON A LARGE E-COMMERCE DATA SET
multivariate time-series:
N(t) =
nc (t)
na (t)
np (t)
, (5.1)
where t represents the date and nc (t) , na (t) , np (t) the number of clicks, add-to-basket and
purchases related to some product after a query, respectively. The VAR model then describes
the evolution of N(t) as a linear function of its past values:
N(t) =P∑i=1
AiN(t− i) + E(t), (5.2)
where Ai is a time-invariant matrix containing the coefficients of the linear relation between the
signal and itself for a time lag of i, and E (t) represents Gaussian noise. The maximum time
lag, P , is called the order of the process.
The matrices Ai can be estimated from a least square fit on the observed signal including a
`1 (or Lasso) regularization which seeks to minimize:
∑t
∥∥∥∥∥N(t)−∑i
AiN(t− i)
∥∥∥∥∥2
2
+ λ∑i
‖Ai‖1 ., (5.3)
where ‖.‖2 denotes the Euclidean norm and ‖.‖1 the `1-norm. The parameter λ, which controls
the regularization strength, is optimized using a three-fold cross-validation procedure, and takes
typical values between 0.2 and 2. In the present work we estimated best-fitting matrices Ai for
each pair {query,product}, but one may alternatively choose to aggregate signals by making
one fit per query, or even one single global fit on all available pairs. This can be of interest in
a production environment to save computational time and rerank queries associated with few
events.
It is straightforward to use the VAR model for the reranking purpose. First, the products’
number of purchases after a given query is predicted from past series from Eq. (5.2). The price
is then taken into account to reorder the products associated with the query by decreasing
predicted revenue.
5.3.2 Granger causality test
Before we proceed with the evaluation metric, it is worth verifying whether the time series
we included in the VAR model are really able to forecast future purchase. Granger causality
test (Granger, 1969) is a statistical hypothesis test that can help answer this question. A time
series X (t) is said to Granger-cause Y (t) if Y (t) can be better predicted using the histories of
45

RERANKING STRATEGIES BASED ON FINE-GRAINED BUSINESS USER EVENTSBENCHMARKED ON A LARGE E-COMMERCE DATA SET
both X (t) and Y (t) than it can by using the history of Y (t) alone.
Explicitly speaking, one can test for the absence of Granger causality by estimating the
following VAR model:
Y (t) = α0 +∑i
αiY (t− i) +∑i
βiX(t− i) + µ(t) (5.4)
We define the following null hypothesis:
H0 : β1 = β2 = · · · = βp = 0. (5.5)
A rejection of H0 implies there is Granger causality.
We selected at random 1000 pairs of {query,product} from our data set and performed
Granger causality tests on both click and add-to-basket signals against purchase signal. The
null hypothesis was rejected on over 98% of the pairs examined. Most of the unrejected cases
correspond to less popular queries and products with negligible signals and accordingly large
confidence intervals.
5.4 Evaluation metric
Ranking algorithms are often evaluated with the precision@k metric, which is the average
proportion of relevant items amongst the top k results. This metric relies on the availability of a
labeled test data set wherein human annotators decide which items are relevant with respect to
a user search (e.g. Liu et al., 2007; Voorhees, 2003). However, there is no such data set publicly
available in the e-commerce area, and manually assigning relevance scores on our data would be
prohibitively time-consuming. Besides, human scores may suffer from severe inconsistencies, as
annotators can have different relevance judgment with respect to the same item (Agrawal et al.,
2009). Finally, relevance in the e-commerce context is highly volatile, as the desired products
after a given query can vary from a period to another. For example, the relevance of the iPhone
5 product with respect to the query ‘iPhone’ is likely to collapse when the iPhone 6 is released.
We therefore argue that a better metric in the e-commerce context should be guided by
the increase in revenue generated by the reranked items. After all, it is better to adopt a
customer-oriented relevance score, directly related to the probability of purchase. Specifically,
as a natural extension of the precision@k metric, we propose the revenue@k metric, which
measures the percent revenue generated by the top k items of the search results, relative to the
list of 28 products:
46

RERANKING STRATEGIES BASED ON FINE-GRAINED BUSINESS USER EVENTSBENCHMARKED ON A LARGE E-COMMERCE DATA SET
Table 5.2 – Evaluation scores of the reranking algorithms according to the revenue@k metric.
Estimated revenue generated by:top 4 products top 8 products
Random 14.6% 29.3%Solr/BM25 24.8% 39.2%Reranking by click1 48.4% 67.8%VAR model 54.7% 76.1%Upper limit 88.3% 98.8%1aggregated over the 30 days preceding the test date
revenue@k =
∑queries revenue of the top k products
total revenue. (5.6)
In the present work, the revenue@k metric serves to evaluate the reranking strategies outlined
in section 5.3.
5.5 Results and discussion
We benchmarked the reranking strategies described in section 5.3 over a 7-day test period,
from November 21th to November 27th, 2015. The reranking-by–click strategy aggregated
the number of click events over a 30-day interval ending at the day before each test date, and
reordered accordingly the list of products associated with each query. The VAR model described
in section 5.3.1 was fitted on all available time series, i.e. number of clicks, add-to-basket and
purchases per day, from the first available day (July 1st, 2015) until the day before each test date.
This allowed making a prediction for the number of purchases at the test date and, together
with the products’ price, to reorder them by decreasing predicted revenue.
The algorithms were then evaluated using the revenue@k metric (section 5.4), which calcu-
lates the percent revenue generated by the top k reranked products relative to the list of 28
products, averaged over the queries and over the testing dates, using the data set of purchase
events (section 5.2). Fig. 5.3 and Table 5.2 show the performance of the reranking strategies ac-
cording to that metric; they also display the upper limit of the revenue, which would be reached
if one knew in advance the purchase events of the testing dates.
As is to be expected, the revenue is on average uniformly distributed amongst randomly
ordered products, as shown by the linear trend in Fig. 5.3. A purely text-based strategy sig-
nificantly improves the share of top ranked products: reordering the items according to their
BM25 similarity (Robertson et al., 1995) with the query allows the the top 4 and 8 products
to increase their share of the estimated revenue by about 70% and 30%, respectively, compared
to a random ordering (Table 5.2). Logically, products best matching the search terms are more
47

RERANKING STRATEGIES BASED ON FINE-GRAINED BUSINESS USER EVENTSBENCHMARKED ON A LARGE E-COMMERCE DATA SET
Figure 5.3 – Average percent revenue generated by the top k products (relative to the list of 28products) of each reranking algorithm.
likely to end up purchased. However, a much stronger enhancement is achieved using past user
events: crudely reordering according to the clicks aggregated over the last 30 days raises the
estimated revenue of the top 4 and 8 products to approximately 48% and 68% of the total,
respectively.
The VAR model achieves better results than all other strategies. Although the leap is not
as impressive as that performed by the simple, click-based algorithm compared to the BM25,
the improvement should not be overlooked: it increases the estimated share of the top 4 and 8
products by about 12–13%, thus reaching 62% and 77% of the upper limit (Table 5.2). Such a
gain is likely to translate into significantly larger conversion rate and revenue in most e-commerce
companies.
5.5.1 Analysis of the coefficients of the VAR model
Before we conclude, it is interesting to analyze the coefficients of the VAR model in order
to better understand how the different types of events are related to the number of purchases,
and how their predicting power decay with time. We are interested in the elements of the third
line of the matrices Ai, which correspond to the coefficients of the linear relation between (1)
the daily number of purchases and (2) the daily number of clicks, add-to-basket and purchases
48

RERANKING STRATEGIES BASED ON FINE-GRAINED BUSINESS USER EVENTSBENCHMARKED ON A LARGE E-COMMERCE DATA SET
time-lagged by i (Eqs 5.1-5.2). Fig. 5.4 shows these coefficients, obtained by applying the VAR
model to normalized time series, i.e. with zero mean and unit variance, and averaged over pairs
of {query, product} and testing days. The normalization procedure ensures that the differences
between the values of the coefficients do not reflect the systematic differences in amplitude
between the time series (e.g., Fig. 5.2).
Figure 5.4 – Normalized coefficients of the VAR model related to the number of purchases,averaged over pairs of {query, product} and testing days, function of time lag. Shaded areasshow one standard error around the mean.
Interestingly, Fig. 5.4 suggests that clicks and (to a less extent) add-to-basket possess a
stronger predictive power than purchases to forecast the latter time series. We believe that this
is explained by the larger amplitude of the former time series which, together with their strong
correlation with the latter signal, allow to anticipate finer tendencies of the purchases to come:
a close inspection of Fig. 5.2a reveals that clicks without purchases sometimes precede a wave
of purchase events.
As can be expected, events lose their predicting power as time lag increases. The typical
decay time may seem rather short: fitting an exponentially decaying function show that the
99% of the decrease of the average coefficient associated with the number of clicks is achieved
in about 2.8 days. This value is approximately 3.3 days and 4.5 days for the add-to-basket
and purchases events, respectively. So, purchases retain predictive power over a longer time,
probably because they are not as volatile as other events.
49

RERANKING STRATEGIES BASED ON FINE-GRAINED BUSINESS USER EVENTSBENCHMARKED ON A LARGE E-COMMERCE DATA SET
5.6 Conclusion
For the first time in the e-commerce context (to the best of our knowledge), several reranking
strategies were benchmarked on a real-world data set of user events provided by a leading online
retail company. We used an evaluation metric adapted to e-commerce data, which measures the
percent revenue generated by the top k items of the search results.
A text-based reordering according to the BM25 similarity (Robertson et al., 1995) between
the products’ description and the query’s keywords allows the top four products to capture on
average about 25% of the query’s revenue. This is much less than reranking products according to
the clicks they gathered following the query over the last 30 days, which increases this percentage
to about 48%. A linear autoregressive method forecasting the number of purchases from past
time-series of daily clicks, add-to-basket and purchases further reaches about 55%. The strength
of the latter approach lies in its implicit exploiting of correlation of all major user events with
purchases, and of their decay in predictive power as time lag increases.
The present work thus showed how crucial to the business model reranking algorithms guided
by past user events are. As future lines of improvement, one may suggest the use of nonlinear
predictive model and/or the integration of additional types of event such as remove-from-basket
or purchase abandon.
50

CHAPTER 6
THE CDISCOUNT 2015 DATASCIENCE.NET CHALLENGE: A
LARGE E-COMMERCE DATA SET RELEASED TO BENCHMARK
CLASSIFICATION METHODS
In 2015, Cdiscount challenged the community to predict the correct cat-
egory of its products from some of their attributes such as their title,
description, price or associated image. The candidates had access to the whole
catalogue of active products as of May 2015, which accounts for about 15.8
millions items distributed over 5,789 categories, a subset of which served as
testing set. The data suffers from inconsistencies typical of large, real-world
databases and the distribution of categories is extremely uneven, thereby com-
plicating the classification task. The five winning algorithms, selected amongst
more than 3,500 contributions, are able to predict the correct category of 66–
68% of the testing set’s products. Most of them are based on simple linear
models such as logistic regressions, which suggests that preliminary steps such
as text preprocessing, vectorization and data set rebalancing are more crucial
than resorting to complex, non-linear models. In particular, the winning con-
tributions all carefully cope with the strong imbalance of the categories, either
through random sampling or sample weighting. A distinguishing feature of the
two highest-scoring algorithms is their blending of large ensemble of models
trained on random subsets of the data. The data set is released to the public,
as we hope it will prove of valuable help to improve text and image-based
classification algorithms in a context of very large number of classes.
51

THE CDISCOUNT 2015 DATASCIENCE.NET CHALLENGE: A LARGE E-COMMERCEDATA SET RELEASED TO BENCHMARK CLASSIFICATION METHODS
6.1 Introduction . . . . . . . . . . . . . . . . . . . . . . . . . . . . . . . . . . . . . . . 53
6.2 Data set . . . . . . . . . . . . . . . . . . . . . . . . . . . . . . . . . . . . . . . . . 53
6.3 Description of the challenge . . . . . . . . . . . . . . . . . . . . . . . . . . . . . . 56
6.4 Analysis of the winning contributions . . . . . . . . . . . . . . . . . . . . . . . . . 57
6.5 Teaching materials . . . . . . . . . . . . . . . . . . . . . . . . . . . . . . . . . . . 60
6.6 Conclusion . . . . . . . . . . . . . . . . . . . . . . . . . . . . . . . . . . . . . . . 60
52

THE CDISCOUNT 2015 DATASCIENCE.NET CHALLENGE: A LARGE E-COMMERCEDATA SET RELEASED TO BENCHMARK CLASSIFICATION METHODS
6.1 Introduction
E-commerce companies have become major actors of the retail business over the past decade
(Turban et al., 2015). As the product catalog of the largest companies now routinely exceeds
several millions of distinct items, a large part of which from third-party sellers, and users are
less inclined to crawl through pages of results (Spink et al., 2002a), a salient yet increasingly
tough need consists in filling correctly the products’ characteristics in order to efficiently guide
the customers towards the products they desire. It is clear that purely manual procedures are
precluded, so one must rely on algorithms based on the description or image of the products.
In 2015, the leading French e-commerce company Cdiscount challenged the community on
the datascience.net platform on a simple, real-word question: how can one guess the category
of a product from its description, its image and other available attributes? The participants
had access to Cdiscount’s catalogue of active products, a subset of which had their category
hidden to serve as testing set and evaluate the candidates’ algorithms, thus turning the problem
into one of supervised classification. Cdiscount released the data set to the public to be used
as a practical benchmark and encourage improvements over text and image-based classification
algorithms.
The contest was held between May–August 2015 and attracted over 800 participants. In the
present paper we describe the underlying data set (Section 6.2), the challenge and evaluation
criteria (Section 6.3) and the solutions proposed by the winning candidates (Section 6.4).
6.2 Data set
The data set consists of about 15.8 millions of products, which represents virtually the whole
catalogue of Cdiscount as of May 2015. Each product is associated with a unique identifier, a
three-level category, a title, a description, a brand, a seller (Cdiscount or third party) and a price
(Table 6.1). Some products, owned and sold directly by Cdiscount itself, are also provided with
a representative image in jpeg format as additional information. The total volume of text and
image data is about 4 Gb and 1 Gb, respectively. As described hereafter, the data suffers from
flaws and inconsistencies typical of large databases involving strong user interaction. Products
do not necessarily have a brand, and their description is sometimes cut off, ending in this case
with an ellipsis. The price is set to −1 for out of stock products, and can take unrealistically
large values. More importantly, the category filled by third-party sellers is not as reliable as
that of Cdiscount’s products.
As a consequence, the vast majority of the populated categories are not strongly reliable,
third-party sellers accounting for almost 95% of the database (Table 6.2). As can be expected,
53

THE CDISCOUNT 2015 DATASCIENCE.NET CHALLENGE: A LARGE E-COMMERCEDATA SET RELEASED TO BENCHMARK CLASSIFICATION METHODS
Table 6.1 – Fields of the data set and examples of products (with associated image). Note thatthe description can end with an ellipsis.
Field Examples
Id 13110226 15572267Title Samsung LE32C450 Whirlpool AWOD2850
Lave-linge frontallevel 1 1000010900 – TV - video - son 1000003564 – Electromenager
Category level 2 1000011032 – TV 1000003786 – Gros appareillavage-sechage
level 3 1000011035 – Televiseur LCD 1000003789 – Lave-lingeDescription Televiseur LCD 32” (82 cm) HD
TV - Triple HDMI - Port USBmultimedia - Resolution: 1366 x768 - Contraste dynamique -Sublimateur de couleur - Dolb...
Lave-Linge 8.5 kg - Classeenergetique : A++ -Consommation d’energie : 240kWh/an - Consommation d’eau: 10800 Litres/an - Classed’efficacite a l’essorage: B - 1200tours/min.
Brand Samsung WhirlpoolSeller Third party CdiscountPrice 389.99e 306.49e
Associated image –
Table 6.2 – Key numbers on the data set.
15,821,950 products791,453 products sold by Cdiscount
15,030,497 products sold by third-parties5,789 distinct categories27,982 distinct brands
the ∼5,800 available categories are strongly unevenly distributed amongst the products: the
distribution of the number of products per category approximately follows a power law, which
exhibits a long tail of categories containing a large number of products (Fig. 6.1a). As a matter of
fact, about 700 categories hold 90% of the products (Fig. 6.1b) and the largest one – smartphone
covers – contains more than two millions items. Similar trends are observed for the distribution
of the ∼28,000 brands (Fig. 6.1c) and of the descriptions’ vocabulary (Fig. 6.1d) amongst the
products.
It is interesting to focus on the distribution of the attributes amongst the categories (rather
than the products), since the former shall be used to predict the latter. Fig. 6.2 shows that the
distribution of the brands and of the vocabulary amongst the categories again approximately
follow power laws. In other words, the distributions are characterized by long tails of brands
54

THE CDISCOUNT 2015 DATASCIENCE.NET CHALLENGE: A LARGE E-COMMERCEDATA SET RELEASED TO BENCHMARK CLASSIFICATION METHODS
100 101 102 103
category's size (in number of products)
101
102
freq
uen
cy o
f in
dic
ate
d s
ize
a)
0 500 1000 1500 2000 2500 3000
category's rank
10
20
30
40
50
60
70
80
90
100
cu
mu
lati
ve p
erc
en
tag
e o
f p
rod
ucts
(%
) b)
100 101 102 103
brand's number of appearances
101
102
103
freq
uen
cy o
f in
dic
ate
d n
um
ber
c)
100 101 102 103 104
word's number of appearances
101
102
103
104
105
106
freq
uen
cy o
f in
dic
ate
d n
um
ber
d)
Figure 6.1 – (a) Size distribution of the categories: size corresponds to the number of productsbelonging to a category (e.g., the point shown by an arrow indicates that there are slightly morethan 100 categories which contain only 2 products). (b) Cumulative percentage of products heldby the categories, sorted by the number of products they contain. (c) Recurrence distributionof the brands: recurrence corresponds to the number of products associated with a brand (e.g.,the point shown by an arrow indicates that more than 3,000 brands are represented by a singleproduct in the catalogue). (d) Recurrence distribution of the words of the vocabulary used indescriptions: recurrence corresponds to the number of products wherein a word of the vocabularyappears (e.g., the point shown by an arrow indicates that about 105 words of the vocabularyappear in exactly 4 distinct products).
55

THE CDISCOUNT 2015 DATASCIENCE.NET CHALLENGE: A LARGE E-COMMERCEDATA SET RELEASED TO BENCHMARK CLASSIFICATION METHODS
100 101 102
brand's nb of appearances (in categories)
101
102
103
104
freq
uen
cy o
f in
dic
ate
d n
um
ber
a)
100 101 102 103
word's nb of appearances (in categories)
101
102
103
104
105
106
freq
uen
cy o
f in
dic
ate
d n
um
ber
b)
Figure 6.2 – (a) Recurrence distribution of the brands: recurrence corresponds to the number ofdistinct categories containing at least one product associated with a given brand. (b) Recurrencedistribution of the words of the vocabulary used in product descriptions: recurrence correspondsto the number of distinct categories containing at least one product wherein a given word of thevocabulary appears.
and words that appear in many different categories: unsurprisingly, when taken individually,
most of them are uninformative with respect to the product’s category.
This section thus illustrates the kind of pitfalls and difficulties encountered when dealing
with a large, real-world e-commerce data set of products. In particular, algorithms designed to
predict the category have to cope with the strong unevenness of the distribution of the attributes
amongst the products and categories as illustrated in Figs 6.1-6.2.
6.3 Description of the challenge
In 2015, Cdiscount offered a simple challenge on the datascience.net platform based on the
data set described in the previous section: given a list of product attributes (title, description,
brand, seller and price, see Table 6.1), what is its correct category? A subset of 35,065 products,
the category of which was hidden, served to evaluate the prediction algorithms proposed by the
candidates. We built this testing set by selecting exclusively products sold by Cdiscount, as the
category filled by third-party sellers is considered not as reliable. As an evaluation metric, we
56

THE CDISCOUNT 2015 DATASCIENCE.NET CHALLENGE: A LARGE E-COMMERCEDATA SET RELEASED TO BENCHMARK CLASSIFICATION METHODS
100 101
category's size (in number of products)
102
103
freq
uen
cy o
f in
dic
ate
d s
ize
Figure 6.3 – Size distribution of the categories in the testing set: size corresponds to the numberof products belonging to a category.
simply used the proportion of correct predictions:
score =1
N
N∑i=1
⎧⎪⎨⎪⎩1 if ci = ci
0 else
, (6.1)
with N the size of the testing set and ci, ci the predicted and correct category of product i,
respectively. Note that, in order to build up a testing set not too biased towards the most
popular categories, no more than 20 products may belong to the same category. The resulting
distribution of categories amongst the products (Fig. 6.3) consequently strongly differs from that
of the whole data set (Fig. 6.1a).
The challenge attracted 838 participants who submitted 3,533 contributions. The five
highest-scoring contributions were sent to a jury, which made the final ranking based on the
score, quality and originality of the proposed solutions. The following section briefly describes
the winning contributions, which received money prizes between 500e and 9,000e.
6.4 Analysis of the winning contributions
The winning algorithms, mostly coded in Python or R, are able to predict the correct category
of 66–68% of the products in the testing set (Table 6.3). The four best algorithms use linear
models, mostly with a logistic loss function (Walker and Duncan, 1967). Interestingly, the
57

THE CDISCOUNT 2015 DATASCIENCE.NET CHALLENGE: A LARGE E-COMMERCEDATA SET RELEASED TO BENCHMARK CLASSIFICATION METHODS
Table 6.3 – Summary of the winning contributions.
Rank Score Language/library Method(s)
#1 68.3% Python/scikit-learn Logistic regression with stochasticgradient descent + multinomial naiveBayes + passive aggressive classifier
#2 68.0% Python/scikit-learn Two-stage logistic regression#3 66.9% Python, R, Vowpal Wabbit Linear classifier with square loss function#4 66.3% Python/PIL, C++, Dataiku Logistic regression#5 66.3% R/ConText Three-stage convolutional neural network
square loss function also gives good results (contribution #3), although it is known to lack
robustness against outliers. Two other linear classifiers appear in the winning contribution,
namely, the passive aggressive classifier (Crammer et al., 2006) and the naive Bayes method
(Zhang, 2004) with multinomial distribution of the features. The only non-linear model is the
convolutional neural network (Johnson and Zhang, 2015a,b), which is used by candidate #5.
All the candidates concatenate at least the title, brand and description of the products to
build input features. Candidate #2 applies larger weights to the title and the brand. Because
of the large range of values it takes and the errors it contains, the price seems more delicate
to include, but it nevertheless appears as input in two contributions (#1 and #3). In order
to tackle the above-mentioned issues, the winner assumes that values above 10,000 actually
correspond to thousandths of euros and uses as input the interval to which the price belongs,
which takes a limited number of values. Only one candidate (#4) fully integrates the images,
by associating with each product the category of the three nearest neighbours of its image,
weighted by their inverse distance, as an additional input feature. Curiously, candidate #1
finds that simply appending a piece of text describing the image’s geometry (rectangular or not
rectangular) significantly improves the categorization of books.
As can be expected when dealing with large chunks of text data with potential inconsistencies,
the candidates have to apply a variety of preprocessing techniques before the vectorization step.
These usually include lower-casing, removal of stop words, conversion to plain ascii text and
word stemming. Some candidates additionally remove numbers, or replace them with generic
strings such as —number— or —digit—. Candidate #1 also prepends the preposition “for”
(in French, “pour”) to every following word in sentences where this preposition appears, in order
to better differentiate accessories from the products to which they are associated. For example,
for the product #1963634 whose title starts with Baseus Cable Lightning format Cle
USB pour iPhone iPad iPod, the tokens pour iPhone, pour iPad and pour iPod are
58

THE CDISCOUNT 2015 DATASCIENCE.NET CHALLENGE: A LARGE E-COMMERCEDATA SET RELEASED TO BENCHMARK CLASSIFICATION METHODS
appended to the text. Candidate #4 applies the same technique to a wider set of prepositions
for the same reason, and adds the token start by <word> to the text, where <word> is
the first meaningful word of the title or of the description (i.e. not the brand, not a number. . . ):
the rationale behind this processing is that the beginning of the text often allows guessing the
product’s category. For example, for the product #5360298 whose title starts with Drone X46
2,4GHz, the token start by drone is appended to the text.
The vectorization step is then most often realized with the tf-idf statistic (Sparck Jones,
1972), wherein the concatenated text associated with a product is converted to a vector whose
ith element is proportional to the number of appearances of the ith token of the corpus within
the product’s text, and offset by the frequency of the token in the corpus. Depending on the
algorithms, tokens can be words (unigrams) or sequences of two consecutive words (bigrams).
A simple word count is also applied to some of the models in contribution #1. Candidate #5
takes on a different approach that partly preserves the order of the words, wherein the text is
split in successive regions of 15–20 contiguous words, and a word count is applied to each region.
In order to cope with the unevenness of the distribution of the categories outlined in sec-
tion 6.2, most of the candidates resort to some form of stratified sampling (Cochran, 1953): in
other words, subsets of the catalogue are randomly selected as training sets, with a limit of a
few hundreds products per category and with replacement oversampling for underrepresented
categories. Candidates #1 and #2 repeat this subsetting procedure several thousands of times
and blend the predictions from the resulting ensemble of models, which we assume to be a key
ingredient to their success. The winning algorithm actually goes a step further by (1) random
parametrising several processing steps applied to the subsets (e.g., tf-idf or word count, word
stemming or not, unigrams or bigrams. . . ) and (2) including three families of classifiers in the
ensemble of models (Table 6.3). Only candidate #3 chooses not to re-sample the catalog of
products, but rather assigns them weights inversely proportional to the frequency of appearance
of their categories.
As for the better reliability of the category of Cdiscount products (section 6.2), it is an infor-
mation only two candidates take advantage of (#1 and #5): the former candidate specifically
trains models on Cdiscount or third-party products and assigns them different weights in the
final blend; the latter candidate explicitly gives priority to Cdiscount products in the stratified
sampling step described in the previous paragraph.
Finally, candidates #2 and #5 use the three-level hierarchical structure of the categorization
(see Table 6.1) to reduce ambiguity between categories belonging to different branches, by per-
forming classifications by stage. The idea is to successively predict the category across the levels
of the hierarchical tree from top to bottom. Candidate #2 trains logistic classifiers to get the
59

THE CDISCOUNT 2015 DATASCIENCE.NET CHALLENGE: A LARGE E-COMMERCEDATA SET RELEASED TO BENCHMARK CLASSIFICATION METHODS
probabilities of belonging to the first-level categories, P (product ∈ cat1), and the conditional
probabilities of belonging to the third-level ones, P (product ∈ cat3 | product ∈ cat1), then ap-
plies the classical chain rule to estimate the desired marginal probabilities P (product ∈ cat3)
as:
P (product ∈ cat3 | product ∈ cat1) · P (product ∈ cat1) . (6.2)
Candidate #5 goes through the three levels of categories and trains one neural network per
category of a given level to predict the category of the next level.
6.5 Teaching materials
The shortage of data scientists has become a serious constraint across various sectors recently.
Such explosion in demand results in an increasing amount of data science courses both through
online platforms and in traditional schools. In those courses, it is often attempting for instructors
to focus on the theoretical part of data science, therefore the data in use is often simulated or well
prepared in advance. However, as we have seen through this challenge, data pre-processing and
cleansing is one the most distinguished factors of the winning solutions. Higher data quality often
brings more improvement in terms of prediction accuracy than more complicated modeling. We
hope that our data could serve as a field training material for students after completion of related
courses. They will not only have a chance of acquiring a deeper understanding of previously
learned models but also be better prepared for solving real-world problems after graduation.
6.6 Conclusion
In this paper we gave statistical insights into the catalog of products of Cdiscount in order
to highlight the kind of pitfalls and difficulties a classification algorithm applied to a real-world
data set has to cope with. Specifically, the potential inconsistencies of the products’ attributes,
the varying reliability of the data, the large number of categories and the extreme imbalance of
their distribution obviously complicate the classification task.
The five winning contributions of the datascience.net challenge are able to predict the correct
category of 66–68% of the products in the testing set. Most of the algorithms are based on
simple linear classifiers; in particular, the logistic regression appears in three contributions.
When dealing with noisy, imperfect data, the preliminary processing steps thus appear to be
more crucial than the choice of a complex, non-linear classifier. Another factor could be the bad
scalability of such algorithms with respect to the number of classes, which is extremely large
in our case. Preprocessing steps include text processing, vectorization and rebalancing of the
60

THE CDISCOUNT 2015 DATASCIENCE.NET CHALLENGE: A LARGE E-COMMERCEDATA SET RELEASED TO BENCHMARK CLASSIFICATION METHODS
training data. The last point is particularly salient and was tackled by all the winning candidates,
either through random stratified sampling to set up balanced training sets or by weighting
training samples by the inverse of their categories’ frequency of appearance. A distinguishing
feature of the two most accurate algorithms is their training of ensemble of thousands of models
on random subsets of the data, whose predictions are then averaged to get the final predicted
category: we thus assume this to be a key ingredient to their success.
The whole data set is released to the public. The availability of a large, real-world catalogue
of products with associated images and text attributes, together with benchmark results from
the most accurate models to date, should prove of valuable help to the scientific community
in order to improve over existing text and image-based classification algorithms in a context of
very large number of classes.
Supplementary material
The data set described in this article is released to the public and can be obtained by
contacting any of the authors affiliated with Cdiscount. Alternatively, the following mailing list
may be used: [email protected].
Acknowledgements
We thank the datascience.net team for hosting and helping us organize the 2015 categoriza-
tion challenge.
61

CHAPTER 7
PREDICTING STOCK MOVEMENT DIRECTION WITH MACHINE
LEARNING: AN EXTENSIVE STUDY ON S&P 500 STOCKS
Stocks movement direction forecasting has received a lot of attention. In-
deed, being able to make accurate forecasts has strong implications on
trading strategies. Surprisingly enough little has been published, relatively to
the importance of the topic. In this paper, we reviewed how well four classic
classification algorithms: random forest, gradient boosted trees, artificial neu-
ral network and logistic regression perform in predicting 463 stocks of the S&P
500. Several experiments were conduced to thoroughly study the predictability
of these stocks. To validate each prediction algorithm, three schemes we com-
pared: standard cross validation, sequential validation and single validation.
As expected, we were not able to predict stocks future prices from their past.
However, unexpectedly, we were able to show that taking into account recent
information – such as recently closed European and Asian indexes – to predict
S&P 500 can lead to a vast increase in predictability. Moreover, we also found
out that, among various sectors, financial sector stocks are comparatively more
easy to predict than others.
62

PREDICTING STOCK MOVEMENT DIRECTION WITH MACHINE LEARNING: ANEXTENSIVE STUDY ON S&P 500 STOCKS
7.1 Introduction . . . . . . . . . . . . . . . . . . . . . . . . . . . . . . . . . . . . . . . 64
7.2 Related Works . . . . . . . . . . . . . . . . . . . . . . . . . . . . . . . . . . . . . 66
7.3 Data Description . . . . . . . . . . . . . . . . . . . . . . . . . . . . . . . . . . . . 67
7.4 Problem Formulation . . . . . . . . . . . . . . . . . . . . . . . . . . . . . . . . . . 68
7.5 Time Series Feature Engineering . . . . . . . . . . . . . . . . . . . . . . . . . . . 69
7.6 Experiment Setup . . . . . . . . . . . . . . . . . . . . . . . . . . . . . . . . . . . 71
7.6.1 Data Pipeline . . . . . . . . . . . . . . . . . . . . . . . . . . . . . . . . . . 71
7.6.2 Validation Scheme . . . . . . . . . . . . . . . . . . . . . . . . . . . . . . . 71
7.7 Results and Analysis . . . . . . . . . . . . . . . . . . . . . . . . . . . . . . . . . . 73
7.7.1 Whether stocks are self predictable? . . . . . . . . . . . . . . . . . . . . . 73
7.7.2 What features can we use to predict stock movement direction? . . . . . . 75
7.7.3 What is the best model for stock movement direction prediction? . . . . . 76
7.7.4 What is the best validation scheme? . . . . . . . . . . . . . . . . . . . . . 77
7.7.5 Are there stocks more easily predictable than others? . . . . . . . . . . . 77
7.7.6 Is it possible to predict the S&P 500 index movement direction? . . . . . 79
7.8 Conlcusion and future directions . . . . . . . . . . . . . . . . . . . . . . . . . . . 79
63

PREDICTING STOCK MOVEMENT DIRECTION WITH MACHINE LEARNING: ANEXTENSIVE STUDY ON S&P 500 STOCKS
7.1 Introduction
Stock market has long been characterized by its dynamic, complicated, and non-stationary
nature (Fama, 1965). Market movements are dependent upon various factors ranging from polit-
ical events, firms policies, economic background, commodity prices, exchange rates, movements
of other stock markets to psychology of investors (Gidofalvi and Elkan, 2001; Committee, 2013).
In addition, the Efficient Market Hypothesis (Peters, 1996) assumes that asset prices are fair and
adjust quickly to reflect all past and present information, which implies that future stock price
movements are independent from pending and past information and should therefore follow a
random walk pattern. If this hypothesis were true, then any attempts to predict the market
would be fruitless (Taylor, 2008).
The EMH hypothesis has been tested extensively across various markets. The results are,
however, sometimes contradictory. Many early work support the random walk model (Alexander,
1961). “There is no other proposition in economics which has more solid empirical evidence
supporting it than the Efficient Market Hypothesis”, as said by Jensen (Jensen, 1978). However,
modern studies (Fama, 1991; Gallagher and Taylor, 2002) on stock markets reject the random
walk behavior of stock prices.
Besides the efficient market hypothesis, there are two schools of thought regarding stock
market predictions: fundamental analysis and technical analysis. Fundamental analysis (Dechow
et al., 2001) consists of evaluating the intrinsic value of a stock by examining the financial
condition of a company. However, the proponents of the EMH argue that the intrinsic value of
a stock is always equal to its current price. Technical analysis, on the other hand, is a study of
the market itself. Technical analysts believe market action tells everything, so price and trading
volume time series are enough for prediction tasks. Since market driving forces (i.e., human
psychologies) hardly change, the prices are then considered to be recurrent and predictable
since history always repeats itself.
In this paper, we took the technical analysis viewpoint and tried to predict stock market
movements using historical stock prices and modern tools from machine learning and artificial
intelligence. In other terms, we asked the following question: to what extent are market stock
prices self predictable?
Technical analysts traditionally build compound features from historical data, called tech-
nical indicators, representing various aspects of a stock in order to exploit recurring patterns.
Some commonly seen technical indicators include MA (moving average), RSI (Relative Strength
Index), MACD (Moving Average Convergence/Divergence Oscillator), CCI (Commodity chan-
nel index) etc. In our study we regard the movement of each stock price as a time series and
64

PREDICTING STOCK MOVEMENT DIRECTION WITH MACHINE LEARNING: ANEXTENSIVE STUDY ON S&P 500 STOCKS
perform extensive feature extraction to obtain over 200 features for each stock on a given time
window. Similar to traditional technical indicators, our newly extracted features aim to capture
different aspects of a stock thus reveal potential predictive power to stock movement.
We studied 463 stocks, which are constituents of S&P 500 index, with over 7 years of trading
history. We examined several classification models: logistic regression, artificial neural network,
random forest, and gradient boosted trees to predict the direction of tomorrow based on the
information of today. We also evaluated the usefulness of 8 global market index, including 3
Asian index (Nikkei 225, Hang Seng, and All Ords), 2 Europe index (DAX, FTSE 100) and 3
US index (NYSE Composite, Dow Jones Industrial Average, S&P 500). It is worth noticing
that Asian and Europe Markets close before US markets, therefore they can be used to provide
additional information to predict stocks of US markets. In our numerical experiments, we first
performed detailed feature selection revealing features with the most predictive power. Next we
fine tuned 4 state of the art classification algorithms and compared their prediction performance
on all of 463 stocks. Then we compared three different validation schemes for model selection
and parameter tuning and confirmed the usefulness of time-aware cross-validation. Further on,
we analyzed the predictability of stocks within different sectors and compared the prediction
performance on stocks per sector, which could provide useful advise on stock investment. Last,
we compared models with the one proposed in a recent and popular study on predicting S&P
500 index movements direction and verified the efficiency of our models.
In summary, our main contributions are the following:
1. The scope of our study is unprecedented in the existing literature, to the best of our knowl-
edge. With 463 stocks and 8 index across the globe being analyzed, more than 200 technical
indicators used as features, 4 state-of-the-art classification models involved, we conduct an
extensive analysis and comparison of different prediction approaches.
2. We provide a publicly available notebook to make our study easily reproducible 1. The data
used in this paper is also provided in the project folder.
3. We highlight that data and feature selection play a key role in such prediction task whereas
prediction performance improvement due to fine tuning remain insignificant.
4. We demonstrate that, for stock market price movement prediction, immediate past contains
most of the signal.
5. We find that stocks within financial sectors are the most predictable ones with more than 10
point of prediction accuracy above the overall average.
The rest of this paper is organized as follows. In Section 7.2, we review some related works
1. https://github.com/skyjiao/stock prediction sp500
65

PREDICTING STOCK MOVEMENT DIRECTION WITH MACHINE LEARNING: ANEXTENSIVE STUDY ON S&P 500 STOCKS
of our study. In Section 7.4, we formulate the stock movement direction prediction problem into
a classic binary classification problem. In Section 7.5, we elaborate the time series features we
create for each stock. In Section 7.6, we present our experiment design. We then follow by the
result and analysis in Section 7.7. We finally conclude our study in Section 7.8.
7.2 Related Works
In recent years, there have been a growing number of studies looking at the direction of
movements of various kinds of financial instruments. Both academia and practitioners have
made tremendous efforts to predict future movements of stock market prices and devise financial
trading strategies to translate forecasts into profits (Chen et al., 2003).
The emergence of machine learning and artificial intelligence algorithms has made it possi-
ble to tackle computationally demanding models for stock price movement direction prediction.
In (Bahrammirzaee, 2010), the author shows that AI outperformed traditional statistical meth-
ods in dealing with various financial problems including credit evaluation, portfolio management
and financial prediction/planning. In our study, we are interested in forecasting the direction
of stock price movement. Naturally, an associated trading strategy takes a short position when
direction is predicted to go down and a long position when the predicted direction is up. In (Lin
et al., 2013), the author used 53 technical indicators to predict direction of three stocks and one
index of Taiwan stock market with a SVM based approach and a prediction accuracy between
55% and 65%. In (Qian and Rasheed, 2007), the author tried to predict Dow Jones Industrial
Average index using three models including DT, KNN, and NN. After selecting the most pred-
icable period using Hurst exponent, the author restrained the scope of the study to this period
and then performed a voting based ensemble methods to combine the result of those three mod-
els to achieve a better accuracy than any single classifier. In (Kara et al., 2011), the author
used 10 technical indicators to predict Istanbul Stock Exchange National 100 Index (ISE) and
reported an over 75% accuracy using neural network. In (Patel et al., 2015), the author tried
to predict with 10 technical indicators the direction of stock movement for Indian stock market
by using two stocks and two index as samples. Attempts of predicting stock movement without
the use of technical indicators have also been made recently. In (Wang, 2014), the author tried
to predict Korean and Hong Kong market using price data alone with SVM based approach
preceded by a PCA to reduce the dimension of input features. In (Khaidem et al., 2016), the
authors used Random Forest to predict stock direction of three stocks: Apple, Samsung and
GE.
A recent survey (Zhang et al., 2017) compares 11 classification algorithms on 71 different
66

PREDICTING STOCK MOVEMENT DIRECTION WITH MACHINE LEARNING: ANEXTENSIVE STUDY ON S&P 500 STOCKS
Stock group S&P 500
Stock number 463
Start Jan 2, 2009
End Jun 30, 2017
Trading days 2139
Table 7.1 – Data summary
datasets and shows that Gradient Boosted Decision Tree (GBDT), followed by Support Vector
Machine (SVM) and Random Forest (RF) are the most accurate among their competitors. It is
also worth noticing that GBDT are rarely used in previous studies on stock direction prediction
however the model shows its superior prediction capacity against other models in many recent
Kaggle competitions 2. Therefore, in our study, we include GBDT into our candidate list along
with other most commonly used methods such as RF, ANN and Logistic Regression. SVM is
excluded in our study because of its lack of capacity to naturally provide probability estimation
of its prediction.
7.3 Data Description
This study focuses on US market consisting S&P 500 component stocks. Up to date, the
S&P 500 stock market index, maintained by S&P Dow Jones Indices, comprises 505 common
stocks issued by 500 large-cap companies and traded on American stock exchanges, and covers
about 80 percent of the American equity market by capitalization.
All the data used in this study is publicly available from yahoo finance 3. As shown in
table 7.1, the whole dataset covers the period from Jan 2, 2009 to Jun 30, 2017, a total of 2139
observations recored at each trading day.
Only 463 among 505 stocks in S&P 500 have a complete trading history on the period and
will thus be used in this study. The complete list of those 463 stocks are presented in Annex ??.
Besides those stocks, we also use 8 global index as additional source of information. There
are 3 Asian, 2 European and 3 American indices, as shown in Table 7.2. It is worth noticing
that Asian markets and European markets close earlier than US markets. Therefore index of
those foreign markets can be used to predict S&P 500 stocks of the same day, which is obviously
not the case for index of US market.
For each asset i, stock or index, let rit denote its daily log return at day t which is defined
as:
rit = logcitcit−1
, (7.1)
2. www.kaggle.com3. https://finance.yahoo.com/
67

PREDICTING STOCK MOVEMENT DIRECTION WITH MACHINE LEARNING: ANEXTENSIVE STUDY ON S&P 500 STOCKS
Index Name Country Closing Time (EST) Hours Before S&P Close
All Ordinaries Australia 0100 15
Nikkei 225 Japan 0200 14
Hang Seng Hong Kong 0400 12
DAX Germany 1130 4.5
FTSE 100 UK 1130 4.5
NYSE Composite US 1600 0
Dow Jones Industrial Average US 1600 0
S&P 500 US 1600 0
Table 7.2 – 8 global market index used as environment indicators
where cit denote the close price of asset i at day t. Notice that rit is positive when cit−1 > cit and
nonpositive otherwise. Figure 7.1 shows the daily return of Apple, Amazon and Microsoft on
our dataset.
Figure 7.1 – Daily return of Apple, Amazon and Microsoft
7.4 Problem Formulation
In the current study, we are interested in predicting the direction of stock movement on a
daily basis, i.e. the sign of rit (please see Eq (7.1) for a definition).
Time series prediction is different from classic supervised machine learning where samples are
assumed independent and identically distributed. Time series adds an explicit order dependence
68

PREDICTING STOCK MOVEMENT DIRECTION WITH MACHINE LEARNING: ANEXTENSIVE STUDY ON S&P 500 STOCKS
between observations: time. This additional dimension is both a constraint and a structure that
provides a source of additional information. An important aspect is that the future is always
completely unavailable to make predictions.
Fortunately, time series prediction can be framed as a supervised learning problem, allowing
standard linear or non-linear machine learning algorithms to be applied on it. And in our case,
predicting the stock movement direction can be framed into a binary classification problem. We
describe in the next section the features we use and the target we predict.
The task of a binary classification problem consists in deciding class membership yu of an
unknown data item xu based on a data set of N samples D = (x1, y1), · · · , (xN , yN ) of data items
xi with known class memberships yi where yi ∈ {0, 1}. The xi are usually multidimensional
vectors.
In most problem domains, there is no deterministic functional relationship y = f(x) between
y and x. In this case, the relationship between x and y has to be described more generally
by a probability distribution Pr(x, y). From statistical decision theory, it is well known that
the optimal decision is to choose the so-called Bayes classifier that maximizes the posterior
distribution Pr(y|x) (Friedman et al., 2001).
For each given asset i, the response variable yit is defined as follows:
yit =
1 if rit > 0
0 else,(7.2)
where rit is the log return of the asset i at date t defined in Equation (7.1).
The multivariate input features xit for each asset i at date t can be computed using any
information available before the prediction moment. Different approaches for extracting input
features xit will be discussed in the next Section.
7.5 Time Series Feature Engineering
In general, the goal of feature engineering is to provide strong and ideally simple relationships
between input features and the output variable for the machine learning algorithm to model.
Since our goal is to predict the next value to come based on previous values. In Section 7.4,
we explained how stock movement direction prediction could be seen as a binary classification
problem. Let us now explain what input features can be extracted to feed classification models.
One of the most natural time series features are the so-called lag features, which are values
at prior time steps. For example, a simple approach to predict the value at the next time t+ 1
is to built a model on its value at time t, t− 1, t− 2, · · · .
69

PREDICTING STOCK MOVEMENT DIRECTION WITH MACHINE LEARNING: ANEXTENSIVE STUDY ON S&P 500 STOCKS
Date rtAAPL lag 1 feature Lag 2 feature Lag 3 feature
2009-01-02 0.061348
2009-01-05 0.041338 0.061348
2009-01-06 -0.016632 0.041338 0.061348
2009-01-07 -0.021845 -0.016632 0.041338 0.061348
2009-01-08 0.018399 -0.021845 -0.016632 0.041338
2009-01-09 -0.023135 0.018399 -0.021845 -0.016632
Table 7.3 – Apple (APPL)’s lag features with step 1 to 3
The table 7.3 gives an example of lag features with step 1 to 3 on Apple (AAPL)’s daily
return time series. It is worth noticing that the very first samples do not have lag features. This
is a boundary effect. Such samples could either be dropped dealt with padding or imputing
techniques. In our study, we use the former approach since the number of neglected samples are
not significant enough to impact the modeling performance.
Another family of time series features are the so-called window features, which are extracted
over a fixed window of prior time steps. Technical indicators are a special case of window
features. For example, the commonly used k days moving average is nothing but the mean of
prior values on a windows size of k. We go beyond those traditional technical indicators and
compute more than 200 features for each given time window on a time series. Those features
can be grouped into the following 12 families.
1. Entropy and energy
2. Autocorrelation with different lags
3. Coefficients of Continuous Wavelet Transform
4. Coefficients of Fourier Transform
5. Friedrich Coefficients
6. Auto-regression coefficients
7. Quantiles of different measures
8. Symmetry related
9. Cross power spectral density at different frequencies
10. Counting related
11. Location related
12. Others (30 features), including augmented Dickey Fuller test, skewness, kurtosis, min, max,
std etc.
70

PREDICTING STOCK MOVEMENT DIRECTION WITH MACHINE LEARNING: ANEXTENSIVE STUDY ON S&P 500 STOCKS
Window features analyzed in this study are generated using the tsfresh package. Detailed
explanation about those features can be found in the documentation of tsfresh package 4.
Feature engineering is important since models cannot do any miracle without good input
features. We might try to lean on the capability of sophisticated models to decipher the problem
complexity. However, if we can better expose the inherent relationship between inputs and
outputs in the data, models should perform better. The main difficulty is the fact that underlying
inherent functional relationship between inputs and outputs is often unknown. The only feedback
we have is model performance. In effect, a default strategy is to use all available knowledge.
7.6 Experiment Setup
We refer to (Friedman et al., 2001) for details on models we use throughout the rest of this
paper: logistic regression, artificial neural network, random forest, and gradient boosted trees.
7.6.1 Data Pipeline
The experiments were performed with Python and three machine learning packages scikit-learn
for logistic regression and random forest, xgboost for gradient boosted trees and keras for neural
network.
The data pipeline of our numerical experiments is presented in 7.2.
After extracting and preprocessing data from Yahoo Finance, we performed feature extrac-
tion as described in Section 7.5 and transformed our market direction prediction task into a
standard binary classification problem as described in Section 7.4.
7.6.2 Validation Scheme
As for the numerical experiment part, in order to guarantee the accuracy and generalization
of our prediction models, we followed the standard cross-validation methodology (Friedman
et al., 2001), and divided our entire dataset into three main parts: a training set, a validation
set and a test set. The training set is used to fit the models; the validation set is used to estimated
prediction error for model selection; the test set is used for assessment of the generalization error
of the final chosen model. In our experiments, a test set of 252 samples, equivalent to data of
a trading year, is kept in a “vault” and is used only at the end of the data analysis to prevent
overfitting. Furthermore, in order to reduce the variance of the validation error, we employ a
sequential split scheme described in Figure 7.3. Instead of using a single train-validation pair,
4. https://github.com/blue-yonder/tsfresh
71

PREDICTING STOCK MOVEMENT DIRECTION WITH MACHINE LEARNING: ANEXTENSIVE STUDY ON S&P 500 STOCKS
Figure 7.2 – Data pipeline
the overall validation score is the average score on 5 disjoint validation sets trained on 5 training
sets. It is also worth noticing that the data is split into consecutive folds with respect to the
time dimension. Because of time dimension in the data, only the past should be used to predict
the future. We will show in numerical experiments the interest of the sequential split scheme
rather than classic cross validation, where one would split the folds at random without taking
into account time (please see Figure 7.4).
72
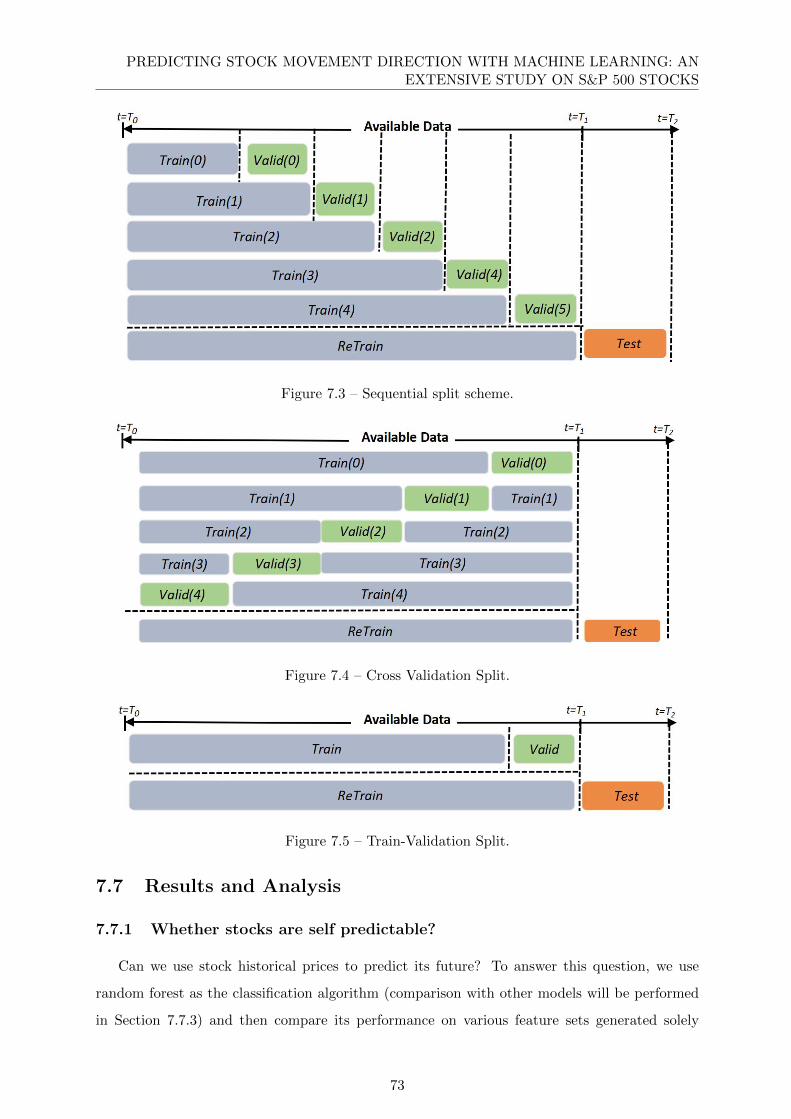
PREDICTING STOCK MOVEMENT DIRECTION WITH MACHINE LEARNING: ANEXTENSIVE STUDY ON S&P 500 STOCKS
Figure 7.3 – Sequential split scheme.
Figure 7.4 – Cross Validation Split.
Figure 7.5 – Train-Validation Split.
7.7 Results and Analysis
7.7.1 Whether stocks are self predictable?
Can we use stock historical prices to predict its future? To answer this question, we use
random forest as the classification algorithm (comparison with other models will be performed
in Section 7.7.3) and then compare its performance on various feature sets generated solely
73

PREDICTING STOCK MOVEMENT DIRECTION WITH MACHINE LEARNING: ANEXTENSIVE STUDY ON S&P 500 STOCKS
based each stock’s own past data. The lag and window feature sets can be extracted from
each stock’s past on different time windows, as described in Section 7.5. We chose two typical
window sizes: 5 and 22 which represent respectively one week and one month of trading days.
We compared the prediction performance using different feature sets on different time windows
and their results is shown in Table 7.4. It can be noticed that even with more than 200 technical
indicators generated from the past, stocks future is still hardly predictable (score slightly better
than 0.5). Increasing the window size from 5 to 22 does not bring significant uplift. Figure 7.6
presents the histogram of AUC scores obtained on those 463 stocks using different feature sets.
From the left figure, we can see that the use of window features, i.e. 220 technical indicators
generated from the past, does not provide an improvement in average AUC. And the right figure
shows that increasing window size from 5 to 22 does not bring much advantage neither.
Feature Set window size feature dim Avg AUC Std AUC
Lag + window 5 220 0.5051 0.0153Lag + window 22 220 0.5093 0.0159
Lag 5 5 0.5039 0.0156Lag 22 22 0.5028 0.0155
Table 7.4 – Prediction evaluation of 483 stocks using random forest with sequential validationscheme.
Figure 7.6 – Histogram of AUC using Random Forest
We further repeated our experiments using other classification algorithms and observed the
same pattern. Therefore, we conclude that Stock movement direction is hardly pre-
dictable from its own past data. This conclusion somehow confirms the EMH at the stock
level.
74

PREDICTING STOCK MOVEMENT DIRECTION WITH MACHINE LEARNING: ANEXTENSIVE STUDY ON S&P 500 STOCKS
7.7.2 What features can we use to predict stock movement direction?
If a stock’s own past data does not contains enough information to predict its future, can
we use other data as input features to increase the prediction performance?
Each market index is an aggregated indicator presenting a weighted average value on a given
market. It might be the case that foreign market indexes could be used to predict – say – US
stocks. We collected data of 8 market indexes in total, as shown in Table 7.2. Among those
8, 3 from US, 2 from Europe and 3 from Asia. We built lag and window features on past data
of those indexes and used them as input features to predict stocks of S&P 500, which belongs
to US market. Since both Asian and European markets close earlier than US markets, we can
use their today’s return data as input features for American stocks. However we can only use
yesterday’s return data of US market indexes to predict today’s stocks is US market. The
comparison results using feature sets generated from different indexes is shown in Table 7.5.
Compared to previous experiments using features generated from a stock’s own past, index
features can indeed dramatically increase the prediction performance. Especially, for the case
at hand, European indexes seem to have the most predictive power. The histograms of their
prediction performances on 463 stocks are compared in Figure 7.7.
It is worth noticing that European markets close 4.5 hours ahead of US markets, whereas
Asian markets close 12 to 15 hours ahead of US markets and US indexes from previous day in
fact represent data with 24 hours time lag to our prediction. It seems more recent information
is, better predictive power it provides.
Feature Set window size Avg AUC Std AUC
Lag + US Lag 5 0.4983 0.0148Lag + Asia Lag 5 0.5687 0.0257
Lag + Europe Lag 5 0.6669 0.0389
Lag + Global Lag 5 0.6702 0.0400Lag + Window 5 0.6641 0.0394
Table 7.5 – Prediction evaluation of 483 stocks using random forest with sequential validationscheme.
And again, we repeated our experiments using other classification algorithms and observed
the same pattern. Therefore, we conclude that stocks from US markets can be better
predicted with European and Asian indexes. Hence proving that the belief that stock
prices cannot be predicted using historical prices is not true at all scales: very recent data can
make a strong difference.
75

PREDICTING STOCK MOVEMENT DIRECTION WITH MACHINE LEARNING: ANEXTENSIVE STUDY ON S&P 500 STOCKS
Figure 7.7 – Histogram of AUC using Random Forest using different index features
7.7.3 What is the best model for stock movement direction prediction?
In this section, we study the impact of the model on the prediction performance. We compare
lasso penalized logistic regression, artificial neural network, random forest and gradient boosted
trees.
Details about the parameters we grid searched are presented in Table 7.6. The performances
of each of the optimized models are presented in Table 7.7. Notice that both validation and test
set performances are measured, in order to prevent overfitting in this parameter tuning stage.
In this study, logistic regression with lasso constraint outperforms other models both on
validation data and on test data. But we have to notice that the difference among fined tuned
models is not significant, especially compared to the uplift brought by using different index as
seen previously.
Logistic Regression (Lasso) C ∈ {0.01, 0.05, 0.1, 0.5, 1, 5, 10, 100}
Random Forestmax features ∈ {0.6, 0.8, 1.0}max depth ∈ {2, 3, 4, 5, 6, 8, 10, 15, 20}
Neural Network hidden nodes ∈ {16, 32, 64, 128}
Gradient Boosted Trees
colsample bytree ∈ {0.6, 0.8, 1.0}subsample ∈ {0.6, 0.8, 1.0}learning rate ∈ {0.01, 0.02, 0.05, 0.1, 0.2}
Table 7.6 – Grid Searched Model Parameters
Therefore, we conclude that, on this dataset, logistic regression with lasso penalization
76

PREDICTING STOCK MOVEMENT DIRECTION WITH MACHINE LEARNING: ANEXTENSIVE STUDY ON S&P 500 STOCKS
Model Name Avg Validation AUC Avg Test AUC
Logistic Regression (Lasso) 0.6942 0.6172
Random Forest 0.6853 0.6103
Neural Network 0.6829 0.6111
Gradient Boosted Trees 0.6835 0.6127
Blended Model 0.6953 0.6176
Table 7.7 – Prediction performance on different classification models.
achieves slightly better performances than random forests, boosted trees and neural
nets
7.7.4 What is the best validation scheme?
Cross validation is a very popular technique in machine learning tasks. However, we argue
that, in a time series context, it has to be naturally adapted to take time into account. More
specifically, what should be avoided is to take into account the future to make predictions in
the past. Yet, this is the case if standard cross validation is applied as shown in Figure 7.4.
Using a single split, as shown in Figure 7.5, fixes the problem of using the future just like the
split we propose. Hence, we compared the sequential split used throughout this study with the
two others mentioned validation schemes by measuring their prediction performance correlation
with the test data. The results in Table 7.8 show that the sequential validation split correlates
the most among the other two.
Model Name Validation Scheme Validation-Test Correlation
Logistic Regression (Lasso)
Sequential Validation 0.83
Cross Validation 0.81
Single Validation 0.77
Table 7.8 – Validation Schemes Comparison
Hence, we conclude that, at least on this dataset but we believe more generally too, sequen-
tial split is a better choice than general cross validation and single split.
7.7.5 Are there stocks more easily predictable than others?
Prediction performance differs significantly across stocks. It is therefore interesting to see
if there are groups of stocks that are more amenable to predictions than others. It could also
provide some investment suggestions and potential trading strategies. Table 7.9 shows that top
77
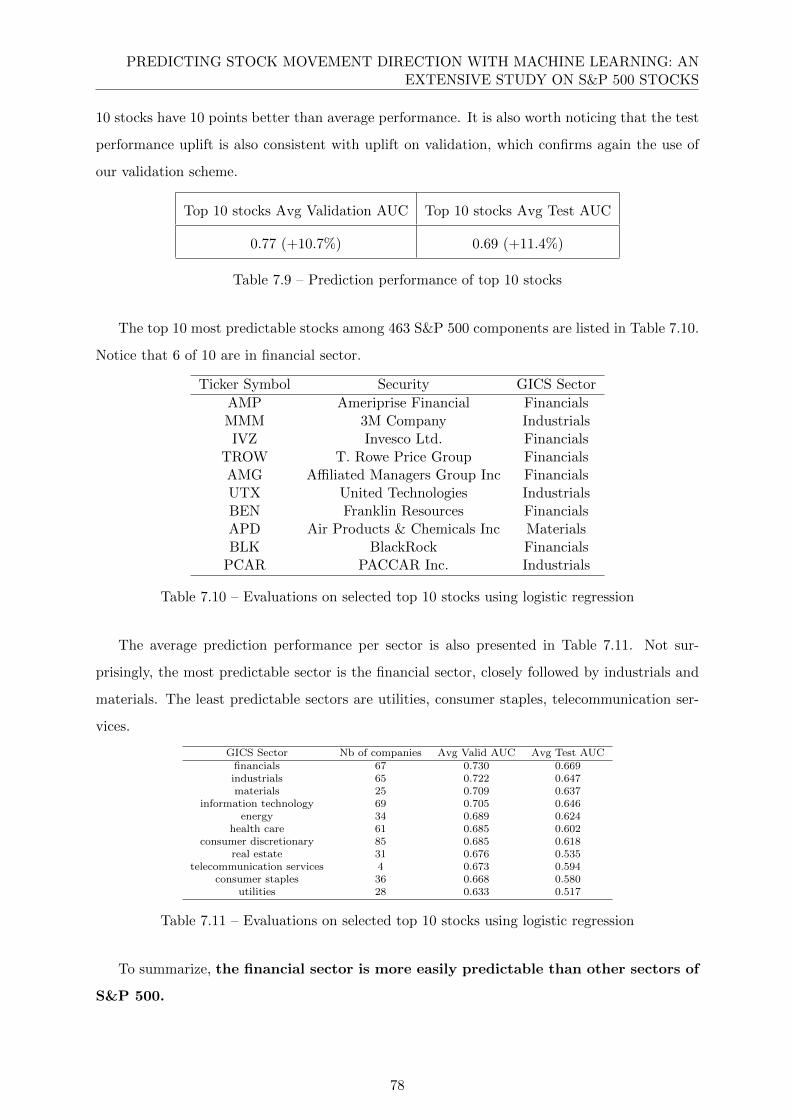
PREDICTING STOCK MOVEMENT DIRECTION WITH MACHINE LEARNING: ANEXTENSIVE STUDY ON S&P 500 STOCKS
10 stocks have 10 points better than average performance. It is also worth noticing that the test
performance uplift is also consistent with uplift on validation, which confirms again the use of
our validation scheme.
Top 10 stocks Avg Validation AUC Top 10 stocks Avg Test AUC
0.77 (+10.7%) 0.69 (+11.4%)
Table 7.9 – Prediction performance of top 10 stocks
The top 10 most predictable stocks among 463 S&P 500 components are listed in Table 7.10.
Notice that 6 of 10 are in financial sector.
Ticker Symbol Security GICS Sector
AMP Ameriprise Financial FinancialsMMM 3M Company IndustrialsIVZ Invesco Ltd. Financials
TROW T. Rowe Price Group FinancialsAMG Affiliated Managers Group Inc FinancialsUTX United Technologies IndustrialsBEN Franklin Resources FinancialsAPD Air Products & Chemicals Inc MaterialsBLK BlackRock Financials
PCAR PACCAR Inc. Industrials
Table 7.10 – Evaluations on selected top 10 stocks using logistic regression
The average prediction performance per sector is also presented in Table 7.11. Not sur-
prisingly, the most predictable sector is the financial sector, closely followed by industrials and
materials. The least predictable sectors are utilities, consumer staples, telecommunication ser-
vices.
GICS Sector Nb of companies Avg Valid AUC Avg Test AUCfinancials 67 0.730 0.669industrials 65 0.722 0.647materials 25 0.709 0.637
information technology 69 0.705 0.646energy 34 0.689 0.624
health care 61 0.685 0.602consumer discretionary 85 0.685 0.618
real estate 31 0.676 0.535telecommunication services 4 0.673 0.594
consumer staples 36 0.668 0.580utilities 28 0.633 0.517
Table 7.11 – Evaluations on selected top 10 stocks using logistic regression
To summarize, the financial sector is more easily predictable than other sectors of
S&P 500.
78

PREDICTING STOCK MOVEMENT DIRECTION WITH MACHINE LEARNING: ANEXTENSIVE STUDY ON S&P 500 STOCKS
7.7.6 Is it possible to predict the S&P 500 index movement direction?
In the previous sections, we tried to predict the movement direction of each individual stock
of S&P 500. In this section we try to predict the S&P 500 index itself using indexes of other
markets. Similar experiments have been released recently using the Tensorflow framework 5 by C.
Elston. In the mentioned experiments, the authors adopted the single train-test split and used a
feed forward neural net with two hidden layers as classification algorithm. We implemented their
algorithm and compared their results with our fine-tuned models using the presented sequential
validation scheme. Table 7.12 sums up the comparison. Logistic regression with lasso constraint
still outperforms other models.
Model Name Validation AUC on sequential split
Elston’s algorithm 0.7623
Logistic Regression (Lasso) 0.7861
Random Forest 0.7799
Neural Network 0.7775
Gradient Boosted Trees 0.7798
Table 7.12 – Prediction performance on different classification models.
Compared to the average validation AUC on 463 stocks, we obtained a better performance
predicting S&P 500 index. Hence, we conclude that S&P 500 index is easier to predict
than its components and our proposed models outperform the one proposed by
Elston.
7.8 Conlcusion and future directions
In this paper, we tried to predict the movement direction of 463 stocks of S&P 500 using
standard machine learning algorithms and stocks themselves as features. We find out that, as it is
well known in the financial domain, stocks are hardly predictable using their own past. However
we were surprised to discover that recent data consisting of near closed indexes have considerable
predictive power on stocks. Better algorithms do improve the prediction accuracy but the uplift
still remains insignificant compared to taking into account these recently closed indexes. We
also discovered that stocks of financial sector are significantly more easily predictable than
other stocks. We further compared our models with Elston’s algorithm and achieved better
performance in predicting S&P 500 index movement direction.
5. https://cloud.google.com/solutions/machine-learning-with-financial-time-series-data
79

PREDICTING STOCK MOVEMENT DIRECTION WITH MACHINE LEARNING: ANEXTENSIVE STUDY ON S&P 500 STOCKS
Many promising future directions are to be investigated. The use of macroeconomic data
could provide another source of information. Interest rates (TS), consumer price index (CPI),
industrial production (IP), government consumption (GC), private consumption (PC), gross
national product (GNP) and gross domestic product (GDP) etc. are also publicly available to
improve this study. Besides, trading volume data could be another source of information to
further increase prediction accuracy. Moreover, going from predictions to trading strategies is a
natural path to follow.
80

CHAPTER 8
CONCLUSION AND FUTURE WORKS
Life is like riding a bicycle. To keep
your balance, you must keep moving.
Albert Einstein
8.1 Summary . . . . . . . . . . . . . . . . . . . . . . . . . . . . . . . . . . . . . . . . 82
8.2 Future works . . . . . . . . . . . . . . . . . . . . . . . . . . . . . . . . . . . . . . 84
81

CONCLUSION AND FUTURE WORKS
As described in Chapter 2, the omnipresence of data has changed the rules of the games
across various sectors especially of e-commerce and finance. As the president of Alibaba, the
Chinese Internet giant, once said, “Nine years ago, when Alibaba shifted its position from an
e-commerce company to a data company, we had a huge fight internally and finally decided that
we were shifting. So we haven’t called ourselves an e-commerce company internally for nine
years”.
Throughout this thesis, we have shown how AI can be leveraged to solve real-world problems
though four concrete applications: semantic search, search result ranking, product categorization
and stock prediction.
In this chapter, we first summarize our work in Section 8.1, then we illustrate some perspec-
tives for future works in Section 8.2.
8.1 Summary
In Chapter 4, we introduced the notion of “term entropy” and proposed a novel term weight-
ing scheme, which often serves as text similarity measurement and thus is the foundation of some
higher level tools, such as collaborative filtering, text matching etc. Tf-idf, another popular term
weighting scheme carefully reviewed in this chapter, is based on the idea that the importance
of a term cannot be decided on its number of occurrences in the database alone. Rather, term
importance, as we defined it, is based on how concentrated were the purchases it led to. This no-
tion was implemented through the computation of term entropy that we defined in this chapter.
Numerical experiments, performed on real-world purchase data, showed encouraging results for
the entropy-based term weighting over tf-idf in improving semantic search performance under
the context of e-commerce.
Later, in Chapter 5, we have continued our research on product search but this time, instead
of focusing on the semantic aspect of search queries, we have pursued their behavior aspect and
proposed a novel reranking strategy aiming at maximize the profitability of the search result
ranking. Several reranking strategies were benchmarked along on a real-world data set of user
events. In addition, we used an evaluation metric adapted to e-commerce data, which measures
the percent revenue generated by the top k items of the search results. Such metric is considered
to be closer to the one used by e-commerce marketers in real world.
A text-based reranking according to the BM25 between the products’ description and the
query’s keywords allows the top four products to capture on average about 25% of the query’s
revenue. This is much less than reranking products according to the clicks they gathered fol-
lowing the query over the last 30 days, which increases this percentage to about 48%. A linear
82

CONCLUSION AND FUTURE WORKS
autoregressive method forecasting the number of purchases from past time-series of daily clicks,
add-to-basket and purchases further reaches about 55%. The strength of the latter approach lies
in its implicit exploiting of correlation of all major user events with purchases in a time series
nature.
Chapter 6 summarized an AI competition that Cdiscount held on a public platform, challeng-
ing the data science community to predict the correct class of a product based on its description
and image. This competition gave us a unique opportunity to compare some of the state-of-the-
art classification algorithms on real world dataset and many meaningful insights were discovered
during in-depth analysis of those winning solutions.
The five winning contributions of the challenge were able to predict the correct category of
66–68% of the products in the testing set. Most of the algorithms were based on simple linear
classifiers; in particular, the logistic regression appeared in three contributions. When dealing
with noisy, imperfect data, the preliminary processing steps thus appeared to be more crucial
than the choice of a complex, non-linear classifier. A distinguishing feature of the two most
accurate algorithms was their training of ensemble of thousands of models on random subsets
of the data, whose predictions were then averaged to get the final predicted category: we thus
assume this to be a key ingredient to their success.
We also released the whole dataset to the public for the purpose of reproducible science,
which could also provide a common playground for researchers of related fields to improve over
existing text and image based classification algorithms in a context of very large number of
classes.
Finally, in Chapter 7, inspired by our previous work in Chapter 5 where a time series model
was built to predict daily sales, we took the challenge to predict one of the most difficult time
series data but also the one with the most potential value: stock and the results were quite
promising.
We attempted to predict the movement direction of 463 stocks of S&P 500 using various
machine learning algorithms and stocks themselves as features. We found out that, as it is well
known in the financial domain, stocks were hardly predictable using their own past. However we
were surprised, in a good way, to discover that recent data consisting of near closed indexes have
considerable predictive power on stocks. Better algorithms did improve the prediction accuracy
but the uplift still remained insignificant compared to taking into account these recently closed
indexes. We also discovered that stocks of financial sector were significantly more easily pre-
dictable than other stocks. With respect to predicting the S&P 500 index movement direction
itself, a comparison of our models with Elston’s algorithm was conducted and a better perfor-
83

CONCLUSION AND FUTURE WORKS
mance was recorded using our models. We also provided a publicly available Python notebook 1
reproducing some of the key results of our research, just as did Elston 2.
8.2 Future works
With the work realized by this thesis, we managed to tackle some of the most challenging
problems faced by AI practitioners. Meanwhile, as a natural consequence, interesting aspects
to continue working on appeared. In this section, we will describe some promising perspectives
for future works.
In Chapter 4 and 5, we have targeted on product search and its related result ranking
problem. The term weighting scheme proposed in Chapter 4 has made significant improvement
on search accuracy but it is still indifferent to the containing query, such that the same term has
the same importance in different queries. Effort in removing such synonymic effect from query
analysis has been made by many researchers of this field and should constitute a promising
direction to follow. As for the reranking strategy proposed in Chapter 5, its performance is
heavily relied to the prediction accuracy of daily sales. Using more sophisticated and complex
non-linear models, rather than the auto-regression model used in this study should prove of
valuable.
Furthermore, categorization is one of the most fundamental tasks in machine learning and
has been studied actively for decades. Automatic product categorization having a significant
potential financial benefit for the company, any improvement on its accuracy would surely be
highly appreciated. We’ve noticed that the winning solutions of this categorization challenge,
presented in Chapter 6 are mainly based on text description and neglected the importance of
images. It’s our firm belief that combining the power of text and images would yield a higher
categorization accuracy.
Finally, in Chapter 7, we revealed the importance of data in stock prediction tasks. Using
more adequate data as features would produce much significant uplift than building complex
models. Therefore, a promising direction to further boost the stock prediction accuracy is to
fully deploy market data, rather than using the price data alone in the current study. Trading
volumes, macro-economic indicators, commodity prices etc. are all valuable source of informa-
tion. Another interesting direction to follow is trading strategy building based on AI based
prediction results. How to optimize the entry and exit point to minimize the trading risk while
maximize the potential benefit would certainly worth devoting efforts on.
The thesis only covers a small tip of the iceberg of what AI can do to improve our daily lives
1. https://github.com/skyjiao/stock prediction sp5002. https://cloud.google.com/solutions/machine-learning-with-financialtime-series-data
84

CONCLUSION AND FUTURE WORKS
and there will always be the next land to conquer. I’d like to kindly end this thesis by a quote
from Eliezer Yudkowsky :
“Anything that could give rise to smarter-than-human intelligence - in the form of Artificial
Intelligence, brain-computer interfaces, or neuroscience-based human intelligence enhancement
- wins hands down beyond contest as doing the most to change the world. Nothing else is even
in the same league.”
85


BIBLIOGRAPHY
Agichtein, E., Brill, E., and Dumais, S. (2006). Improving web search ranking by incorporating
user behavior information. In Proceedings of ACM Conference on Research and Development
on Information Retrieval (SIGIR).
Agrawal, R., Halverson, A., Kenthapadi, K., Mishra, N., and Tsaparas, P. (2009). Generating
labels from clicks. In Proceedings of ACM Conference on Web Search and Data Mining
(WSDM).
Ahmad, F. and Kondrak, G. (2005). Learning a spelling error model from search query logs.
In Proceedings of the conference on Human Language Technology and Empirical Methods in
Natural Language Processing, pages 955–962. Association for Computational Linguistics.
Alexander, S. S. (1961). Price movements in speculative markets: Trends or random walks.
Industrial Management Review (pre-1986), 2(2):7.
Azar, P. D. and Lo, A. W. (2016). The wisdom of twitter crowds: Predicting stock market
reactions to fomc meetings via twitter feeds. The Journal of Portfolio Management, 42(5):123–
134.
Baeza-Yates, R. and Maarek, Y. (2012). Usage data in web search: benefits and limitations. In
Scientific and Statistical Database Management, pages 495–506.
Bahrammirzaee, A. (2010). A comparative survey of artificial intelligence applications in finance:
artificial neural networks, expert system and hybrid intelligent systems. Neural Computing
and Applications, 19(8):1165–1195.
Balakrishnan, V. and Zhang, X. (2014). Implicit user behaviours to improve post-retrieval
document relevancy. Computers in Human Behavior, 33:104–112.
87

BIBLIOGRAPHY
Ballings, M., Van den Poel, D., Hespeels, N., and Gryp, R. (2015). Evaluating multiple classifiers
for stock price direction prediction. Expert Systems with Applications, 42(20):7046–7056.
Bird, S. (2006). Nltk: the natural language toolkit. In Proceedings of the COLING/ACL on
Interactive presentation sessions, pages 69–72. Association for Computational Linguistics.
Blanzieri, E. and Bryl, A. (2008). A survey of learning-based techniques of email spam filtering.
Artificial Intelligence Review, 29(1):63–92.
Buscher, G., Dengel, A., Biedert, R., and Elst, L. V. (2012). Attentive documents: Eye tracking
as implicit feedback for information retrieval and beyond. ACM Transactions on Interactive
Intelligent Systems (TiiS), 1(2):9.
Buscher, G., Dumais, S. T., and Cutrell, E. (2010). The good, the bad, and the random: an
eye-tracking study of ad quality in web search. In Proceedings of the 33rd international ACM
SIGIR conference on Research and development in information retrieval, pages 42–49. ACM.
Chan, T.-H., Jia, K., Gao, S., Lu, J., Zeng, Z., and Ma, Y. (2015). Pcanet: A simple deep learn-
ing baseline for image classification? IEEE Transactions on Image Processing, 24(12):5017–
5032.
Chen, A.-S., Leung, M. T., and Daouk, H. (2003). Application of neural networks to an emerging
financial market: forecasting and trading the taiwan stock index. Computers & Operations
Research, 30(6):901–923.
Chen, H. and Karger, D. R. (2006). Less is more: probabilistic models for retrieving fewer
relevant documents. In Proceedings of the 29th annual international ACM SIGIR conference
on Research and development in information retrieval, pages 429–436. ACM.
Chen, M., Hao, Y., Hwang, K., Wang, L., and Wang, L. (2017). Disease prediction by machine
learning over big data from healthcare communities. IEEE Access.
Chen, M. C., Anderson, J. R., and Sohn, M. H. (2001). What can a mouse cursor tell us
more?: correlation of eye/mouse movements on web browsing. In CHI’01 extended abstracts
on Human factors in computing systems, pages 281–282. ACM.
Ciregan, D., Meier, U., and Schmidhuber, J. (2012). Multi-column deep neural networks for
image classification. In Computer Vision and Pattern Recognition (CVPR), 2012 IEEE Con-
ference on, pages 3642–3649. IEEE.
Clarke, C. L., Craswell, N., and Soboroff, I. (2009). Overview of the trec 2009 web track.
Technical report, WATERLOO UNIV (ONTARIO).
88

BIBLIOGRAPHY
Cochran, W. (1953). Sampling techniques. John Wiley, Oxford.
Committee, N. P. (2013). Understanding asset prices. Nobel Prize in Economics documents
2013-1, Nobel Prize Committee.
Cortes, C. and Vapnik, V. (1995). Support-vector networks. Machine learning, 20(3):273–297.
Cover, T. M. and Thomas, J. A. (1991). Entropy, relative entropy and mutual information.
Elements of Information Theory, pages 12–49.
Crammer, K., Dekel, O., Keshet, J., Shalev-Shwartz, S., and Singer, Y. (2006). Online passive-
aggressive algorithms. Journal of Machine Learning Research, 7:551–585.
Craswell, N. and Szummer, M. (2007). Random walks on the click graph. In Proceedings
of the 30th annual international ACM SIGIR conference on Research and development in
information retrieval, pages 239–246. ACM.
Craswell, N., Zoeter, O., Taylor, M., and Ramsey, B. (2008). An experimental comparison of
click position-bias models. In Proceedings of the 2008 International Conference on Web Search
and Data Mining, pages 87–94. ACM.
Croft, W. B., Metzler, D., and Strohman, T. (2010). Search engines: Information retrieval in
practice. Addison-Wesley Reading.
Cruz, J. A. and Wishart, D. S. (2006). Applications of machine learning in cancer prediction
and prognosis. Cancer informatics, 2:59.
Cutrell, E. and Guan, Z. (2007). Eye tracking in msn search: Investigating snippet length, target
position and task types. City, pages 1–13.
Dechow, P. M., Hutton, A. P., Meulbroek, L., and Sloan, R. G. (2001). Short-sellers, fundamental
analysis, and stock returns. Journal of Financial Economics, 61(1):77–106.
Dupret, G. E. and Piwowarski, B. (2008). A user browsing model to predict search engine click
data from past observations. In Proceedings of the 31st annual international ACM SIGIR
conference on Research and development in information retrieval, pages 331–338. ACM.
Fama, E. F. (1965). The behavior of stock-market prices. The journal of Business, 38(1):34–105.
Fama, E. F. (1991). Efficient capital markets: Ii. The journal of finance, 46(5):1575–1617.
Friedman, J., Hastie, T., and Tibshirani, R. (2001). The elements of statistical learning, vol-
ume 1. Springer series in statistics New York.
89

BIBLIOGRAPHY
Gallagher, L. A. and Taylor, M. P. (2002). Permanent and temporary components of stock
prices: Evidence from assessing macroeconomic shocks. Southern Economic Journal, pages
345–362.
Gidofalvi, G. and Elkan, C. (2001). Using news articles to predict stock price movements.
Department of Computer Science and Engineering, University of California, San Diego.
Goel, S., Broder, A., Gabrilovich, E., and Pang, B. (2010). Anatomy of the long tail: ordinary
people with extraordinary tastes. In Proceedings of the third ACM international conference
on Web search and data mining, pages 201–210. ACM.
Granger, C. W. (1969). Investigating causal relations by econometric models and cross-spectral
methods. Econometrica: Journal of the Econometric Society, pages 424–438.
Guo, F., Liu, C., Kannan, A., Minka, T., Taylor, M., Wang, Y.-M., and Faloutsos, C. (2009).
Click chain model in web search. In Proceedings of the 18th international conference on World
wide web, pages 11–20. ACM.
Guresen, E., Kayakutlu, G., and Daim, T. U. (2011). Using artificial neural network models in
stock market index prediction. Expert Systems with Applications, 38(8):10389–10397.
Hamilton, J. D. (1994). Time series analysis, volume 2. Princeton university press.
Han, E.-H. S., Karypis, G., and Kumar, V. (2001). Text categorization using weight adjusted
k-nearest neighbor classification. In Pacific-asia conference on knowledge discovery and data
mining, pages 53–65. Springer.
Hasan, M. A., Parikh, N., Singh, G., and Sundaresan, N. (2011). Query suggestion for e-
commerce sites. In Proceedings of the fourth ACM international conference on Web Search
and Data Mining, pages 765–774.
Herlocker, J. L., Konstan, J. A., Borchers, A., and Riedl, J. (1999). An algorithmic framework
for performing collaborative filtering. In Proceedings of the 22nd annual international ACM
SIGIR conference on Research and Development in Information Retrieval, pages 230–237.
Hornik, K., Stinchcombe, M., and White, H. (1989). Multilayer feedforward networks are uni-
versal approximators. Neural networks, 2(5):359–366.
Hotho, A., Nurnberger, A., and Paaß, G. (2005). A brief survey of text mining. In Ldv Forum,
volume 20, pages 19–62.
90

BIBLIOGRAPHY
Huang, C.-J., Yang, D.-X., and Chuang, Y.-T. (2008). Application of wrapper approach
and composite classifier to the stock trend prediction. Expert Systems with Applications,
34(4):2870–2878.
Jain, V. and Varma, M. (2011). Learning to re-rank: query-dependent image re-ranking using
click data. In Proceedings of the 20th international conference on World Wide Web (WWW).
ACM.
Jensen, M. C. (1978). Some anomalous evidence regarding market efficiency. Journal of financial
economics, 6(2-3):95–101.
Jiao, Y., Cornec, M., and Jakubowicz, J. (2015). An entropy-based term weighting scheme and
its application in e-commerce search engines. In International Symposium on Web Algorithms
(iSWAG).
Joachims, T. (1996). A probabilistic analysis of the rocchio algorithm with tfidf for text cate-
gorization. Technical report, Carnegie-mellon univ pittsburgh pa dept of computer science.
Joachims, T. (1998). Text categorization with support vector machines: Learning with many
relevant features. Machine learning: ECML-98, pages 137–142.
Joachims, T. (2002). Optimizing search engines using clickthrough data. In Proceedings of
the eighth ACM SIGKDD international conference on Knowledge discovery and data mining,
pages 133–142. ACM.
Joachims, T., Granka, L., Pan, B., Hembrooke, H., and Gay, G. (2005). Accurately interpreting
clickthrough data as implicit feedback. In Proceedings of ACM Conference on Research and
Development on Information Retrieval (SIGIR).
Johnson, D. E., Oles, F. J., Zhang, T., and Goetz, T. (2002). A decision-tree-based symbolic
rule induction system for text categorization. IBM Systems Journal, 41(3):428–437.
Johnson, R. and Zhang, T. (2015a). Effective use of word order for text categorization with con-
volutional neural networks. In Proceedings of the North American Chapter of the Association
for Computational Linguistics (NAACL’15), number 2011, pages 103–112.
Johnson, R. and Zhang, T. (2015b). Semi-supervised convolutional neural networks for text
categorization via region embedding. In Advances in Neural Information Processing Systems,
pages 919–927.
91

BIBLIOGRAPHY
Kara, Y., Boyacioglu, M. A., and Baykan, O. K. (2011). Predicting direction of stock price
index movement using artificial neural networks and support vector machines: The sample of
the istanbul stock exchange. Expert systems with Applications, 38(5):5311–5319.
Kaundal, R., Kapoor, A. S., and Raghava, G. P. (2006). Machine learning techniques in disease
forecasting: a case study on rice blast prediction. BMC bioinformatics, 7(1):485.
Kazem, A., Sharifi, E., Hussain, F. K., Saberi, M., and Hussain, O. K. (2013). Support vector
regression with chaos-based firefly algorithm for stock market price forecasting. Applied soft
computing, 13(2):947–958.
Kearney, C. and Liu, S. (2014). Textual sentiment in finance: A survey of methods and models.
International Review of Financial Analysis, 33:171–185.
Kelly, D. and Belkin, N. J. (2004). Display time as implicit feedback: understanding task
effects. In Proceedings of the 27th annual international ACM SIGIR conference on Research
and development in information retrieval, pages 377–384. ACM.
Khaidem, L., Saha, S., and Dey, S. R. (2016). Predicting the direction of stock market prices
using random forest. arXiv preprint arXiv:1605.00003.
Kim, J., Oard, D. W., and Romanik, K. (2000). Using implicit feedback for user modeling in
internet and intranet searching.
Koller, D. and Sahami, M. (1997). Hierarchically classifying documents using very few words.
Technical report, Stanford InfoLab.
Krizhevsky, A., Sutskever, I., and Hinton, G. E. (2012). Imagenet classification with deep
convolutional neural networks. In Advances in neural information processing systems, pages
1097–1105.
Larkey, L. S. and Croft, W. B. (1996). Combining classifiers in text categorization. In Proceedings
of the 19th annual international ACM SIGIR conference on Research and development in
information retrieval, pages 289–297. ACM.
Lee, M.-C. (2009). Using support vector machine with a hybrid feature selection method to the
stock trend prediction. Expert Systems with Applications, 36(8):10896–10904.
Li, H., Xu, J., et al. (2014). Semantic matching in search. Foundations and Trends R© in
Information Retrieval, 7(5):343–469.
92

BIBLIOGRAPHY
Li, Q., Tian, M., Liu, J., and Sun, J. (2015). An implicit relevance feedback method for cbir
with real-time eye tracking. Multimedia Tools and Applications, pages 1–17.
Lin, Y., Guo, H., and Hu, J. (2013). An svm-based approach for stock market trend prediction.
In Neural Networks (IJCNN), The 2013 International Joint Conference on, pages 1–7. IEEE.
Liu, T.-Y., Xu, J., Qin, T., Xiong, W., and Li, H. (2007). Letor: Benchmark dataset for research
on learning to rank for information retrieval. In Proceedings of SIGIR workshop on learning
to rank for information retrieval.
Malkiel, B. G. and Fama, E. F. (1970). Efficient capital markets: A review of theory and
empirical work. The journal of Finance, 25(2):383–417.
McCallum, A., Nigam, K., et al. (1998). A comparison of event models for naive bayes text
classification. In AAAI-98 workshop on learning for text categorization, volume 752, pages
41–48. Madison, WI.
McCallum, A. K. (1996). Bow: A toolkit for statistical language modeling, text retrieval,
classification and clustering.
McCallum, A. K. (2002). Mallet: A machine learning for language toolkit.
McDonnell, P. (2014). Time based ranking. US Patent 8,909,655.
Medhat, W., Hassan, A., and Korashy, H. (2014). Sentiment analysis algorithms and applica-
tions: A survey. Ain Shams Engineering Journal, 5(4):1093–1113.
Metzler, D., Dumais, S., and Meek, C. (2007). Similarity measures for short segments of text. In
Advances in Information Retrieval: 29th European Conference on IR Research, ECIR 2007,
Rome, Italy, April 2-5, 2007, Proceedings, volume 4425.
Naeini, M. P., Taremian, H., and Hashemi, H. B. (2010). Stock market value prediction using
neural networks. In Computer Information Systems and Industrial Management Applications
(CISIM), 2010 International Conference on, pages 132–136. IEEE.
Nguyen, T. H., Shirai, K., and Velcin, J. (2015). Sentiment analysis on social media for stock
movement prediction. Expert Systems with Applications, 42(24):9603–9611.
Nurmi, P., Lagerspetz, E., Buntine, W., Floreen, P., and Kukkonen, J. (2008). Product retrieval
for grocery stores. In Proceedings of the 31st annual international ACM SIGIR conference on
Research and development in information retrieval, pages 781–782. ACM.
93

BIBLIOGRAPHY
Pagolu, V. S., Challa, K. N. R., Panda, G., and Majhi, B. (2016). Sentiment analysis of twitter
data for predicting stock market movements. arXiv preprint arXiv:1610.09225.
Paik, J. H. (2013). A novel tf-idf weighting scheme for effective ranking. In Proceedings of
the 36th international ACM SIGIR conference on Research and Development in Information
Retrieval, pages 343–352.
Palan, S. (2004). The efficient market hypothesis and its validity in today’s markets.
Pantel, P., Lin, D., et al. (1998). Spamcop: A spam classification & organization program. In
Proceedings of AAAI-98 Workshop on Learning for Text Categorization, pages 95–98.
Parikh, N., Sriram, P., and Al Hasan, M. (2013). On segmentation of ecommerce queries. In
Proceedings of the 22nd ACM international conference on Information & Knowledge Manage-
ment, pages 1137–1146.
Parikh, N. and Sundaresan, N. (2008). Inferring semantic query relations from collective user
behavior. In Proceedings of the 17th ACM conference on Information and Knowledge Man-
agement, pages 349–358.
Patel, J., Shah, S., Thakkar, P., and Kotecha, K. (2015). Predicting stock and stock price
index movement using trend deterministic data preparation and machine learning techniques.
Expert Systems with Applications, 42(1):259–268.
Peters, E. E. (1996). Chaos and order in the capital markets: a new view of cycles, prices, and
market volatility, volume 1. John Wiley & Sons.
Porter, M. (2001). Snowball: A language for stemming algorithms.
Qian, B. and Rasheed, K. (2007). Stock market prediction with multiple classifiers. Applied
Intelligence, 26(1):25–33.
Rajaraman, A. and Ullman, J. D. (2011). Mining of massive datasets. Cambridge University
Press.
Ramachandran, P. (2005). Discovering user preferences by using time entries in click-through
data to improve search engine results. In Discovery Science, pages 383–385. Springer.
Rezaeiye, P. P., Fazli, M. S., et al. (2014). Use hmm and knn for classifying corneal data. arXiv
preprint arXiv:1401.7486.
Robertson, S. E., Walker, S., Jones, S., Hancock-Beaulieu, M. M., Gatford, M., et al. (1995).
Okapi at trec-3. Proceedings of the third Text REtrieval Conference (TREC-3).
94

BIBLIOGRAPHY
Rodden, K., Fu, X., Aula, A., and Spiro, I. (2008). Eye-mouse coordination patterns on web
search results pages. In CHI’08 extended abstracts on Human factors in computing systems,
pages 2997–3002. ACM.
Roul, R. K., Devanand, O. R., and Sahay, S. (2014). Web document clustering and ranking
using tf-idf based apriori approach. IJCA Proceedings on ICACEA.
Ruthven, I. (2008). Interactive information retrieval. Annual review of information science and
technology, 42(1):43–91.
Sahami, M., Dumais, S., Heckerman, D., and Horvitz, E. (1998). A bayesian approach to filtering
junk e-mail. In Learning for Text Categorization: Papers from the 1998 workshop, volume 62,
pages 98–105.
Salton, G. and McGill, M. J. (1986). Introduction to modern information retrieval.
Sands, T. M., Tayal, D., Morris, M. E., and Monteiro, S. T. (2015). Robust stock value prediction
using support vector machines with particle swarm optimization. In Evolutionary Computation
(CEC), 2015 IEEE Congress on, pages 3327–3331. IEEE.
Schapire, R. E. and Singer, Y. (2000). Boostexter: A boosting-based system for text categoriza-
tion. Machine learning, 39(2-3):135–168.
Sebastiani, F. (2002). Machine learning in automated text categorization. ACM computing
surveys (CSUR), 34(1):1–47.
Singh, G., Parikh, N., and Sundaresan, N. (2012). Rewriting null e-commerce queries to rec-
ommend products. In Proceedings of the 21st international conference on World Wide Web
(WWW). ACM.
Skuza, M. and Romanowski, A. (2015). Sentiment analysis of twitter data within big data
distributed environment for stock prediction. In Computer Science and Information Systems
(FedCSIS), 2015 Federated Conference on, pages 1349–1354. IEEE.
Sparck Jones, K. (1972). A statistical interpretation of term specifity and its application in
retrieval. Journal of Documentation, 28(1):11–21.
Sparck Jones, K. (2004). Idf term weighting and ir research lessons. Journal of documentation,
60(5):521–523.
Sparck-Jones, K., Robertson, S. E., and Sanderson, M. (2007). Ambiguous requests: implications
for retrieval tests, systems and theories. In ACM SIGIR Forum, volume 41, pages 8–17. ACM.
95

BIBLIOGRAPHY
Spink, A., Jansen, B., Wolfram, D., and Saracevic, T. (2002a). From e-sex to e-commerce: Web
search changes. IEEE Computer, 35(3):107–109.
Spink, A., Jansen, B. J., Wolfram, D., and Saracevic, T. (2002b). From e-sex to e-commerce:
Web search changes. IEEE Computer, pages 35(3), 107–109.
Taylor, S. J. (2008). Modelling financial time series. world scientific.
Ticknor, J. L. (2013). A bayesian regularized artificial neural network for stock market forecast-
ing. Expert Systems with Applications, 40(14):5501–5506.
Turban, E., King, D., Lee, J., Liang, T., and Turban, D. (2015). Electronic commerce: A
managerial and social networks perspective. Springer.
Vapnik, V. N. and Kotz, S. (1982). Estimation of dependences based on empirical data, vol-
ume 40. Springer-Verlag New York.
Veilumuthu, A. and Ramachandran, P. (2007). Discovering implicit feedbacks from search engine
log files. In Discovery Science, pages 231–242. Springer.
Voorhees, E. M. (2003). Overview of trec 2003. In Proceedings of the Text REtrieval Conference.
Walker, S. and Duncan, D. (1967). Estimation of the probability of an event as a function of
several independent variables. Biometrika, 54(1867):167–179.
Wang, K., Gloy, N., and Li, X. (2010). Inferring search behaviors using partially observable
markov (pom) model. In Proceedings of the third ACM international conference on Web
search and data mining, pages 211–220. ACM.
Wang, Y. (2014). Stock price direction prediction by directly using prices data: an empirical
study on the kospi and hsi. International Journal of Business Intelligence and Data Mining,
9(2):145–160.
White, R. W. and Buscher, G. (2012). Text selections as implicit relevance feedback. In Pro-
ceedings of the 35th international ACM SIGIR conference on Research and development in
information retrieval, pages 1151–1152. ACM.
Wiener, N. (1956). The theory of prediction. Modern Mathematics for Engineers.
Xu, B., Guo, X., Ye, Y., and Cheng, J. (2012). An improved random forest classifier for text
categorization. JCP, 7(12):2913–2920.
96

BIBLIOGRAPHY
Xue, G.-R., Zeng, H.-J., Chen, Z., Yu, Y., Ma, W.-Y., Xi, W., and Fan, W. (2004). Optimizing
web search using web click-through data. In Proceedings of the thirteenth ACM international
conference on Information and knowledge management, pages 118–126. ACM.
Yang, B., Parikh, N., Singh, G., and Sundaresan, N. (2014). A study of query term deletion using
large-scale e-commerce search logs. In Advances in Information Retrieval, pages 235–246.
Yang, Y. and Liu, X. (1999). A re-examination of text categorization methods. In Proceedings
of the 22nd annual international ACM SIGIR conference on Research and development in
information retrieval, pages 42–49. ACM.
Yu, B. and Xu, Z.-b. (2008). A comparative study for content-based dynamic spam classification
using four machine learning algorithms. Knowledge-Based Systems, 21(4):355–362.
Yuan, Y. (2013). Forecasting the movement direction of exchange rate with polynomial smooth
support vector machine. Mathematical and Computer Modelling, 57(3):932–944.
Yue, Y., Patel, R., and Roehrig, H. (2010). Beyond position bias: Examining result attrac-
tiveness as a source of presentation bias in clickthrough data. In Proceedings of the 19th
international conference on World wide web, pages 1011–1018. ACM.
Zbikowski, K. (2015). Using volume weighted support vector machines with walk forward testing
and feature selection for the purpose of creating stock trading strategy. Expert Systems with
Applications, 42(4):1797–1805.
Zhang, C., Liu, C., Zhang, X., and Almpanidis, G. (2017). An up-to-date comparison of state-
of-the-art classification algorithms. Expert Systems with Applications, 82:128–150.
Zhang, H. (2004). The optimality of naive Bayes. In Proceedings of the Seventeenth International
Florida Artificial Intelligence Research Society Conference, Miami Beach. FL: AAAI Press.
97