applications of mobile lidar and uav sourced …tpingel.org/documents/presentations/pingel and...
TRANSCRIPT
Applications of Mobile LiDAR and UAV Sourced Photogrammetry
Thomas J. Pingel and Earle W. IsibueNorthern Illinois University
2017 Illinois GIS Association (ILGISA) Annual MeetingOctober 2-4, 2017
tpingel.orggithub.com/thomaspingel
Research Objectives
• Develop open source methodology to collect, process, render, and print 3D maps of the environment.
• Use UAVs, terrestrial and airborne lidar, DEMs.
• Create both indoor and outdoor maps.
• Applications– Printed maps for people with visual impairments
– Enhance and support expert decision making
– Improve education on terrain and its influence on a variety of geographic processes
2
UAV-based data capture
3
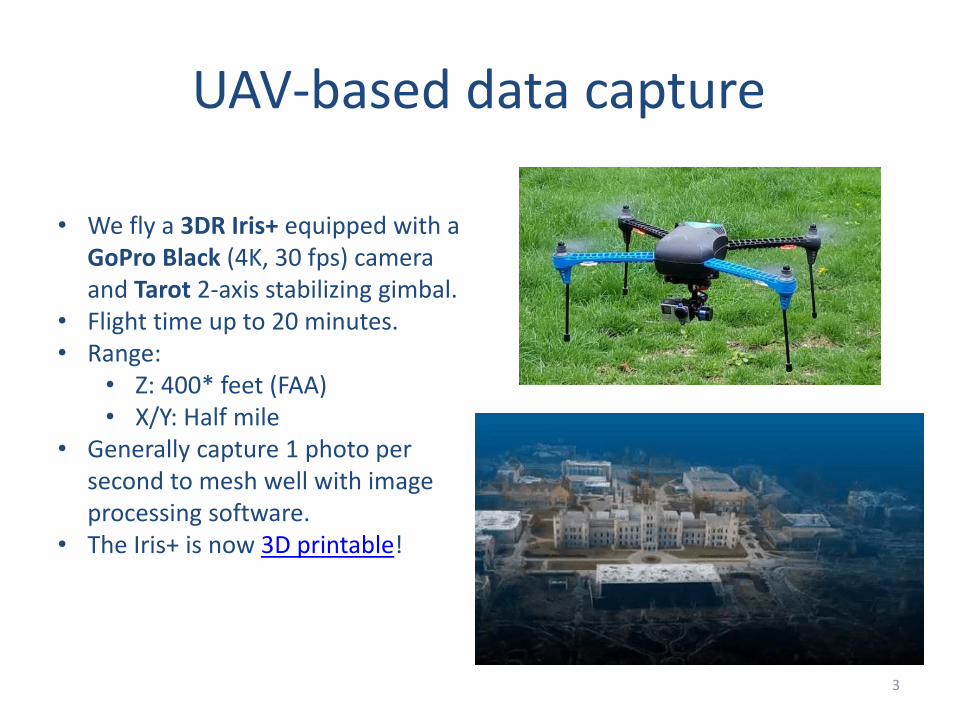
• We fly a 3DR Iris+ equipped with a GoPro Black (4K, 30 fps) camera and Tarot 2-axis stabilizing gimbal.
• Flight time up to 20 minutes.• Range:
• Z: 400* feet (FAA)• X/Y: Half mile
• Generally capture 1 photo per second to mesh well with image processing software.
• The Iris+ is now 3D printable!
3D Printed UAVs
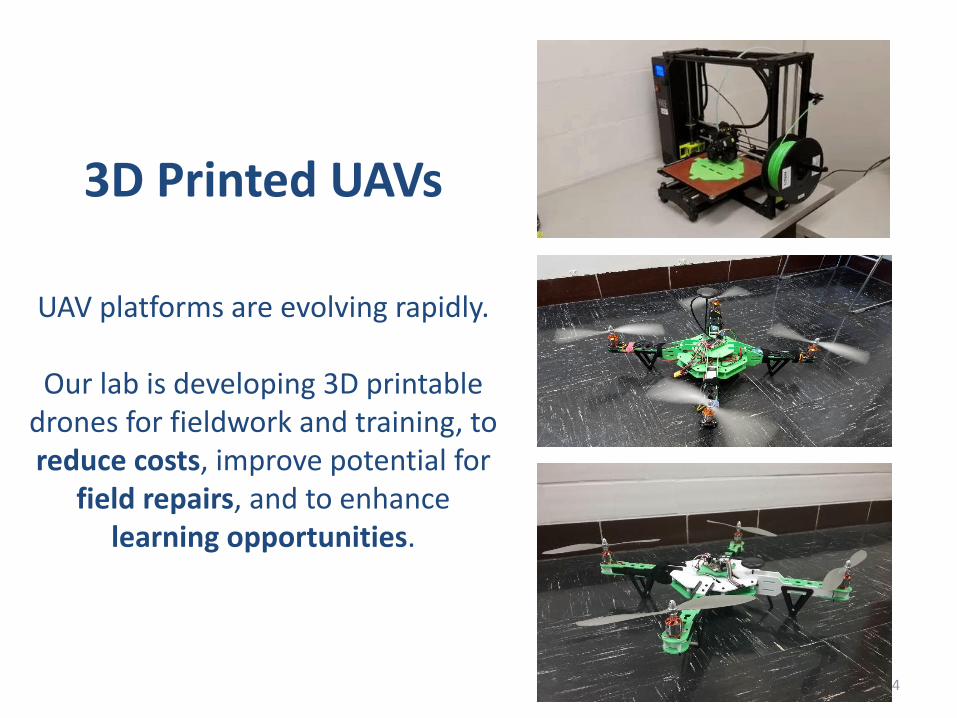
UAV platforms are evolving rapidly.
Our lab is developing 3D printable drones for fieldwork and training, to reduce costs, improve potential for
field repairs, and to enhance learning opportunities.
4

We’re currently working on a new 3D printed / MakerBeam drone.
5

6
We use Tower (for Android) and Mission Planner (for Windows) to plan and fly
autonomous missions.
Mission Planner is used to fuse the drone’s GPS data with the GoPro images to georeference
them.
GPS log and images are synchronized via a time offset
calculated from a post-hoc timestamp comparison of a
captured image.
Mission Planner
Tower
7
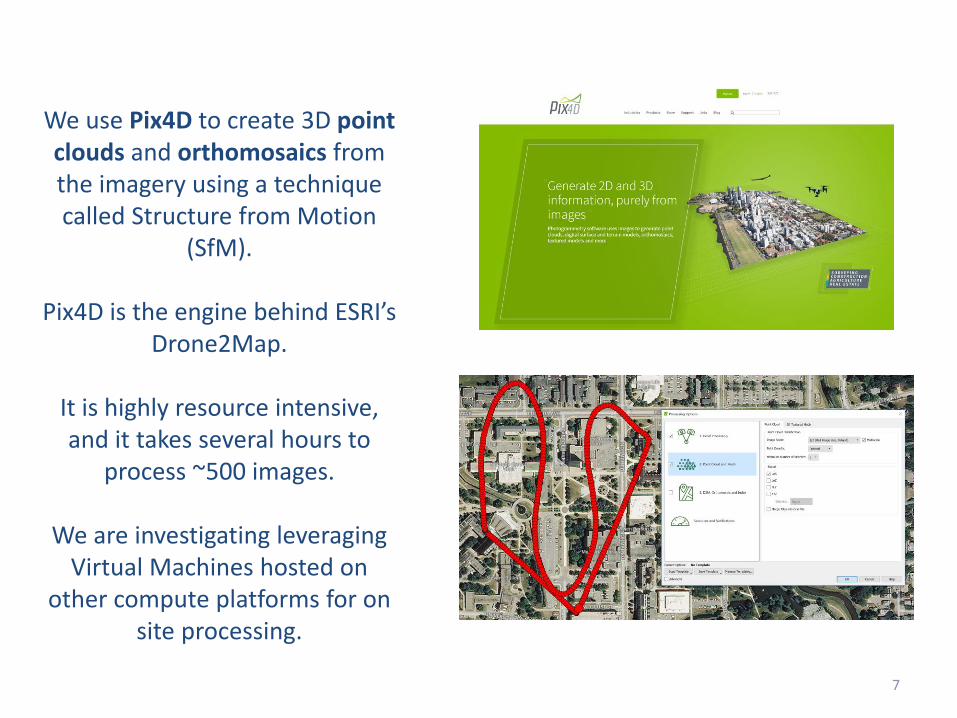
We use Pix4D to create 3D point clouds and orthomosaics from the imagery using a technique called Structure from Motion
(SfM).
Pix4D is the engine behind ESRI’s Drone2Map.
It is highly resource intensive, and it takes several hours to
process ~500 images.
We are investigating leveraging Virtual Machines hosted on
other compute platforms for on site processing.

Benchmarking Pix4D on Virtual Machines
• Why– How to handle very large scans with a fixed
wing UAV?• Test environment
– i7, 6 core, 3.3 GHz– NVIDIA 1050ti– Pix4D’s Quarry Dataset
• For initial matching (Step 1):– 12 threads + GPU: 8 min– 12 threads w/o GPU: 11 min– 6 threads + GPU: 7 min– 6 threads w/o GPU: 16 mins– VM (6 threads) w/o GPU: 22 min
• For point cloud construction (Step 2)– 12 threads + GPU: 10 mins – 12 threads w/o GPU: 11 mins – 6 threads + GPU: 15 min– 6 threads w/o GPU: 16 min– VM (6 threads) w/o GPU: 17 min
• GPU is helpful for initial matching (Step 1) but CPUs are key for point cloud construction (Step 2)
8

9
Microsoft’s free Image Composite Editor (ICE) is a passable option for some aerial work.
This is a stitched image of a farmstead in Iowa taken with a GoPro at 200 feet.
303 images stitched to 22,000 x 23,000 pixels.
Acquisition time was 12 minutes.
Effective resolution is about 1 cm.
Processing time: 5 minutes.

10
Microsoft ICE also has some fun projections for image mosaics.
11
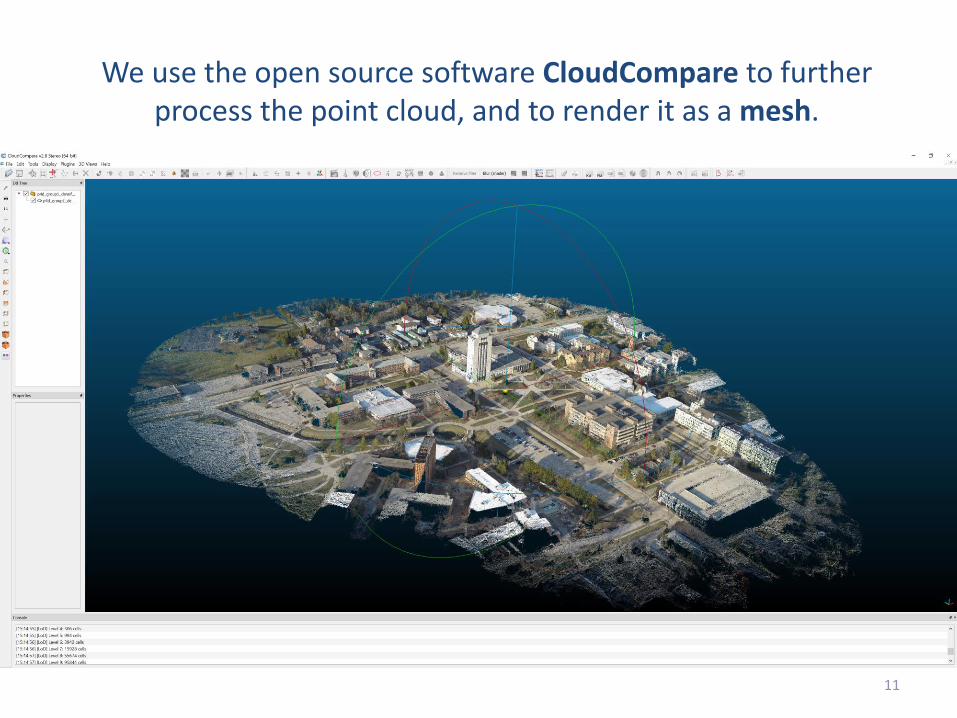
We use the open source software CloudCompare to further process the point cloud, and to render it as a mesh.

12
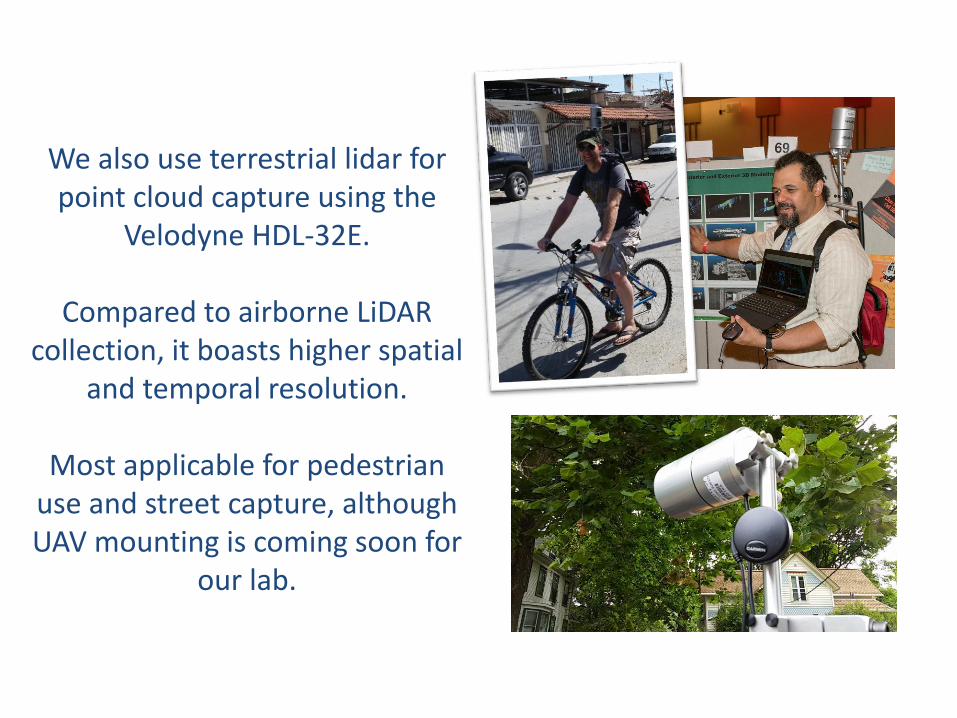
We also use terrestrial lidar for point cloud capture using the
Velodyne HDL-32E.
Compared to airborne LiDAR collection, it boasts higher spatial
and temporal resolution.
Most applicable for pedestrian use and street capture, although UAV mounting is coming soon for
our lab.
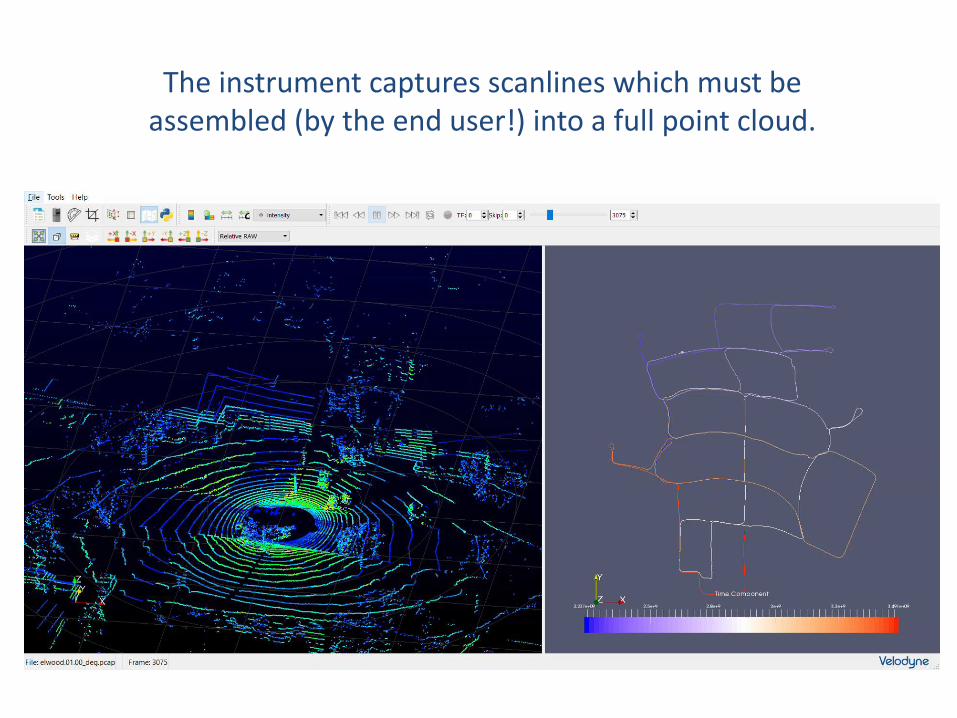
The instrument captures scanlines which must be assembled (by the end user!) into a full point cloud.
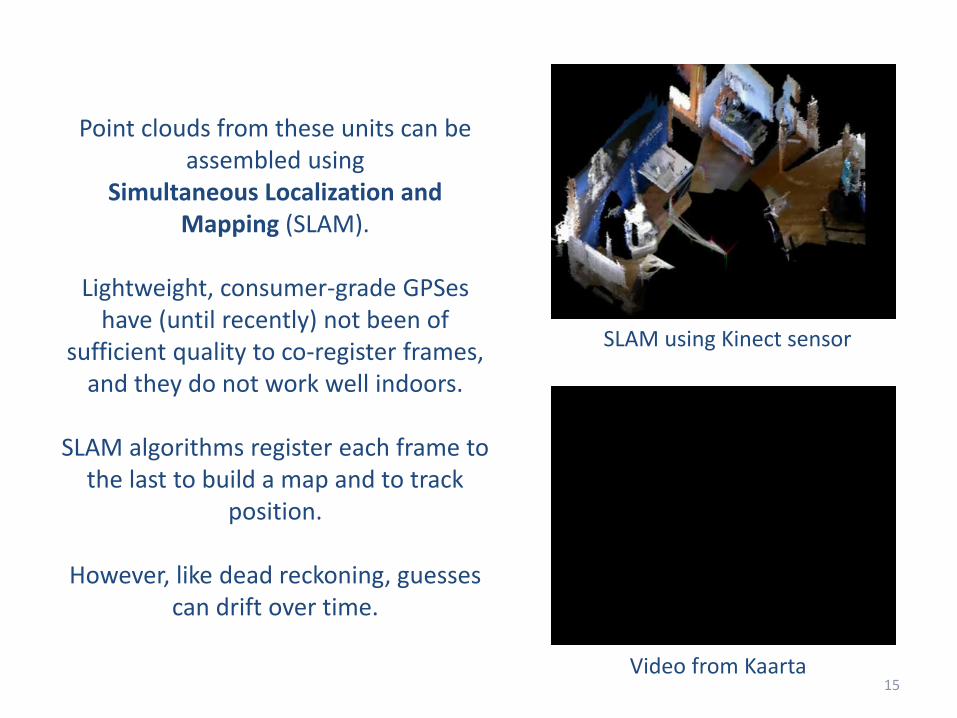
Point clouds from these units can be assembled using
Simultaneous Localization and Mapping (SLAM).
Lightweight, consumer-grade GPSeshave (until recently) not been of
sufficient quality to co-register frames, and they do not work well indoors.
SLAM algorithms register each frame to the last to build a map and to track
position.
However, like dead reckoning, guesses can drift over time.
15Video from Kaarta
SLAM using Kinect sensor

SLAM using the Robot Operating System (ROS)
16

The small, open source Reach RTK GPS will enable both precise positioning and orientation.
This will enable the assembly of point clouds either eliminating or reducing the need for SLAM, and improving results outdoors
over large footprint areas.
17
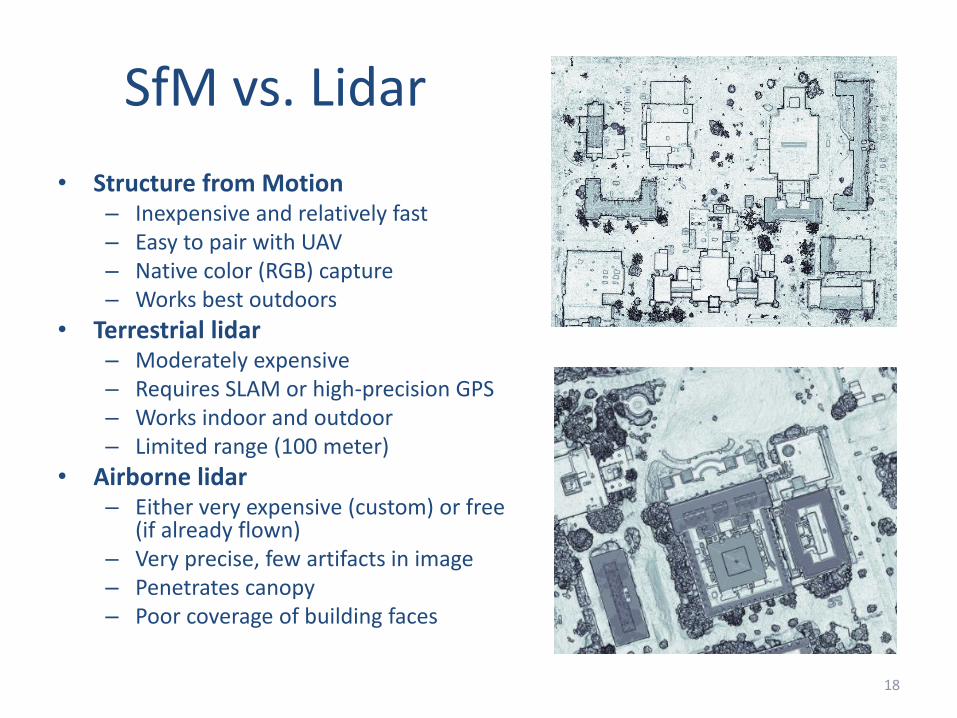
SfM vs. Lidar
• Structure from Motion– Inexpensive and relatively fast– Easy to pair with UAV– Native color (RGB) capture– Works best outdoors
• Terrestrial lidar– Moderately expensive– Requires SLAM or high-precision GPS– Works indoor and outdoor– Limited range (100 meter)
• Airborne lidar– Either very expensive (custom) or free
(if already flown)– Very precise, few artifacts in image– Penetrates canopy– Poor coverage of building faces
18
19
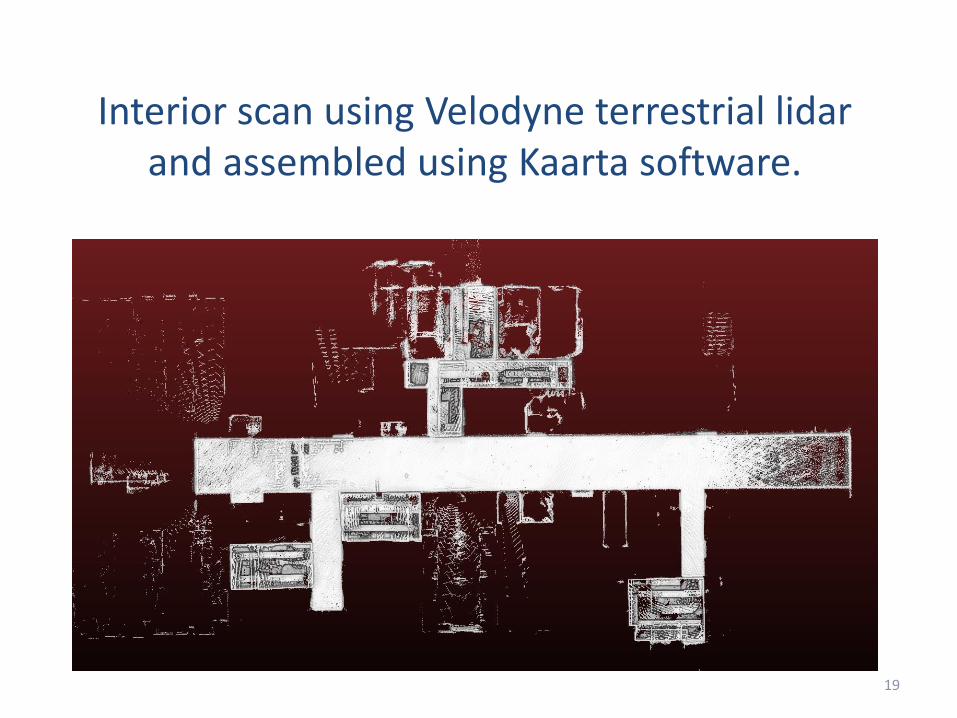
Interior scan using Velodyne terrestrial lidar and assembled using Kaarta software.
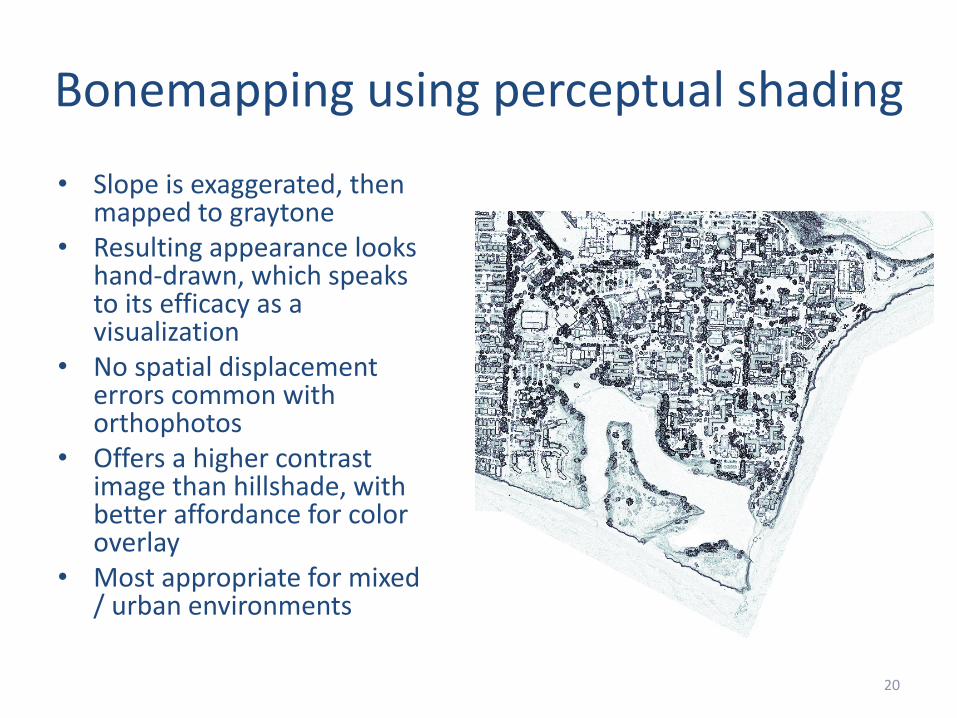
Bonemapping using perceptual shading
• Slope is exaggerated, then mapped to graytone
• Resulting appearance looks hand-drawn, which speaks to its efficacy as a visualization
• No spatial displacement errors common with orthophotos
• Offers a higher contrast image than hillshade, with better affordance for color overlay
• Most appropriate for mixed / urban environments
20
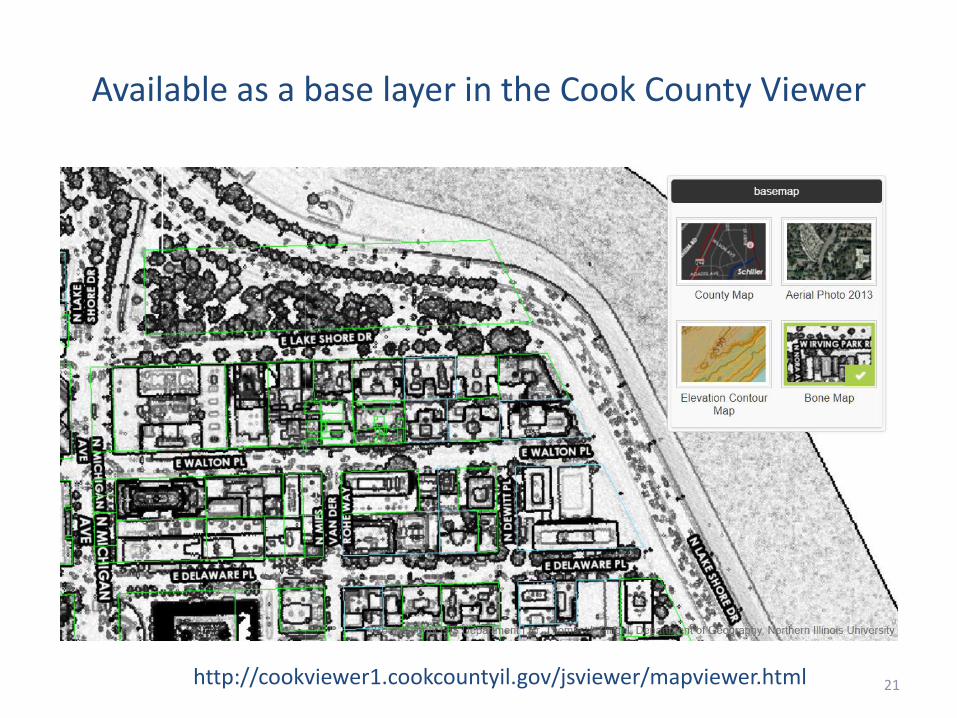
Available as a base layer in the Cook County Viewer
21http://cookviewer1.cookcountyil.gov/jsviewer/mapviewer.html
22
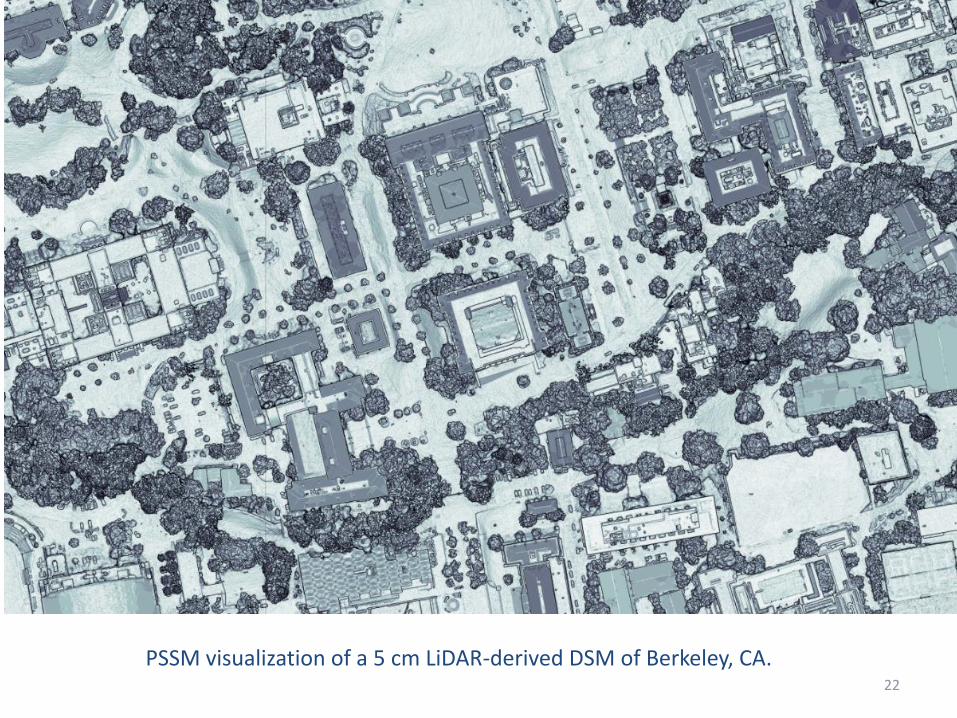
PSSM visualization of a 5 cm LiDAR-derived DSM of Berkeley, CA.
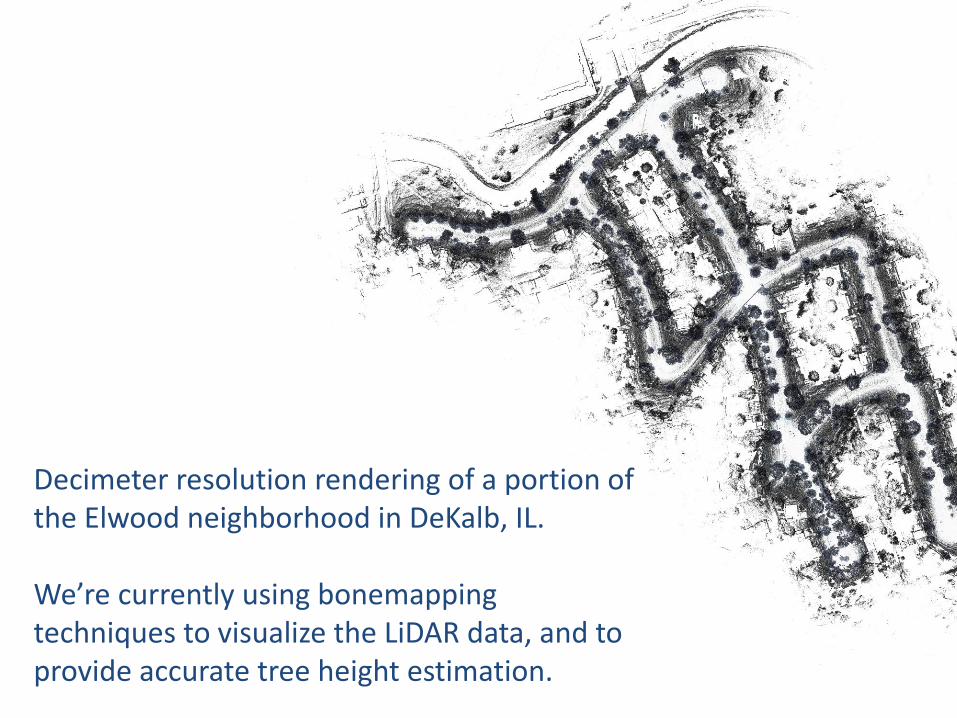
Decimeter resolution rendering of a portion of the Elwood neighborhood in DeKalb, IL.
We’re currently using bonemappingtechniques to visualize the LiDAR data, and to provide accurate tree height estimation.
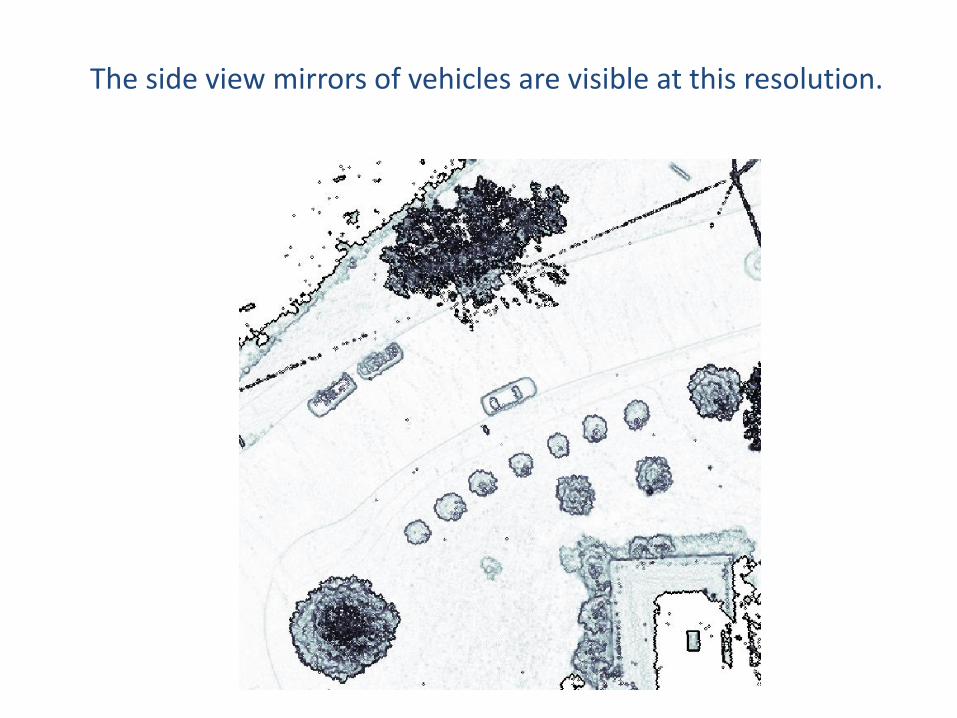
The side view mirrors of vehicles are visible at this resolution.
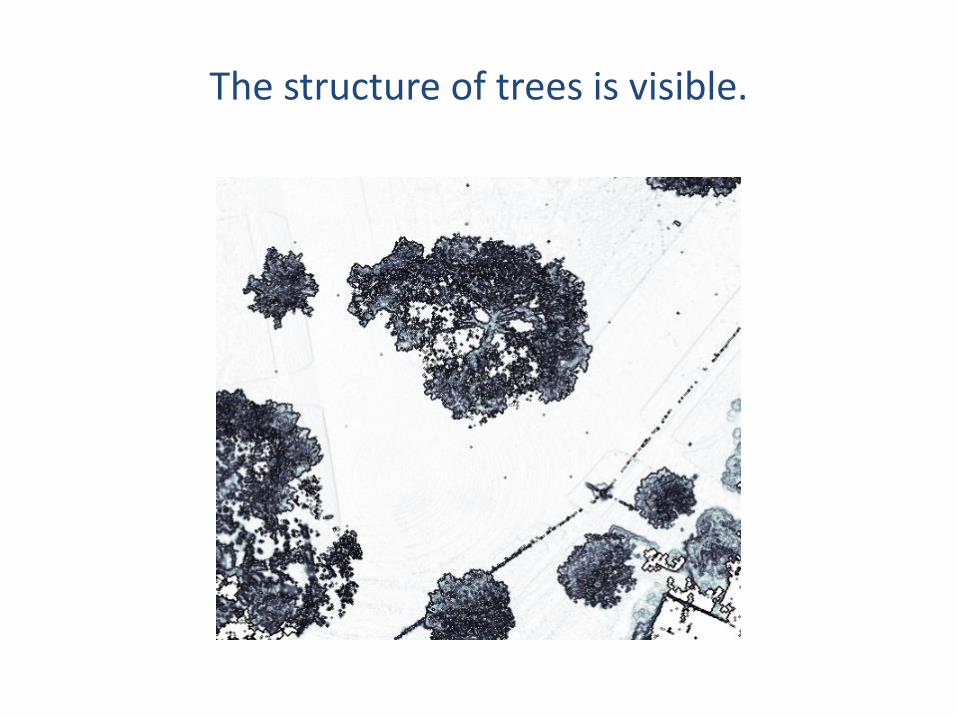
The structure of trees is visible.
26
Over the past year, we have been working on 3D printing of lidar and photogrammetry derived data.
The scans are integrated in CloudCompare using automated and manual techniques.
The meshes are sent to Cura and printed on our LulzBot TAZ 6 printer.

27
We are using similar techniques to develop 3D printed models of large-extent terrain.
The rasters are first processed using a Python script to parse the scene into layers (.25 mm thick) to improve print quality. They are saved as PNG image
files, with an integer value indicating the layer.
Cura handles the conversion of PNG to mesh.
They are printed in sizes up to 280 mm.
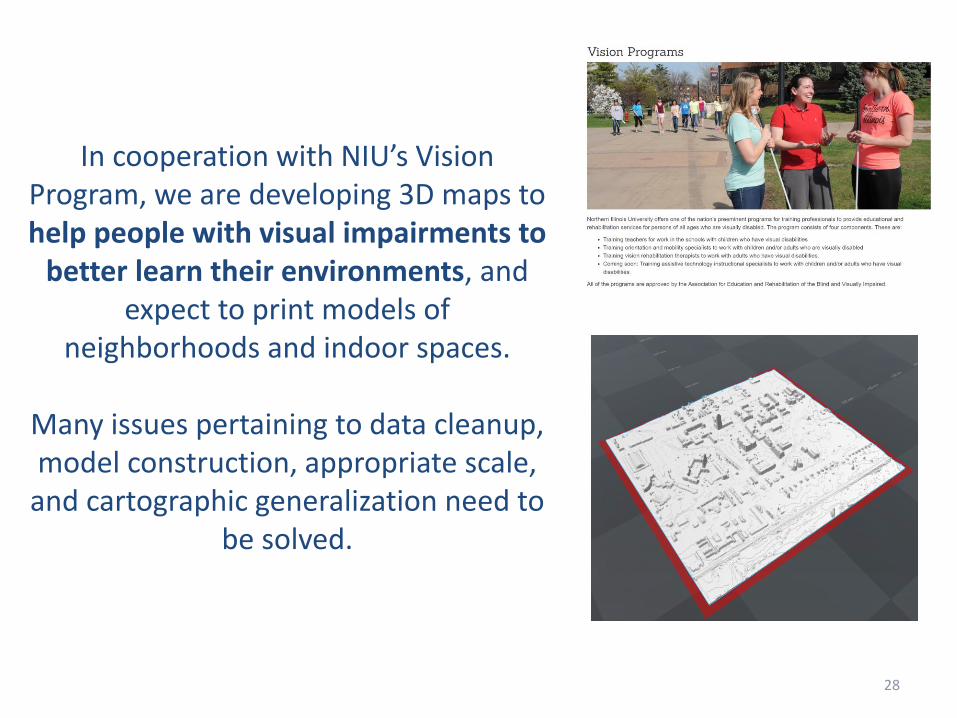
In cooperation with NIU’s Vision Program, we are developing 3D maps to help people with visual impairments to
better learn their environments, and expect to print models of
neighborhoods and indoor spaces.
Many issues pertaining to data cleanup, model construction, appropriate scale,
and cartographic generalization need to be solved.
28
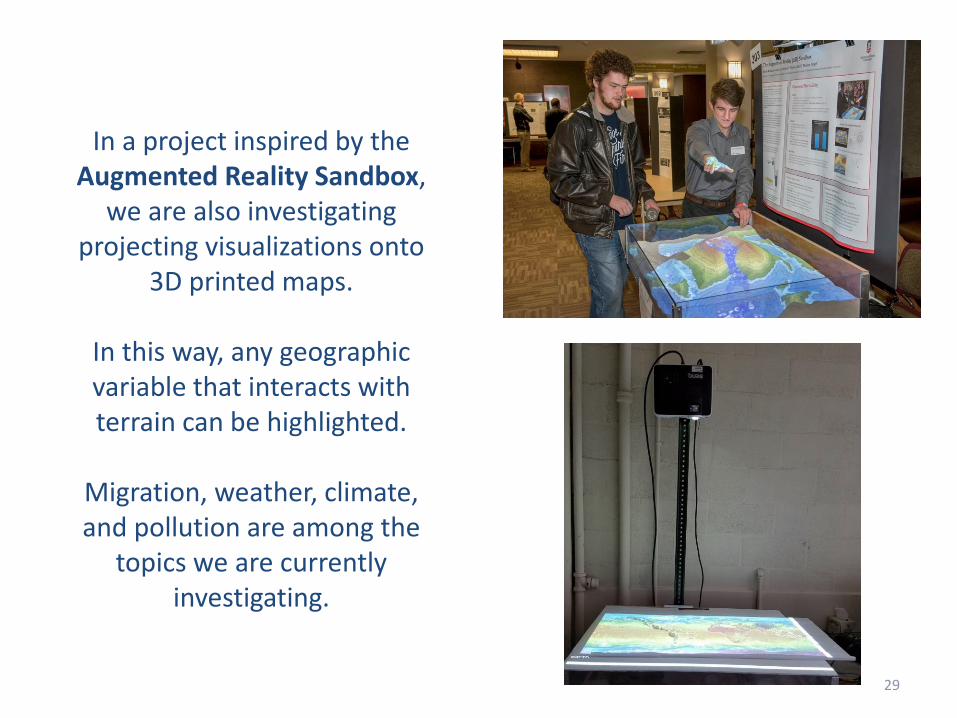
In a project inspired by the Augmented Reality Sandbox,
we are also investigating projecting visualizations onto
3D printed maps.
In this way, any geographic variable that interacts with terrain can be highlighted.
Migration, weather, climate, and pollution are among the
topics we are currently investigating.
29
Conclusions
• Lidar and photogrammetry can be combined for merged interior-exterior modeling, but there is still a significant amount of manual alignment and cleaning necessary for a quality finished product.
• Bonemapping is an easy 2D solution for visualizing this data, and can be useful for things like building footprint extraction.
• 3D printing of locally sourced point clouds currently requires a good deal of trial and error to reconstruct printable surfaces.
• There are many print applications for people with visual impairments. These kinds of maps may find purchase in campus and building orientation displays. We are currently working to develop touch-sensing technology for interaction.
• Many applications of 3D printed maps based on lidar and photogrammetry in education and public display.
• Special thanks to the Illinois Geographical Society and Northern Illinois University for grant support on this project.
30