applied cotton insect and disease pest managementcotton.tamu.edu/insects/cotton insecticide tests...
TRANSCRIPT
i
Applied Cotton Insect and Disease Pest Management Evaluations in the Texas High Plains
2008 Report
Dr. David Kerns Extension Entomologist – Cotton
Dr. Jason Woodward
Extension Plant Pathologist – Cotton/Peanuts
Dr. Terry Wheeler Research Plant Pathologist
Bo Kesey
Extension Program Specialist – Cotton Entomology
Texas AgriLife Extension Service Texas AgriLife Research and Extension Center
Lubbock Texas
February, 2009
Trade names of commercial products used in this report are included only for better understanding and clarity. Reference to commercial products or trade names is made with the understanding that no discrimination is intended and no endorsement by the Texas A&M System is implied. Readers should realize that results from one experiment do not represent conclusive evidence the same response would occur where conditions vary. Extension programs serve all people regardless of socioeconomic level, race, color, sex, religion, disability, or national origin. The Texas A&M system, U.S. Department of Agriculture, and the County Commissioners Courts of Texas Cooperating.
ii
ACKNOWLEDGEMENTS
The authors thank the following for their support of this project:
Plains Cotton Growers and Cotton Incorporated
Texas State Support for funding
Producers/Consultants-Cooperators:
Tim Black – Muleshoe Tyler Black – Muleshoe
Kendal Devault – Farwell Chad Harris – Ralls
Glenn Farms – Levelland/Wolfforth Brad Kleman – Dimmitt Dana Palmer – Lubbock
Chuck Roland – Seminole Kenneth Schilling – Dimmitt
Bruce Turnipseed - Levelland
Co-Researchers:
Dr. Megha Parajulee – Texas AgriLife Research, Lubbock Abhilash Balachandran – Graduate Research Assistant,
Department of Plant and Soil Science, Texas Tech University Brant Baugh – EA-IPM, Lubbock County
Manda Cattaneo – EA-IPM, Gaines County Greg Cronholm – EA-IPM, Hale/Swisher Counties
Tommy Doederlein, EA-IPM, Dawson/Lynn Counties Emilio Nino – EA-IPM, Castro/Lamb Counties
Scott Russell – EA-IPM, Terry/Yoakum Counties Kerry Siders – EA-IPM, Cochran/Hockley Counties Monti Vandiver – EA-IPM, Bailey/Parmer Counties
Steve Young – CEA-AG/NR, Castro County
Texas AgriLife Research:
Dr. Jane Dever Dr. Terry Wheeler Mr. Mark Arnold
Mr. Doug Nesmith Mr. Danny Meason
iii
Companies:
All-Tex
Americot / NexGen Amvac Chemical Corporation
Bayer CropScience (FiberMax, AFD, Stoneville) Croplan Genetics
Delta and Pine Land DuPont Crop Protection
FMC Corporation Agricultural Products Helena Chemical Company
ISK Biosciences Corporation Loveland Products, Inc.
MANA - Makhteshim Agan of North America, Inc. Monsanto Company
PhytoGen Syngenta Crop Protection, Inc.
Fiber and Biopolymer Research Institute Texas Tech University
Texas Department of Agriculture – Food and Fibers Research

iv
Table of Contents
Title page ....................................................................................................................................... i Acknowledgments ......................................................................................................................... ii Insects..........................................................................................................................................1 Thrips ...........................................................................................................................................1
Evaluation of At-Planting Insecticides for Thrips Control in Cotton Kendal Devault, Farwell, TX - 2008.......................................................................1
Evaluation of At-Planting Insecticides for Thrips Control and Effect on Leafminers in Cotton
Chuck Roland, Seminole, TX - 2008 .....................................................................8
Developing an Action Threshold for Thrips in the Texas High Plains - 2008 Tyler Black, Muleshoe, TX; Tim Black, Muleshoe, TX; Chuck Roland, Seminole, TX; Bruce Turnipseed, Levelland, TX; Chad Harris, Ralls, TX.........................................................................................15
Cotton Fleahoppers ..................................................................................................................32
Evaluation of Insecticides for Cotton Fleahopper Control Brad Kleman, Dimmitt, TX - 2008........................................................................32
Aphids ........................................................................................................................................37
Efficacy of Insecticides Targeting Cotton Aphids and Impact on Key Aphid Predators – 2008.............................................................................................................37 Efficacy of a Range of Rates of Carbine and Intruder on Cotton Aphids – 2008 ............43
Lygus..........................................................................................................................................47
Efficacy of Insecticides towards a Sub-threshold Chronic Infestation of Lygus Glenn Farms / Dana Palmer, Levelland, TX - 2008.............................................47
Chemical Management of Lygus in Late-Season Cotton and Impact on Yield Glenn Farms / Dana Palmer, Levelland, TX - 2008.............................................50
Worms ........................................................................................................................................58
Efficacy of Insecticides for Beet Armyworm Control in Cotton - 2008 .............................58 Evaluation of New Chemistries for Bollworm Management in the Texas High Plains
Kenneth Schilling, Dimmitt, TX - 2008.................................................................62 Boll Damage Survey of Bt and non-Bt Cotton Varieties in the South Plains Region of Texas – 2007-08 .............................................................................................................67
v
Diseases.....................................................................................................................................72 Fusarium ....................................................................................................................................72
Fusarium Wilt Trails Results from 2007 - 2008 ...............................................................72
Verticillium.................................................................................................................................78
Verticillium Wilt Trails Results from 2007 - 2008.............................................................78
Evaluation of At-Planting Insecticides for Thrips Control in Cotton, Farwell - 2008
Cooperators: Kendal Devault Farm, Cotton Grower/
Texas AgriLife Extension Service
David Kerns, Monti Vandiver and Bo Kesey Extension Entomologist-Cotton, EA-IPM Bailey/Parmer Counties
and Extension Program Specialist-Cotton
Parmer County Summary:
The use of preventive, in-furrow insecticides and seed treatments are common for managing western flower thrips, Frankliniella occidentalis (Pergande), in areas of the High Plains where thrips are especially troublesome. In this test we evaluated the efficacy of in-furrow applications of Temik, and the seed treatments Aeris, Avicta Complete Cotton, and Cruiser, and a combination of Temik and Aeris. Unfortunately, the thrips pressure in this study was very low. Unlike our 2007 Parmer County test, when significant yield loss was prevented by utilizing similar preventive treatments, we were not able to detect any benefit from using any these treatments in 2008. These data demonstrate that using preventive treatments is not always justified, and that under some conditions, using a foliar treatment regime based on an action threshold may be more cost effective.
Objective:
To determine the efficacy of at-planting insecticides targeting thrips in cotton. Materials and Methods:
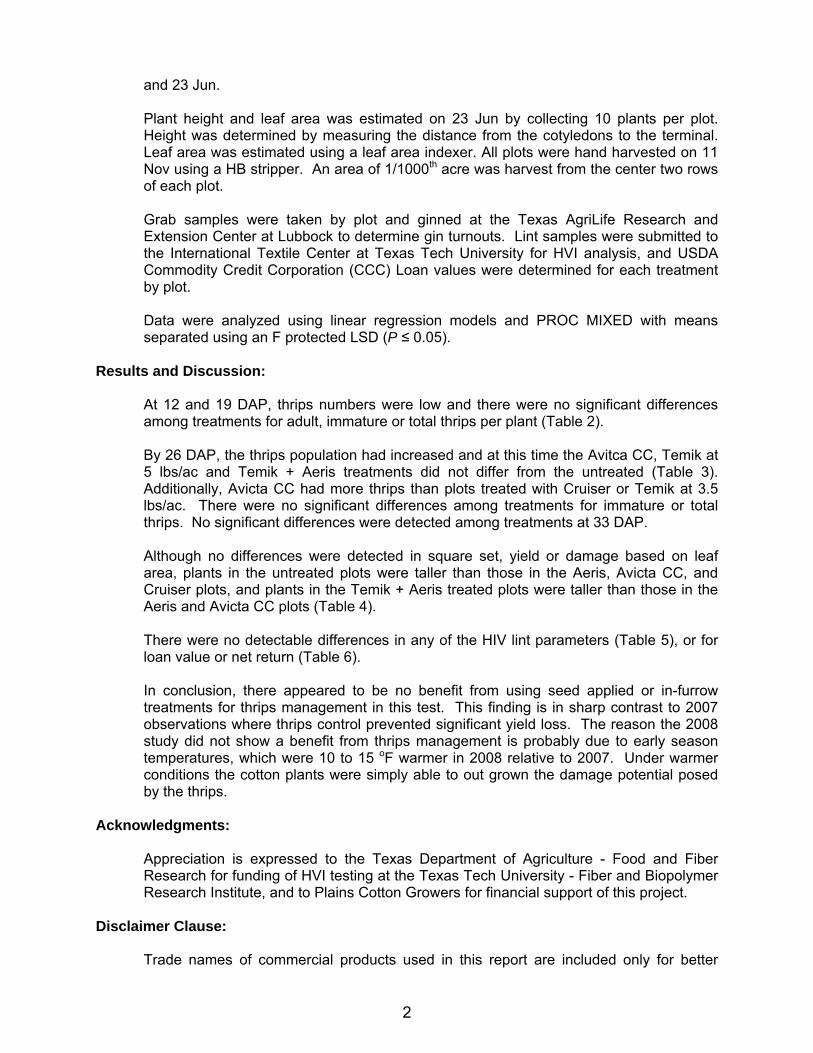
This test was conducted in a commercial cotton field near Farwell, TX, managed by the Kendal Devault Farm. The field was planted on 21 May on 30-inch rows at and seeding rate of 60,000 seeds/acre. The variety was ‘FiberMax 9063B2F’. The field was irrigated using a pivot irrigation system. The test was a randomized complete block design with four replications. Plots were 2-rows wide × 200 ft in length. Treatments, application type and timing are listed in Table 1. In-furrow insecticides were applied at planting with the seed using a granular-insecticide metering box at a depth of 1.5 inches. Adult and immature western flower thrips, Frankliniella occidentalis (Pergande), were sampled by visually inspecting 10 whole plants per plot. Samples were taken on 2, 9, 16
1
and 23 Jun. Plant height and leaf area was estimated on 23 Jun by collecting 10 plants per plot. Height was determined by measuring the distance from the cotyledons to the terminal. Leaf area was estimated using a leaf area indexer. All plots were hand harvested on 11 Nov using a HB stripper. An area of 1/1000th acre was harvest from the center two rows of each plot. Grab samples were taken by plot and ginned at the Texas AgriLife Research and Extension Center at Lubbock to determine gin turnouts. Lint samples were submitted to the International Textile Center at Texas Tech University for HVI analysis, and USDA Commodity Credit Corporation (CCC) Loan values were determined for each treatment by plot. Data were analyzed using linear regression models and PROC MIXED with means separated using an F protected LSD (P ≤ 0.05).
Results and Discussion: At 12 and 19 DAP, thrips numbers were low and there were no significant differences among treatments for adult, immature or total thrips per plant (Table 2). By 26 DAP, the thrips population had increased and at this time the Avitca CC, Temik at 5 lbs/ac and Temik + Aeris treatments did not differ from the untreated (Table 3). Additionally, Avicta CC had more thrips than plots treated with Cruiser or Temik at 3.5 lbs/ac. There were no significant differences among treatments for immature or total thrips. No significant differences were detected among treatments at 33 DAP. Although no differences were detected in square set, yield or damage based on leaf area, plants in the untreated plots were taller than those in the Aeris, Avicta CC, and Cruiser plots, and plants in the Temik + Aeris treated plots were taller than those in the Aeris and Avicta CC plots (Table 4). There were no detectable differences in any of the HIV lint parameters (Table 5), or for loan value or net return (Table 6). In conclusion, there appeared to be no benefit from using seed applied or in-furrow treatments for thrips management in this test. This finding is in sharp contrast to 2007 observations where thrips control prevented significant yield loss. The reason the 2008 study did not show a benefit from thrips management is probably due to early season temperatures, which were 10 to 15 oF warmer in 2008 relative to 2007. Under warmer conditions the cotton plants were simply able to out grown the damage potential posed by the thrips.
Acknowledgments:
Appreciation is expressed to the Texas Department of Agriculture - Food and Fiber Research for funding of HVI testing at the Texas Tech University - Fiber and Biopolymer Research Institute, and to Plains Cotton Growers for financial support of this project.
Disclaimer Clause: Trade names of commercial products used in this report are included only for better
2

understanding and clarity. Reference to commercial products or trade names is made with the understanding that no discrimination is intended and no endorsement by the Texas A&M University System is implied. Readers should realize that results from one experiment do not represent conclusive evidence that the same response would occur where conditions vary.
3
Table 1. Insecticide components, rates and application type, Kendal Devault Farm, Farwell, TX, 2008. Treatment/formulation Rate mg(AI)/seed Application type Untreated check -- -- + Dynasty CST 125FS + 0.03 seed Aerisb --b + Trilex Advancedc + 1.6 fl-oz/100 lb seed seed
Avicta Complete Cottona --a seed Cruiser 5FS 0.34 + Dynasty CST 125FS + 0.03 seed
Temik 15G 3.5 lbs/ac in-furrow + Dynasty CST 125FS + 0.03 seed Temik 15G 5.0 lbs/ac in-furrow + Dynasty CST 125FS + 0.03 seed Temik 15G 3.5 lbs/ac in-furrow + Aerisb --b + Trilex Advancedc + 1.6 fl-oz/100 lb seed seed aAvicta Complete Pak is a mixture of Avicta 500FS at 0.15 mg(AI)/seed, Cruiser 5FS at 0.34 mg(AI)/seed, and Dynasty CST 125FS at 0.03 mg(AI)/seed. bAeris is a mixture of Gaucho Grande 5FS at 0.375 mg(AI)/seed and thiodicarb at 0.375 mg(AI)/seed. cTrilex Advanced is a mixture of trifloxystrobin 8.55%, triadimenol 4.27% and metalaxy 12.82%.
4

Table 2. Mean number of thrips at 12 and 19 DAP, Kendal Devault Farm, Farwell, TX, 2008.
2 Jun – cotyledon stage (12 DAP)
9 Jun – 1 true leaf stage (19 DAP)
Thrips per plant Thrips per plant Treatment/ formulationa
Rate mg(AI)/seed
a adults immatures total adults immatures total Untreated check -- 0.06a 0.03a 0.09a 0.08a 0.04a 0.11a Aeris -- 0.05a 0.00a 0.05a 0.00a 0.00a 0.00a Avicta CC -- 0.05a 0.00a 0.05a 0.00a 0.03a 0.03a Cruiser 5FS 0.34 0.05a 0.00a 0.05a 0.00a 0.05a 0.05a Temik 15G 3.5 lb/ac 0.03a 0.00a 0.03a 0.05a 0.00a 0.05a Temik 15G 5.0 lbs/ac 0.00a 0.00a 0.00a 0.00a 0.00a 0.00a Temik 15G 3.5 lbs/ac + Aeris + -- 0.00a 0.00a 0.00a 0.00a 0.00a 0.00a
Values in a column followed by the same letter are not different based a Proc Mixed analysis with an F protected LSD (P ≥ 0.05). aSee Table 1 for full listing of treatment components and rates.
Table 3. Mean number of thrips at 26 and 33 DAP, Kendal Devault Farm, Farwell, TX, 2008.
16 Jun – 2 true leaf stage (26 DAP)
23 Jun – 4 true leaf stage (33 DAP)
Thrips per plant Thrips per plant Treatment/ formulationa
Rate mg(AI)/seeda adults immatures total adults immatures total
Untreated check -- 0.88a 0.37a 1.24a 0.13a 0.10a 0.23a Aeris -- 0.70ab 0.15a 0.85a 0.10a 0.23a 0.33a Avicta CC -- 1.05a 0.15a 1.20a 0.28a 0.08a 0.35a Cruiser 5FS 0.34 0.40b 0.20a 0.60a 0.20a 0.25a 0.45a Temik 15G 3.5 lb/ac 0.28b 0.10a 0.38a 0.30a 0.33a 0.63a Temik 15G 5.0 lbs/ac 0.68ab 0.13a 0.08a 0.25a 0.00a 0.25a Temik 15G 3.5 lbs/ac + Aeris + -- 0.65ab 0.20a 0.85a 0.18a 0.00a 0.18a
Values in a column followed by the same letter are not different based a Proc Mixed analysis with an F protected LSD (P ≥ 0.05). aSee Table 1 for full listing of treatment components and rates.
5
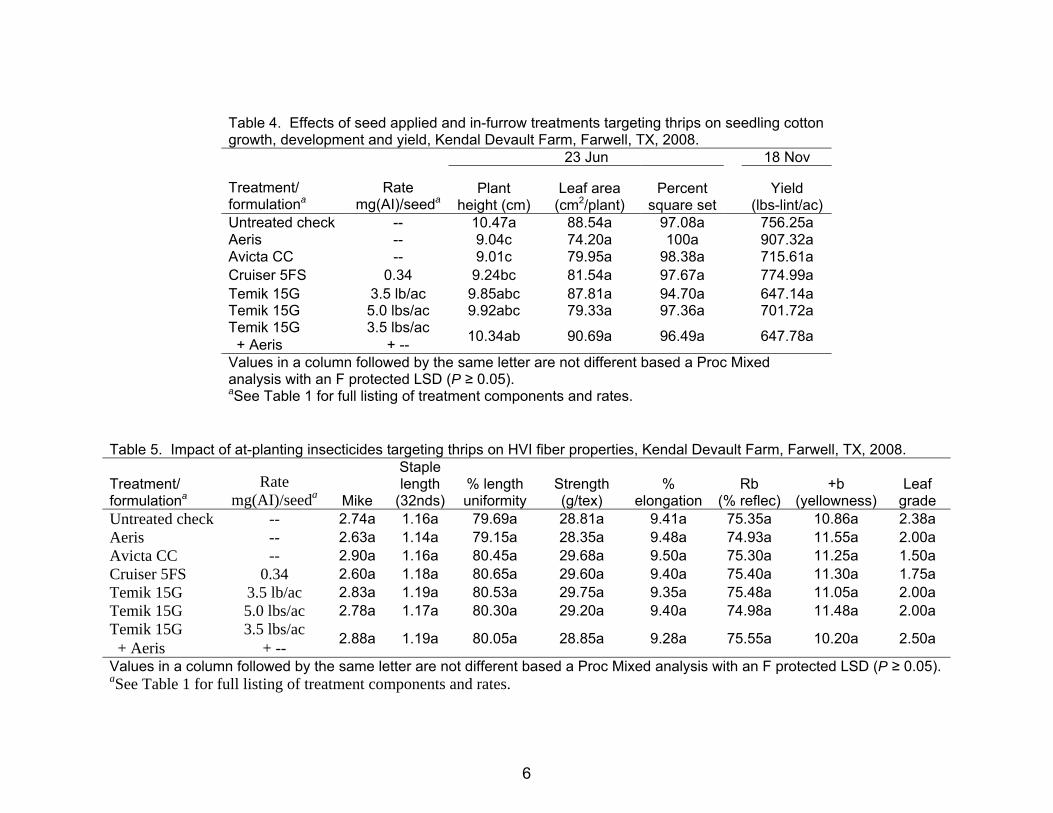
Table 4. Effects of seed applied and in-furrow treatments targeting thrips on seedling cotton growth, development and yield, Kendal Devault Farm, Farwell, TX, 2008.
23 Jun 18 Nov
Treatment/ formulationa
Rate mg(AI)/seeda
Plant height (cm)
Leaf area (cm2/plant)
Percent square set
Yield (lbs-lint/ac)
Untreated check -- 10.47a 88.54a 97.08a 756.25a Aeris -- 9.04c 74.20a 100a 907.32a Avicta CC -- 9.01c 79.95a 98.38a 715.61a Cruiser 5FS 0.34 9.24bc 81.54a 97.67a 774.99a Temik 15G 3.5 lb/ac 9.85abc 87.81a 94.70a 647.14a Temik 15G 5.0 lbs/ac 9.92abc 79.33a 97.36a 701.72a Temik 15G 3.5 lbs/ac + Aeris + -- 10.34ab 90.69a 96.49a 647.78a
Values in a column followed by the same letter are not different based a Proc Mixed analysis with an F protected LSD (P ≥ 0.05). aSee Table 1 for full listing of treatment components and rates.
Table 5. Impact of at-planting insecticides targeting thrips on HVI fiber properties, Kendal Devault Farm, Farwell, TX, 2008.
Treatment/ formulationa
Rate mg(AI)/seeda Mike
Staple length
(32nds) % length uniformity
Strength (g/tex)
% elongation
Rb (% reflec)
+b (yellowness)
Leaf grade
Untreated check -- 2.74a 1.16a 79.69a 28.81a 9.41a 75.35a 10.86a 2.38a Aeris -- 2.63a 1.14a 79.15a 28.35a 9.48a 74.93a 11.55a 2.00a Avicta CC -- 2.90a 1.16a 80.45a 29.68a 9.50a 75.30a 11.25a 1.50a Cruiser 5FS 0.34 2.60a 1.18a 80.65a 29.60a 9.40a 75.40a 11.30a 1.75a Temik 15G 3.5 lb/ac 2.83a 1.19a 80.53a 29.75a 9.35a 75.48a 11.05a 2.00a Temik 15G 5.0 lbs/ac 2.78a 1.17a 80.30a 29.20a 9.40a 74.98a 11.48a 2.00a Temik 15G 3.5 lbs/ac + Aeris + -- 2.88a 1.19a 80.05a 28.85a 9.28a 75.55a 10.20a 2.50a
Values in a column followed by the same letter are not different based a Proc Mixed analysis with an F protected LSD (P ≥ 0.05). aSee Table 1 for full listing of treatment components and rates.
6
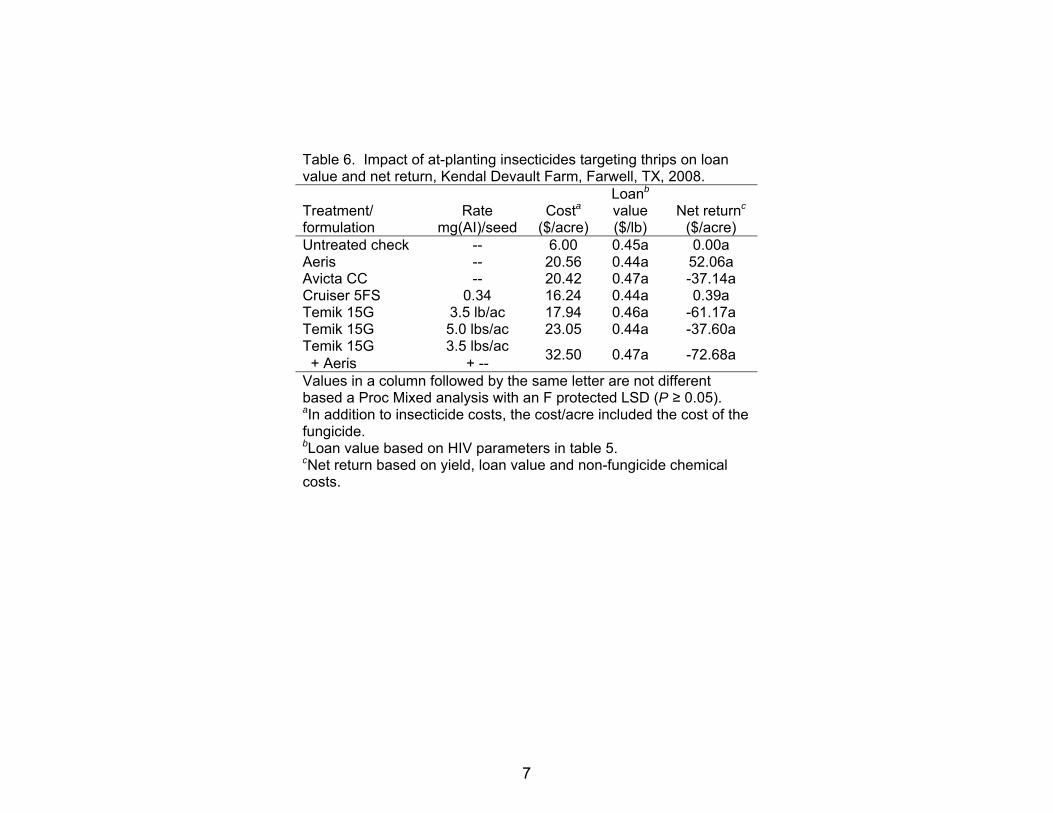
Table 6. Impact of at-planting insecticides targeting thrips on loan value and net return, Kendal Devault Farm, Farwell, TX, 2008.
Treatment/ formulation
Rate mg(AI)/seed
Costa ($/acre)
Loanb value ($/lb)
Net returnc ($/acre)
Untreated check -- 6.00 0.45a 0.00a Aeris -- 20.56 0.44a 52.06a Avicta CC -- 20.42 0.47a -37.14a Cruiser 5FS 0.34 16.24 0.44a 0.39a Temik 15G 3.5 lb/ac 17.94 0.46a -61.17a Temik 15G 5.0 lbs/ac 23.05 0.44a -37.60a Temik 15G 3.5 lbs/ac + Aeris + -- 32.50 0.47a -72.68a
Values in a column followed by the same letter are not different based a Proc Mixed analysis with an F protected LSD (P ≥ 0.05). aIn addition to insecticide costs, the cost/acre included the cost of the fungicide. bLoan value based on HIV parameters in table 5. cNet return based on yield, loan value and non-fungicide chemical costs.
7

Evaluation of At-Planting Insecticides for Thrips Control and Effect on Leafminers
in Cotton, Seminole - 2008
Cooperators: Chuck Roland Farm, Cotton Grower/ Texas AgriLife Extension Service
David Kerns, Manda Cattaneo and Bo Kesey
Extension Entomologist-Cotton, EA-IPM Gaines County and Extension Program Specialist-Cotton
Gaines County
Summary:
The use of in-furrow applications of Temik in irrigated cotton is common in Gaines County; however, the target pest for these treatments is primarily nematodes, and secondarily western flower thrips, Frankliniella occidentalis (Pergande). In this test we wanted to evaluate the benefit of using preventive, in-furrow insecticides and seed treatments for managing thrips in a field with low nematode pressure in Gaines County. In this test we evaluated the efficacy of in-furrow applications of Temik, and the seed treatments Aeris, Avicta Complete Cotton, and Cruiser, and a combination of Temik and Aeris. Unfortunately, the thrips pressure in this study was low, and because of warm temperatures, the impact of thrips on the cotton was minimal and we could not detect any benefit from using any these treatments solely for thrips control in 2008. However, we did note the presence of leafminers, Liriomyza sp., in this test. All of the treatments that included Temik had a lower percentage of leafminer mined plants than the untreated, but did not differ from Cruiser or Avicta CC. Aeris, Cruiser and Avicta CC did not differ from the untreated in the percentage of leafminer mined plants. A significant reduction in leaf area was noted; and plants in all of the treatments except Aeris had a greater leaf area than the untreated. Plant leaf area was closely correlated with leafminer, indicating that the damage was caused by this pest. However, no differences in yield were observed. It is not known if leafminers mining seedling cotton pose an economic threat, but it is possible that they may act similarly to thrips where they may cause yield loss when the seedling cotton is subjected to early-season stress, such as cold weather. More research is need on this pest to address this question.
Objective:
To determine the efficacy of at-planting insecticides targeting thrips in cotton, and impact of leafminers.
8

Materials and Methods:
This test was conducted in a commercial cotton field near Seminole, TX, managed by the Chuck Roland Farm. The field was planted on 13 May on 40-inch rows at a seeding rate of approximately 46,000 seeds/acre. The variety was ‘FiberMax 9063B2F’. The field was irrigated using a pivot irrigation system. The test was a randomized complete block design with four replications. Plots were 2-rows wide × 100 ft in length. Treatments, application type and timing are listed in Table 1. In-furrow insecticides were applied at planting with the seed using a granular-insecticide metering box at a depth of 1.5 inches. Adult and immature western flower thrips, Frankliniella occidentalis (Pergande), were sampled by visually inspecting 10 whole plants per plot. Samples were taken on 23 and 28 May, and 2 and 9 Jun. Leafminers, Liriomyza sp., were estimated by recording the number of infested plant from 10 plants per plot. Plant height and leaf area was estimated on 9 Jun by collecting 10 plants per plot. Height was determined by measuring the distance from the cotyledons to the terminal. Leaf area was estimated using a leaf area indexer. All plots were hand harvested on 31 Oct using a HB stripper. An area of 1/1000th acre was harvest from the center two rows of each plot. Grab samples were taken by plot and ginned at the Texas AgriLife Research and Extension Center at Lubbock to determine gin turnouts. Lint samples were submitted to the International Textile Center at Texas Tech University for HVI analysis, and USDA Commodity Credit Corporation (CCC) Loan values were determined for each treatment by plot. Data were analyzed using linear regression models and PROC MIXED with means separated using an F protected LSD (P ≤ 0.05).
Results and Discussion: At 10 and 15 DAP, thrips numbers were low and there were no significant differences among treatments for adult, immature, total thrips per plant, or percentage of leafminer mined plants (Table 2). By 20 DAP, the thrips population had increased and at this time there were still no significant differences among treatments for adult thrips or leafminers, but all of the insecticide treatments had fewer immature thrips than the untreated, and Temik at 3.5 lbs had fewer total thrips than the untreated (Table 3). The lack of colonization as indicated by the reduced number of immature thrips in the chemical treatments relative to the check indicates that treatments were expressing activity 20 days past planting. By 27 DAP the thrips population had decline sharply and there were no difference in the number of thrips among treatments. However, all of the treatments that included Temik had a lower percentage of leafminer mined plants than the untreated, but did not differ from Cruiser or Avicta CC. Aeris, Cruiser and Avicta CC did not differ from the untreated in the percentage of leafminer mined plants. No differences were detected in plant height or yield, but Avicta CC, Cruiser, and the treatments containing Temik, all had a greater leaf area than the untreated (Table 4). A simple linear regression analysis indicated that leaf area was correlated with the
9

percentage of plants with leaf mines (R2=0.86, P < 0.001) (Figure 1), but no correlation was observed for yield. It is not known if leafminers mining seedling cotton pose an economic threat, but it is possible that they may act similarly to thrips where they may cause yield loss when the seedling cotton is subjected to early-season stress, such as cold weather. More research is need on this pest to address this question. Based on the HIV analysis of the lint, micronaire was the only trait where significant differences were observed (Table 5). The untreated plots had the highest mike, and was significantly higher that Temik at 3.5 lbs/ac and Cruiser. The reason for the differences in mike is not certain, but it did not result in a significant difference in loan value or net return (Table 6). Temperatures at this test site were warm during the test period. During the first week post emergence, the temperature ranged from 59-95 oF, and was 63-91 oF, 68-102 oF, and 65-95 oF for weeks 2, 3, and 4 respectively thereafter. Under such warm conditions, the cotton was developing very rapidly, and the impact of thrips, and possibly leafminers was minimized. In essence, the cotton was able to out grow any sustained damage.
Acknowledgments:
Appreciation is expressed to the Texas Department of Agriculture - Food and Fiber Research for funding of HVI testing at the Texas Tech University - Fiber and Biopolymer Research Institute, and to Plains Cotton Growers for financial support of this project.
Disclaimer Clause: Trade names of commercial products used in this report are included only for better
understanding and clarity. Reference to commercial products or trade names is made with the understanding that no discrimination is intended and no endorsement by the Texas A&M University System is implied. Readers should realize that results from one experiment do not represent conclusive evidence that the same response would occur where conditions vary.
10

Table 1. Insecticide components, rates and application type, Chuck Roland Farm, Seminole, TX, 2008. Treatment/formulation Rate mg(AI)/seed Application type Untreated check -- -- + Dynasty CST 125FS + 0.03 seed Aerisb --b + Trilex Advancedc + 1.6 fl-oz/100 lb seed seed
Avicta Complete Cottona --a seed Cruiser 5FS 0.34 + Dynasty CST 125FS + 0.03 seed
Temik 15G 3.5 lbs/ac in-furrow + Dynasty CST 125FS + 0.03 seed Temik 15G 5.0 lbs/ac in-furrow + Dynasty CST 125FS + 0.03 seed Temik 15G 3.5 lbs/ac in-furrow + Aerisb --b + Trilex Advancedc + 1.6 fl-oz/100 lb seed seed aAvicta Complete Pak is a mixture of Avicta 500FS at 0.15 mg(AI)/seed, Cruiser 5FS at 0.34 mg(AI)/seed, and Dynasty CST 125FS at 0.03 mg(AI)/seed. bAeris is a mixture of Gaucho Grande 5FS at 0.375 mg(AI)/seed and thiodicarb at 0.375 mg(AI)/seed. cTrilex Advanced is a mixture of trifloxystrobin 8.55%, triadimenol 4.27% and metalaxy 12.82%.
11

Table 2. Mean number of thrips at 10 and 15 DAP, Roland Farm, Seminloe, TX, 2008.
23 May – cotyledon stage (10 DAP)
28 May – 1 true leaf stage (15 DAP)
Thrisp per plant Thrisp per plant Treatment/ formulationa
Rate mg(AI)/seeda adults immatures total
% mined plants adults immatures total
% mined plants
Untreated check -- 0.10a 0.00a 0.10a 0.0a 0.15a 0.13a 0.28a 5.0a Aeris -- 0.00a 0.00a 0.00a 0.0a 0.08a 0.00a 0.08a 2.5a Avicta CC -- 0.00a 0.00a 0.00a 0.0a 0.08a 0.00a 0.08a 0.0a Cruiser 5FS 0.34 0.00a 0.00a 0.00a 3.0a 0.05a 0.03a 0.08a 0.0a Temik 15G 3.5 lb/ac 0.00a 0.00a 0.00a 0.0a 0.05a 0.00a 0.05a 0.0a Temik 15G 5.0 lbs/ac 0.00a 0.00a 0.00a 0.0a 0.00a 0.00a 0.00a 0.0a Temik 15G 3.5 lbs/ac + Aeris + -- 0.03a 0.00a 0.03a 0.0a 0.15a 0.03a 0.18a 0.0a
Values in a column followed by the same letter are not different based a Proc Mixed analysis with an F protected LSD (P ≥ 0.05). aSee Table 1 for full listing of treatment components and rates.
Table 3. Mean number of thrips and percentage of leafminer mined plants at 20 and 27 DAP, Roland Farm, Seminole, TX, 2008.
2 Jun – 2 true leaf stage (20 DAP)
9 Jun – 5 true leaf stage (27 DAP)
Thrips per plant Thrips per plant Treatment/ formulationa
Rate mg(AI)/seeda adults immatures total
% mined plants adults immatures total
% mined plants
Untreated check -- 0.54a 0.40a 0.94a 12.5a 0.05a 0.01a 0.08a 11.3a Aeris -- 0.38a 0.00b 0.38a 7.5a 0.10a 0.00a 0.10a 12.5a Avicta CC -- 0.20a 0.08b 0.28a 0.0a 0.20a 0.00a 0.20a 5.0ab Cruiser 5FS 0.34 0.30a 0.03b 0.33a 5.0a 0.08a 0.00a 0.08a 5.0ab Temik 15G 3.5 lb/ac 0.28a 0.03b 0.30b 5.0a 0.20a 0.00a 0.20a 2.5b Temik 15G 5.0 lbs/ac 0.53a 0.00b 0.53ab 0.0a 0.13a 0.00a 0.20a 0.0b Temik 15G 3.5 lbs/ac + Aeris + -- 0.20a 0.08b 0.28a 2.5a 0.13a 0.05a 0.18a 0.0b
Values in a column followed by the same letter are not different based a Proc Mixed analysis with an F protected LSD (P ≥ 0.05). aSee Table 1 for full listing of treatment components and rates.
12

Table 4. Effects of seed applied and in-furrow treatments targeting thrips on seedling cotton growth, development and yield, Roland Farm, Seminole, TX, 2008.
9 Jun 31 Oct
Treatment/ formulationa
Rate mg(AI)/seeda
Plant height (cm)
Leaf area (cm2/plant)
Yield (lbs-lint/ac)
Untreated check -- 6.00a 60.03c 1062.75a Aeris -- 6.24a 67.23bc 975.32a Avicta CC -- 6.86a 78.68a 931.98a Cruiser 5FS 0.34 6.83a 83.34a 1012.06a Temik 15G 3.5 lb/ac 6.60a 75.28ab 1106.34a Temik 15G 5.0 lbs/ac 6.56a 79.35a 1236.88a Temik 15G 3.5 lbs/ac + Aeris + -- 6.46a 78.07a 1056.85a
Values in a column followed by the same letter are not different based a Proc Mixed analysis with an F protected LSD (P ≥ 0.05). aSee Table 1 for full listing of treatment components and rates.
Table 5. Impact of at-planting insecticides targeting thrips on HVI fiber properties, Roland Farm, Seminole, TX, 2008.
Treatment/ formulationa
Rate mg(AI)/seeda Mike
Staple length
(32nds) % length uniformity
Strength (g/tex)
% elongation
Rb (% reflec)
+b (yellowness)
Leaf grade
Untreated check -- 5.14a 1.15a 81.73a 30.64a 9.69a 80.09a 7.26a 2.13a Aeris -- 5.18a 1.12a 81.30a 29.75a 9.60a 79.35a 7.13a 1.00a Avicta CC -- 5.08abc 1.13a 81.65a 30.65a 9.63a 79.73a 7.15a 1.50a Cruiser 5FS 0.34 5.00bc 1.14a 80.93a 30.53a 9.88a 79.95a 7.45a 2.00a Temik 15G 3.5 lb/ac 5.10ab 1.14a 81.55a 30.33a 10.15a 80.10a 7.30a 2.00a Temik 15G 5.0 lbs/ac 4.95c 1.14a 81.63a 30.53a 10.18a 80.25a 7.33a 2.25a Temik 15G 3.5 lbs/ac + Aeris + -- 5.05abc 1.16a 81.03a 30.50a 9.68a 80.05a 7.18a 2.25a
Values in a column followed by the same letter are not different based a Proc Mixed analysis with an F protected LSD (P ≥ 0.05). aSee Table 1 for full listing of treatment components and rates.
13
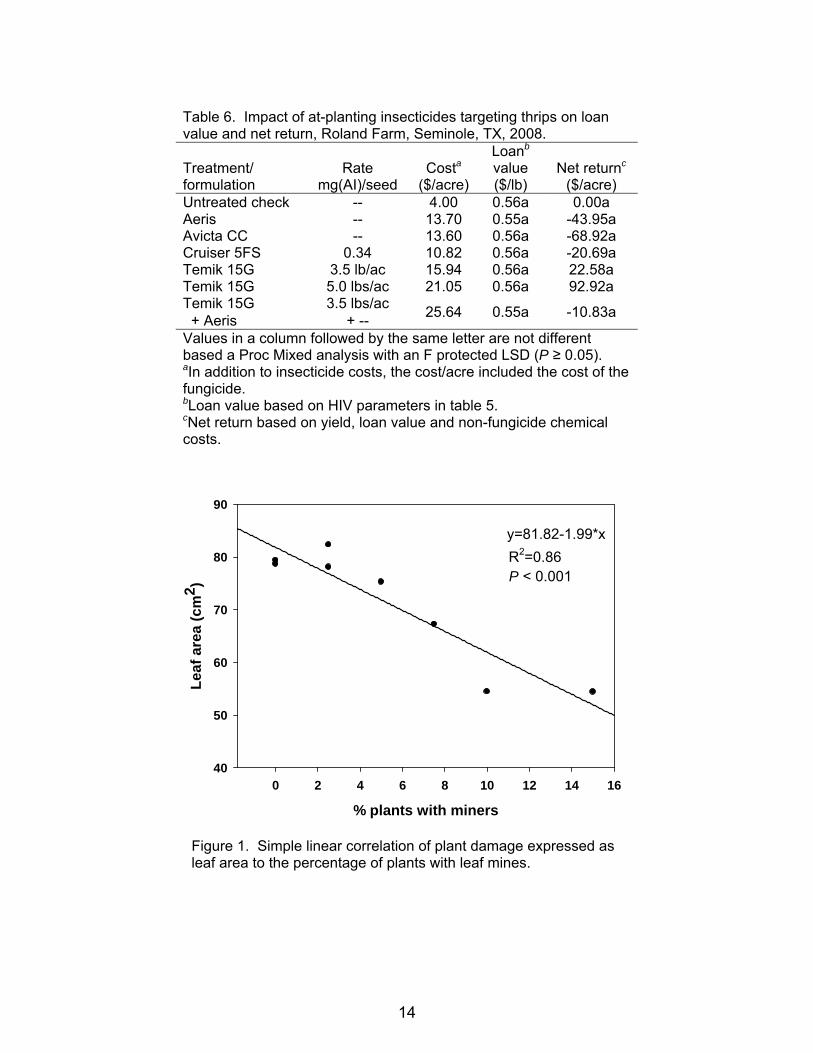
Table 6. Impact of at-planting insecticides targeting thrips on loan value and net return, Roland Farm, Seminole, TX, 2008.
Treatment/ formulation
Rate mg(AI)/seed
Costa ($/acre)
Loanb
value ($/lb)
Net returnc ($/acre)
Untreated check -- 4.00 0.56a 0.00a Aeris -- 13.70 0.55a -43.95a Avicta CC -- 13.60 0.56a -68.92a Cruiser 5FS 0.34 10.82 0.56a -20.69a Temik 15G 3.5 lb/ac 15.94 0.56a 22.58a Temik 15G 5.0 lbs/ac 21.05 0.56a 92.92a Temik 15G 3.5 lbs/ac + Aeris + -- 25.64 0.55a -10.83a
Values in a column followed by the same letter are not different based a Proc Mixed analysis with an F protected LSD (P ≥ 0.05). aIn addition to insecticide costs, the cost/acre included the cost of the fungicide. bLoan value based on HIV parameters in table 5. cNet return based on yield, loan value and non-fungicide chemical costs.
y=81.82-1.99*x
% plants with miners
0 2 4 6 8 10 12 14 16
Leaf
are
a (c
m2 )
40
50
60
70
80
90
R2=0.86P < 0.001
Figure 1. Simple linear correlation of plant damage expressed as leaf area to the percentage of plants with leaf mines.
14
Developing an Action Threshold for Thrips in the Texas High Plains - 2008
Cooperators: Tyler Black Farm, Tim Black Farm, Chuck Roland Farm, Bruce Turnipseed Farm, Chad Harris Farm, Cotton Growers/ Texas AgriLife Extension Service/Texas AgriLife Research
David Kerns, Megha Parajulee, Monti Vandiver,
Manda Cattaneo, Kerry Siders and Bo Kesey Extension Entomologist-Cotton, Research Entomologist-Cotton, EA-IPM
Bailey/Parmer Counties, EA-IPM Gaines County, EA-IPM Hockley/Cochran Counties and Extension Program Specialist-Cotton
Gaines, Hockley, Lubbock, Crosby, Hale and Bailey Counties
Summary:
Thrips are a significant economic pest of cotton during the pre-squaring stage of growth and development in most of the cotton growing areas of the United States. On the Texas High Plains, the western flower thrips, Frankliniella occidentalis (Pergande), is the predominate thrips species comprising 95% of the population infesting cotton. In irrigated cotton where thrips populations are historically high many growers opt to utilize preventative insecticide treatments such as in-furrow applications or seed treatments to control thrips. However, where thrips populations are not “guaranteed” to be especially troublesome, preventive treatments may not be necessary and represent an unnecessary expense. In these situations, well timed banded foliar insecticide applications for thrips control may be more profitable. In this study we studied the impact of different foliar spray intervals targeting thrips in seedling cotton on yield. Using this data we hope to develop a robust action threshold for management of thrips in seedling cotton with foliar insecticides. The current Texas AgriLife Extension action threshold for thrips in cotton is: 1 thrips per plant from plant emergence to 1 true leaf, 2 thrips per plant at the 2 true leaf stage, 3 thrips per plant at the 3 true leaf stage, and 4 thrips per plant at the 4 true leaf stage. In 2007, temperatures were cool (lower 50s to lower 80s oF) and we observed a significant yield reduction due to thrips impact during the first two week following plant emergence. Correlation analysis suggested that the current action threshold of 1 thrips per true leaf is too high under these environmental conditions, and that the threshold should probably be closer to 0.5 thrips per plant. Waiting until the current action threshold was reached did not prevent yield loss. In 2008, temperatures were much warmer than in 2007, and despite greater thrips
15
densities in 2008, there was no observable impact on yield that was attributable to thrips. Under warm conditions, (upper 50s to lower 90s oF) the current action threshold appears to be too low. It is evident that the current action threshold is inadequate and that a threshold dependent on temperatures is needed.
Objectives:
The objectives of this study were to 1) determine at what population density western flower thrips should be subjected to control tactics to prevent yield reduction and significant delayed maturity and 2) compare action thresholds for thrips with and without the 30% thrips larvae requirement.
Materials and Methods:
This study was conducted in irrigated cotton in Bailey County in 2007 and in Bailey, Crosby, Gaines, Hale, Hockley and Lubbock counties in 2008 (Table 1). Plots at all locations were 2-rows wide × 100-ft long, except for Gaines County which had 50-ft long plots. Plots were arranged in a RCB design with 4 replicates. The foliar treatment regimes are outlined in Table 2. All foliar sprays consisted of Orthene 97 S applied at 3 oz-product/acre with a CO2 pressurized hand boom calibrated to deliver 10 gallons/acre. Thrips were counted weekly by counting the number of larvae and adult thrips from 10 plants per plot. Whole plants were removed and inspected in the field. Once the cotton was beyond the thrips susceptibly window 10 whole plants were removed from each plot and transported to the laboratory where plant height was measured from cotyledon to the last true leaf, leaf area was measured using a LICOR leaf area indexer. Additionally, percent square set was estimated at this same time by counting the total number of square sites divided by the number of set squares. Each plot was harvested in entirety in 2007, using a stripper with a burr extractor, and a 1/1000th acre portion was harvested from each plot using an HB hand stripper from tests in 2008. Grab samples were taken by plot and ginned at the Texas AgriLife Research and Extension Center at Lubbock to determine gin turnouts. Lint samples were submitted to the International Textile Center at Texas Tech University for HVI analysis, and USDA Commodity Credit Corporation (CCC) Loan values were determined for each treatment by plot. Data were analyzed using linear regression models and PROC MIXED with means separated using an F protected LSD (P ≤ 0.05).
Results and Discussion: In 2007, we had only one test site. At this location the thrips numbers were relatively low throughout the test period (Figure 1). The thrips did not exceed the action threshold in the untreated plots until week 3. All of the treatment regimes that were sprayed during week 1 yielded significantly more lint than the untreated (Figure 2), although the thrips populations were below 0.5 thrips per plant during this period (Figure 1). Although both of the threshold treatment regimes were sprayed at the same time, and did not differ from each other, the threshold regime that did not depend on the occurrence of thrips larvae yielded significantly more than the untreated. The treatment regime sprayed on weeks 2 and 3 failed to produce significantly more lint than the untreated. Temperatures
16
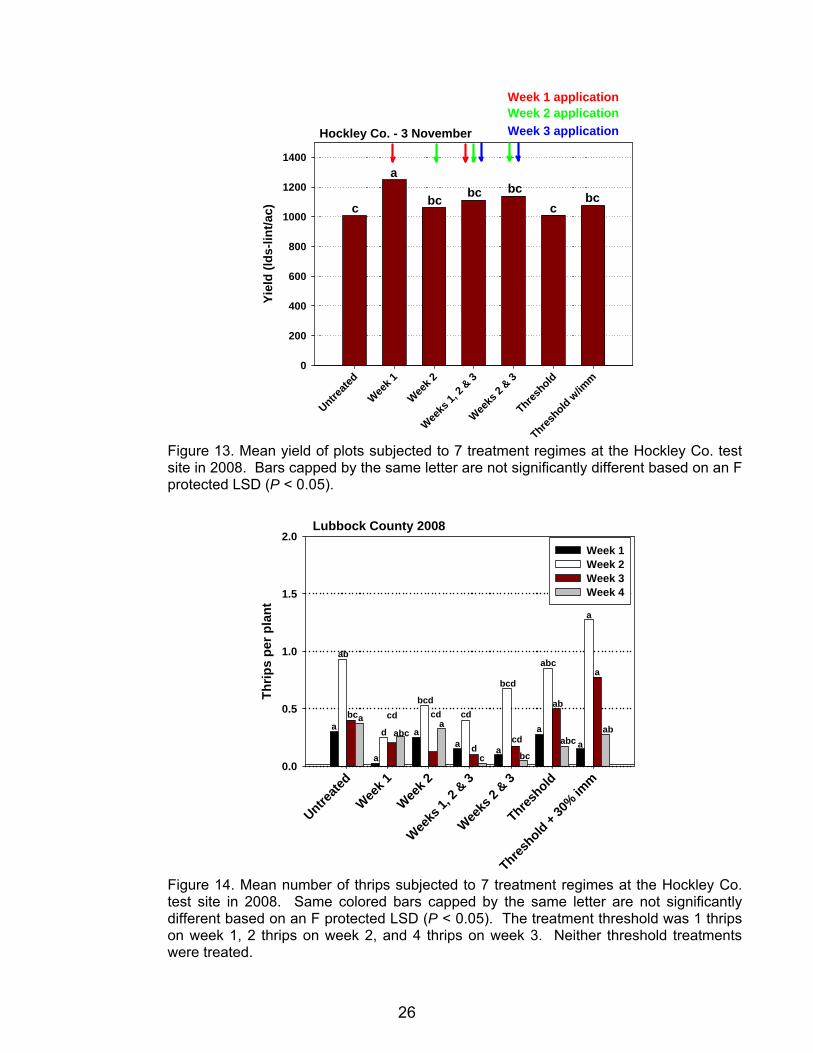
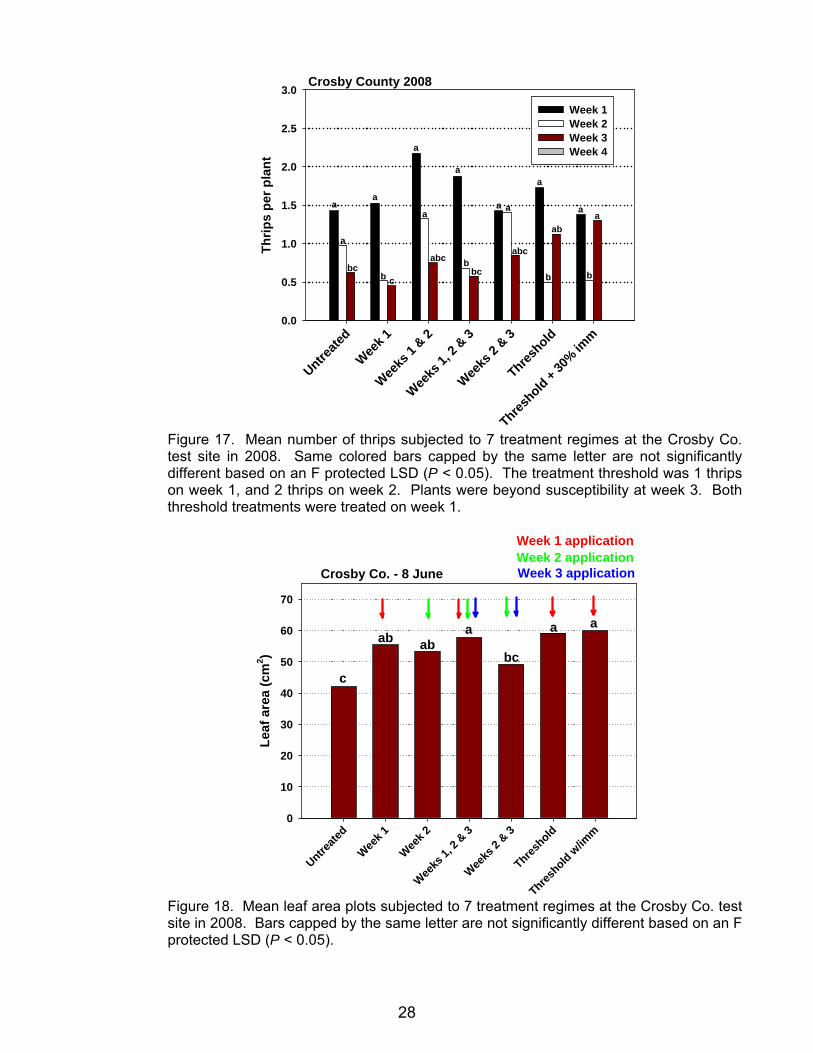
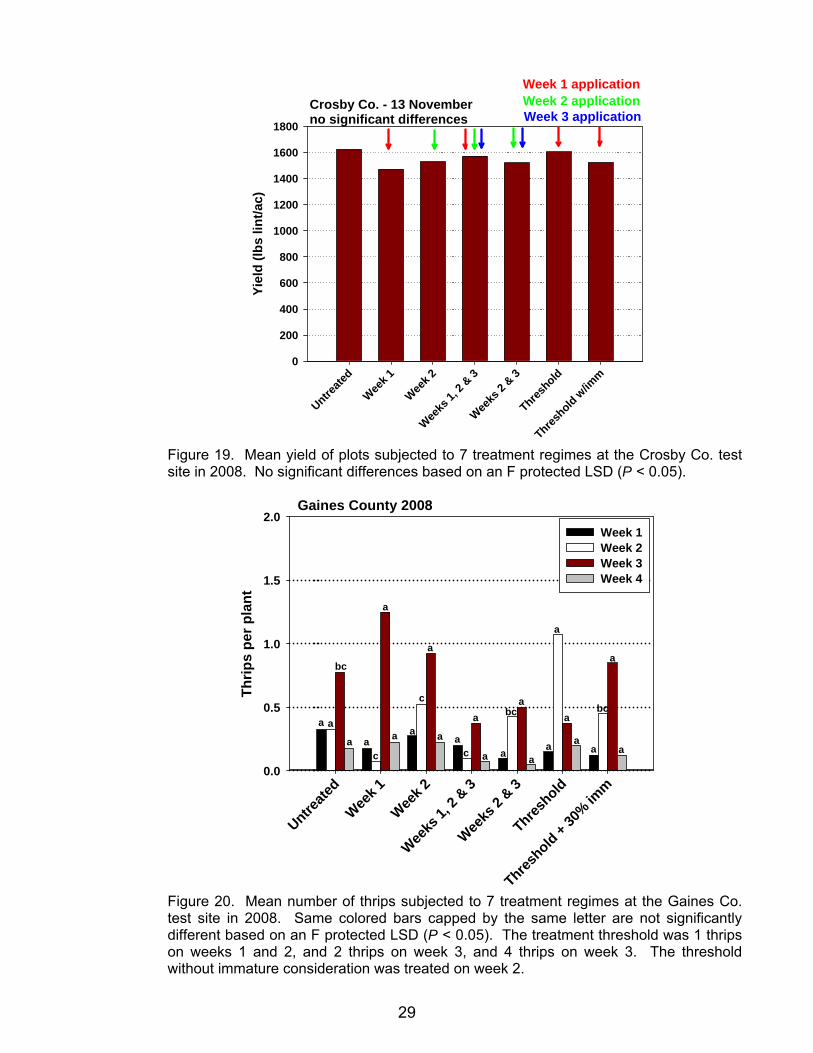
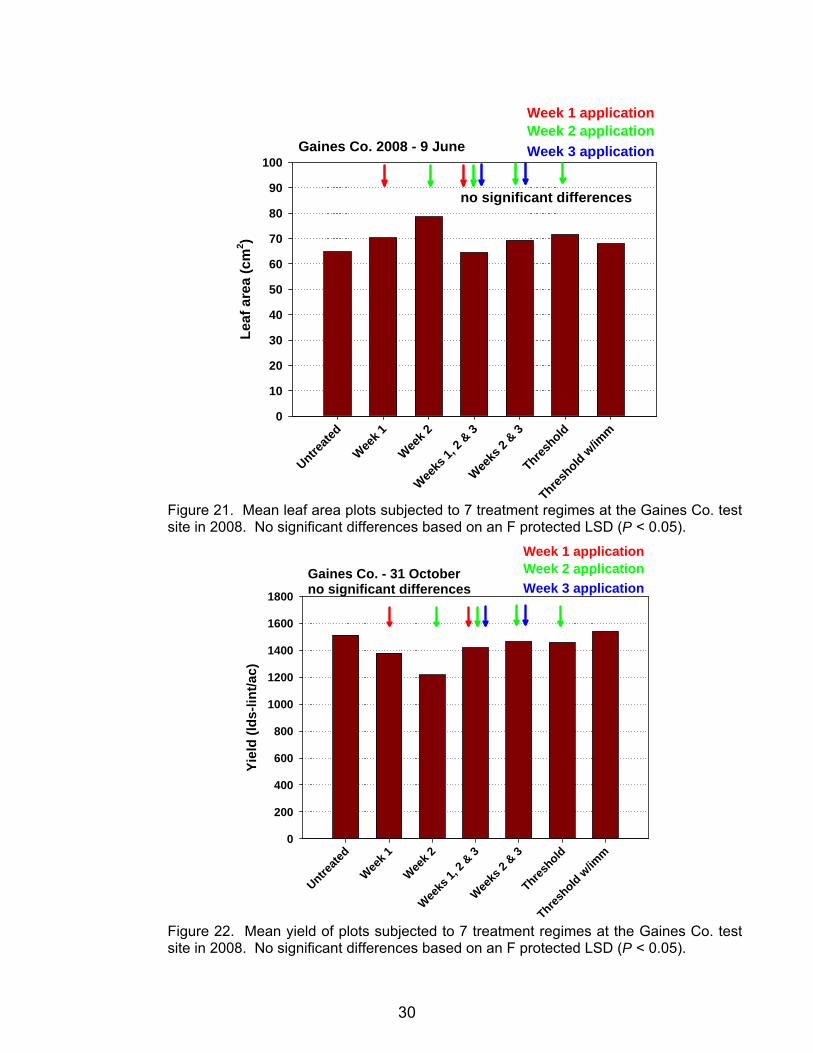
at the 2007 Bailey County site were cool and the plants were slow growing (Table 3). It is likely that the cotton plants could not out grow the thrips damage under the temperatures experienced. Based on a standard four parameter logistic curve, there was a significant correlation between the thrips population and yield at the 1 and 2 true leaf stages. At the 1 true leaf stage there was a distinct break between yields and thrips numbers at approximately 0.3 to 0.5 thrips per plant (Figure 3), which is ≤ 50% of the current recommended threshold. There was also a significant correlation between thrips numbers at the 2 true leaf stage to yield (Figure 4). At this stage of growth the break between high and low yields was less distinctive but appeared to be about 0.6 and 0.8 thrips per plant, or 0.3 and 0.4 thrips per true leaf. Again, well below the current action threshold of 1 thrips per true leaf. Regression analyses at the cotyledon and 4 leaf stage were non-significant at the Bailey County 2007 test site. At the Bailey County location in 2008, the thrips populations never exceeded threshold for any of the treatment regimes (Figure 5) and we could not detect any differences among treatment regime in leaf damage (Figure 6) or yield (Figure 7). Thrips populations at the Hale County test site were high relative to other 2008 test sites with the untreated averaging 1.5, 3.0, 5.5 and 2.6 thrips per plant on weeks 1, 2, 3 and 4 respectively (Figure 8). Leaf damage was evident at this location, and the plots received the week 1 application did appear to be least damage, although not statistically different from several other regimes (Figure 9). However, no differences were detected in yield (Figure 10). Similar to the Bailey County site, thrips were low at the Hockley County location and none of the treatments exceeded threshold (Figure 11). Subsequently we did not detect any differences among treatments in damage (Figure 12) and although there were some differences among treatments in yield, these differences did not appear to follow a logical pattern (Figure 13). The thrips population was also low at the Lubbock County site with no treatments exceeding threshold (Figure 14). However, differences were observed for leaf area and yield. Plot that received insecticide applications at week 2 and weeks 2 and 3 appeared to have less damage than the other treatment regimes (Figure 15). However, the difference observed for yield did not appear to match any sort of pattern or trend with regard to thrips density or insecticide use. (Figure 16). During the first few weeks post emergence at the Crosby County site, the thrips population was relatively high and exceeded the threshold on week 1 (Figure 17). Differences in leaf damage suggest that timing an insecticide application at week 1 when the thrips population was high did protect the plants from damage relative to the untreated (Figure 18). However, no differences in yield were detected (Figure 19). The temperatures at the Crosby County site were especially high and the plants were growing very rapidly and likely out grew the thrips damage. (Table 3). Gaines County was the earliest planted and most southerly test site. At this location thrips were fairly low, but the non-immature consideration threshold treatment regime did trigger an insecticide application on week 2 (Figure 20). However, no leaf damage
17
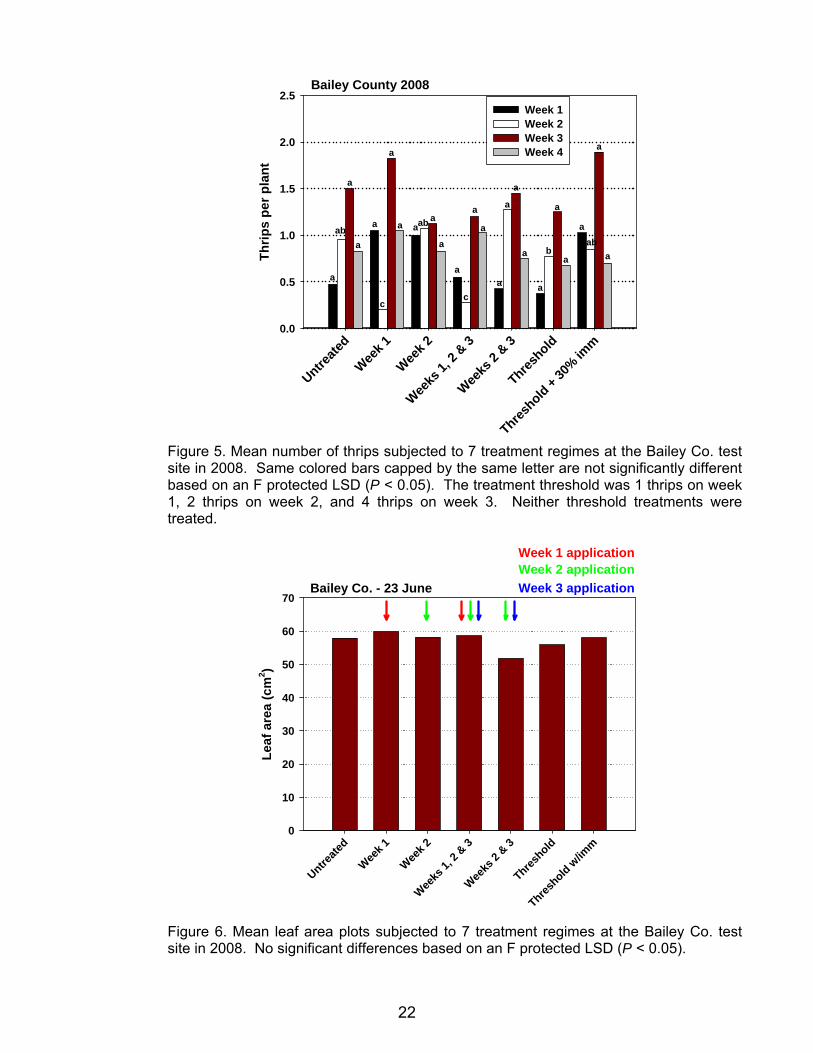
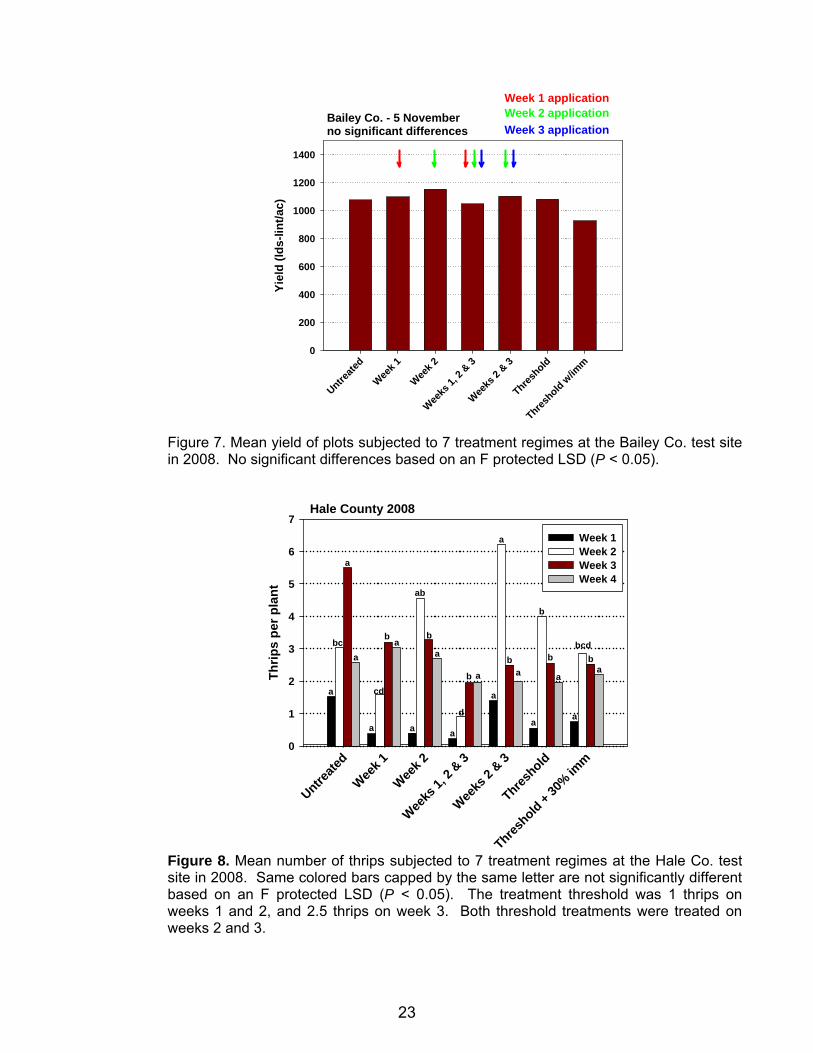
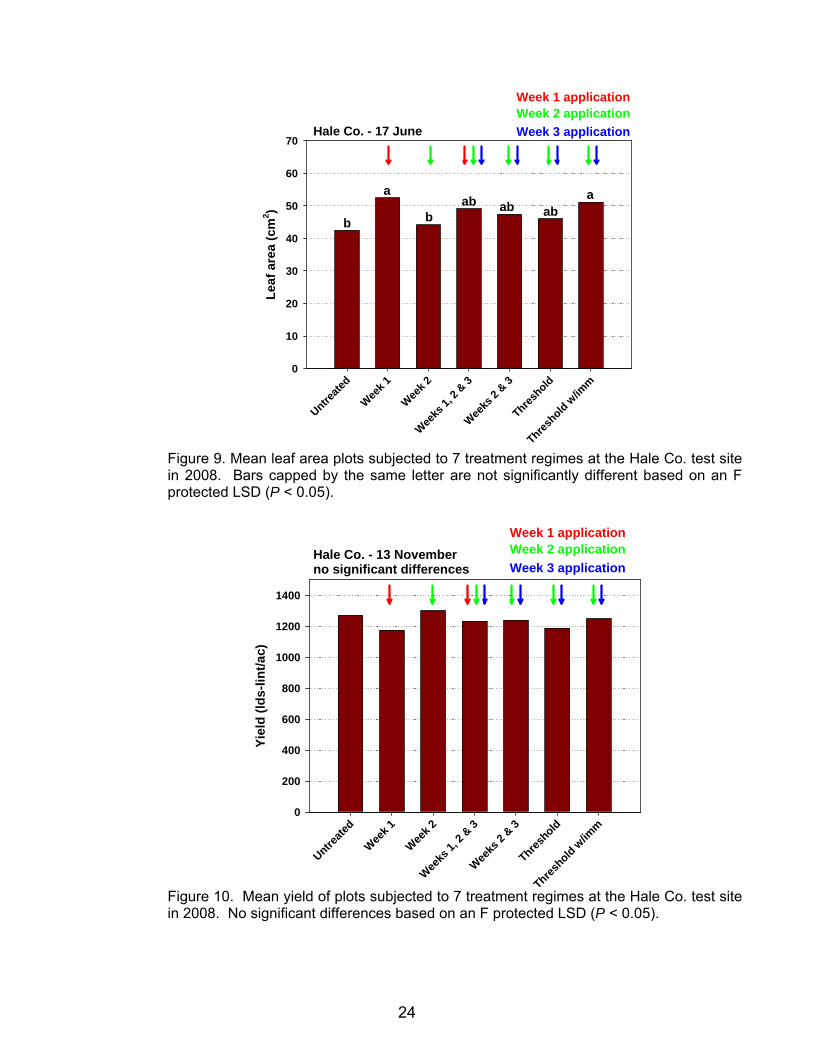
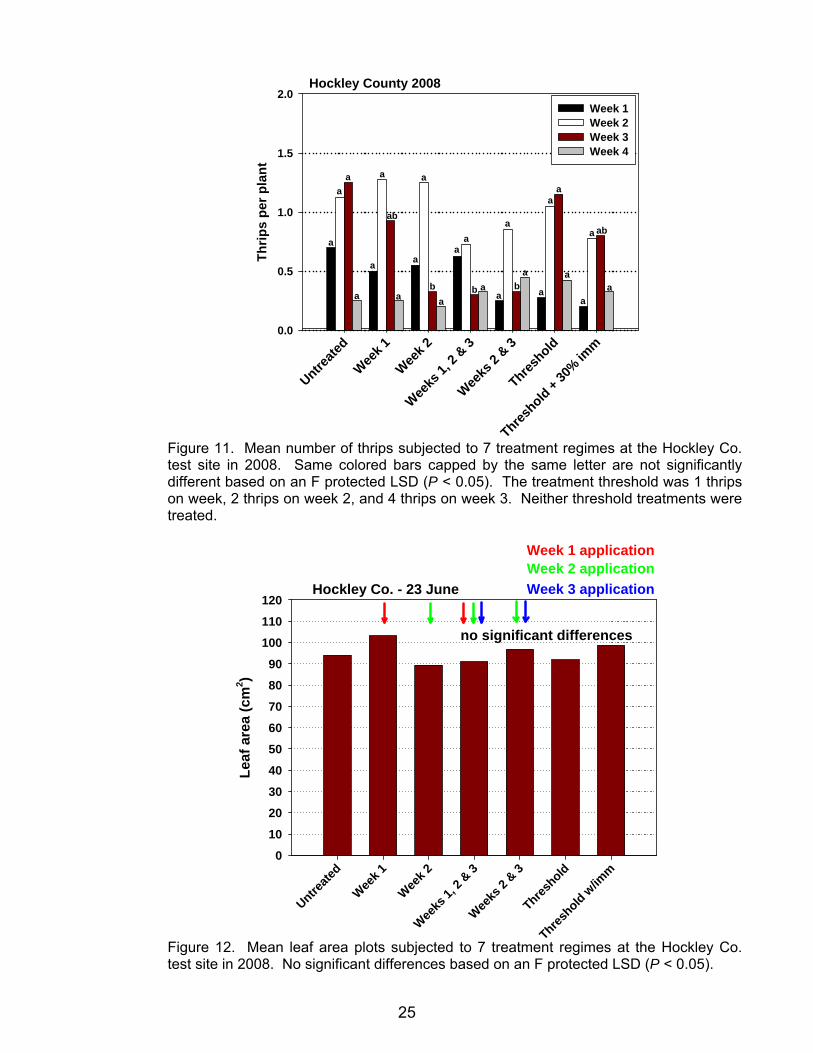
(Figure 21) or yield differences were detected (Figure 22). Similar to the other 2008 test sites, temperatures were fairly hot at the Gaines County site (Table 3). For the 2008 tests, the data for thrips densities and yields were pooled across locations in attempt to detect trends. Additionally, yields were normalized across locations to account for variation due to other factors. In 2008, overall thrips densities where greater than in 2007, particularly during the first 2 weeks of development (Figure 23). Based on the pooled data pooled across locations, there were significant differences in the thrips populations among treatments during weeks 2 and 3. Invariably, plots receiving an insecticide application the previous week tended to have lower thrips numbers than those than were not treated. Despite higher thrips numbers, unlike 2007 there were no significant differences in yield across tests when pooled (Figure 24). Similarly, regression analyses of the 2008 data could not detect any significant relationships between thrips density and yield. The lack of impact of thrips on yield in 2008 despite higher thrips densities during the first few weeks of plant development (critical time period based on 2007), appears to be related to temperature and subsequent rapidity of plant growth (Table 3). Although sites such as Hale County in 2008 had temperatures similar to those experienced at week 1 in Bailey County in 2007, subsequent temperatures were much warmer.
Acknowledgments:
Appreciation is expressed to the Texas Department of Agriculture - Food and Fiber Research for funding of HVI testing at the Texas Tech University - Fiber and Biopolymer Research Institute, and to Cotton Incorporated Texas State Support and Plains Cotton Growers for financial support of this project.
Disclaimer Clause: Trade names of commercial products used in this report are included only for better
understanding and clarity. Reference to commercial products or trade names is made with the understanding that no discrimination is intended and no endorsement by the Texas A&M University System is implied. Readers should realize that results from one experiment do not represent conclusive evidence that the same response would occur where conditions vary.
18
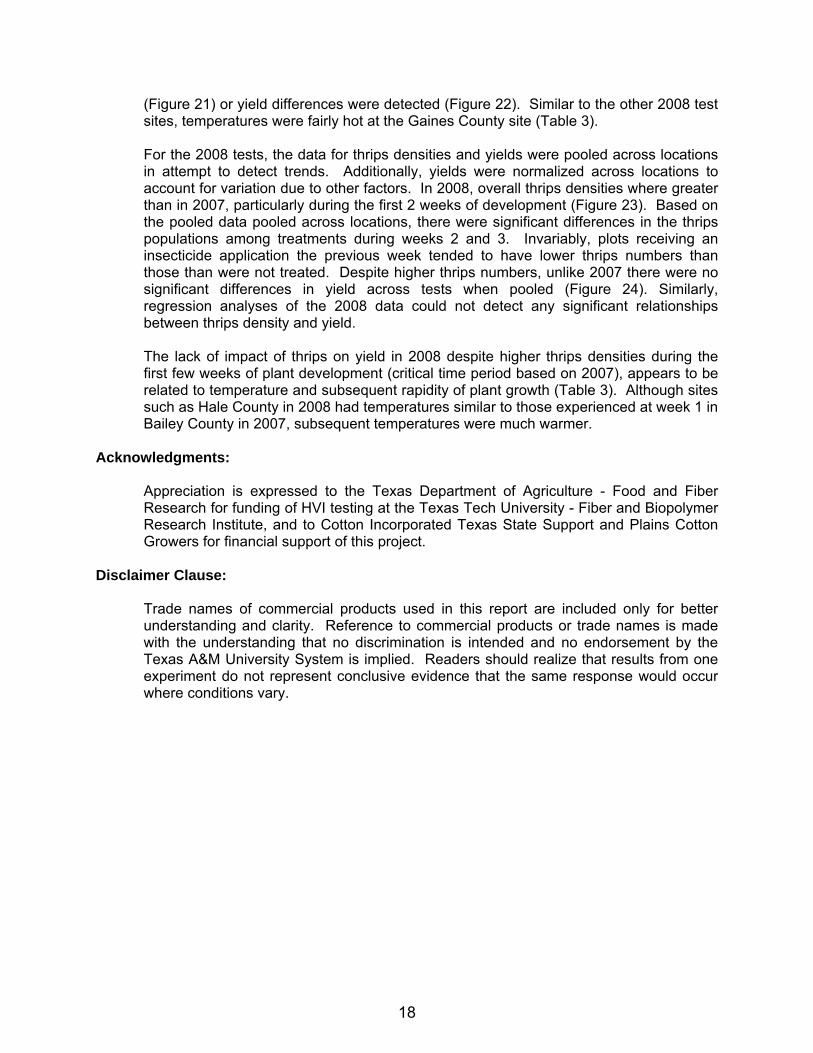
Table 1. Test sites and details. County Year Variety Row spacing Planting date Bailey 2007 FM 960BR 30 inch 17 May Bailey 2008 FM 9063B2F 30 inch 13 May Crosby 2008 FM 9063B2F 40 inch 23 May Gaines 2008 FM 9063B2F 40 inch 13 May Hale 2008 FM 9063B2F 40 inch 13 May Hockley 2008 FM 9063B2F 40 inch 22 May Lubbock 2008 DP 141B2RF 40 inch 14 May
Table 2. Foliar treatment regime timings. 1) Untreated check 2) Automatic treatment on week 1 3) Automatic treatment on weeks 1 and 2 (only week 2 in 2008) 4) Automatic treatment on weeks 1, 2 and 3 5) Automatic treatment on weeks 2 and 3 6) Treatment based on the Texas AgriLife Extension Threshold (One thrips per plant from plant emergence through the first true leaf stage, and one thrips per true leaf thereafter until the cotton has 4 to 5 true leaves) 7) Treatment based on the Texas AgriLife Extension Threshold with 30% larvae consideration (One thrips per plant from plant emergence through the first true leaf stage, and one thrips per true leaf with at least 30% larvae until the cotton has 4 to 5 true leaves)
Table 3. Test sites plant growth and climatic conditions. Week 1 Week 2 Week 3 Week 4
Growth stage Growth stage Growth stage Growth stage
County Avg Temp oF
(min-max) Avg Temp oF
(min-max) Avg Temp oF
(min-max) Avg Temp oF
(min-max) 2007
Cotyledon 1 true leaf 2 true leaves 4 true leaves Bailey 52-79 54-82 57-82 56-86 2008
Cotyledon 2 true leaves 4 true leaves 6 true leaves Bailey 68-100 61-93 62-97 62-90 Cotyledon 2 true leaves 5 true leaves -- Crosby 68-102 66-95 67-98 -- Cotyledon 1 true leaf 2 true leaves 5 true leaves Gaines 59-95 63-91 68-102 65-95 Cotyledon 1 true leaf 3 true leaves 5 true leaves Hale 56-74 58-93 57-93 60-94 Cotyledon 2 true leaves 4 true leaves 6 true leaves Hockley 67-103 64-95 67-100 63-90 Cotyledon 2 true leaves 4 true leaves 5 true leaves Lubbock 61-91 68-96 65-95 70-99
19

Untreate
d
Week 1
Weeks
1 & 2
Weeks
1, 2
& 3
Weeks
2 & 3
Threshold
Threshold +
30% im
m
Thrip
s pe
r pla
nt
0
1
2
3
4
5
6Week 1Week 2Week 3Week 4
Bailey County 2007
a a aa a a a
a
aab
ab abcbc c
a
b
b b b
b
ba a
aa a a
a
Figure 1. Mean number of thrips subjected to 7 treatment regimes at the Bailey Co. test site in 2007. Same colored bars capped by the same letter are not significantly different based on an F protected LSD (P < 0.05). The treatment threshold was 1 thrips on weeks 1 and 2, 2 thrips on week 3, and 4 thrips on week 4. Both threshold treatments were treated on week 2.
Untreate
d
Week 1
Weeks
1 & 2
Weeks
1, 2
& 3
Weeks
2 & 3
Threshold
Threshold +
30% im
m
Yiel
d (lb
s-lin
t/acr
e)
0
200
400
600
800
1000 Bailey County - 29 October
d
aab abccd bc cd
Figure 2. Mean yield of plots subjected to 7 treatment regimes at the Bailey Co. test site in 2007. Bars capped by the same letter are not significantly different based on an F protected LSD (P < 0.05).
20

Yield (lbs-lint/acre)
620 640 660 680 700 720 740 760 780
Thrip
s pe
r pla
nt
0.2
0.4
0.6
0.8
1.0
1.2
1.4
R2=0.95P=0.01
1 true leaf stage
Figure 3. Relationship between thrips density and yield at the 1 true leaf stage.
Yield (lbs-lint/acre)
620 640 660 680 700 720 740 760 780
Thrip
s pe
r pla
nt
0.2
0.4
0.6
0.8
1.0
1.2
1.4
1.6
1.8
2.02 true leaf stageR2=0.99P=0.003
Figure 4. Relationship between thrips density and yield at the 2 true leaf stage.
21
Untreate
d
Week 1
Week 2
Weeks
1, 2
& 3
Weeks
2 & 3
Threshold
Threshold +
30% im
m
Thrip
s pe
r pla
nt
0.0
0.5
1.0
1.5
2.0
2.5Week 1Week 2Week 3Week 4
Bailey County 2008
a
a
a a a
a
a
a
a
a
a
a
a
a
a
a
ab
c
a
aab
c
a
a
b
a
ab
a
Figure 5. Mean number of thrips subjected to 7 treatment regimes at the Bailey Co. test site in 2008. Same colored bars capped by the same letter are not significantly different based on an F protected LSD (P < 0.05). The treatment threshold was 1 thrips on week 1, 2 thrips on week 2, and 4 thrips on week 3. Neither threshold treatments were treated.
Untreate
d
Week 1
Week 2
Weeks
1, 2
& 3
Weeks
2 & 3
Threshold
Threshold w
/imm
Leaf
are
a (c
m2 )
0
10
20
30
40
50
60
70Bailey Co. - 23 June
Week 2 applicationWeek 1 application
Week 3 application
Figure 6. Mean leaf area plots subjected to 7 treatment regimes at the Bailey Co. test site in 2008. No significant differences based on an F protected LSD (P < 0.05).
22
Untreate
d
Week 1
Week 2
Weeks
1, 2
& 3
Weeks
2 & 3
Threshold
Threshold w
/imm
Yiel
d (ld
s-lin
t/ac)
0
200
400
600
800
1000
1200
1400
Bailey Co. - 5 Novemberno significant differences
Week 2 applicationWeek 1 application
Week 3 application
Figure 7. Mean yield of plots subjected to 7 treatment regimes at the Bailey Co. test site in 2008. No significant differences based on an F protected LSD (P < 0.05).
Untreate
d
Week 1
Week 2
Weeks
1, 2
& 3
Weeks
2 & 3
Threshold
Threshold +
30% im
m
Thrip
s pe
r pla
nt
0
1
2
3
4
5
6
7Week 1Week 2Week 3Week 4
Hale County 2008
a
a
a
a
a
a
a
a
a
a
a
a
a
a
a
a
bc
cd
b b
ab
d
b
b
b
bbcd
b
Figure 8. Mean number of thrips subjected to 7 treatment regimes at the Hale Co. test site in 2008. Same colored bars capped by the same letter are not significantly different based on an F protected LSD (P < 0.05). The treatment threshold was 1 thrips on weeks 1 and 2, and 2.5 thrips on week 3. Both threshold treatments were treated on weeks 2 and 3.
23
Untreate
d
Week 1
Week 2
Weeks
1, 2
& 3
Weeks
2 & 3
Threshold
Threshold w
/imm
Leaf
are
a (c
m2 )
0
10
20
30
40
50
60
70Hale Co. - 17 June
aaababab
bb
Week 2 applicationWeek 1 application
Week 3 application
Figure 9. Mean leaf area plots subjected to 7 treatment regimes at the Hale Co. test site in 2008. Bars capped by the same letter are not significantly different based on an F protected LSD (P < 0.05).
Untreate
d
Week 1
Week 2
Weeks
1, 2
& 3
Weeks
2 & 3
Threshold
Threshold w
/imm
Yiel
d (ld
s-lin
t/ac)
0
200
400
600
800
1000
1200
1400
Hale Co. - 13 Novemberno significant differences
Week 2 applicationWeek 1 application
Week 3 application
Figure 10. Mean yield of plots subjected to 7 treatment regimes at the Hale Co. test site in 2008. No significant differences based on an F protected LSD (P < 0.05).
24
Untreate
d
Week 1
Week 2
Weeks
1, 2
& 3
Weeks
2 & 3
Threshold
Threshold +
30% im
m
Thrip
s pe
r pla
nt
0.0
0.5
1.0
1.5
2.0Week 1Week 2Week 3Week 4
Hockley County 2008
a
a
a
a
a
a
a
aa
a
a
a
aa
a
a
a
ab
a a
b b
a
b
aa
a ab
Figure 11. Mean number of thrips subjected to 7 treatment regimes at the Hockley Co. test site in 2008. Same colored bars capped by the same letter are not significantly different based on an F protected LSD (P < 0.05). The treatment threshold was 1 thrips on week, 2 thrips on week 2, and 4 thrips on week 3. Neither threshold treatments were treated.
Untreate
d
Week 1
Week 2
Weeks
1, 2
& 3
Weeks
2 & 3
Threshold
Threshold w
/imm
Leaf
are
a (c
m2 )
0
10
20
30
40
50
60
70
80
90
100
110
120Hockley Co. - 23 June
no significant differences
Week 2 applicationWeek 1 application
Week 3 application
Figure 12. Mean leaf area plots subjected to 7 treatment regimes at the Hockley Co. test site in 2008. No significant differences based on an F protected LSD (P < 0.05).
25
Untreate
d
Week 1
Week 2
Weeks
1, 2
& 3
Weeks
2 & 3
Threshold
Threshold w
/imm
Yiel
d (ld
s-lin
t/ac)
0
200
400
600
800
1000
1200
1400
Hockley Co. - 3 NovemberWeek 2 applicationWeek 1 application
Week 3 application
abc
ccbcbc bc
Figure 13. Mean yield of plots subjected to 7 treatment regimes at the Hockley Co. test site in 2008. Bars capped by the same letter are not significantly different based on an F protected LSD (P < 0.05).
Untreate
d
Week 1
Week 2
Weeks
1, 2
& 3
Weeks
2 & 3
Threshold
Threshold +
30% im
m
Thrip
s pe
r pla
nt
0.0
0.5
1.0
1.5
2.0Week 1Week 2Week 3Week 4
Lubbock County 2008
aa
a
abc aa
ac
a bc
aabc a
ab
ab
bcd
bc cd
d
bcdcd
d
cd
cd
abc
ab
a
a
Figure 14. Mean number of thrips subjected to 7 treatment regimes at the Hockley Co. test site in 2008. Same colored bars capped by the same letter are not significantly different based on an F protected LSD (P < 0.05). The treatment threshold was 1 thrips on week 1, 2 thrips on week 2, and 4 thrips on week 3. Neither threshold treatments were treated.
26

Untreate
d
Week 1
Week 2
Weeks
1, 2
& 3
Weeks
2 & 3
Threshold
Threshold w
/imm
Leaf
are
a (c
m2 )
0
10
20
30
40
50
60
70
Lubbock Co. - 17 June
aabc ab abcd
dcd bcd
Week 2 applicationWeek 1 application
Week 3 application
Figure 15. Mean leaf area plots subjected to 7 treatment regimes at the Lubbock Co. test site in 2008. Bars capped by the same letter are not significantly different based on an F protected LSD (P < 0.05).
Untreate
d
Week 1
Week 2
Weeks
1, 2
& 3
Weeks
2 & 3
Threshold
Threshold w
/imm
Yiel
d (lb
s lin
t/ac)
0
200
400
600
800
1000
1200
1400
1600Lubbock Co. - 30 October
Week 2 applicationWeek 1 application
Week 3 application
a
ab
c
bcbc
bcbc
Figure 16. Mean yield of plots subjected to 7 treatment regimes at the Lubbock Co. test site in 2008. Bars capped by the same letter are not significantly different based on an F protected LSD (P < 0.05).
27
Untreate
d
Week 1
Weeks
1 & 2
Weeks
1, 2
& 3
Weeks
2 & 3
Threshold
Threshold +
30% im
m
Thrip
s pe
r pla
nt
0.0
0.5
1.0
1.5
2.0
2.5
3.0
Week 1Week 2Week 3Week 4
Crosby County 2008
bc
a
b
a
bb
aa
c
abcbc
abc
ab
b
a
a
a
a
a
aa
Figure 17. Mean number of thrips subjected to 7 treatment regimes at the Crosby Co. test site in 2008. Same colored bars capped by the same letter are not significantly different based on an F protected LSD (P < 0.05). The treatment threshold was 1 thrips on week 1, and 2 thrips on week 2. Plants were beyond susceptibility at week 3. Both threshold treatments were treated on week 1.
Untreate
d
Week 1
Week 2
Weeks
1, 2
& 3
Weeks
2 & 3
Threshold
Threshold w
/imm
Leaf
are
a (c
m2 )
0
10
20
30
40
50
60
70
Crosby Co. - 8 June
aab
bc
aab
c
a
Week 2 applicationWeek 1 application
Week 3 application
Figure 18. Mean leaf area plots subjected to 7 treatment regimes at the Crosby Co. test site in 2008. Bars capped by the same letter are not significantly different based on an F protected LSD (P < 0.05).
28
Untreate
d
Week 1
Week 2
Weeks
1, 2
& 3
Weeks
2 & 3
Threshold
Threshold w
/imm
Yiel
d (lb
s lin
t/ac)
0
200
400
600
800
1000
1200
1400
1600
1800
Crosby Co. - 13 Novemberno significant differences
Week 2 applicationWeek 1 application
Week 3 application
Figure 19. Mean yield of plots subjected to 7 treatment regimes at the Crosby Co. test site in 2008. No significant differences based on an F protected LSD (P < 0.05).
Untreate
d
Week 1
Week 2
Weeks
1, 2
& 3
Weeks
2 & 3
Threshold
Threshold +
30% im
m
Thrip
s pe
r pla
nt
0.0
0.5
1.0
1.5
2.0Week 1Week 2Week 3Week 4
Gaines County 2008
a
a a a a a aa a a
a aa a
abc
bc
a
c
c
a
a
c
a
a
abc
a
Figure 20. Mean number of thrips subjected to 7 treatment regimes at the Gaines Co. test site in 2008. Same colored bars capped by the same letter are not significantly different based on an F protected LSD (P < 0.05). The treatment threshold was 1 thrips on weeks 1 and 2, and 2 thrips on week 3, and 4 thrips on week 3. The threshold without immature consideration was treated on week 2.
29
Untreate
d
Week 1
Week 2
Weeks
1, 2
& 3
Weeks
2 & 3
Threshold
Threshold w
/imm
Leaf
are
a (c
m2 )
0
10
20
30
40
50
60
70
80
90
100
no significant differences
Gaines Co. 2008 - 9 JuneWeek 2 applicationWeek 1 application
Week 3 application
Figure 21. Mean leaf area plots subjected to 7 treatment regimes at the Gaines Co. test site in 2008. No significant differences based on an F protected LSD (P < 0.05).
Untreate
d
Week 1
Week 2
Weeks
1, 2
& 3
Weeks
2 & 3
Threshold
Threshold w
/imm
Yiel
d (ld
s-lin
t/ac)
0
200
400
600
800
1000
1200
1400
1600
1800
Gaines Co. - 31 Octoberno significant differences
Week 2 applicationWeek 1 application
Week 3 application
Figure 22. Mean yield of plots subjected to 7 treatment regimes at the Gaines Co. test site in 2008. No significant differences based on an F protected LSD (P < 0.05).
30

Untreate
d
Week 1
Week 2
Weeks
1, 2
& 3
Weeks
2 & 3
Threshold
Threshold +
30% im
m
Thrip
s pe
r pla
nt
0.0
0.5
1.0
1.5
2.0
2.5Week 1Week 2Week 3Week 4
Across locations 2008
a a
a
a
aa
a a a a aa a a
aa
bc
d
abc
bcd
ab
d
d
cd
bc
bc
ab
c
Figure 23. Mean number of thrips subjected to 7 treatment regimes across locations in 2008. Same colored bars capped by the same letter are not significantly different based on an F protected LSD (P < 0.05).
Untreate
d
Week 1
Week 2
Weeks
1, 2
& 3
Weeks
2 & 3
Thresh
old
Thresh
old + 3
0% im
m
Yiel
d (lb
s-lin
t/acr
e)
0
200
400
600
800
1000
1200
1400
1600
Across locations 2008no significant differences
Figure 24. Mean yield of plots subjected to 7 treatment regimes at across locations in 2008. No significant differences were detected among treatments based on an F protected LSD (P < 0.05).
31

Evaluation of Insecticides for Cotton Fleahopper Control - 2008
Cooperators: Brad Kleman Farm, Cotton Grower/ Texas AgriLife Extension Service
David Kerns, Emilio Nino and Bo Kesey
Extension Entomologist-Cotton, EA-IPM Castro/Lamb Count and Extension Program Specialist-Cotton
Castro County
Summary:
The cotton fleahopper, Pseudatomoscelis seriatus (Reuter), is an occasional pest of cotton in the High Plains of Texas. Although fleahoppers were scarce in most cotton on the High Plains in 2008, they were prevalent in some late, re-planted cotton in portions of Castro County. Insecticides tested included: Brigadier, Carbine, Centric, Endigo, Leverage and Orthene. Endigo, Brigadier, Centric and Orthene all preformed well at the rates tested. Leverage performed well at 5.0 fl-oz but appeared somewhat weak at the 3.8 fl-oz rate. Carbine, which performed well at the same rate in our 2007 fleahopper test, did not perform well in this test.
Objective:
To determine the efficacy of insecticides toward cotton fleahoppers in cotton. Materials and Methods:
This test was conducted in a commercial cotton field managed by Brad Kleman near Dimmitt, TX. The field was planted on 6 Jun on 30-inch rows, and was irrigated using a pivot irrigation system. The variety was ‘FiberMax 9058F’. The test was a randomized complete block design with four replications. Plots were 4-rows wide × 60 ft in length. Insecticides were applied with a CO2 pressurized hand-boom sprayer calibrated to deliver 10 gpa through Teejet 8001VS TwinJet nozzles (2 per row) at 40 psi. Insecticides were applied to the entire plot on 22 Jul (see tables for insecticides tested and rates). About the insecticides. Brigadier is a new insecticide mix that contains the pyrethroid
32
bifenthrin (Brigade) mixed with imidacloprid, which is the same active ingredient as Trimax Pro. Leverage is similar to Brigadier is that it is a mixture of a pyrethoird and imidacloprid, but in this case the pyrethroid is cyfluthirn, or Baythroid. Endigo is another mixture of a pyrethroid and a neonicotinoid, but used lambda-cyhalothrin (Karate) as the pyrethroid and thiamethoxam (Centric) as the neonicotinoid. Carbine is a fairly new insecticide that constitutes the sole entry in its own class of insecticide, flonicamid. It acts as an anti-feedent, which results in starvation and/or desiccation of the pest. Orthene was included as a standard comparison. Treatments were evaluated inspecting entire plants and counting the number of cotton fleahopper, Pseudatomoscelis seriatus (Reuter), adults and nymphs from 10 plants per plot. Square set was estimated at 0 and 14 DAT by counting the number of squares present and absent from 10 entire plants per plot. Data were analyzed using linear regression models and PROC MIXED with means separated using an F protected LSD (P ≤ 0.05).
Results and Discussion: On 22 Jul, prior to insecticide application, the total number of fleahoppers was averaging 4.39 per 10 plants across all treatments, and there were no significant differences in fleahopper nymphs, adults or nymphs + adults (Table 1). At no time were significant differences among treatments detected for fleahopper adults. At 3 DAT, there were statistical differences among treatments for fleahopper nymphs and total fleahoppers. At this time the all of the treatments except Carbine had fewer fleahoppers than the untreated. Carbine was not expected to demonstrate much activity at this time since it is an anti-feedent and requires time for the insects to starve and/or desiccate. At 7 DAT, the fleahopper population had declined, averaging 1 fleahopper per 10 plants in the untreated (Table 2). The only treatments that had fewer fleahopper nymphs and total fleahoppers than the untreated were Centric alone, both rates of Endigo and Leverage at 5.0 fl-oz. Carbine had statistically more fleahopper nymphs than all other insecticide treatments, and more total fleahoppers than all the other insecticides except Leverage at 3.8 fl-oz. Carbine performed better in 2007 tests. It is not known why it did not look good in this study. There were no significant differences among treatments for fleahopper nymphs, adults or total at 14 DAT. At 0 and 14 DAT, no significant differences were detected among treatment for % square set or % change in square set 0 vs 14 DAT (Table 3). No phytotoxicity from any insecticide was observed in this test.
Acknowledgments:
Appreciation is expressed to the Plains Cotton Growers for financial support of this project.
Disclaimer Clause: Trade names of commercial products used in this report are included only for better
understanding and clarity. Reference to commercial products or trade names is made with the understanding that no discrimination is intended and no endorsement by the
33
Texas A&M University System is implied. Readers should realize that results from one experiment do not represent conclusive evidence that the same response would occur where conditions vary.
34

Table 1. Mean number of cotton fleahopper nymphs, adults and total fleahoppers prior to treatment and 2 DAT, Brad Kleman Farm, Dimmitt, TX, 2008. Number of cotton fleahoppers per 10 plants
22 Jul (pre-treatment) 24 Jul (2 DAT) Treatment/formulationa
Rate amt product/acre nymphs adults total nymphs adults Total
Untreated -- 3.00a 0.00a 3.00a 3.75a 0.00a 3.75a Brigadier + COC 3.8 fl-oz 2.75a 0.25a 3.00a 0.00b 0.00a 0.00b Carbine 50WG + COC 1.7 oz 5.75a 0.50a 6.25a 3.00a 0.00a 3.00a Centric 40WG 1.5 oz 4.75a 0.50a 5.25a 0.50b 0.00a 0.50b Centric 40WG + COC 1.5 oz 4.00a 0.25a 4.25a 0.25b 0.25a 0.50b Endigo ZC + COC 3.4 fl-oz 3.75a 0.75a 4.50a 0.00b 0.00a 0.00b Endigo ZC + COC 4.0 fl-oz 6.00a 0.25a 6.25a 0.50b 0.00a 0.50b Leverage 2.7SE + COC 3.8 fl-oz 3.25a 0.00a 3.25a 0.75b 0.00a 0.75b Leverage 2.7 SE + COC 5.0 fl-oz 2.75a 0.00a 2.75a 0.25b 0.00a 0.25b Orthene 97S + COC 4.00 oz 5.00a 0.25a 5.25a 0.25b 0.00a 0.25b Values in a column followed by the same letter are not significantly different based on LSD (P ≤ 0.05). aCOC, Crop oil concentrate was included at 1% v/v.
Table 2. Mean number of cotton fleahopper nymphs, adults and total fleahoppers at 7 and 14 DAT, Brad Kleman Farm, Dimmitt, TX, 2008. Number of cotton fleahoppers per 10 plants
29 Jul (7 DAT) 5 Aug (14 DAT) Treatment/formulationa
Rate amt product/acre nymphs adults total nymphs adults Total
Untreated -- 1.00ab 0.00a 1.00ab 2.00a 0.00a 0.00a Brigadier + COC 3.8 fl-oz 0.25bc 0.25a 0.50bc 0.00a 0.25a 0.22a Carbine 50WG + COC 1.7 oz 1.50a 0.00a 1.50a 1.00a 0.00a 0.00a Centric 40WG 1.5 oz 0.00c 0.00a 0.00c 0.00a 0.00a 0.00a Centric 40WG + COC 1.5 oz 0.25bc 0.00a 0.25bc 0.25a 0.00a 0.00a Endigo ZC + COC 3.4 fl-oz 0.00c 0.00a 0.00c 0.00a 0.00a 0.00a Endigo ZC + COC 4.0 fl-oz 0.00c 0.00a 0.00c 0.50a 0.00a 0.00a Leverage 2.7SE + COC 3.8 fl-oz 0.50bc 0.25a 0.75abc 0.25a 0.00a 0.00a Leverage 2.7 SE + COC 5.0 fl-oz 0.00c 0.00a 0.00c 0.50a 0.00a 0.00a Orthene 97S + COC 4.00 oz 0.50bc 0.00a 0.50bc 0.75a 0.25a 1.00a Values in a column followed by the same letter are not significantly different based on LSD (P ≤ 0.05). aCOC, Crop oil concentrate was included at 1% v/v.
35

Table 3. Damage due to cotton fleahoppers, Brad Kleman Farm, Dimmitt, TX, 2008. % square set
Treatment/formulationa
Rate amt product/acre
22 Jul (pre-treatment)
5 Aug (14 DAT)
% change in square set
Untreated -- 97.06a 89.20a -7.86a Brigadier + COC 3.8 fl-oz 94.75a 92.81a -1.94a Carbine 50WG + COC 1.7 oz 94.88a 91.49a -3.39a Centric 40WG 1.5 oz 95.72a 92.33a -3.38a Centric 40WG + COC 1.5 oz 96.72a 93.18a -3.54a Endigo ZC + COC 3.4 fl-oz 95.24a 92.34a -2.91a Endigo ZC + COC 4.0 fl-oz 92.22a 94.47a +2.25a Leverage 2.7SE + COC 3.8 fl-oz 97.42a 93.50a -3.39a Leverage 2.7 SE + COC 5.0 fl-oz 92.84a 89.70a -3.14a Orthene 97S + COC 4.00 oz 92.36a 93.17a +0.81a Values in a column followed by the same letter are not significantly different based on LSD (P ≤ 0.05). aCOC, Crop oil concentrate was included at 1% v/v.
36

Efficacy of Insecticides Targeting Cotton Aphids and Impact on Key Aphid Predators - 2008
Cooperators: Texas AgriLife Research & Extension Center – Lubbock
David Kerns, Brant Baugh, and Bo Kesey
Extension Entomologist-Cotton, EA-IPM Lubbock County, and Extension Program Specialist-Cotton
Lubbock County
Summary:
Cotton aphids, Aphis gossypii Glover are a common pest of cotton grown in the High Plains of Texas. An aphicide efficacy test was conducted at the Texas AgriLife Research and Extension Center in Lubbock, Texas. In addition to impact on aphids, the aphicides were evaluated for impact on key aphid predators. At 3 days after treatment (DAT) and 5 days after the pretreament counts were taken, aphids in the untreated plots had increased 96.94%, averaging 54.12 aphids per leaf; slightly over threshold. All of the aphicides had fewer aphids than the untreated throughout the plant canopy. There were no differences among the aphicides for aphids on the 3 to 4th node leaves, but Bidrin and Intruder had fewer aphids on the mid to lower canopy leaves than Carbine. Convergent lady beetle, Hippodamia convergens Guérin-Méneville, and common green lacewing, Chrysoperla plorabunda (Fitch), were the most prevalent predators present in the test. Although the data for lacewing larvae were inconclusive, none of the treatments differed from the untreated, aphicide impact on lady beetle larvae was clearer. At 3 DAT, the number of lady beetle larvae did not differ between the Carbine, Bidrin or the untreated plots, while all of the neonicotinoids (Centric, Intruder and Trimax Pro) contained fewer lady beetle larvae than the untreated. Trimax Pro had fewer lady beetle larvae than either Carbine or Bidrin. At 5 DAT, aphid numbers in the untreated were slightly lower than at the 3 DAT evaluation. All of the treatments had significantly fewer aphids than the untreated; however, Trimax Pro did not differ from the untreated in the number of aphids infesting the mid to lower canopy. Based on the mean number of aphids from both leaf locations, Trimax Pro did not perform as well as the other aphicides. Aphid numbers in the Trimax Pro plots on the mid to lower canopy leaves increased 181.62% from 3 DAT to 5 DAT. None of the other treatments exhibited an increase in aphid numbers. The increase in aphids in the Trimax Pro plots may have been due to its impact on lady beetles. No significant differences among treatments were observed in lint yield. However a significant correlation between aphids per leaf and lint yield per acre was observed based on non-linear regression. Lint yield decreased as the population increased over 50 aphids per leaf which validates the
37
Texas AgriLife Extension Service threshold. Objective:
To determine the efficacy of insecticides targeting cotton aphids and their impact on aphid predators.
Materials and Methods:
This test was conducted at the Texas AgriLife Research and Extension Center in Lubbock, Texas. Cotton ‘DeltaPine 174 RF’ was planted on 4 June 2008 on 40-inch rows and irrigated using furrow run irrigation. Plots were 4-rows wide × 25-feet long. Plots were arranged in a randomized complete block design with 4 replicates. An aphid outbreak was induced by overspraying the entire test area with Karate 1EC (lambda cyhalothrin) at 4.0 fl-oz per acre on 18 July and 7 August. The aphicide treatments and rates are outlined in the tables. All treatments were applied with a CO2 pressurized hand boom calibrated to deliver 10 gallons/acre. All treatment included crop oil concentrate at 1% v/v. The boom consisted of 2 hollow cone TX-6 nozzles per row spaced at 20 inches. Treatments were applied on 21 August 2008 when the aphid population was approaching the action threshold of 50 aphids per leaf. The aphid population was estimated by counting the number of aphids per leaf. Ten 3 to 4 node terminal and ten mid to lower canopy leaves were randomly sampled per plot. Predators were estimated utilizing a 36-inch x 40-inch black drop cloth. Drop cloths were laid between the rows and approximately 1.5 row-ft of cotton were shaken onto the drop cloth from each row, and the type and number of predators were counted. The plots were hand harvested on 19 November using a HB stripper, and the cotton ginned at the Texas AgriLife Research and Extension Center in Lubbock. Grab samples were taken by plot and ginned at the Texas AgriLife Research and Extension Center at Lubbock to determine gin turnouts. Lint samples were submitted to the International Textile Center at Texas Tech University for HVI analysis, and USDA Commodity Credit Corporation (CCC) Loan values were determined for each treatment by plot. All data were analyzed using PROC MIXED and the means were separated using an F protected LSD (P ≤ 0.05).
Results and Discussion:
On 21 August, the aphid population was averaging across all plot, 46.66, 19.82 and 33.24 aphids per leaf on the mid to lower canopy leaves, 3 to 4th node leaves, and averaged across both leaf locations respectively. There were no statistical differences among treatments at this time (Table 1). Although the aphid population was not at the treatment threshold, since the population appeared to be rapidly increasing treatments were initiated on 23 August. On 26 August, 3 days after treatment (DAT) and 5 days after the pretreament counts were collected; aphids in the untreated plots had increased 96.94%, averaging 54.12 aphids per leaf; slightly over threshold. All of the aphicides had fewer aphids than the untreated throughout the plant canopy (Table 1). There were no differences among the
38
aphicides for aphids on the 3 to 4th node leaves, but Bidrin and Intruder had fewer aphids on the mid to lower canopy leaves than Carbine. Carbine was not expected to exhibit full activity at 3 DAT since this chemistry acts as an anti-feedent and requires time for the aphids to starve and/or desiccate. Aphids in the mid to lower canopy were less exposed to sun and wind and undoubtedly died slower than those near the terminal. At 5 DAT, aphid numbers in the untreated were slightly lower than at the 3 DAT evaluation (Table 2). All of the treatments had significantly fewer aphids than the untreated; however, Trimax Pro did not differ from the untreated in the number of aphids infesting the mid to lower canopy. Based on the mean number of aphids from both leaf locations, Trimax Pro did not perform as well as the other aphicides. Aphid numbers in the Trimax Pro plots on the mid to lower canopy leaves increased 181.62% from 3 DAT to 5 DAT None of the other treatments exhibited an increase in aphid numbers. The increase in aphids in the Trimax Pro plots may have been due to its impact on lady beetles. By 10 DAT, the aphid population had declined considerably across the entire test, and none of the treatments were exceeding threshold (Figure 5). However, aphid numbers on the mid to lower canopy leaves and averaged across both leaf locations were greater in the Trimax Pro plots relative to the other treatments, including the untreated. Aphids in the Trimax Pro plots did not differ from the untreated on the 3 to 4 the node leaves but were significantly greater than the other aphicides. Convergent lady beetle, Hippodamia convergens Guérin-Méneville, and common green lacewing, Chrysoperla plorabunda (Fitch), were the most prevalent predators present in the test. Although the data for lacewing larvae were inconclusive, none of the treatments differed from the untreated, aphicide impact on lady beetle larvae was clearer (Table 3). At 3 DAT, the number of lady beetle larvae did not differ between the Carbine, Bidrin or the untreated plots, while all of the neonicotinoids (Centric, Intruder and Trimax Pro) contained fewer lady beetle larvae than the untreated. Trimax Pro had the fewer lady beetle larvae than either Carbine or Bidrin. Because of its broad spectrum of activity, Bidrin was expected to adversely impact lady beetle larvae. The reason they survived the Bidrin treatment is unclear but may be due to the rapid dissipation of Bidrin and its translaminar activity. The University of Arkansas suggests that at least 0.2 lady beetle larvae or 0.3 lady beetle adults per 1 ft-row may be sufficient to biologically manage an aphid infestation. The untreated plots of this test were averaging 2.56 and 0.28 lady beetle larvae and adults, respectively, per 1 ft-row, at 3 DAT. Based on the high number of lady beetle larvae present, within a week we expected to see a reduction in aphid numbers due to predation, particularly in the untreated plots and where lady beetle larvae were selectively conserved. No significant differences between treatments were observed in lint yield (Table 3). Additionally, we could not detect any differences among the treatments in any of the HIV analysis parameter or loan values (data not presented). However, figure 1 shows a significant correlation between aphids per leaf and lint yield per acre. This trend was evident at 5 DAT, after the aphidices had sufficient time to act and before the population crashed. Lint yield decreased as the population increased over 50 aphids per leaf which validates the Texas AgriLife Extension Service threshold.
Acknowledgments:
Appreciation is expressed to the Texas Department of Agriculture - Food and Fiber
39

Research for funding of HVI testing at the Texas Tech University - Fiber and Biopolymer Research Institute, and to Plains Cotton Growers for financial support of this project.
Disclaimer Clause: Trade names of commercial products used in this report are included only for better
understanding and clarity. Reference to commercial products or trade names is made with the understanding that no discrimination is intended and no endorsement by the Texas A&M University System is implied. Readers should realize that results from one experiment do not represent conclusive evidence that the same response would occur where conditions vary.
40

Table 1. Impact of aphicides on cotton aphids in cotton prior treatments and 3 DAT, Lubbock, 2008. 21 Aug (pre-treatment) 26 Aug (3 DAT)
Aphids per leaf Aphids per leaf
Treatment/ formulation1
Rate amt product/acre
3-4th node leaf
lower canopy
leaf total 3-4th node
leaf
lower canopy
leaf total Untreated -- 14.13 a 40.83 a 34.44 a 40.85 a 67.38 a 54.12 a Carbine 50WG 1.5 oz 16.93 a 43.38 a 30.16 a 16.60 b 35.00 b 25.80 b Intruder 70WP 0.75 oz 7.52 a 30.78 a 19.15 a 2.05 b 3.45 c 2.75 c Centric 40WP 2.0 oz 40.35 a 63.93 a 52.14 a 4.03 b 21.18 bc 14.11 bcTrimax Pro 4.44SC 1.8 fl-oz 19.93 a 52.20 a 36.07 a 8.85 b 16.05 bc 12.45 bcBibrin 8EC 8 fl-oz 20.05 a 48.83 a 34.44 a 2.18 b 6.73 c 4.45 c Values in a column followed by the same letter are not significantly different based on an F-protected LSD (P ≤ 0.05). 1All treatments included COC at 1% v/v.
Table 2. Impact of aphicides on cotton aphids in cotton at 5 and 10 DAT, Lubbock, 2008. 28 Aug (5 DAT) 2 Sep (10 DAT) Aphids per leaf Aphids per leaf
Treatment/ formulation1
Rate amt product/acre
3-4th node leaf
lower canopy
leaf total 3-4th
node leaf
lower canopy
leaf total Untreated -- 31.60 a 63.63 a 47.62 a 1.38 ab 1.10 b 1.24 b Carbine 50WG 1.5 oz 0.73 b 10.08 b 5.41 c 0.08 b 0.15 b 0.11 b Intruder 70WP 0.75 oz 0.13 b 1.08 b 0.60 c 0.08 b 0.25 b 0.16 b Centric 40WP 2.0 oz 5.03 b 18.03 b 11.53 c 0.63 b 1.75 b 1.19 b Trimax Pro 4.44SC 1.8 fl-oz 4.95 b 45.20 a 25.08 b 2.52 a 6.72 a 4.62 a Bibrin 8EC 8 fl-oz 2.42 b 5.13 b 3.78 c 0.27 b 0.18 b 0.26 a Values in a column followed by the same letter are not significantly different based on an F-protected LSD (P ≤ 0.05). 1All treatments included COC at 1% v/v.
41

Table 3. Impact of aphicides on key predators of cotton aphids, Lubbock, 2008. No. per 6 ft-row on 26 Aug (3
DAT)
Treatment/formulation1Rate amt
product/acre Lady beetle
larvae Lacewing
larvae Yield
(lbs-lint/ac) Untreated -- 10.25 a 5.50 abc 749.93a Carbine 50WG 1.5 oz 9.00 ab 7.25 ab 922.00a Intruder 70WP 0.75 oz 3.75 cd 9.50 a 963.36a Centric 40WP 2.0 oz 4.75 bcd 2.00 c 764.96a Trimax Pro 4.44SC 1.8 fl-oz 1.50 d 3.75 bc 868.50a Bibrin 8EC 8 fl-oz 7.00 abc 5.50 abc 936.90a Values in a column followed by the same letter are not significantly different based on an F-protected LSD (P ≤ 0.05). 1All treatments included COC at 1% v/v.
f=y0+a*exp(-b*x)+c*exp(-d*x)R2=0.81P<0.0001
Yield (lbs-lint/acre)
400 600 800 1000 1200
Aph
ids
per l
eaf (
5 D
AT)
0
25
50
75
100
125
150
175
200
Figure 1. Non-linear regression depicting the trend towards lower yields with increasing aphid numbers at 5 DAT.
42

Efficacy of a Range of Rates of Carbine and Intruder on Cotton Aphids - 2008
Cooperators: Texas AgriLife Research & Extension Center – Lubbock
David Kerns and Bo Kesey Extension Entomologist-Cotton and Extension Program Specialist-Cotton
Lubbock County
Summary:
Cotton aphids, Aphis gossypii Glover are a common pest of cotton grown in the High Plains of Texas. In the past, Bidrin was a common product for managing aphids in High Plain’s cotton, but in recent years the neonicotinoids have dominated this market. Bidrin was surpassed by the neonicotinoids largely because of resistance problems. In the last two years, there has been concern in some portions of the cotton belt with aphids developing resistance to the neonicotinoids. In this study, we evaluated a range of rates of the neonicotinoid Intruder for aphid control in comparison to a newer, novel aphid active insecticide, Carbine, as well as to Bidrin. All of the rates Intruder and Carbine, and the single rate of Bidrin, all exhibited excellent activity. Resistance to Intruder does not appear to be a problem on the Texas High Plains, and resistance to Bidrin appears to have subsided.
Objective:
To determine the efficacy of a range of rates of several insecticides targeting cotton aphids.
Materials and Methods:
This test was conducted at the Texas AgriLife Research and Extension Center in Lubbock, TX. The field was planted on 14 May on 40-inch rows, and was irrigated using row irrigation. The test was a RCB design with four replications. Plots were 4-rows wide × 50 ft in length. The insecticide evaluated included 4 rates of Carbine, 4 rates of Intruder, and a single rate of Bidrin (see tables for rates). Insecticides were applied with a CO2 pressurized hand-boom sprayer calibrated to deliver 10 gpa through TX-6 hollow cone nozzles (2 per row) at 40 psi. The insecticides to be evaluated were applied to the all four rows of each plot on 31 Jul. A crop oil concentrate was added to each treatment at 1% v/v.
43

Treatments were evaluated by counting the number of aphids from 10, 3 to 4th node leaves (top leaf sample) and 10 leaves from the lower 50% of the plant canopy (lower leaf sample) per plot on 31 Jul and 4, 8 and 15 Aug. All data were analyzed using PROC MIXED and the means were separated using an F protected LSD (P ≤ 0.05).
Results and Discussion:
On 21 Aug, the aphid population was averaging across all plot, 29.81, 35.93 and 32.87 aphids per leaf on the mid to lower canopy leaves, 3 to 4th node leaves, and averaged across both leaf locations respectively. There were no statistical differences among treatments at this time (Table 1). On 4 Aug, 3 days after treatment (DAT), aphids in the untreated plots had increased and was averaging 98.78 aphids per leaf. All of the insecticides had fewer aphids than the untreated throughout the at the 3-4th node leaf position, and across both leaf positions, but no differences were detected for the mid - lower canopy leaves. At 7 DAT, aphid numbers in the untreated had increased to 131.25 aphids per leaf across both leaf potions. At this time all of the treatments had statistically fewer aphids than the untreated but did not differ from each other (Table 2). Aphid numbers had decreased sharply by 14 DAT, and results were similar to the 7 DAT evaluation. All of the products evaluated demonstrated good mixing and handling characteristics and no phytotoxicity was observed.
Acknowledgments:
Appreciation is expressed to Plains Cotton Growers for financial support of this project and to Dr. Jane Dever for granting access to her cotton where this study was conducted.
Disclaimer Clause: Trade names of commercial products used in this report are included only for better
understanding and clarity. Reference to commercial products or trade names is made with the understanding that no discrimination is intended and no endorsement by the Texas A&M University System is implied. Readers should realize that results from one experiment do not represent conclusive evidence that the same response would occur where conditions vary.
44

Table 1. Impact of aphicides on cotton aphids in cotton prior treatments and 3 DAT, Lubbock, 2008. 31 Jul Aug (pre-treatment) 4 Aug (3 DAT)
Cotton aphids per leaf Cotton aphids per leaf
Treatment/formulation Rate amt
product/acre3-4th node
leaf
lower canopy
leaf total 3-4th node
leaf
lower canopy
leaf total Untreated -- 42.05 a 42.35 a 42.20 a 83.38 a 114.17 a 98.78 a Carbine 50WG 1.4 oz 34.10 a 31.2 a 32.65 a 29.42 b 27.26 a 28.34 b Carbine 50WG 1.7 oz 31.08 a 25.28 a 28.18 a 29.23 b 10.18 a 19.71 b Carbine 50WG 2.0 oz 28.60 a 31.00 a 29.80 a 16.59 b 8.40 a 12.50 b Carbine 50WG 2.3 oz 26.25 a 35.30 a 30.78 a 17.70 b 8.93 a 13.32 b Intruder 70WP 0.6 oz 47.95 a 30.23 a 39.09 a 4.23 b 8.38 a 6.31 b Intruder 70WP 0.75 oz 30.18 a 19.75 a 24.97 a 3.20 b 2.90 a 3.05 b Intruder 70WP 0.9 oz 20.75 a 18.55 a 19.65 a 1.25 b 1.93 a 1.59 b Intruder 70WP 1.1 oz 29.15 a 21.78 a 25.47 a 1.08 b 1.15 a 1.12 b Bibrin 8EC 8 fl-oz 78.53 a 39.73 a 59.13 a 11.28 b 7.58 a 9.43 b Values in a column followed by the same letter are not significantly different based on an F-protected LSD (P ≤ 0.05).
45
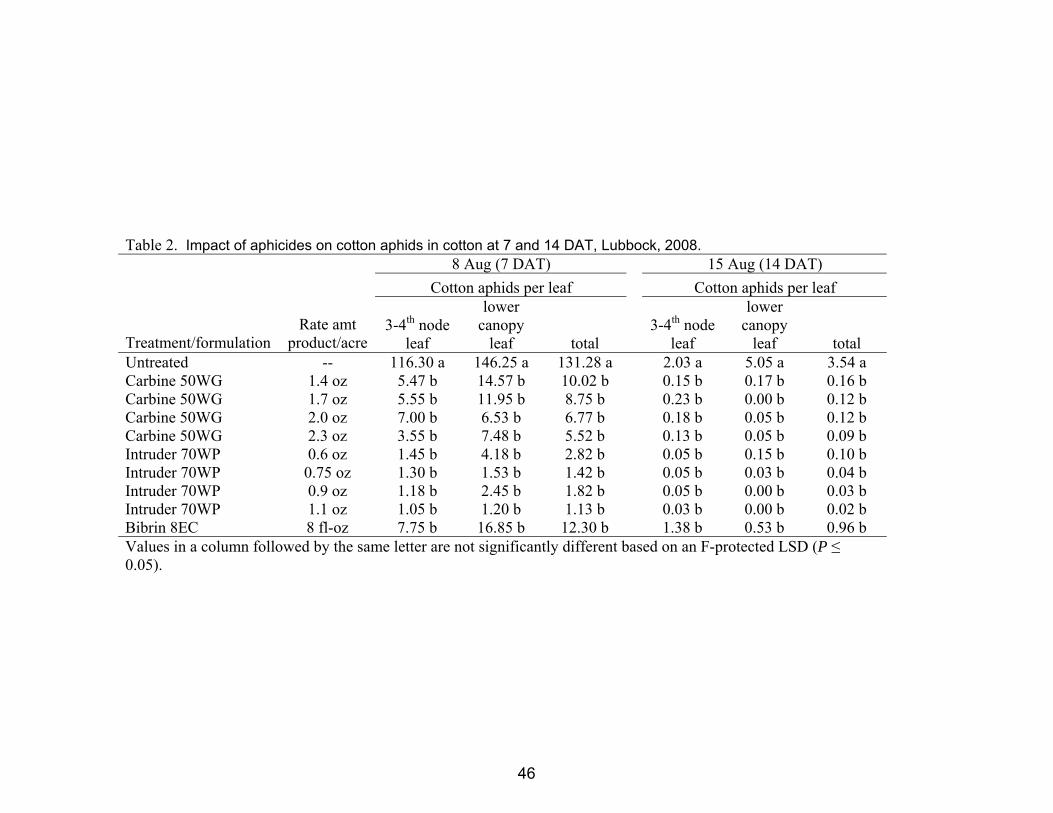
Table 2. Impact of aphicides on cotton aphids in cotton at 7 and 14 DAT, Lubbock, 2008. 8 Aug (7 DAT) 15 Aug (14 DAT)
Cotton aphids per leaf Cotton aphids per leaf
Treatment/formulation Rate amt
product/acre3-4th node
leaf
lower canopy
leaf total 3-4th node
leaf
lower canopy
leaf total Untreated -- 116.30 a 146.25 a 131.28 a 2.03 a 5.05 a 3.54 a Carbine 50WG 1.4 oz 5.47 b 14.57 b 10.02 b 0.15 b 0.17 b 0.16 b Carbine 50WG 1.7 oz 5.55 b 11.95 b 8.75 b 0.23 b 0.00 b 0.12 b Carbine 50WG 2.0 oz 7.00 b 6.53 b 6.77 b 0.18 b 0.05 b 0.12 b Carbine 50WG 2.3 oz 3.55 b 7.48 b 5.52 b 0.13 b 0.05 b 0.09 b Intruder 70WP 0.6 oz 1.45 b 4.18 b 2.82 b 0.05 b 0.15 b 0.10 b Intruder 70WP 0.75 oz 1.30 b 1.53 b 1.42 b 0.05 b 0.03 b 0.04 b Intruder 70WP 0.9 oz 1.18 b 2.45 b 1.82 b 0.05 b 0.00 b 0.03 b Intruder 70WP 1.1 oz 1.05 b 1.20 b 1.13 b 0.03 b 0.00 b 0.02 b Bibrin 8EC 8 fl-oz 7.75 b 16.85 b 12.30 b 1.38 b 0.53 b 0.96 b Values in a column followed by the same letter are not significantly different based on an F-protected LSD (P ≤ 0.05).
46

Efficacy of Insecticides towards a Sub-threshold, Chronic Infestation of Lygus - 2008
Cooperators: Glenn Farms, Cotton Grower/Dana Palmer, Private Consultant
David Kerns and Bo Kesey
Extension Entomologist-Cotton and Extension Program Specialist-Cotton
Hockley County Summary:
The western tarnished plant bug, Lygus hesperus (Knight), is an common pest of cotton in the High Plains of Texas. Lygus are usually most severe in cotton located near alfalfa which serves as a reservoir and source of Lygus, especially following cutting of the alfalfa. However, prior to cutting the alfalfa, it is not uncommon for low populations of Lygus to leave the alfalfa for nearby cotton at sub-threshold levels resulting in long-term chronic infestations. An insecticide efficacy test targeting Lygus was conducted at one such location near Levelland, Texas. When this test was initiated, the Lygus population was comprised primarily of migratory adults and was averaging large sized larvae. After 7 days, all of the insecticides tested appeared to have good activity towards low/chronic populations of Lygus. These insecticides included: Carbine, Centric, Holster (cypermethrin), Vydate, Orthene and Diamond.
Objective:
To determine the efficacy of insecticides targeting a sub-threshold, but chronic infestation of western tarnished plant bugs in cotton.
Materials and Methods:
This test was conducted in a commercial cotton field managed by Glenn Farms near Levelland, TX. Cotton, ‘FiberMax 9063B2F’ was planted in late May on 40-inch rows, and irrigated using a pivot irrigation system. The test was a randomized complete block design with four replications. Plots were 4-rows wide × 60 ft in length. Insecticides were applied with a CO2 pressurized hand-boom sprayer calibrated to deliver 10 gpa through TX-6 hollow cone nozzles (2 per row) at 40 psi. Insecticides were applied to all four rows of each plot on 13 Aug. A crop oil concentrate was added to each treatment at 1% v/v. The western tarnished plant bug, Lygus hesperus (Knight), population was estimated on
47

13, 15 and 20 Aug utilizing a 36-inch x 40-inch black drop cloth. Drop cloths were laid between the rows and approximately 1.5 row-ft of cotton were shaken onto the drop cloth from each row; four drop cloth samples were taken per plot. Data were analyzed with PROC MIXED, and means were separated using an F-protected LSD (P ≤ 0.05).
Results and Discussion:
On 13 Aug (pretreatment count), the Lygus population was comprised primarily of migratory adults and was averaging 2.26 total Lygus per 6 ft-row across all plots. No statistical differences were detected among treatments at this time (Table 1). Although the Lygus population was below the threshold of 4 Lygus per 6 ft-row, the population had been constant for several weeks. It was evident that the Lygus were moving into the field on a regular basis from an adjacent circle of alfalfa. At 2 DAT, all of the insecticide treatments had fewer nymphs and total Lygus than the untreated. Among the insecticide treatments, Vydate had fewer total Lygus than Diamond, but Diamond was not expected to exhibit much activity at 2 DAT. Diamond is an IGR that is active only towards nymphal stages, and usually takes more than 2 days to demonstrate activity. At 7 DAT, the Lygus population had declined, but all of the insecticides had fewer Lygus nymphs than the untreated. At low Lygus populations, all of the insecticides evaluated appeared to have adequate activity towards western tarnished plant bugs.
Acknowledgments:
Appreciation is expressed to Plains Cotton Growers for financial support of this project.
Disclaimer Clause: Trade names of commercial products used in this report are included only for better
understanding and clarity. Reference to commercial products or trade names is made with the understanding that no discrimination is intended and no endorsement by the Texas A&M University System is implied. Readers should realize that results from one experiment do not represent conclusive evidence that the same response would occur where conditions vary.
48
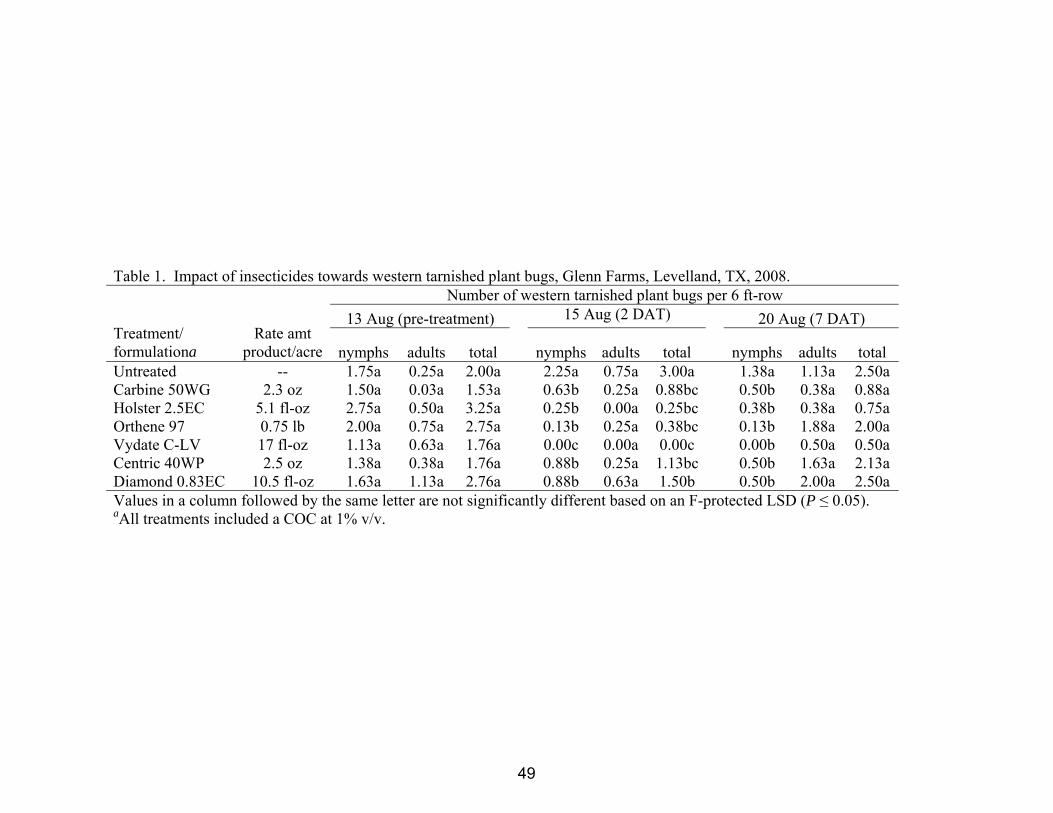
Table 1. Impact of insecticides towards western tarnished plant bugs, Glenn Farms, Levelland, TX, 2008. Number of western tarnished plant bugs per 6 ft-row
13 Aug (pre-treatment) 15 Aug (2 DAT) 20 Aug (7 DAT) Treatment/ formulationa
Rate amt product/acre nymphs adults total
nymphs adults total nymphs adults total
Untreated -- 1.75a 0.25a 2.00a 2.25a 0.75a 3.00a 1.38a 1.13a 2.50a Carbine 50WG 2.3 oz 1.50a 0.03a 1.53a 0.63b 0.25a 0.88bc 0.50b 0.38a 0.88a Holster 2.5EC 5.1 fl-oz 2.75a 0.50a 3.25a 0.25b 0.00a 0.25bc 0.38b 0.38a 0.75a Orthene 97 0.75 lb 2.00a 0.75a 2.75a 0.13b 0.25a 0.38bc 0.13b 1.88a 2.00a Vydate C-LV 17 fl-oz 1.13a 0.63a 1.76a 0.00c 0.00a 0.00c 0.00b 0.50a 0.50a Centric 40WP 2.5 oz 1.38a 0.38a 1.76a 0.88b 0.25a 1.13bc 0.50b 1.63a 2.13a Diamond 0.83EC 10.5 fl-oz 1.63a 1.13a 2.76a 0.88b 0.63a 1.50b 0.50b 2.00a 2.50a Values in a column followed by the same letter are not significantly different based on an F-protected LSD (P ≤ 0.05). aAll treatments included a COC at 1% v/v.
49

Chemical Management of Lygus in Late-Season Cotton and Impact on Yield - 2008
Cooperators: Glenn Farms, Cotton Grower/Dana Palmer, Private Consultant/
Texas AgriLife Extension Service/Texas AgriLife Research/Depart. of Plant and Soil Science, Texas Tech University
David Kerns, Abhilash Balachandran, Brant Baugh,
Megha Parajulee and Bo Kesey Extension Entomologist-Cotton, Research Assistant, EA-IPM Lubbock County, Research Entomologist and
Extension Program Specialist-Cotton
Hockley County Summary:
Overall, western tarnished plant bug, Lygus hesperus (Knight), populations were low across the High Plains of Texas in 2008. However, where ever alfalfa – cotton systems exists, there is high chance of an infestation of Lygus. Being a highly mobile insect, Lygus exhibits back and forth movement between alfalfa and cotton depending on phenological stage of the crop. Since our study was conducted in such a system where the adjacent field of alfalfa acted as the major source of Lygus; even in late season cotton (8 NAWF), it was evident that yield could be affected if not managed in a timely manner. We observed a 239 lbs-lint/acre reduction beween the highest yielding treatment and the untreated. All insecticides except Centric and Diamond had a significant impact in reducing Lygus populations below threshold at 3 DAT, continuing until 13 DAT. Centric and Diamond showed activity at 6 DAT. Percentage of bolls (at 150-200 HU maturity) with external and internal injury did not vary among insecticides initially, but after treatment showed a sharp decline relative to the untreated beginning at 6 DAT. Holster recorded the least amount of Lygus injury to the bolls. The currently recommended threshold of 4 Lygus/6 ft-row appears to follow the yield response curve, adding validity to the threshold. Additionally, because of the tight linear relationship where approximately 50% of 150-200 HU aged bolls with external injury resulted in internal injury, a threshold based on external injury using this boll age cohort is may be possible. With further evaluation, an action threshold of 25% bolls with external injury could be used as a scouting measure for the population threshold of 4 Lygus/6 ft-row. Orthene proved to be the best insecticide considering the lint yield, overall effect in reducing the Lygus population, injury to bolls, and net return.
50

Objective:
To determine the efficacy of insecticides targeting a sub-threshold, but chronic infestation of western tarnished plant bugs in cotton.
Materials and Methods:
The field trial was conducted in southeastern Hockley County, TX. The cotton field had adjacent vegetation of alfalfa, cotton, weeds and trees. The alfalfa had high numbers of Lygus which acted as source for Lygus in the cotton. The experiment was a randomized complete block design with seven treatments and four replications. The plots were of 4 rows x 60 ft; ‘FiberMax 9063B2F’ was the variety and was planted on 40-inch rows. The field was irrigated using a sub-surface drip irrigation system. The insecticides evaluated and rates are listed in the tables; the control plots were untreated. During the experiment, cotton was at approximately the 8 nodes above white flower stage. The Lygus population was estimated by drop cloth method (3 ft x 2 ft) and expressed as mean density/6-ft row. Bolls of approximately 10-20 mm dia. (~150 – 200 HU maturity) were collected at random from the plots for damage assessment. Pre-treatment observations on Lygus densities and boll samples were taken on Aug 20, 2008. Approximately 30 bolls were collected from each plot to assess external and internal damage. The samples were collected in Ziploc bags and stored in a refrigerator until damage observations were recorded. The insecticide application was made on Aug 23 using a four nozzle CO2 pressurized hand boom sprayer with a discharge rate of 10 gallons/acre. Population counts were made at 3, 6 and 13 DAT, and boll samples were collected at 6 and 13 DAT. The boll samples consisted of 20 bolls/plot. The external damage assessment was made by counting the number of feeding punctures using a 10x magnifying lens. For internal damage, bolls were cut cross sectional with two cuts, one at about one third and next at two thirds from the tip. The number of locules damaged were counted and recorded as internal damage. The plots were harvested on Nov 11 using an HB hand stripper. A 1/1000th acre section was harvested from the middle two rows of each plot. Grab samples were taken by plot and ginned at the Texas AgriLife Research and Extension Center at Lubbock to determine gin turnouts. Lint samples were submitted to the International Textile Center at Texas Tech University for HVI analysis, and USDA Commodity Credit Corporation (CCC) Loan values were determined for each treatment by plot. Data were analyzed using SAS PROC MIXED and means separated using protected LSD (P ≤ 0.05). The internal and external damage were expressed in % number of bolls affected.
Results and Discussion:
Pre-treatment counts of Lygus by drop cloth method showed no significant differences among treatments (Table 1). Population densities (Lygus nymphs and adults) were above treatment threshold (4 Lygus/6-ft row) in all plots. Post-treatment observations (3, 6 and 13 DAT) showed a sharp decline in Lygus densities across all treated plots, while the densities increased in untreated plots (Tables 1 & 2). The population in the untreated plots remained above threshold through 13 DAT (Table 2). Holster (cypermethrin), Vydate, Orthene and Carbine were able to reduce the Lygus populations below threshold at 3 DAT, after which the population continued to remain low through 13 DAT (Tables 1 & 2). Centric and Diamond reduced the population below threshold at 6 DAT
51

(Table 1). The results clearly indicate that Lygus population in the Texas High Plains could be suppressed effectively by insecticidal application and that softer insecticides like Carbine and Diamond could be utilized. Boll damage based on % bolls with external and internal injury/damaged locules did not differ among plots in pre-treatment observations (Table 3). At 6 DAT, the percentage of bolls with external and internal injury decreased in all treated plots, whereas damage in untreated plots increased. Plots treated with Holster had the least damage which may be due to its longer residual effect. Among the treatments, only the 6 DAT sample had significant differences among treatments for both internal and external injury, whereas at the 13 DAT sample, when the Lygus population had declined across the entire test, did not show differences between treatments. Of the treatments, Centric, Vydate and Diamond demonstrated the least amount of boll protection although they had significantly less damaged bolls than in untreated plots. The external and internal injury on the bolls showed a linear relationship. A simple linear regression of % bolls with external injury and % bolls with internal injury demonstrated a strong positive relationship (R2 = 0.97, P < 0.0001) (Figure 1). Results indicated that approximately 50% of the bolls with external damage suffered internal damage. Because of the tightness of this relationship, one can reasonably assume that 50% of bolls sampled within the 150-200 HU age cohort with external injury will have internal damage. Simple linear regression analysis also demonstrated a good relationship between Lygus density and external injury (R2=0.82, P<0.0001) (Figure 2). At a threshold of 4 Lygus/6 row ft., the % bolls with external injury would be around 25%. Thus it is possible that a threshold based on external boll injury in the presence of Lygus could be developed. Such a threshold may make sampling for Lygus easier and less time consuming. Significant yield differences were observed among treatments (Table 3). Orthene recorded the highest lint yield (958 lbs/acre), but did not differ significantly from Holster or Diamond. The lowest yields were recorded in the Centric and untreated plots at 687 and 719 lbs/acre, respectively. In addition to the untreated, Centric did not statistically differ from Carbine or Vydate. The reason the yields were poor in the Centric plots is not known. A sigmoidal 3 parameter Chapman simple linear regression analysis indicated a significant correlation between Lygus/6 ft-row and yield (lbs-lint/acre); R2 = 0.48 (P < 0.0004) (Figure 3). A threshold of 4 Lygus/6 ft-row appears to be well situated to prevent the steepest portion of the curve toward yield reduction. For the most part, HVI analysis showed no differences among treatments for all parameters tested with the exception of micronaire (Table 4). Mike was highest in the untreated plots, but did not differ from Carbine or Diamond. It is plausible that mike was greatest in the untreated because those plots suffered high yield loss most likely due to aborted bolls. Since the bolls that were aborted were among the last to be viable for harvest, they would naturally have a lower mike, especially with the early freeze on 21 October. Thus, the low mike bolls were essentially eliminated from the untreated plots resulting in a higher mike average. The reason Carbine and Diamond did not differ from the untreated is uncertain, but it is curious that both of these products tend to be slow acting, although Carbine did not appear slow in this study. Additionally, one might expect Centric to exhibit a higher mike average since its yield was the lowest in the test, but for unexplained reasons, its mike was the lowest in the test.
52

Based on the cost of the insecticides, crop oil concentrate and estimated application, along with yield and loan values for each plot, the net return was calculated for each treatment. Keep in mind that these values will change along with the price of the product and other inputs. For application cost, we chose a cost of $4.00/acre which should be somewhere in the middle of the range between self application and aerial application. Orthene resulted in the greatest net return at $105.14/acre, but did not statistically differ from Diamond at $66.28/acre. As one might expect due to its low yield and low mike, the Centric treated plots had the lowest net return with a loss of $32.56, which did not statistically differ from the untreated or Vydate. Other benefits not expressed in this study are the impact on insect natural enemies and potential for flaring aphids or mites. Both Carbine and Centric have aphid activity, and Carbine appears to be very soft on beneficials. Centric is soft on some beneficials as well, but is harsh towards lady beetle larvae and thrips. It impact on thrips has been implicated in contributing to mite outbreaks under some conditions, but this relationship is not fully understood. Diamond is also very soft on insect natural enemies, and has activity on many lepidopterous pests as well.
Acknowledgments:
Appreciation is expressed to the Texas Department of Agriculture - Food and Fiber Research for funding of HVI testing at the Texas Tech University - Fiber and Biopolymer Research Institute, and to Plains Cotton Growers for financial support of this project.
Disclaimer Clause: Trade names of commercial products used in this report are included only for better
understanding and clarity. Reference to commercial products or trade names is made with the understanding that no discrimination is intended and no endorsement by the Texas A&M University System is implied. Readers should realize that results from one experiment do not represent conclusive evidence that the same response would occur where conditions vary.
53
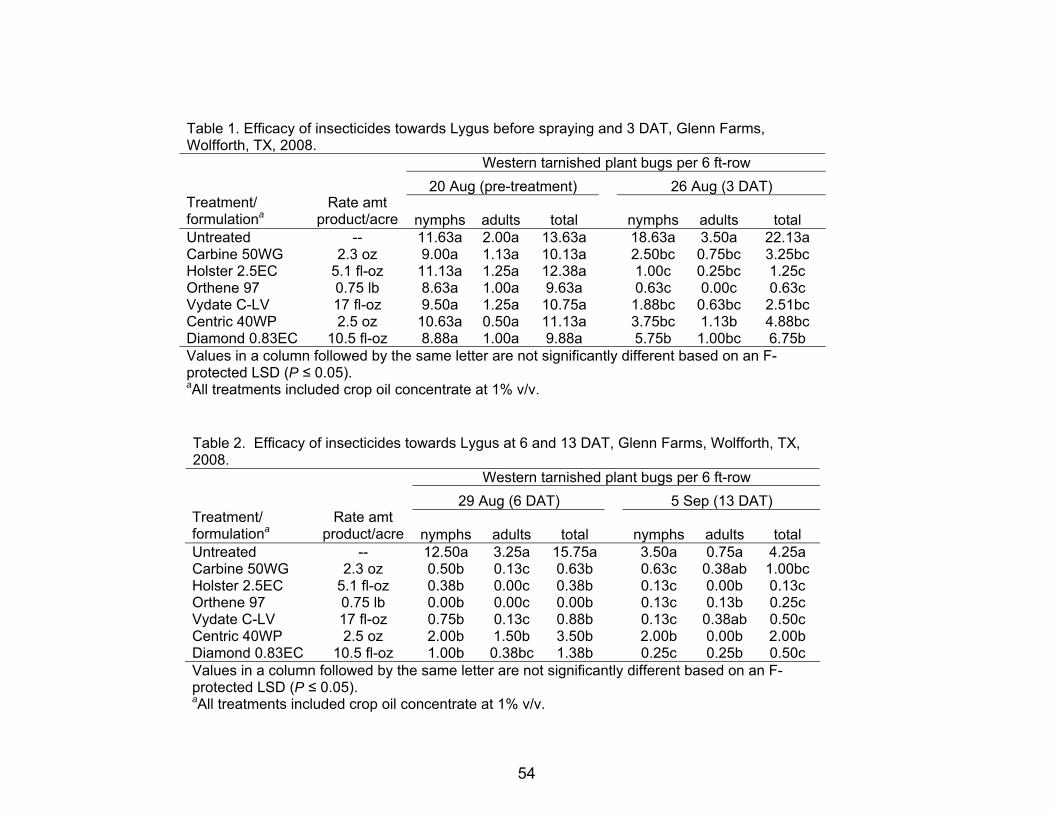
Table 1. Efficacy of insecticides towards Lygus before spraying and 3 DAT, Glenn Farms, Wolfforth, TX, 2008.
Western tarnished plant bugs per 6 ft-row 20 Aug (pre-treatment) 26 Aug (3 DAT)
Treatment/ formulationa
Rate amt product/acre nymphs adults total nymphs adults total
Untreated -- 11.63a 2.00a 13.63a 18.63a 3.50a 22.13a Carbine 50WG 2.3 oz 9.00a 1.13a 10.13a 2.50bc 0.75bc 3.25bc Holster 2.5EC 5.1 fl-oz 11.13a 1.25a 12.38a 1.00c 0.25bc 1.25c Orthene 97 0.75 lb 8.63a 1.00a 9.63a 0.63c 0.00c 0.63c Vydate C-LV 17 fl-oz 9.50a 1.25a 10.75a 1.88bc 0.63bc 2.51bc Centric 40WP 2.5 oz 10.63a 0.50a 11.13a 3.75bc 1.13b 4.88bc Diamond 0.83EC 10.5 fl-oz 8.88a 1.00a 9.88a 5.75b 1.00bc 6.75b Values in a column followed by the same letter are not significantly different based on an F-protected LSD (P ≤ 0.05). aAll treatments included crop oil concentrate at 1% v/v.
Table 2. Efficacy of insecticides towards Lygus at 6 and 13 DAT, Glenn Farms, Wolfforth, TX, 2008.
Western tarnished plant bugs per 6 ft-row 29 Aug (6 DAT) 5 Sep (13 DAT)
Treatment/ formulationa
Rate amt product/acre nymphs adults total nymphs adults total
Untreated -- 12.50a 3.25a 15.75a 3.50a 0.75a 4.25a Carbine 50WG 2.3 oz 0.50b 0.13c 0.63b 0.63c 0.38ab 1.00bc Holster 2.5EC 5.1 fl-oz 0.38b 0.00c 0.38b 0.13c 0.00b 0.13c Orthene 97 0.75 lb 0.00b 0.00c 0.00b 0.13c 0.13b 0.25c Vydate C-LV 17 fl-oz 0.75b 0.13c 0.88b 0.13c 0.38ab 0.50c Centric 40WP 2.5 oz 2.00b 1.50b 3.50b 2.00b 0.00b 2.00b Diamond 0.83EC 10.5 fl-oz 1.00b 0.38bc 1.38b 0.25c 0.25b 0.50c Values in a column followed by the same letter are not significantly different based on an F-protected LSD (P ≤ 0.05). aAll treatments included crop oil concentrate at 1% v/v.
54
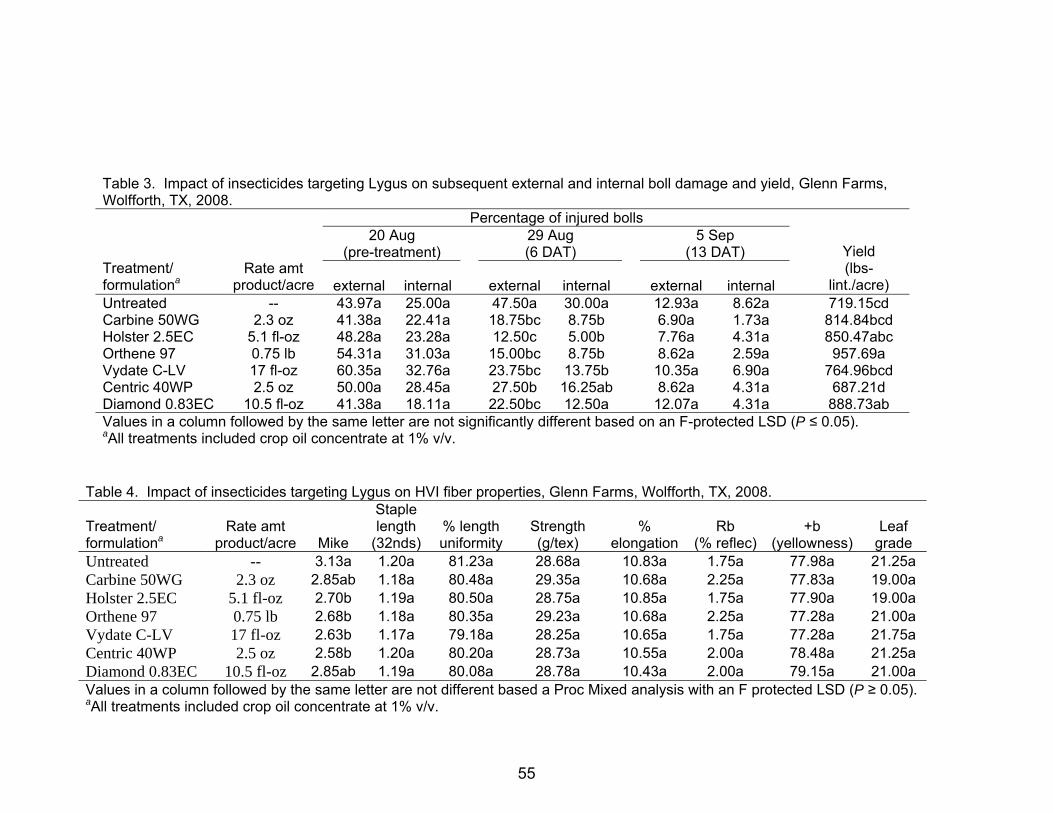
Table 3. Impact of insecticides targeting Lygus on subsequent external and internal boll damage and yield, Glenn Farms, Wolfforth, TX, 2008.
Percentage of injured bolls 20 Aug
(pre-treatment) 29 Aug (6 DAT)
5 Sep (13 DAT)
Treatment/ formulationa
Rate amt product/acre external internal external internal
external internal
Yield (lbs-
lint./acre) Untreated -- 43.97a 25.00a 47.50a 30.00a 12.93a 8.62a 719.15cd Carbine 50WG 2.3 oz 41.38a 22.41a 18.75bc 8.75b 6.90a 1.73a 814.84bcd Holster 2.5EC 5.1 fl-oz 48.28a 23.28a 12.50c 5.00b 7.76a 4.31a 850.47abc Orthene 97 0.75 lb 54.31a 31.03a 15.00bc 8.75b 8.62a 2.59a 957.69a Vydate C-LV 17 fl-oz 60.35a 32.76a 23.75bc 13.75b 10.35a 6.90a 764.96bcd Centric 40WP 2.5 oz 50.00a 28.45a 27.50b 16.25ab 8.62a 4.31a 687.21d Diamond 0.83EC 10.5 fl-oz 41.38a 18.11a 22.50bc 12.50a 12.07a 4.31a 888.73ab Values in a column followed by the same letter are not significantly different based on an F-protected LSD (P ≤ 0.05). aAll treatments included crop oil concentrate at 1% v/v.
Table 4. Impact of insecticides targeting Lygus on HVI fiber properties, Glenn Farms, Wolfforth, TX, 2008.
Treatment/ formulationa
Rate amt product/acre Mike
Staple length
(32nds) % length uniformity
Strength (g/tex)
% elongation
Rb (% reflec)
+b (yellowness)
Leaf grade
Untreated -- 3.13a 1.20a 81.23a 28.68a 10.83a 1.75a 77.98a 21.25a Carbine 50WG 2.3 oz 2.85ab 1.18a 80.48a 29.35a 10.68a 2.25a 77.83a 19.00a Holster 2.5EC 5.1 fl-oz 2.70b 1.19a 80.50a 28.75a 10.85a 1.75a 77.90a 19.00a Orthene 97 0.75 lb 2.68b 1.18a 80.35a 29.23a 10.68a 2.25a 77.28a 21.00a Vydate C-LV 17 fl-oz 2.63b 1.17a 79.18a 28.25a 10.65a 1.75a 77.28a 21.75a Centric 40WP 2.5 oz 2.58b 1.20a 80.20a 28.73a 10.55a 2.00a 78.48a 21.25a Diamond 0.83EC 10.5 fl-oz 2.85ab 1.19a 80.08a 28.78a 10.43a 2.00a 79.15a 21.00a Values in a column followed by the same letter are not different based a Proc Mixed analysis with an F protected LSD (P ≥ 0.05). aAll treatments included crop oil concentrate at 1% v/v.
55
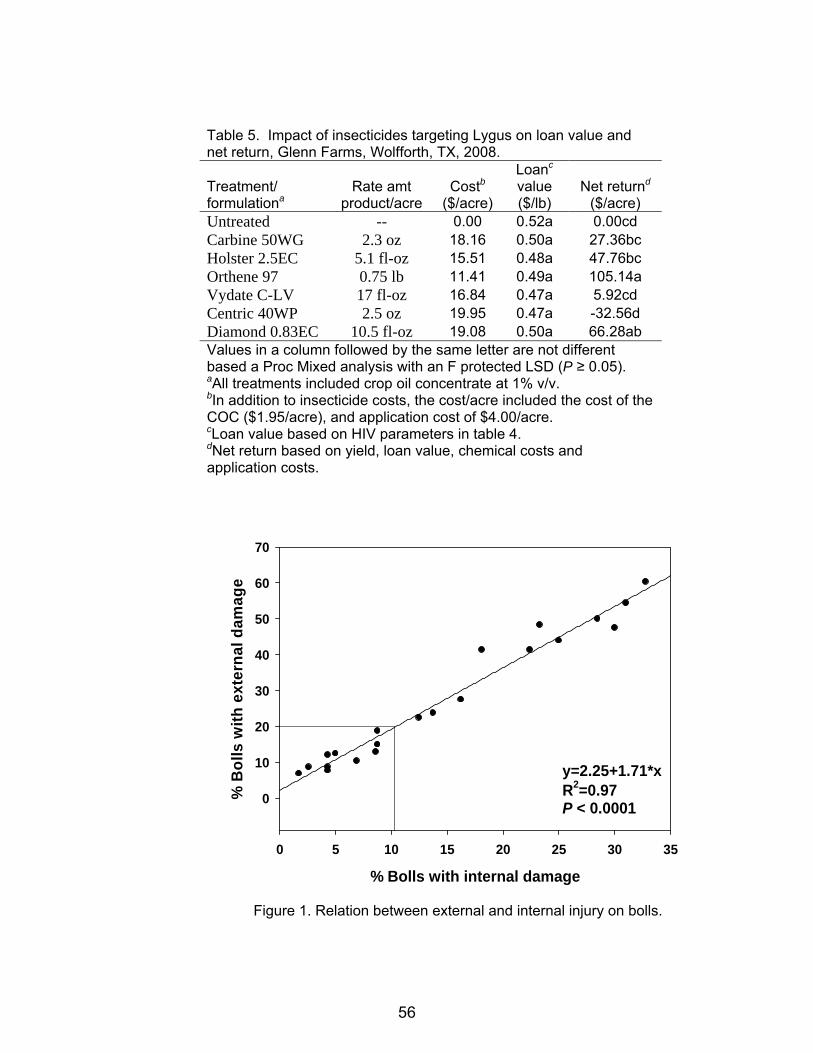
Table 5. Impact of insecticides targeting Lygus on loan value and net return, Glenn Farms, Wolfforth, TX, 2008.
Treatment/ formulationa
Rate amt product/acre
Costb ($/acre)
Loanc value ($/lb)
Net returnd ($/acre)
Untreated -- 0.00 0.52a 0.00cd Carbine 50WG 2.3 oz 18.16 0.50a 27.36bc Holster 2.5EC 5.1 fl-oz 15.51 0.48a 47.76bc Orthene 97 0.75 lb 11.41 0.49a 105.14a Vydate C-LV 17 fl-oz 16.84 0.47a 5.92cd Centric 40WP 2.5 oz 19.95 0.47a -32.56d Diamond 0.83EC 10.5 fl-oz 19.08 0.50a 66.28ab Values in a column followed by the same letter are not different based a Proc Mixed analysis with an F protected LSD (P ≥ 0.05). aAll treatments included crop oil concentrate at 1% v/v. bIn addition to insecticide costs, the cost/acre included the cost of the COC ($1.95/acre), and application cost of $4.00/acre. cLoan value based on HIV parameters in table 4. dNet return based on yield, loan value, chemical costs and application costs.
% Bolls with internal damage
0 5 10 15 20 25 30 35
% B
olls
with
ext
erna
l dam
age
0
10
20
30
40
50
60
70
y=2.25+1.71*xR2=0.97P < 0.0001
Figure 1. Relation between external and internal injury on bolls.
56

% Bolls with external damage
0 5 10 15 20 25 30 35 40 45 50 55 60 65 70
No.
Lyg
us p
er 6
ft-r
ow
-4
-2
0
2
4
6
8
10
12
14
16
18
y=2.21-0.27*xR2=0.82P < 0.0001
Figure 2. Relation between Lygus population and external injury on bolls.
Yield (lbs/acre)
400 600 800 1000
Lygu
s (6
ft-ro
w)
0
4
8
12
16
20
24
28
32
36
40
y=a(1-e-bx)c
R2=0.48P < 0.004
Figure 3. Relation between Lygus population and yield.
57
Efficacy of Insecticides for Beet Armyworm Control in Cotton - 2008
Cooperators: Texas AgriLife Research & Extension Center – Lubbock
David Kerns, Brant Baugh, and Bo Kesey Extension Entomologist-Cotton, EA-IPM Lubbock County,
and Extension Program Specialist-Cotton
Lubbock County Summary:
Beet armyworm, Spodoptera exigua (Hübner) is an occasional pest on non-Bt cotton grown in the High Plains of Texas. An insecticide efficacy test targeting beet armyworms was conducted at the Texas AgriLife Research and Extension Center in Lubbock, Texas. When this test was initiated, the armyworm population was comprised primarily of large sized larvae. Belt, Coragen, Demin, Intrepid, Diamond and Steward all exhibited very good activity toward all the larval sizes, while Cobalt appeared to be active primarily towards small larvae. When evaluating total larvae, Tracer was also somewhat weaker relative to the other treatments. The reason Tracer did not perform well is not certain, but perhaps the rate, although at its maximum, may be too low for large armyworms where coverage is difficult.
Objective:
To determine the efficacy of insecticides targeting cotton aphids and their impact on aphid predators.
Materials and Methods:
This test was conducted at the Texas AgriLife Research and Extension Center in Lubbock, Texas. Cotton ‘DeltaPine 174 RF’ was planted on 4 June 2008 on 40-inch rows and irrigated using furrow run irrigation. Plots were 4-rows wide × 80-feet long. Plots were arranged in a randomized complete block design with 4 replicates. A beet armyworm outbreak was induced by overspraying the entire test area with Karate 1EC (lambda cyhalothrin) at 4.0 fl-oz per acre on 18 July and 7 August. The insecticide treatments and rates are outlined in the tables. All treatments were applied with a CO2 pressurized hand boom calibrated to deliver 10 gallons/acre. All treatment included the non-ionic surfactant Liberate at 0.156% v/v except one treatment of Belt, which included methylated seed oil at 1.88% v/v. The spray boom consisted of 2 hollow cone TX-6 nozzles per row spaced at 20 inches.
58

Treatments were applied on 25 August 2008. The application should probably have been applied 5-7 days earlier, but heavy rainfall prevented access to the field. The beet armyworm, Spodoptera exigua (Hübner), population was estimated utilizing a 36-inch x 40-inch black drop cloth. Drop cloths were laid between the rows and approximately 1.5 row-ft of cotton were shaken onto the drop cloth from each row, and the number and size, small (< 0.25 inch), medium (0.25-0.625 inch) and large (> 0.625 inch), of beet armyworm larvae were counted. Data were analyzed with PROC MIXED, and means were separated using an F-protected LSD (P ≤ 0.05).
Results and Discussion:
Prior to insecticide application, the armyworm population was averaging 4.87 larvae per 6-ft-row. At this time there were no significant differences among treatments (Table 1). Additionally, the armyworm population was comprised primarily of large larvae, followed by medium sized and small. It was evident that insecticides should have been applied earlier since in general smaller larvae are more easily controlled. At 4 DAT, all of the insecticide treatments contained fewer small larvae than the untreated, and there were no differences among treatments for medium sized larvae. The untreated did not differ from any of the insecticide treatments for large larvae, but Cobalt had more large larvae than the other insecticide treatments. It appears that Cobalt is efficacious towards small larvae, but may be somewhat weak against larger larvae. This is not necessarily surprising since Cobalt is a mixture of two older chemistries, Lorsban and the pyrethroid gamma-cyhalothrin, which are known to be most active on smaller sized larvae. Additionally, Cobalt is probably harsher towards the natural enemies relative to the other insecticides, which have influenced it performance. When evaluating total larvae, Tracer was also somewhat weaker relative to the other treatments. Tracer in known to have exceptional activity towards beet armyworms, especially in vegetable crops. The reason it did not perform well here is not certain, but perhaps the rate, although at its maximum, may be too low for large armyworms where coverage is difficult. All of the other insecticides performed equally well at the rates tested. We did not see any benefit in this test from including a methylated seed oil with Belt over a non-ionic surfactant. A high level of parasitism was evident in this test which undoubtedly suppressed the number of larger larvae in the untreated at 4 DAT. The number of small larvae in the untreated had increased since the initial evaluation indicating that egg laying was still occurring. Shortly after the 4 DAT evaluation the beet armyworm population crashed due to predation and parasitism.
Acknowledgments:
Appreciation is expressed to Plains Cotton Growers for financial support of this project.
Disclaimer Clause: Trade names of commercial products used in this report are included only for better
59

understanding and clarity. Reference to commercial products or trade names is made with the understanding that no discrimination is intended and no endorsement by the Texas A&M University System is implied. Readers should realize that results from one experiment do not represent conclusive evidence that the same response would occur where conditions vary.
60

Table 1. Impact of various insecticides toward small, medium and large sized beet armyworms. Number of beet armyworms per 6 ft-row
25 Aug (pre-treatment) 29 Aug (4 DAT) Treatment/ formulationa
Rate amt product/acre small medium large total small medium large total
Untreated -- 0.50a 1.00a 1.75a 3.25a 2.75a 1.25a 1.25ab 5.25a Belt 480SC 3 fl-oz 0.50a 1.25a 3.75a 5.50a 0.25b 0.25a 0.50b 1.00b Belt 480SC + MSO 3 fl-oz 0.25a 0.75a 2.50a 3.50a 0.00b 0.25a 0.00b 0.25b Cobalt 38 fl-oz 1.00a 1.50a 4.00a 6.50a 0.25b 1.00a 3.00a 4.25a Coragen 1.67SC 5 fl-oz 1.50a 2.00a 2.50a 6.00a 0.00b 0.75a 0.00b 0.75b Demin 0.16EC 8 fl-oz 0.25a 0.75a 2.50a 3.50a 0.00b 0.00a 0.50b 0.50b Diamond 0.83EC 12 fl-oz 2.00a 2.00a 2.00a 6.00a 0.25b 0.25a 0.25b 0.75b Intrepid 2F 6 fl-oz 0.25a 2.50a 3.25a 6.00a 0.50b 0.50a 0.00b 1.00b Steward 1.25EC 11.3 fl-oz 1.50a 1.00a 1.25a 3.75a 0.50b 0.00a 0.25b 0.75b Tracer 4SC 2.9 fl-oz 2.75a 0.75a 1.25a 4.75a 0.00b 1.75a 1.50b 3.25ab Values in a column followed by the same letter are not different based a Proc Mixed analysis with an F protected LSD (P ≥ 0.05) aAll treatments, except Belt 480SC + MSO at 1.88% v/v, included the non-ionic surfactant Liberate at 0.156 % v/v.
61
Evaluation of New Chemistries for Bollworm Management in the Texas High Plains - 2008
Cooperators: Kenneth Schilling, Cotton Grower/Texas AgriLife Extension Service
David Kerns, Emilio Nino, Brant Baugh,
Greg Cronholm, Steve Young, and Bo Kesey Extension Entomologist-Cotton, EA-IPM Castro/Lamb Counties,
EA-IPM Lubbock County, EA-IPM Hale/Swisher Counties, CEA-ANR Castro County, and Extension Program Specialist-Cotton
Castro County
Summary:
The cotton bollworm, Helicoverpa zea (Boddie), is one of the most damaging pests of cotton in the Texas High Plains. Traditionally, pyrethroids are the products of choice for managing bollworms. However, when concurrent infestations of beet armyworms, Spodoptera exigua (Hübner) are encountered, pyrethroids are not a stand only choice since they lack efficacy towards beet armyworms. At 5 DAT, Belt, Coragen, Steward and Karate, all had significantly fewer larvae than the untreated, but none of the treatments had reduced the bollworm population to sub-threshold levels. By 9 DAT, all of the insecticides had significantly fewer larvae than the untreated, but at this time only Karate had reduced the population below threshold. Results were similar at 15 DAT. The temperature during the test averaged a high of 80ºF and a low of 58ºF, whereas the long-term average for this time of year is an approximate high of 85ºF and a low of 58ºF. Since much of the activity for Belt and Coragen, and to a lesser extent Steward, is derived from ingestion, the cool temperatures may have reduced feeding activity to a point where some efficacy appeared to be somewhat compromised. Yield data was not entirely supportive of the findings based on bollworm counts. Belt was the only treatment to significantly yield more cotton than the untreated, but did not differ from Coragen. Consequently, Belt resulted in the greatest net return relative to the untreated, although it did not differ from Coragen. It is plausible that although the larvae in the Belt plots were alive, feeding may have been minimal. Thus, it appears that Belt, Coragen and Steward all exhibit good activity towards beet armyworms, and in addition to Karate, express efficacy towards bollworms when targeting small larvae. More research is required to determine the efficacy of these products toward larger sized bollworm larvae.
Objective:
To determine the efficacy of insecticides targeting cotton bollworm that also exhibit
62

activity towards beet armyworm relative to a standard bollworms material that does not have substantial beet armyworm activity.
Materials and Methods:
This test was conducted in Castro County near Dimmitt, TX. Cotton ‘FiberMax 9058 F’ was planted on 19 May 2008 on 30-inch rows. The plots were 4-rows wide × 60-feet long. In both tests, plots were arranged in a randomized complete block design with 4 replicates. The insecticide treatments and rates are outlined in Table 1. All treatments were applied with a CO2 pressurized hand boom calibrated to deliver 10 gallons/acre. The boom consisted of 2 TwinJet 8001VS nozzles per row. Treatments were applied on 27 August 2008. Bollworm, Helicoverpa zea (Boddie), populations were estimated by counting the number of bollworms from 10 whole plant inspections per plot. On both tests larvae size was estimated by length; small larvae (<1/4 inch), medium larvae (1/4 to 5/8 inch) and large (>5/8 inch). The bollworm test was harvested on 7 November 2008, using a 28-inch HB hand basket stripper. A 1/1000th acre portion was harvested from the middle two rows of each plot. Grab samples were taken by plot and ginned at the Texas AgriLife Research and Extension Center at Lubbock to determine gin turnouts. Lint samples were submitted to the International Textile Center at Texas Tech University for HVI analysis, and USDA Commodity Credit Corporation (CCC) Loan values were determined for each treatment by plot. All data were analyzed using PROC MIXED and the means were separated using an F protected LSD (P ≤ 0.05).
Results and Discussion:
The bollworm population was extremely high and was initially comprised of primarily small larvae. Thus, based on label recommendations, the timing for using Steward for bollworm control was optimal. On 27 August (pretreatment) plots were averaging 20,750, 4,500 and 1,500 small, medium and large larvae per acre respectively, and there were no statistical differences among treatments (Table 1). The Texas AgriLife Extension Service action threshold for bollworms post bloom is 10,000 small larvae per acre and 5,000 medium and large larvae per acre. Thus we were exceeding the action threshold for bollworms in this test. Medium larvae were the predominant size at 5 DAT. At this time the all of the insecticides had fewer small and total larvae than the untreated; there were no differences for medium and large size larvae. However, none of the treatments had reduced the bollworm population to sub-threshold levels. At 9 DAT, large larvae were the most numerous size. All of the insecticides has significantly fewer medium, large and total larvae than the untreated, but did not differ for small larvae (Table 2). Among the insecticides, Karate and Steward contained significantly fewer medium sized larvae than Coragen, but did not differ from Belt. Karate was the only treatment that was below the action threshold. At 15 DAT, all of the insecticides contained fewer large and total bollworms than the untreated, but did not differ among each other. There were no differences in small of medium size larvae. Although 15 days had passed since application, Karate was the
63

only treatment that reduced the bollworm population below the action threshold. However, based on yields, crop protection may not have been compromised in the other treatments. Plots treated with Belt produced the most cotton at 1,011 lbs-lint/acres, but did not differ from Coragen. Belt was the only treatment that differed from the untreated, which yielded 876 lbs-lint/acre. It is plausible that although the larvae in the Belt plots were alive feeding may have been minimal (Table 3). There were no detectable differences among treatments regarding any HVI traits (Table 4).
Acknowledgments:
Appreciation is expressed to the Texas Department of Agriculture - Food and Fiber Research for funding of HVI testing at the Texas Tech University - Fiber and Biopolymer Research Institute, and to Plains Cotton Growers for financial support of this project.
Disclaimer Clause: Trade names of commercial products used in this report are included only for better
understanding and clarity. Reference to commercial products or trade names is made with the understanding that no discrimination is intended and no endorsement by the Texas A&M University System is implied. Readers should realize that results from one experiment do not represent conclusive evidence that the same response would occur where conditions vary.
64
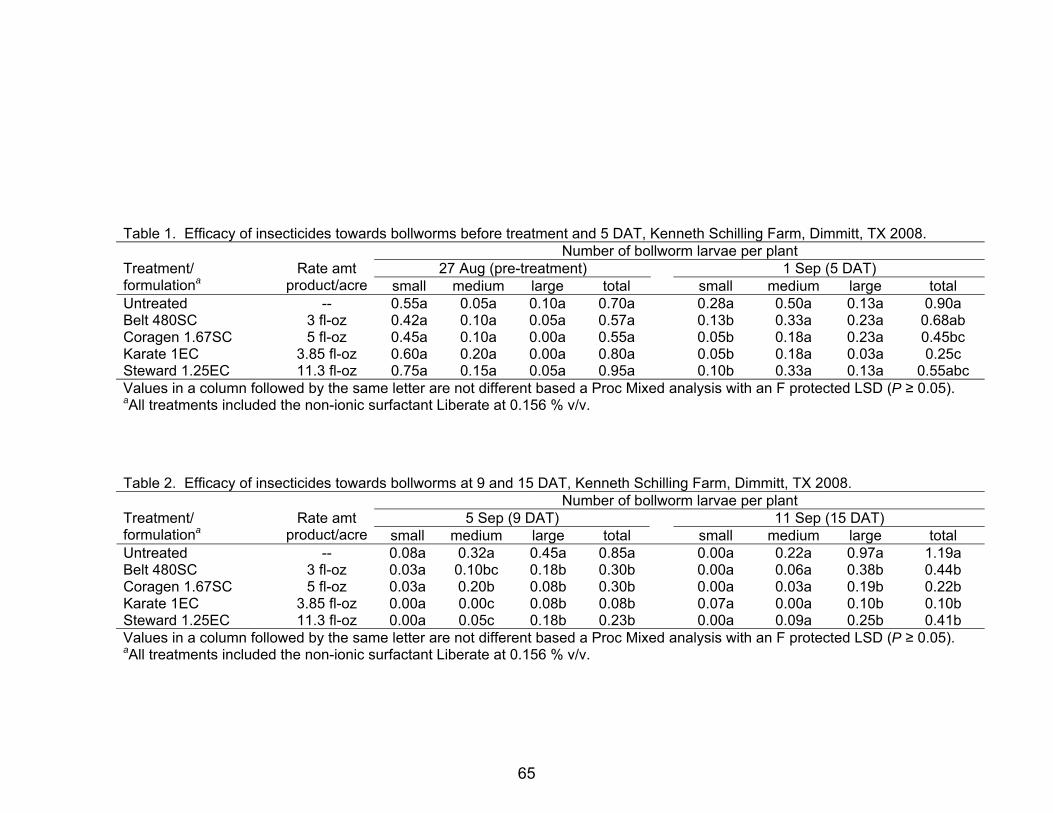
Table 1. Efficacy of insecticides towards bollworms before treatment and 5 DAT, Kenneth Schilling Farm, Dimmitt, TX 2008. Number of bollworm larvae per plant
27 Aug (pre-treatment) 1 Sep (5 DAT) Treatment/ formulationa
Rate amt product/acre small medium large total small medium large total
Untreated -- 0.55a 0.05a 0.10a 0.70a 0.28a 0.50a 0.13a 0.90a Belt 480SC 3 fl-oz 0.42a 0.10a 0.05a 0.57a 0.13b 0.33a 0.23a 0.68ab Coragen 1.67SC 5 fl-oz 0.45a 0.10a 0.00a 0.55a 0.05b 0.18a 0.23a 0.45bc Karate 1EC 3.85 fl-oz 0.60a 0.20a 0.00a 0.80a 0.05b 0.18a 0.03a 0.25c Steward 1.25EC 11.3 fl-oz 0.75a 0.15a 0.05a 0.95a 0.10b 0.33a 0.13a 0.55abc Values in a column followed by the same letter are not different based a Proc Mixed analysis with an F protected LSD (P ≥ 0.05). aAll treatments included the non-ionic surfactant Liberate at 0.156 % v/v.
Table 2. Efficacy of insecticides towards bollworms at 9 and 15 DAT, Kenneth Schilling Farm, Dimmitt, TX 2008. Number of bollworm larvae per plant
5 Sep (9 DAT) 11 Sep (15 DAT) Treatment/ formulationa
Rate amt product/acre small medium large total small medium large total
Untreated -- 0.08a 0.32a 0.45a 0.85a 0.00a 0.22a 0.97a 1.19a Belt 480SC 3 fl-oz 0.03a 0.10bc 0.18b 0.30b 0.00a 0.06a 0.38b 0.44b Coragen 1.67SC 5 fl-oz 0.03a 0.20b 0.08b 0.30b 0.00a 0.03a 0.19b 0.22b Karate 1EC 3.85 fl-oz 0.00a 0.00c 0.08b 0.08b 0.07a 0.00a 0.10b 0.10b Steward 1.25EC 11.3 fl-oz 0.00a 0.05c 0.18b 0.23b 0.00a 0.09a 0.25b 0.41b Values in a column followed by the same letter are not different based a Proc Mixed analysis with an F protected LSD (P ≥ 0.05). aAll treatments included the non-ionic surfactant Liberate at 0.156 % v/v.
65

Table 3. Impact of insecticides targeting bollworms on yield, turnout, loan value and profit, Kenneth Schilling Farm, Dimmitt, TX 2008. Treatment/ formulationa
Rate amt product/acre
Yield (lbs-lint/ac) % turnout
Loan valueb ($/lb)
Net returnc ($/ac)
Untreated -- 876.00b 22.50a 0.48a 0.00b Belt 480SC 3 fl-oz 1010.08a 22.50a 0.46a 61.69a Coragen 1.67SC 5 fl-oz 922.49ab 22.75a 0.46a 20.42ab Karate 1EC 3.85 fl-oz 892.25ab 22.25a 0.46a 7.44b Steward 1.25EC 11.3 fl-oz 847.49ab 22.00a 0.46a -12.02b Values in a column followed by the same letter are not different based a Proc Mixed analysis with an F protected LSD (P ≥ 0.05). aAll treatments included the non-ionic surfactant Liberate at 0.156 % v/v. bLoan values based on HVI quality parameters reported in table 4. cProfit is the amount of value added due to the insecticide application relative to the untreated, based on yield and loan value; insecticide and application costs were not included in this estimation.
Table 4. Impact of insecticides targeting bollworms on HVI fiber properties, Kenneth Schilling Farm, Dimmitt, TX 2008.
Treatment/ formulationa
Rate amt product/acre Mike
Staple length
(32nds) % length uniformity
Strength (g/tex)
% elongation
Rb (% reflec)
+b (yellowness)
Leaf grade
Untreated -- 2.83a 1.17a 80.98a 27.60a 9.98a 76.45bc 9.65a 3.25a Belt 480SC 3 fl-oz 2.55a 1.19a 80.58a 28.25a 9.80a 77.50a 9.70a 3.00a Coragen 1.67SC 5 fl-oz 2.65a 1.17a 80.55a 28.13a 9.85a 77.20ab 9.40a 4.25a Karate 1EC 3.85 fl-oz 2.58a 1.17a 80.05a 27.83a 9.88a 77.35ab 9.65a 3.50a Steward 1.25EC 11.3 fl-oz 2.65a 1.16a 80.53a 27.68a 9.90a 76.25c 9.65a 3.75a Values in a column followed by the same letter are not different based a Proc Mixed analysis with an F protected LSD (P ≥ 0.05). aAll treatments included the non-ionic surfactant Liberate at 0.156 % v/v.
66
Boll Damage Survey of Bt and non-Bt Cotton Varieties in the South Plains Region of Texas 2007-08
Cooperators: Texas AgriLife Extension Service
David Kerns, Monti Vandiver, Emilio Nino, Tommy Doederlein, Manda Cattaneo,
Greg Cronholm, Kerry Siders, Brant Baugh and Scott Russell Extension Entomologist-Cotton, EA-IPM Bailey/Parmer Counties, EA-IPM
Castro/Lamb Counties, EA-IPM Lynn/Dawson Counties, EA-IPM Gaines County, EA-IPM Hale/Swisher Counties, EA-IPM Hockley/Cochran Counties, EA-IPM
Lubbock County and EA-IPM Terry/Yoakum Counties
South Plains Summary:
Late-season boll damage surveys were conducted in 2007 and 2008 to evaluate the amount of Lepidoptera induced damage in Bt cotton varieties relative to non-Bt cotton varieties. Additional, data was collected on the number of insecticide applications required for these varieties to manage lepiopterous pests. Boll damage was light in 2007; however, more damaged bolls where found in the non-Bt fields (3.11%) than in the Bollgard (0.52%) and Bollgard II (0.25%) fields, but did not differ from the Widestrike fields (1.29%). Very few insecticide applications were made targeting bollworm in any of the 2007 survey fields and there were no significant differences among variety types. None of the Bt cotton fields were treated for bollworms, whereas 9% on the non-Bt field received a single insecticide application. Late season bollworm damage in 2008 was similar to 2007. All of the Bt cotton variety types had significantly fewer damaged bolls than the non-Bt varieties and none of the Bt varieties required insecticide applications for lepidopterous pests, but unlike 2007, more non-Bt cotton was treated for bollworm and/or beet armyworms in 2008 (41% of the fields received a single insecticide application).
Objective:
The objective of this study was to compare the qualitative value of Bollgard II, Widestrike and Bollgard insect control traits in grower fields relative to each other and to non-Bt cotton varieties.
Materials and Methods:
In 2007 and 2008, boll damage surveys were conducted to quantify bollworm damage in
67
late season Bt and non-Bt cotton varieties. Although the source of the damage is not certain, most of it is suspected to have come from cotton bollworms although beet armyworms were present in some fields in 2008. Two of the non-Bt were treated for a mixed population of bollworms and beet armyworms in Bailey County in 2008. The survey was conducted late season because Bt levels in mature/senescent cotton tends to deteriorate relative to rapidly growing plants. Thus, late season would represent the time period when Bt levels would be less intensely expressed and damage would be more likely to occur. Grower fields of non-Bt, Bollgard, Bollgard II and Widestrike cotton were sampled throughout the South Plains region of Texas (Table 1). Samples were taken after the last possible insecticide applications and before approximately 20% of the boll were open. Three distinct areas were sampled within each field, and 100 consecutive harvestable bolls were sampled from each location. Each field by variety type served as a replicate. Bolls were considered damaged if the carpal was breached through to the lint. The insecticide history in regard to insecticides targeting bollworms was recorded. All data were analyzed using PROC MIXED and the means were separated using an F protected LSD (P ≤ 0.10).
Results and Discussion:
In 2007, damage was very light across all of the field types. However, more damaged bolls where found in the non-Bt fields (3.11%) than in the Bollgard (0.52%) and Bollgard II (0.25%) fields, but did not differ from the Widestrike fields (1.29%) (Table 2). Damage in the Widestrike fields did not differ from the Bollgard and Bollgard II fields. The fact that Widestrike did not differ from the non-Bt fields does not appear to indicate a lack of efficacy, but probably indicates a lack of area wide bollworm pressure. Very few insecticide applications were made targeting bollworm in any of the 2007 survey fields and there were no significant differences among variety types. None of the Bt cotton fields were treated for bollworms, whereas 9% on the non-Bt field received a single insecticide application. Late season bollworm damage in 2008 was similar to 2007. All of the Bt cotton variety types had significantly fewer damaged bolls than the non-Bt varieties (Table 3). There were no differences in boll damage among the Bt types. Similar to 2007, none of the Bt varieties required insecticide applications for bollworms, but unlike 2007, more non-Bt cotton was treated for bollworms and/or beet armyworms in 2008 (41% of the fields received a single insecticide application). Based on these data, Bt cotton appears to continue to be highly effective in preventing boll damage by lepidopterous pests in the South Plains region of Texas.
Acknowledgments:
Appreciation is expressed to the Monsanto Company for financial support of this project.
Disclaimer Clause: Trade names of commercial products used in this report are included only for better
understanding and clarity. Reference to commercial products or trade names is made with the understanding that no discrimination is intended and no endorsement by the Texas A&M University System is implied. Readers should realize that results from one experiment do not represent conclusive evidence that the same response would occur
68
where conditions vary.
69

Table 1. Number of fields sampled by county and Bt trait in 2007-08. County Non-Bt Bollgard Bollgard II Widestrike
Year 2007 Bailey 0 3 1 0 Castro 4 0 3 0 Dawson 1 3 2 4 Floyd 3 0 4 0 Gaines 0 0 0 1 Hale 7 0 6 3 Hockley 3 2 2 2 Lubbock 1 5 2 1 Parmer 2 1 0 1 Terry 1 0 3 4 TOTAL 22 14 23 16
Year 2008 Bailey 5 0 5 0 Castro 6 0 6 1 Dawson 0 0 0 2 Gaines 4 0 3 10 Hale 3 0 2 1 Hockley 5 5 5 3 Lubbock 6 0 5 0 TOTAL 29 5 26 17
70
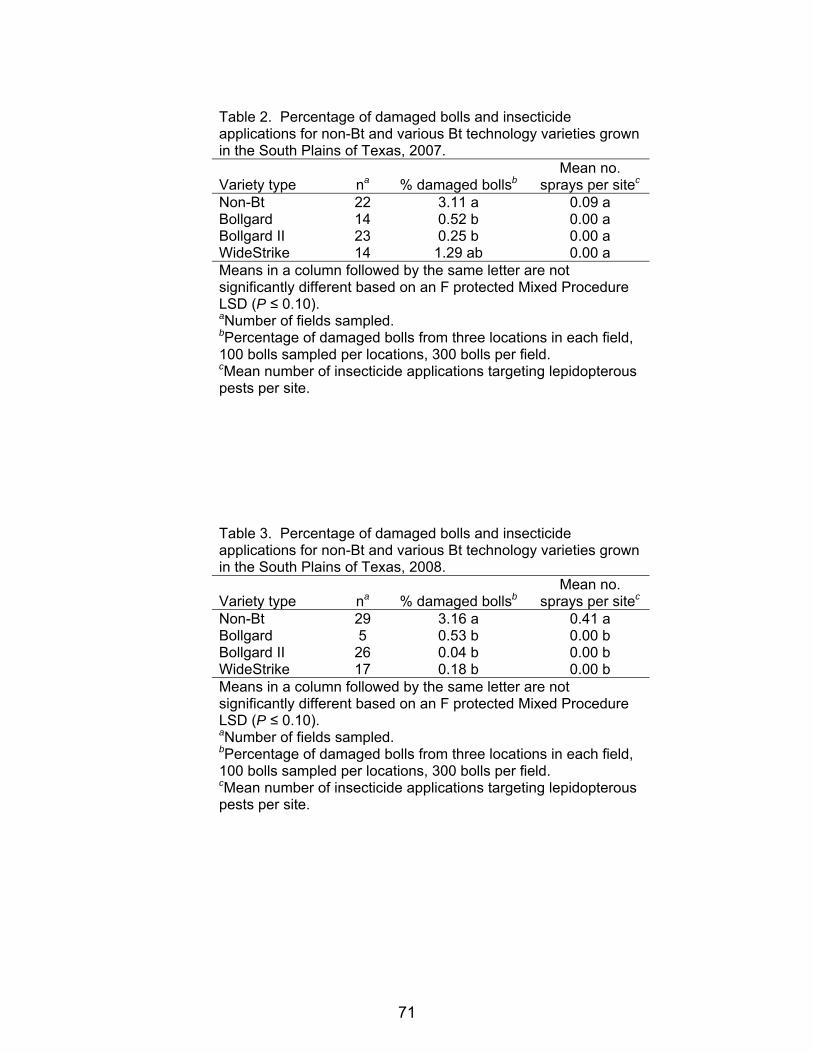
Table 2. Percentage of damaged bolls and insecticide applications for non-Bt and various Bt technology varieties grown in the South Plains of Texas, 2007.
Variety type na % damaged bollsb Mean no.
sprays per sitec Non-Bt 22 3.11 a 0.09 a Bollgard 14 0.52 b 0.00 a Bollgard II 23 0.25 b 0.00 a WideStrike 14 1.29 ab 0.00 a Means in a column followed by the same letter are not significantly different based on an F protected Mixed Procedure LSD (P ≤ 0.10). aNumber of fields sampled. bPercentage of damaged bolls from three locations in each field, 100 bolls sampled per locations, 300 bolls per field. cMean number of insecticide applications targeting lepidopterous pests per site.
Table 3. Percentage of damaged bolls and insecticide applications for non-Bt and various Bt technology varieties grown in the South Plains of Texas, 2008.
Variety type na % damaged bollsb Mean no.
sprays per sitec Non-Bt 29 3.16 a 0.41 a Bollgard 5 0.53 b 0.00 b Bollgard II 26 0.04 b 0.00 b WideStrike 17 0.18 b 0.00 b Means in a column followed by the same letter are not significantly different based on an F protected Mixed Procedure LSD (P ≤ 0.10). aNumber of fields sampled. bPercentage of damaged bolls from three locations in each field, 100 bolls sampled per locations, 300 bolls per field. cMean number of insecticide applications targeting lepidopterous pests per site.
71

Fusarium Wilt Trials Results from 2007 - 2008
Jason Woodward, Mitchell Ratliff, and Ira Yates Extension Plant Pathologist, Technician, Technician
Texas AgriLife Extension, Lubbock
Terry Wheeler, Evan Arnold, Victor Mendoza, Lindsi Clark, and Justin Carthal Professor, Technician, Technician, Technician, Technician
Texas AgriLife Research, Lubbock
Field trials were conducted in 2008 to evaluate commercially available cotton varieties in fields with a history of Fusarium wilt. A total of six trials were conducted; however, four were lost to the hot, dry, windy conditions experienced in early June. In addition, one of the remaining trials (Dawson County Trial) had to be replanted due to harsh environmental conditions. Disease pressure at this location was very low, and the results from the trial were somewhat inconsistent with what was observed in 2007. A preliminary ranking of varieties tested is listed in Table 5. Continued screening will take place during the 2009 growing season. If you have any questions pertaining to the selection of cotton varieties with regard to Fusarium wilt, please contact Jason Woodward via phone (806) 746‐4053, or e‐mail [email protected].
72
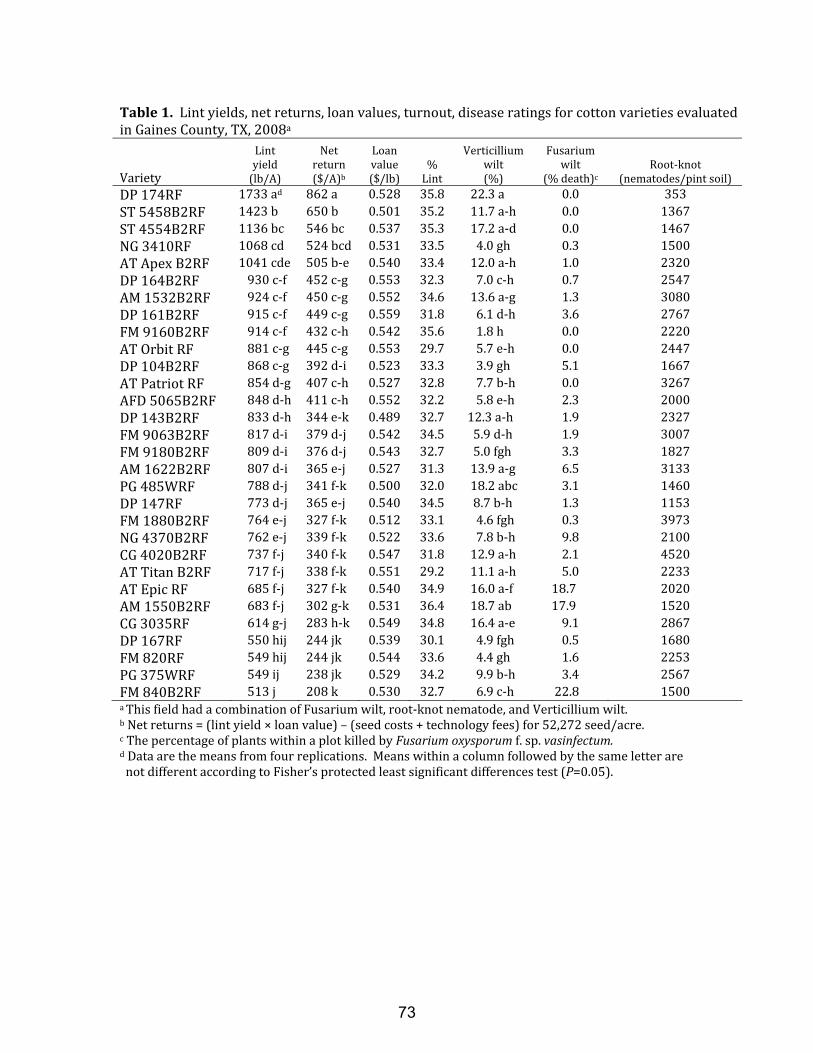
Table 1. Lint yields, net returns, loan values, turnout, disease ratings for cotton varieties evaluated in Gaines County, TX, 2008a Variety
Lint yield (lb/A)
Net return ($/A)b
Loan value ($/lb)
% Lint
Verticillium wilt (%)
Fusarium wilt
(% death)c
Root‐knot
(nematodes/pint soil) DP 174RF 1733 ad 862 a 0.528 35.8 22.3 a 0.0 353 ST 5458B2RF 1423 b 650 b 0.501 35.2 11.7 a‐h 0.0 1367 ST 4554B2RF 1136 bc 546 bc 0.537 35.3 17.2 a‐d 0.0 1467 NG 3410RF 1068 cd 524 bcd 0.531 33.5 4.0 gh 0.3 1500 AT Apex B2RF 1041 cde 505 b‐e 0.540 33.4 12.0 a‐h 1.0 2320 DP 164B2RF 930 c‐f 452 c‐g 0.553 32.3 7.0 c‐h 0.7 2547 AM 1532B2RF 924 c‐f 450 c‐g 0.552 34.6 13.6 a‐g 1.3 3080 DP 161B2RF 915 c‐f 449 c‐g 0.559 31.8 6.1 d‐h 3.6 2767 FM 9160B2RF 914 c‐f 432 c‐h 0.542 35.6 1.8 h 0.0 2220 AT Orbit RF 881 c‐g 445 c‐g 0.553 29.7 5.7 e‐h 0.0 2447 DP 104B2RF 868 c‐g 392 d‐i 0.523 33.3 3.9 gh 5.1 1667 AT Patriot RF 854 d‐g 407 c‐h 0.527 32.8 7.7 b‐h 0.0 3267 AFD 5065B2RF 848 d‐h 411 c‐h 0.552 32.2 5.8 e‐h 2.3 2000 DP 143B2RF 833 d‐h 344 e‐k 0.489 32.7 12.3 a‐h 1.9 2327 FM 9063B2RF 817 d‐i 379 d‐j 0.542 34.5 5.9 d‐h 1.9 3007 FM 9180B2RF 809 d‐i 376 d‐j 0.543 32.7 5.0 fgh 3.3 1827 AM 1622B2RF 807 d‐i 365 e‐j 0.527 31.3 13.9 a‐g 6.5 3133 PG 485WRF 788 d‐j 341 f‐k 0.500 32.0 18.2 abc 3.1 1460 DP 147RF 773 d‐j 365 e‐j 0.540 34.5 8.7 b‐h 1.3 1153 FM 1880B2RF 764 e‐j 327 f‐k 0.512 33.1 4.6 fgh 0.3 3973 NG 4370B2RF 762 e‐j 339 f‐k 0.522 33.6 7.8 b‐h 9.8 2100 CG 4020B2RF 737 f‐j 340 f‐k 0.547 31.8 12.9 a‐h 2.1 4520 AT Titan B2RF 717 f‐j 338 f‐k 0.551 29.2 11.1 a‐h 5.0 2233 AT Epic RF 685 f‐j 327 f‐k 0.540 34.9 16.0 a‐f 18.7 2020 AM 1550B2RF 683 f‐j 302 g‐k 0.531 36.4 18.7 ab 17.9 1520 CG 3035RF 614 g‐j 283 h‐k 0.549 34.8 16.4 a‐e 9.1 2867 DP 167RF 550 hij 244 jk 0.539 30.1 4.9 fgh 0.5 1680 FM 820RF 549 hij 244 jk 0.544 33.6 4.4 gh 1.6 2253 PG 375WRF 549 ij 238 jk 0.529 34.2 9.9 b‐h 3.4 2567 FM 840B2RF 513 j 208 k 0.530 32.7 6.9 c‐h 22.8 1500 a This field had a combination of Fusarium wilt, root‐knot nematode, and Verticillium wilt. b Net returns = (lint yield × loan value) – (seed costs + technology fees) for 52,272 seed/acre. c The percentage of plants within a plot killed by Fusarium oxysporum f. sp. vasinfectum. d Data are the means from four replications. Means within a column followed by the same letter are not different according to Fisher’s protected least significant differences test (P=0.05).
73
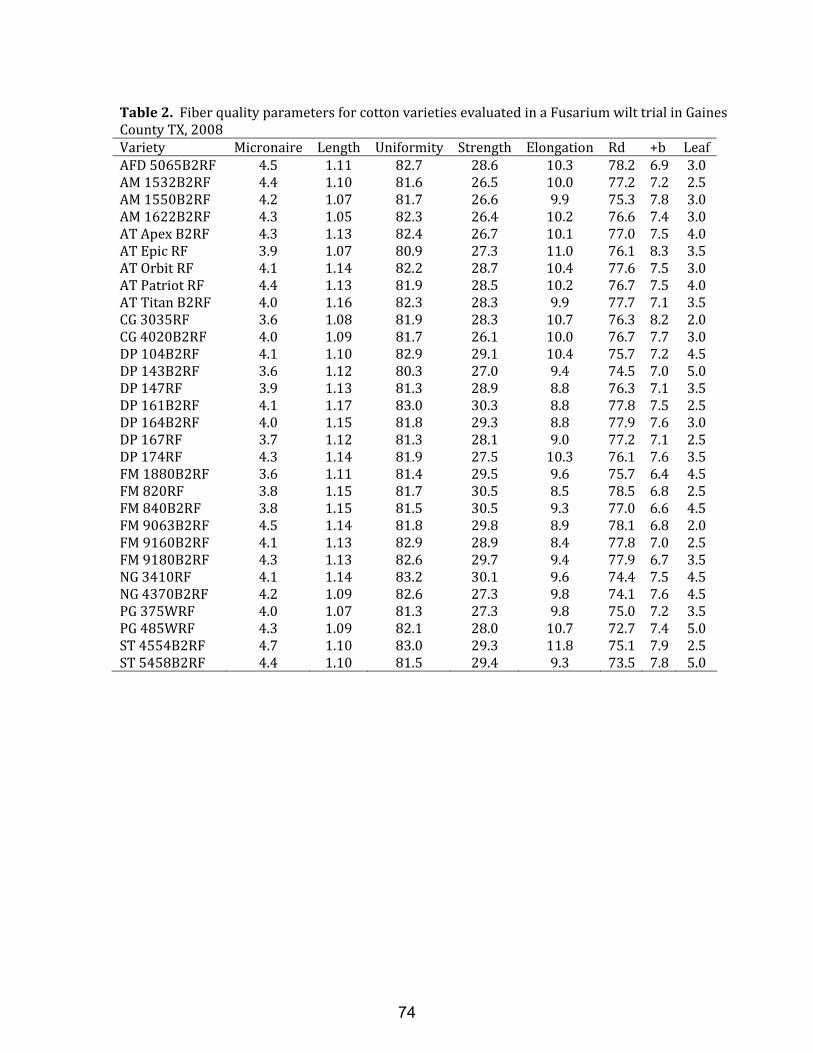
Table 2. Fiber quality parameters for cotton varieties evaluated in a Fusarium wilt trial in Gaines County TX, 2008 Variety Micronaire Length Uniformity Strength Elongation Rd +b LeafAFD 5065B2RF 4.5 1.11 82.7 28.6 10.3 78.2 6.9 3.0 AM 1532B2RF 4.4 1.10 81.6 26.5 10.0 77.2 7.2 2.5 AM 1550B2RF 4.2 1.07 81.7 26.6 9.9 75.3 7.8 3.0 AM 1622B2RF 4.3 1.05 82.3 26.4 10.2 76.6 7.4 3.0 AT Apex B2RF 4.3 1.13 82.4 26.7 10.1 77.0 7.5 4.0 AT Epic RF 3.9 1.07 80.9 27.3 11.0 76.1 8.3 3.5 AT Orbit RF 4.1 1.14 82.2 28.7 10.4 77.6 7.5 3.0 AT Patriot RF 4.4 1.13 81.9 28.5 10.2 76.7 7.5 4.0 AT Titan B2RF 4.0 1.16 82.3 28.3 9.9 77.7 7.1 3.5 CG 3035RF 3.6 1.08 81.9 28.3 10.7 76.3 8.2 2.0 CG 4020B2RF 4.0 1.09 81.7 26.1 10.0 76.7 7.7 3.0 DP 104B2RF 4.1 1.10 82.9 29.1 10.4 75.7 7.2 4.5 DP 143B2RF 3.6 1.12 80.3 27.0 9.4 74.5 7.0 5.0 DP 147RF 3.9 1.13 81.3 28.9 8.8 76.3 7.1 3.5 DP 161B2RF 4.1 1.17 83.0 30.3 8.8 77.8 7.5 2.5 DP 164B2RF 4.0 1.15 81.8 29.3 8.8 77.9 7.6 3.0 DP 167RF 3.7 1.12 81.3 28.1 9.0 77.2 7.1 2.5 DP 174RF 4.3 1.14 81.9 27.5 10.3 76.1 7.6 3.5 FM 1880B2RF 3.6 1.11 81.4 29.5 9.6 75.7 6.4 4.5 FM 820RF 3.8 1.15 81.7 30.5 8.5 78.5 6.8 2.5 FM 840B2RF 3.8 1.15 81.5 30.5 9.3 77.0 6.6 4.5 FM 9063B2RF 4.5 1.14 81.8 29.8 8.9 78.1 6.8 2.0 FM 9160B2RF 4.1 1.13 82.9 28.9 8.4 77.8 7.0 2.5 FM 9180B2RF 4.3 1.13 82.6 29.7 9.4 77.9 6.7 3.5 NG 3410RF 4.1 1.14 83.2 30.1 9.6 74.4 7.5 4.5 NG 4370B2RF 4.2 1.09 82.6 27.3 9.8 74.1 7.6 4.5 PG 375WRF 4.0 1.07 81.3 27.3 9.8 75.0 7.2 3.5 PG 485WRF 4.3 1.09 82.1 28.0 10.7 72.7 7.4 5.0 ST 4554B2RF 4.7 1.10 83.0 29.3 11.8 75.1 7.9 2.5 ST 5458B2RF 4.4 1.10 81.5 29.4 9.3 73.5 7.8 5.0
74
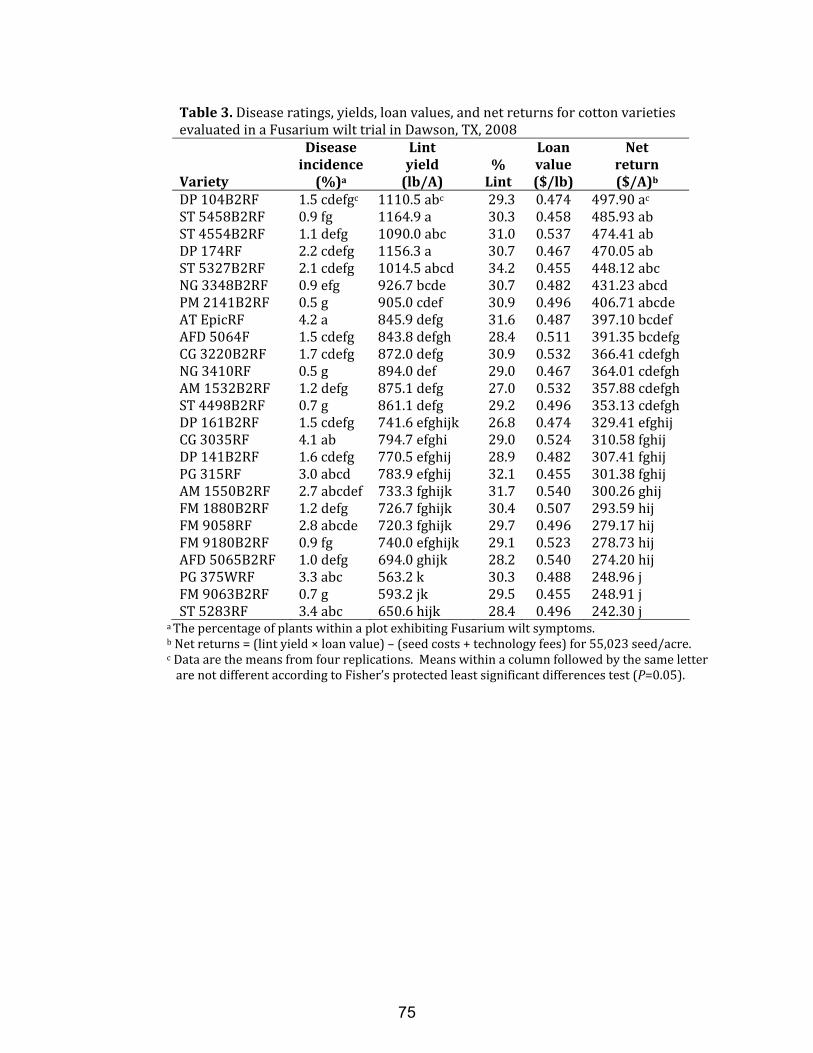
Table 3. Disease ratings, yields, loan values, and net returns for cotton varieties evaluated in a Fusarium wilt trial in Dawson, TX, 2008
Variety
Disease incidence (%)a
Lint yield (lb/A)
% Lint
Loan value ($/lb)
Net return ($/A)b
DP 104B2RF 1.5 cdefgc 1110.5 abc 29.3 0.474 497.90 ac ST 5458B2RF 0.9 fg 1164.9 a 30.3 0.458 485.93 ab ST 4554B2RF 1.1 defg 1090.0 abc 31.0 0.537 474.41 ab DP 174RF 2.2 cdefg 1156.3 a 30.7 0.467 470.05 ab ST 5327B2RF 2.1 cdefg 1014.5 abcd 34.2 0.455 448.12 abc NG 3348B2RF 0.9 efg 926.7 bcde 30.7 0.482 431.23 abcd PM 2141B2RF 0.5 g 905.0 cdef 30.9 0.496 406.71 abcde AT EpicRF 4.2 a 845.9 defg 31.6 0.487 397.10 bcdef AFD 5064F 1.5 cdefg 843.8 defgh 28.4 0.511 391.35 bcdefg CG 3220B2RF 1.7 cdefg 872.0 defg 30.9 0.532 366.41 cdefgh NG 3410RF 0.5 g 894.0 def 29.0 0.467 364.01 cdefgh AM 1532B2RF 1.2 defg 875.1 defg 27.0 0.532 357.88 cdefgh ST 4498B2RF 0.7 g 861.1 defg 29.2 0.496 353.13 cdefgh DP 161B2RF 1.5 cdefg 741.6 efghijk 26.8 0.474 329.41 efghij CG 3035RF 4.1 ab 794.7 efghi 29.0 0.524 310.58 fghij DP 141B2RF 1.6 cdefg 770.5 efghij 28.9 0.482 307.41 fghij PG 315RF 3.0 abcd 783.9 efghij 32.1 0.455 301.38 fghij AM 1550B2RF 2.7 abcdef 733.3 fghijk 31.7 0.540 300.26 ghij FM 1880B2RF 1.2 defg 726.7 fghijk 30.4 0.507 293.59 hij FM 9058RF 2.8 abcde 720.3 fghijk 29.7 0.496 279.17 hij FM 9180B2RF 0.9 fg 740.0 efghijk 29.1 0.523 278.73 hij AFD 5065B2RF 1.0 defg 694.0 ghijk 28.2 0.540 274.20 hij PG 375WRF 3.3 abc 563.2 k 30.3 0.488 248.96 j FM 9063B2RF 0.7 g 593.2 jk 29.5 0.455 248.91 j ST 5283RF 3.4 abc 650.6 hijk 28.4 0.496 242.30 j
a The percentage of plants within a plot exhibiting Fusarium wilt symptoms. b Net returns = (lint yield × loan value) – (seed costs + technology fees) for 55,023 seed/acre. c Data are the means from four replications. Means within a column followed by the same letter are not different according to Fisher’s protected least significant differences test (P=0.05).
75

Table 4. Fiber quality parameters for cotton varieties evaluated in a Fusarium wilt trial in Dawson, TX, 2008 Variety Micronaire Length Uniformity Strength Elongation Leaf Rd +b AFD 5064F 3.55 1.08 80.3 28.5 10.2 2.5 81.7 7.95AFD 5065B2RF 3.40 1.10 79.6 28.9 10.8 2.0 83.0 7.65AM 1532B2RF 2.90 1.11 79.3 25.6 9.9 1.0 83.3 8.45AM 1550B2RF 3.05 1.07 79.3 26.2 10.2 1.0 81.8 8.90AT EpicRF 3.20 1.07 79.9 26.4 10.9 1.0 82.7 8.80CG 3035RF 3.05 1.07 79.4 26.6 10.6 1.5 82.4 8.85CG 3220B2RF 3.10 1.09 79.2 26.0 10.4 1.5 82.5 8.65DP 104B2RF 3.25 1.12 82.0 28.5 11.1 2.5 81.9 8.10DP 141B2RF 2.75 1.10 78.9 28.0 9.6 2.0 82.1 8.30DP 161B2RF 3.55 1.10 78.3 26.4 9.5 1.0 83.4 8.05DP 164B2RF 3.00 1.09 77.0 26.5 9.2 1.5 82.9 8.40DP 174RF 2.80 1.13 80.4 26.9 10.5 2.5 82.3 7.70FM 1880B2RF 2.95 1.10 79.0 28.8 9.4 1.0 83.8 8.15FM 9058RF 3.25 1.12 78.1 27.4 8.6 2.0 82.1 7.70FM 9063B2RF 3.25 1.13 80.1 29.3 9.4 1.0 84.3 7.65FM 9180B2RF 3.15 1.12 81.0 29.0 10.0 1.0 84.6 7.40NG 3348B2RF 3.55 1.12 81.6 28.7 10.1 2.0 81.5 8.55NG 3410RF 3.10 1.16 81.0 28.5 9.7 1.5 81.1 7.90PG 315RF 3.20 1.03 78.4 25.5 9.4 1.5 81.4 8.90PG 375WRF 3.35 1.03 78.3 25.3 9.7 1.5 82.0 8.45PM 2141B2RF 3.50 1.10 80.4 27.5 10.0 4.0 78.4 7.40ST 4498B2RF 3.00 1.11 81.5 28.7 11.7 1.5 82.2 8.70ST 4554B2RF 3.15 1.10 80.5 28.7 11.5 2.0 81.2 9.15ST 5283RF 3.00 1.06 79.5 27.8 10.2 2.0 81.5 8.95ST 5327B2RF 3.00 1.08 79.9 27.5 10.1 2.5 80.8 8.50ST 5458B2RF 3.30 1.10 79.6 27.7 9.9 2.5 80.9 8.65
76

Table 5. Ranking (by yield and net value) of cotton varieties tested in Fusarium wilt trials from 2007 and 2008*
Variety Number of trials
Rank by yield
Rank by net value
AFD 5064F 3 10 10 AFD 5065B2RF 4 20 19 All‐Tex Apex B2RF 3 11 13 All‐Tex Arid B2RF 2 29 29 All‐Tex EpicRF 2 19 18 All‐Tex Titan B2RF 3 17 16 AM 1532B2RF 2 9 9 AM 1550B2RF 2 28 28 Americot 1622B2RF 3 18 17 Americot 2220RF 2 30 30 CG 3035RF 2 25 25 Deltapine 104B2RF 2 4 4 Deltapine 143B2RF 3 5 5 Deltapine 147RF 3 24 24 Deltapine 161B2RF 2 12 11 Deltapine 164B2RF 3 3 3 Deltapine 167RF 3 23 22 Deltapine 174RF 4 1 1 Fibermax 1740B2F 2 33 33 Fibermax 1840B2F 2 7 7 Fibermax 1880B2RF 4 15 15 Fibermax 9058RF 2 31 31 Fibermax 9063B2RF 4 21 20 Fibermax 9068F 2 14 14 Fibermax 9180B2RF 3 22 21 NexGen 3410RF 2 8 8 Phytogen 375WRF 2 32 32 Phytogen 485WRF 3 27 27 Stoneville 4554B2RF 4 6 6 Stoneville 5327B2F 2 16 23 Stoneville 5458B2RF 2 2 2 Stoneville 6611B2F 2 26 26 Stoneville 6622F 2 13 12
* Varieties in bold have performed consistently well across years and/or locations.
77
Verticillium Wilt Trials Results from 2007 - 2008
Terry Wheeler, Evan Arnold, Victor Mendoza, Lindsi Clark, and Justin Carthal Professor, Technician, Technician, Technician, Technician
Texas AgriLife Research, Lubbock
Jason Woodward Extension Plant Pathologist
Texas AgriLife Extension, Lubbock Small plot trials were conducted near Floydada, Ropesville, Slaton, Lamesa, Seminole, and Garden City. Plot size was 35 ft. long and two-rows wide, with 32 varieties at a site, replicated four times. The first Table provides an average of how a variety performed in all the sites that it was tested from 2007 – 2008. There are 10 sites between the two years and a variety had to be present in at least two sites to be included in Table 1.
78
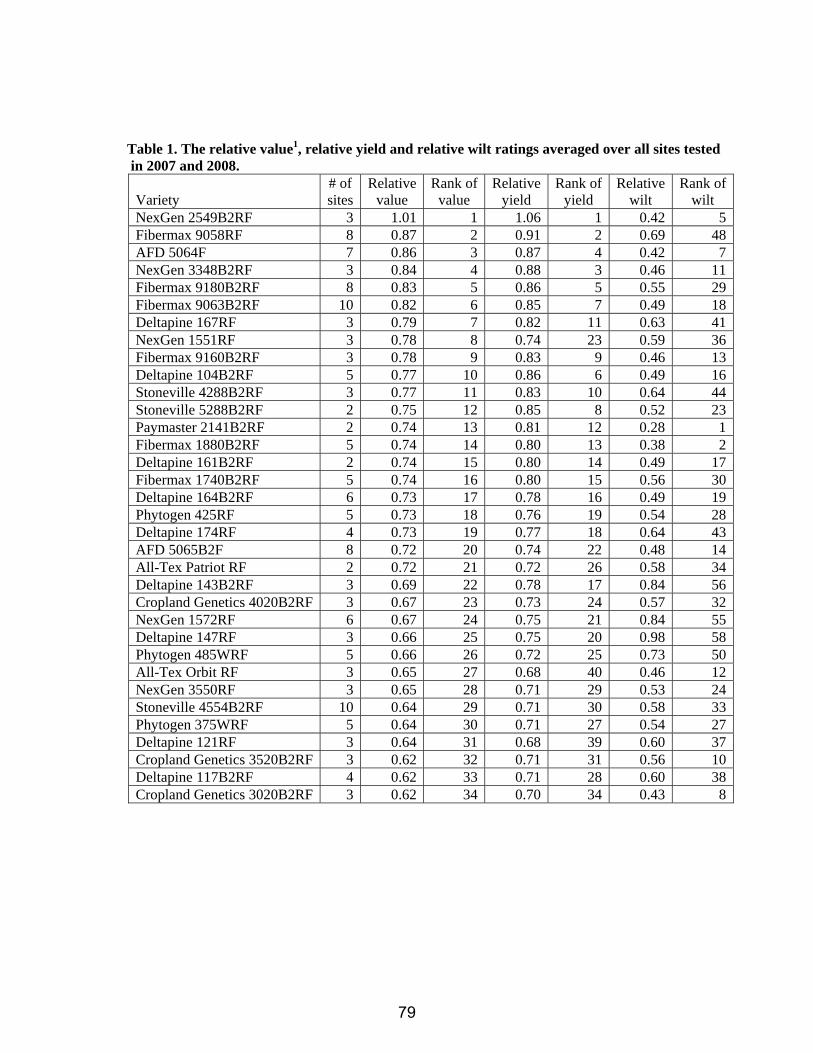
Table 1. The relative value1, relative yield and relative wilt ratings averaged over all sites tested in 2007 and 2008.
Variety
# of sites
Relative value
Rank of value
Relative yield
Rank of yield
Relative wilt
Rank of wilt
NexGen 2549B2RF 3 1.01 1 1.06 1 0.42 5Fibermax 9058RF 8 0.87 2 0.91 2 0.69 48AFD 5064F 7 0.86 3 0.87 4 0.42 7NexGen 3348B2RF 3 0.84 4 0.88 3 0.46 11Fibermax 9180B2RF 8 0.83 5 0.86 5 0.55 29Fibermax 9063B2RF 10 0.82 6 0.85 7 0.49 18Deltapine 167RF 3 0.79 7 0.82 11 0.63 41NexGen 1551RF 3 0.78 8 0.74 23 0.59 36Fibermax 9160B2RF 3 0.78 9 0.83 9 0.46 13Deltapine 104B2RF 5 0.77 10 0.86 6 0.49 16Stoneville 4288B2RF 3 0.77 11 0.83 10 0.64 44Stoneville 5288B2RF 2 0.75 12 0.85 8 0.52 23Paymaster 2141B2RF 2 0.74 13 0.81 12 0.28 1Fibermax 1880B2RF 5 0.74 14 0.80 13 0.38 2Deltapine 161B2RF 2 0.74 15 0.80 14 0.49 17Fibermax 1740B2RF 5 0.74 16 0.80 15 0.56 30Deltapine 164B2RF 6 0.73 17 0.78 16 0.49 19Phytogen 425RF 5 0.73 18 0.76 19 0.54 28Deltapine 174RF 4 0.73 19 0.77 18 0.64 43AFD 5065B2F 8 0.72 20 0.74 22 0.48 14All-Tex Patriot RF 2 0.72 21 0.72 26 0.58 34Deltapine 143B2RF 3 0.69 22 0.78 17 0.84 56Cropland Genetics 4020B2RF 3 0.67 23 0.73 24 0.57 32NexGen 1572RF 6 0.67 24 0.75 21 0.84 55Deltapine 147RF 3 0.66 25 0.75 20 0.98 58Phytogen 485WRF 5 0.66 26 0.72 25 0.73 50All-Tex Orbit RF 3 0.65 27 0.68 40 0.46 12NexGen 3550RF 3 0.65 28 0.71 29 0.53 24Stoneville 4554B2RF 10 0.64 29 0.71 30 0.58 33Phytogen 375WRF 5 0.64 30 0.71 27 0.54 27Deltapine 121RF 3 0.64 31 0.68 39 0.60 37Cropland Genetics 3520B2RF 3 0.62 32 0.71 31 0.56 10Deltapine 117B2RF 4 0.62 33 0.71 28 0.60 38Cropland Genetics 3020B2RF 3 0.62 34 0.70 34 0.43 8
79

Table 1. cont.
Variety
# of sites
Relative value
Rank of value
Relative yield
Rank of yield
Relative wilt
Rank of wilt
Stoneville 5283RF 6 0.62 35 0.67 41 0.75 51Phytogen 315RF 3 0.61 36 0.69 36 0.39 3Stoneville 5327B2RF 6 0.61 37 0.69 37 0.64 45Deltapine 141B2RF 2 0.61 38 0.70 33 0.82 53Americot 1532B2RF 2 0.61 39 0.66 43 0.44 9NexGen 3273B2RF 4 0.61 40 0.69 38 0.54 26Stoneville 5458B2RF 2 0.60 41 0.69 35 0.48 15Stoneville 4498B2RF 3 0.59 42 0.70 32 0.52 22Americot 1662B2RF 5 0.58 43 0.65 45 0.51 20All-Tex Apex B2RF 5 0.58 44 0.64 46 0.62 39NexGen 4377B2RF 4 0.58 45 0.67 42 0.56 31All-Tex Arid B2RF 4 0.58 46 0.65 44 0.62 40NexGen 3538RF 3 0.57 47 0.60 52 0.69 47NexGen 1556RF 3 0.56 48 0.58 55 0.54 25All-Tex Titan B2RF 3 0.56 49 0.63 48 0.58 35Americot 1664B2RF 4 0.54 50 0.63 49 0.42 6Stoneville 4427B2RF 5 0.54 51 0.64 47 0.42 4NexGen 4370B2RF 3 0.53 52 0.62 50 0.51 21NexGen 3331B2RF 3 0.52 53 0.61 51 0.65 46Americot 1504B2RF 3 0.49 54 0.59 53 0.63 42Americot 1550B2RF 2 0.48 55 0.58 54 0.83 54Cropland Genetics 3220B2RF 2 0.47 56 0.57 57 0.72 49Cropland Genetics 3035RF 3 0.47 57 0.57 56 0.87 57All-Tex Epic RF 2 0.46 58 0.54 58 0.76 52
1Value is calculated as the yield (lbs of lint/acre) x loan value ($/lb) – (seed + technology fees [$/acre]). Relative value is the value of a variety at a site divided by the highest average value for a variety at that site. Relative yield is the yield at a site divided by the highest average yield that occurred at that site. Relative wilt is the wilt incidence at a site divided by the highest average wilt rating that occurred at that site.
80
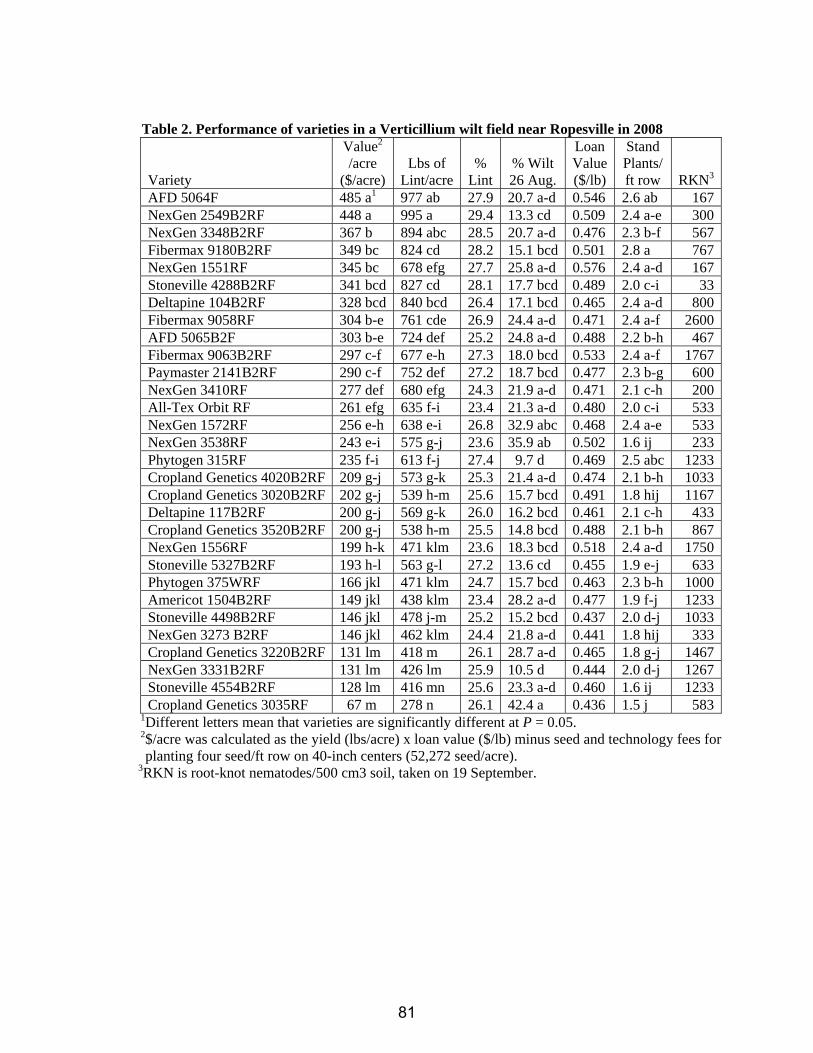
Table 2. Performance of varieties in a Verticillium wilt field near Ropesville in 2008
Variety
Value2 /acre
($/acre)
Lbs of
Lint/acre
%
Lint
% Wilt 26 Aug.
Loan Value ($/lb)
Stand Plants/ ft row
RKN3
AFD 5064F 485 a1 977 ab 27.9 20.7 a-d 0.546 2.6 ab 167NexGen 2549B2RF 448 a 995 a 29.4 13.3 cd 0.509 2.4 a-e 300NexGen 3348B2RF 367 b 894 abc 28.5 20.7 a-d 0.476 2.3 b-f 567Fibermax 9180B2RF 349 bc 824 cd 28.2 15.1 bcd 0.501 2.8 a 767NexGen 1551RF 345 bc 678 efg 27.7 25.8 a-d 0.576 2.4 a-d 167Stoneville 4288B2RF 341 bcd 827 cd 28.1 17.7 bcd 0.489 2.0 c-i 33Deltapine 104B2RF 328 bcd 840 bcd 26.4 17.1 bcd 0.465 2.4 a-d 800Fibermax 9058RF 304 b-e 761 cde 26.9 24.4 a-d 0.471 2.4 a-f 2600AFD 5065B2F 303 b-e 724 def 25.2 24.8 a-d 0.488 2.2 b-h 467Fibermax 9063B2RF 297 c-f 677 e-h 27.3 18.0 bcd 0.533 2.4 a-f 1767Paymaster 2141B2RF 290 c-f 752 def 27.2 18.7 bcd 0.477 2.3 b-g 600NexGen 3410RF 277 def 680 efg 24.3 21.9 a-d 0.471 2.1 c-h 200All-Tex Orbit RF 261 efg 635 f-i 23.4 21.3 a-d 0.480 2.0 c-i 533NexGen 1572RF 256 e-h 638 e-i 26.8 32.9 abc 0.468 2.4 a-e 533NexGen 3538RF 243 e-i 575 g-j 23.6 35.9 ab 0.502 1.6 ij 233Phytogen 315RF 235 f-i 613 f-j 27.4 9.7 d 0.469 2.5 abc 1233Cropland Genetics 4020B2RF 209 g-j 573 g-k 25.3 21.4 a-d 0.474 2.1 b-h 1033Cropland Genetics 3020B2RF 202 g-j 539 h-m 25.6 15.7 bcd 0.491 1.8 hij 1167Deltapine 117B2RF 200 g-j 569 g-k 26.0 16.2 bcd 0.461 2.1 c-h 433Cropland Genetics 3520B2RF 200 g-j 538 h-m 25.5 14.8 bcd 0.488 2.1 b-h 867NexGen 1556RF 199 h-k 471 klm 23.6 18.3 bcd 0.518 2.4 a-d 1750Stoneville 5327B2RF 193 h-l 563 g-l 27.2 13.6 cd 0.455 1.9 e-j 633Phytogen 375WRF 166 jkl 471 klm 24.7 15.7 bcd 0.463 2.3 b-h 1000Americot 1504B2RF 149 jkl 438 klm 23.4 28.2 a-d 0.477 1.9 f-j 1233Stoneville 4498B2RF 146 jkl 478 j-m 25.2 15.2 bcd 0.437 2.0 d-j 1033NexGen 3273 B2RF 146 jkl 462 klm 24.4 21.8 a-d 0.441 1.8 hij 333Cropland Genetics 3220B2RF 131 lm 418 m 26.1 28.7 a-d 0.465 1.8 g-j 1467NexGen 3331B2RF 131 lm 426 lm 25.9 10.5 d 0.444 2.0 d-j 1267Stoneville 4554B2RF 128 lm 416 mn 25.6 23.3 a-d 0.460 1.6 ij 1233Cropland Genetics 3035RF 67 m 278 n 26.1 42.4 a 0.436 1.5 j 583
1Different letters mean that varieties are significantly different at P = 0.05. 2$/acre was calculated as the yield (lbs/acre) x loan value ($/lb) minus seed and technology fees for planting four seed/ft row on 40-inch centers (52,272 seed/acre). 3RKN is root-knot nematodes/500 cm3 soil, taken on 19 September.
81

Table 3. Fiber ratings for varieties in a Verticillium wilt field near Ropesville in 2008 Variety Micronaire Length Uniformity Strength Elongation Leaf Rd +b AFD 5064F 3.80 1.09 80.9 29.6 11.4 3.5 80.2 7.6AFD 5065B2F 2.85 1.13 79.8 29.9 11.3 2.0 81.9 7.1Americot 1504B2F 2.45 1.15 79.8 28.1 10.9 1.5 82.1 7.6All-Tex Orbit RF 2.55 1.16 80.0 29.2 11.0 2.5 80.8 8.8Cropland Genetics 3020B2RF
2.80 1.10 80.2 26.3 10.9 1.5 81.7 8.0
Cropland Genetics 3035RF
2.50 1.06 78.1 27.1 10.8 3.0 79.5 9.0
Cropland Genetics 3220B2RF
2.50 1.11 78.3 26.3 10.6 2.0 81.6 8.1
Cropland Genetics 3520B2RF
2.65 1.11 79.0 26.8 11.3 2.0 82.0 8.0
Cropland Genetics 4020B2RF
2.70 1.12 77.8 26.5 10.4 2.5 81.8 8.1
Deltapine 104B2RF 2.60 1.12 80.4 29.2 11.2 3.0 80.8 7.8Deltapine 117B2RF 2.60 1.13 79.5 29.4 9.8 4.0 77.7 7.9Fibermax 9058RF 2.90 1.20 80.5 29.6 9.5 4.0 81.2 7.5Fibermax 9063B3RF 3.20 1.20 81.9 31.5 9.7 1.5 83.6 7.2Fibermax 9180B2RF 2.80 1.17 81.0 31.8 9.9 3.0 71.8 7.5NexGen 1551RF 3.80 1.11 81.3 31.0 10.4 1.5 79.1 8.4NexGen 1556RF 3.00 1.13 81.9 32.0 10.3 2.5 79.1 7.9NexGen 1572RF 2.55 1.12 80.2 27.9 10.4 3.5 79.8 7.4NexGen 2549B2RF 3.15 1.07 82.4 29.7 11.3 3.0 79.8 8.0NexGen 3273B2RF 2.55 1.08 78.5 25.3 10.6 2.0 81.5 8.0NexGen 3331B2RF 2.45 1.10 79.3 27.9 10.0 4.0 78.7 8.3NexGen 3348B2RF 2.75 1.15 81.9 30.8 10.7 4.0 79.8 8.1NexGen 3410RF 2.60 1.18 79.7 29.3 9.8 3.0 79.8 8.2NexGen 3538RF 2.65 1.14 80.0 29.8 9.9 1.5 80.6 8.0Phytogen 315RF 2.55 1.10 77.9 28.7 9.9 3.0 81.3 8.1Phytogen 375WRF 2.40 1.11 78.8 27.2 9.9 2.5 81.6 7.9Paymaster 2141B2RF 2.85 1.12 81.2 28.9 10.5 3.5 79.2 7.0Stoneville 4288B2RF 2.70 1.13 79.2 29.2 10.7 1.5 81.5 8.4Stoneville 4498B2RF 2.35 1.09 79.7 27.4 11.2 4.0 80.5 8.3Stoneville 4554B2RF 2.50 1.10 79.0 28.7 11.7 3.0 80.3 8.7Stoneville 5327B2RF 2.40 1.09 79.1 28.5 10.8 2.5 80.0 8.8
82

Table 4. Performance of varieties in a Verticillium wilt field near Garden City in 2008
Variety
Lbs of Lint/a
Value /acre ($)2
% Lint
Loan Value ($/lb)
% Wilt 13 Aug.
Stand Plants /ft row
Fibermax 9160B2RF 1,917 ab 947 ab 28.4 0.527 24.0 h 2.5 a-d Fibermax 1740B2RF 1,763 cd 896 bc 30.7 0.542 48.1 a-e 3.0 ab Fibermax 9180B2RF 1,796 bc 894 bc 27.5 0.533 44.2 a-h 2.7 a-d Deltapine 164B2RF 1,731 cde 883 bcd 29.4 0.545 36.7 c-h 2.6 a-d Deltapine 161B2RF 1,715 cde 842 cde 29.4 0.527 36.1 c-h 2.7 a-d Cropland Genetics 4020B2RF 1,600 ef 822 c-f 28.3 0.553 45.1 a-g 2.8 a-d AFD 5065B2RF 1,589 ef 792 d-g 26.3 0.535 42.6 b-h 3.0 ab Fibermax 1880B2RF 1,661 c-f 789 efg 28.3 0.514 26.4 fgh 2.9 abc Fibermax 9063B2RF 1,625 def 788 e-h 25.1 0.524 40.9 b-h 3.1 a Deltapine 141B2RF 1,642 def 784 e-h 26.4 0.515 41.7 b-h 2.3 a-d NexGen 3348B2RF 1,540 fg 783 e-h 28.7 0.547 25.8 gh 2.2 bcdPhytogen 375WRF 1,598 ef 781 e-i 30.7 0.521 36.6 c-h 2.4 a-d Deltapine 174RF 1,555 fg 755 e-j 28.9 0.542 46.7 a-f 2.3 a-d Deltapine 143B2RF 1,645 c-f 745 f-k 29.7 0.491 60.2 ab 2.1 cd Fibermax 840B2RF 1,589 ef 745 f-k 29.3 0.509 32.4 d-h 2.5 a-d Deltapine 104B2RF 1,555 fg 745 f-k 27.8 0.519 34.0 c-h 2.6 a-d All-Tex Orbit RF 1,408 ghi 730 f-l 24.0 0.549 29.5 e-h 2.5 a-d Americot 1532B2RF 1,433 ghi 725 h-l 28.6 0.549 35.7 c-h 2.4 a-d Fibermax 820RF 1,545 fg 722 g-l 29.0 0.503 40.3 b-h 2.1 cd Phytogen 485WRF 1,514 fgh 712 h-m 26.2 0.505 43.3 b-h 2.6 a-d All-Tex Patriot RF 1,369 hij 702 g-n 25.2 0.542 38.0 c-h 2.3 a-d Stoneville 4554B2RF 1,423 ghi 695 h-n 28.7 0.532 39.1 c-h 2.0 d Deltapine 147RF 1,540 fg 687 i-n 26.2 0.479 60.5 ab 2.2 bcdAmericot 1622B2RF 1,375 hij 668 j-o 27.3 0.530 49.8 a-e 2.7 a-d Stoneville 5458B2RF 1,430 ghi 654 k-n 28.3 0.502 41.2 b-h 2.4 a-d NexGen 3273B2RF 1,365 hij 648 l-o 26.3 0.519 40.8 b-h 2.1 cd NexGen 4377B2RF 1,338 ij 624 mno 27.7 0.510 36.2 c-h 2.3 a-d All-Tex Titan B2RF 1,298 ij 618 no 25.8 0.520 46.0 a-g 2.7 a-d All-Tex Epic RF 1,252 j 609 no 28.3 0.522 53.2 abc 2.4 a-d Americot 1550B2RF 1,256 j 582 o 29.6 0.512 64.4 a 2.4 a-d
1Different letters mean that varieties are significantly different at P = 0.05. 2$/acre was calculated as the yield (lbs/acre) x loan value ($/lb) minus seed and technology fees for planting four seed/ft row on 40-inch centers (52,272 seed/acre).
83

Table 5. Fiber ratings for varieties in a Verticillium wilt field near Garden City in 2008 Variety Micronaire Length Uniformity Strength Elongation Rd +b LeafAFD 5065B2F 3.4 1.13 79.6 28.4 10.7 75.8 8.3 1.0 Americot 1532B2RF 3.5 1.15 80.8 27.5 9.6 78.1 7.8 1.5 Americot 1550B2RF 3.2 1.10 79.3 27.4 9.8 77.2 7.7 3.0 Americot 1622B2RF 3.2 1.11 80.6 26.6 10.1 78.0 8.0 1.5 All-Tex Epic RF 3.4 1.09 79.5 27.5 10.5 76.0 9.0 2.0 All-Tex Orbit RF 3.5 1.17 82.0 28.2 11.0 76.6 8.6 1.5 All-Tex Patriot RF 3.6 1.16 81.0 28.8 10.6 75.7 8.2 2.0 All-Tex Titan B2RF 3.5 1.17 80.9 28.5 10.1 76.8 7.3 1.5 Cropland Genetics 4020B2RF
3.5 1.13 80.1 26.8 10.2 78.6 7.6 2.0
Deltapine 104B2RF 3.4 1.12 80.7 28.8 10.6 75.0 8.4 2.5 Deltapine 141B2RF 3.0 1.15 78.8 28.4 9.6 76.8 8.1 3.0 Deltapine 143B2RF 3.0 1.15 78.6 27.8 9.0 77.0 8.2 3.0 Deltapine 147RF 3.0 1.15 79.1 28.5 8.4 76.0 8.6 2.5 Deltapine 161B2RF 3.2 1.18 80.1 29.3 9.3 77.8 8.3 2.5 Deltapine 164B2RF 3.3 1.17 80.1 29.8 9.0 78.0 7.8 1.5 Deltapine 174RF 3.5 1.16 80.0 27.9 9.7 75.7 7.9 3.0 Fibermax 1740B2RF 3.5 1.14 80.7 29.3 9.2 78.6 7.3 2.0 Fibermax 1880B2RF 3.2 1.14 79.7 29.8 9.4 78.8 7.4 3.0 Fibermax 820RF 3.1 1.19 80.1 30.6 8.9 76.4 7.5 2.5 Fibermax 840B2RF 3.3 1.19 80.8 31.0 9.5 77.9 6.8 3.5 Fibermax 9063B2RF 3.2 1.19 81.1 31.6 9.0 77.3 7.8 2.0 Fibermax 9180B2RF 3.4 1.17 81.8 30.9 9.2 76.9 7.8 2.0 Fibermax 9160B2RF 3.0 1.15 80.2 30.0 8.4 77.9 7.9 2.5 NexGen 3273B2RF 3.4 1.13 80.6 26.9 10.3 79.7 6.8 2.5 NexGen 3348B2RF 3.5 1.14 81.6 30.1 9.6 75.6 8.4 3.5 NexGen 4377B2RF 3.4 1.10 81.2 28.0 10.5 74.7 7.8 3.5 Phytogen 375WRF 3.3 1.12 80.2 28.0 9.5 77.3 7.6 2.5 Phytogen 485WRF 3.7 1.15 82.8 29.5 11.0 74.2 7.3 4.5 Stoneville 4554B2RF 3.2 1.13 80.1 29.6 11.5 76.1 8.5 3.0 Stoneville 5458B2RF 3.2 1.10 78.0 28.2 9.3 75.8 8.5 2.5
84

Table 6. Performance of varieties in a Verticillium wilt field in Lynn County in 2008 Variety
Lbs of Lint/a
$/Acre2
Loan Value ($/lb)
% Lint
% Wilt on 29 Aug.
Stand Plants/ ft. row
AFD 5064F 943 ab 466 a 0.546 26.2 13.6 d-h 2.9 a-e Stoneville 5288B2RF 989 a 417 ab 0.487 28.1 11.7 fgh 2.7 c-g Phytogen 425RF 866 a-e 415 abc 0.540 26.6 17.7 c-h 3.1 ab Deltapine 104B2RF 935 ab 404 a-d 0.498 27.2 20.2 b-f 3.1 a Fibermax 1740B2RF 899 abc 398 a-e 0.513 29.0 20.2 b-f 3.0 abcFibermax 9058RF 906 ab 397 a-e 0.499 27.4 24.5 bc 2.9 a-f Fibermax 1880B2RF 825 a-f 375 b-f 0.531 25.4 12.3 e-h 2.7 a-f Fibermax 9180B2RF 848 a-f 363 b-g 0.503 26.6 14.6 d-h 2.9 a-d Fibermax 9063B2RF 787 b-g 356 b-h 0.532 26.8 20.5 b-f 2.9 a-d Stoneville 4554B2RF 776 b-g 353 b-h 0.536 26.1 17.6 c-h 2.1 jk Stoneville 4288B2RF 830 a-f 348 b-i 0.504 27.7 14.3 d-h 2.8 a-f NexGen 1572B2RF 891 a-d 343 b-i 0.433 30.5 37.4 a 2.5 d-i NexGen 1551RF 712 e-i 338 c-i 0.538 25.2 21.9 bcd 2.5 d-i Fibermax 9160B2RF 807 b-g 332 d-i 0.491 28.5 11.8 fgh 2.6 d-i Stoneville 4498B2RF 776 b-g 326 d-j 0.502 26.8 21.1 b-e 2.8 a-f Cropland Genetics 3520B2RF 772 b-g 326 d-j 0.503 26.0 12.6 e-h 2.9 a-e NexGen 4377B2RF 780 b-g 318 f-k 0.482 25.3 19.7 b-g 2.5 f-j Stoneville 5283RF 735 c-h 314 f-l 0.502 27.4 19.7 b-g 2.5 e-i Phytogen 375WRF 733 c-h 309 f-l 0.493 27.2 16.4 c-h 2.6 c-g Cropland Genetics 3020B2RF 729 d-h 298 f-m 0.495 24.3 13.0 d-h 2.3 g-j Stoneville 5327B2RF 717 e-i 292 g-m 0.496 27.6 24.6 bc 2.2 ijk NexGen 4370B2RF 690 f-i 292 g-m 0.508 23.3 16.6 c-h 2.6 c-h Americot 1504B2RF 682 f-i 277 i-m 0.494 23.5 16.9 c-h 2.7 a-f NexGen 3331B2RF 692 f-i 276 i-m 0.483 26.7 19.0 b-g 2.2 ijk Phytogen 315RF 690 f-i 275 i-m 0.483 24.0 10.7 gh 2.9 a-d Cropland Genetics 3035RF 708 e-i 257 j-m 0.436 25.8 26.9 b 2.1 j NexGen 1556RF 578 hi 250 j-m 0.511 22.5 18.7 b-g 2.9 a-d Americot 1664B2RF 595 hi 248 j-m 0.520 26.0 12.9 d-h 2.6 d-h Stoneville 4427B2RF 648 ghi 243 lm 0.474 24.3 10.7 gh 2.2 hij NexGen 3538RF 554 i 226 m 0.491 20.7 18.1 b-h 2.1 jk
1Different letters mean that varieties are significantly different at P = 0.05. 2$/acre was calculated as the yield (lbs/acre) x loan value ($/lb) minus seed and technology fees for planting four seed/ft row on 40-inch centers (52,272 seed/acre).
85

Table 7. Fiber ratings for varieties in a Verticillium wilt field in Lynn County in 2008 Variety Micronaire Length Uniformity Strength Elongation Leaf Rd +b AFD 5064F 3.7 1.13 81.4 30.9 10.2 2.5 77.4 7.3Americot 1504B2RF 3.0 1.15 80.0 27.6 10.2 2.0 80.6 7.2Americot 1664B2RF 3.1 1.14 80.1 27.3 10.7 2.0 78.5 7.5Cropland Genetics 3020B2RF
2.9 1.09 80.0 26.3 10.1 1.0 80.9 7.4
Cropland Genetics 3035RF
2.6 1.07 78.5 27.2 10.5 1.0 78.1 8.4
Cropland Genetics 3520B2RF
3.1 1.13 79.6 27.1 10.4 2.5 78.1 7.7
Deltapine 104B2RF 3.0 1.15 81.0 29.3 10.8 2.5 78.3 7.5Fibermax 1740B2RF 3.0 1.12 80.3 29.3 9.9 1.0 80.1 7.3Fibermax 1880B2RF 3.1 1.18 81.1 30.5 9.2 2.0 80.2 7.6Fibermax 9058RF 3.0 1.18 79.8 28.7 8.8 1.5 78.8 7.1Fibermax 9063B2RF 3.2 1.20 80.9 32.2 8.9 1.5 80.5 6.9Fibermax 9160B2RF 2.9 1.19 81.6 30.3 8.7 1.0 80.3 7.1Fibermax 9180B2RF 2.8 1.16 80.4 31.3 9.3 1.0 80.9 7.2NexGen 1551RF 3.6 1.15 80.4 32.0 9.6 1.5 77.0 8.1NexGen 1556RF 3.2 1.15 81.8 31.7 9.8 2.5 77.2 7.8NexGen 1572RF 2.6 1.13 79.3 29.2 10.0 3.0 78.5 6.7NexGen 3331B2RF 2.7 1.11 80.4 29.2 9.3 2.0 77.3 8.3NexGen 3538RF 2.8 1.19 81.3 31.3 9.2 1.0 78.9 7.7NexGen 4370B2RF 3.1 1.13 80.4 28.0 10.5 1.5 78.6 8.1NexGen 4377B2RF 2.8 1.13 81.1 28.1 10.4 3.0 77.3 7.9Phytogen 315RF 2.9 1.11 78.6 26.7 9.3 3.0 78.8 7.7Phytogen 375WRF 2.9 1.13 79.1 27.7 9.5 2.0 79.5 7.7Phytogen 425RF 3.5 1.15 81.5 28.7 10.8 2.5 76.2 8.1Stoneville 4427B2RF 2.7 1.10 78.4 27.9 9.3 1.5 78.3 8.1Stoneville 4288B2RF 3.1 1.15 79.0 29.4 10.2 2.0 78.3 8.1Stoneville 4498B2RF 3.0 1.16 80.8 31.0 10.6 3.5 78.2 7.9Stoneville 4554B2RF 3.3 1.16 80.7 29.3 10.9 1.5 77.9 8.5Stoneville 5283RF 2.8 1.12 79.1 30.2 9.8 2.0 77.9 8.5Stoneville 5288B2RF 2.8 1.12 77.6 28.6 9.5 2.5 79.6 7.1Stoneville 5327B2RF 3.0 1.14 80.3 30.5 9.7 1.0 76.5 8.2
86
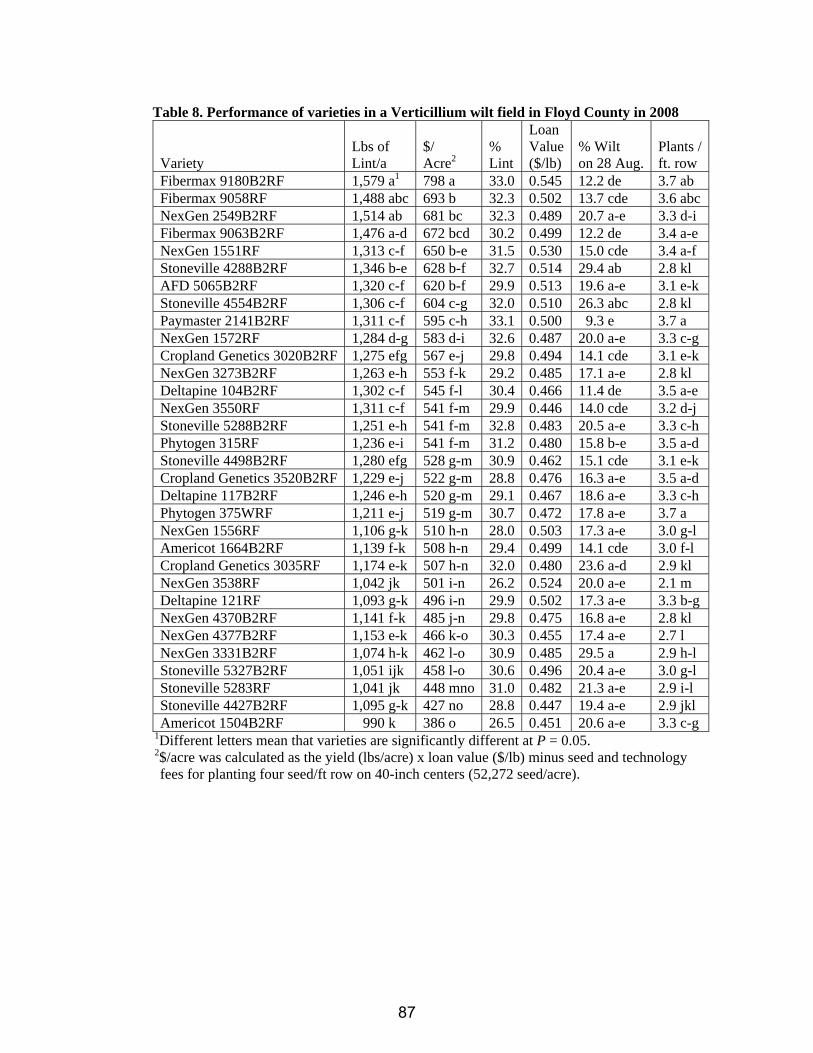
Table 8. Performance of varieties in a Verticillium wilt field in Floyd County in 2008 Variety
Lbs of Lint/a
$/ Acre2
% Lint
Loan Value ($/lb)
% Wilt on 28 Aug.
Plants / ft. row
Fibermax 9180B2RF 1,579 a1 798 a 33.0 0.545 12.2 de 3.7 ab Fibermax 9058RF 1,488 abc 693 b 32.3 0.502 13.7 cde 3.6 abc NexGen 2549B2RF 1,514 ab 681 bc 32.3 0.489 20.7 a-e 3.3 d-i Fibermax 9063B2RF 1,476 a-d 672 bcd 30.2 0.499 12.2 de 3.4 a-e NexGen 1551RF 1,313 c-f 650 b-e 31.5 0.530 15.0 cde 3.4 a-f Stoneville 4288B2RF 1,346 b-e 628 b-f 32.7 0.514 29.4 ab 2.8 kl AFD 5065B2RF 1,320 c-f 620 b-f 29.9 0.513 19.6 a-e 3.1 e-k Stoneville 4554B2RF 1,306 c-f 604 c-g 32.0 0.510 26.3 abc 2.8 kl Paymaster 2141B2RF 1,311 c-f 595 c-h 33.1 0.500 9.3 e 3.7 a NexGen 1572RF 1,284 d-g 583 d-i 32.6 0.487 20.0 a-e 3.3 c-g Cropland Genetics 3020B2RF 1,275 efg 567 e-j 29.8 0.494 14.1 cde 3.1 e-k NexGen 3273B2RF 1,263 e-h 553 f-k 29.2 0.485 17.1 a-e 2.8 kl Deltapine 104B2RF 1,302 c-f 545 f-l 30.4 0.466 11.4 de 3.5 a-e NexGen 3550RF 1,311 c-f 541 f-m 29.9 0.446 14.0 cde 3.2 d-j Stoneville 5288B2RF 1,251 e-h 541 f-m 32.8 0.483 20.5 a-e 3.3 c-h Phytogen 315RF 1,236 e-i 541 f-m 31.2 0.480 15.8 b-e 3.5 a-d Stoneville 4498B2RF 1,280 efg 528 g-m 30.9 0.462 15.1 cde 3.1 e-k Cropland Genetics 3520B2RF 1,229 e-j 522 g-m 28.8 0.476 16.3 a-e 3.5 a-d Deltapine 117B2RF 1,246 e-h 520 g-m 29.1 0.467 18.6 a-e 3.3 c-h Phytogen 375WRF 1,211 e-j 519 g-m 30.7 0.472 17.8 a-e 3.7 a NexGen 1556RF 1,106 g-k 510 h-n 28.0 0.503 17.3 a-e 3.0 g-l Americot 1664B2RF 1,139 f-k 508 h-n 29.4 0.499 14.1 cde 3.0 f-l Cropland Genetics 3035RF 1,174 e-k 507 h-n 32.0 0.480 23.6 a-d 2.9 kl NexGen 3538RF 1,042 jk 501 i-n 26.2 0.524 20.0 a-e 2.1 m Deltapine 121RF 1,093 g-k 496 i-n 29.9 0.502 17.3 a-e 3.3 b-g NexGen 4370B2RF 1,141 f-k 485 j-n 29.8 0.475 16.8 a-e 2.8 kl NexGen 4377B2RF 1,153 e-k 466 k-o 30.3 0.455 17.4 a-e 2.7 l NexGen 3331B2RF 1,074 h-k 462 l-o 30.9 0.485 29.5 a 2.9 h-l Stoneville 5327B2RF 1,051 ijk 458 l-o 30.6 0.496 20.4 a-e 3.0 g-l Stoneville 5283RF 1,041 jk 448 mno 31.0 0.482 21.3 a-e 2.9 i-l Stoneville 4427B2RF 1,095 g-k 427 no 28.8 0.447 19.4 a-e 2.9 jkl Americot 1504B2RF 990 k 386 o 26.5 0.451 20.6 a-e 3.3 c-g
1Different letters mean that varieties are significantly different at P = 0.05. 2$/acre was calculated as the yield (lbs/acre) x loan value ($/lb) minus seed and technology fees for planting four seed/ft row on 40-inch centers (52,272 seed/acre).
87
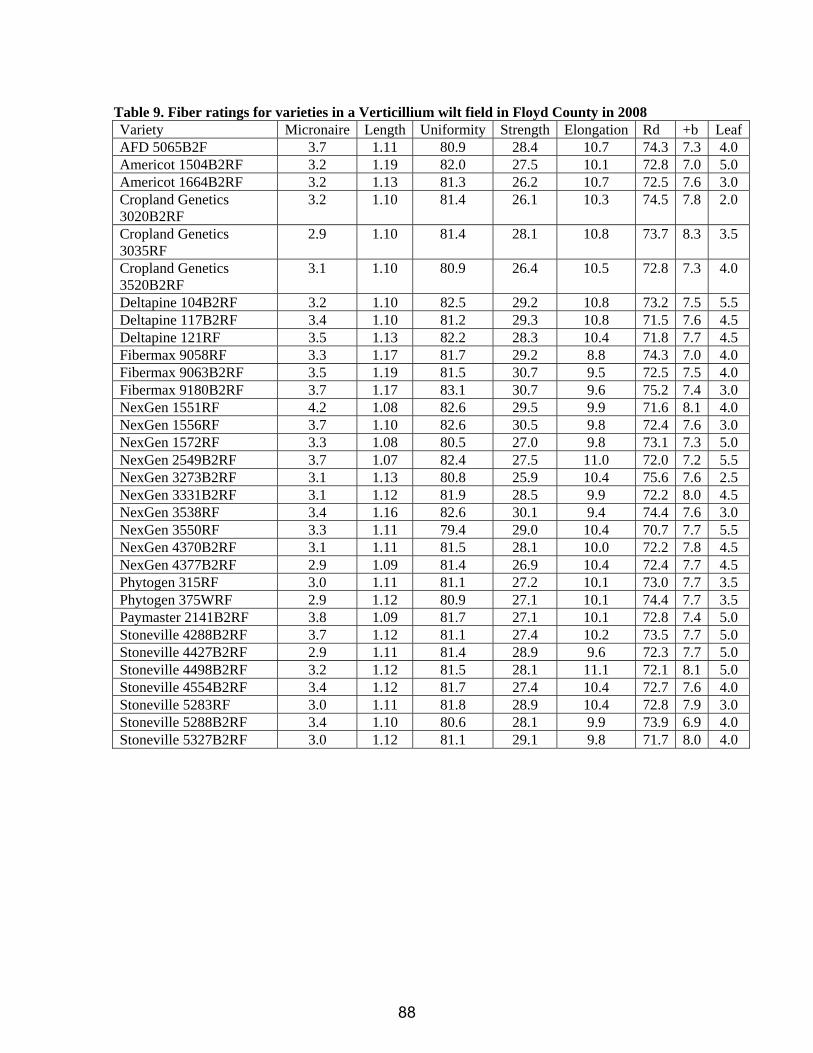
Table 9. Fiber ratings for varieties in a Verticillium wilt field in Floyd County in 2008 Variety Micronaire Length Uniformity Strength Elongation Rd +b LeafAFD 5065B2F 3.7 1.11 80.9 28.4 10.7 74.3 7.3 4.0 Americot 1504B2RF 3.2 1.19 82.0 27.5 10.1 72.8 7.0 5.0 Americot 1664B2RF 3.2 1.13 81.3 26.2 10.7 72.5 7.6 3.0 Cropland Genetics 3020B2RF
3.2 1.10 81.4 26.1 10.3 74.5 7.8 2.0
Cropland Genetics 3035RF
2.9 1.10 81.4 28.1 10.8 73.7 8.3 3.5
Cropland Genetics 3520B2RF
3.1 1.10 80.9 26.4 10.5 72.8 7.3 4.0
Deltapine 104B2RF 3.2 1.10 82.5 29.2 10.8 73.2 7.5 5.5 Deltapine 117B2RF 3.4 1.10 81.2 29.3 10.8 71.5 7.6 4.5 Deltapine 121RF 3.5 1.13 82.2 28.3 10.4 71.8 7.7 4.5 Fibermax 9058RF 3.3 1.17 81.7 29.2 8.8 74.3 7.0 4.0 Fibermax 9063B2RF 3.5 1.19 81.5 30.7 9.5 72.5 7.5 4.0 Fibermax 9180B2RF 3.7 1.17 83.1 30.7 9.6 75.2 7.4 3.0 NexGen 1551RF 4.2 1.08 82.6 29.5 9.9 71.6 8.1 4.0 NexGen 1556RF 3.7 1.10 82.6 30.5 9.8 72.4 7.6 3.0 NexGen 1572RF 3.3 1.08 80.5 27.0 9.8 73.1 7.3 5.0 NexGen 2549B2RF 3.7 1.07 82.4 27.5 11.0 72.0 7.2 5.5 NexGen 3273B2RF 3.1 1.13 80.8 25.9 10.4 75.6 7.6 2.5 NexGen 3331B2RF 3.1 1.12 81.9 28.5 9.9 72.2 8.0 4.5 NexGen 3538RF 3.4 1.16 82.6 30.1 9.4 74.4 7.6 3.0 NexGen 3550RF 3.3 1.11 79.4 29.0 10.4 70.7 7.7 5.5 NexGen 4370B2RF 3.1 1.11 81.5 28.1 10.0 72.2 7.8 4.5 NexGen 4377B2RF 2.9 1.09 81.4 26.9 10.4 72.4 7.7 4.5 Phytogen 315RF 3.0 1.11 81.1 27.2 10.1 73.0 7.7 3.5 Phytogen 375WRF 2.9 1.12 80.9 27.1 10.1 74.4 7.7 3.5 Paymaster 2141B2RF 3.8 1.09 81.7 27.1 10.1 72.8 7.4 5.0 Stoneville 4288B2RF 3.7 1.12 81.1 27.4 10.2 73.5 7.7 5.0 Stoneville 4427B2RF 2.9 1.11 81.4 28.9 9.6 72.3 7.7 5.0 Stoneville 4498B2RF 3.2 1.12 81.5 28.1 11.1 72.1 8.1 5.0 Stoneville 4554B2RF 3.4 1.12 81.7 27.4 10.4 72.7 7.6 4.0 Stoneville 5283RF 3.0 1.11 81.8 28.9 10.4 72.8 7.9 3.0 Stoneville 5288B2RF 3.4 1.10 80.6 28.1 9.9 73.9 6.9 4.0 Stoneville 5327B2RF 3.0 1.12 81.1 29.1 9.8 71.7 8.0 4.0
88
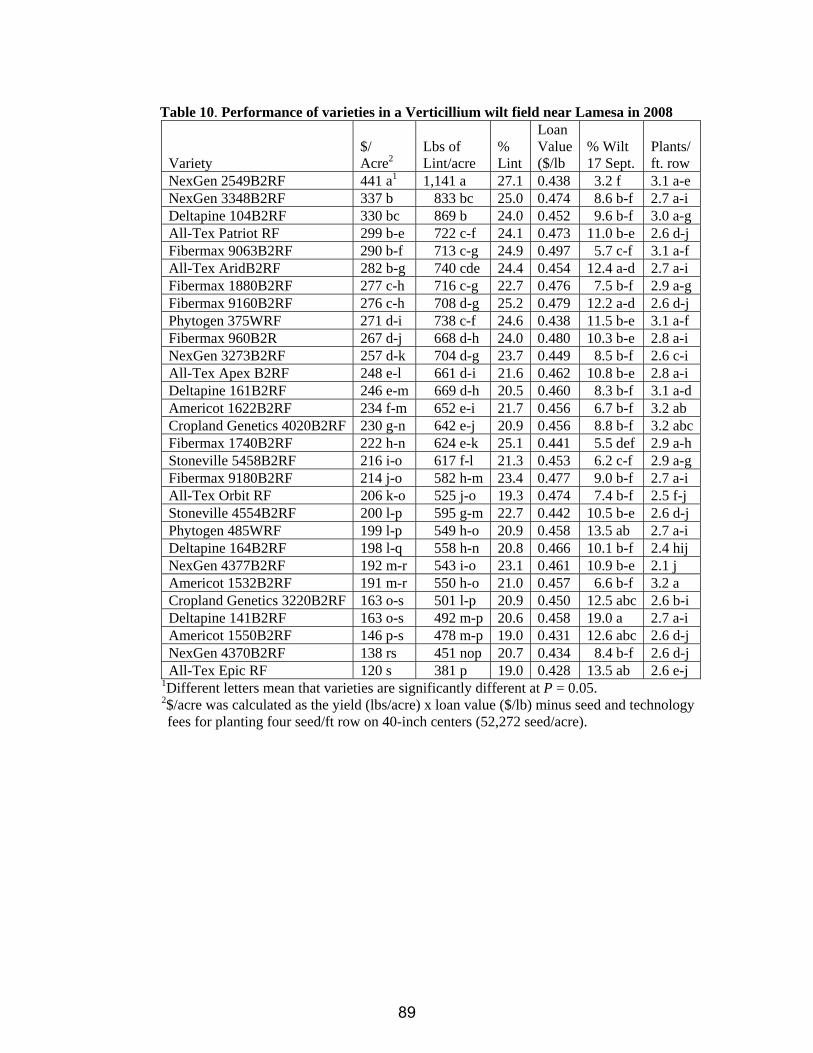
Table 10. Performance of varieties in a Verticillium wilt field near Lamesa in 2008 Variety
$/ Acre2
Lbs of Lint/acre
% Lint
Loan Value ($/lb
% Wilt 17 Sept.
Plants/ ft. row
NexGen 2549B2RF 441 a1 1,141 a 27.1 0.438 3.2 f 3.1 a-e NexGen 3348B2RF 337 b 833 bc 25.0 0.474 8.6 b-f 2.7 a-i Deltapine 104B2RF 330 bc 869 b 24.0 0.452 9.6 b-f 3.0 a-g All-Tex Patriot RF 299 b-e 722 c-f 24.1 0.473 11.0 b-e 2.6 d-j Fibermax 9063B2RF 290 b-f 713 c-g 24.9 0.497 5.7 c-f 3.1 a-f All-Tex AridB2RF 282 b-g 740 cde 24.4 0.454 12.4 a-d 2.7 a-i Fibermax 1880B2RF 277 c-h 716 c-g 22.7 0.476 7.5 b-f 2.9 a-g Fibermax 9160B2RF 276 c-h 708 d-g 25.2 0.479 12.2 a-d 2.6 d-j Phytogen 375WRF 271 d-i 738 c-f 24.6 0.438 11.5 b-e 3.1 a-f Fibermax 960B2R 267 d-j 668 d-h 24.0 0.480 10.3 b-e 2.8 a-i NexGen 3273B2RF 257 d-k 704 d-g 23.7 0.449 8.5 b-f 2.6 c-i All-Tex Apex B2RF 248 e-l 661 d-i 21.6 0.462 10.8 b-e 2.8 a-i Deltapine 161B2RF 246 e-m 669 d-h 20.5 0.460 8.3 b-f 3.1 a-d Americot 1622B2RF 234 f-m 652 e-i 21.7 0.456 6.7 b-f 3.2 ab Cropland Genetics 4020B2RF 230 g-n 642 e-j 20.9 0.456 8.8 b-f 3.2 abcFibermax 1740B2RF 222 h-n 624 e-k 25.1 0.441 5.5 def 2.9 a-h Stoneville 5458B2RF 216 i-o 617 f-l 21.3 0.453 6.2 c-f 2.9 a-g Fibermax 9180B2RF 214 j-o 582 h-m 23.4 0.477 9.0 b-f 2.7 a-i All-Tex Orbit RF 206 k-o 525 j-o 19.3 0.474 7.4 b-f 2.5 f-j Stoneville 4554B2RF 200 l-p 595 g-m 22.7 0.442 10.5 b-e 2.6 d-j Phytogen 485WRF 199 l-p 549 h-o 20.9 0.458 13.5 ab 2.7 a-i Deltapine 164B2RF 198 l-q 558 h-n 20.8 0.466 10.1 b-f 2.4 hij NexGen 4377B2RF 192 m-r 543 i-o 23.1 0.461 10.9 b-e 2.1 j Americot 1532B2RF 191 m-r 550 h-o 21.0 0.457 6.6 b-f 3.2 a Cropland Genetics 3220B2RF 163 o-s 501 l-p 20.9 0.450 12.5 abc 2.6 b-i Deltapine 141B2RF 163 o-s 492 m-p 20.6 0.458 19.0 a 2.7 a-i Americot 1550B2RF 146 p-s 478 m-p 19.0 0.431 12.6 abc 2.6 d-j NexGen 4370B2RF 138 rs 451 nop 20.7 0.434 8.4 b-f 2.6 d-j All-Tex Epic RF 120 s 381 p 19.0 0.428 13.5 ab 2.6 e-j
1Different letters mean that varieties are significantly different at P = 0.05. 2$/acre was calculated as the yield (lbs/acre) x loan value ($/lb) minus seed and technology fees for planting four seed/ft row on 40-inch centers (52,272 seed/acre).
89

Table 11. Fiber ratings for varieties in a Verticillium wilt field near Lamesa in 2008 Variety Micronaire Length Uniformity Strength Elongation Leaf Rd +b Americot 1532B2RF 2.20 1.11 78.8 25.9 9.9 2.5 83.4 7.7Americot 1550B2RF 2.15 1.06 77.5 25.3 9.9 1.0 82.7 9.0Americot 1622B2RF 2.35 1.08 80.1 26.0 10.7 2.0 83.7 8.0All-Tex Orbit RF 2.35 1.11 80.8 27.4 11.3 2.0 84.1 8.4All-Tex Patriot RF 2.60 1.10 78.9 28.5 10.8 1.5 83.5 8.1All-Tex Epic RF 2.10 1.06 77.5 26.5 10.0 2.0 83.4 8.5All-Tex Apex B2RF 2.25 1.11 78.5 25.8 9.9 1.5 83.8 8.0All-Tex Arid B2RF 2.50 1.07 79.7 27.4 10.3 2.5 83.3 7.6Fibermax 9160B2RF 2.25 1.14 80.7 29.1 9.7 1.0 83.7 8.1Cropland Genetics 3220B2RF
2.20 1.08 78.3 26.3 10.3 1.5 83.8 8.2
Cropland Genetics 4020B2RF
2.25 1.10 78.0 26.0 9.8 2.5 82.6 7.8
Deltapine 104B2RF 2.45 1.10 80.7 29.0 11.0 3.5 82.6 7.8Deltapine 141B2RF 2.15 1.12 78.2 27.6 9.8 3.5 80.9 8.0Deltapine 161B2RF 2.20 1.10 77.1 26.4 9.5 2.0 83.3 8.2Deltapine 164B2RF 2.20 1.12 77.0 26.5 9.6 2.0 83.2 7.7Fibermax 1740B2RF 2.40 1.06 78.4 26.5 10.0 1.0 84.9 8.0Fibermax 1880B2RF 2.30 1.14 79.8 28.6 9.7 2.0 83.1 7.9Fibermax 9063B2RF 2.65 1.16 80.8 30.4 9.9 1.5 84.5 7.6Fibermax 9180B2RF 2.40 1.12 81.0 29.1 10.0 1.5 85.4 7.7Fibermax 960B2R 2.40 1.12 80.8 29.0 8.9 1.5 84.2 7.9NexGen 2549B2RF 2.65 1.02 79.6 27.0 11.0 2.5 81.9 8.0NexGen 3273B2RF 2.25 1.09 78.8 26.1 10.5 2.5 84.7 7.7NexGen 3348B2RF 2.55 1.14 80.9 29.0 10.8 3.0 82.1 8.1NexGen 4370B2RF 2.15 1.07 78.8 26.2 9.9 4.0 80.8 8.1NexGen 4377B2RF 2.35 1.09 80.1 26.4 10.7 3.0 82.7 8.2Phytogen 375WRF 2.35 1.08 79.4 25.6 10.1 3.0 82.2 8.5Phytogen 485WRF 2.35 1.11 80.0 29.1 11.1 3.5 80.0 8.4Stoneville 4554B2RF 2.25 1.08 78.5 26.9 11.8 3.5 81.0 8.4Stoneville 5458B2RF 2.30 1.09 78.1 28.3 9.4 2.0 80.9 8.4
90