applied investment management (aim) program aim class …€¦ · · 2018-03-02modine...
TRANSCRIPT
Marquette University AIM Class 2018 and 2019 Equity Reports Spring 2018 Page 1
Applied Investment Management (AIM) Program
AIM Class of 2018 and Class of 2019 Equity Fund Reports Spring 2018
Date: Friday, February 16th | Time: See Schedule Below | Location: AIM Research Room 488
9:00 AM Presenter Company Name Ticker Sector Page
Sarfaraz Mohammed Modine Manufacturing Company MOD Consumer Discretionary 2
Andrea Blomquist Travelport Worldwide Ltd. TVPT International Consumer
Discretionary 5
Riddhi Vakil Oxford Industries, Inc. OXM Consumer Discretionary 8
3:00 PM Presenter Company Name Ticker Sector Page
John Wagner Green Dot Corp. GDOT Financials 11
Max Mattappillil Apogee Enterprises, Inc. APOG Industrials 14
Jack Gorski Accenture Plc ACCN International Technology 17
Nick Longo Novocure Limited NVCR International Healthcare 20
These student presentations are an important element of the applied learning experience in the AIM program. The students conduct fundamental equity research and present their recommendations in written and oral format – with the goal of adding their stock to the AIM Equity Fund. Your comments and advice add considerably to their educational experience and is greatly appreciated. Each student will spend about 5-7 minutes presenting their formal recommendation, which is then followed by about 8-10 minutes of Q & A. David S. Krause, PhD Director, Applied Investment Management Program Marquette University College of Business Administration, Department of Finance 436 Straz Hall, PO Box 1881 Milwaukee, WI 53201-1881 mailto: [email protected] Website: MarquetteBuz/AIM AIM Blog: AIM Program Blog Twitter: Marquette AIM Facebook: Marquette AIM
Marquette University AIM Class 2018 and 2019 Equity Reports Spring 2018 Page 2
Modine Manufacturing Company (MOD) February 16, 2018
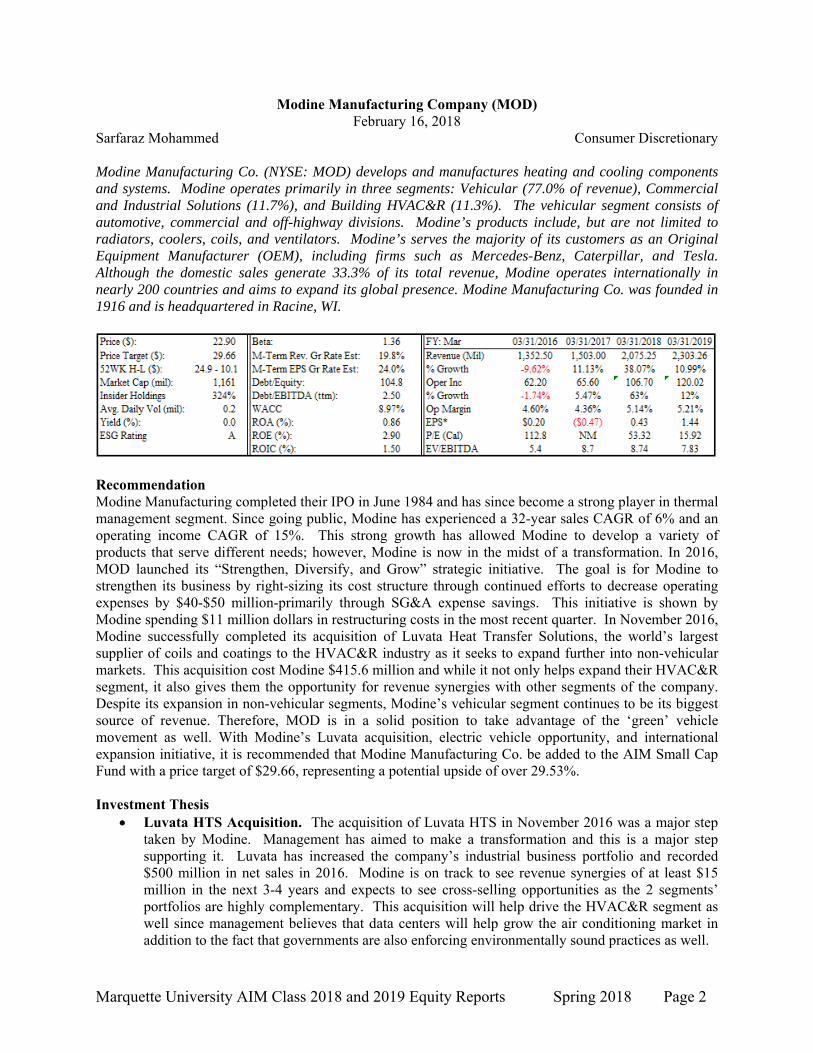
Sarfaraz Mohammed Consumer Discretionary Modine Manufacturing Co. (NYSE: MOD) develops and manufactures heating and cooling components and systems. Modine operates primarily in three segments: Vehicular (77.0% of revenue), Commercial and Industrial Solutions (11.7%), and Building HVAC&R (11.3%). The vehicular segment consists of automotive, commercial and off-highway divisions. Modine’s products include, but are not limited to radiators, coolers, coils, and ventilators. Modine’s serves the majority of its customers as an Original Equipment Manufacturer (OEM), including firms such as Mercedes-Benz, Caterpillar, and Tesla. Although the domestic sales generate 33.3% of its total revenue, Modine operates internationally in nearly 200 countries and aims to expand its global presence. Modine Manufacturing Co. was founded in 1916 and is headquartered in Racine, WI.
Recommendation Modine Manufacturing completed their IPO in June 1984 and has since become a strong player in thermal management segment. Since going public, Modine has experienced a 32-year sales CAGR of 6% and an operating income CAGR of 15%. This strong growth has allowed Modine to develop a variety of products that serve different needs; however, Modine is now in the midst of a transformation. In 2016, MOD launched its “Strengthen, Diversify, and Grow” strategic initiative. The goal is for Modine to strengthen its business by right-sizing its cost structure through continued efforts to decrease operating expenses by $40-$50 million-primarily through SG&A expense savings. This initiative is shown by Modine spending $11 million dollars in restructuring costs in the most recent quarter. In November 2016, Modine successfully completed its acquisition of Luvata Heat Transfer Solutions, the world’s largest supplier of coils and coatings to the HVAC&R industry as it seeks to expand further into non-vehicular markets. This acquisition cost Modine $415.6 million and while it not only helps expand their HVAC&R segment, it also gives them the opportunity for revenue synergies with other segments of the company. Despite its expansion in non-vehicular segments, Modine’s vehicular segment continues to be its biggest source of revenue. Therefore, MOD is in a solid position to take advantage of the ‘green’ vehicle movement as well. With Modine’s Luvata acquisition, electric vehicle opportunity, and international expansion initiative, it is recommended that Modine Manufacturing Co. be added to the AIM Small Cap Fund with a price target of $29.66, representing a potential upside of over 29.53%. Investment Thesis
Luvata HTS Acquisition. The acquisition of Luvata HTS in November 2016 was a major step taken by Modine. Management has aimed to make a transformation and this is a major step supporting it. Luvata has increased the company’s industrial business portfolio and recorded $500 million in net sales in 2016. Modine is on track to see revenue synergies of at least $15 million in the next 3-4 years and expects to see cross-selling opportunities as the 2 segments’ portfolios are highly complementary. This acquisition will help drive the HVAC&R segment as well since management believes that data centers will help grow the air conditioning market in addition to the fact that governments are also enforcing environmentally sound practices as well.

Marquette University AIM Class 2018 and 2019 Equity Reports Spring 2018 Page 3
Electric Vehicles. While Modine is focused on expanding its reach in non-vehicular segments, its vehicular segment consisting of automotive, commercial, and off-highway vehicles, remains its top performer in sales. This can be even further ‘electrified’ if Modine is able to capitalize on the green movement in vehicles. According to Baird Research, the estimated thermal content in an electric vehicle is 3x more than that of a normal vehicle. Modine has a solid opportunity to take advantage of this as MOD is already partnered with many vehicular manufacturers, including Tesla.
International Expansion. Modine is committed to expanding its reach to international markets. This past quarter, MOD finished the construction of another production facility in Hungary in order to produce more of its top selling engine. Additionally, the company is targeting Asian markets heavily as well- particularly, China and India. Sales increased by 41% in Asia in fiscal 2017 due to automotive market demand and maturing program volumes in China. Modine is continuing to ramp up production of aluminum oil coolers in Shanghai; production levels in Changzhou, China and Chennai, India also increased in fiscal 2017. Management expects this trend to continue in fiscal 2018.
Valuation In order to reach an intrinsic value for MOD, a five year DCF model was constructed. Using a terminal growth rate of 2.00% and a WACC of 8.94%, an intrinsic value of $25.19 was reached. A sensitivity analysis on the terminal growth rate and WACC resulted in a range between $23.00-$33.60. Additionally, a P/E multiple valuation was calculated. Using a 2018E EPS of $1.44 and utilizing a blended average P/E multiple of 22.30x, resulted in an intrinsic value of $32.08. Finally, an EV/EBITDA multiple valuation was conducted using a blended average EV/EBITDA multiple of 11.76x, resulting in an intrinsic value of $31.85. By weighing the three models 34/33/33, a price target of $29.66 was reached, resulting in a 29.53% potential upside. MOD does not pay a dividend. Risks
Price Reduction Pressure. Modine faces regular price-reduction pressure from its vehicular customers, even if it’s contrary to contractual terms. In response to this, Modine is required to consistently reduce operating costs to maintain acceptable profit margins. MOD will continue to implement price reduction tasks in the future, but if they are unable to offset price reductions through improved operating efficiencies, the results of operating could be adversely affected.
Fluctuations in the Cost of Material. As a manufacturing company, Modine is heavily reliant on the materials it needs to provide value to its customers. Increases in the cost of these materials could negatively affect the results of operations; however, it should be noted that MOD has included material pass-through provisions in customer contracts when possible. Under these arrangements, customer prices are adjusted based on increases and decreases in relation to the cost of raw materials.
International Risk. Although Modine is based domestically, it has operations in multiple continents and seeks to expand its influence internationally. However, MOD faces competition from suppliers that may enjoy economic advantages such as low labor costs. In addition to competition, Modine is also subject to currency rate fluctuations. Sales and profitability are both affected by changes in rates as a significant portion of revenue is realized in foreign currency.
Management The President and Chief Executive Officer is Thomas A. Burke. Mr. Burke has been the CEO of Modine since April 1, 2008 for a tenor of 13 years. Before this, he held other leadership positions within the company including the titles of Chief Technology Officer and Executive Vice President. The Chief Financial Officer is Michael B. Lucareli, who has been with the company for a tenor of 19 years.
Marquette University AIM Class 2018 and 2019 Equity Reports Spring 2018 Page 4
Marquette University AIM Class 2018 and 2019 Equity Reports Spring 2018 Page 5
Travelport Worldwide Ltd. (TVPT) February 16, 2018
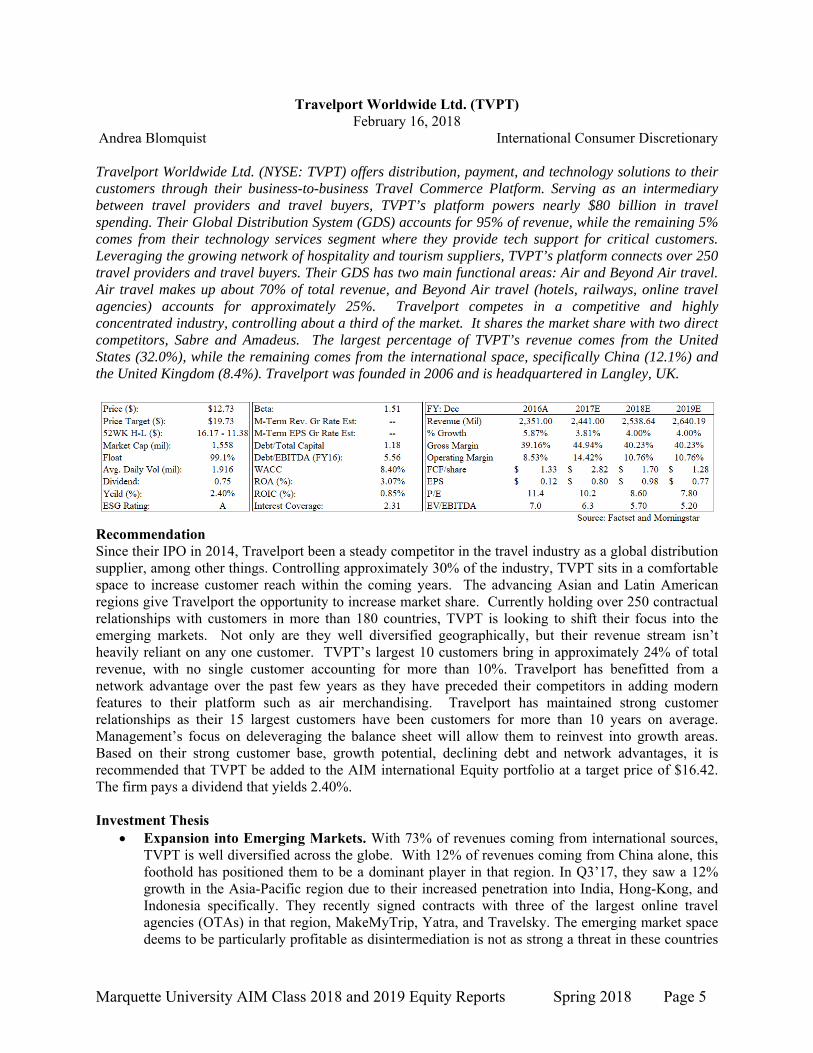
Andrea Blomquist International Consumer Discretionary Travelport Worldwide Ltd. (NYSE: TVPT) offers distribution, payment, and technology solutions to their customers through their business-to-business Travel Commerce Platform. Serving as an intermediary between travel providers and travel buyers, TVPT’s platform powers nearly $80 billion in travel spending. Their Global Distribution System (GDS) accounts for 95% of revenue, while the remaining 5% comes from their technology services segment where they provide tech support for critical customers. Leveraging the growing network of hospitality and tourism suppliers, TVPT’s platform connects over 250 travel providers and travel buyers. Their GDS has two main functional areas: Air and Beyond Air travel. Air travel makes up about 70% of total revenue, and Beyond Air travel (hotels, railways, online travel agencies) accounts for approximately 25%. Travelport competes in a competitive and highly concentrated industry, controlling about a third of the market. It shares the market share with two direct competitors, Sabre and Amadeus. The largest percentage of TVPT’s revenue comes from the United States (32.0%), while the remaining comes from the international space, specifically China (12.1%) and the United Kingdom (8.4%). Travelport was founded in 2006 and is headquartered in Langley, UK.
Recommendation Since their IPO in 2014, Travelport been a steady competitor in the travel industry as a global distribution supplier, among other things. Controlling approximately 30% of the industry, TVPT sits in a comfortable space to increase customer reach within the coming years. The advancing Asian and Latin American regions give Travelport the opportunity to increase market share. Currently holding over 250 contractual relationships with customers in more than 180 countries, TVPT is looking to shift their focus into the emerging markets. Not only are they well diversified geographically, but their revenue stream isn’t heavily reliant on any one customer. TVPT’s largest 10 customers bring in approximately 24% of total revenue, with no single customer accounting for more than 10%. Travelport has benefitted from a network advantage over the past few years as they have preceded their competitors in adding modern features to their platform such as air merchandising. Travelport has maintained strong customer relationships as their 15 largest customers have been customers for more than 10 years on average. Management’s focus on deleveraging the balance sheet will allow them to reinvest into growth areas. Based on their strong customer base, growth potential, declining debt and network advantages, it is recommended that TVPT be added to the AIM international Equity portfolio at a target price of $16.42. The firm pays a dividend that yields 2.40%. Investment Thesis
Expansion into Emerging Markets. With 73% of revenues coming from international sources, TVPT is well diversified across the globe. With 12% of revenues coming from China alone, this foothold has positioned them to be a dominant player in that region. In Q3’17, they saw a 12% growth in the Asia-Pacific region due to their increased penetration into India, Hong-Kong, and Indonesia specifically. They recently signed contracts with three of the largest online travel agencies (OTAs) in that region, MakeMyTrip, Yatra, and Travelsky. The emerging market space deems to be particularly profitable as disintermediation is not as strong a threat in these countries

Marquette University AIM Class 2018 and 2019 Equity Reports Spring 2018 Page 6
due to the lower prevalence of technologies among citizens. Additionally, only 10% of Chinese citizens currently to hold a passport. This number is expected to see growth in the next few years which will undoubtedly add a major influx of new travelers into the market whose revenue Travelport is well positioned to receive.
Strong Network Advantages and Market Share. TVPT holds a competitive advantage over its competitors because of their timeliness of new technology integration. TVPT was the first in the industry to develop a payment solution which settles transactions immediately (eNett) which they continue to reap the benefits of. In addition, they offer 4x more airline merchandising than their next competitor. Airline merchandising is a new trend in the industry that includes the bundling or unbundling or airline products. Additionally, the high barriers to entry in the GDS industry would not allow a fourth competitor to be profitable in this space, leading to an economic moat.
Deleveraging. Historically, TVPT’s main form of financing has been through debt. As an overleveraged company, TVPT was struggling to turn a profit and experienced years of large net losses. In the recent years, TVPT has managed to cut their interest payments by nearly 3x and is continuing the downward trend. By 2019, TVPT is expected to decrease debt by 15% to reach a more optimal level. This can be seen as a major catalyst for TVPT as it will allow them to increase earnings, but also give them the opportunity to pour the extra money into projects with a higher return.
Valuation In order to reach an intrinsic value for TVPT, a five year DCF model was constructed. Using a terminal growth rate of 2.00% and a WACC of 8.40%, an intrinsic value of $16.45 was reached. Additionally, an EV/EBITDA multiple valuation was conducted. Using TVPT’s EV/EBITDA of 6.41x, a peer average EV/EBITDA of 8.25x (adjusted for historical industry data), and TVPT’s most current price of $12.73, an intrinsic value of $16.38 was reached. By weighting the two models 50/50, a price target of $16.42 was reached, with a 29% upside. TVPT pays a dividend yeilding 2.4%. Risks
Overall Market Disintermediation. With the development of emerging technologies, the modern-day consumer has had more access to every corner of the Internet than ever before. Being an intermediary, there is the possibility that TVPT get cut out of the equation. While this could be detrimental to TVPT and its competitors, companies like Delta and various online travel agencies have tried to develop their own GDS, however the majority found that costs were simply too high. Furthermore, TVPT offers an aggregated platform which is more user friendly.
Codependence on Weather and Natural Disasters. Consistent with the travel and tourism industries, TVPT’s revenues and therefore profits will fluctuate in tune with the weather and the amount of natural disasters. Years with abundant natural disasters like 2016 and 2017 can greatly affect Travelport’s revenue stream given that they receive fees off the number of transactions processed from their platform.
Management Travelport is run by President and CEO Gordon Wilson who was appointed to this role in 2011 but has been with the company since 2007. Prior to holding his current positions, Wilson gained experience in other parts of TVPT’s management as well as with other companies such as Galileo and Cendant Travel Distribution Services, totaling more than 25 years of experience in travel distribution. In early 2016, Bernard Bot was appointed to the CFO of TVPT after moving on from Aer Lingus Plc. and TNT Express N.V. where he held CFO roles as well.

Marquette University AIM Class 2018 and 2019 Equity Reports Spring 2018 Page 7
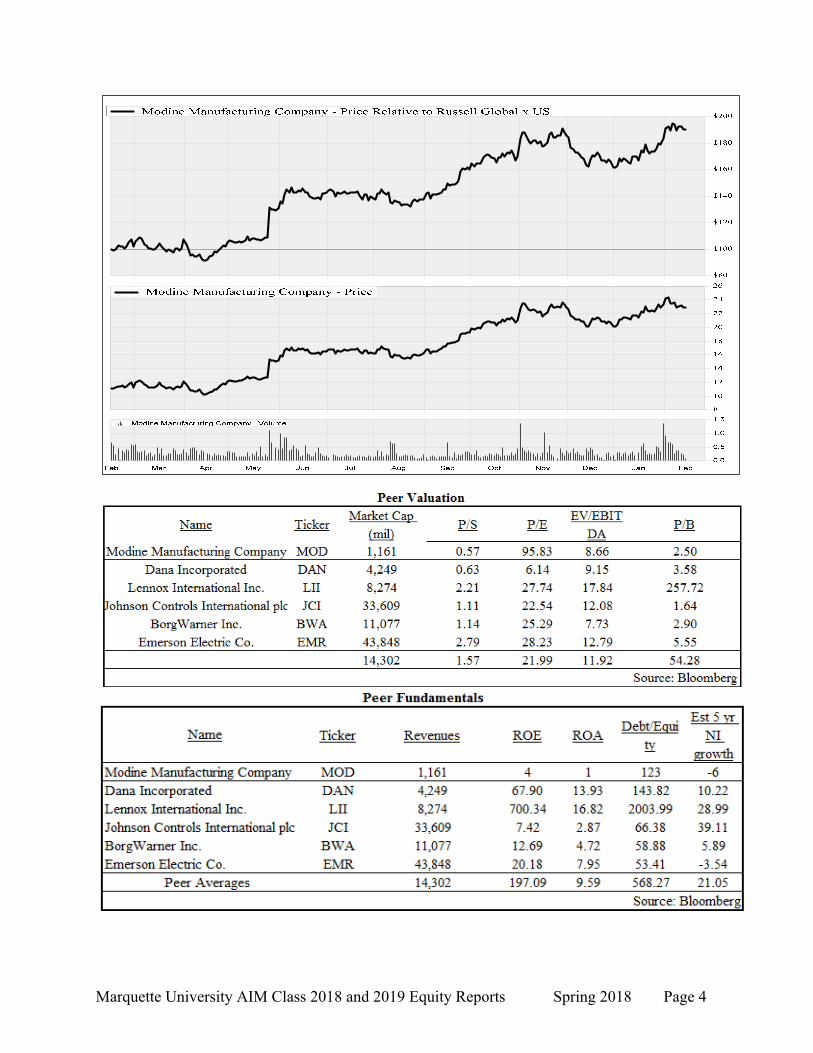
Source: FactSet
Marquette University AIM Class 2018 and 2019 Equity Reports Spring 2018 Page 8
Oxford Industries, Inc. (OXM) February 16, 2016
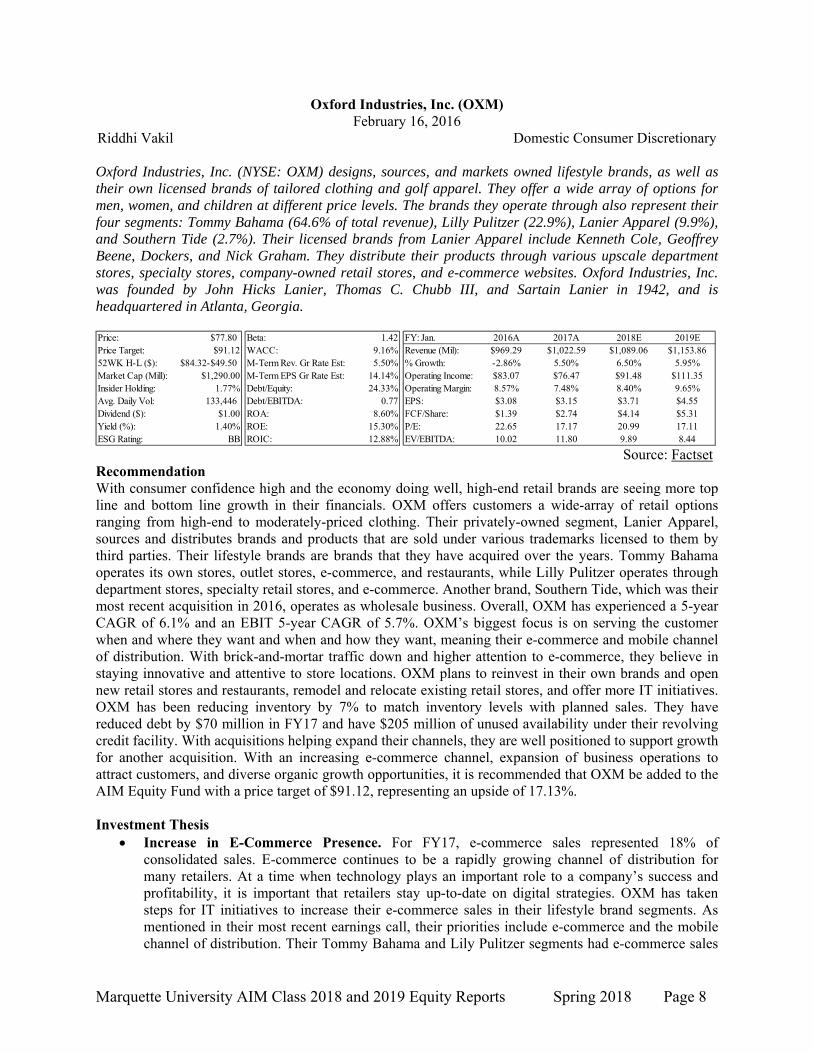
Riddhi Vakil Domestic Consumer Discretionary Oxford Industries, Inc. (NYSE: OXM) designs, sources, and markets owned lifestyle brands, as well as their own licensed brands of tailored clothing and golf apparel. They offer a wide array of options for men, women, and children at different price levels. The brands they operate through also represent their four segments: Tommy Bahama (64.6% of total revenue), Lilly Pulitzer (22.9%), Lanier Apparel (9.9%), and Southern Tide (2.7%). Their licensed brands from Lanier Apparel include Kenneth Cole, Geoffrey Beene, Dockers, and Nick Graham. They distribute their products through various upscale department stores, specialty stores, company-owned retail stores, and e-commerce websites. Oxford Industries, Inc. was founded by John Hicks Lanier, Thomas C. Chubb III, and Sartain Lanier in 1942, and is headquartered in Atlanta, Georgia.
$77.80 1.42 2016A 2017A 2018E 2019E$91.12 9.16% $969.29 $1,022.59 $1,089.06 $1,153.86
$84.32-$49.50 5.50% -2.86% 5.50% 6.50% 5.95%$1,290.00 14.14% $83.07 $76.47 $91.48 $111.35
1.77% 24.33% 8.57% 7.48% 8.40% 9.65%133,446 0.77 EPS: $3.08 $3.15 $3.71 $4.55
$1.00 8.60% $1.39 $2.74 $4.14 $5.311.40% 15.30% 22.65 17.17 20.99 17.11
BB 12.88% 10.02 11.80 9.89 8.44
M-Term Rev. Gr Rate Est:
EV/EBITDA:
Dividend ($): ROA: FCF/Share:Yield (%): ROE: P/E:ESG Rating: ROIC:
Price: Beta: FY: Jan.
Avg. Daily Vol: Debt/EBITDA:
Price Target: WACC:% Growth:
Market Cap (Mill): M-Term EPS Gr Rate Est: Operating Income:
Revenue (Mil):
Insider Holding: Debt/Equity: Operating Margin:
52WK H-L ($):
Source: Factset
Recommendation With consumer confidence high and the economy doing well, high-end retail brands are seeing more top line and bottom line growth in their financials. OXM offers customers a wide-array of retail options ranging from high-end to moderately-priced clothing. Their privately-owned segment, Lanier Apparel, sources and distributes brands and products that are sold under various trademarks licensed to them by third parties. Their lifestyle brands are brands that they have acquired over the years. Tommy Bahama operates its own stores, outlet stores, e-commerce, and restaurants, while Lilly Pulitzer operates through department stores, specialty retail stores, and e-commerce. Another brand, Southern Tide, which was their most recent acquisition in 2016, operates as wholesale business. Overall, OXM has experienced a 5-year CAGR of 6.1% and an EBIT 5-year CAGR of 5.7%. OXM’s biggest focus is on serving the customer when and where they want and when and how they want, meaning their e-commerce and mobile channel of distribution. With brick-and-mortar traffic down and higher attention to e-commerce, they believe in staying innovative and attentive to store locations. OXM plans to reinvest in their own brands and open new retail stores and restaurants, remodel and relocate existing retail stores, and offer more IT initiatives. OXM has been reducing inventory by 7% to match inventory levels with planned sales. They have reduced debt by $70 million in FY17 and have $205 million of unused availability under their revolving credit facility. With acquisitions helping expand their channels, they are well positioned to support growth for another acquisition. With an increasing e-commerce channel, expansion of business operations to attract customers, and diverse organic growth opportunities, it is recommended that OXM be added to the AIM Equity Fund with a price target of $91.12, representing an upside of 17.13%. Investment Thesis
Increase in E-Commerce Presence. For FY17, e-commerce sales represented 18% of consolidated sales. E-commerce continues to be a rapidly growing channel of distribution for many retailers. At a time when technology plays an important role to a company’s success and profitability, it is important that retailers stay up-to-date on digital strategies. OXM has taken steps for IT initiatives to increase their e-commerce sales in their lifestyle brand segments. As mentioned in their most recent earnings call, their priorities include e-commerce and the mobile channel of distribution. Their Tommy Bahama and Lily Pulitzer segments had e-commerce sales

Marquette University AIM Class 2018 and 2019 Equity Reports Spring 2018 Page 9
representing 16% and 32%, respectively, of total consolidated net sales, up from the previous fiscal years. A large percentage of their e-commerce sales come from seasonal flash clearance sales. Since their lifestyle brands operate partly online, OXM is increasing their capital expenditures to compete with other large, high-end retailers.
Diverse Growth Opportunities. Along with their private label brand, Lanier Apparel, OXM also operates through their various acquired brands. With their newest acquisition in 2016, Southern Tide, not being fully integrated into operations yet, OXM has a positive outlook on growth of about 3% as they expand operations. Tommy Bahama and Lily Pulitzer hold seasonal flash clearance sales online which helps build momentum of sales into full price products; Lily saw 13.2% YoY sales growth. These sales represented 39% of e-commerce sales for Lily Pulitzer and 10% of e-commerce sales for Tommy Bahama. OXM plans to increase these sales with the expansion of e-commerce.
Expansion for More Attraction. In order for OXM to be innovative in retail, they have expanded their lifestyle brands to include restaurants. Tommy Bahama retail stores have opened up coconut bars, a new concept Marlin Bar, and other retail restaurants. At the beginning of 2017, there were 17 restaurants and Marlin Bar locations strategically placed in high foot-traffic stores. With a 5.7% YoY sales growth, OXM is looking to expand their restaurant strategy into other high revenue stream locations.
Valuation In order to reach an intrinsic value for OXM, a five year DCF model was constructed. Using a terminal growth rate of 2.00% and a WACC of 9.16%, an intrinsic value of $94.18 was reached. A sensitivity analysis on the terminal growth rate and WACC ranged from $80.77-$112.94. Additionally, a P/E multiple valuation was calculated. Using a 2018E EPS of $3.71 and utilizing a blended average P/E multiple of 20.73x, resulted in an intrinsic value of $78.34. Finally, an EV/EBITDA multiple valuation was conducted using a blended average EV/EBITDA multiple of 12.07x, resulting in an intrinsic value of $97.80. By weighing the three models 50/25/25, a price target of $91.12 was reached, resulting in a 17.13% upside. OXM pays a $1.08 dividend, yielding 1.40%. Risks
Loss of Key Wholesale Customers. In 2016, 46% of their wholesale sales, or 16% of their net sales came from five of their largest customers. With more and more retailers switching from brick-and-mortar to e-commerce, OXM faces the risk of store closures from department stores which would negatively impact their net sales. OXM also relies on order-by-order purchases rather than long-term contracts. If a key customer were to terminate their relationship, OXM would see an automatic decline in profits.
Unexpected Costs from Acquisitions. OXM’s acquisitions have a risk of not integrating into the business as planned. They estimate and record the fair value of the acquired intangible assets. However, in the future they may have to incur a higher amount of debt, assume other liabilities, or make dilutive issuances of their equity securities.
Highly Competitive Industry. The retail industry has low barriers of entry making it extremely competitive. If OXM cannot evolve as quickly as some of the other large retailers, it can suffer financial losses from the loss of customers. They must introduce new retail concepts and products, strategically open new locations in the proper geographic areas, and have innovations in sales and marketing technology to keep their competitive edge.
Management Thomas Caldecot Chubb, III is the Founder, Chairman, President, and CEO of OXM, and he also serves as the Chairman and President at Tommy Bahama Group, Inc. K. S. Grassmyer is the CFO, Executive VP and Controller at OXM, and also serves on the Board of Directors at Tommy Bahama Group, Inc.
Marquette University AIM Class 2018 and 2019 Equity Reports Spring 2018 Page 10
Source: Factset
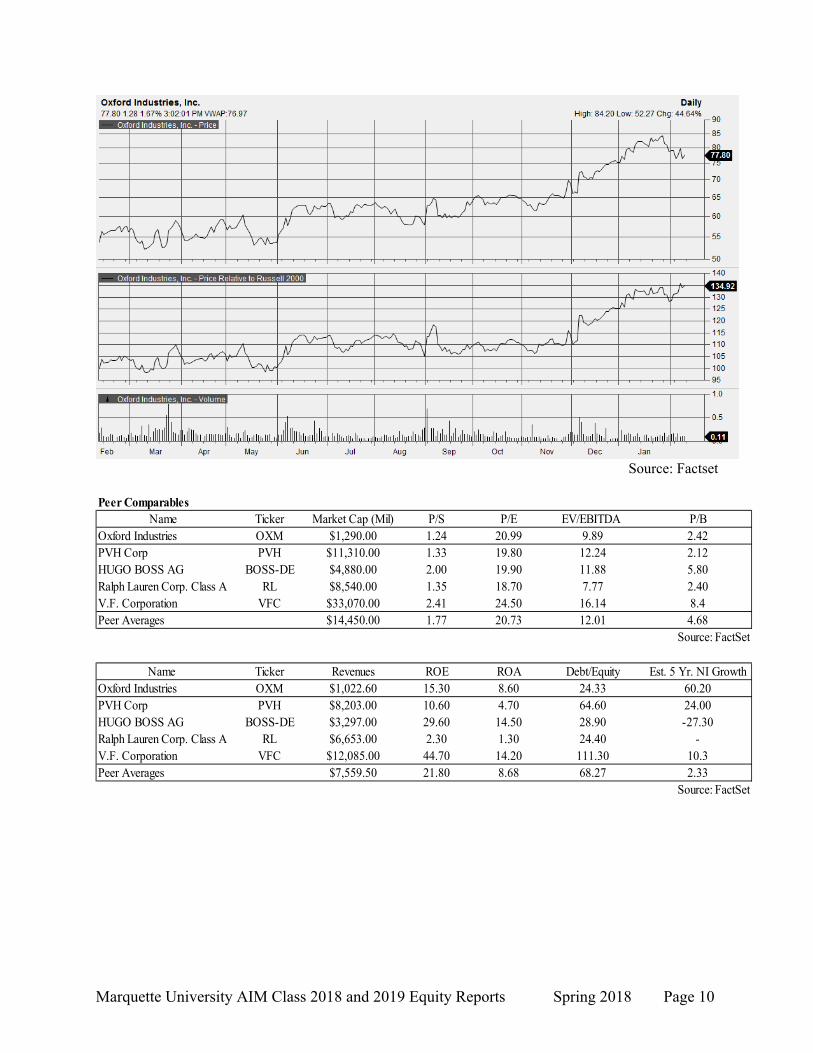
Ticker Market Cap (Mil) P/S P/E EV/EBITDA P/BOxford Industries OXM $1,290.00 1.24 20.99 9.89 2.42PVH Corp PVH $11,310.00 1.33 19.80 12.24 2.12HUGO BOSS AG BOSS-DE $4,880.00 2.00 19.90 11.88 5.80Ralph Lauren Corp. Class A RL $8,540.00 1.35 18.70 7.77 2.40V.F. Corporation VFC $33,070.00 2.41 24.50 16.14 8.4Peer Averages $14,450.00 1.77 20.73 12.01 4.68
Source: FactSet
Ticker Revenues ROE ROA Debt/Equity Est. 5 Yr. NI GrowthOxford Industries OXM $1,022.60 15.30 8.60 24.33 60.20PVH Corp PVH $8,203.00 10.60 4.70 64.60 24.00HUGO BOSS AG BOSS-DE $3,297.00 29.60 14.50 28.90 -27.30Ralph Lauren Corp. Class A RL $6,653.00 2.30 1.30 24.40 -V.F. Corporation VFC $12,085.00 44.70 14.20 111.30 10.3Peer Averages $7,559.50 21.80 8.68 68.27 2.33
Source: FactSet
Name
Peer ComparablesName

Marquette University AIM Class 2018 and 2019 Equity Reports Spring 2018 Page 11
Green Dot Corp. (GDOT) February 16, 2018
John Wagner Domestic Financials Green Dot Corp. (GDOT) is a consumer financial technology company offering accessible and affordable financial services to primarily unbanked, underbanked, and unsatisfied groups, as well as Millennials. GDOT is currently the largest provider of reloadable prepaid debit cards and reloading services in the United States. They lead in mobile banking and technology through their GoBank mobile checking account, available online and via smartphone. GDOT is also the largest processor of tax disbursements in the United States, with more than 25,000 companies utilizing their services. GDOT operates through two main segments: Account Services, and Processing and Settlement Services. Account Services includes revenues from general purpose reloadable card accounts, checking accounts, private label cards, and gift cards. Processing and Settlement Services include reload service fees and tax refund processing fees. GDOT was founded by Steven W. Streit in 1999 and is headquartered in Pasadena, CA. Price ($): 55.87 Beta: 0.94 FY: Dec 12/31/2016 12/31/2017 12/31/2018 12/31/2019
Price Target ($): 69.37 M-Term Rev. Gr Rate Est: 10.0% Revenue (Mil) 718.77 892.89 1,045.09 1,149.60
52WK H-L ($): 65.88 - 26.13 M-Term EPS Gr Rate Est: 14.00% % Growth 3.47 24.22 17.05 10.00
Market Cap (mil): 2,839 Debt/Equity: 11.6 Oper Inc 60.96 89.88 115.92 133.35
Float (%) 89.7 Debt/EBITDA (ttm): 0.83 % Growth -16.98 47.44 28.98 15.04
Avg. Daily Vol (mil): 0.24 WACC 9.05% Op Margin 8.5 10.1 11.1 11.6
Yield (%): 0.0 ROA (%): 4.17 EPS $0.81 $1.60 $1.69 $1.94
ESG Rating BB ROE (%): 10.22 P/E (Cal) 29.4 34.9 33.1 28.7
ROIC (%): 9.25 EV/EBITDA 18.68 14.23 12.51 11.29 Recommendation Green Dot Corp. is the largest provider of reloadable debit cards with over 100,000 locations dispersed throughout retailers, neighborhood financial service center locations and tax preparation offices, as well as online and in app stores. Since rolling out their GoBank platform, GDOT has recently secured partnerships with companies such as Uber, Apple, and Intuit, representing a customer base of over 100 million users and potential incremental revenue of $70-100M. GDOT also has multi-year distribution arrangements with companies including Walmart, Walgreens, CVS, Rite Aid, 7-Eleven, Kroger, Kmart, and Dollar Tree. Through organic growth and acquisitions, such as UniRush LLC, long term user growth has increased to 15% this year, and many larger competitors have retrenched from the market unable to poach customers from Green Dot and others. As a result, competitive pricing has fallen, and fees have increased generating an organic revenue growth of 11%, outpacing the industry average of just 6%. Being a market leader outpacing industry growth, higher prices, and increased long term customer base, it is recommended that Green Dot Inc. be added to the AIM Equity Portfolio with a price target of $69.37 providing a near 18% upside potential. The firm does not pay a dividend. Investment Thesis
Contribution from New Partnerships. Green Dot has a growing list of enterprise-level programs such as Uber, Apple, Walmart, and Intuit. These partnerships stem from GDOT’s GoBank or Banking-as-a-Service (BaaS) mobile platform, offering product design, technological development, and ongoing program management. This platform not only generates transaction and interchange revenues but expands the addressable market to tech-savvy millennials and increases cross-sell potential for long term use. The recently announced Intuit deal is expected to reel in $20 million by 2018, based on a prior partnership in 2012 and comparable companies tax revenue/volume ratios. Apple Wallet users are expected to double to 86M by 1Q18, and with PayPal doing $100 billion in mobile volume yearly, there is a clear market for GDOT’s virtual P2P debit card. GDOT’s Walmart partnership accounts for 40% of 2017 revenue and has currently been extended to 2020 with increased monthly fees, creating higher margins.

Marquette University AIM Class 2018 and 2019 Equity Reports Spring 2018 Page 12
Acquisitive and Organic Growth with Increasing Margins. GDOT has exceeded top and bottom line forecasts for eight consecutive quarters, continuing to expand the business both organically and acquisitively. Organic growth has been 5.6%, 12%, and 12% YoY for 1Q17, 2Q17, and 3Q17, respectively. Active cards growth has been 28% (5% organic) YoY to 5.23 million, with another estimated 6-9% increase by 1Q18. Tax refunds processed currently have a 6% YoY growth rate. Additionally, TTM 2017 revenues have grown YoY 18.81%, while net margin expansion has increased YoY for the past five consecutive quarters. With new partnerships and a lowered effective tax rate, GDOT should be able to continue low double digit organic growth over the next couple of years.
Direct Deposit Growth. Based on historical quartely earnings, direct depositors have 5-6x the funds loaded on their cards and an estimated 4x the revenue, opposed to cash reloaders. This is attributed to both more consistent monthly membership fees, and more frequent interchange and transactional fees. However, GDOT’s customer base is only about 40% direct depositors with a 1-2% shift from cash to direct deposit quarterly. With the new partnerhips and acquisition of UniRush LLC, direct deposit penetration is at 15% growth this year If Green Dot can continue to convert more users to direct depositors, revenue should continue to increase at the 4x multiple.. Additionally, a reformed lower tax rate for users should help with tax refund deposit amounts and create a more consistent, active, direct depositing consumer base. With the help of partnerships, acquistions, and long-term users, direct deposit usage should continue to grow.
Valuation In order to reach an intrinsic value for GDOT, a five year DCF model was constructed. Using a terminal growth rate of 2.25% and a WACC of 9.05%, an intrinsic value of $69.57 was reached. A sensitivity analysis of ±1% the WACC and ±0.50% perpetual growth rate resulted in a price range of $57.44-88.50. Additionally, a weighted peer average P/E multiple valuation was calculated. Using a 2018E of EPS of $1.69 and P/E multiple of 34.8x, resulted in an intrinsic value of $58.71. Finally, a 5.87x P/B multiple approach was used, resulting in an intrinsic value of $79.46. By weighing these 60/20/20, a price target of $69.37 was reached, resulting in a 17.6% potential upside. GDOT does not pay a dividend. Risks
Failure to Retain Millennial Demographic. A large consumer segment necessary for the growth of GDOT relies on retention of Millennials. If GDOT cannot retain the business and growth of younger users, the price of the stock could be adversely impacted.
Competitive Business Environment. The prepaid financial services and tax refund services industry is a highly competitive market. Most retail stores that generate card revenue for GDOT also sell competitors cards. Prices, and therefore revenues, may vary depending on competitor’s prices. Sales and marketing expenses may also increase, affecting the growth of the company.
Outcome of Partnerships. In the case that GDOT’s new partnerships with Uber, Intuit, and Apple fail to reach expectations, margins and earnings could be adversely affected. A major contributor to the success of these partnerships depends on both marketing capabilities and Millennial usage. Walmart is also a large contributor to GDOT’s revenues. If the relationship between them and Walmart deteriorates, the share price could be affected.
Management Steven W. Streit is currently the President, Founder, and Chief Executive Officer at Green Dot Corp. Mr. Streit became President and Founder in 1999, then later CEO in 2001. William I. Jacobs was just named Chairman of the Board in 2016. Mr. Jacobs is also on the Board at LifeNexus, Inc., as well as President at Global Payments and WIJ & Associates.
Marquette University AIM Class 2018 and 2019 Equity Reports Spring 2018 Page 13
$20
$30
$40
$50
$60
$70Green Dot Corporation Class A - Price
80
100
120
140
160
180
200
220
240Green Dot Corporation Class A - Total Return Relative to Russell 2000
Feb Mar Apr May Jun Jul Aug Sep Oct Nov Dec Jan
0.00.2
0.4
0.6
0.81.0
1.2
1.4
1.6
1.8Green Dot Corporation Class A - Volume
TickerMarket
CapP/E P/B
EV/EBITDA
Div Yld
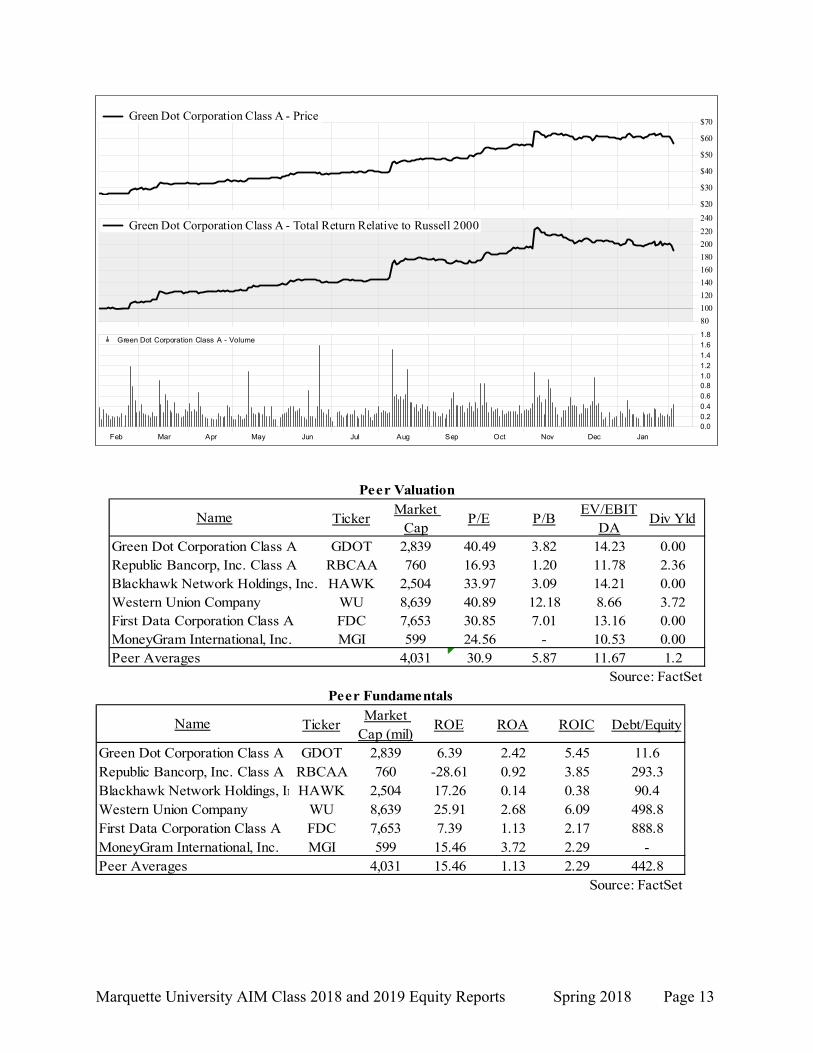
GDOT 2,839 40.49 3.82 14.23 0.00RBCAA 760 16.93 1.20 11.78 2.36HAWK 2,504 33.97 3.09 14.21 0.00
WU 8,639 40.89 12.18 8.66 3.72FDC 7,653 30.85 7.01 13.16 0.00MGI 599 24.56 - 10.53 0.00
Peer Averages 4,031 30.9 5.87 11.67 1.2Source: FactSet
MoneyGram International, Inc.First Data Corporation Class AWestern Union Company
Peer Valuation
Name
Green Dot Corporation Class ARepublic Bancorp, Inc. Class ABlackhawk Network Holdings, Inc.
TickerMarket
Cap (mil)ROE ROA ROIC Debt/Equity
GDOT 2,839 6.39 2.42 5.45 11.6RBCAA 760 -28.61 0.92 3.85 293.3HAWK 2,504 17.26 0.14 0.38 90.4
WU 8,639 25.91 2.68 6.09 498.8FDC 7,653 7.39 1.13 2.17 888.8MGI 599 15.46 3.72 2.29 -
Peer Averages 4,031 15.46 1.13 2.29 442.8Source: FactSet
First Data Corporation Class AMoneyGram International, Inc.
Peer Fundamentals
Name
Green Dot Corporation Class ARepublic Bancorp, Inc. Class ABlackhawk Network Holdings, InWestern Union Company
Marquette University AIM Class 2018 and 2019 Equity Reports Spring 2018 Page 14
Apogee Enterprises, Inc. (APOG) February 16, 2018
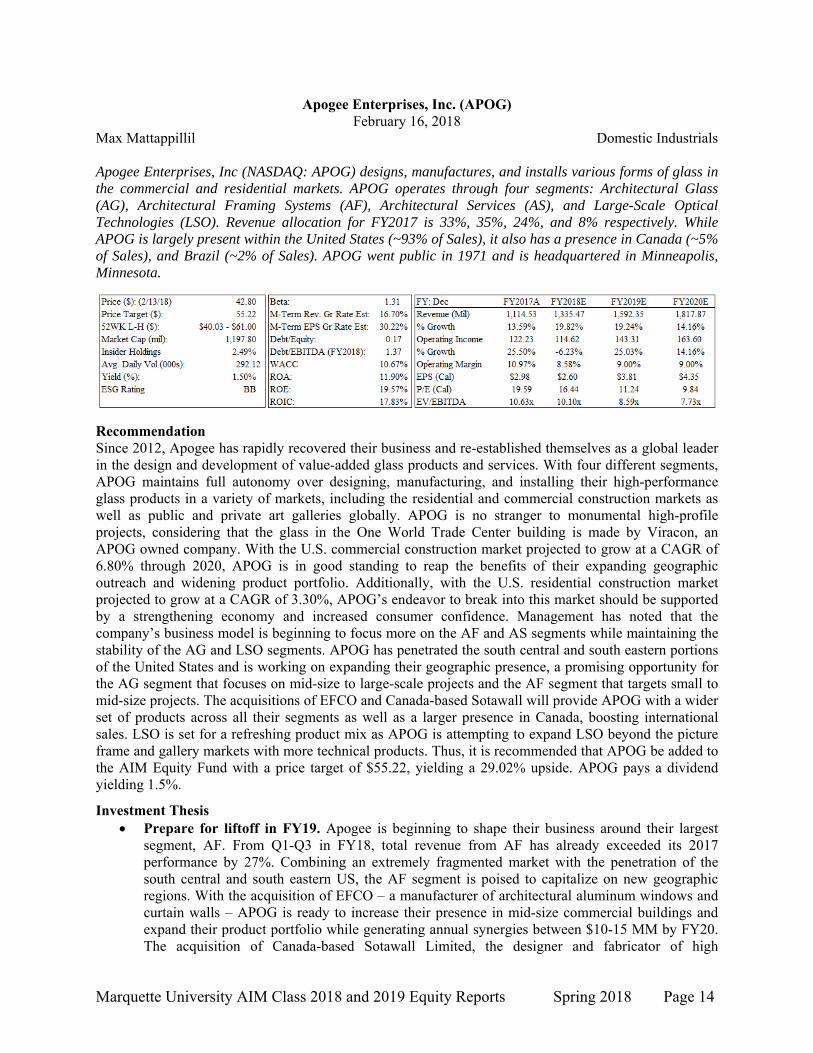
Max Mattappillil Domestic Industrials Apogee Enterprises, Inc (NASDAQ: APOG) designs, manufactures, and installs various forms of glass in the commercial and residential markets. APOG operates through four segments: Architectural Glass (AG), Architectural Framing Systems (AF), Architectural Services (AS), and Large-Scale Optical Technologies (LSO). Revenue allocation for FY2017 is 33%, 35%, 24%, and 8% respectively. While APOG is largely present within the United States (~93% of Sales), it also has a presence in Canada (~5% of Sales), and Brazil (~2% of Sales). APOG went public in 1971 and is headquartered in Minneapolis, Minnesota.
Recommendation Since 2012, Apogee has rapidly recovered their business and re-established themselves as a global leader in the design and development of value-added glass products and services. With four different segments, APOG maintains full autonomy over designing, manufacturing, and installing their high-performance glass products in a variety of markets, including the residential and commercial construction markets as well as public and private art galleries globally. APOG is no stranger to monumental high-profile projects, considering that the glass in the One World Trade Center building is made by Viracon, an APOG owned company. With the U.S. commercial construction market projected to grow at a CAGR of 6.80% through 2020, APOG is in good standing to reap the benefits of their expanding geographic outreach and widening product portfolio. Additionally, with the U.S. residential construction market projected to grow at a CAGR of 3.30%, APOG’s endeavor to break into this market should be supported by a strengthening economy and increased consumer confidence. Management has noted that the company’s business model is beginning to focus more on the AF and AS segments while maintaining the stability of the AG and LSO segments. APOG has penetrated the south central and south eastern portions of the United States and is working on expanding their geographic presence, a promising opportunity for the AG segment that focuses on mid-size to large-scale projects and the AF segment that targets small to mid-size projects. The acquisitions of EFCO and Canada-based Sotawall will provide APOG with a wider set of products across all their segments as well as a larger presence in Canada, boosting international sales. LSO is set for a refreshing product mix as APOG is attempting to expand LSO beyond the picture frame and gallery markets with more technical products. Thus, it is recommended that APOG be added to the AIM Equity Fund with a price target of $55.22, yielding a 29.02% upside. APOG pays a dividend yielding 1.5%.
Investment Thesis Prepare for liftoff in FY19. Apogee is beginning to shape their business around their largest
segment, AF. From Q1-Q3 in FY18, total revenue from AF has already exceeded its 2017 performance by 27%. Combining an extremely fragmented market with the penetration of the south central and south eastern US, the AF segment is poised to capitalize on new geographic regions. With the acquisition of EFCO – a manufacturer of architectural aluminum windows and curtain walls – APOG is ready to increase their presence in mid-size commercial buildings and expand their product portfolio while generating annual synergies between $10-15 MM by FY20. The acquisition of Canada-based Sotawall Limited, the designer and fabricator of high
Marquette University AIM Class 2018 and 2019 Equity Reports Spring 2018 Page 15
performance curtainwall systems, will help boost APOG’s international presence as well as contribute to companywide performance through FY20. The nature of APOG’s business model implies that the benefit provided to the AF segment can also help the AS and AG segments as APOG is fully independent in the installation and fabrication of their high-performance glass.
Backlog, backlog, backlog, APOG up to something. With $450MM and $350MM in backlog between the AF and AS segments respectively, APOG has already booked the lion’s share for FY19. Backlog between the two segments has grown by 83% and 35% respectively from the beginning of 2017. While management for any company tries to be as optimistic as possible, the impressive growth in backlog combined with recent acquisitions stated above and management’s guidance for near record results in the AS segment for FY19 is indicative of Apogee’s continued presence as a global leader in providing value-added glass products and services.
Entering new markets requires stabilization. APOG has received increased interest in the non-residential and high-end multi-family residential building sectors towards upgrading facades and improving energy efficiency. A new opportunity for APOG, the stability of AG should help smooth the initial bumps that arise from entering a new market. While LSO represents roughly 10% of the business, it also holds the largest domestically manufactured brand of value-added glass and acrylic for picture frames and regularly supplies products to public and private galleries globally. With operating margins in the mid 20s and a focus on developing more technical products beyond glass in picture frames, LSO provides APOG with the flexibility to take innovate leaps that may find its way into AG, AF, and AS with relatively low risk.
Valuation In order to reach an intrinsic value for APOG, a five year sum-of-the-parts model was constructed. Using a terminal growth rate of 2.50% for the Architectural Framing and Services segments, a terminal growth rate of 2.00% for the Architectural Glass and Large Scale Optical segments, and a WACC of 10.67%, an intrinsic value of $52.28 was reached. Additionally, an EV/EBITDA multiple valuation was conducted using APOG’s revenue weighted peer average of 10.27x and APOG’s FY2019E EBITDA of $198.39M, resulting in a valuation of $64.03. Weighing the DCF and EV/EBITDA multiple models 75/25, a price target of $55.22 was reached, yielding a 29.02% upside. APOG pays a dividend that has increased YoY for the past 6 years, currently yielding 1.5%.
Risks Glass is cyclical, not stable. While management has noted that they are trying to smooth revenue
streams in order to reduce cyclicality, the nature of the construction industry means that APOG is highly dependent on a growing economy. Although the nature of APOG’s contracts cause the company to feel the effects of a contracting economy close to 8 months after it occurs, an economic downturn will severely impact APOG more so than other companies.
Watch out for those raw materials. APOG uses a significant portion of raw aluminum and glass. A sudden price movement in aluminum could adversely affect short term operations and potentially affect long-term operations given the severity of the price movement. APOG secures its supply of raw glass from multiple suppliers, but an unforeseen hiccup in the supply chain could impact APOG’s performance greatly.
With great power comes great responsibility. APOG uses some hazardous chemicals in their production processes requiring a variety of regulations at the local, state, and federal levels. These chemicals relate to storage, discharge, handling, and disposal, all of which require some form of compliance. Should APOG create more products with hazardous chemicals and are subjects to increased regulation, manufacturing costs can increase and pressure top and bottom line growth.
Management Joseph F. Puishys has been CEO since 2011 and has more than 35 years of experience in the manufacturing business. Prior, Mr. Puishys served as president of Honeywell’s Environmental and Combustion Controls division. James S. Porter has been CFO of Apogee since 2005.

Marquette University AIM Class 2018 and 2019 Equity Reports Spring 2018 Page 16
30
35
40
45
50
55
60
65Apogee Enterprises, Inc. - Price
70
75
80
85
90
95
100
105
110
115
120
75.39
Apogee Enterprises, Inc. - Price Relative to Russell 2000
4/16 7/16 10/16 1/17 4/17 7/17 10/17 1/18
0.0
0.5
1.0
1.5
2.0
2.5
3.0
0.15
Apogee Enterprises, Inc. - Volume
Marquette University AIM Class 2018 and 2019 Equity Reports Spring 2018 Page 17
Accenture Plc (ACN) February 16, 2018
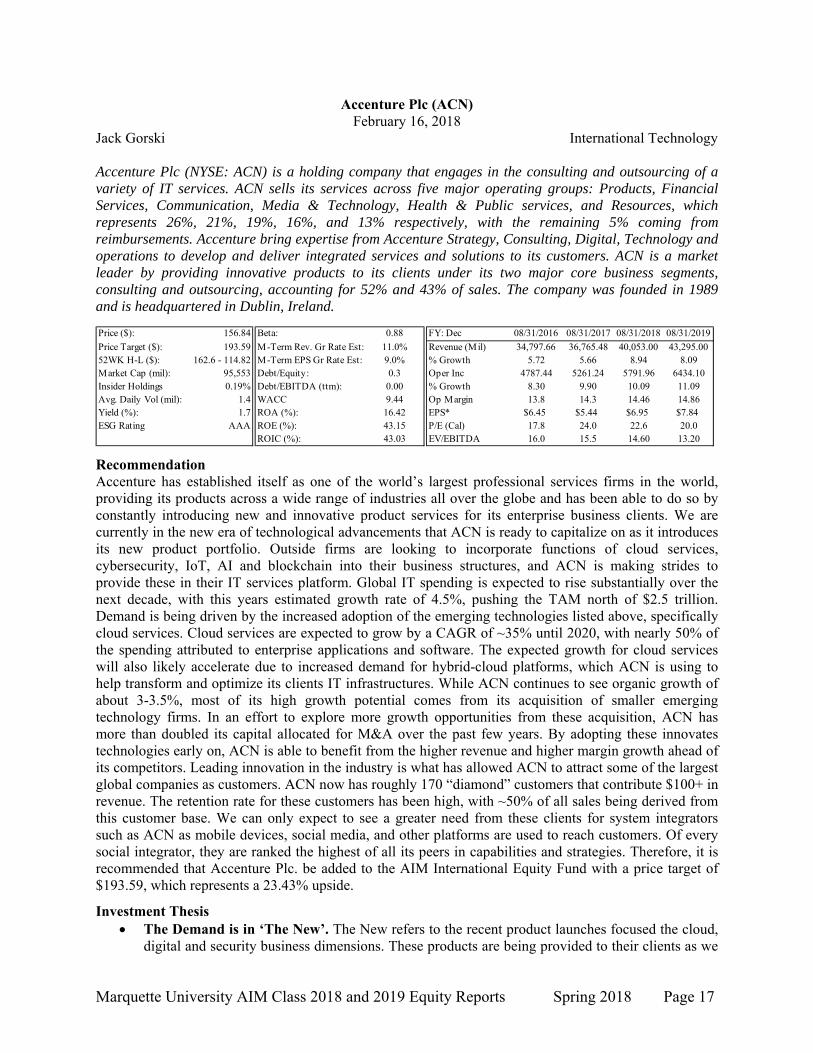
Jack Gorski International Technology Accenture Plc (NYSE: ACN) is a holding company that engages in the consulting and outsourcing of a variety of IT services. ACN sells its services across five major operating groups: Products, Financial Services, Communication, Media & Technology, Health & Public services, and Resources, which represents 26%, 21%, 19%, 16%, and 13% respectively, with the remaining 5% coming from reimbursements. Accenture bring expertise from Accenture Strategy, Consulting, Digital, Technology and operations to develop and deliver integrated services and solutions to its customers. ACN is a market leader by providing innovative products to its clients under its two major core business segments, consulting and outsourcing, accounting for 52% and 43% of sales. The company was founded in 1989 and is headquartered in Dublin, Ireland.
Recommendation Accenture has established itself as one of the world’s largest professional services firms in the world, providing its products across a wide range of industries all over the globe and has been able to do so by constantly introducing new and innovative product services for its enterprise business clients. We are currently in the new era of technological advancements that ACN is ready to capitalize on as it introduces its new product portfolio. Outside firms are looking to incorporate functions of cloud services, cybersecurity, IoT, AI and blockchain into their business structures, and ACN is making strides to provide these in their IT services platform. Global IT spending is expected to rise substantially over the next decade, with this years estimated growth rate of 4.5%, pushing the TAM north of $2.5 trillion. Demand is being driven by the increased adoption of the emerging technologies listed above, specifically cloud services. Cloud services are expected to grow by a CAGR of ~35% until 2020, with nearly 50% of the spending attributed to enterprise applications and software. The expected growth for cloud services will also likely accelerate due to increased demand for hybrid-cloud platforms, which ACN is using to help transform and optimize its clients IT infrastructures. While ACN continues to see organic growth of about 3-3.5%, most of its high growth potential comes from its acquisition of smaller emerging technology firms. In an effort to explore more growth opportunities from these acquisition, ACN has more than doubled its capital allocated for M&A over the past few years. By adopting these innovates technologies early on, ACN is able to benefit from the higher revenue and higher margin growth ahead of its competitors. Leading innovation in the industry is what has allowed ACN to attract some of the largest global companies as customers. ACN now has roughly 170 “diamond” customers that contribute $100+ in revenue. The retention rate for these customers has been high, with ~50% of all sales being derived from this customer base. We can only expect to see a greater need from these clients for system integrators such as ACN as mobile devices, social media, and other platforms are used to reach customers. Of every social integrator, they are ranked the highest of all its peers in capabilities and strategies. Therefore, it is recommended that Accenture Plc. be added to the AIM International Equity Fund with a price target of $193.59, which represents a 23.43% upside.
Investment Thesis The Demand is in ‘The New’. The New refers to the recent product launches focused the cloud,
digital and security business dimensions. These products are being provided to their clients as we
Price ($): 156.84 Beta: 0.88 FY: Dec 08/31/2016 08/31/2017 08/31/2018 08/31/2019
Price Target ($): 193.59 M-Term Rev. Gr Rate Est: 11.0% Revenue (Mil) 34,797.66 36,765.48 40,053.00 43,295.0052WK H-L ($): 162.6 - 114.82 M-Term EPS Gr Rate Est: 9.0% % Growth 5.72 5.66 8.94 8.09Market Cap (mil): 95,553 Debt/Equity: 0.3 Oper Inc 4787.44 5261.24 5791.96 6434.10Insider Holdings 0.19% Debt/EBITDA (ttm): 0.00 % Growth 8.30 9.90 10.09 11.09Avg. Daily Vol (mil): 1.4 WACC 9.44 Op Margin 13.8 14.3 14.46 14.86Yield (%): 1.7 ROA (%): 16.42 EPS* $6.45 $5.44 $6.95 $7.84ESG Rating AAA ROE (%): 43.15 P/E (Cal) 17.8 24.0 22.6 20.0
ROIC (%): 43.03 EV/EBITDA 16.0 15.5 14.60 13.20
Marquette University AIM Class 2018 and 2019 Equity Reports Spring 2018 Page 18
see the full effects of technological innovations of the cloud, IoT, AI and blockchain. Businesses are looking to incorporate these new technologies into their infrastructure to help scale their business at accelerated rates. With cloud based services expecting to grow by a CAGR of ~35% until 2020, reaching a TAM estimated at nearly $300 billion, ACN can expect to see strong revenue growth as their clients continue to adopt more of their Consulting, Digital, and Technology services.
Improving Margin Mix. ACN provides its services to several different operating groups, which all hold their own operating margins, based on the necessary service requirements. The three fastest growing op. group segments, Products, Financial Services, and Com., Media, & Tech, also have the highest margins, which are continuing to grow. As these segments’ revenue growth surpasses that of Health & Public Service and Resources, ACN is able to develop a better operating margin mix. These segments are expected to have double digit revenue growth and improve the full business operating margin by ~250 bps.
Acquisitions Grow Market Share. ACN has managed to stay ahead of the curve by adopting emerging technologies at low costs and by implementing them into their product portfolio. Management has shown to be successful in anticipating future capabilities and demand for these technologies, and thus, focuses their acquisitions accordingly. The increase in committed capital for M&A is expected to drive market share growth as innovative differentiation from its peers attracts new clients.
Valuation To reach and intrinsic value for ACN, a core segment weighted P/E and EV/EBITDA relative valuation was conducted. A peer average P/E multiple of 24.0x multiple was used, resulting in an valution of $201.03. A peer average EV/EBITDA multiple of 20.3x was used to produce a price target of $232.03. Finally, a DCF model was constructed, utilizing a WACC of 9.94% and a perpetuity growth rate of 2.50% to reach an intrinsic value of $147.71. A sensitivity analysis for the DCF was evaluted using a ±2% WACC and ± 30 bps terminal growth rate, resulting in a price range of $124.32 - $211.65. Weighting the three techniques equally, a final value of $193.59 was reached, representing an upside of 23.43%.
Risks Consolidation Leads to Fiercer Competition. ACN provides its services in a highly competitive
market, against several other large players. Acquisitions have been common in this space in order to expand markets share, penetrate new markets, and solidify existing position. As the market continues to consolidate, the competition for both ACN’s IT consulting and outsourcing business will become much harsher, leading to further pricing pressure.
Technology is Changing. The company’s core business depends on their ability to keep up with technological changes and deliver new products that are valuable to their clients. Failing to provide innovative products will make their services obsolete to their customers. ACN will need to continue to invest heavily in R&D and M&A ensure they remain a leading innovative within the industry.
Cybersecurity and Data Breaches. ACN offers cybersecurity products, which are used by other third party business to protect important, confidential data. This sensitive data is often targeted by hackers and other malicious entities, which could lead to data breaches that undermine the service. ACN has experienced data breaches such as this in the past that have resulted in settlement loses. ACN will have to ensure the preeminence of their product to prevent any further loses.
Management Pierre Nanterme has served as the CEO of Accenture since 2007 but has been with the company for 34 years. Prior he served as the Chief Leadership Officer, country managing director for France, and several other positions. The CFO is David Rowland, who has held the position since 2013. Before he served as the SVP of Finance.

Marquette University AIM Class 2018 and 2019 Equity Reports Spring 2018 Page 19
Source: FactSet
Peer Valuation
Peer Fundamentals
Ticker Revenues ROE ROA Debt/EquityEst 5 yr NI
growthACN 36,765 43.1 16.4 0.3 5.9TCS 17,592 33.4 27.3 0.3 12IBM 79,139 32.1 4.7 266.1 -8SAP 26,463 15.7 9.4 25.9 8
CGEMY 20,704 14.1 10.2 8.2 18INFO 10,213 22.0 18.0 0.0 11.7
Peer Averages 35,974 23.8 12.9 75.1 7.2Source: FactSet
Name
Accenture Plc Class ATata Consulting Services LimitedInternational Business Machines CorporationSAP SE Sponsored ADR
Infosys LimitedCapgemini SE Unsponsored ADR

Marquette University AIM Class 2018 and 2019 Equity Reports Spring 2018 Page 20
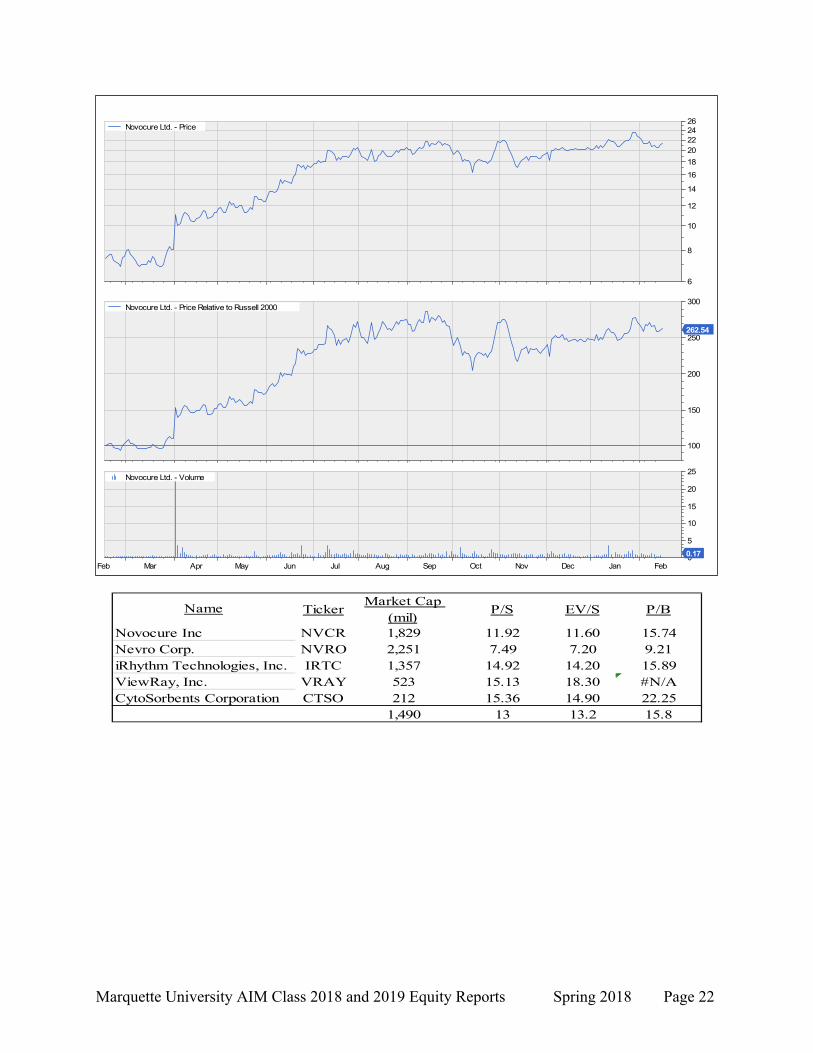
Novocure Limited (NVCR) February 12, 2018
Nicholas Longo International Healthcare Novocure Ltd. (NASDAQ:NVCR) is an oncology company focused on the research, development, and distribution of a novel, device-based treatment modality for solid tumor-cancers known as Tumor Treatment Fields (TTF). TTF uses electrical field arrays to suspend malignant cell replication, without inducing the severe side effects radiation or chemotherapy. Their current product, now in its second generation, is branded as Optune and has entered the market in the US, EU, Switzerland, Israel, and Japan following regulatory approvals. Optune is proven to extend survival in recurrent and newly diagnosed brain cancer. Late-stage research is underway for the applicability of TTF treatment in metastatic brain, lung, pancreatic, and ovarian cancers, with phase 3 data and final FDA approval expected for some of these indications in the next 5 years. Novocure went public in Q3 2015 and is headquartered in Jersey Isle with operations and research offices located across the globe.
Price ($): 21.05 Beta: 1.24 FY: Dec 12/31/2015 12/31/2016 12/31/2017 12/31/2018
Price Target ($): 26.44 M-Term Rev. Gr Rate Est: 46.1% Revenue (Mil) 33.09 82.89 177.00 285.0352WK H-L ($): 24.15 - 6.75 M-Term EPS Gr Rate Est: 60.0% % Growth 113.60 150.52 113.50 61.00Market Cap (mil): 1,874 Debt/Equity: 83.2 Oper Inc -103.96 -108.91 -94.61 -30.24Insider Holdings 14.41 Debt/EBITDA (ttm): #N/A % Growth -29.70 -4.76 13.00 68.00Avg. Daily Vol (mil): 0.6 WACC 12.00 Op Margin -314.2 -131.4 -80.86 -10.61Yield (%): 0.0 ROA (%): -26.34 EPS* -3.62 -1.46 -1.27 -1.41ESG Rating BB ROE (%): -53.02 P/E (Cal) N/A N/A N/A N/A
ROIC (%): -31.15 EV/EBITDA N/A N/A N/A N/A
Recommendation Since 2015, Novocure’s innovative, effective, treatment platform has slowly been embraced by regulators, physicians, and insurers. Shortly after NVCR’s IPO, Optune was cleared for US use in newly diagnosed GBM, which significantly expanded its TAM beyond the relatively limited scope of recurrent GBM, the clinical indication it was originally cleared for in late 2012. This milestone, subsequent approvals throughout Europe and Japan, and the rapid growth in Optune-trained practitioners globally were indicative of growing medical community trust and interest in the technology. Until last year, Optune sales remained disappointing, primarily due to private insurance payers in the US expressing skepticism towards Optune’s therapeutic value, and refusing to guarantee coverage. While Optune remains expensive at $21,000 per month, end-of-year reviews of coverage by major private insurers resulted in a cascade of positive coverage rulings throughout 2016. As a result, 90% of privately insured Americans are now covered for Optune use. Similar judgements by public health systems in Europe and Japan have also been boons to NVCR’s commercial development. As an entirely new and peerless technology, TTF/Optune’s opportunities for expansion remain underappreciated by the market, making this current commercialization phase (incremental growth before 2020-2024 PMA approvals) an ideal entry point. In the years before the next round of PMA submissions, NVCR can take advantage of commercialization and reimbursement tailwinds to outperform its sector. Due to strong patient growth with significant market penetration to come, NVCR is recommended for purchase with a 25.6% upside.
Investment Thesis Growing Commercial Acceptance The medical community has been impressed with Optune’s
clinically significant efficacy, which can often extend beyond the <1 year extension of life many patients are granted. Patients on Optune saw 160% increases in 5-year survival rates, an unprecedented clinical success (albeit for a minority of users). Optune works about as well as chemo or radiation, is used alongside chemo, and has almost no severe side effects. NVCR has now liaised with hundreds of doctors, making Optune available at over 960 treatment centers globally. They have experienced ten straight quarters of active patient growth, alongside 61% YoY prescription growth for the most recent quarter. Optune’s penetration of the total GBM market is only around 11%, far below what would be considered an already mature product.
Marquette University AIM Class 2018 and 2019 Equity Reports Spring 2018 Page 21
Potential for Future Approvals is Misunderstood Major sell side firms completely omit future revenue from NVCR’s phase 2 and 3 research applying Optune to pancreatic cancer, ovarian cancer, and NSCLC. 2015 FDA device approvals hit a record 98%, making complete omission unreasonably bearish. To reconcile this with the understanding that Optune is relatively new, all revenue from future clinical segments were probability-weighted (conservatively) by 50%. The available pharmokinetic evidence suggests to me that efficacy and safety of Optune can be replicated in new disease types. Optune’s mechanism of action functions on a more generalizable level of efficacy than any drug by physically arresting mitosis with TTF. The proteins driving mitosis follow similarly in nearly all organs, and there is little question that Optune will help treat cancer progression in the other solid-tumors. There is only a question of magnitude, safety, and device portability, which appear to improve regularly. Conservative sales estimates were used to address commercialization risks for phase 2 and 3 development programs.
Reimbursement Tailwind Shortly after launch, Optune for newly-diagnosed GBM was added to Aetna’s coverage list, while other major health accepted Optune at various points throughout 2016 and early 2017. The delay in coverage (attributable to the high prescription costs) hurt sales in 2016, but as of 2Q17 204M privately insured Americans are covered. Medicare covers Optune on a case by case basis, though public health plans in international markets have elected to cover the treatment. The reimbursement/coverage foundation needed for Optune sales to mature is now in place, and there exists a precedent for coverage that could help prevent future delays in coverage (and therefore sales growth) when Optune is approved in additional clinical indications.
Valuation A ten year DCF model was constructed. Using a terminal growth rate of 2.00% and a WACC of 12%, a base-case intrinsic value of $33.17 was reached. Bear-case DCF yielded $19.55, suggesting strong downside protection at the current price. Peer EV/S valuation puts the stock at $26.25 By weighting these potential outcomes 60/20/10. A consevative price target for this company is $26.24, representing a 25.6% upside over the current price.
Risks Clinical Trial Failure FDA device approvals are near record highs and NVCR’s technology has
been approved previously, but there is no guarantee that the FDA will interpret future clinical results similarly. While the likelihood of failure on safety concerns seems extraordinarily minimal compared to investigational biologic or drug treatments, it is possible that the efficacy of TTF demonstrated in GBM will not translate to clinically significant efficacy in other indications. And while the FDA has given the benefit of the doubt to promising but controversial treatments, this could change, increasing the risk of rejection should future data suggest poor efficacy.
Reversal of Insurance Coverage in New Indications: Positive reception and approval of new clinical uses by regulators and scientists does not guarantee complete or any coverage of Optune in any geography. While history suggests the most insurers will cover future TTF systems, they may decline to should clinical data on future products be less convincing. This could severely limit Optune prescriptions.
Negative SG&A Dynamics as Hiring Grows: As NVCR grows and receives new approvals, they will need to hire many more employees to sell and service its devices, and instruct the patients and doctors who operate them. Support employees have complained (understandably) about poor pay, and to fill more of these positions globally will likely require material increases in pay which could consistently hold back operating margin expansion. Liberal base pay estimates were made for these new employees in my model.
Management NVCR was founded by Yoram Palti, an Israeli biophysicist who has served as CTO for 17 years. CEO Asaf Danziger has been CEO since 2002. Chairman William F. Doyle joined the firm in 2009. One development was this year’s departure of COO Peter Melynk..
Marquette University AIM Class 2018 and 2019 Equity Reports Spring 2018 Page 22
6
8
10
12
14
16
18
20222426
Novocure Ltd. - Price
100
150
200
250
300
262.54
Novocure Ltd. - Price Relative to Russell 2000
Feb Mar Apr May Jun Jul Aug Sep Oct Nov Dec Jan Feb0
5
10
15
20
25
0.17
Novocure Ltd. - Volume
TickerMarket Cap
(mil)P/S EV/S P/B
NVCR 1,829 11.92 11.60 15.74NVRO 2,251 7.49 7.20 9.21IRTC 1,357 14.92 14.20 15.89
VRAY 523 15.13 18.30 #N/ACTSO 212 15.36 14.90 22.25
1,490 13 13.2 15.8CytoSorbents Corporation
Novocure IncNevro Corp.iRhythm Technologies, Inc.ViewRay, Inc.
Name