applied statistical methods - question & answer on spss
TRANSCRIPT

[email protected] & [email protected]ökhan AYRANCIOGLU | a50236
Estela Vilhena
Statistical Package for the Social SciencesSPSS
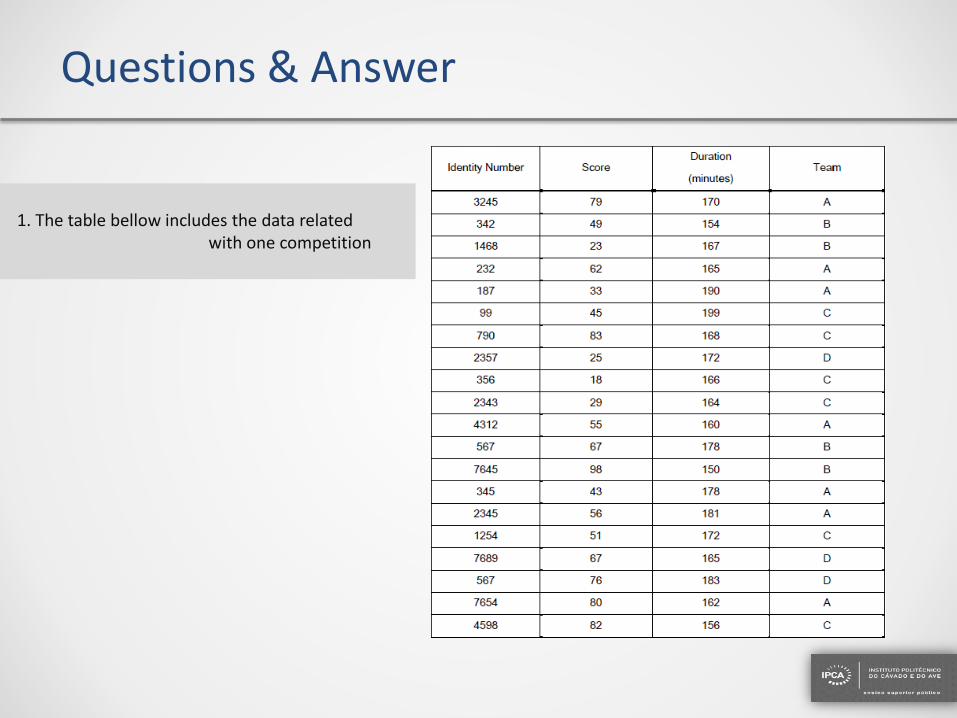
Questions & Answer
1. The table bellow includes the data related with one competition

Applied Statistical Methods
1.1 Insert the data in one SPSS file and save it with the name Grupo4. (Codify accordingly the variables that you find necessary).

Applied Statistical Methods
1.2 Obtain one plot and one table of frequencies for the variable Team.
Scatter Plot


Applied Statistical Methods
Table of frequencies for the variable Team.
Frequency : Contains the raw number results for how many people of team.

Applied Statistical Methods
has greater percentage of individual.
• The «Percent» column represents the percentage of all cases, including the missing cases, constituted by each category
• «Valid Percent» category presents the percentage of only the non-missing cases falling into each category.
• The «cumulative percent», expresses an ongoing sum of the valid percents.
Applied Statistical Methods
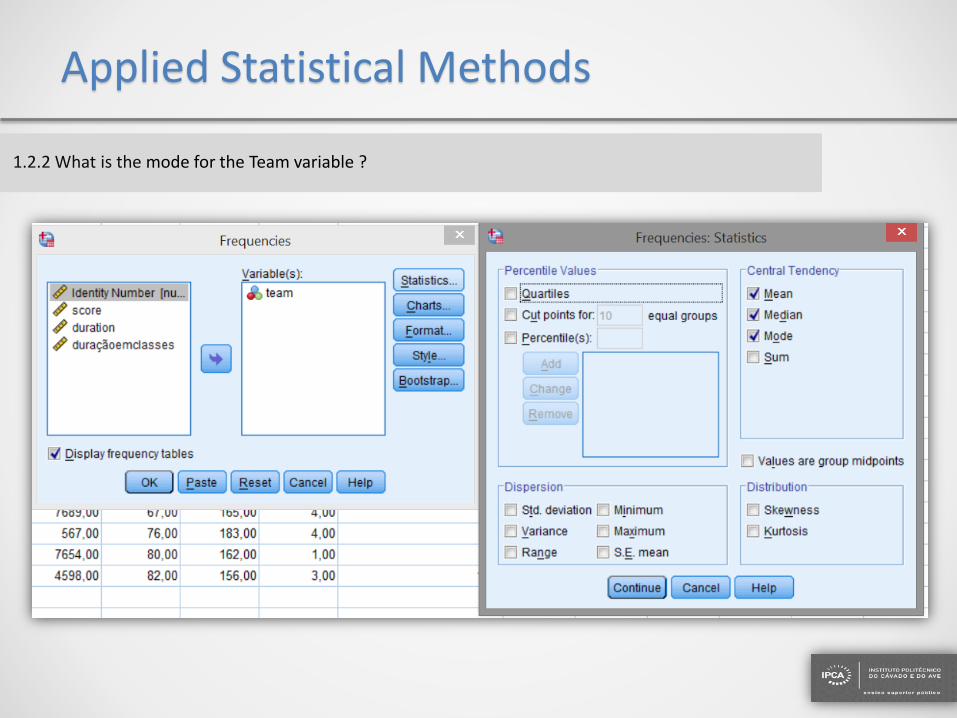
1.2.2 What is the mode for the Team variable ?
Applied Statistical Methods
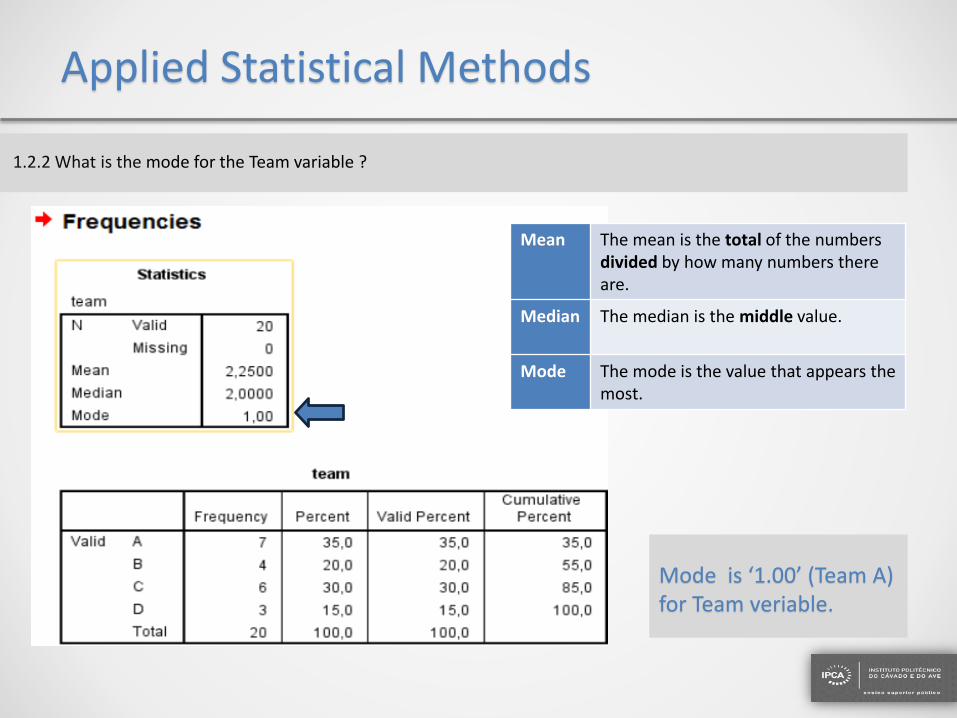
1.2.2 What is the mode for the Team variable ?
Mode is ‘1.00’ (Team A) for Team veriable.
Mean The mean is the total of the numbers divided by how many numbers there are.
Median The median is the middle value.
Mode The mode is the value that appears the most.

Applied Statistical Methods
1.2.3 What is the frequency of the individuals from Team D ?
Team D
Frequency Percent Valid Percent Cumulative Percent
3 15,0 15,0 100,00

Applied Statistical Methods
1.3. Characterize the game score, calculating the value of the central tendency measurements. Interpret the results in the context of the problem . What is the standard deviation? Get also a histogram for the variable in question.

Applied Statistical Methods
You can see groupings of various types of statistics like central tendency and dispersion.
Standard deviation is a measure of the spread of data around the mean value.
Applied Statistical Methods
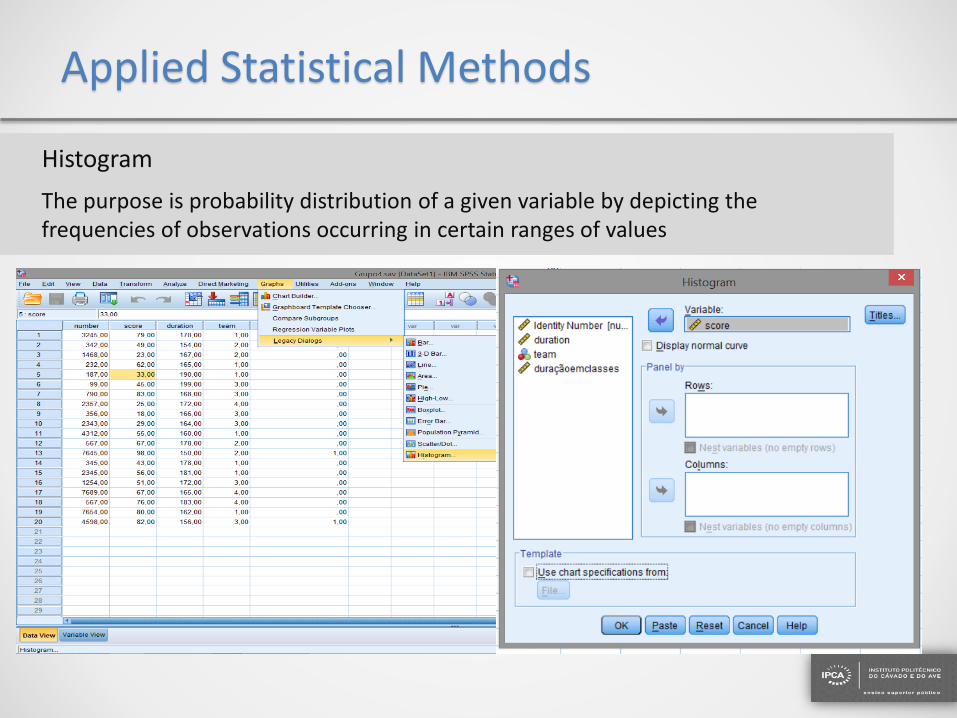
Histogram
The purpose is probability distribution of a given variable by depicting the frequencies of observations occurring in certain ranges of values

Applied Statistical Methods
Histogram for Score veriable

Applied Statistical Methods
1.4 Create in the way that you find more adequate , a new variable, ‘duraçãoemclasses’, based on the variable duration of the game,
Creatinig the follow in groups:
[150, 160 [, [ 160, 170[, [170, 180[, [ 180, 190[ e [ 19 0, 20 0[.

Applied Statistical Methods
Creatinig the follow in groups: [150, 160 [, [ 160, 170[, [170, 180[, [ 180, 190[ e [ 19 0, 20 0[.

Applied Statistical Methods
1.4 Create in the way that you find more adequate , a new variable, ‘duraçãoemclasses’, based on the variable duration of the game,
Creatinig the follow in groups:
[150, 160 [, [ 160, 170[, [170, 180[, [ 180, 190[ e [ 19 0, 20 0[.

Applied Statistical Methods
1.4.1 . Build a table of frequencies and indicate the number of gameswith duration smaller than 180 minutes ?
Indicate The number of games with duration smaller than 180 minutes :

Applied Statistical Methods
1.4.2 What is the percentage o f mess with the duration equal or higher than 160, but lower than 190 minutes?
The percentage of mess with the duration equal or higher than 160, but lower than
190 minutes :

Applied Statistical Methods
2. The file "Inqueritos.sav" contains 200 observations related to tests performed to students from higher education .

Applied Statistical Methods
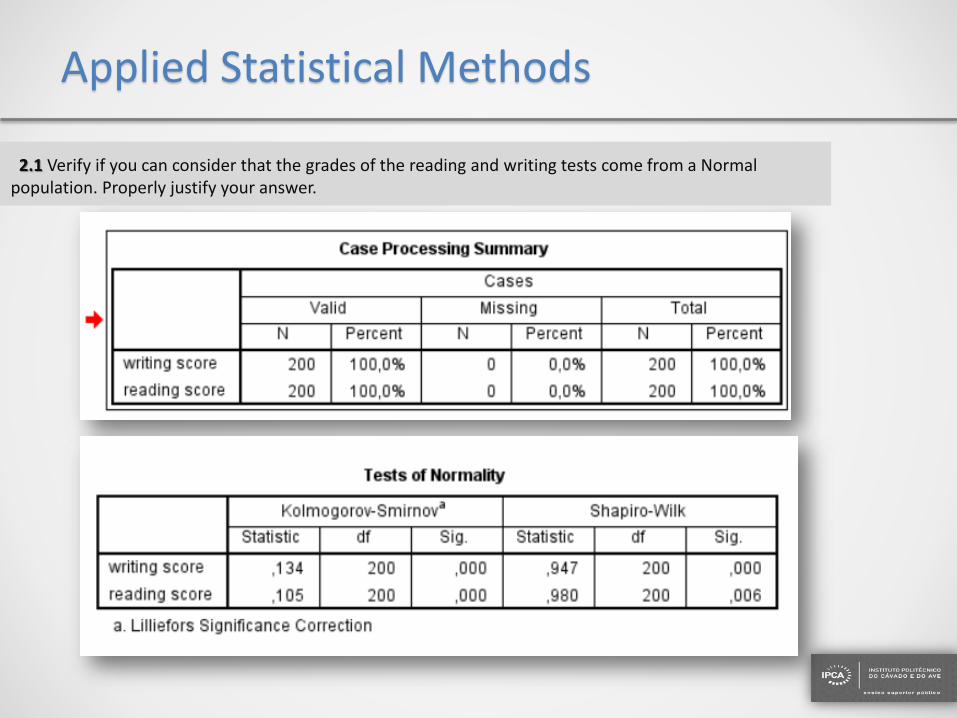
2.1 Verify if you can consider that the grades of the reading and writing tests come from a Normal population. Properly justify your answer.

Applied Statistical Methods
2.1 Verify if you can consider that the grades of the reading and writing tests come from a Normal population. Properly justify your answer.
Applied Statistical Methods
2.1 Verify if you can consider that the grades of the reading and writing tests come from a Normal population. Properly justify your answer.

Applied Statistical Methods
Descriptives for writing score and
reading score

Applied Statistical Methods
Description
This is a sample text here. Insert your desired text
here. This is a sample text.

Applied Statistical Methods
2.1 Perform a hypothesis test in order to as certain whether there is sufficient evidence to consider that the math average grade in the population is ignificantly different from 50, at a significance level of 5 %.
One sample t-test is a statistical procedure often performed for testing the mean value of a distribution.

2.1 Perform a hypothesis test in order to as certain whether there is sufficient evidence to consider that the math average grade in the population is ignificantly different from 50, at a significance level of 5 %.

Applied Statistical Methods
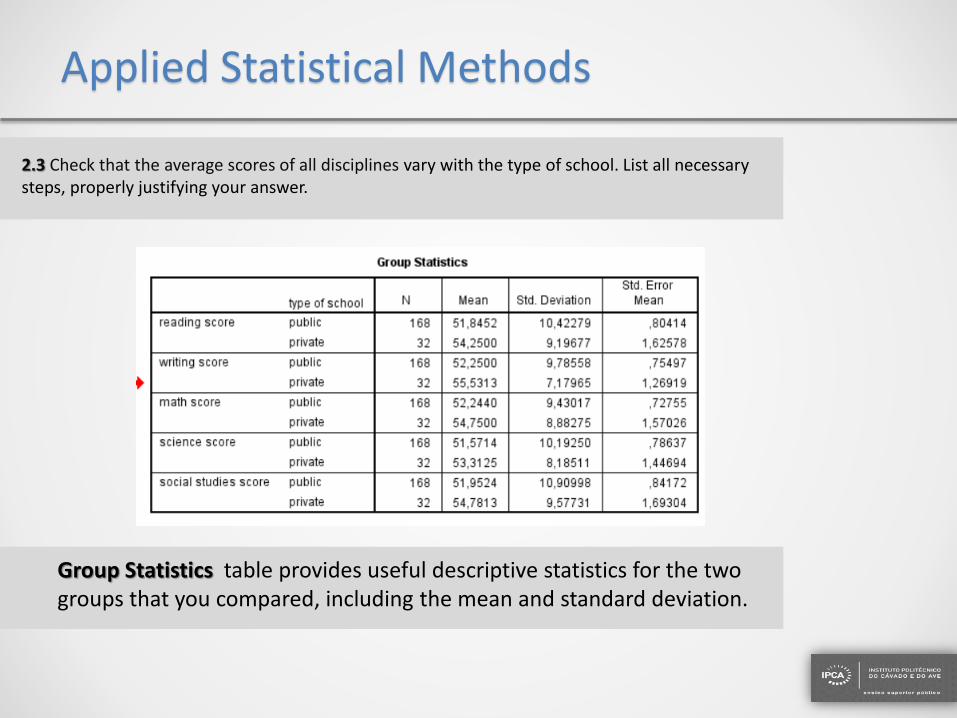
2.3 Check that the average scores of all disciplines vary with the type of school. List all necessary steps, properly justifying your answer.
The independent-samples t-test (or independent t-test, for short) compares the means between two unrelated groups on the same continuous, dependent variable.
Applied Statistical Methods
2.3 Check that the average scores of all disciplines vary with the type of school. List all necessary steps, properly justifying your answer.
Group Statistics table provides useful descriptive statistics for the two groups that you compared, including the mean and standard deviation.

Applied Statistical Methods
Independent Samples Test TableThis table provides the actual results from the independent t-test.

Applied Statistical Methods
2.4 Create a variable that reflects the average of the grades obtained in all tests, justifying your answer.

Applied Statistical Methods
3 . A and B are supplyers from an article to a processor company, that stores them in a container. It is known that 5% of the articles of A and 9% of items of B are defective, which is why the articles supplyedfrom company A are four times the articles suplyed by company B. It was chosen at random one of the articles of the container.
A useful way of investigating probability problems is to use what are known as tree diagrams. Tree iagramsare a useful way of mapping out all possible outcomes for a given scenario. They are widely used in probability and are often referred to as probability trees. They are also used in decision analysis where they are referred to as decision trees. In the context of decision theory a complex series of choices are available with various different outcomes and we are looking for the bets of these under a given performance criterion such as maximising profit or minimising cost.
Tree Diagrams
References : Glasgow Caledonian University

Applied Statistical Methods
3.1 What is the probability that the article is defective?
References : Glasgow Caledonian University

Applied Statistical Methods
References : Glasgow Caledonian University
3.2 Knowing that the article is defective, what is the probability of being supplied by company A?

Applied Statistical Methods
5. Certain company, dedicated to the commercialization and repair of computers expressed an interest in studyingthe relationship between the duration of a repair service and the number of electronic components to be repairedor replaced on a computer. This company has been registering computer repair times (in minutes) and the respective number of failed components. The obtained data collection is in repararxls.


Applied Statistical Methods
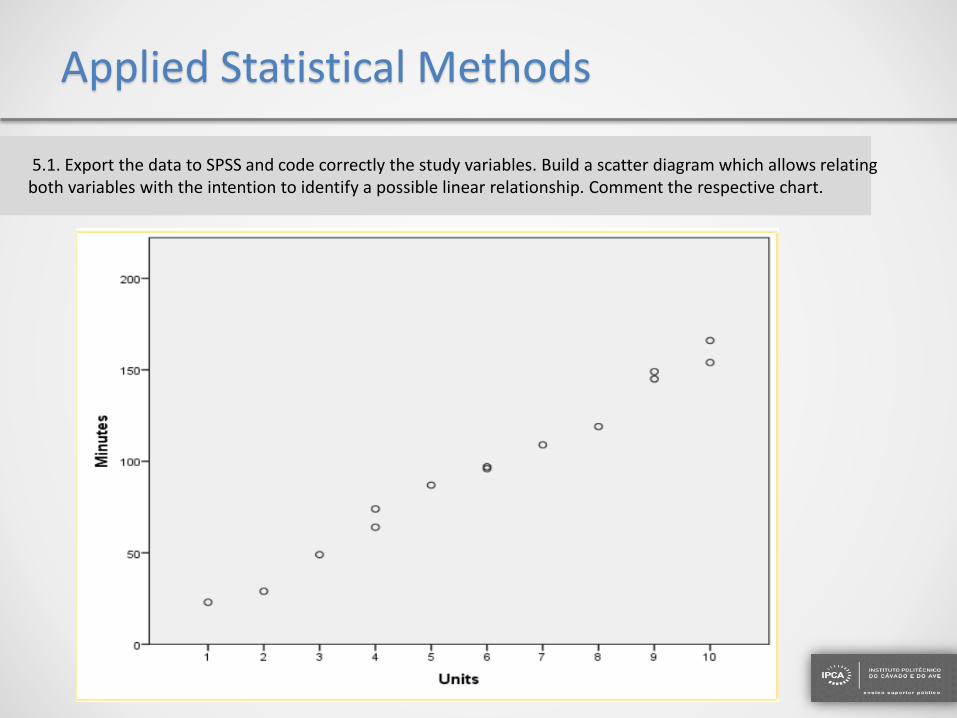
5.1. Export the data to SPSS and code correctly the study variables. Build a scatter diagram which allows relatingboth variables with the intention to identify a possible linear relationship. Comment the respective chart.

5.1. Export the data to SPSS and code correctly the study variables. Build a scatter diagram which allows relatingboth variables with the intention to identify a possible linear relationship. Comment the respective chart.
Applied Statistical Methods
5.1. Export the data to SPSS and code correctly the study variables. Build a scatter diagram which allows relatingboth variables with the intention to identify a possible linear relationship. Comment the respective chart.

Applied Statistical Methods
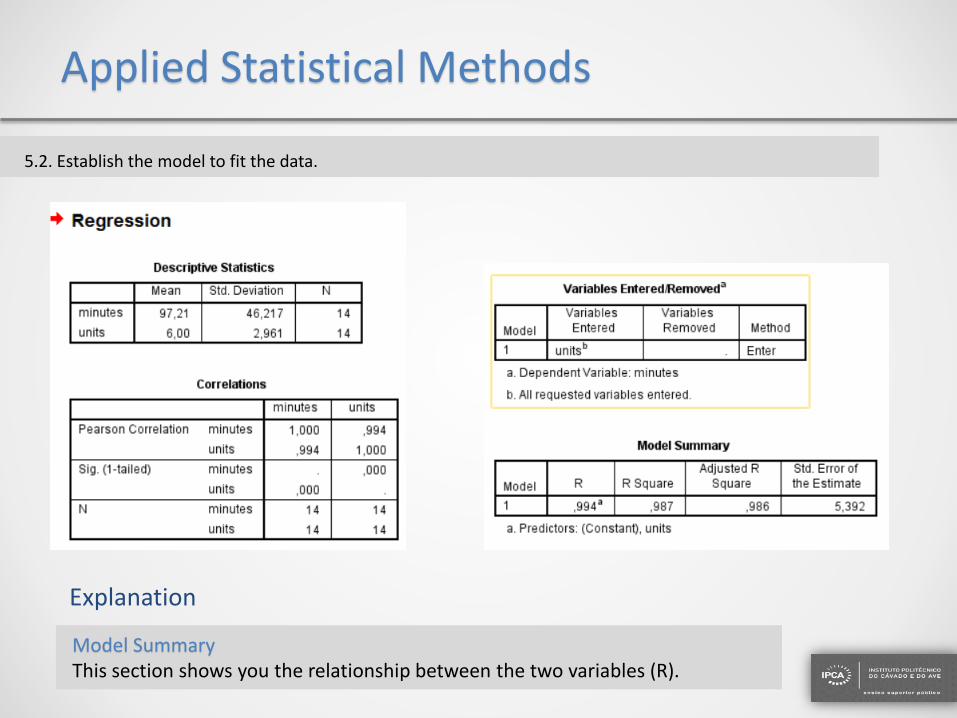
5.2. Establish the model to fit the data.
Applied Statistical Methods
Explanation
5.2. Establish the model to fit the data.
Model SummaryThis section shows you the relationship between the two variables (R).

Applied Statistical Methods
5.2. Establish the model to fit the data.
This section shows you the p-value (“sig” for “significance”) of the predictors effect onthe criterion variable. P-values less than .05 are generally considered “statistically significant.”
Explanation

Applied Statistical Methods
5.2. Establish the model to fit the data.
• This section shows you the beta coefficients for the actual regression equation. Usually, you want the “unstandardized coefficients,” because this section includes a
y-intercept term (beta zero) as well as a slope term (beta one). • The “standardized coefficients” are based on a re-scaling of the variables so that
the y-intercept is equal to zero.
Explanation
Applied Statistical Methods
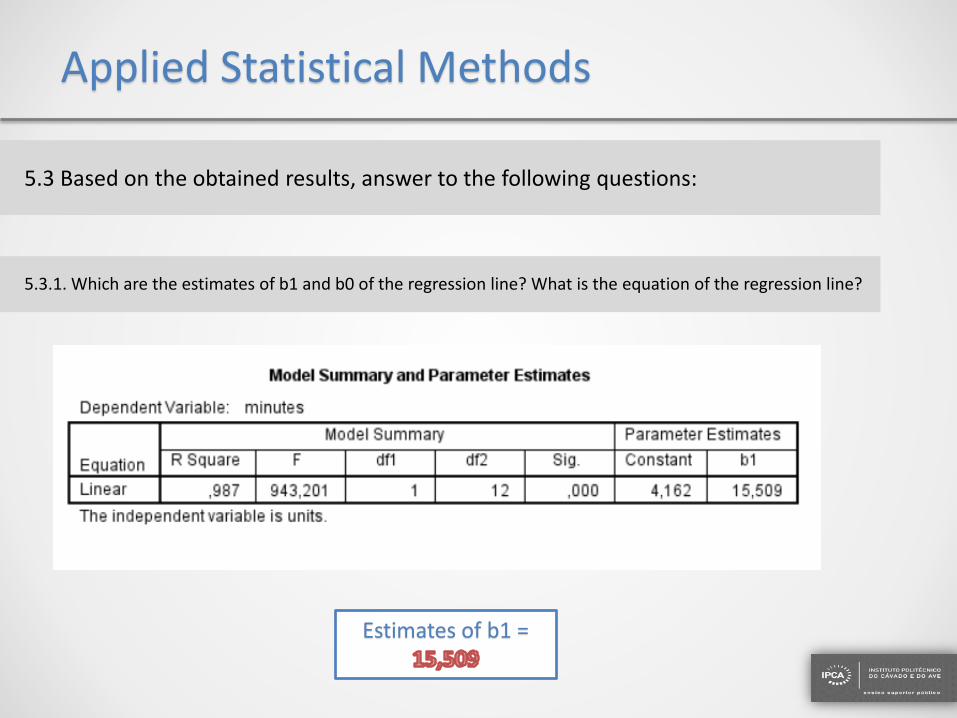
5.3 Based on the obtained results, answer to the following questions:
5.3.1. Which are the estimates of b1 and b0 of the regression line? What is the equation of the regression line?
Estimates of b1 =
Applied Statistical Methods
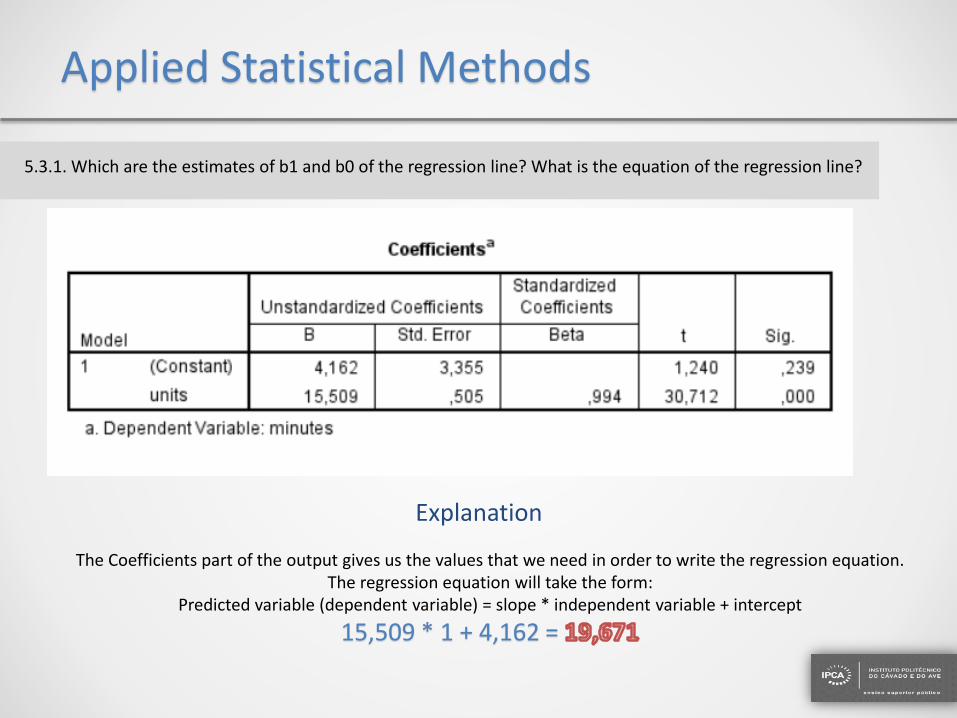
5.3.1. Which are the estimates of b1 and b0 of the regression line? What is the equation of the regression line?
Explanation
The Coefficients part of the output gives us the values that we need in order to write the regression equation. The regression equation will take the form:
Predicted variable (dependent variable) = slope * independent variable + intercept
15,509 * 1 + 4,162 =

Applied Statistical Methods
5.3.2. The value of the coefficients are significantly different from 0, with a significance level of 5%? Write for the two coefficients the hypothesis indicating the value of p-value from the respective test and respective conclusion.

Applied Statistical Methods
5.4. Indicate and interpret, justifying properly, the determination coefficient.

Description
5.1. Export the data to SPSS and code correctlythe study variables. Builda scatter diagram whichallows relating bothvariables with the intention to identify a possible linearrelationship. Commentthe respective chart.
Output
REGRESSION STATISTICS
Multiple R 0,993699
R square 0,987437
Adjusted R square
0,98639
StandartError
0,345466
Observations
14
ANOVA
df SS MS F Significance F
Regression 1 112,5678 112,5678 943,2009 8,92E-13
Residual 12 1,432159 0,119347Total 13 114
Coefficient Standart Error t Stat P-Value Lower %95 Upper %95 Lower 95,0% Upper 95,0%
Intercept -0,18959 0,221682 -0,85525 0,409163 -0,6726 0,29341 -0,6726 0,29341
X Value 1 0,06367 0,002073 30,71158 8,92E-13 0,059153 0,068187 0,059153 0,068187

Applied Statistical Methods
R square :
• This is r2, the Coefficient of Determination. It tells you how many points fall on the regression line.
• The coefficient of determination, with respect to correlation, is the proportion of the variance that is shared by both variables. It gives a measure of the amount of variation that can be explained by the model (the correlation is the model).
REGRESSION STATISTICS
Multiple R 0,993699
R square 0,987437Adjusted R
square 0,98639
Standart Error 0,345466
Observations 14
Coefficient of Determination
0,987437

Tank You! Obrigado! Teşekkür Ederim !
Estela Vilhena
Applied Statistic Method
Gökhan AYRANCIOGLU | a50236