apply the selected development methodology - aoi...
TRANSCRIPT

Apply the selected development methodology
Overview
Image: Overview
You should already know about determining and selecting appropriate methodology for a given activity. This resource will help you to apply the appropriate systems development methodology to an activity.
In this topic you will learn how to:
create a project plan
clearly describe project tasks
define suitable project controls
estimate task duration and cost
sequence tasks
estimate resource requirements
monitor project flow
review and document the project.
This topic contains:
reading notes
activities
references
a topic quiz.
As you work through the reading notes you will be directed to activities that will help you practise what you are learning. The topic also includes references to aid further learning and a topic quiz to check your understanding.
Download a print version of this whole topic: Apply the selected development technology (1,027 KB 2843.doc)

Reading notes 1
Image: Reading notes
The project planning process Once the goals and objectives have been defined and the development methodology selected, it is time to start planning how the project will be undertaken.
Goals and objectives
Goals and objectives must be SMART:
specific – the project should have specific outcomes defined by rate, number, percentage or frequency
measurable – a reliable system should be in place to measure progress towards objectives
achievable – the objectives should be attainable with a reasonable amount of effort
realistic – there should be sufficient knowledge, authority and skills so that the objectives are achievable
timely – start and finish dates should be clearly defined.
Checkpoints
Special review activities sometimes referred to as milestones are inserted into the project.
Tasks (Activities)
The project is broken down into units of work that will lead to project completion.
Relationships
Activities are interdependent in that one activity needs to be completed before another can commence.
Time estimates
Time estimates are an important management requirement in project management. These are extremely difficult to do accurately in IT projects. Management tools are available to facilitate this process.
Preparing for the project planThe project plan is definitely the key document in the project. It is a positive thing that represents the move from planning to execution. It is simultaneously a tool for guiding management decisions, controlling and reporting. It tells you where you are, where you are going and how you are going to get there.
Project plan development uses the outputs of other planning processes (discussed in following sections) to produce a coherent document that can be used to guide both project execution and project control. This process is almost always iterated several times. For example, the initial draft may include generic resources and undated duration, while the final plan reflects specific resources and explicit dates.
The project plan is used to do the following:
guide project execution
document project planning assumptions
document project planning decisions regarding alternatives chosen
facilitate communications among stakeholders
define key management reviews as to content, extent and timing
provide a baseline for progress measurement and project control.
To construct a project plan, follow these steps:

1. Break down the project outcomes into stand-alone groups of tasks. Break down the work further into individual tasks. Write your tasks into a task list with headings to show the related groups of tasks.
2. Estimate the start and end date for each task, i.e. task duration.
3. Determine task dependencies and draw a line between dependent tasks.
4. Estimate the resources required to complete the project tasks and allocate them to a staff member.
5. Estimate the costs of the resources and develop a resource budget.
6. Determine quality management tasks and add them to the plan.
7. Determine communication management tasks and add them to the plan.
8. Determine risk management tasks and add them to the plan.
9. Determine procurement tasks and add them to the plan.
Project tasksThe project plan breaks the identified objectives into manageable pieces with clearly defined checkpoints or milestones. Outlined in the project plan is a detailed list of these tasks and their milestones, sequence and cost.
First, tasks must be determined.
Guidelines for determining tasks Identify tasks as precisely as possible. Each task should be short
compared to the overall project duration. For example, if you plan to put up a house frame, you may want to break up the ‘put up the frame’ process into three or more tasks, one for each part of the house (outer walls, inner walls, roof). This helps you make a more reliable estimate of the time and resources required to complete a task.
Tasks must be significant enough to be included in the plan. Insignificant or unscheduled related tasks only clutter your project task list. For example, in the ‘pour the concrete’ task, mixing the concrete may be important, but it may not be significant enough to include as a separate step if it doesn’t affect how the task is scheduled.
The level of detail in your list of tasks should be appropriate for the amount of planning and control you want. For example, if you are hiring outside consultants to do a study, you’re interested in when the consultant starts to do a study and when the study will be in your hands, but you aren’t interested in the detailed tasks performed by

the consultant. In your list of tasks, you would include one task for the study - showing the duration for the whole - rather than many tasks indicating each step of the study.
o However, if you are doing the study yourself, the separate steps in completing the study are crucial to you. Your list of tasks would include every step necessary to do the study.
When you list your tasks and milestones, you must be aware of the scope of the tasks and the assumptions on which the tasks and milestones are based. This helps you to identify changes and measure progress.
Be comprehensive. Remember to include reports, reviews and coordination activities in your list of tasks and remember to include tasks for anticipated rework or modifications after a task has been completed, such as revising a manual or reworking and retesting a new product.
Name a task using a verb and a noun, such as ‘pour the concrete’, ‘build the outer wall frame’ and ‘shingle the roof’. Make the names as explicit as possible and keep the style of the names consistent throughout. This consistency will help others understand each task in your schedule.
Milestones
The use of milestones provides you with a built-in checklist of task completion. The most important characteristic of a good milestone is that there should be no room for doubt about whether it has been passed or not - for example, ‘email service approved ready for users to send emails’. The word ‘approved’ tightens the milestone definition.
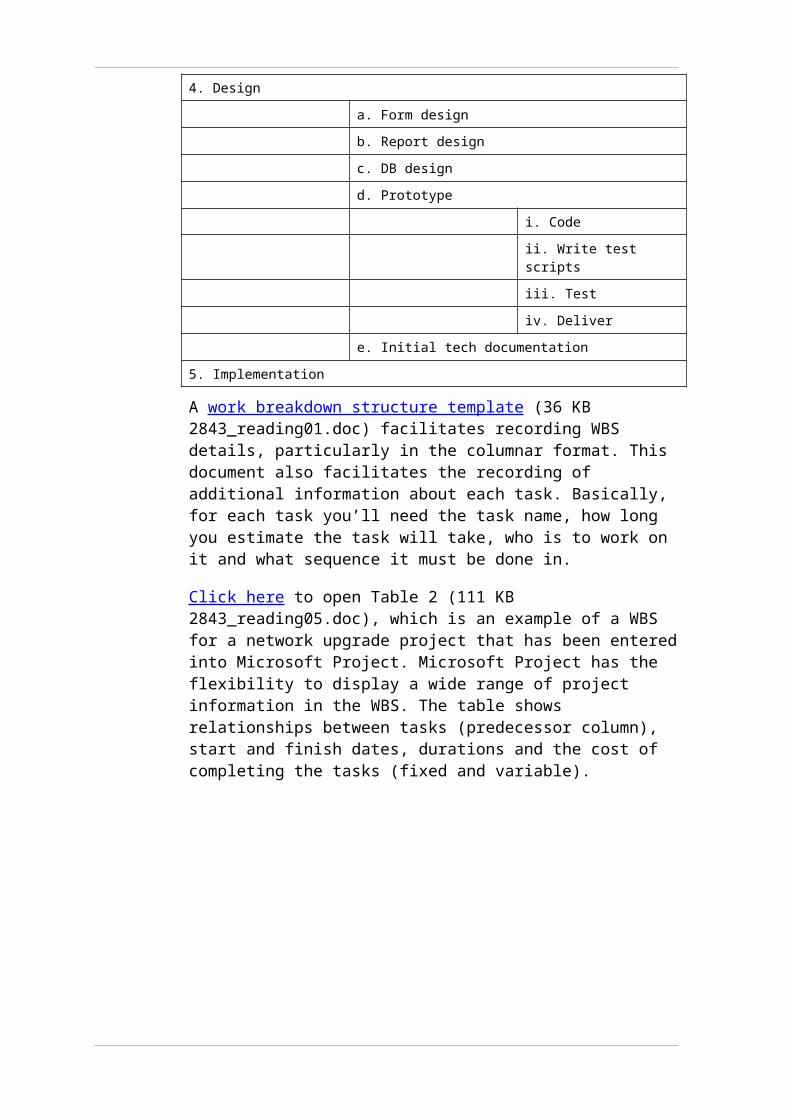
Developing the work breakdown structure Of the many methods available to define the activity and tasks that make up a project, the one that is most used and easiest to understand is the work breakdown structure (WBS).
The WBS is a useful tool for breaking down a lot of work into manageable pieces. Because most projects involve many people and many different deliverables, it is important to organise and divide the work into logical parts based on how the work will be performed.
Using this method, we represent the goal, objectives, tasks, subtasks and work packages using a hierarchical tree showing all the levels of breakdown. The top branch represents the goal of the project and the bottom branches represent the individual work activities to be performed.

WBS representation
WBS can be represented by
a graphical diagram very similar to an organisational chart of a company
a hierarchical listing like a table of contents in the front of a book.
Graphical format
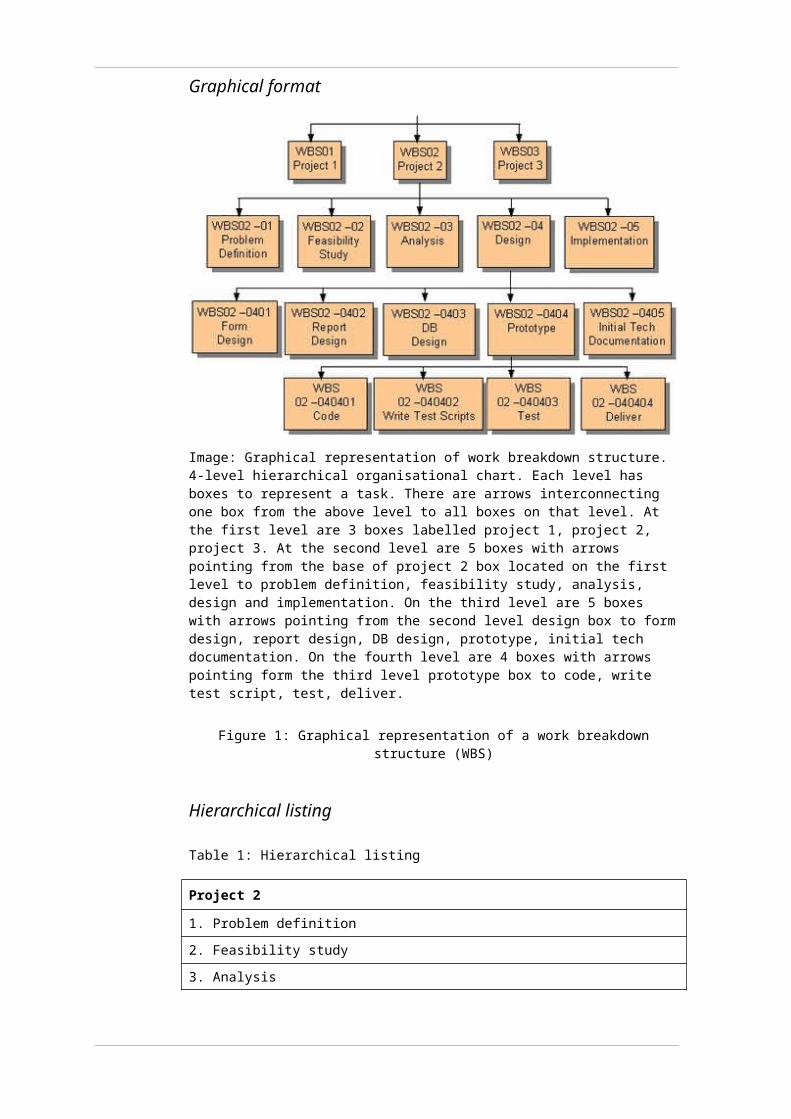
Image: Graphical representation of work breakdown structure. 4-level hierarchical organisational chart. Each level has boxes to represent a task. There are arrows interconnecting one box from the above level to all boxes on that level. At the first level are 3 boxes labelled project 1, project 2, project 3. At the second level are 5 boxes with arrows pointing from the base of project 2 box located on the first level to problem definition, feasibility study, analysis, design and implementation. On the third level are 5 boxes with arrows pointing from the second level design box to form design, report design, DB design, prototype, initial tech documentation. On the fourth level are 4 boxes with arrows pointing form the third level prototype box to code, write test script, test, deliver.
Figure 1: Graphical representation of a work breakdown structure (WBS)
Hierarchical listing
Table 1: Hierarchical listing
Project 2
1. Problem definition
2. Feasibility study
3. Analysis
4. Design
a. Form design
b. Report design
c. DB design
d. Prototype
i. Code
ii. Write test scripts
iii. Test
iv. Deliver
e. Initial tech documentation
5. Implementation
A work breakdown structure template (36 KB 2843_reading01.doc) facilitates recording WBS details, particularly in the columnar format. This document also facilitates the recording of additional information about each task. Basically, for each task you’ll need the task name, how long you estimate the task will take, who is to work on it and what sequence it must be done in.
Click here to open Table 2 (111 KB 2843_reading05.doc), which is an example of a WBS for a network upgrade project that has been entered into Microsoft Project. Microsoft Project has the flexibility to display a wide range of project information in the WBS. The table shows relationships between tasks (predecessor column), start and finish dates, durations and the cost of completing the tasks (fixed and variable).

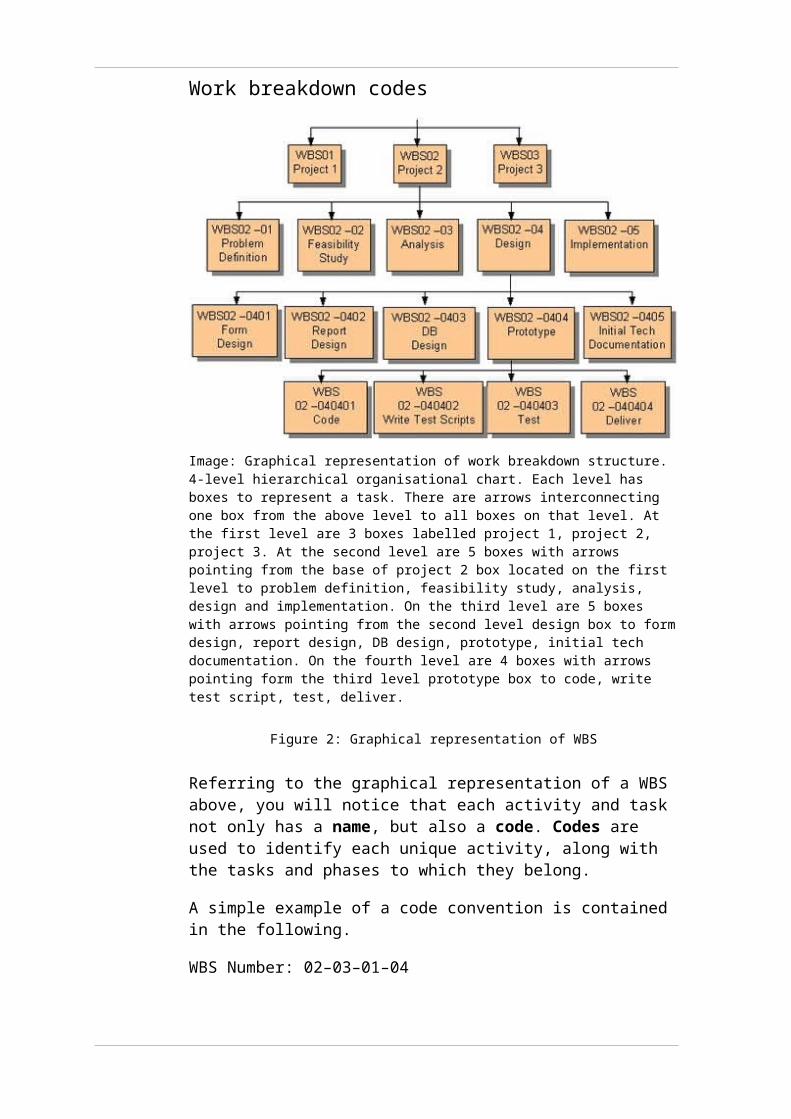
Work breakdown codes
Image: Graphical representation of work breakdown structure. 4-level hierarchical organisational chart. Each level has boxes to represent a task. There are arrows interconnecting one box from the above level to all boxes on that level. At the first level are 3 boxes labelled project 1, project 2, project 3. At the second level are 5 boxes with arrows pointing from the base of project 2 box located on the first level to problem definition, feasibility study, analysis, design and implementation. On the third level are 5 boxes with arrows pointing from the second level design box to form design, report design, DB design, prototype, initial tech documentation. On the fourth level are 4 boxes with arrows pointing form the third level prototype box to code, write test script, test, deliver.
Figure 2: Graphical representation of WBS
Referring to the graphical representation of a WBS above, you will notice that each activity and task not only has a name, but also a code. Codes are used to identify each unique activity, along with the tasks and phases to which they belong.
A simple example of a code convention is contained in the following.
WBS Number: 02–03–01–04
02 = Project number 2
03 = Phase number 3
01 = Task number 1
04 = Activity number 4
Tasks and types of breakdown methods
How do you know if you have identified all of the necessary tasks that are required to successfully achieve the project objectives? A well–defined task has five basic characteristics:
its status and completion are easily measured
it has a definite beginning and end
it is familiar (may have been done before) and therefore its completion time, associated resource requirements and costs can be easily estimated from previous experience
it is made up of work packages that are manageable, measurable and independent of work packages in other tasks
it should normally be one continuous stream of work from start to finish.
If you examine a task that you have identified and it does not have one or more of these characteristics, then you will have to break it down further into subtasks.
The top down method
The most common method used when breaking down projects into tasks and then work packages is the top down approach. The following are five simple steps for this method.
Step 1 – divide the project into its major objectives.
Step 2 – divide each objective into the tasks that must be done in order to accomplish the objective.
Step 3 – check that each task that must be done has all of the required characteristics listed above. If it has one or more missing characteristics, then divide the task into subtasks.
Step 4 – repeat Step 3 until all subtasks have the required characteristics.
Step 5– make the lowest level of subtasks in the WBS hierarchy the basis for the work packages that must be done to complete the project.
The other type of breakdown method is the bottom up approach. This is where all the basic tasks are determined; then they are grouped into linked tasks and then into phases. This is best suited to smaller projects.
Activity 1
To practise the top down method, complete Activity 1-Work breakdown structure in the Activities section of the topic menu.
Research
Go to Washington’s Project Management Framework site and search for examples of work breakdown structure. You can find this site at http://isb.wa.gov/tools/pmframework/index.aspx.
Project controlsControlling a project is a key project management process that is essential to ensure a successful outcome. It can be supported by the use of project plans and reports against these plans. Monitoring and control activities need to be in place to ensure that each stage of the project stays on course and to respond to unexpected events.
Project controls are usually designed to focus on the four major aspects of project measurements: cost, time schedules and performance levels and managing change.
Project controls are necessary to:
Monitor and track progress by having in place a periodic reporting system that identifies the status of every activity in the project for the current reporting period as well as for the entire project
Determine variation from plan by using exception and variance reports that provide information on activities and resources that vary from expected criteria
Take corrective action by examining alternatives, and modifications to the schedule and resource usage to correct any detected deviation from plans..
The Work Breakdown Structure identifies all of the tasks that need to be performed in order to complete the project and the sequence in which they need to be performed.
No matter which development methodology has been chosen, the tasks should be grouped into the stages specified in the methodology. For each stage that has been identified, it is important that control tasks be included so that it can be monitored to ensure that it will be completed on schedule.
The control tasks will vary depending on the specific stage of the project, but should include:
Planning controls
In the early stages of the project the controls should include the following:
identifying the milestones for the stage
identifying the tasks that are on the critical path
defining the allowable deviation from the plans without having to involve higher level management
defining the standards and quality criteria to be used – this is usually done by creating a quality management plan
identifying, prioritising and providing management strategies for potential risks – usually done by creating a risk management plan
estimating project costs
defining the communications requirements of the project – a communications management plan should be created for this purpose
Monitoring controls
Once development is underway, it is important to monitor the progress of the project to ensure that everything is running smoothly and to take corrective action if that is not the case. Controls at this time should include the following:
monitoring the critical path to ensure schedules are being met
progress reporting
exception reporting
using an issues log and impact assessment
logging of all risks that occur
tracking and analysing project costs
managing the process of risk and change control
documenting and delivering project status information
testing/inspecting the product to ensure it meets the stated criteria, as identified in the quality plan
Controls for closure of a project
Formal controls should also be included in the project closure stage whether closing goes to plan or is premature because the project has been abandoned. These controls include the following:
acceptance testing by the stakeholders
reviewing the project outcomes
documenting the results of the project.
Most of these controls are discussed in other areas of this topic; however, it is important to realise that they must be included as tasks in the Work Breakdown Structure to ensure that they are planned for, resourced,
scheduled, and - most importantly - carried out! Even though the control tasks do not directly contribute to the product being developed, they are critical to the successful completion of the project.
Activity 2
To practise identifying controls, complete Activity 2 - Controls in the Activities section of the topic menu.
Input/output parametersAll tasks identified on the Work Breakdown Structure will require some form of Input parameters specifying the requirements for the inputs, and output parameters specifying the quality requirements of the output of the task.
Consider the example of a project to build a house. Using the project specification for the task dig foundations, shown below, you can see that one of the inputs is wire mesh. The specific type of wire mesh is specified as 6-inch #6. Therefore 6-inch #6 wire mesh is an input parameter. Below is a sample project specification:
Table 3: Sample project specification
Foundation:
Pour 4-inch concrete slab over 6 inches of compacted sand fill.
Reinforce with 6-inch #6 wire mesh.
Install 6 mil. polyethylene membrane water-proofing barrier between sand and concrete.
Use 1-foot wide by 1-foot 6-inch deep beams around perimeter of foundation and under load bearing walls, per blueprints.
Beams to include #5 reinforcing steel bars in each corner positioned with #3 stirrups on 2-feet 6-inch centres.
Concrete to withstand 2500psi test after 28 days.
Using the same example, the output of this task is the concrete foundation. This output must meet the quality requirements as specified in the project

specification for the task. Looking at the project specification you can see that the output parameter is concrete to withstand 25000psi test after 28 days.
Input parameters are therefore specifications that the inputs to the task must satisfy before it can be commenced.
Output parameters are the stated quality requirements that must be met before the task can be considered complete.
In an information technology project, an example of an input parameter would be that the images to be used in a web page must be in a gif file format. An example of an output parameter would be that the web page will display three images across the page, each image being 3cm square in size.
As can be seen from the building example, input and output parameters are usually defined in the project specifications that are provided for tasks in the Work Breakdown Structure. These specifications will be created by the systems analyst with the major input coming from the users of the system and will generally be found in the quality standards that are created for the project.
Since most tasks on the Work Breakdown Structure cannot be started until previous tasks have been completed, i.e. their predecessors, it follows that the input parameters for a task will include the timely completion of the predecessors to the required level of quality. This means that the output parameter of one task will be an input parameter to its successor.
Estimating task duration and cost Now that the Work Breakdown Structure is complete, we have all of the tasks required to complete the project. We must use the Work Breakdown Structure to estimate the work effort or time for each task, and the cost for each task.
Estimating task duration
When estimating task work effort, there are five options that you can use to gather information to help you make the estimates as accurate as possible.
Ask the people who will actually do the work because they have the experience.
Get an expert’s opinion in the task field. (For example, someone who isn’t working on the project.)
Use an identical or similar task in a completed project as a guideline.
If you have time and the task is possible now, perform a test task.
If all else fails, make your best guess. That is why they employed you!
In most cases the work effort, or time, to complete a task will vary if it is repeated over and over again. This is true for even simple routine activities. For some tasks, the variation may be small and for others it may be considerably large. Variables that may affect this may include the following:
the skill levels of the people doing the task
machine and product variations
material availability
unexpected events (sickness, accidents, employee turnover, strikes, natural disasters, etc).
We know that these things will happen, but we cannot predict when they will affect a project with any accuracy. However, there is a statistical relationship called a weighted average formula that takes variations of time estimations into consideration quite well is very easy to use. It is outside the scope of this topic to show the derivation and proof of this formula, but it is an excellent tool for the project manager to use when estimating the average completion time for a given task that may not be familiar.
The weighted average formula
To apply this formula we need to have three estimates of the task completion time.
The best completion time, B, is the time that the task will take if everything goes perfectly.
The worst completion time, W, is the time that the task will take if everything that can go wrong does go wrong, but we can still complete the activity.
The most likely completion time, L, is the time that the task takes under normal circumstances. This may also be the informed estimate drawing from experience from a previous project. We then calculate the average task completion time as:
Image: Weighted average formula where B (best completion time) plus 4 times L (most likely completion time) plus W (worst completion time) over 6 is equal to the E the estimated completion time.
Figure 3: Calculating the average task completion time
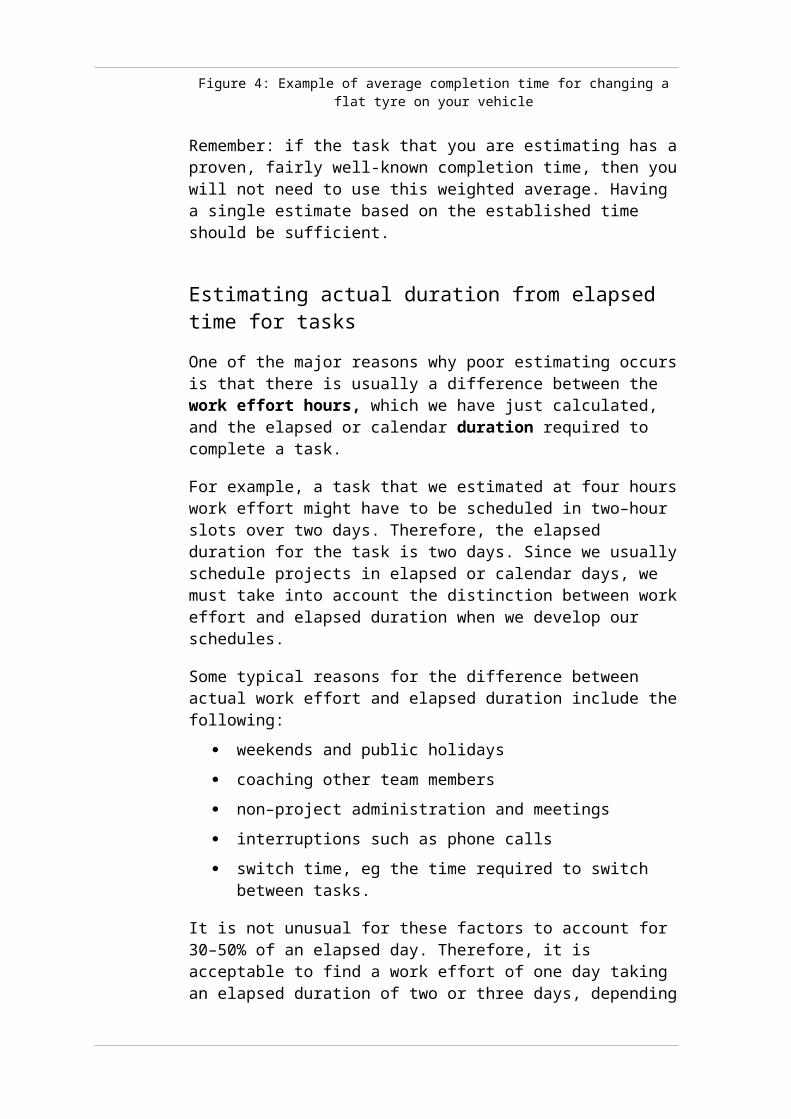
Here is an example of the average completion time for changing a flat tyre on your vehicle.
Image: Example of average completion time for changing a tyre where B equals 20, L equals 30, W equals 90, therefore E equals 39 where ( 20 plus (4 times 30) equals 90) is divided by 6.
Figure 4: Example of average completion time for changing a flat tyre on your vehicle
Remember: if the task that you are estimating has a proven, fairly well-known completion time, then you will not need to use this weighted average. Having a single estimate based on the established time should be sufficient.
Estimating actual duration from elapsed time for tasks
One of the major reasons why poor estimating occurs is that there is usually a difference between the work effort hours, which we have just calculated, and the elapsed or calendar duration required to complete a task.
For example, a task that we estimated at four hours work effort might have to be scheduled in two–hour slots over two days. Therefore, the elapsed duration for the task is two days. Since we usually schedule projects in elapsed or calendar days, we must take into account the distinction between work effort and elapsed duration when we develop our schedules.
Some typical reasons for the difference between actual work effort and elapsed duration include the following:
weekends and public holidays
coaching other team members
non–project administration and meetings
interruptions such as phone calls
switch time, eg the time required to switch between tasks.
It is not unusual for these factors to account for 30–50% of an elapsed day. Therefore, it is acceptable to find a work effort of one day taking an elapsed duration of two or three days, depending on the particular project and administrative environment.
Finally, the number of people available to complete the work also affects the overall time. This may be a simple relationship. For example, if the effort estimate to test the code of an Information System is 40 days, five people may do it in 40/5 = 8 days. But some tasks cannot be done faster by using more staff. For example, if it takes 4 hours to install a piece of software on a computer, four people will not do it faster because the time is limited by the computer and software - not the person.
Activity 3
To practice identifying factors that could impact on time estimates, complete Activity 3 - Factors that impact on time estimates in the Activities section of the Topic menu.
Estimating costsCosting a project is not an easy task. All projects are different and therefore you may not have a previous example to assist in costing the current project. You may refer to audit reports and budgets from previous projects, but these may only provide ideas, rather than real costs.
One of the key inputs to the costing process is the detailed Work Breakdown Structure that you developed at the start of the planning phases of the project life cycle. At the end of the costing process, you will have developed your budget requirements for the project.
You will typically prepare several types of cost estimates for most projects, depending on where you are in the project life cycle. The following table details different types of estimates:
Table 4: Cost estimates
Type of Estimate When Done Why Done How accurate
Rough estimate Prior to project commencement
Provides a costing estimate to help decide if project should be selected
–25%, +75%
Budget estimate At project planning stage
Used in budget –10%, +25%
Definite costing During project Provides details for purchases, estimates, actual costs
–5%, +10%
Obviously, very small projects will tend to skip the earlier estimates.

There are typically four major cost areas that are involved in any task. They are:
labour costs
material costs
other direct costs (transport, travel, telephone, contracted services)
indirect costs (company overheads, depreciation, etc.).
These items are determined as part of the resource planning process.
As you did when you developed the Work Breakdown Structure, you can either do a top down or a bottom up approach to costing.
The top down method is a difficult approach as it relies on senior management estimating a budget from their experience and then allocating funds to the project team for execution. This only works if senior management has significant project experience. This method puts a constraint on the project, which can severely affect the outcome. This method is appropriate for ‘order of magnitude’ estimates.
The preferred approach by most project managers for budgetary estimates is the bottom up method. This is the most accurate as it involves input from the staff and providers of materials and services. This method ensures that no task is missed in the rollup of the costing for the project. By having a correctly defined list of tasks and subtasks and good estimates for task times, you can then develop a reasonably accurate cost for each task. You will have reasonable estimates of the people, resources, materials and time required to complete each task so you can calculate a cost per task with simple mathematics. If the task is repeated many times throughout the project, then you can use this as a standard work unit cost.
When all the tasks have been rolled up and you have a final cost figure for the project, don’t forget to add in your contingency allowance. In project management terms this is “padding” to allow for errors in estimating or unexpected cost occurrences.
Estimated costs and budget
When you have added up all of the costs for all tasks and activities, you have a final cost estimate for the project. This is usually presented to the project sponsor and stakeholders that will be providing the funds. After assessment and negotiation, the project sponsor will usually accept the costing for the project and then approve funds. When the funds are allocated this becomes the project budget, which you will use to control and track the project expenditure.
Resources
Estimating resources
Resource planning is a critical part of project management. To estimate budget and control costs, project managers and their teams must determine what physical resources (people, equipment, and materials) in what quantity are required to complete the project. Expert judgement and the availability of alternatives are the only real tools available to assist in resource planning, but to help with this process ask yourself some questions.
Will it be difficult to accomplish specific tasks in the project?
Is there anything unique about the project that might cause problems in the future?
Has your organisation done anything similar before? Who did the work?
Does your organisation have staff, equipment and resources that are capable of doing the job?
Do you need to outsource some of the work?
Does your organisation have any policies that might affect obtaining resources?
A project’s WBS, scope statement, historical information, resource information and policies are all important resources for answering these questions.
A further consideration in resource planning is the availability of resources to meet projected workloads. Sometimes a task will require more resources in a given timeframe than are available, i.e. the resource is overloaded. You can use processes known as resource levelling to resolve resource conflicts by delaying tasks. The same process can also be used to improve under utilised resources, as shown in Figure 5. (Tasks are referred to as activities in the figure.)
Image: Picture showing the Project network with Activities A, B and C and durations as A=2 days, B=5 days, C=3 days. Activity A has 3 days of slack. And activity C has 2 days of slack. Assume activity A has 2 workers, B has 4 workers, and C has 2 workers. Below is two bar graphs. The graphs has 1,2,3,4,5,days on the x axis and 2, 4, 6,8 on the y axis. The fist bar graph shows resource usage if all activities start on day one. 1 to 2 days has 8 workers day 3 has 6 workers and days 4 and 5 has 4 workers. The second bar graph shows resource usage if activity C is delayed 2 days, that is its total slack. Resources are levelled across all 5 days at 6 workers.
Figure 5: Resource levelling
When the baseline project plan is approved, there are many required resources identified. There are seven fundamental resource types that are required to implement almost any project. The actual quantity of each resource should be identified in the detailed Work Breakdown Structure and schedules that make up the baseline project plan. The seven fundamental types of resources are:
people
money
equipment

facilities
materials and supplies
information
technology.
Always start with the people first! Other materials and facilities are useless without the right project team.
Organisational planning
Organisational planning involves identifying, assigning and documenting project roles, responsibilities and reporting relationships. Before creating the project organisation chart, you will refer to the scope document and the Work Breakdown Structure and make sure that the work is broken down into manageable components. You should then assign like components to the same organisational units within the company. The project organisation chart would then show the units responsible for the various work outputs.
When you have completed the organisational chart and the work assignments, you can move on to preparing the staff management plan, which describes when and how people will be added to and taken away from the project team.
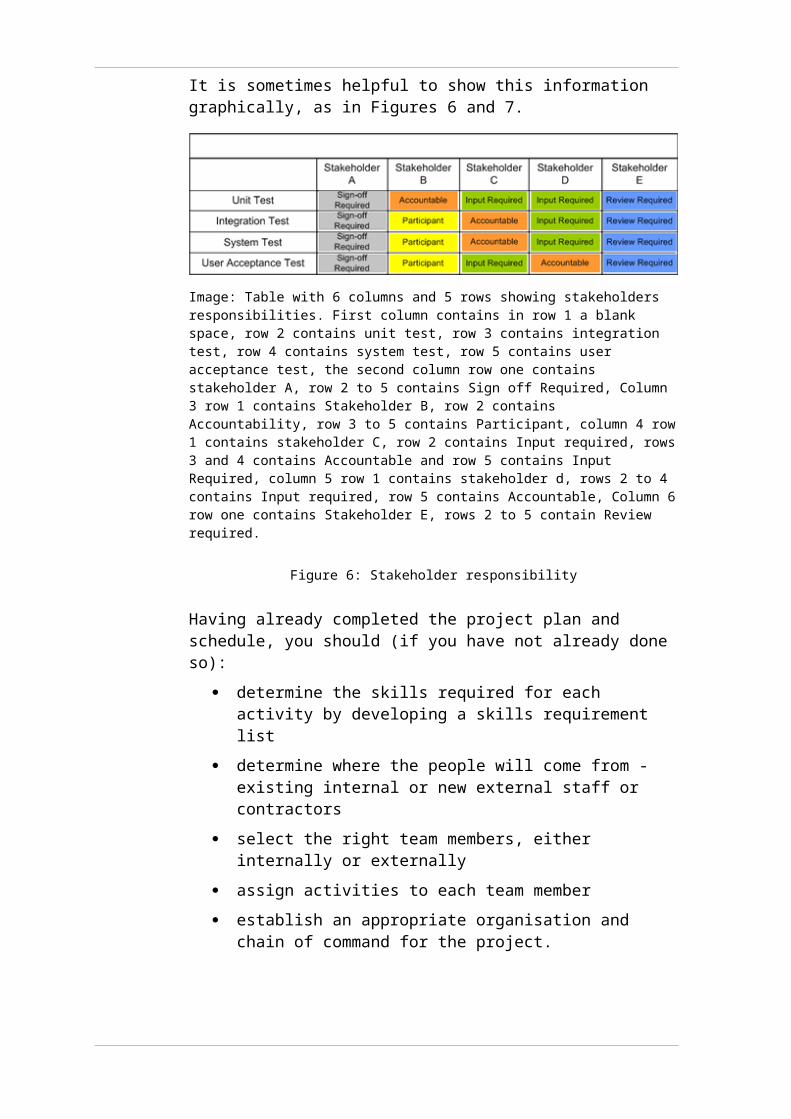
It is sometimes helpful to show this information graphically, as in Figures 6 and 7.
Image: Table with 6 columns and 5 rows showing stakeholders responsibilities. First column contains in row 1 a blank space, row 2 contains unit test, row 3 contains integration test, row 4 contains system test, row 5 contains user acceptance test, the second column row one contains stakeholder A, row 2 to 5 contains Sign off Required, Column 3 row 1 contains Stakeholder B, row 2 contains Accountability, row 3 to 5 contains Participant, column 4 row 1 contains stakeholder C, row 2 contains Input required, rows 3 and 4 contains Accountable and row 5 contains Input Required, column 5 row 1 contains stakeholder d, rows 2 to 4 contains Input required, row 5 contains Accountable, Column 6 row one contains Stakeholder E, rows 2 to 5 contain Review required.
Figure 6: Stakeholder responsibility
Having already completed the project plan and schedule, you should (if you have not already done so):
determine the skills required for each activity by developing a skills requirement list
determine where the people will come from - existing internal or new external staff or contractors
select the right team members, either internally or externally
assign activities to each team member
establish an appropriate organisation and chain of command for the project.
Determining the skills required
Let’s assume that you have already completed a Work Breakdown Structure and a network diagram that list all the activities to take place. It is now time to use them to develop a skills requirements list based on what is needed to complete each activity. Below is an example.
Table 5: Example of team skills requirements
Activity Skills required
1.1 Problem definition Systems Analyst – large financial systems
1.2 Analysis of current system Systems Analyst – large financial systems
1.3 Current physical and logical dataflow diagrams
Systems Analyst – financial experience and experience in logically layering dataflow diagrams
1.4 Cost-benefit solutions Systems Analyst – estimating cost of alternatives
2.1 Form design Systems Analyst – systems design
2.2 Report design Systems Analyst – systems design
2.3 Relational database design Database Analyst – large financial relational database
3.1 Prototype of development Programmer - Powerbuilder
3.2 Coding of forms Programmer - Powerbuilder
As you can see from the above skills requirements list, the skills and resources required by a project are determined by the activities that need to be completed in the project.
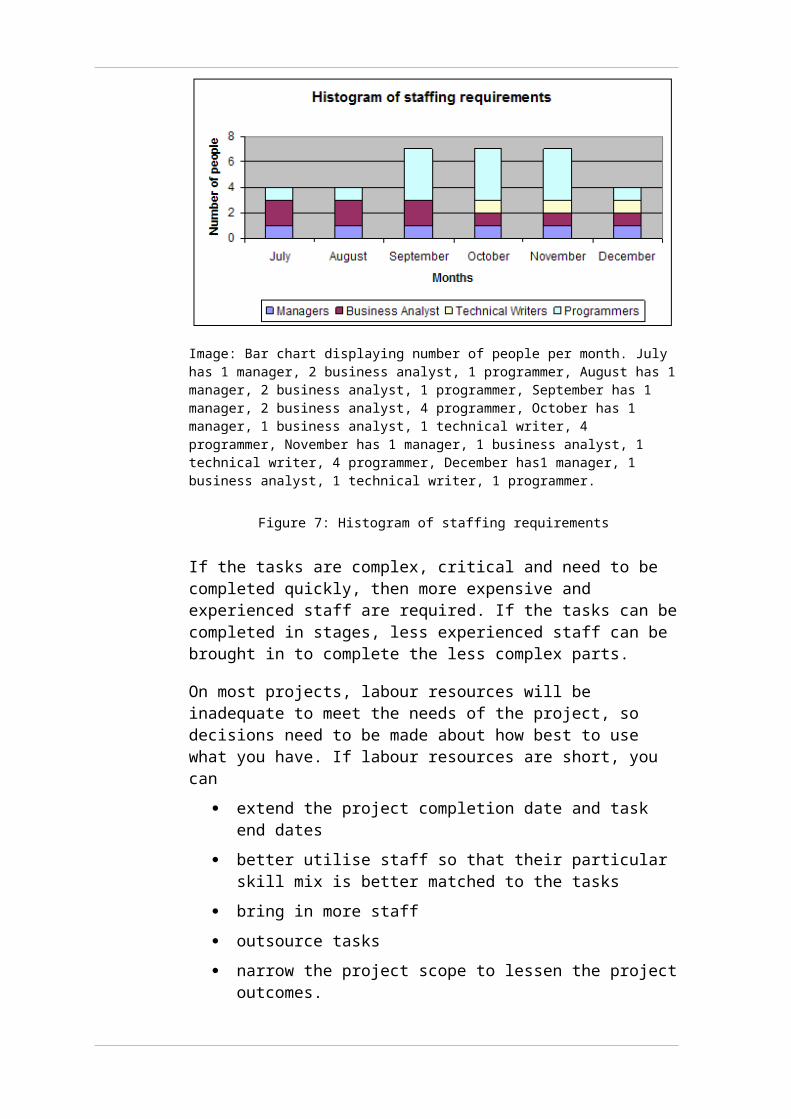
Image: Bar chart displaying number of people per month. July has 1 manager, 2 business analyst, 1 programmer, August has 1 manager, 2 business analyst, 1 programmer, September has 1 manager, 2 business analyst, 4 programmer, October has 1 manager, 1 business analyst, 1 technical writer, 4 programmer, November has 1 manager, 1 business analyst, 1 technical writer, 4 programmer, December has1 manager, 1 business analyst, 1 technical writer, 1 programmer.
Figure 7: Histogram of staffing requirements
If the tasks are complex, critical and need to be completed quickly, then more expensive and experienced staff are required. If the tasks can be completed in stages, less experienced staff can be brought in to complete the less complex parts.
On most projects, labour resources will be inadequate to meet the needs of the project, so decisions need to be made about how best to use what you have. If labour resources are short, you can
extend the project completion date and task end dates
better utilise staff so that their particular skill mix is better matched to the tasks
bring in more staff
outsource tasks
narrow the project scope to lessen the project outcomes.
What position the project team takes will depend greatly on the constraint that drives the project, i.e. time, money or project outcomes.
Activity 4
To practise staffing the development of an online training component, complete Activity 4 - Determining the positions required in the Activities section of the Topic menu.

Establish resource availability
After identifying what resources are needed, the next step is to determine when they are needed. The project schedule will provide this information, as it identifies when each task should start and finish. Once this information is known, the availability of these resources at the specific times can be established. This can be done by
1. determining what skills are available within the organization
2. determining what skills are required outside the organization
3. for skills to be acquired outside, determining their availability
4. compiling a resource acquisition list based on these findings.
Step 1 can be achieved by consulting the personnel department.
Step 2 can be achieved by subtracting from the Skills Requirement List the set which is available in Step 1.
Step 3 can be achieved by consulting an employment agency.
A pro forma can be used for step 4:
Table 6: Resource availability
Skills Quantity Availability
Programmer (Powerbuilder) 2 IT Department
Systems Analyst – large financial systems 1 IT Department
Database Analyst — large financial relational database
1 Contractor
Acquiring resources
Since a project is a finite event, most resources are only required for a set period of time while the system is being developed. A small number of staff may be necessary to support the new system on a permanent basis, but the particular project team is temporary and all of its members will eventually be re-allocated.
For this reason, many organizations prefer to bring in contract staff from outside during the development of a new system, so that the company does not incur the overheads of having to pay staff when there may not be any work available for them. In particular, small companies which do not have ongoing development projects cannot afford to employ permanent development staff. Contract staff are paid at higher rates than permanent employees but only for the duration of the project.
Large organizations may have a permanent body of staff, with members being transferred between project teams as required. Any additional skills required can be obtained by hiring contractors with the relevant expertise.
As the costs of employing highly-skilled IT staff continue to increase, many organisations, both large and small, are outsourcing any new IT projects, as well as many of the ongoing maintenance functions of the department. This involves entering into a contractual agreement with an outside company which specialises in these areas. The outside company will then be responsible for the complete project development, including provision of all of the resources required.
Selecting the right candidates for a team
You can compare a project team with any other team of staff that work together in a department. In selecting staff, it is important that they have as many of the following characteristics as possible. These team member characteristics have been found to be successful regardless of the nature of the project. These include
commitment to the project and its completion
flexibility in changing work activities from one task to another and varying working hours
technical competence
being task-oriented and able to work with schedules and resource constraints
ability to work across formal structures and - if necessary - with two or more bosses
being open to suggestions and showing a willingness to admit error and be corrected
knowledge and experience with project management tools.
As a project manager, you will need to keep a team member record which lists all project members, their skills, when they came onto the project and when they left the project. This can be a document containing a table. You can use any software program that enables you to create tables, such as MS Word or MS Excel.
The following diagram is an example of a table of resources that can be created for reference when assigning individuals to project tasks.
Table 7: Table of resources
Resource Name
Skills Cost Availability Employment Term
Fred Jones Programmer (Powerbuilder)
$60/hour Mon - Fri Internal
Jean Dimos Programmer (Powerbuilder)
$60/hour Mon -Fri Internal
Mary Black Systems Analyst – large financial systems
$70/hour Mon - Fri Internal
Paul Lee Database Analyst — large financial relational database
$120/hour Tues, Wed Contractor
Assigning tasks
Assigning the right resources to project tasks is crucial to the ultimate success of a project.
The following steps need to be performed when doing this:
1. Match the resources available in the resource table against the skills required by the tasks as indicated in the skills requirement table.
2. Assign the names of matching resources against each task in the project plan, along with the duration.
3. Generate weekly/monthly task lists for each resource.
The linear responsibility chart shown below can be used to give a global representation of the task assignments.
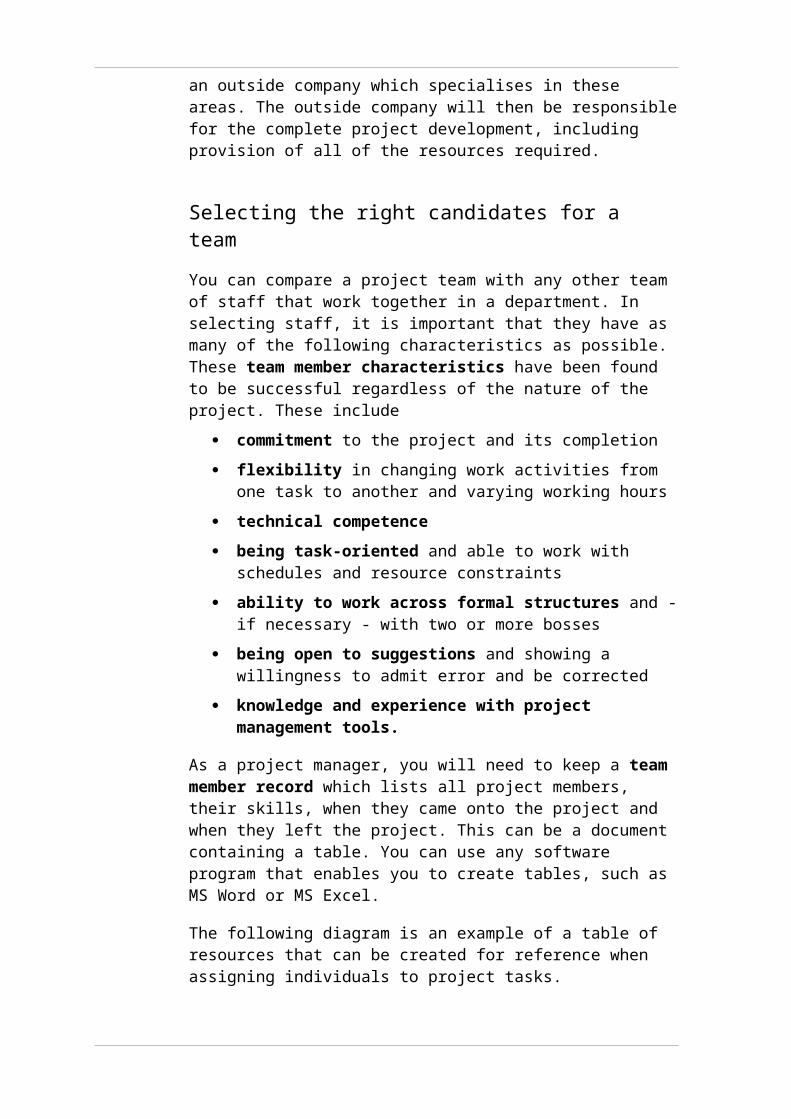
Table 8: Linear responsibility chart
Activity Description Senior Systems Analyst – Mary Black
Programmer – Fred Jones
1.1 Problem definition X
1.2 Analysis of current system
X X
2.3 Relational database design
X
3.1 Prototype development
X
3.2 Coding of forms X
Note: A resource can be allocated to more than one task and can be active on several tasks in the same time period. The time fraction of the resource that is allocated to each task should be noted on the task list and/or schedule.

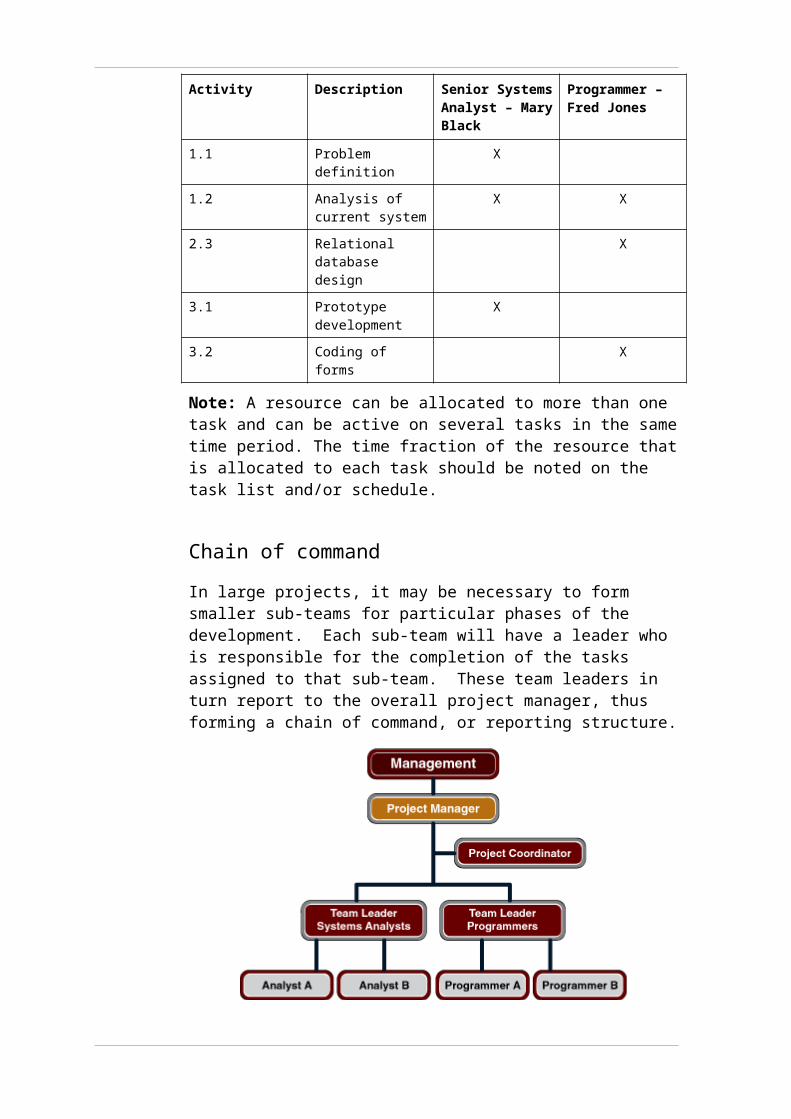
Chain of command
In large projects, it may be necessary to form smaller sub-teams for particular phases of the development. Each sub-team will have a leader who is responsible for the completion of the tasks assigned to that sub-team. These team leaders in turn report to the overall project manager, thus forming a chain of command, or reporting structure.
Image: Project team organisation chart with ‘Management’ at the top level, ‘Project Manager’ at second level, ‘Project Coordinator’ at third level ‘ Team Leaders’ for ‘Systems Analysts’ and ‘Programmers’ at fourth level, two ‘Analysts’ ‘A’ and ‘B’ and two ‘Programmers’ ‘A’ and ‘B’ at fifth level.
Figure 8: Project team organisation chart
Authority is delegated to each member of the team along the chain of command and a duties statement for each person is produced. This, together with the organisation chart, formalises the reporting structure of the team.
Reading notes 2
Image: Reading notes
Task sequence and project schedulesNow we must once again apply our principles of general management. We must use our planning skills to incorporate all of the task, staff and duration estimates and other details in the project plan into a schedule. This time plan will show calendar dates, task durations and resource capacity for each task. An accurate schedule is the most important tool for controlling the implementation of a project and coordinating the resources. If you are too short with your timeframe and expect the impossible or are too long on the time frame, then the project will go over time and over budget. You must be realistic about the time required to complete a project.
Sequencing the project tasks
At the moment, our project is a list of tasks/activities that must be done in order to complete the project, with deliverables and milestones to measure the progress. We must now determine the sequence in which the tasks can be done to achieve these milestones and deliverables. Obviously, we could just put them in a logical order like a “to do” list and then do them one after the other. This is fine for small simple projects of less than about 30 tasks, but for a complex project with many, many tasks, this would be the longest way to completion. It is easy to recognise that many activities in a project may be done simultaneously and others will be done sequentially because they have dependencies on preceding tasks.
For example, if we are implementing a corporate network in our new office building, we can’t install network hardware before the cabling system and the office furniture fit–out is complete. Similarly, we can’t install the cabling system before walls are in place.
Picture your project plan
In developing your project systems you have probably generated a lot of data. To help make sense of it, you can generate a pictorial representation of your schedule. There are many ways to represent a project which can be used individually or to support each other. These representations most commonly take the following forms.
network diagrams focus on the relationship between tasks
the critical path method is a type of network diagram used to estimate the duration of tasks
PERT (program evaluation review) technique is another type of network diagram used when time management is difficult to estimate
Gantt charts provide a visual overview of all activities on a project time line.
Network diagramsThe proven and most accepted way to organise and sequence project tasks is by using a network diagram. This is like a roadmap that shows all of the project’s activities drawn as an interconnected network of tasks. A low-level version for 50 tasks can be easily drawn with pencil and paper. When managing more complex projects, it is usually necessary to use computer-based project management software to generate complex network diagrams.
The figure below shows an example of a network diagram for a simple LAN project. It shows the basic steps required for installing a LAN.
Image: Diagram of the Start of the LAN project, Establish requirements, document requirements and beginning sourcing HW done concurrently, Begin design of LAN and purchase required H/W undertaken concurrently, Review installation docs and then Install cabling and PCs done concurrently, install a network completed after PCs have been installed. Then test LAN and S/W and finally end project.
Figure 9: Example of a network diagram
Check that your diagram has the following attributes:

tasks start from the left and sequence left to right. That is, all predecessors must be to the left of their successor tasks
there are no loops or backward flow sequences
all nodes, represented by circles that indicate an activity or task, except ‘start project’ and ‘end project’, have at least one predecessor and one successor node and therefore there are no orphan nodes.
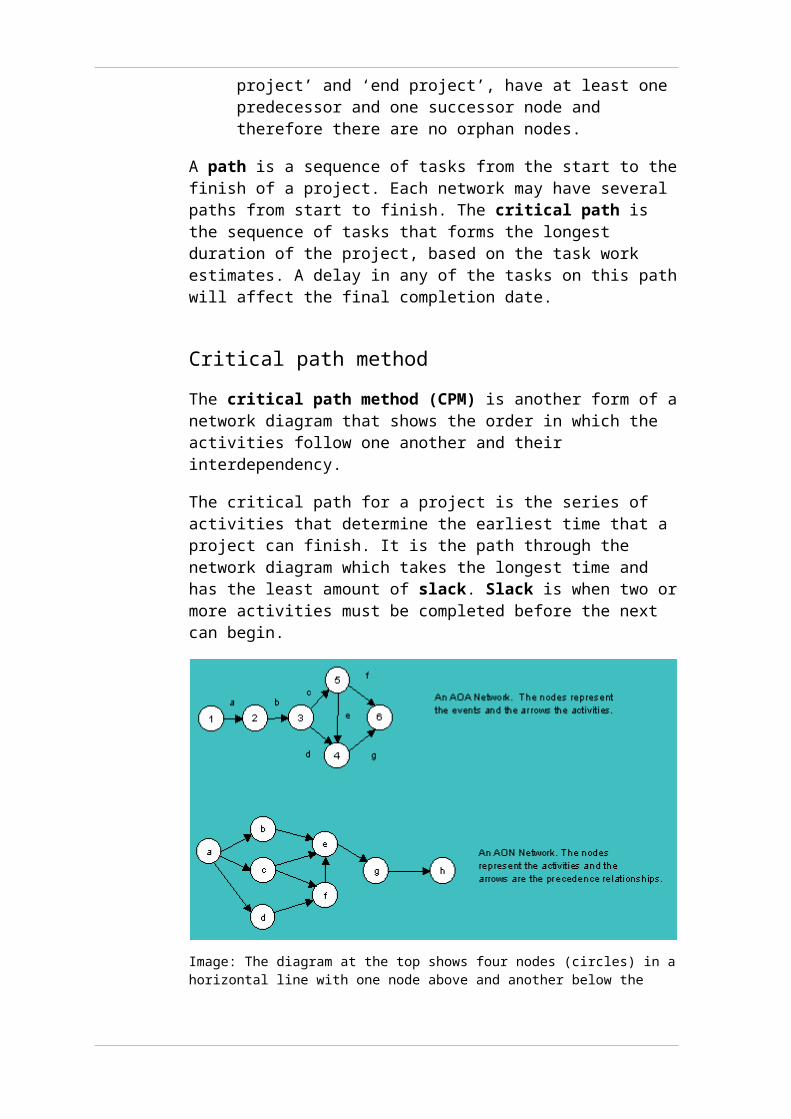
A path is a sequence of tasks from the start to the finish of a project. Each network may have several paths from start to finish. The critical path is the sequence of tasks that forms the longest duration of the project, based on the task work estimates. A delay in any of the tasks on this path will affect the final completion date.
Critical path method
The critical path method (CPM) is another form of a network diagram that shows the order in which the activities follow one another and their interdependency.
The critical path for a project is the series of activities that determine the earliest time that a project can finish. It is the path through the network diagram which takes the longest time and has the least amount of slack. Slack is when two or more activities must be completed before the next can begin.
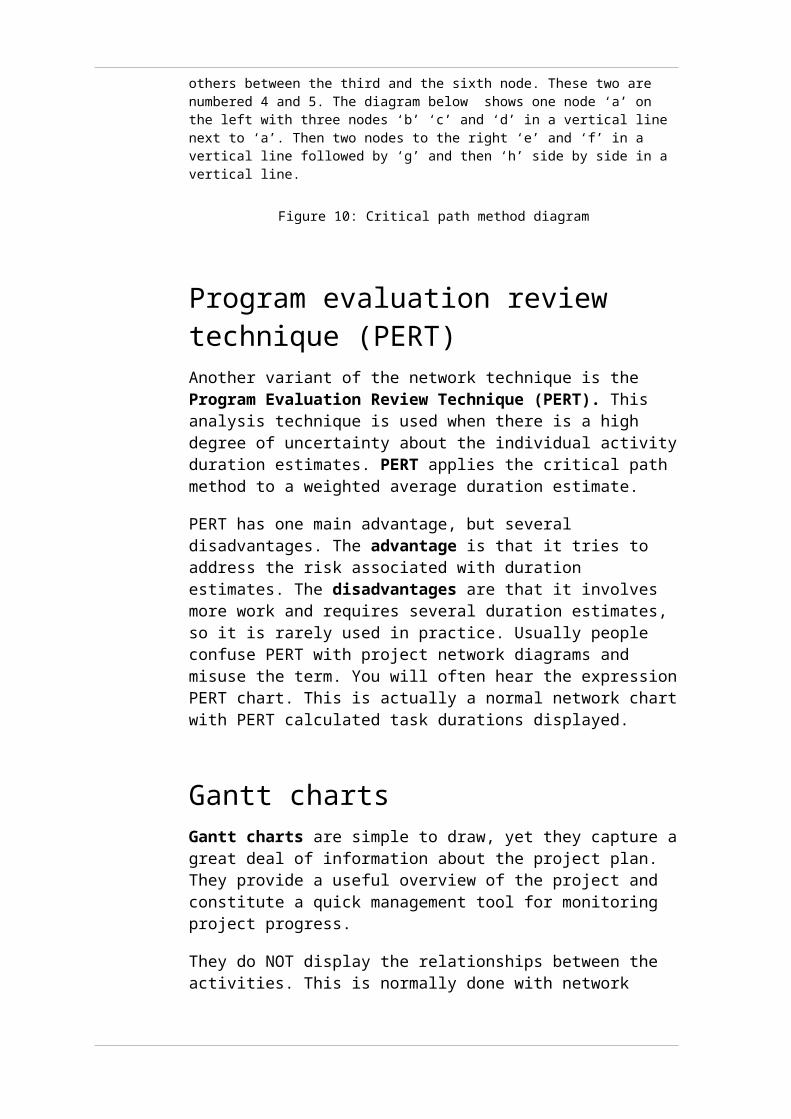
Image: The diagram at the top shows four nodes (circles) in a horizontal line with one node above and another below the others between the third and the sixth node. These two are numbered 4 and 5. The diagram below shows one node ‘a’ on the left with three nodes ‘b’ ‘c’ and ‘d’ in a vertical line next to ‘a’. Then two nodes to the right ‘e’ and ‘f’ in a vertical line followed by ‘g’ and then ‘h’ side by side in a vertical line.
Figure 10: Critical path method diagram
Program evaluation review technique (PERT)Another variant of the network technique is the Program Evaluation Review Technique (PERT). This analysis technique is used when there is a high degree of uncertainty about the individual activity duration estimates. PERT applies the critical path method to a weighted average duration estimate.
PERT has one main advantage, but several disadvantages. The advantage is that it tries to address the risk associated with duration estimates. The disadvantages are that it involves more work and requires several duration estimates, so it is rarely used in practice. Usually people confuse PERT with project network diagrams and misuse the term. You will often hear the expression PERT chart. This is actually a normal network chart with PERT calculated task durations displayed.
Gantt chartsGantt charts are simple to draw, yet they capture a great deal of information about the project plan. They provide a useful overview of the project and constitute a quick management tool for monitoring project progress.
They do NOT display the relationships between the activities. This is normally done with network diagrams. The Gantt chart should be used in conjunction with network diagrams, including the critical path method (CPM) and the project schedule, to give a clear overall picture of the project.
A Gantt chart has three basic parts: a time line, a list of activities and a bar for each activity (the length of which represents the time estimated for the activity).The activities are on the left-hand side of the chart and the time line across the top.
Click here (111 KB 2843_reading06.doc) to see a simple Gantt chart.
Four relationships between activities on a Gantt chart
There are four ways that activities can relate to one another.
Finish to start (FS) - The start of an activity depends on the finish of the previous activity.
Finish to finish(FF) - The finish of one activity coincides with the finish of another activity.

Start to Start (SS) - Two activities due to start at the same time must be completed before the following activity starts.
Start to finish(SF) - The start of one activity coincides with the finish of another.
Lead time
Lead time occurs when an activity can start before its dependent relationship to another activity has finished. The difference between the start of this activity and the finish of its predecessor is called lead time.
Lag time
Lag time is when there is a time delay between one activity and the next dependent activity. For example, after a system is implemented, the project may need to wait a few months before commencing a post-implementation review.
Slack / Float time
Slack time occurs when two or more activities must be completed before the next activity can begin. Both activities do not have to finish on the same day, but there is an end date by which both must be completed. The best way to represent slack / float time is to show two activities with one longer than the other.
Detailed Gantt charts
Complex Gantt charts can show the slack times and the absolute latest finish times by using different kinds of lines. They can also show milestones and the current project status. When creating complex Gantt charts, it is always a good idea to include a legend so that others reading it can associate what the different lines represent.
The example in the figure below shows the level of detail that can be put on a Gantt chart using Microsoft Project. We can see resource names, the task interrelationships and the percentage of completion for each task. Milestones have been represented as red diamonds.
Image: Diagram showing a complex Gantt chart displaying interlinking tasks, resources, critical path task duration, start and finish dates.
Figure 12: Complex Gantt chart
Research
Go to Washington’s Project Management Framework site and search for examples of project schedules. You can find this site at http://isb.wa.gov/tools/pmframework/index.aspx.
Activity 5
To practise creating a Gantt chart, complete Activity 5 — Gantt chart located in the Activities section of the Topic menu.
Quality planningAt the beginning of an IT project, it is critical to plan for the implementation of quality assurance processes. Planning for the implementation of quality assurance involves the following:
identifying quality stakeholders
determining quality objectives
determining quality standards and levels.
Project tasks and milestones to check quality can then be put into the project plan. Without a plan for quality assurance, it will not be a priority and stakeholder satisfaction can’t be measured.
Research
Look in your library or on the Internet for information on ISO 9000 standards.
The quality management plan
A quality project plan can include the following components:
Management responsibility
The people responsible for activities such as quality control, audits, reviews and corrective action should be identified.
Quality system
Project processes are described and the procedures for controlling them detailed.
Design control
The quality factors affecting design should be outlined, including
design processes and responsibilities
measurable design specifications
relevant standards and codes
client involvement.
Document management and control
Project document management procedures such as formatting, collection, storage and version control should be detailed. Controlled documents should be marked with
the project name
the document purpose
the intended audience
version control details.
Quality documentation must be produced and managed to be ISO compliant.
Supplier and product issues
The plan should outline the important products and suppliers, as well as the procedures for source selection, purchasing and delivery.

Inspection and testing issues
Inspection and test plans should be described. This may be a separate document. Client acceptance details should also be outlined.
The plan should identify inspection, measuring and test equipment, and include the procedure for ensuring the fitness of the equipment.
The deliverables such as inspection and testing reports should be outlined, thus ensuring there is a method for identifying testing status during the project.
Corrective and preventative action
The plan should include procedures to ensure that any products that don't conform to specified requirements are prevented from unintended use or installation.
Procedures should be documented for implementing corrective and preventative action.
Quality audits
Audits are designed to periodically review project processes and may include internal audits, client or third party audits, and audits of key suppliers. A project audit timetable and responsibility for audits should be established.
Training
The plan should outline how staff will develop and maintain their skills throughout the project.
Servicing
If servicing and maintenance form part of the contract, servicing procedures should be detailed.
Statistical technique
The plan should detail any statistical techniques used in the project.
The list of topics to be included in the quality plan appears quite formidable. However, for most projects you will not need to develop a comprehensive set of new processes and procedures if your organisation has an existing quality policy. Wherever possible, you should refer to the existing organisational quality policy.
The quality plan format
The quality plan may be a stand alone document or an annex to the project management plan (PMP), depending on the level of detail required. Regardless of which formatting approach is taken, you should ensure that the quality plan
explains how the generic quality procedures are related to the project
includes only an appropriate amount of detail
does not duplicate the PMP or organisational quality policy.
Activity 6
To practise identifying quality stakeholders for a project, complete Activity 6 – Quality planning in the Activities section of the topic menu.
Communications planningEffective communication is critical to a project’s success. Project communication management refers to the application of skills and techniques to ensure that all stakeholders and members of the project team receive required information when expected. It is about the gathering, generation, distribution, and storage and disposal of all project information.
Keep the following in mind:
Keep progress communication reports simple and easy to read as this is the key to successful communications.
Make sure that you distribute reports to the right people.
Remember that stakeholders have an interest in project costs as well as the progress of the overall project activities.
Make sure project team members are informed about task completions and progress against task lists.
All this needs to be done on a regular basis.
Remember the three ‘W’ approach to good communications skills:
who needs to know what
when they need to know it
what format they want the information in.
In the planning phase, strategies need to be designed for formal and informal communications. This is done by specifying what communications methods will be acceptable during the project.

Informal communication includes phone conversations, emails and memorandums. Formal communication includes letters, status review meetings and official presentations to stakeholders.
A Stakeholder Communication Analysis table can be put together to clearly show which stakeholders should get which written communications, the contact person, when it is due and the preferred format.
Table 9: Stakeholder communication analysis
Stakeholders Document Name Document Format Contact Person Due
Customer management
Monthly Status Report
Hard copy Mary Brown, Jane Feldman
First of month
Customer Business Staff
Monthly Status Report
Hard copy Dave Martin, Geoff Macdonald
First of month
Customer Technical Staff
Monthly Status Report
E-mail Evan Davis, Nancy Vandrine
First of month
Internal Management Monthly Status Report
Hard copy Jack Thomson First of month
Internal Business and Technical Staff
Monthly Status Report
Intranet Sarah Liu First of month
Training Subcontractor
Training Plan Hard copy Mark Kraus 11/4/2006
Software Subcontractor
Software Implementation Plan
E-mail Barbara Watkins 6/4/2006
The communication plan
Makes sure that you have a communications plan that contains
a list of all required communications
the target for each communication
the method of each communication
the frequency of each communication
who is responsible for each communication.
This plan is included in your project plan documentation. Here is an example of a Communications planning template (41 KB 2843_reading02.doc).
Research
For further examples of communication planning documents, go to Washington’s Project Management Framework site and search in the

examples for communication planning documents. You can find this site at http://isb.wa.gov/tools/pmframework/index.aspx.
Risk management planningYou've created a detailed plan for your project and you believe you've accounted for everything. What could possibly go wrong? Plenty! The question is, ‘Where will the project go awry and what can you do to avert disaster?’ Assessing and managing risks is the best weapon you have against project catastrophes. By evaluating your plan for potential problems and developing strategies to address them, you'll improve your chances of a successful - if not perfect - project. The following diagram shows how assessments of risk fit into the tactical planning of a project.
Image: The flow chart is divided into 2 sections. On the left is Analysis; on the right is Management. On the analysis side of the diagram from top to bottom and left to right: ‘WBS’ is above ‘Risk assessment checklist’, both with arrows pointing to ‘Identify risks’, which has an arrow pointing to ‘Asses each risk’, with arrows pointing to ‘Probability of occurrence’ and ‘Likely impact’. Both point to ‘Assess each risk’. ‘Assess each risk’ has an arrow pointing to ‘Risk list or register’ and, on the management side of the flow chart, to ‘Determine effects on estimate, plans’ and ‘Strategy for this risk?’. ‘Strategy for this risk?’ also points to ‘Determine effects on estimate, plans’. ‘Determine effects on estimate, plans’ points to ‘Revised plans’, ‘Estimates (contingency reserves)’, ‘Contingency plans’. ‘Strategy for this risk?’ also points to ‘Contingency plans’.
Figure 13: Tactical planning of risk
There are three major activities in addressing risk management.
Risk identification
Risk analysis
Risk response planning
Risk identification
Risk identification is the process of understanding what potential unsatisfactory outcomes are associated with a particular project. Not all risks are equal; some are more likely to occur than others, and all have different impacts. You need to consider each risk factor against two criteria:
What impact will this factor have on the project if it should occur?
What is the probability of the event occurring?
These results can be plotted on a matrix:
Image: Probability of impact table. y axis from top to bottom is high, medium and low. On the x axis from left to right is low, medium and high. Risk 6 is a high probability, low impact. Risk 9 is a high probability, medium impact. Risk 1 is a high probability, high impact. Risk 3 and 4 is a medium probability, low impact. Risks 2, 5, and 11 are medium probability, medium impact. Risks 8 and 10 is a low probability, medium impact. Risk 12 is a low probability high impact.
Figure 14: Risk identification matrix
Obviously, Risks 1 and 4 will require some response as your judgement is that these risks are highly likely to occur and will have a significant impact if they do.
Risk response planning
Having analysed the situation, the next step is to decide what to do about the risks.

Potential responses include
avoiding the risk — perhaps excluding some risky areas or not doing the project at all
reducing the risk (likelihood and/or impact)
transferring the risk to others (insurance)
developing contingency plans (to be implemented should the risk occur)
accepting the risk (just monitoring the situation).
The risk management approach should be documented. Click here (44 KB 2843_reading03.doc) for a template for risk assessment and management.
Research
For more risk analysis examples and templates, go to Washington’s Project Management Framework site. You can find this site at http://isb.wa.gov/tools/pmframework/index.aspx.
Procurement and solicitation planningProject procurement management is the process by which the organisation acquires goods and services from external suppliers to meet the needs of the project. Many organisations have procurement policies in place as part of their company systems and procedures. However, the main planning processes of procurement management are the following:
Procurement planning: Determine what you need, when you need it, what you need to outsource, and why. You should review the work breakdown structure, staffing levels, cost estimates and schedules to determine if procurement is necessary. The result will be a procurement management plan that forms part of the overall project plan.
Solicitation planning: Develop documents that identify potential sources and evaluation criteria. One output from this is a Request for Proposal (RFP) (36 KB 2843_reading04.doc), which is issued by the organisation to outside suppliers. This document will usually contain a statement of work required, location, timeframe, acceptance criteria and any special requirements that apply.
The project planNow that the planning process has been completed, it is time to compile the planning documentation into a project plan. This document is then used to guide both project execution and project control. Project plans vary from a
very simple single page document with some objectives, a task list, resources and budget, to a complex report accompanied by books of estimates, task lists, Gantt charts, critical path analyses, etc.
A project plan is a document that brings together the planning and documentation of the project in a co-ordinated manner. It provides a guide for the execution and control of the project.
The size, complexity and importance of a project will dictate the project plan format. Usually, the plan will contain the following:
Introduction or Overview
Project Organisation
Managerial Processes
Technical Processes
Major Work Packages
Schedule
Budget
Introduction or Overview
The following information should be included:
Project name
Brief project description, including needs it addresses. It should clearly outline the goals and reason for the project and be non-technical in style, avoiding jargon. It should include a rough time and cost estimate.
Sponsor/client name and contact details
Names of project manager and key team members(if a large project)
Project Deliverables (software packages, pieces of hardware, technical reports and training materials are examples of deliverables).
List of important reference materials. Listing important documents or meetings related to a project can help stakeholders understand the history of a project. This section should reference and summarise important parts of the plan produced for other knowledge areas such as scope management, schedule management, cost management, quality management, communications management, risk management, etc.
List of definitions and acronyms, if appropriate.
Project Organisation
Project organisation should include
Organisational charts of the sponsor/client’s company, project organisational chart to show lines of authority, responsibilities and communications.
Project responsibilities, i.e. define major project functions and who is responsible for them.
Other process-related information. For example, if the project involves a major software upgrade, it might be useful to have a diagram or timeline of the major steps involved in that process.
Managerial Processes
Managerial processes should include
Management objectives, i.e. senior management’s view of the project, including perceived priorities and constraints.
Project Controls, describing how to monitor project progress and handle changes.
Risk Management, describing how risks will be identified, managed and controlled. It should refer to the risk management plan.
Project Staffing, describing the staff required for the project.
Technical Processes
Technical processes should include
Specific software development methodologies or CASE tools to be used
Specific formats for technical documentation
Major Work Packages
Major work packages should include
Work Breakdown Structure
Key deliverables and associated Quality Standards.
Other work related information such as specific hardware or software that must be used or certain specifications that must be followed

Schedule
The schedule will usually consist of
Gantt chart
PERT chart or Network diagram
Budget
The budget should include
Summary budget, including the total overall estimate of the project’s budget. It is important to identify those values that cannot change and those that are rough estimates only at this stage.
Detailed budget, for example:
o The fixed and recurring cost estimates per annum for the project.o The projected financial benefits of the project.o The types of people needed to do the work.o Labour cost calculations.
Project plans should be dynamic, flexible and subject to change as the project environment changes. Project plans will vary in content depending on the size and nature of the project. There is no fixed guideline for the level of detail that should go into the project plan. However, consider the following. If the project is the installation of a new server and will take only one week to complete, there is no point taking two weeks to develop the project plan. If your project is the implementation of a global information network that will cost $2.5 million, take 6 months to do and involve over 100 people across seven countries, then one month of planning will be a small cost to pay for the successful completion of the project.
Research
The IEEE website (http://www.computer.org/portal/site/ieeecs/index.jsp) has a number of project management templates. Look for these templates. Do they have the inclusions listed below?
acquisition strategies
budget and financial management strategy
contract management
cost estimates
evaluation criteria
expected outcomes/measurable benefits of the project
facilities
inclusions and exclusions from the project
information/communication strategy
intellectual property strategies
milestones
objectives
outputs/project deliverables and their acceptance criteria
people plan including human resource management and human resource development
performance criteria/indicators
project control mechanisms
project implementation strategies
project governance strategy
purpose
quality assurance
quality control
quality standards for project
rationale
required project resources
resource management
risk management
roles and responsibilities
schedule/timeline
task/work breakdown structure (WBS).
Project plan executionNow that the project plan has been created, it is time to put the plan into execution. This involves managing and performing all of the work defined in the project plan. As would be expected, the majority of time and money is usually spent on execution. This is where the products of the project are produced.
Good project management views project planning and execution as inseparable activities. The main function of producing a good project plan is to guide project execution. A good plan should help to produce good work results. To improve the coordination between project plan development and execution, those who will do the work should plan the work.

Tools and techniques that help perform activities of the project execution process include the following:
Work Authorisation System is a method for ensuring qualified people do work at the right time and in the proper sequence. The method used can be manual, in which written forms and signatures are used for authorisation, automated, or in the case of small projects, verbal authorisations are adequate.
Status Review Meetings are regularly scheduled meetings used to exchange project information. They can be an excellent method of motivating people to make progress on the project. If staff are aware that they have to provide formal progress reports to the major stakeholders on a regular basis, they will make sure they have completed some work to report on! Sending a written report is not as effective as giving a verbal presentation.
Project Management Software is specifically designed for project management and can assist greatly in creating and executing the project plan. Gantt and PERT charts can be generated quickly and easily and tracking of the project can be performed using a baseline plan.
Managing time
Time is a very valuable commodity. It is the one resource we all have that cannot be increased just because we need or want more. In today’s highly competitive business world, we are constantly asked to do more with less and in the same time. Simply put, you have all the time that you are ever going to get!
Personal time management will allow you and your team to
eliminate waste
be prepared for meetings
refuse excessive workloads
monitor project progress
allocate time in accordance with a task's importance
ensure that long term projects are not neglected
plan each day effectively
plan each week effectively
do tasks simply with a little self-discipline.
Encourage your team members to keep a log of everything they do in a normal working day. In this way, they can see clearly how much time they spend on work tasks and how much time is potentially wasted.

The following table is an example of this process. You will see from this table of a sample day, that 0900–1700 equals 400 minutes for work and 80 minutes for lunch and coffee breaks So 47 minutes for interruptions represents 11.75% waste with social interruptions alone. You may think that this is high, but you will get a surprise when you do your own log honestly. Try to imagine this in terms of whether you’d like to give away 11.75% of your salary, for example!
Table 10: Daily log
Start work 09:00
Activity Start time Stop time Total time in minutes
Morning coffee 0900 0910 10
Check emails 0910 0940 30
Read project status reports
0940 1025 45
Attend project review meeting
1030 1130 60
Coffee break 1130 1140 10
Write up minutes from meeting
1140 1200 20
Lunch 1200 1300 60
Update project plan
1300 1435 95
Coffee break 1435 1445 10
Write memo to staff re new project
1445 1527 42
Weekly staff meeting
1530 1630 60
Write up minutes from meeting
1635 1700 25
Interruptions 0900 1700 47
Activity 7
To practise recording a log, complete Activity 7 — Managing your time in the Activities section of the Topics menu.

Some dos and don’ts of time management
Don’t
Don’t allow a lot of social interruption such as long phone calls, conversations around the coffee machine, etc. We all need breaks, but if it’s a choice between chatting to a workmate over a coffee or meeting a deadline, the deadline must come first.
Don’t procrastinate. Check your log to see if any tasks are being delayed or deadlines missed simply because they are dull or difficult. Five minutes sorting the filing drawer after finding that boring audit file that you need to analyse is a waste of time. Break the unpleasant task into smaller tasks and do it a bit at a time.
Don’t allocate too much time on one task. In your time log, look at each work activity and decide objectively how much time each activity was worth to you and compare that with the time you actually spent on it. An afternoon spent polishing an internal memo into a Pulitzer Prize-winning piece of provocative prose is a waste of time.
Don’t keep changing activities. Time is often wasted in changing between activities. For this reason, it is useful to group similar tasks together, thus avoiding the start-up delay of each. The time log will show you where these savings can be made. You may then want to initiate a routine to deal with these tasks on a fixed but regular basis.
Don’t do a subordinate’s work. You may think it is simpler to do the job yourself. Using the stamp machine to frank your own letters ensures they leave by the next post; writing the missing summary in the latest progress report from your junior is more pleasant than sending it back (and it lets you choose the emphasis). However, doing this does not actually save time! Assigning secretarial duties to secretaries can make large gains, as they regularly catch the next post and they type a lot faster. Your subordinate should be told about the missing section and told how (and why) to slant it. If you have a task that could be done by a subordinate, use the next occasion to start training them to do it instead of doing it yourself. You will need to spend some time monitoring the task thereafter, but less than in doing it yourself.
Don’t do the work of others. A major impact upon your work can be the tendency to help others with theirs. In the spirit of an open and harmonious work environment it is obviously desirable that you should be willing to help out, but check your work log and decide how much time you spend on your own work and how much you spend on others’. For example, if you spend a morning checking the grammar and spelling in the training material related to the last project, then that is a waste of your time. Publications should do the proofreading as that is their job. You should deal with the technical level.

Don’t attend unnecessary meetings. Be ruthless and eliminate all unnecessary meetings. There may be committees where you can’t productively contribute or where a subordinate might be better able to participate. There may be long lunches which could be better run as short conference calls. There may be interviews which last three times as long as necessary because they are scheduled for a whole hour. And there may be meetings that you attend because you always attend them and for no other reason. Don’t!
Do
Schedule tasks and projects. The most daunting external appointments are deadlines, which are often the handover of deliverables. Do you leave the work too late? Is there commonly a final panic towards the end? Are the last few hectic hours often marred by errors? If so, use personal time management.
The basic idea is that your management of personal deadlines should be achieved with exactly the same techniques you would use in a large project.
Check the specification. Are you sure that you agree with what is to be delivered?
Break the task down into small sections so that you can estimate the time needed for each and monitor progress.
Schedule reviews of your progress (eg, after each sub-task) so that you can respond quickly to difficulties.
Keep long term objectives in mind. Long term objectives have the disadvantage of being important but not urgent as they do not have deadlines and seem remote. For this reason, it is all too easy to ignore them in favour of the urgent and immediate. Clearly, a balance must be struck.
The beauty of time management is that the balance can be decided objectively (without influence from immediate deadlines) and self-imposed through the use of the diary. Simply, you might decide that one hour a week should be devoted to personnel issues and allocate a regular block of time to that activity. Unless a crisis occurs, this time should then be used correctly and always applied to the same, designated purpose.
Similarly, time may be allocated to staff development and training. If one afternoon a month is deemed to be a suitable allocation, simply designate the second Thursday (for example) of each month and delegate the choice of speakers. The actual time spent in managing this sort of long-term objective is small, but without that deliberate planning it will not be achieved.
Be prepared for meetings. If you are going to a meeting where you will be asked to comment on a specific report, allocate time to read it. This will avoid delays in the meeting and increases your chance of making the right decision the first time. Consider what actions need to be taken beforehand

and what actions must be taken to follow-up. Even if the latter is unclear before the event, you must still allocate time to review the outcome and to plan the resulting action. Simply mark in your diary the block of time necessary to do this and when the time comes, do it.
Use time management tools. To effectively manage your time, you need tools to help you. Action plans, to do lists, and timesheets are all useful tools in the management of your time in projects.
Time management tools
Time management tools include
action plans
‘to do’ lists
activity logs
timesheets.
Action plans
An action plan is a brief list of tasks that you have to carry out to achieve a specific objective. It differs from a to do list in that it focuses on the achievement of a single goal, rather than focusing on several goals that have to be achieved in a period of time. Drawing up an action plan allows you to concentrate on the stages of the achievement and monitor your progress towards that achievement.
To do lists
To do lists are lists of tasks to be carried out to achieve goals. These goals might be specific targets or may simply be the efficient administration of your day. By ordering these tasks in order of importance, you have prioritised your to do list, and this will allow you to concentrate on the more important tasks first.
These lists are an extremely powerful both as a method of organising yourself and as a method of reducing stress. Often problems may seem overwhelmingly large or you may have a seemingly huge number of demands on your time. Without to do lists, you may feel out of control or overburdened with work.
It is a good idea to prepare to do lists whenever it suits you. Some people recommend doing them at the end of each day for the next day, others at the beginning of a day and others whenever they feel that things are getting out of control. The important thing is that you use them in the way that suits you.
Resolving time conflicts by prioritising tasks:
The solution is often simple:
Write down the tasks that face you and allocate the importance using, A = must be done, B = should be done, and C = nice to do (unimportant).
Go through the B’s and reallocate them as either A or C.
Prioritise the A’s in the order that they must be completed and leave the C’s until you have the time to do them.
If any of the A’s are too large, break them down into smaller elements. If these still seem large, break them down again. Do this until everything that you have to do is listed.
This method is sometimes called the ‘Swiss cheese method’. Basically, we take a large job and keep poking holes in it until it is reduced in size and completed.
Activity log
Activity logs are an effective way of monitoring the way you spend your time. If you work purely from memory, it is easy to believe that you spend all your day working. However, if you keep an activity log for a few days you may be surprised to see precisely how much of your day is wasted, thus allowing you to become more efficient in your daily activities.
Timesheets
Timesheets are used to accurately manage resources. Each team member completes weekly timesheets, recording time against task numbers. As each task number has a budget, this allows management to compare actual time spent to budget and variance reporting. It also allows identification of time wasted on unnecessary tasks.
Project models for a ‘birds-eye’ view of progress:
Although the timesheets provide actual versus budget information at an individual task level, this information does not readily provide an overall view of how the project is progressing. So to overcome this problem, the project manager usually enters the timesheet data into a computer software application. This automatically summarises timesheet data from the task level to the higher level on a weekly or monthly basis as follows:
by activity (eg logical design)
by module (eg general ledger)
by project (eg financial system) .
For each level, the project model shows
total budget
budget issued to date

percentage of budget issued
total actual time expended to date
forecast time to complete
estimated over/under run.
Keeping track of appointments
The project manager's day is hectic at the best of times. Trying to keep abreast of the daily activities during a project is difficult enough without having to remember appointments. There are many software applications that can assist the project manager in keeping track of appointments.
Software tools
Lotus Notes has a good appointment calendar and is very popular amongst large organisations as it is used as an emailing facility as well as appointment calendar and database program.
Microsoft Outlook also has reasonable time management features.
Research
There is a good range of software available, with prices ranging from free to very reasonable to quite expensive. To view a reasonable sample, together with their features, search the web with the search phrase ’manage to-do-list’.
Project monitoring
The control loop
The development of a project is a cyclic process of monitoring, controlling and directing work. Consider the following diagram.
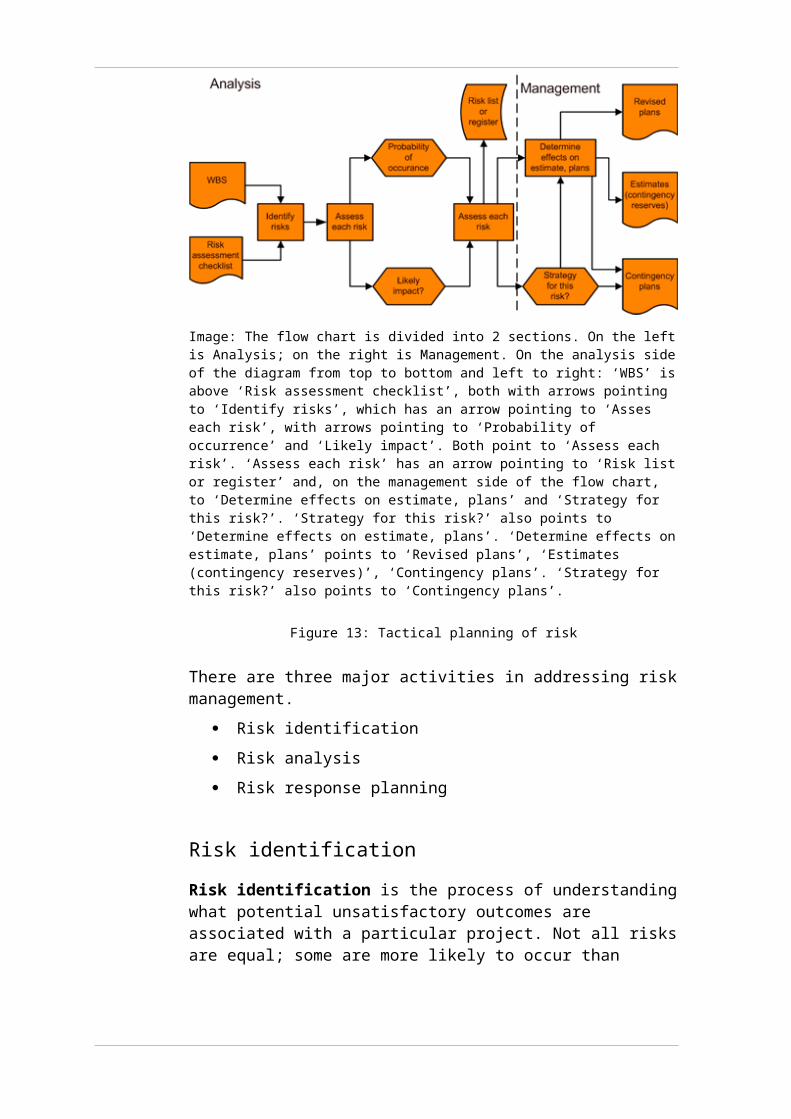
Image: Circular diagram showing project manager with an arrow pointing to project (supervision) team, then with an arrow (actions) pointing to the project, then an arrow (output) pointing to measuring device, then an arrow (status measures) pointing to project manager. There are external influences on the project such as unforeseen problems that the project manager must detect
Figure 15: Cyclic process of monitoring
Assess, approve and manage change
In larger projects, reports that say everything is on target, on budget, etc. are usually too long to be read and digested. Monitoring and control is usually achieved through exception reports, variance reports and graphical reports. These assist in management decision making because they are in a concise format and easy to read.
Once a significant variation from the plan is detected, the next step is to determine appropriate corrective action and timing of the action needed to get back on plan. This may be as simple as a resource reallocation to assist
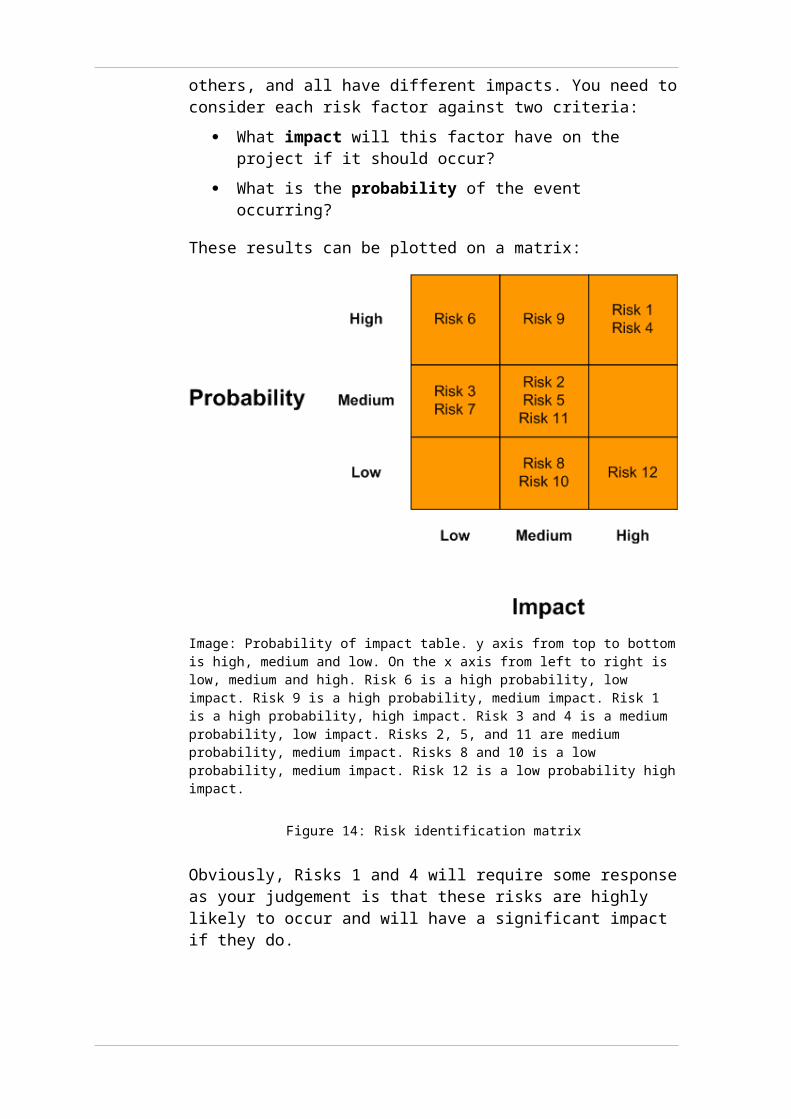
in task completion or it may be as complex as a complete rescheduling of the current phase to overcome a major equipment supply problem.
Variation can be both good and bad. For example, being ahead of schedule and under budget at any phase is music to the ears of project managers and stakeholders. Positive variances usually allow some replanning that could bring the whole project in ahead of schedule, under budget or both. Of course, you may prefer to be in the current actual position rather then where you planned to be. This will usually require some replanning of current work.
Negative variances on task time are bad but in most cases this will only affect the project completion if the variances occur in tasks that are on the critical path.
It is very easy to get carried away and implement too many controls and associated reports. You must balance the rigidity of a tightly controlled project with the need for flexibility and creativeness.
Any changes that are identified should be analysed, negotiated and agreed upon by relevant parties. Any changes acted on will need to then go through the change control procedure as discussed later in the readings.
Decision making and negotiating change
Just by using a pencil, paper and clever formulas, you can convince people that a change to the project is worthwhile. Computer software can make the convincing even easier. The problem is that little is actually known about the consequences of an investment.
For example, information recommending a change to a project that predicts an increase in sales may be rejected as being unrealistic. However, in rejecting this, the organisation may miss out on other benefits such as higher quality, improvements in the environment, improved cash flow, etc. If, though, the organisation makes the change, it may be hard to determine the exact ‘value added’ of the change.
More often than not, in making these decisions you will need to negotiate.
Negotiation is essentially a process between individuals or parties where goods, services or information are exchanged for an agreed rate. This rate may be either financial or non-financial. In other words, it is about bargaining.
There are two general approaches to bargaining:
distributive bargaining
integrative bargaining.
Distributive bargaining
Distributive bargaining is about negotiating who gets what share of a fixed pie. A good example is union versus management negotiations over wages. The union will be trying to get the best on behalf of the employees and management will know that every extra dollar the union gets will increase the cost of production.
Integrative bargaining
Integrative bargaining is somewhat different. This form of bargaining is more about finding an amicable solution which results in a win-win for both parties. A good example of this is in sales. A customer places a large order for goods but has a poor track record of paying on time. Since both parties want the transaction to go ahead, the company asks the customer to provide a bank guarantee that the finance is available.
Conflict management
What is conflict?
Conflict can occur between people because there are
differences in interpretation of facts, methods or goals
differences in values and beliefs
different treatment of individuals and groups.
Here are some common causes of conflict in organisations:
lack of resources
frustration with people, systems or processes
blockages due to bureaucratic procedures (red tape), approvals, policy, payment and so on
change - eg new staff come on board, or new systems are implemented, or external consultants come into the organisation
inequity, such as unfair treatment
jealousy as a result of favouritism.
How to deal with conflict
It may sound strange at first, but sometimes you need to stimulate conflict to cause improvements and change. Put another way, it’s better to get your team to talk about problems or grievances than to let them worry about things — nothing gets solved like that!

The important thing is to communicate. Talk to people regularly, not just when there’s something wrong. If there seems to be something wrong, ask them to tell you what is happening.
In conflict situations, people can become anxious or aggressive. It’s your job to keep things on track.
Remember these important things:
Stay calm. It’s quite possible that at least one person may be in a very excitable, volatile state. If you are in the same condition, the chances of coming to a resolution are very small. You must remain calm.
Find a private space. If the conflict was initiated in front of other team members, ask the person to go with you to your office or a conference room to discuss the conflict out of the way of prying eyes and ears. The fewer disturbances the conflict creates for the group, the better.
Look for the real issue. When a team member feels strongly enough about something to act, he or she may cloud the issue by making far-flung accusations and issuing ultimatums. You need to get to the heart of the matter and find out what is really upsetting them. Ask simple things like, ‘Can you tell me more about what happened?’
Meet the problem head on. Don’t avoid the real issues. Now is the time to engage in the conflict and acknowledge any correct facts presented by the other person. Then, either agree or disagree with them. If you disagree, explain your reasons clearly.
Solve the problem. Work with the individual to figure out how to change his or her belief that there is a problem. Or, if there really is a problem, work on how to solve that problem. You might ask the person how he or she would solve the situation or what he or she would do differently to avoid the problem in the future.
Outcomes of conflict
Conflict usually results in either a positive or negative outcome. These outcomes are measured in terms of either an improvement in performance (positive outcome) or a decline in performance (negative outcome).
Table 11: Positive and negative outcomes
Productive conflict results in positive outcomes:
Unproductive conflict results in negative outcomes:
Better decisions Stress
An increase in motivation Loss of group cohesion
Stimulation of creativity Decrease in productivity
Problems being brought out into the open Increased absenteeism and turnover
Increased self-awareness Communication difficulties
Change Discontent
Achieving positive outcomes
When you manage difficulties or issues in your workplace, it’s a good idea to reflect on how you went. Ask yourself some of the following questions, which will assist you next time you are dealing with difficult situations in your workplace. You could do this individually or with your team.
1. What went well and less well? What did I do to contribute to the outcome? What do I know now that I didn’t know before?
2. What have I learned about behaviour – about my own behaviour and about the way other people behave? What insights have I gained into dealing with this kind of experience in the future?
3. What do I need to challenge about the way I behave? Are there any old ideas or behaviours I need to unlearn first?
4. How, where and when can I use this knowledge to improve my performance?
Activity 8
To practise managing difficult situations, complete Activity 8 — Change negotiation located in the Activities section of the Topic menu.
Project change control procedures
The Issues log or register is the birthplace of project change. Change cannot occur unless an issue has been logged. Some type of change usually occurs in all projects, but more importantly, change must be controlled to make sure that the changes have a positive affect on the project. Without a rigorous and negotiated process to evaluate the need for and impact of changes, the business case and associated project plan can be disrupted, requiring drastic rescheduling of tasks or even the entire project. In this context, changes can be internal or external.
Internal changes are those that arise during project development due to misinterpretation of requirements, errors of principle or fact, estimation errors, project team member changes, invalid logic or technical issues that could not be foreseen during the initial planning of the project, etc.
External changes arise through user or client policy decisions, oversights, new ideas, requirements of other projects, and so forth. These cannot be construed as being part of the original system specification.

Although it is likely that an internal change will be accepted as essential for control purposes, both internal and external changes must be treated in the same manner. Control of change involves three steps:
request for change
evaluation
decision.
All requests for change should be in writing no matter what the source, otherwise control is lost. The requirement is for a brief memorandum, addressed to the project manager, which includes
the originator’s name
date of request
description of the problem addressed
description of the change
justification for the change.
The change control committee evaluates the request for change. The change control committee usually contains some members of the steering committee, the project manger and any other high level mangers in the project team that are impacted by the change. The change control committee’s task is to analyse and evaluate the change request. Evaluation should cover the following points:
Is the change justified?
If justified, is it essential that it be made at this time, or could it or another feature be deferred until the post-implementation review phase at the end of the project?
Does the change alter the business case for the project?
Which tasks are affected: those completed, in progress, or to be commenced?
What is the estimate of duration and work effort required to implement the change?
Will implementing the change require rescheduling of the project and/or extension of the completion date of the project?
Will the change require additional resources to carry out?
Does the change impact subprojects or systems?
Does the change require an alteration to the project development strategy?
Does it alter the complexity and risk of the project?
What risks are involved, whether the change is implemented or not implemented?

The results of the evaluation and impact analysis should then be added to the memorandum requesting the change.
The change committee may decide to accept the change based on the assumptions that they have no doubt that change should be made at this time and provided it will not require additional resources, alter the complexity, change the business case and/or extend the completion date of the project.
If there is some doubt or if the change is extensive, a meeting of interested parties should be called, including the requestor and evaluators of the change. At this meeting, all aspects of the decision should be discussed and a recommendation made to proceed or act otherwise. This recommendation, in turn, may be referred to system and/or user department management for confirmation and approval by a steering committee.
Decisions must be communicated in writing to the requestor. Furthermore, the proposed change may be scheduled as a planned enhancement following successful system or product installation. Decisions at this level are considered final for the duration of the project to avoid wasteful re-evaluation of old issues.
In summary, sensible change control requires
that all changes are to be requested in writing and submitted on a trackable form for approval by the change control committee, which is usually made up of key stakeholders and the project manager
identifying that a change is necessary and making sure that the change is beneficial to the project
that changes to the product scope are reflected in the definition of the project scope statement
the integrity of the performance measurement criteria — all changes must be reflected on the scope, tine and cost lines
determining that a change has taken place
management of the actual change.
Change control — an example
Let’s now look at an example of change control in a project. Below is a simple change request form layout that could be used.
Table 12: Change request form
Change request number 152
Project name: Flash!
Date: 15/2/2002
Requested by: Jack, Sales and Marketing Manager
Phone: (02) 9111-2233

Change requested: Add a new report that lists customer preferences from the customer management data base.
Reason for change: To provide information to the marketing department to assist with product development.
Impacts on Project
Technical: None
Budget: $2800 increase
Schedule: 2 days
Outcomes: An additional report
Other projects: None
Approved / denial details
Approved: YES/NO
Conditions for approval: None
Approved by: Fred, Project Manager
Date: 28/2/2002
Signature: Fred
Reason for denial:
Performance reporting
You should already have developed your communication plan to determine who needs to know what and when they need to know it.
The design of the progress reports
The design of the report depends on the information that you feel is necessary for key stakeholders to know. The usual information in a team member’s progress report includes
a list of completed activities
a list of incomplete activities (those that are supposed to be completed, but are not)
a list of activities in progress.
The usual information that is included in the summary progress report includes
a summary of the current standing of the project
a list of completed activities
a list of incomplete activities
a list of activities in progress

an updated Gantt chart
a list of issues still requiring resolution.
Progress reports are used to update the network diagram, the Gantt chart and alter the critical path if necessary. They are then compared to the original plan or baseline schedule. This is how you inform the team members and stakeholders about the following:
how the project is progressing
if the project has the potential to fall behind
any lag times that need to be taken advantage of so that the project does not fall behind
any contingency plans that have been created.
Reports are a strong means of communicating with team members. Even though meetings are the most effective way to communicate with a team, sometimes the time factor does not allow for a meeting to take place. Instead, a progress report, for example, and an updated Gantt chart can be distributed to all team members and stakeholders showing the changes in the duration of activities.
This can also be seen as a measure of personal and team performance. Each team member can evaluate their performance and see how the schedule is affected (if it is affected) by their performance.
There are three types of reports that most project managers usually use as well as the general progress report seen below. They are Gantt charts, exception reports, and variance reports.
Progress reports that show what the project has accomplished, next steps and outstanding issues are common. For example:
1. Accomplishments of month of January (or appropriate month):
a. Describe most important accomplishments. Relate to project’s Gantt chart.
b. Describe other important accomplishments, with one bullet for each. If any issues were resolved from the precious month, list them as accomplishments.
2. Plans for February (or the following month)
a. Describe most important items to be accomplished in the next month. Again, relate to the project’s Gantt chart.
b. Describe other important items to accomplish, with one bullet for each.
3. Issues: Briefly list important issues that surfaced or are still important. Managers dislike surprises and want to help the project succeed, so be sure to list issues.
4. Project changes (date and description): List any approved or requested changes to the project. Include the date of the change and brief description.
Exception reports take many formats but basically they are only generated when something is outside of a previous specification tolerance. In most cases, an arbitrary level of 10% variation from performance will generate an exception and cause a report to be produced. This applies to cost as well as time measurement criteria.
The simplest type is the variance report, which provides a snapshot of the project or any activities of the project.
Table 13: Sample variance report
Activity Variance Report Activity Name Activity Manager Date
___Cost ___Labour ___Time ___Other
Task Budget this period Budget to date
Number Name Responsibility Plan Actual Var Plan Actual Var
Totals
Prepared by Date Approved by Date Sheet __ of __
A variance report doesn’t report on how the project reached this status; it is merely an indicator of performance against plan. The same format can be used to report variance on the project as a whole as well.
Another way of showing variance is with a simple line graph. Look at the sample below showing project cost variance. This gives a quick visual representation and trend:
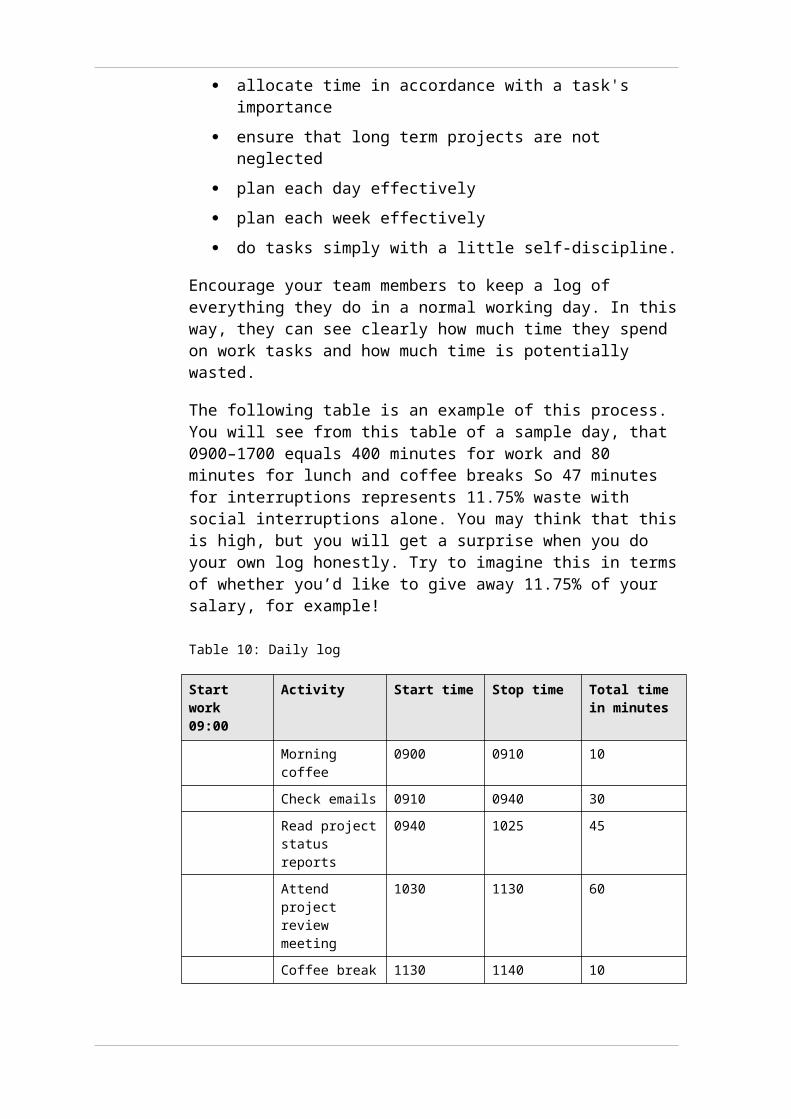
Image: Line graph showing planned, actual and forecast project cost. Costs are on the left axis going form $5,000 to $40,000 and time is measured in weeks on the bottom axis.
Figure 16: Variance cost report
Although these simple variance reports convey budget and exception variations from plan, they don’t tell the whole story. A Gantt chart is one of the most convenient, most used and easiest method of representing project activities at a glance. A complete list of tasks is recorded down the left side of the chart in a table, and progress is indicated against time by the use of bars and colours to show completed status.
Here is an example of a simple Gantt chart. The black sections of the horizontal bars indicate work completed.
Image: Gantt chart with list of activities on left axis and time line in days on top axis.
Figure 17: Simple Gantt chart
Generating the reports is a two-stage process. Firstly, team members are given a template of a progress report that they are to complete according to a schedule. You will then summarise all the information on these periodic progress reports and submit the appropriate status report to key stakeholders and functional managers.
These reports are used to identify delays in activities, issues that team members are facing, and also risks. From these inputs, you can create contingency plans and make any necessary changes to the overall plan.
Earned value management is a project performance reporting technique that integrates scope, time and cost data. Given a cost performance baseline, you can determine how well the project is meeting scope, time and cost goals by entering actual information, then comparing it to the baseline. A baseline is the original project plan plus approved changes. Actual information includes whether or not a WBS item was completed or approximately how much work was completed, when the work actually started and ended, and how much it actually cost to do the completed work. Below is an example of an earned value chart:
Image: Chart with costs on the left axis and months on the bottom axis with a line plotting ‘Earned value’ against ‘Actual cost’ against ‘Budget at completion’.
Figure 18: Sample Earned Value Chart
To open a sample earned value chart in Microsoft Excel click here (42 KB 2843_chart.xls)
For a complete discussion of this tool and how to prepare a chart, visit the Project Magazine website at http://projectmagazine.com/.
Other performance reports may be required. Refer to the communications plan for specific stakeholder requirements.

Activity 9
To practise creating a variance report, complete Activity 9 — Variance reporting located in the Activities section of the Topic menu.
Risk monitoring and reporting
The nature, impact and probabilities of risk change during the life of the project. It is important, therefore, that your risk chart be monitored on a regular basis to ensure the continuing appropriateness of the management response. It is helpful to assign responsibility for monitoring/managing specific risks to individuals. A suggested report that tracks the top risk items on a monthly basis is set out below. The timing of reviews is very much dependant on the properties of the risk.
Table 14: Example risk tracking report
Risk item Monthly rating Risk resolution progress
This month Last month Number of months
Inadequate planning
1 2 4 Working on revising the whole project plan
Poor definition 2 3 3 Holding meetings with project customer and sponsor to clarify scope
Absence of leadership
3 1 2 After previous project manager quit, assigned a new one to lead the project
Poor cost estimates
4 4 3 Revising cost estimates
Poor time estimates
4 4 3 Revising schedule estimates
This table can be developed and run in either Microsoft Word or Microsoft Excel and updated on an agreed timetable.
Contract monitoring and performance reporting
During the execution of the project, contracts will be entered into (verbal or written) that reflect the needs of the project. These contracts need
acceptance criteria: most disputes are about whether or not the contractor has done the work agreed to the standard agreed to
criteria for handling problems detected after acceptance including quality-related claims and purchasing complaints
specification of activities to be carried out by the client, especially the client’s role in requirements’ specification and acceptance.
Contract performance reporting requires that the key performance indicators be extracted from contracts and monitored over time (Microsoft Word will suffice as a recording medium) and reviewed at intervals appropriate to the events of the project as set out in the quality plan.
Example: A company initiated a project to install 2000 workstations across many locations. A contract was awarded to a supplier on the condition that workstations would be delivered to each site with five days notice. This would give the project team time to complete a site and move onto the next having the equipment available on arrival. Thus the key performance indicator was order-to-delivery time and the agreed target was no more than five days.
The project team established a simple graph recording the order-to-delivery time for each order. This report was monitored and it soon became apparent that the supplier was not meeting the contractual agreement. Follow-up meetings remedied the problem and the project proceeded to meet its objectives.
Project management software
Software support
For all but the simplest projects, there is a large volume of data about a project that requires considerable data arithmetic. It is usual to use project management software to assist in this task. Such software accepts budget and actual data and produces reports very easily.
In order to collect data to establish the status of your project, you must develop data capture systems for activities in the project. The exact format of the data captured depends on the software used to assist in project time management. Generally, you will devise a data capture form that will be completed by each project team member that will capture the activities worked on, time spent and % completion. Similarly, costs will be collected from the organisation’s accounting systems.
Most project software packages provide broadly similar outputs. A popular package is Microsoft Project. This has many built-in reports, views and filters to assist in project time and cost management. The following table lists some of these features.
Table 15: Microsoft Project features
Reports Views and Table Views Filters
Overview reports: critical tasks and milestones
Gantt chart, network diagram, tracking Gantt, schedule, tracking, variance, constraint dates and delay
All tasks, completed critical tasks, incomplete tasks and milestone tasks
Current activities reports: unstarted tasks, tasks starting soon, tasks in progress, tasks that should have been started, and slipping tasks
Assignment reports, who does what and when
Project closureRight from the beginning of planning the project, you should focus on the target of successfully closing the project. The project will have a finite duration and you should want to ensure not only that the project has been completed technically, to good quality and within budget and schedule, but also that the ongoing business after the project has been completed as healthily as possible. As the project progresses, you should develop a plan for its closure.
To close a project you need to
complete final deliverables
obtain stakeholder acceptance and sign-off
o hold an end-of-project meeting to get feedbacko decide if the project was a success or failure
write and issue a final report
o document project results and team achievementso complete project accounts o hand over project files
evaluate the project
o conduct a review of project lessonso evaluate the team’s performance
release all resources
o physical resourceso reassign the remaining project team.
This may also include addressing issues such as ongoing maintenance, support, training or warranties. Once this has been achieved, all required

sign-offs from the sponsor or client must be obtained. These sign-offs are usually required before the team is disbanded and the final invoicing done.
Not all projects are successful. As many as 30% of IT projects fail. Closing an unsuccessful project that did not meet its objectives can be very difficult and demoralising for the project manager and project team. In some cases it may be beneficial to replace the project team with new people, who - having no emotional attachment to the project - can close the project down quickly.
At any point in the project life cycle, a project can be closed. The process of closing an unsuccessful project is very much the same as that for a successful project but with greater focus on why the project failed and what lessons can be learned to apply to future projects.
Project handover
The outcome of many projects is a working system to be handed over to some other organisation to operate. For example, at the end of a network deployment project there is a network to be operated. The ease of future operation and maintenance of such a network is probably specified among the objectives for the project manager at the outset, but as the project approaches completion the prospective network managers are likely to take a progressively greater interest. If they do not do so of their own accord, then you need to activate them.
Project handover is the formal completion of the project manager’s obligations. Handover is completed to ensure the customer is satisfied with the project deliverables and project support options are identified and in place. The project manager’s obligation to the client stops once the project product or system has been formally accepted by the client. Before handover can be completed, stakeholders will need to formally approve the product or system. This may be done by the project manager demonstrating the completed product meeting requirements.
Maintenance
Before handover is completed, ongoing short and/or long term maintenance needs are to be finalised. This usually consists of maintenance contracts and/or warranties. Maintenance contracts are usually put in place for large systems to give the client assurances about the likely cost of enhancements and the availability of resources to develop them. This phase in the project lifecycle is often referred to as the maintenance phase: the term “maintenance” applies to software as well as hardware. It refers to small enhancements, bug fixes and large enhancements.
Service Level Agreements (SLA) are contracts put in place that outline what support services are provided, what metrics are associated with the

services, and acceptable and unacceptable service levels. A warranty is a guarantee that the product or system will function and perform as specified.
Maintenance processes and procedures need to be established and this may require an input from the project personnel. It can be helpful to involve some of the maintenance and operations staff in testing and commissioning. These people are then well-placed to write the operations and maintenance manuals or at least provide input to them.
Intensive short-term support
There will always be a period of intense support where the new system is live, but the vendor or development team still has some responsibility for support to the client. During this time, bugs may emerge and need to be fixed quickly. As the client actually begins using the new system, support requirements may be negotiated as new issues emerge that were not fully identified in the requirements-gathering stage.
This period may last a few months for a large system, allowing the client to go through all the business cycles that may affect functions of the system.
Ongoing support phase
Once the initial phase is completed, the risk that the system will fail is reduced and the involvement of the vendor is reduced as well. Bugs may remain, but many of the issues from the client may suggest enhancements as a better understanding of the strengths and weaknesses of the system emerge.
Post-implementation review
The post-implementation review is a very useful step in ongoing maintenance. After a system has been running for three to six months, it can be critically reviewed - ideally by members of the implementation team and those representing the client’s users. The aim is to objectively evaluate the real benefits to accrue from the system and identify any possible improvements that could be made. Benefits relate to future projects as lessons learnt and processes to be implemented in the future.
Documentation
At the end of a project, a large amount of documentation may need to be handed over to the appropriate people.
For example, in a training project, you may need to hand over training files to the HR department so they can update staff files. If you are managing a building project, you may need to hand over plans to local government agencies, maintenance departments, the new building owners, and the like.
The project team should determine - in consultation with the stakeholders - who should receive all the documentation and other assets accumulated during the course of the project.
This documentation includes complete lists of all project deliverables, showing how they fit together and how they were designed and tested. Furthermore, the documents should show how it was intended that the product should be used and maintained. Storage and security of hard and soft copies of project documentation should be agreed upon and procedures on archiving put in place.
Activity 10
To practise project closure, complete Activity 10 - Project close out located in the Activities section of the Topic menu.
Project reviews
Project reviews are important as they are fundamental in answering some questions about the conduct of the project for the benefit of future projects. The purpose of a project review is to determine if
the project was completed to quality, time and cost targets and - if not - why not
there are lessons to be learnt
there are any follow-on actions on the project.
Answers to these questions should be documented and presented to management.
Reviews can cover many areas, but two common ones are
project manager’s final report; and
post-completion review.
Project manager’s final report
The project manager’s final report should be produced at the completion of the project by the project manager. Its primary focus is lessons for future projects. The following issues are usually addressed:
Project performance — comparing achievements to the project plan
Administrative performance — reviewing administrative practices with the organisation
Organisational structure — making recommendations for changes to structure
Team performance — providing a confidential report to senior management on team members’ effectiveness
Techniques of project management — reviewing the methods used for estimating, planning and cost control.
Recommendations for change should be made, if appropriate. Things that worked well should also be noted so that they may be continued in future projects.
Post-completion report
The post completion report is conducted to find out whether the promised benefits have been delivered and - if not - what should be done to achieve them.
The best time to carry out such a review is as soon as possible after the project has had time to start showing the planned benefits. For example, if a promised benefit was to reduce the number of collusions on a network, this should be noticeable at the completion of the project, whereas a planned benefit of increased market share may take some months to realise.
Reassign the remaining project team
At the end of the project, the remaining team members should be reassigned as their tasks are completed. These tasks may include input into the closure activities.
Reassigning staff may mean they are transferred to new projects or returned to their usual work activities. In either case, you need to manage this period to ensure that a smooth transition takes place. After working on a big, exciting and fast-moving project it is often a let-down to have to return to your old mundane job, and often people need motivating to focus on their work activity.
For contractors or temporary staff, the closure of the project may mean the end of their assignments and some time off, being assigned to a new project, or unemployment. In some types of projects, such as buildings or IT, some team members may stay with the project in support roles – such as in an IT helpdesk role or working with tenants on fit-outs in building projects.
In any case, you need to keep in mind that close monitoring and assistance is often necessary to ensure that the end of the project is successfully completed for all involved.
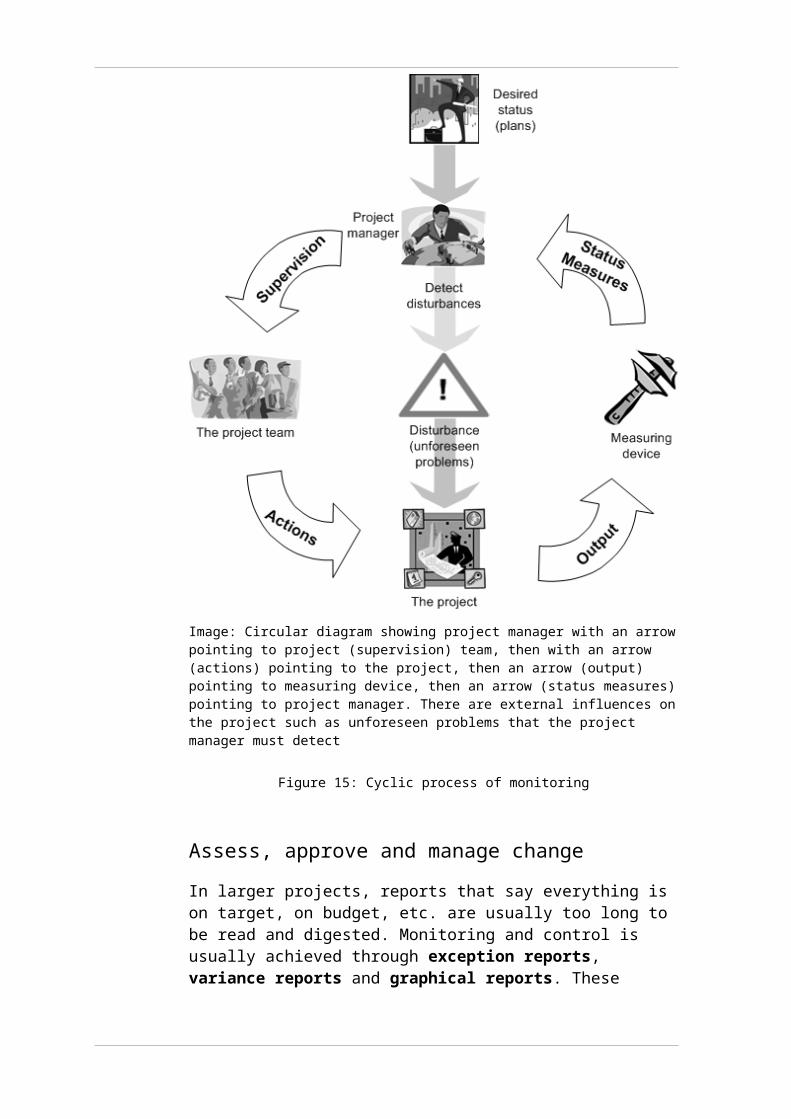
Evaluate the project team and its performance
If the project was large by your organisation’s standards, it may be appropriate to conduct performance reviews after the project is completed. In this case, as project manager, you evaluate your project team members and their performance. In turn, you are evaluated by the project sponsor or a member of the organisation’s management team.
Sometimes, the team is rated as a whole and then team members use the team rating as input into a personal performance review. Other times, the team members may have individual reviews based on their contributions only. There should, however, be some link between team and individual performance.
Activities
Image: Activities
Activity 1 — Work breakdown structureTry the top down method and break down the following goal into several tasks and subtasks and develop a simple work breakdown structure (WBS).
Develop a work breakdown structure for the LAN for Urban Wear’s new retail outlet.
Click here (111 KB 2843_reading07.doc) to see Feedback.
Activity 2 — ControlsClick here (120 KB 2843_reading08.doc) to open an extract of a WBS. Use this extract of a WBS for a network upgrade, identify control tasks that have been included in the Analysis section of the Planning stage.
Feedback Perform risk and impact assessment
Define standards
Activity 3 — Factors that impact on time estimates
What factors could impact on your time estimate for the installation and configuring of the workstations for the LAN from Activity 1?
Feedback
There are many factors that may impact the installation and configuration of the workstations including delayed delivery of hardware, slippage of task dependencies (for example, if the network has not been configured before installation of workstation stats, it will not be possible to use the disk cloning tool to install the standard operating environment); workers skill level; availability of tools.
Activity 4 — Determining the positions requiredYour company, Herriard, which has a staff of 600 full time and 200 part time employees, has decided to introduce sales training techniques on their Intranet site. The training course needs a Learning Management System (LMS) which allocates units of work to the staff. Once in the system, the staff can receive automated feedback and trainers can view staff progress through the system. Herriard has decided to get an off-the-shelf product and adapt it to the company’s needs. You have been given the job of managing the project.
List the job roles or positions that you would include in your team.
Feedback
The team could be comprised of the following:
an instructional designer to design the structure of the site and to train staff
course writers
a graphic designer to create a shell to reflect corporate identity
a development team of 1–2 programmers to adapt the off-the-shelf Learner Management System to company needs
a part-time network engineer
a part-time server support
Activity 5 — Gantt chartIn your notebook, draw a Gantt chart corresponding to the specifications in the table below.
Table 17: Gantt chart specifications
Activity Description Staff Duration Prerequisites
identifier (weeks)
A Prepare offices John, Jill 12
B Procure equipment
Louise, Larry 8
C Design tests Mark 5
D Install equipment
Jane, Jeff, Julie, James
10 A and B
E Test system Brenda, Brad, Bella
10 C and D
F Train users Tony 5 A and B
Feedback
Image: Gantt chart displaying task name, duration, start date in weeks, finish date in weeks: A, 12 weeks 0, 12; B, 8 weeks, 0, 8; C, 5 weeks, 0, 5; D, 10 weeks, 12, 22; E, 10 weeks, 22, 32; F, 5 weeks, 12, 17.
Figure 19: Gantt chart
Activity 6 — Quality planningConsider the LAN project for the Urban Wear retail outlet.
Who are the main quality stakeholders for the project?
Feedback
Project sponsor
Project manager
Retail outlet manager
IT manager
IT staff

Activity 7 — Managing your timeRecord your time usage for a day. Use the following simple rules and be honest and objective.
Record everything you do, even lunch and coffee breaks.
When you start a task, record the time for each step if there are different steps. For example, if your job is to read several documents and write a report, record the time it takes to get the documents, how long it takes to read them and finally how long it takes to write the report.
If you have a telephone call, note who initiated the call, the subject as well as the time taken.
To determine how much time is wasted with interruptions such as chatting at the coffee machine, personnel phone calls, etc., use a stopwatch that you can stop and start at each interruption. At the end of the day, check the total time and enter that under the activity interruptions.
Record start and stop times for each task and do not subtract times for interruptions. Remember they will be added on the stopwatch at the end of the day.
Try to be as accurate as possible but not down to the second; minutes will suffice.
Activity 8 — Change negotiationCase study
HAKME is undertaking a project (I-CUE, Intuitive Contacts, Updates and Enhancements) to update their contact management system. An issue has been raised by Bob Jenkison, customer relations manager, regarding the tracking and delegation of open cases. After reviewing the issue’s log, you determined that the change is currently outside the technical specifications of the project and a change request needs to be submitted and approved.
Peta Young, technical lead, has reviewed the issues log. She feels that it is too late in the development stage of the project to change the technical requirements and feels the customer is constantly shifting the project goals.
Review the emails sent to you by Bob Jenkison (35 KB 2843_email1.doc) and Peta Young (35 KB 2843_email2.doc) outlining their stance on the issue and work out a strategy to best handle the situation.
Feedback
Gather documentation to support your case. Prepare a list of points you need to explain to Bob Jenkison (i.e. the reasons why the change is outside the
technical specifications and why it’s too late to change the specifications). Double check that your facts and Peta Young’s facts are correct and the decision valid. Arrange to meet Bob Jenkison to present your case to him.
Activity 9 — Variance reportingThe I-CUE steering committee has requested a variances report outlining the impact of the recent change to the development phase of the project. Using the financial information provided, complete a variance report for the developing tasks.
Table 18: Pre-change budgeted costs
Task Name Total Cost
Developing $1,999,532.00
Update risk assessment $492.00
Equipment for development/proof of concept arrives $0.00
Set up development environment/lab $4,800.00
Internal Release #1 $422,560.00
Internal release #1 complete $0.00
Review results from internal release $0.00
Perform post-release review $0.00
Internal Release #2 $424,960.00
Distribute to appropriate parties $4,480.00
Internal release #2 complete $15,680.00
Internal Release #3 $0.00
Distribute to appropriate parties $0.00
Internal release #3 complete $0.00
Review results from internal release $32,800.00
Functional specification freeze $0.00
Final feature development $104,000.00
Final logistics development $15,840.00
Final performance support development $7,600.00
Feature complete $0.00
Update Plans and Schedules $95,520.00
Buffer $49,200.00
Perform milestone review $32,800.00
Scope complete $15,680.00

Table 19: Post-change budgeted costs
Task Name Total Cost
Developing $2,951,052.00
Update risk assessment $492.00
Equipment for development/proof of concept arrives $0.00
Set up development environment/lab $4,800.00
Internal Release #1 $422,560.00
Internal release #1 complete $0.00
Review results from internal release $0.00
Perform post-release review $0.00
Internal Release #2 $424,960.00
Distribute to appropriate parties $4,480.00
Internal release #2 complete $15,680.00
Internal Release #3 $578,560.00
Distribute to appropriate parties $4,480.00
Internal release #3 complete $15,680.00
Review results from internal release $15,680.00
Functional specification freeze $0.00
Final feature development $104,000.00
Final logistics development $15,840.00
Final performance support development $7,600.00
Feature complete $0.00
Update Plans and Schedules $95,520.00
Buffer $49,200.00
Perform milestone review $32,800.00
Scope complete $15,680.00
Feedback
There is a variance of $951,520.00 for the task development and its sub tasks.
Table 20: Variance report
Activity Variance Report
Activity Name : Developing Date:
Task Name Plan Actual Variance
Developing total $1,999,532.00 $2,951,052.00 $951,520.00
Update risk assessment $492.00 $492.00 $0.00
Equipment for development/proof of concept arrives $0.00 $0.00 $0.00
Set up development environment/lab $4,800.00 $4,800.00 $0.00
Internal Release #1 $422,560.00 $422,560.00 $0.00
Internal release #1 complete $0.00 $0.00 $0.00
Review results from internal release $0.00 $0.00 $0.00
Perform post-release review $0.00 $0.00 $0.00
Internal Release #2 $424,960.00 $424,960.00 $0.00
Distribute to appropriate parties $4,480.00 $4,480.00 $0.00
Internal release #2 complete $15,680.00 $15,680.00 $0.00
Internal Release #3 $0.00 $578,560.00 $578,560.00
Distribute to appropriate parties $0.00 $4,480.00 $4,480.00
Internal release #3 complete $0.00 $15,680.00 $15,680.00
Review results from internal release $32,800.00 $15,680.00 ($17,120.00)
Functional specification freeze $0.00 $0.00 $0.00
Final feature development $104,000.00 $104,000.00 $0.00
Final logistics development $15,840.00 $15,840.00 $0.00
Final performance support development $7,600.00 $7,600.00 $0.00
Feature complete $0.00 $0.00 $0.00
Update Plans and Schedules $95,520.00 $95,520.00 $0.00
Buffer $49,200.00 $49,200.00 $0.00
Perform milestone review $32,800.00 $32,800.00 $0.00
Scope complete $15,680.00 $15,680.00 $0.00
Activity 10 — Project close outWhat steps do you need to follow to close a project?
Feedback Complete final deliverables.
Obtain stakeholder acceptance and sign-off:
o hold an end-of-project meeting to get feedbacko decide if the project was a success or failure.
Write and issue final report:
o document project results and team achievementso complete project accounts o hand over project files.

Evaluate the project:
o conduct a review of project lessonso evaluate the team and performance.
Release all resources
o physical resourceso reassign remaining project team
References
Image: References
There is no specific text for this topic. The following list contains some suggested texts and manuals only. There are many software manuals, reference books and user guides available from libraries, bookshops, CD-ROMS, or on the Internet.
Note that many textbooks only cover the technical issues of a topic and do not discuss client-user relationships. Techniques to improve client and team communication may be found in books on management techniques and interpersonal skills.
Haynes M (1980) Project Management — from Idea to Implementation, Kogan Page.
Schwabe K (2004) Information Technology Project Management, Third Edition, Cambridge, MA: Course Technology, Inc.
Field M and Keller L (1998) Project Management, London International Thompson Business Press.
Chapman C, Ward S, (2002) Managing Project Risk & Uncertainty: A Constructively Simple Approach To Decision Making, Wiley Publishing
Lewis JP(2000) Project Planning, Scheduling & Control, 3rd Edition, McGraw Hill.
Internet
If the web page does not open by clicking the link, try copying and pasting the link into your web browser’s address bar.
The mindtools website has some interesting articles on stakeholders and their involvement in a project.
Go to http://www.mindtools.com – select Project Planning and Management. Here are two links you should look at:
Stakeholder Analysis
Stakeholder Management
http://isb.wa.gov/tools/pmframework/index.aspx (information services board, Washington state government: the project cycle)
http://www.maxwideman.com/pmglossary/PMG_F02.htm (Max Wideman: Project management principles)
http://www.brainstorming.co.uk/tutorials/tutorialcontents.html (brainstorming.co.uk: brainstorming portal)
http://www.hyperthot.com/project.htm (hyperthost.com: project management principles, practises and techniques)
http://www.umsl.edu/~sauter/analysis/488_f01_papers/Ohlendorf.htm (Conflict Resolution in Project Management, Amy Ohlendorf, 2001: This useful article gives information on conflict in a project and approaches to deal with it.)
http://www.businessballs.com/freeonlineresources.htm (businessballs.com: templates, resources and tools for all types of project management.
http://www.4pm.com/articles/PMTalk07-03-01.pdf (4pm.com: information about how to approach managing the change.
http://www.projectmanagement.tas.gov.au/pm_templates/pm035_menu.htm (Tasmanian state government: Project management guidelines, information resources and tools)
http://www.tbs-sct.gc.ca/emf-cag/pmg-ggp/pm-gp-process/close-cloture/close-cloture_e.asp (Treasure board of Canada: Closing a project guidelines)

Topic quiz
Image: Topic quiz
This quiz will help you review the content you have learned in this topic.
Answer the questions, check the feedback at the end of each question and take note of the areas you need to learn more about.
1. Fill in the missing word:
A Work Breakdown Structure is a deliverable–oriented grouping of the work involved in a project, defining the total scope of the project.
Feedback
Correct! A Work Breakdown Structure is a deliverable-oriented grouping of the work involved in a project, defining the total scope of the project.
Incorrect. Go to the Reading notes and review the section on Developing the work breakdown structure.
2. Fill in the missing word:
The longest path through a network diagram that determines the earliest completion of a project is called the critical path.
Feedback
Correct! The earliest completion of a project is called the critical path.
Incorrect. Go to the Reading notes and review the section on Critical path method.
3. Which three processes are involved in the development of a project?
monitoring, controlling and directing

tracking, deciding and controlling
screening, controlling and directing
planning, assessing and monitoring
Feedback
Correct! Monitoring, controlling and directing are involved in the development of a project.
Incorrect. Go to the Reading notes and review the section on Control loop.
4. Project controls are usually designed to focus on which three major aspects of project measurements?
taking corrective action
monitoring and tracking progress
determining variation from plan
all of the above
Feedback
Correct! Project controls focus on taking corrective action, monitoring and tracking progress, and determining variation from plan.
Incorrect. Go to the Reading notes and review the section on Project controls.
5. In which phase of a project would you estimate activity duration and resources?
initiating
planning
executing
controlling
Feedback
Correct! You would estimate activity duration and resources during the planning phase of the project.
Incorrect. Go to the Reading notes and review the section on Estimating task duration and cost.
6. What is the name given to the end of a project phase?
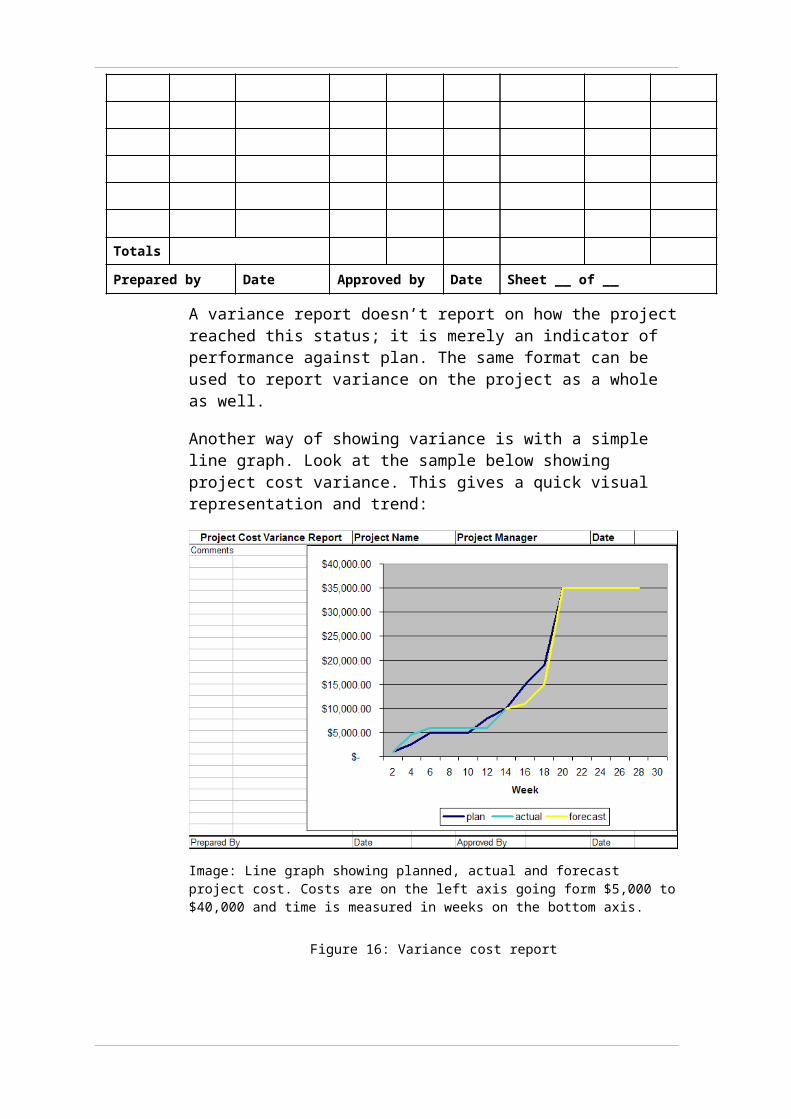
kill point
end point
sign–off
milestone
Feedback
Correct! The end of a project phase is called a milestone.
Incorrect. Go to the Reading notes and review the section on Project tasks.
7. Which of the following is NOT a goal of a project plan?
to guide project execution
to facilitate communication among stakeholders
to provide a baseline for progress measurement and project control
to define ongoing support and maintenance strategy
Feedback
Correct! Defining ongoing support and maintenance is NOT a goal of a project plan.
Incorrect. Go to the Reading notes and review the section on Preparing for the project plan.
8. Write down some examples of risk that you can think of in the following areas: Cost management, Time management, Procurement management, Change management.
Feedback
Cost management has one big risk: project costs being over budget
Time management:
activities taking too long, causing late start of dependent tasks
late delivery of products
scheduling too many tasks for the available resources
unrealistic delivery dates
Procurement management:
materials no longer available or obsolete
late delivery by supplier
damaged materials delivered

Change management:
failing to lodge a change request
allowing change in schedule without impact assessment
You probably have many examples which just serves to emphasise the wide range of potential risks.
9. List five input requirements for accurately defining time management within a project.
Feedback
Work breakdown structure
Scope document
Constraints
Assumptions
Historical information
10. At what stage should planning for project close out begin?
planning stage
initiating
closing
executing
Feedback
Correct! Planning for project close out begins in the planning stage.
Incorrect. Go to the Reading notes and review the section on Project closure.
11. Which of the following is NOT part of closing a project?
writing and issuing the final report
obtaining stakeholder sign-off
releasing all resources
selecting a quality reporting system
Feedback

Correct! Selecting a quality reporting system is NOT part of closing a project.
Incorrect. Go to the Reading notes and review the section on Project closure.
12. What is the primary goal of a project review?
to answer questions about the conduct of the project for the benefit of future projects
to identify follow-on action for the project
to determine if the project was a success
to determine how well the project team preformed
Feedback
Correct! The primary goal of a project review is to identify follow-on action for the project.
Incorrect. Go to the Reading notes and review the section on Project reviews.