applying control theory to application performance...
TRANSCRIPT

© 2014 VMware Inc. All rights reserved.
Applying Control Theory to Application Performance Management in the Cloud
Xiaoyun Zhu CDS@20 August 7, 2014

Virtualization – a new computing paradigm
Key benefits • Higher hardware utilization • Easier deployment
• Elastic capacity • Better agility via live migration
• Higher availability
• Fault tolerance • Lower energy cost
2 2

Virtual machines become mainstream in IT
3
• (also from Gartner): 5 out of every 6 x86 server workloads are deployed in VMs by 2015.
• vSphere-infographic, VMworld 2011.
3
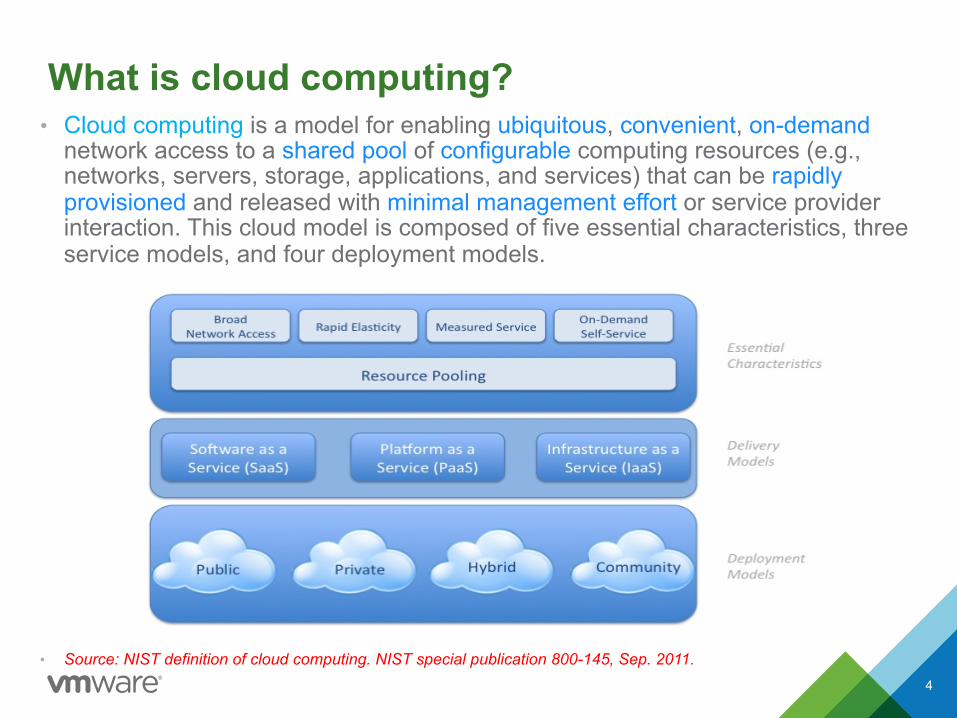
• Cloud computing is a model for enabling ubiquitous, convenient, on-demand network access to a shared pool of configurable computing resources (e.g., networks, servers, storage, applications, and services) that can be rapidly provisioned and released with minimal management effort or service provider interaction. This cloud model is composed of five essential characteristics, three service models, and four deployment models.
• Source: NIST definition of cloud computing. NIST special publication 800-145, Sep. 2011.
What is cloud computing?
4
4
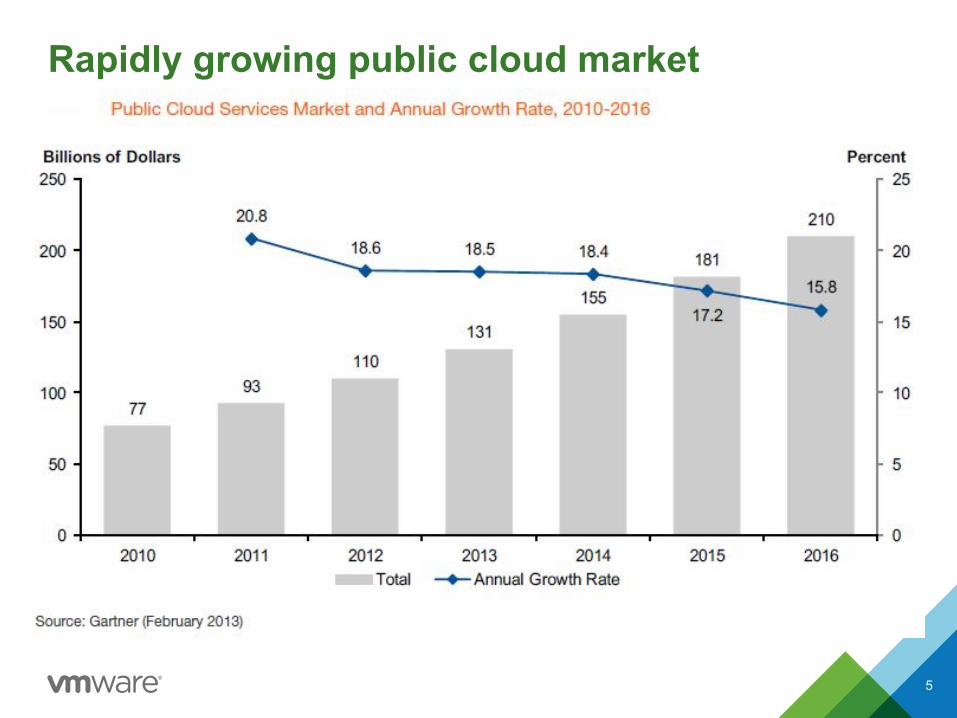
Rapidly growing public cloud market
5

How about hosting critical applications?
6

64%
51%
44%
Source: “The hidden costs of managing applications in the cloud,” Compuware/Research In Action White Paper, Dec. 2012, based on survey results from 468 CIOs in Americas, Europe, and Asia.
Application performance – a real concern
7
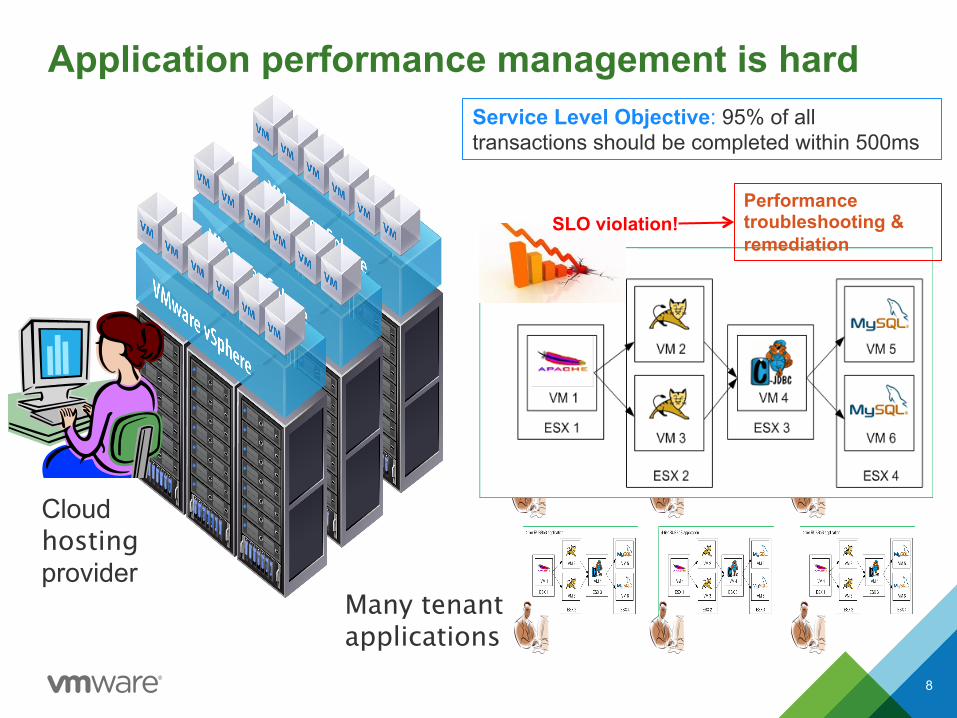
Application performance management is hard
8
Cloud hosting provider
Service Level Objective: 95% of all transactions should be completed within 500ms
Many tenant applications
SLO violation! Performance troubleshooting & remediation

• On average, 46.2 hours spend in “war-room” scenarios each month
9
Source: Improving the usability of APM data: Essential capabilities and benefits. TRAC Research, June 2012, based on survey data from 400 IT organizations worldwide
Challenges in managing application performance

10
“false negatives”
Source: Improving the usability of APM data: Essential capabilities and benefits. TRAC Research, June 2012, based on survey data from 400 IT organizations worldwide
Challenges in usability of performance data

APM goal: achieve service-level-objective (SLO) Technical challenges
• Enterprise applications are distributed or multi-tiered • App-level performance depends on access to many
resources – HW: CPU, memory, cache, network, storage – SW: threads, connection pool, locks
• Time-varying application behavior • Time-varying hosting condition • Dynamic and bursty workload demands • Performance interference among co-hosted applications
11 11

Better IT analytics for APM automation Three-pronged approach
12
Control
Optimization
Learning

Why learning?
• Deals with APM-generated big data problem
• Fills the semantic gap with learned models
• Answers key modeling questions
13 13

Source: “APM-generated big data boom.” Netuitive & APMDigest, July 2012, based on survey of US & UK IT professionals.
APM-generated big data • “APM tools were part of the huge explosion in metric
collection, generating thousands of KPIs per application.” • “83% of respondents agreed that metric data collection has
grown >300% in the last 4 years alone.” • “88% of companies are only able to analyze less than half
of the metric data they collect… 45% analyze less than a quarter of the data.”
• “77% of respondents cannot effectively correlate business, customer experience, and IT metrics.”
14
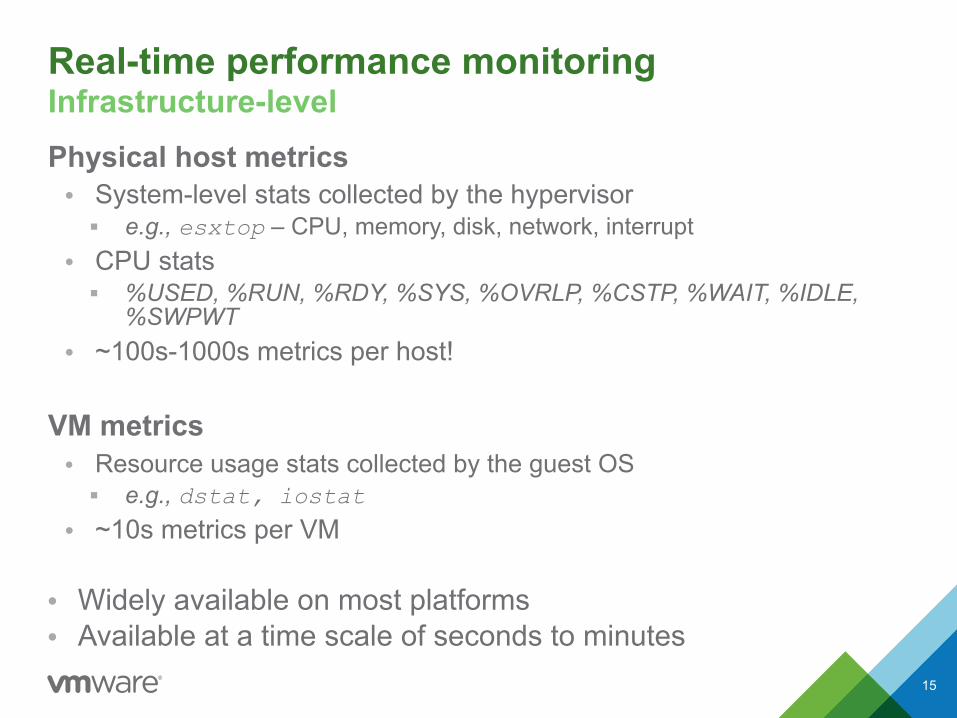
Real-time performance monitoring Infrastructure-level Physical host metrics • System-level stats collected by the hypervisor
§ e.g., esxtop – CPU, memory, disk, network, interrupt • CPU stats
§ %USED, %RUN, %RDY, %SYS, %OVRLP, %CSTP, %WAIT, %IDLE, %SWPWT
• ~100s-1000s metrics per host!
VM metrics • Resource usage stats collected by the guest OS
§ e.g., dstat, iostat • ~10s metrics per VM
• Widely available on most platforms • Available at a time scale of seconds to minutes
15
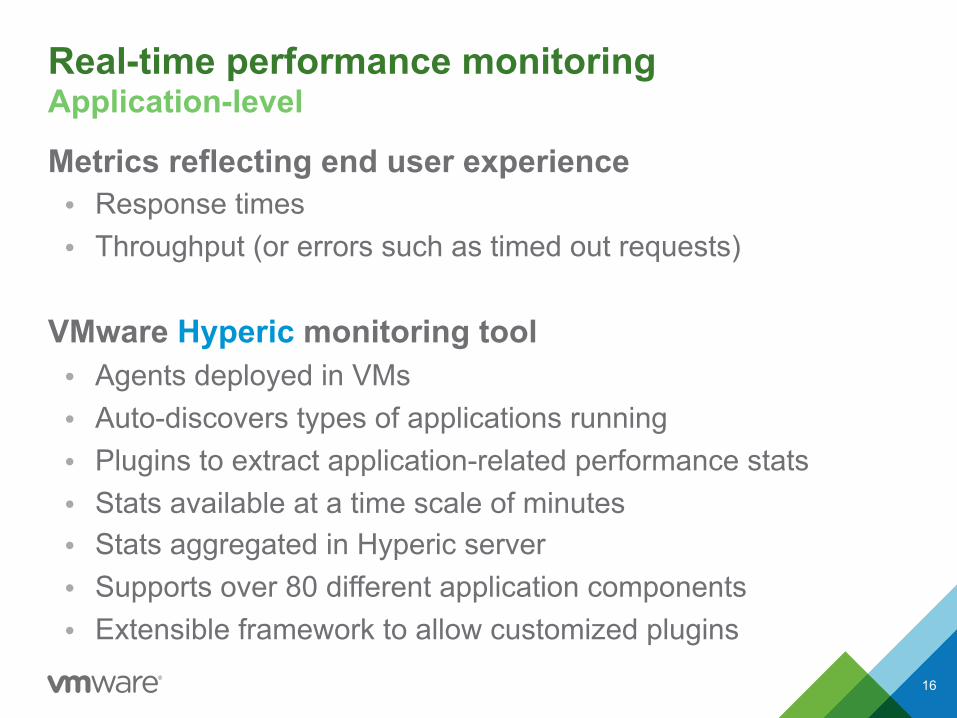
Real-time performance monitoring Application-level Metrics reflecting end user experience • Response times • Throughput (or errors such as timed out requests)
VMware Hyperic monitoring tool • Agents deployed in VMs • Auto-discovers types of applications running • Plugins to extract application-related performance stats • Stats available at a time scale of minutes • Stats aggregated in Hyperic server • Supports over 80 different application components • Extensible framework to allow customized plugins
16
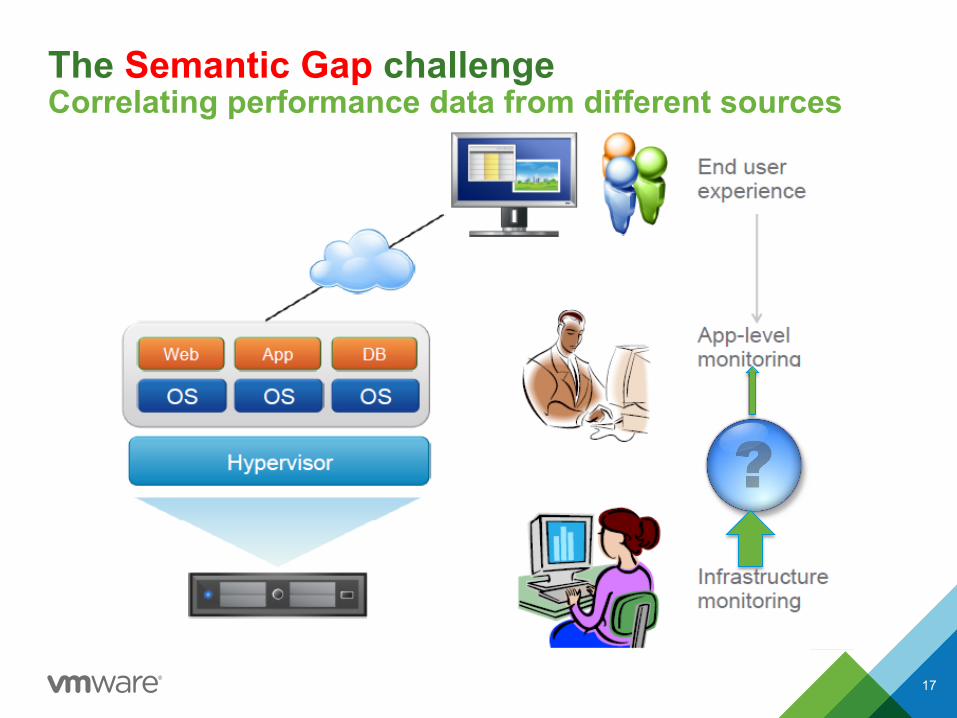
The Semantic Gap challenge Correlating performance data from different sources
17

Semantic gap filled by performance models
Traditional models harder to apply • First-principle models: Only exist for special cases (e.g., flow models)
• Queuing models: More suitable for aggregate/average behavior
• Architectural models: Require domain knowledge, harder to automate
Empirical models via statistical learning
• Data driven, easier to automate and scale
• Offline modeling usually insufficient § Time-varying workloads
§ Changing system/software configurations
• Online modeling • Need to be low overhead
18
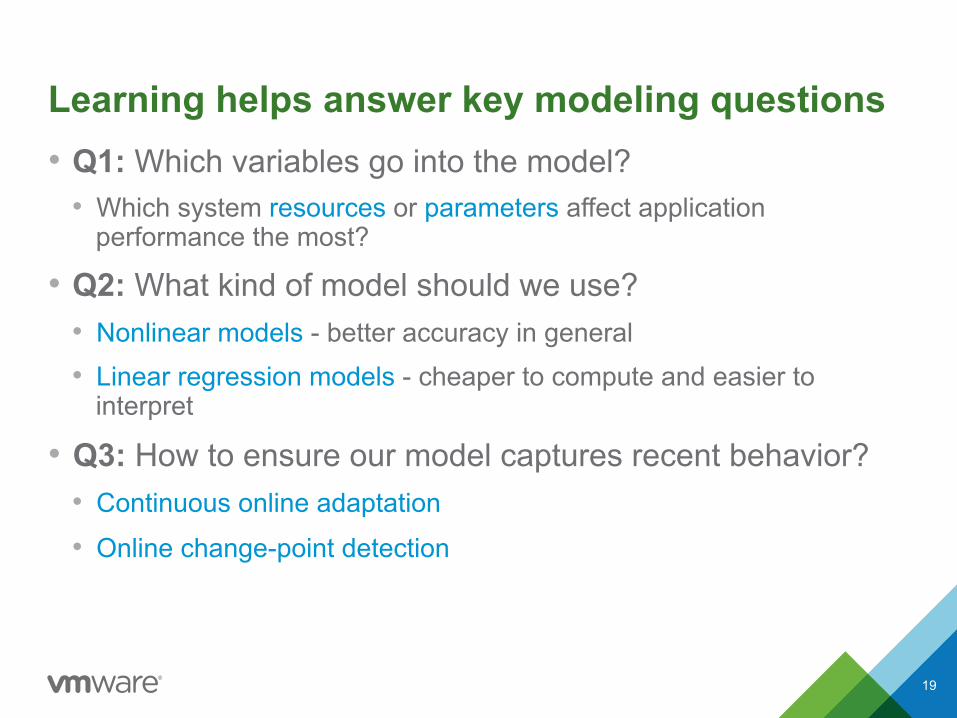
Learning helps answer key modeling questions
• Q1: Which variables go into the model? • Which system resources or parameters affect application
performance the most?
• Q2: What kind of model should we use? • Nonlinear models - better accuracy in general • Linear regression models - cheaper to compute and easier to
interpret
• Q3: How to ensure our model captures recent behavior? • Continuous online adaptation
• Online change-point detection
19

Auto-Scaling to maintain application SLO A feedback-control approach
20
Front Tier DB Tier End
User
Application Latency

Auto-Scaling to maintain application SLO A feedback-control approach
21
Front Tier DB Tier End
User
Application Latency
Front Tier DB Tier End
User
Application Latency
Horizontal scaling

Auto-Scaling to maintain application SLO A feedback-control approach
22
Front Tier DB Tier End
User
Application Latency
Front Tier DB Tier End
User
Application Latency
Vertical scaling Horizontal scaling

• User-defined threshold on a specific metric – Spin up new instances when threshold is violated – e.g. AWS Auto Scaling: http://aws.amazon.com/autoscaling/
• Challenges
– How to determine the threshold value? – How to handle multiple application tiers? – How to handle multiple resources?
Existing solutions to horizontal scaling Threshold-based approach
Threshold
0
20
40
60
80
0 5 10 15 20 25
CPU U%liza%
on (%
)
Time
23

Our Solution: Learning-based auto scaling • Uses reinforcement learning to capture application’s
scaling behavior and inform future actions • Uses heuristics to seed the learning process • Handles multiple resources and tiers • Fully automated without human intervention
0
200
400
600
800
1000
1200
1400
0 100 200 300 400 500 600 700 800 900 0
2
4
6
8
10
12
14
16
End-t
o-E
nd L
ate
ncy
(m
s)
Num
ber
of A
pp-S
erv
er
VM
s &
Num
ber
of C
lientT
hre
ads
Time in minutes
AppServer VMsClient threads
avg Apache LatencySLO
24

Vertical scaling of resource containers Automatic tuning of resource control settings • Available on various virtualization platforms • For shared CPU, memory, disk I/O*, network I/O*:
– Reservation (R)* – minimum guaranteed amount of resources – Limit (L) – upper bound on resource consumption (non-work-conserving) – Shares (S) – relative priority during resource contention
• VM’s CPU/memory demand (D): estimated by hypervisor, critical to actual allocation
25
R
L
VM configured size (C) Actual-allocation = f(R, L, S, D, Cap)
Available capacity

DRS (Distributed Resource Scheduler) Resource pool hierarchy
• Capacity of an RP divvied hierarchically based on resource settings • Sibling RPs share capacity of the VDC • Sibling VMs share capacity of the parent RP
26
VDC
RP1
VM1 VM2 Web App DB
vApp1
RP2
vApp2
Web App DB
<R1, L1, S1> <R2, L2, S2>
<r, l, s>
* VMware distributed resource management: Design, implementation, and lessons learned, VMware Technical Journal, April 2012.
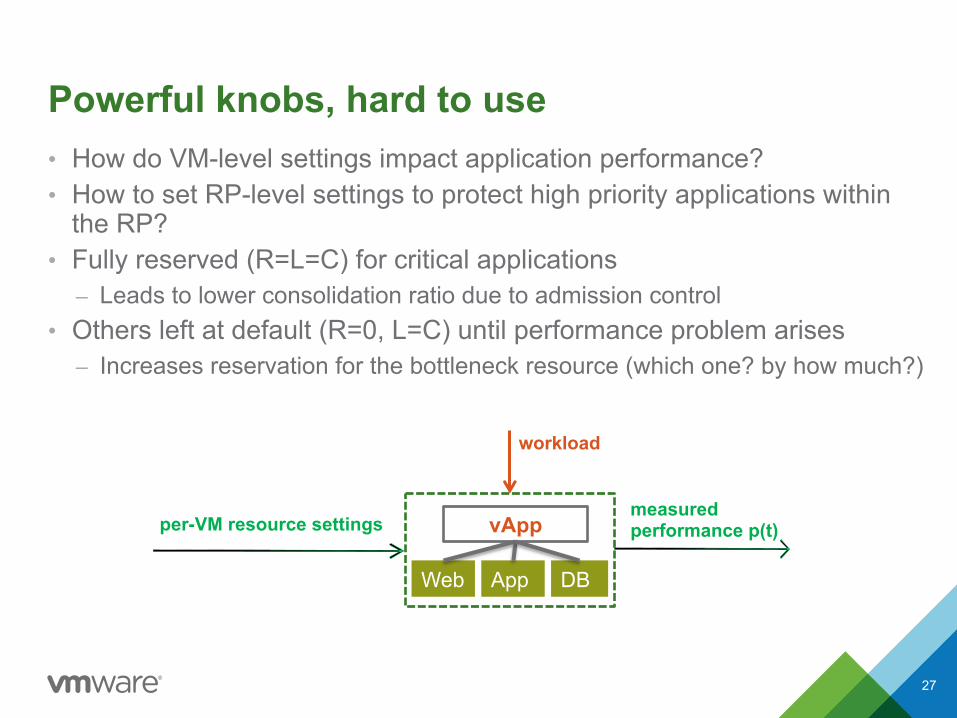
Powerful knobs, hard to use • How do VM-level settings impact application performance? • How to set RP-level settings to protect high priority applications within
the RP? • Fully reserved (R=L=C) for critical applications
– Leads to lower consolidation ratio due to admission control • Others left at default (R=0, L=C) until performance problem arises
– Increases reservation for the bottleneck resource (which one? by how much?)
27
measured performance p(t) per-VM resource settings
Web App DB
vApp
workload

Performance model learned for each vApp Maps VM-level resource allocations to app-level performance • Captures multiple tiers and multiple resource types
• Choose a linear low-order model (easy to compute)
• Workload indirectly captured in model parameters • Model parameters updated online in each interval (tracks nonlinearity)
28
VM memory usage ukm(t)
measured performance p(t)
VM CPU usage ukc(t)
Web App DB
vApp Model p(t) = f(p(t-1),u(t))
workload λ
VM I/O usage ukio(t)

Simplified optimal control law • An example cost function
• Compute optimal resource allocations online
29
22 ||)()1(||))1(())1(( ttptptJ SLO uuu −++−+=+ β
Tradeoff between performance and stability
performance cost control cost

Resource pool sharing among multiple vApps • Auto-tunes VM-level and RP-level resource control settings to meet
application SLOs – For each application, vApp Manager translates its SLO into desired
resource control settings at individual VM level – For each resource pool, RP Manager computes the actual VM- and RP-
level resource settings to satisfy all critical applications
30
Arbiter Actuator
Desired VM resource settings
VM1 VM2 VMn ...
App/System Sensors
vApp Manager
VM2 VMn ...
App/System Sensors
vApp Manager
VM1
vApp1 vApp2
Actual VM- or RP-level settings via vSphere API
...
Resource Pool (RP)
App-level SLO
App-level SLO
Resource Pool Manager (RP Manager)

Performance evaluation • Application
– MongoDB – distributed data processing application with sharding – Rain – workload generation tool to generate dynamic workload
• Workload – Number of clients – Read/write mix
• Evaluation questions – Can the vApp Manager meet
individual application SLO? – Can the RP Manager meet SLOs
of multiple vApps?
31
VM
Shard1
Shard2
Configsvr
Mongos
VM1
VM2
VM3

0.1
1
10
100
1 6 11 16 21 26 31 36 41 46 51 56 61 66 71 76 81 86
Normalized
Respo
nse Time
Mean response %me ( target 300ms)
RT-‐scenario1 RT-‐scenario2 Target
control + continued-learning
Time interval ( every 1 min)
Result: Meeting mean response time target • Under-provisioned initial settings: R = 0, Limit = 512 (MHz, MB) • Over-provisioned initial settings: R = 0, L = unlimited (cpu, mem)
32
Initial-learning

Resource utilization (under-provisioned case) • Target response time = 300 ms • Initial setting R = 0, L = 512 MHz/MB (under-provisioned)
33
0
0.01
0.02
0.03
0.04
0.05
0.06
0.07
0.08
0.09
1 11 21 31 41 51 61 71 81
CPU u%liza%
on
CPU u%liza%on
Mongos-‐CPU Shard1-‐CPU Shard2-‐CPU
0
0.02
0.04
0.06
0.08
0.1
0.12
0.14
0.16
0.18
0.2
1 11 21 31 41 51 61 71 81
Mem
ory u%
liza%
on
Memory u%liza%on
Mongos-‐MEM Shard1-‐MEM Shard2-‐MEM
The Vision of Autonomic Computing, IEEE Computer, Jan. 2003. “Systems manage themselves according to an administrator’s goals. New components integrate as effortlessly as a new cell establishes itself in the human body. These ideas are not science fiction, but elements of the grand challenge to create self-managing computing systems.”
Enablers • Widely deployed sensors and lots of (noisy) data • New control knobs, resource fungibility and elasticity • Increasing compute, storage, and network capacity • Matured learning, control, and optimization techniques
Challenges • Software complexity, nonlinearity, dependency, scalability • Automated root-cause analysis, integrated diagnosis & control • Need more collaborations between control and systems people • How to teach control theory to CS students?
34
Grand challenge
34
Thanks to collaborators
35
VMware • Lei Lu, Rean Griffith, Mustafa Uysal, Anne Holler, Pradeep Padala, Aashish Parikh, Parth Shah
HP Labs • Zhikui Wang, Sharad Singhal, Arif Merchant (now Google)
KIT • Simon Spinner, Samuel Kounev
College of William & Mary • Evgenia Smirni
Georgia Tech • Pengcheng Xiong (now NEC Lab), Calton Pu
University of Michigan • Kang Shin, Karen Hou

Related venues
36
• International Conference on Autonomic Computing https://www.usenix.org/conference/icac14
• Feedback Computing Workshop (formerly known as FeBID)
http://feedbackcomputing.org/
http://www.controlofsystems.org/
• Lund University Cloud Control Workshop (LCCC)
http://www.lccc.lth.se/index.php?page=Workshop201405Program

References • X. Zhu, et al. “What does control theory bring to systems research?” ACM SIGOPS
Operating Systems Review, 43(1), January 2009.
• P. Padala et al. “Automated control of multiple virtualized resources.” Eurosys 2009.
• A. Gulati et al. “VMware distributed resource management: Design, implementation, and lessons learned.” VMware Technical Journal, Vol. 1(1), April 2012.
• P. Xiong et al. “vPerfGuard: An automated model-driven framework for application performance diagnosis in consolidated cloud environments.” ICPE 2013.
• A. Gulati , “Towards proactive resource management in virtualized datacenters,” RESoLVE 2013.
• L. Lu, et al., “Application-Driven dynamic vertical scaling of virtual machines in resource pools.” NOMS 2014.
37