applying machine learning to leverage big data for ... · 1 the credit & financial management...
TRANSCRIPT
1 The Credit & Financial Management Review
Applying Machine Learning to Leverage Big
Data for Commercial Credit Scoring
By: Chintan Trivedi, Irina Rabinovich
and Shyarsh Desai
“The temptation to form premature theories upon insufficient data is the bane of our profession.” - Arthur Conan Doyle via Sherlock Holmes
Machine learning derived models improve accuracy of bankruptcy prediction compared to Altman’s Z-Score.
Abstract
Commercial credit risk scores are essential for creditors who need efficient and consistent
means to measure the risk associated with their trading partners. Traditionally, credit scoring
has been based on point systems derived by human experts relying on their domain knowledge
and intuition to pick the factors contributing to the model. The relative weights of these factors
would then be tested and tuned until the overall score would reach a seemingly satisfactory
outcome. However, the modern era of big data brings volumes and complexity of information
that are impossible for the human mind to comprehend cohesively. Current machine learning
technology allows us to utilize all data available and to shift from traditional ad-hoc models to
systematic models that are accurate, efficient, and objective. The authors highlight advantages of
these models by using a well-known machine learning algorithm - artificial neural network - to
predict future delinquency in business-to-business transactions. The data shows that on a test
sample of 40,000 unique companies, the neural network based model achieved 30% higher
prediction accuracy than the traditional models currently used by many credit departments and
credit rating agencies. Further demonstrated is both the flexibility and scalability of machine
learning derived models using two case studies. First, a significant accuracy improvement of 8%
in prediction of delinquency is observed for the hospitals sector by assimilating publicly
available Medicare data into the model, which would take a human analyst a great effort to
incorporate. Second, building the model using the neural network algorithm with the same
predictors as in the traditional Altman’s Z-Score yields a 13% improvement in bankruptcy
prediction. This illustrates that a machine learning derived model can automatically adapt to
changes in input data patterns -- an infeasible task for a human analyst, especially when
measured over long periods of time.
2 The Credit & Financial Management Review
Introduction
Recent advances in large-scale data acquisition, transmission and storage have created
unprecedented volumes of available data. Furthermore, with constant growth in the computing
capacity, it becomes possible to leverage these data volumes efficiently. At the same time, there
has been rapid progress in the development of sophisticated algorithms for machine learning,
data mining and statistical analysis of large volumes of data. This confluence of trends should
precipitate a paradigm shift in the approach to data analysis in the financial services industry.
Specifically, in the domain of credit risk scoring, the traditional approach has been to extract the
model from human understanding of which factors are important and their relative weights [6].
Even when statistical techniques are used, they are applied to a very limited hand-picked number
of elements [1, 11, 12]. However, the human-centered approach cannot scale to vast amounts,
both in volume and complexity, of the available data. In addition, traditional models have a
tendency to stay static and be unable to adopt new data sets, which results in score models that
have largely remained the same over the years or even decades. Recent research [2, 5, 8, 10, 14]
shows the advantages of using machine learning based models over the traditional scoring
models in the consumer market. Similar advantages in the B2B market are demonstrated in this
paper.
The fundamental premise of machine learning is to build algorithms that can automatically
extract information from a wide range of input data sources and use statistical analysis to learn
from this information in order to predict an output value. It has been successfully applied across
human activities: from detecting malicious behavior in cyberspace to predicting patient outcomes
in healthcare.
Leveraging big data through machine learning leads to dramatic improvement in accuracy of
credit scores over traditional methods. The focus is on the task of predicting future payment
performance, not only since this is a key characteristic of interest in credit scoring, but also
because there are B2B traditional models available for comparison. By applying machine
learning to big data available, a large number of predictors can be used which would not be
feasible to interpret by a human expert. Further, a case study is shared that builds an industry
specific model for prediction of payment delinquency by hospitals. This case study shows that
augmenting a list of predictors by non-traditional elements that only recently became available,
and which to our knowledge traditional models have yet to incorporate, significantly improves
score accuracy. Finally, it is demonstrated that machine learning can flexibly reflect ever-
changing data patterns, even when the set of predictors does not change. Specifically, machine
learning derived models improve accuracy of bankruptcy prediction compared to Altman’s Z-
Score.
Big Data
Big Data refers to large volumes of data that is difficult to handle, not only due to its pure size,
but also because of its complexity. With millions of business transactions per month, trade data
by itself falls into the big data category and is difficult to analyze efficiently. An even bigger
3 The Credit & Financial Management Review
challenge is to interpret the data that may come from a variety of sources such as financial
statements, politico-economic news, census reports, social media - to name a few. As more and
more sources of information become available and the speed with which the data is accumulating
increases, it is becoming difficult to analyze data in a meaningful way.
Yet, this data contains information of great business value, and it can be used to gain insights
leading to better decisions and strategic business moves. Unlike a human expert, who tends to
“drown” as data volumes and complexities increase, machine learning is a tool that gets better
with more data. Moreover, the “intelligence” of the approach is not predefined by a human
expert but is rather learned inherently by analyzing the data itself. This data-driven approach of
machine learning is well suited to exploit the wealth and diversity of data available.
This paper focuses on combining the richness of big data with the capabilities of machine
learning to improve credit scores. To this end, the following data sets were used: approximately
50 million transactions of accounts receivable data, over 300,000 financial statements from
private and public companies, public filings and collections information from the last ten years,
peer trade alerts collected in a variety of ways, data from the Centers for Medicare & Medicaid
Services, and several other proprietary sources.
Machine Learning Approach to Big Data Analysis
This section focuses on the three general steps that are commonly performed to build a model:
(1) data exploration, (2) feature extraction, and (3) model training and testing.
Data Exploration
An essential first step, which is often omitted or performed in an ad-hoc fashion in traditional
model fitting, is to analyze the individual variables that could be used as predictors in the model.
This analysis can reveal valuable information about any inconsistencies or outliers in the raw
data. For this purpose, the distribution of potential predictors are studied, and necessary
transformations to satisfy model requirements and statistical assumptions about the data were
explored. For example, it is often desirable to preprocess all model predictors that represent
dollar values, like due amounts, by transforming their underlying distributions to a normal
distribution [13]. This type of transformation ensures (among other benefits) that large
companies or large lenders don’t impose undue effect on the outcome, that the predictor values
are scaled similarly for certain (e.g., linear) algorithms to converge more efficiently, and that the
prediction errors are not biased by any inherent bias in the data.
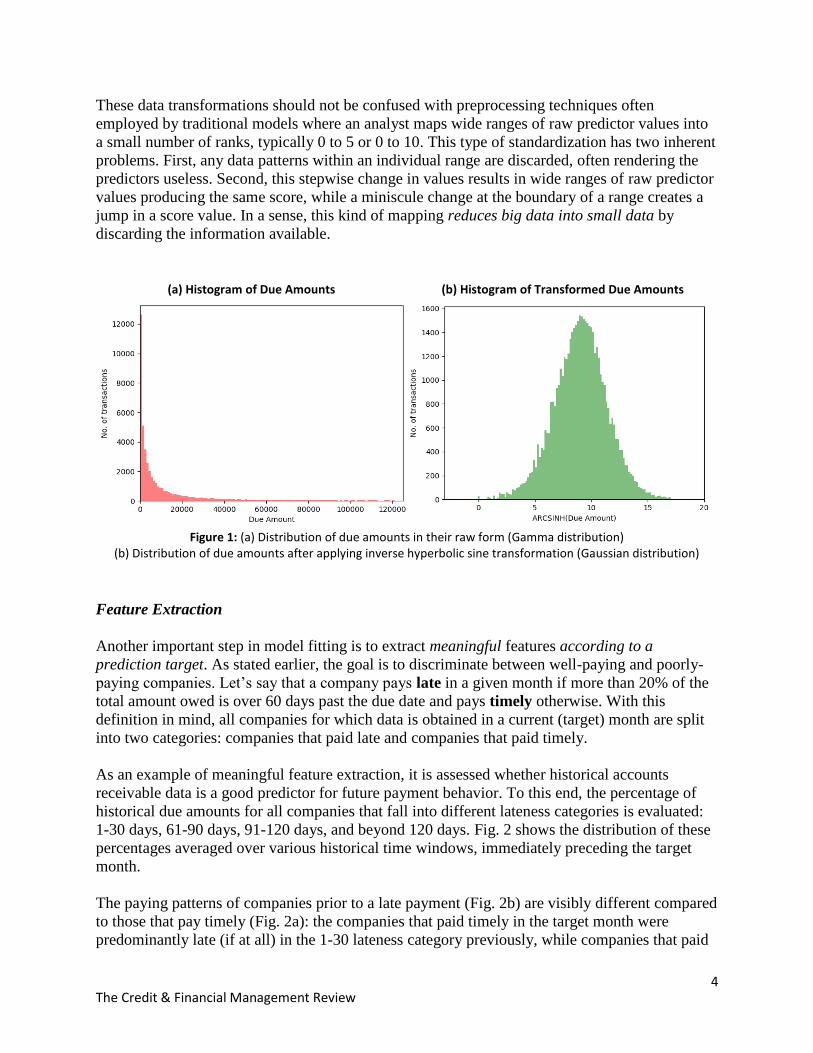
For instance, a raw distribution of the due amounts (Fig. 1a) shows that the majority of due
amounts are small dollar values and there are far fewer transactions in the order of millions of
dollars - an interesting, if not surprising fact. Yet, this distribution fails to underline that, for
example, an increase of $10,000 in past due means something quite different for a small
company than for a large company. The applied hyperbolic sine transformation [9] scales these
differences giving a normal distribution, and enables the use of the scaled due amount value as a
good input predictor in any model.
4 The Credit & Financial Management Review
These data transformations should not be confused with preprocessing techniques often
employed by traditional models where an analyst maps wide ranges of raw predictor values into
a small number of ranks, typically 0 to 5 or 0 to 10. This type of standardization has two inherent
problems. First, any data patterns within an individual range are discarded, often rendering the
predictors useless. Second, this stepwise change in values results in wide ranges of raw predictor
values producing the same score, while a miniscule change at the boundary of a range creates a
jump in a score value. In a sense, this kind of mapping reduces big data into small data by
discarding the information available.
(a) Histogram of Due Amounts (b) Histogram of Transformed Due Amounts
Figure 1: (a) Distribution of due amounts in their raw form (Gamma distribution) (b) Distribution of due amounts after applying inverse hyperbolic sine transformation (Gaussian distribution)
Feature Extraction
Another important step in model fitting is to extract meaningful features according to a
prediction target. As stated earlier, the goal is to discriminate between well-paying and poorly-
paying companies. Let’s say that a company pays late in a given month if more than 20% of the
total amount owed is over 60 days past the due date and pays timely otherwise. With this
definition in mind, all companies for which data is obtained in a current (target) month are split
into two categories: companies that paid late and companies that paid timely.
As an example of meaningful feature extraction, it is assessed whether historical accounts
receivable data is a good predictor for future payment behavior. To this end, the percentage of
historical due amounts for all companies that fall into different lateness categories is evaluated:
1-30 days, 61-90 days, 91-120 days, and beyond 120 days. Fig. 2 shows the distribution of these
percentages averaged over various historical time windows, immediately preceding the target
month.
The paying patterns of companies prior to a late payment (Fig. 2b) are visibly different compared
to those that pay timely (Fig. 2a): the companies that paid timely in the target month were
predominantly late (if at all) in the 1-30 lateness category previously, while companies that paid
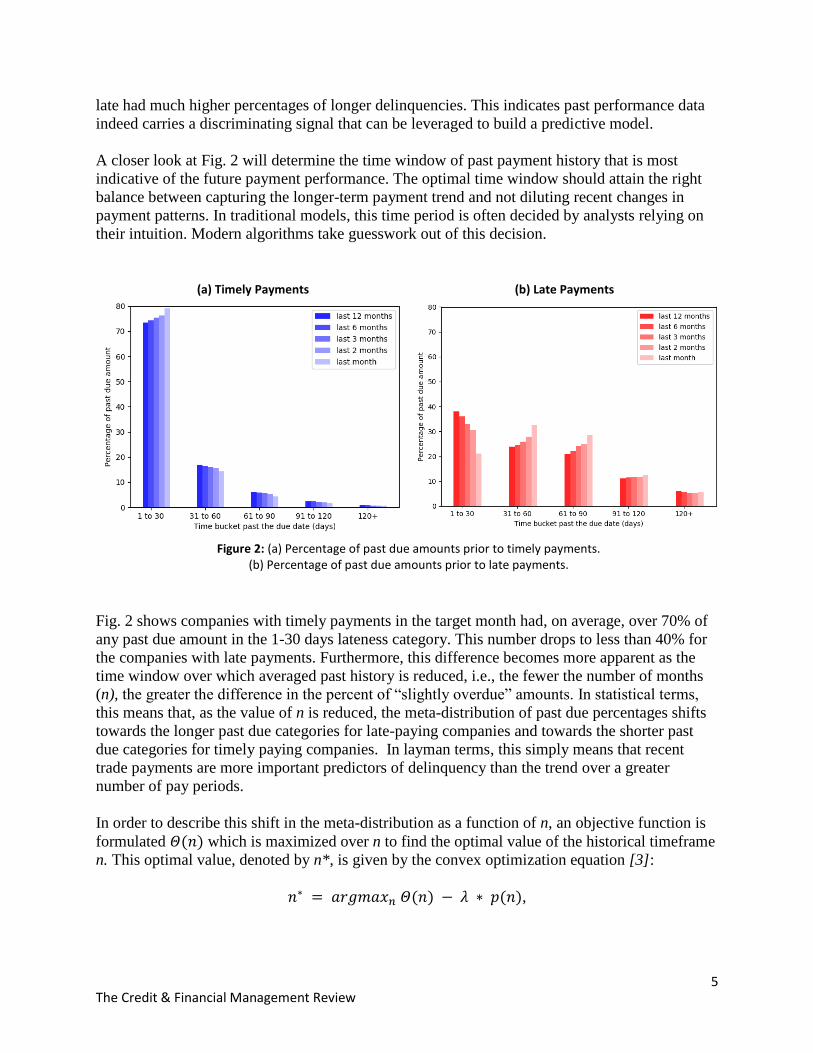
5 The Credit & Financial Management Review
late had much higher percentages of longer delinquencies. This indicates past performance data
indeed carries a discriminating signal that can be leveraged to build a predictive model.
A closer look at Fig. 2 will determine the time window of past payment history that is most
indicative of the future payment performance. The optimal time window should attain the right
balance between capturing the longer-term payment trend and not diluting recent changes in
payment patterns. In traditional models, this time period is often decided by analysts relying on
their intuition. Modern algorithms take guesswork out of this decision.
(a) Timely Payments (b) Late Payments
Figure 2: (a) Percentage of past due amounts prior to timely payments.
(b) Percentage of past due amounts prior to late payments.
Fig. 2 shows companies with timely payments in the target month had, on average, over 70% of
any past due amount in the 1-30 days lateness category. This number drops to less than 40% for
the companies with late payments. Furthermore, this difference becomes more apparent as the
time window over which averaged past history is reduced, i.e., the fewer the number of months
(n), the greater the difference in the percent of “slightly overdue” amounts. In statistical terms,
this means that, as the value of n is reduced, the meta-distribution of past due percentages shifts
towards the longer past due categories for late-paying companies and towards the shorter past
due categories for timely paying companies. In layman terms, this simply means that recent
trade payments are more important predictors of delinquency than the trend over a greater
number of pay periods.
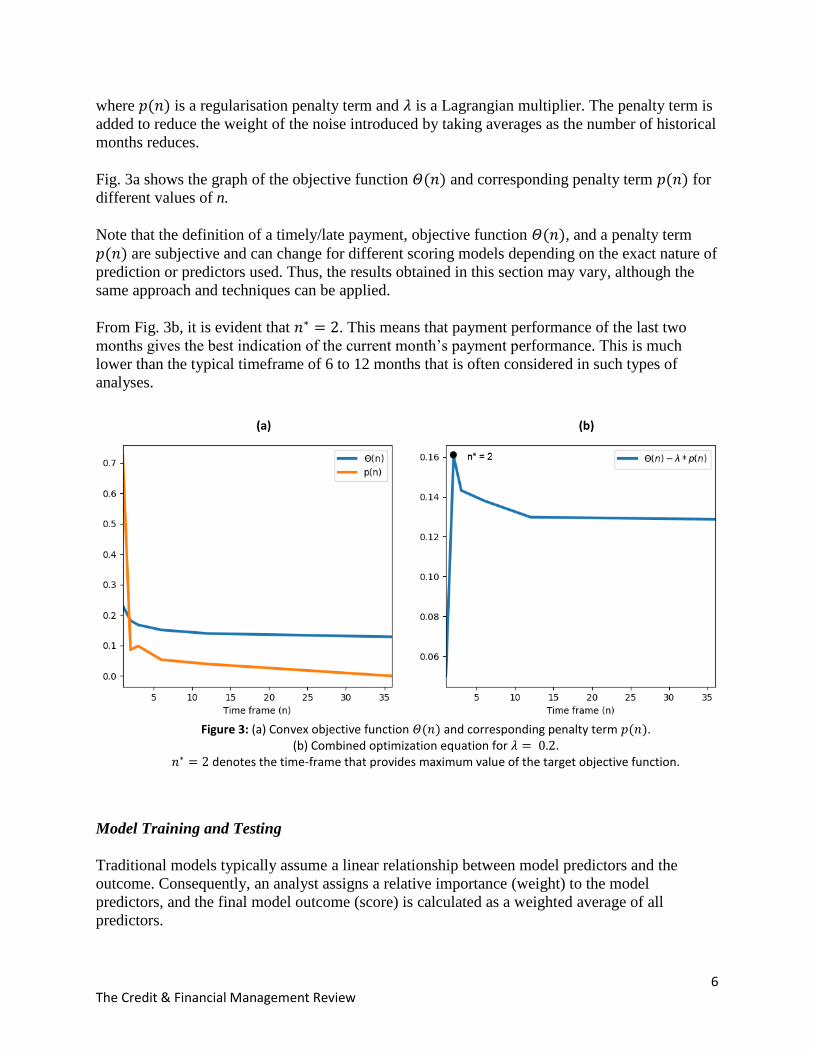
In order to describe this shift in the meta-distribution as a function of n, an objective function is
formulated 𝛩(𝑛) which is maximized over n to find the optimal value of the historical timeframe
n. This optimal value, denoted by n*, is given by the convex optimization equation [3]:
𝑛∗ = 𝑎𝑟𝑔𝑚𝑎𝑥𝑛 𝛩(𝑛) − 𝜆 ∗ 𝑝(𝑛),
6 The Credit & Financial Management Review
where 𝑝(𝑛) is a regularisation penalty term and 𝜆 is a Lagrangian multiplier. The penalty term is
added to reduce the weight of the noise introduced by taking averages as the number of historical
months reduces.
Fig. 3a shows the graph of the objective function 𝛩(𝑛) and corresponding penalty term 𝑝(𝑛) for
different values of n.
Note that the definition of a timely/late payment, objective function 𝛩(𝑛), and a penalty term
𝑝(𝑛) are subjective and can change for different scoring models depending on the exact nature of
prediction or predictors used. Thus, the results obtained in this section may vary, although the
same approach and techniques can be applied.
From Fig. 3b, it is evident that 𝑛∗ = 2. This means that payment performance of the last two
months gives the best indication of the current month’s payment performance. This is much
lower than the typical timeframe of 6 to 12 months that is often considered in such types of
analyses.
(a) (b)
Figure 3: (a) Convex objective function 𝛩(𝑛) and corresponding penalty term 𝑝(𝑛).
(b) Combined optimization equation for 𝜆 = 0.2. 𝑛∗ = 2 denotes the time-frame that provides maximum value of the target objective function.
Model Training and Testing
Traditional models typically assume a linear relationship between model predictors and the
outcome. Consequently, an analyst assigns a relative importance (weight) to the model
predictors, and the final model outcome (score) is calculated as a weighted average of all
predictors.
7 The Credit & Financial Management Review
By its nature, big data comes from a large number of unrelated sources. Thus, it is highly
improbable that different characteristics extracted from big data and supplied to the model would
have a linear relationship with the predicted outcome. Fortunately, there are a number of
machine learning algorithms readily available to account for the most sophisticated relationships
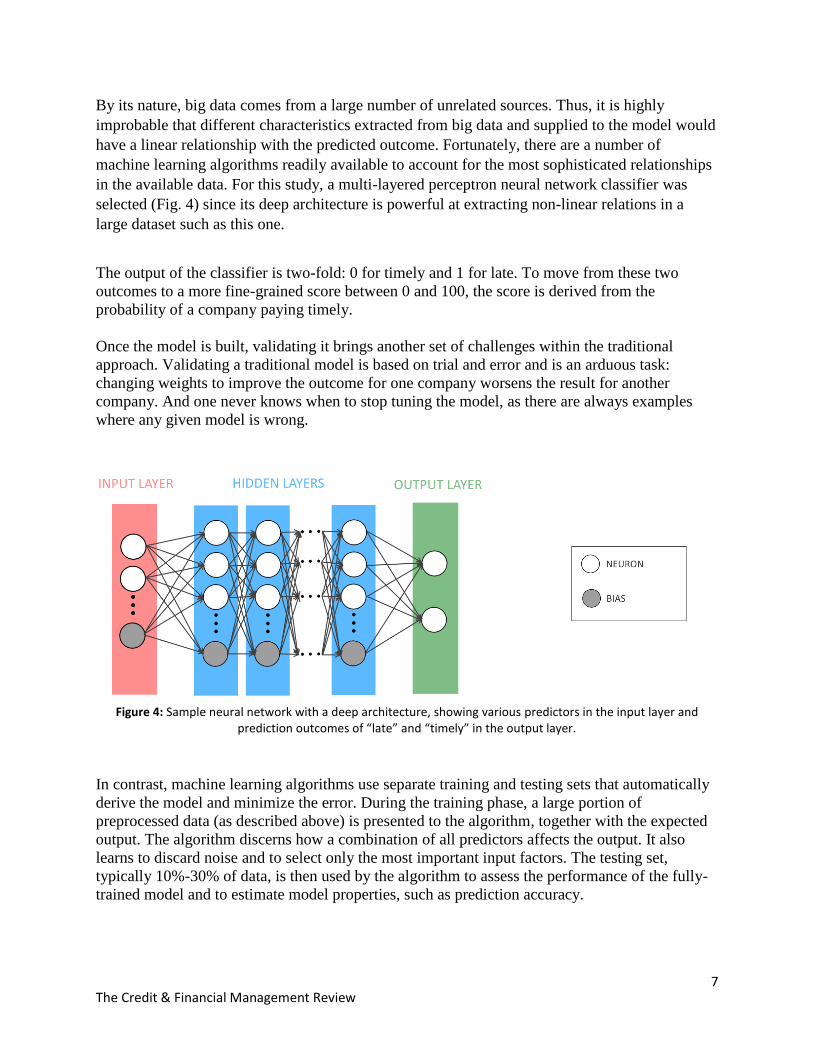
in the available data. For this study, a multi-layered perceptron neural network classifier was
selected (Fig. 4) since its deep architecture is powerful at extracting non-linear relations in a
large dataset such as this one.
The output of the classifier is two-fold: 0 for timely and 1 for late. To move from these two
outcomes to a more fine-grained score between 0 and 100, the score is derived from the
probability of a company paying timely.
Once the model is built, validating it brings another set of challenges within the traditional
approach. Validating a traditional model is based on trial and error and is an arduous task:
changing weights to improve the outcome for one company worsens the result for another
company. And one never knows when to stop tuning the model, as there are always examples
where any given model is wrong.
Figure 4: Sample neural network with a deep architecture, showing various predictors in the input layer and
prediction outcomes of “late” and “timely” in the output layer.
In contrast, machine learning algorithms use separate training and testing sets that automatically
derive the model and minimize the error. During the training phase, a large portion of
preprocessed data (as described above) is presented to the algorithm, together with the expected
output. The algorithm discerns how a combination of all predictors affects the output. It also
learns to discard noise and to select only the most important input factors. The testing set,
typically 10%-30% of data, is then used by the algorithm to assess the performance of the fully-
trained model and to estimate model properties, such as prediction accuracy.
8 The Credit & Financial Management Review
This approach thrives on large volumes of data: the more data points available and the larger the
training set, the more accurate the model will be.
Quantifying the Benefits of Machine Learning Approach
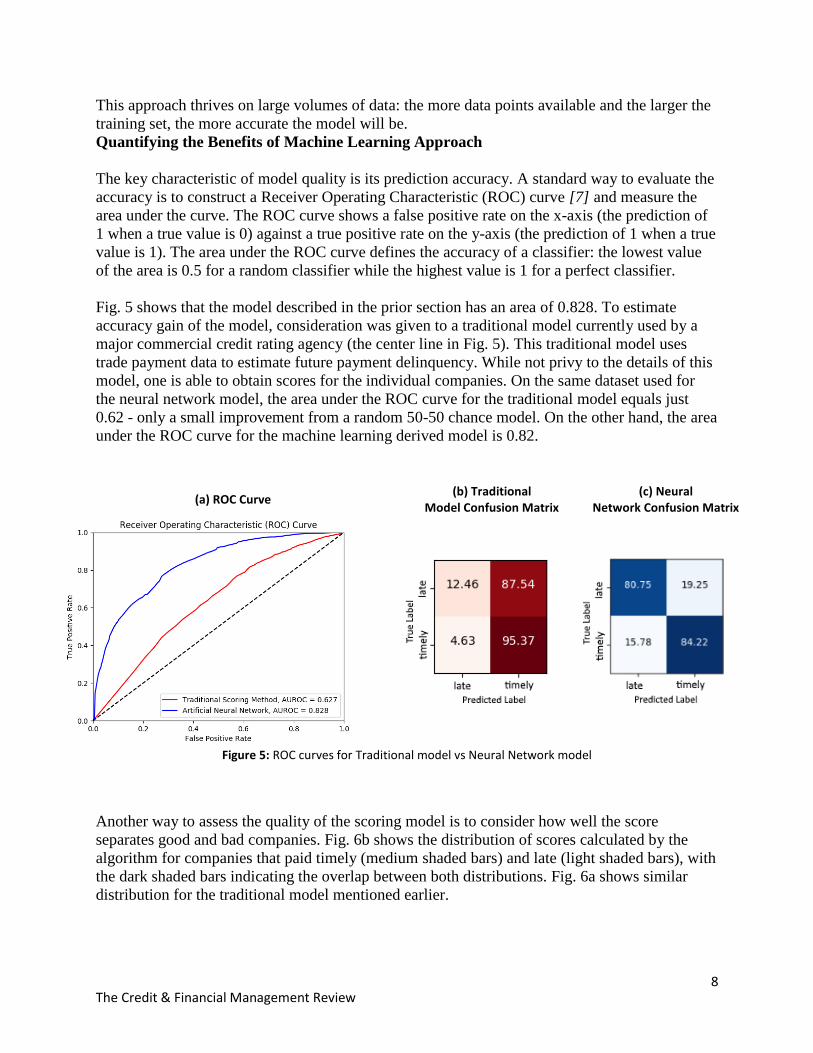
The key characteristic of model quality is its prediction accuracy. A standard way to evaluate the
accuracy is to construct a Receiver Operating Characteristic (ROC) curve [7] and measure the
area under the curve. The ROC curve shows a false positive rate on the x-axis (the prediction of
1 when a true value is 0) against a true positive rate on the y-axis (the prediction of 1 when a true
value is 1). The area under the ROC curve defines the accuracy of a classifier: the lowest value
of the area is 0.5 for a random classifier while the highest value is 1 for a perfect classifier.
Fig. 5 shows that the model described in the prior section has an area of 0.828. To estimate
accuracy gain of the model, consideration was given to a traditional model currently used by a
major commercial credit rating agency (the center line in Fig. 5). This traditional model uses
trade payment data to estimate future payment delinquency. While not privy to the details of this
model, one is able to obtain scores for the individual companies. On the same dataset used for
the neural network model, the area under the ROC curve for the traditional model equals just
0.62 - only a small improvement from a random 50-50 chance model. On the other hand, the area
under the ROC curve for the machine learning derived model is 0.82.
(a) ROC Curve (b) Traditional
Model Confusion Matrix (c) Neural
Network Confusion Matrix
Figure 5: ROC curves for Traditional model vs Neural Network model
Another way to assess the quality of the scoring model is to consider how well the score
separates good and bad companies. Fig. 6b shows the distribution of scores calculated by the
algorithm for companies that paid timely (medium shaded bars) and late (light shaded bars), with
the dark shaded bars indicating the overlap between both distributions. Fig. 6a shows similar
distribution for the traditional model mentioned earlier.
9 The Credit & Financial Management Review
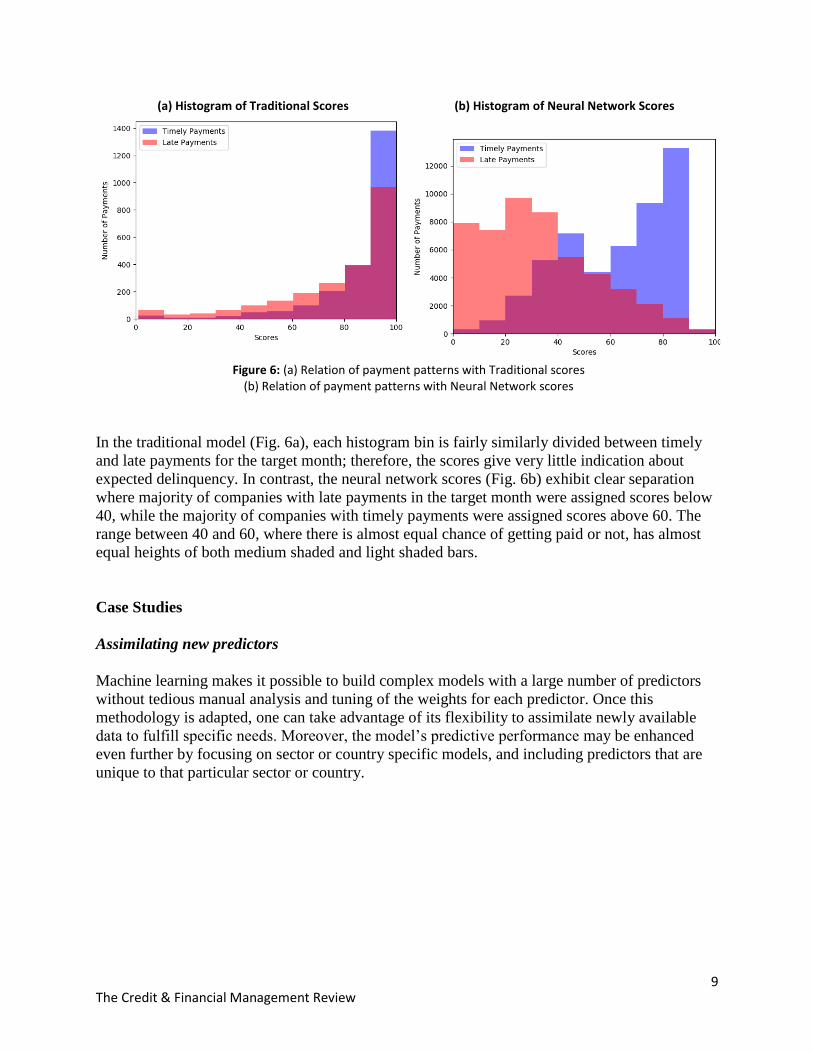
(a) Histogram of Traditional Scores (b) Histogram of Neural Network Scores
Figure 6: (a) Relation of payment patterns with Traditional scores
(b) Relation of payment patterns with Neural Network scores
In the traditional model (Fig. 6a), each histogram bin is fairly similarly divided between timely
and late payments for the target month; therefore, the scores give very little indication about
expected delinquency. In contrast, the neural network scores (Fig. 6b) exhibit clear separation
where majority of companies with late payments in the target month were assigned scores below
40, while the majority of companies with timely payments were assigned scores above 60. The
range between 40 and 60, where there is almost equal chance of getting paid or not, has almost
equal heights of both medium shaded and light shaded bars.
Case Studies
Assimilating new predictors
Machine learning makes it possible to build complex models with a large number of predictors
without tedious manual analysis and tuning of the weights for each predictor. Once this
methodology is adapted, one can take advantage of its flexibility to assimilate newly available
data to fulfill specific needs. Moreover, the model’s predictive performance may be enhanced
even further by focusing on sector or country specific models, and including predictors that are
unique to that particular sector or country.
10 The Credit & Financial Management Review
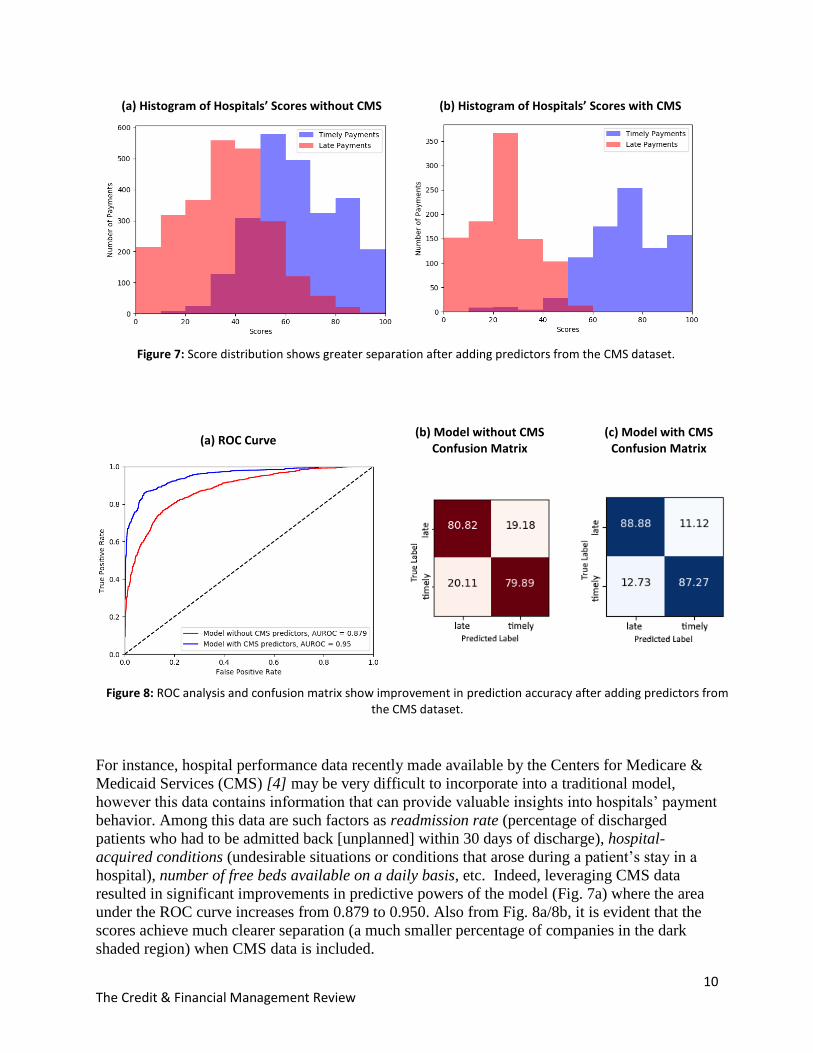
(a) Histogram of Hospitals’ Scores without CMS (b) Histogram of Hospitals’ Scores with CMS
Figure 7: Score distribution shows greater separation after adding predictors from the CMS dataset.
(a) ROC Curve (b) Model without CMS
Confusion Matrix (c) Model with CMS
Confusion Matrix
Figure 8: ROC analysis and confusion matrix show improvement in prediction accuracy after adding predictors from the CMS dataset.
For instance, hospital performance data recently made available by the Centers for Medicare &
Medicaid Services (CMS) [4] may be very difficult to incorporate into a traditional model,
however this data contains information that can provide valuable insights into hospitals’ payment
behavior. Among this data are such factors as readmission rate (percentage of discharged
patients who had to be admitted back [unplanned] within 30 days of discharge), hospital-
acquired conditions (undesirable situations or conditions that arose during a patient’s stay in a
hospital), number of free beds available on a daily basis, etc. Indeed, leveraging CMS data
resulted in significant improvements in predictive powers of the model (Fig. 7a) where the area
under the ROC curve increases from 0.879 to 0.950. Also from Fig. 8a/8b, it is evident that the
scores achieve much clearer separation (a much smaller percentage of companies in the dark
shaded region) when CMS data is included.
11 The Credit & Financial Management Review
Adapting to Change in Data Patterns
The data patterns that impact credit risk may change, and the model that was accurate last year
may not be accurate today. With large numbers of predictors and data volume, these changes are
easily overlooked by a human analyst. With machine learning, one can easily retrain the model
and automatically adapt to new realities. To illustrate this aspect, the goal is to predict
bankruptcies modeled using the same predictors as those utilized in the Altman Z-Scores, but to
build the model using the neural network algorithm. One must consider the 395 bankruptcies that
occurred in the 10-year period starting in 2007 and use financial statements submitted one and
two years prior to the filing date. For non-bankrupt companies, the two-year timeframe is applied
to the financial statements, but is based on the current date.
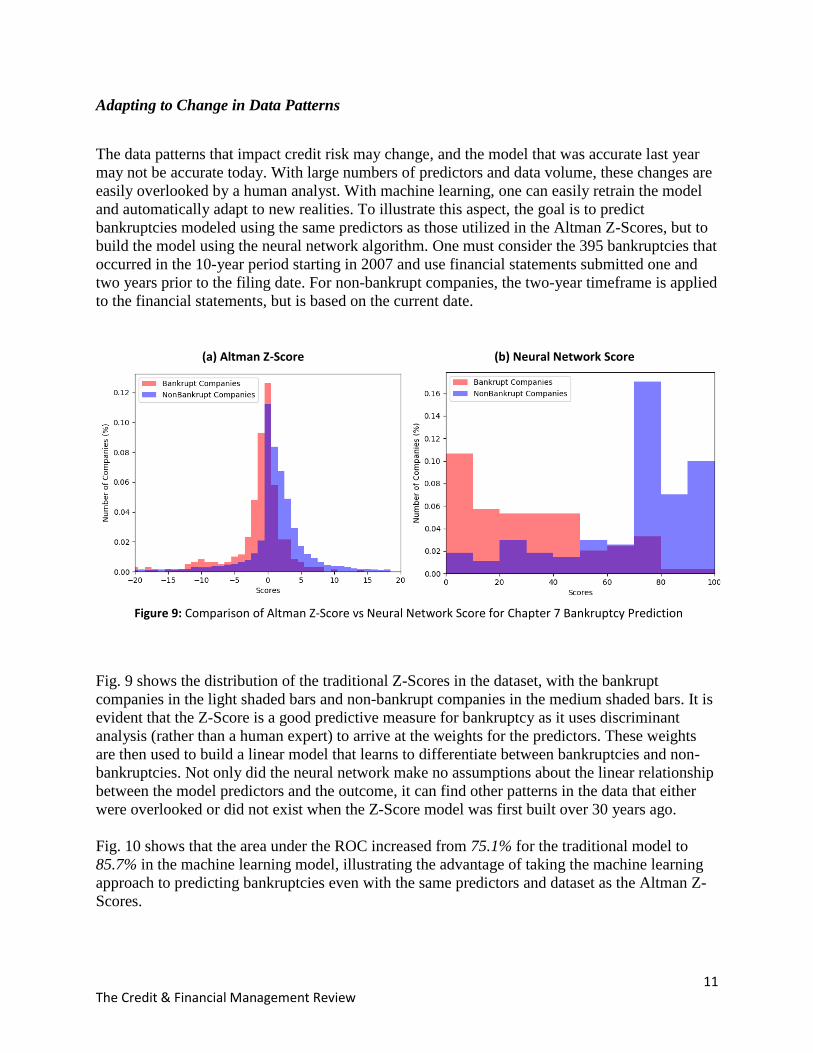
(a) Altman Z-Score (b) Neural Network Score
Figure 9: Comparison of Altman Z-Score vs Neural Network Score for Chapter 7 Bankruptcy Prediction
Fig. 9 shows the distribution of the traditional Z-Scores in the dataset, with the bankrupt
companies in the light shaded bars and non-bankrupt companies in the medium shaded bars. It is
evident that the Z-Score is a good predictive measure for bankruptcy as it uses discriminant
analysis (rather than a human expert) to arrive at the weights for the predictors. These weights
are then used to build a linear model that learns to differentiate between bankruptcies and non-
bankruptcies. Not only did the neural network make no assumptions about the linear relationship
between the model predictors and the outcome, it can find other patterns in the data that either
were overlooked or did not exist when the Z-Score model was first built over 30 years ago.
Fig. 10 shows that the area under the ROC increased from 75.1% for the traditional model to
85.7% in the machine learning model, illustrating the advantage of taking the machine learning
approach to predicting bankruptcies even with the same predictors and dataset as the Altman Z-
Scores.

12 The Credit & Financial Management Review
(a) ROC Curve (b) Z-Score
Confusion Matrix (c) Neural Network Confusion Matrix
Figure 10: Comparison of ROC curves for Altman Z-Score vs Neural Network Model.
Conclusion
Accurate forecasting of future performance is of prime importance in the trade credit industry
where suppliers are expected to make rapid decisions on whether to sell on commercial terms to
a business. These decisions used to be based on very limited information. With the explosion of
data over the last ten years, the opportunity to utilize this data intelligently has grown
exponentially; yet these opportunities often remain unrealized because interpreting vast
quantities of complex data is beyond human capacity. It has been shown that using machine
learning techniques allows one to take advantage of all the available data and, consequently, gain
a considerable improvement in predictability over traditional models. Better (and timelier!)
predictions in turn lead to positive impact on trade conducted by businesses. In addition, this
modeling approach has a self-regulating aspect which allows it to dynamically adjust to trends in
the input data simply by periodic retraining, thus obviating the need to revisit weights in
traditional models.
This does not mean that the role of a human analyst will become obsolete. There are instances
where computer models fall short, for example, in the aftermath of extraordinary events (wars,
natural disasters, political upheavals, etc.). These events create discontinuity when past patterns
no longer apply. Thus, the automatic computer scoring based on machine learning algorithms
and human analysis complement each other in determining credit risk.
Chintan Trivedi, Data Scientist, Credit2B - As a Data Scientist, Chintan focuses on the
research surrounding Big Data and Predictive Analytics. His primary responsibility involves
improving predictability of credit scores using Machine Learning and Pattern Recognition
techniques. Other interests include statistical analysis, data visualization and data integration.
Chintan’s prior research experiences concern bringing benefits of Artificial Intelligence to the
fields of Neuro and Safety Sciences, gained during his time at Rutgers University, New Jersey,
where he got his M.S. degree in Computer Science.
13 The Credit & Financial Management Review
Irina Rabinovich, Chief Technology Officer, Credit2B - In this role, Irina is responsible for
technology management and R&D activities for the firm. In particular, she provides vision
and leadership in the areas of software engineering, system security, and data analytics,
including data acquisition and credit scoring. In her role, Irina manages a technical team,
interacts with vendor partners, and works closely with clients to understand their credit
policies and evolving needs. Prior to Credit2B, Irina worked at Dun & Bradstreet where she
managed design, implementation, and support of web-based systems for the D&B data
warehouse. She holds a B.Sc. in Computer Science and Mathematics and a M.Sc. in
Mathematics, all from the University of Washington, Seattle.
Shyarsh Desai, Chief Executive Officer, Credit2B - As a founder & CEO, Shyarsh is
responsible for vision and the overall day-to-day operations of the business working with a
highly experienced team in financial technology and data management. His background
includes senior roles in strategy, business development, sales and finance through a career
encompassing high growth companies as well as large, established multi-billion-dollar
businesses. Most recently, Shyarsh was a member of the management team at Global
Compliance, a Software-as-a-Service business where he was responsible for business
development and growth market sales. Prior to this, he was a Strategy Leader for North
America responsible for planning and business development at Dun and Bradstreet
(D&B). Shyarsh joined D&B from IBM where he played multiple roles across the firm in
sales, client solutions, finance and corporate development (M&A). Shyarsh has a B.Sc. in
Life Sciences, a graduate degree in Finance and an MBA from the Kellogg School of
Management at Northwestern University.
References
1. Altman, E.I., 1968. Financial ratios, discriminant analysis and the prediction of corporate bankruptcy. The journal
of finance, 23(4), pp.589-609. 2. Baesens, B., Van Gestel, T., Viaene, S., Stepanova, M., Suykens, J. and Vanthienen, J., 2003. Benchmarking
state-of-the-art classification algorithms for credit scoring. Journal of the operational research society, 54(6), pp.627-635.
3. Boyd, S. and Vandenberghe, L., 2004. Convex optimization. Cambridge university press. 4. Centers for Medicare & Medicaid Services, Hospital Compare Data.
https://data.medicare.gov/data/archives/hospital-compare 5. Desai, V.S., Crook, J.N. and Overstreet, G.A., 1996. A comparison of neural networks and linear scoring models
in the credit union environment. European Journal of Operational Research, 95(1), pp.24-37 6. Durand, D., 1941. Risk elements in consumer instalment financing. NBER Books. 7. Fawcett, T., 2006. An introduction to ROC analysis. Pattern recognition letters, 27(8), pp.861-874. 8. Fensterstock, B.A., Salters, J. and Willging, R., 2013. On the Use of Ensemble Models for Credit Evaluation.
Credit Financ. Manag. Rev, 1(1), pp.1-14. 9. Friedline, T., Masa, R.D. and Chowa, G.A., 2015. Transforming wealth: Using the inverse hyperbolic sine (IHS)
and splines to predict youth’s math achievement. Social science research, 49, pp.264-287. 10. Huang, C.L., Chen, M.C. and Wang, C.J., 2007. Credit scoring with a data mining approach based on support
vector machines. Expert systems with applications, 33(4), pp.847-856. 11. Lo, K. and Lys, T., 2000. The Ohlson model: contribution to valuation theory, limitations, and empirical
applications. Journal of Accounting, Auditing & Finance, 15(3), pp.337-367. 12. Piotroski, J.D., 2000. Value investing: The use of historical financial statement information to separate winners
from losers. Journal of Accounting Research, pp.1-41. 13. Rasmussen, C.E. and Williams, C.K., 2006. Gaussian processes for machine learning (Vol. 1). Cambridge: MIT
press. 14. West, D., 2000. Neural network credit scoring models. Computers & Operations Research, 27(11), pp.1131-
1152.