applying sediment cores and nuclear techniques for ... · data providing evidence of pollution...

1
APPLYING SEDIMENT CORES AND NUCLEAR TECHNIQUES FOR POLLUTION ASSESSMENT IN THE BONNY/NEW CALABAR RIVER ESTUARY, NIGER DELTA, NIGERIA 1 1 2 OMOROTIONMWAN OMOKHEYEKE , FRANCIS D. SIKOKI , ABDELMOURHIT LAISSAOUI , 1 Centre for Marine Pollution Monitoring and Seafood Safety, University of Port Harcourt, Port Harcourt, Nigeria 2 Centre National de L'Energie, des Sciences et des Techniques Nucléaires (CNESTEN), B.P. 1382, R.P. 10001, Rabat, Morocco Abstract Sediment cores were collected from the Bonny Estuary in August 2011 to archive pollution records over the last 80years. Three sampling locations were selected and used for assessing the extent of pollution in the estuary. Alpha and gamma spectrometer in conjunction with the constant rate of supply model (CRS were deployed to establish the age of the sediment and the data were validated using 137Cs profiles and events that occurred within the region. The results of the activities of naturally occurring radionuclides(226Ra, 228Ra and 40k) ranged from 15 ± 2 - 34 ± 3 Bq·kg-1; 32 ± 5 - 48 ± 6 Bq·kg-1and 264 ± 29 - 462 ± 36 Bq·kg-1 respectively . The results obtained for the core profiles of stations 1 and 2 exhibited a relativity constant activity but that of station 3 exhibited significant decrease with depth which was appropriate for radiometric dating. CRS model displayed increase in bulk sediment accumulation over the past 80 years with special reference to 1938, 1955, 1973, 1997 and 2004. Cesium-137profiles were in agreement with the CRS established ages. The sedimentation rates obtained ranged from 0.019 to 0.034g.cm-2.y-1. The data further revealed that minimum and maximum environmental perturbations occurred in the early 1970s and late1990s respectively. Core profiles of total hydrocarbon content ranged from 0.001 to 130.80 ppm and total phosphorus 0.01 to 0.499mg/g. The observed profiles had peaks corresponding chronologically to severe environmental perturbations resulting from massive oil spills and substantial delivery of phosphorus from agricultural runoffs between early 1970s and early 2000s. It is therefore surmised that since the advent of industrial activities the estuary has been subject to perturbations and contamination from human activities which has resulted to fluctuations in environment conditions. Keywords: Pollution archiving, total hydrocarbon content, 137Cs, radiometric dating, CRS model INTRODUCTION Nigeria has experienced remarkable increase in industrial activities; particularly in its oil and gas sector. These activities which are centred mainly in the Niger Delta area have generated massive wealth for the nation. The Niger delta is bounded to the south by the Atlantic Ocean and covers about 50% of the total length of the Nigerian Coastline and it is situated in the Gulf of Guinea, located between 5° E to 8° E longitude and 4° N to 6° N latitude. The coastal areas of Nigeria, particularly the Niger Delta Basin have suffered debilitating environmental degradation and pollution from human activities such as oil industry operations, manufacturing and municipal discharges. These activities became heightened following the discovery of crude oil in the late 1950s but have assumed even greater dimensions since the early 1970s when oil prospecting became the mainstay of the Nigerian economy. This scenario has undermined basic ecosystem services such as water quality and land productivity (NDES, 1999). The consequences of this have been the decline in health conditions, standard of living, socio-economic well- being and loss of income of the indigenous populace. However, the government has demonstrated concern for environmental protection and resource conservation but unfortunately, empirical data providing evidence of pollution stocks over the last 80 years is lacking. Thus, in order to maintain and improve the quality of the unique environmental resource endowment and the physical characteristics of the coastal areas, assessing pollution stocks using sediment cores and nuclear techniques is essential. Sediment cores were retrieved from shallow marginal areas at three stations (Fig.1) belonging to the upper Bonny Estuary in August 2011 using an Uwitec gravity corer of 10 cm internal diameter. Three cores, 32; 30 and 20cm depth were collected from station 1 (St-1); station 2 (St-2) and station 3 (St-3) respectively. In addition, sediment surface samples (6 cm depth) were also collected, from the three stations during different months (August, October and December 2011, and February and May 2012) covering rainy and dry seasons. The objectives of this research paper are to evaluate profiles of pollution stocks dating back some 80 years, identify peaks in the disturbances, and Identify possible sources of pollution. Sample Collection and Preparation MATERIALS AND METHODS R I C A AF Nigeria The sampling site * St-2 * St-1 * St-3 R I C A AF Nigeria The sampling site R I C A AF Nigeria The sampling site * St-2 * St-1 * St-1 * St-3 * St-3 Figure 1: The study area showing the sampling locations. The sediment cores were immediately transported after retrieval to the laboratory for pre-treatment and conditioning prior to radiometric analyses. Each core was sectioned into 2 cm slices and wet sub-samples were weighed and then dried in an oven, using a constant temperature of 80°C during 24 h. Dry samples were weighed again and the content of water in each stratigraphic level was calculated for the three cores. Bulk densities were determined from water content and particle density of each slice. Finally, dried sediment was ground in a mortar to fine powder and homogenised for subsequent alpha and gamma emitters analyses. Organic matter content was calculated as the difference in weight between the dried sediment and the ash obtained following ignition at 550ºC for 24 h. Radiometric Measurements: 210 The activity of Po was determined using alpha-ray spectrometry using silicon surface barrier detectors (EG&G) coupled to a PC running MaestroTM data acquisition software while gamma emitting radionuclides were measured using gamma-ray spectrometer. Total Hydrocarbon and Total Phosphorus Analyses: All samples were analyzed as described in Standard Methods for the Examination of Water and Wastewater (APHA, 2001). Trends of Naturally Occurring Radionuclides The activities of naturally occurring radionuclides 226Ra , 228Ra, and 40K , were all in the range of the values reported for coastal regions . The spatial and temporal variations displayed fairly uniform distribution with 226Ra while 228Ra displayed some variability with lowest activities during the dry season than wet season 228 228 214 226 212 228 40 [ Ac( Ra), Bi( Ra), Pb( Th) and K] Spatial and Temporal Trends Station -1 Station -2 Station -3 S T 1 ( f e b ) S T 1 ( m a y ) S T 1 ( a u g ) S T 1 ( o c t ) S T 1 ( d e c ) S T 2 ( f e b ) S T 2 ( m a y ) S T 2 ( a u g ) S T 2 ( o c t ) S T 2 ( d e c ) S T 3 ( f e b ) S T 3 ( m a y ) S T 3 ( a u g ) S T 3 ( o c t ) S T 3 ( d e c ) 0,0 0,2 0,4 0,6 0,8 1,0 1,2 20 30 40 50 60 70 80 226 Ra 228 Ra 226 Ra/ 228 Ra Activity (Bq/kg) 226 Ra/ 228 Ra Station -1 Station -2 Station -3 S T 1 ( f e b ) S T 1 ( m a y ) S T 1 ( a u g ) S T 1 ( o c t ) S T 1 ( d e c ) S T 2 ( f e b ) S T 2 ( m a y ) S T 2 ( a u g ) S T 2 ( o c t ) S T 2 ( d e c ) S T 3 ( f e b ) S T 3 ( m a y ) S T 3 ( a u g ) S T 3 ( o c t ) S T 3 ( d e c ) 0,0 0,2 0,4 0,6 0,8 1,0 1,2 20 30 40 50 60 70 80 226 Ra 228 Ra 226 Ra/ 228 Ra Activity (Bq/kg) 226 Ra/ 228 Ra Figure 2: Activity concentrations of 226Ra and 228Ra in different months at the three stations. Activities are in Bq.kg-1 dry weight and uncertainties are 1-ó statistical errors. Variation of 226Ra to 228Ra ratio is also plotted Vertical Distributions Core profiles of 228Ra 212Pb and 40K displayed fairly homogenous distributions throughout the cores with the only exception for 40K in St- 3. A relatively visible increase of this radionuclide concentration in the basal 6-cm of the core was observed. This enhancement of 40K may be attributed to the different origin of particles present in the deepest layers of the core that may contain more fine-grained clay sediment than the rest of the core. In addition, vertical distributions of organic matter content are also depicted in Fig. 3 for each coring site. Depth in sediment (cm) 228 Ra (Bq/kg) 30 25 20 15 10 5 0 20 40 60 20 30 40 50 60 212 Pb (Bq/kg) 300 400 500 600 40 K (Bq/kg) Station- 1 30 25 20 15 10 5 0 20 40 60 80 45 55 65 200 400 600 Station- 2 20 15 10 5 0 40 50 60 70 300 400 500 600 Station- 3 40 50 60 70 22 24 26 28 25 26 27 28 24 25 26 O. M. % Depth in sediment (cm) 228 Ra (Bq/kg) 30 25 20 15 10 5 0 20 40 60 20 30 40 50 60 212 Pb (Bq/kg) 300 400 500 600 40 K (Bq/kg) Station- 1 228 Ra (Bq/kg) 30 25 20 15 10 5 0 20 40 60 228 Ra (Bq/kg) 30 25 20 15 10 5 0 20 40 60 20 30 40 50 60 212 Pb (Bq/kg) 20 30 40 50 60 212 Pb (Bq/kg) 300 400 500 600 40 K (Bq/kg) 300 400 500 600 40 K (Bq/kg) Station- 1 30 25 20 15 10 5 0 20 40 60 80 45 55 65 200 400 600 Station- 2 30 25 20 15 10 5 0 20 40 60 80 30 25 20 15 10 5 0 20 40 60 80 45 55 65 45 55 65 200 400 600 200 400 600 Station- 2 20 15 10 5 0 40 50 60 70 300 400 500 600 Station- 3 40 50 60 70 20 15 10 5 0 40 50 60 70 20 15 10 5 0 40 50 60 70 300 400 500 600 300 400 500 600 Station- 3 40 50 60 70 40 50 60 70 22 24 26 28 22 24 26 28 25 26 27 28 25 26 27 28 24 25 26 24 25 26 O. M. % 228 212 40 Figure 3. Vertical distributions of Ra, Pb and K in the three sediment cores collected from the Bonny Estuary. Activities are in Bq·kg-1 dry weight and errors are 1-ó statistical uncertainties Radiometric Dating Radiometric dating was achieved for station 3 with the unsupported 210 Pb exhibiting significant decrease with depth while stations 1 and 2 did not exhibit significant decrease in 210Pb with depth, but rather relatively constant activities with discrete maxima and minima. Therefore, these cores (St-1 and St-2) were qualified as incomplete and disturbed, and were excluded from calculations of sedimentation rates, ages and total inventories of 210Pbxs. 30 25 20 15 10 5 0 0 10 20 30 40 50 80 120 160 200 240 210 Pb tot (Bq/kg) 226 Ra (Bq/kg) Depth in sediment (cm) 30 25 20 15 10 5 0 0 50 100 150 200 210 Pb xs (Bq/kg) 30 25 20 15 10 5 0 40 60 80 100 120 212 Pb xs (Bq/kg) 30 25 20 15 10 5 0 0 20 40 60 80 100 120 140 Depth in sediment (cm) 210 Pb tot (Bq/kg) 226 Ra (Bq/kg) 20 15 10 5 0 20 40 60 80 100 226 Ra (Bq/kg) 210 Pb (Bq/kg) Depth in sediment (cm) 20 15 10 5 0 0 20 40 60 80 100 210 Pb xs (Bq/kg) Station-3 Station-2 Station-1 30 25 20 15 10 5 0 0 10 20 30 40 50 80 120 160 200 240 210 Pb tot (Bq/kg) 226 Ra (Bq/kg) Depth in sediment (cm) 30 25 20 15 10 5 0 0 50 100 150 200 210 Pb xs (Bq/kg) 30 25 20 15 10 5 0 0 10 20 30 40 50 80 120 160 200 240 210 Pb tot (Bq/kg) 226 Ra (Bq/kg) Depth in sediment (cm) 30 25 20 15 10 5 0 0 10 20 30 40 50 80 120 160 200 240 210 Pb tot (Bq/kg) 226 Ra (Bq/kg) Depth in sediment (cm) 30 25 20 15 10 5 0 0 50 100 150 200 210 Pb xs (Bq/kg) 30 25 20 15 10 5 0 0 50 100 150 200 210 Pb xs (Bq/kg) 30 25 20 15 10 5 0 40 60 80 100 120 212 Pb xs (Bq/kg) 30 25 20 15 10 5 0 0 20 40 60 80 100 120 140 Depth in sediment (cm) 210 Pb tot (Bq/kg) 226 Ra (Bq/kg) 30 25 20 15 10 5 0 40 60 80 100 120 212 Pb xs (Bq/kg) 30 25 20 15 10 5 0 40 60 80 100 120 212 Pb xs (Bq/kg) 30 25 20 15 10 5 0 0 20 40 60 80 100 120 140 Depth in sediment (cm) 210 Pb tot (Bq/kg) 226 Ra (Bq/kg) 30 25 20 15 10 5 0 0 20 40 60 80 100 120 140 Depth in sediment (cm) 210 Pb tot (Bq/kg) 226 Ra (Bq/kg) 210 Pb tot (Bq/kg) 226 Ra (Bq/kg) 20 15 10 5 0 20 40 60 80 100 226 Ra (Bq/kg) 210 Pb (Bq/kg) Depth in sediment (cm) 20 15 10 5 0 0 20 40 60 80 100 210 Pb xs (Bq/kg) 20 15 10 5 0 20 40 60 80 100 226 Ra (Bq/kg) 210 Pb (Bq/kg) Depth in sediment (cm) 20 15 10 5 0 20 40 60 80 100 226 Ra (Bq/kg) 210 Pb (Bq/kg) Depth in sediment (cm) 20 15 10 5 0 0 20 40 60 80 100 210 Pb xs (Bq/kg) 20 15 10 5 0 0 20 40 60 80 100 210 Pb xs (Bq/kg) Station-3 Station-2 Station-1 226 210 210 Figure 4: Ra, total Pb and Pb activity profiles in the sediment cores collected from the Bonny Estuary. Activities, with 1-ó statistical errors, are all in Bq·kg-1 dry xs weight and line are only for guidance The constant rate of supply (CRS) model displayed increase in bulk sediment accumulation over the past 80 years with special reference to 1938, 1955, 19731997 and 2004. The data were validated using 137Cs (Table 1) and were in agreement with the CRS established age. Sedim. rate (g.cm -2 .y -1 ) Depth in sediment (cm) 0 2 4 6 8 10 0,00 0,05 0,10 0,15 0,20 CRS age (y) 0 2 4 6 8 10 0 10 20 30 40 50 60 70 80 90 Sedim. rate (g.cm -2 .y -1 ) Depth in sediment (cm) 0 2 4 6 8 10 0,00 0,05 0,10 0,15 0,20 Sedim. rate (g.cm -2 .y -1 ) Depth in sediment (cm) 0 2 4 6 8 10 0,00 0,05 0,10 0,15 0,20 CRS age (y) 0 2 4 6 8 10 0 10 20 30 40 50 60 70 80 90 CRS age (y) 0 2 4 6 8 10 0 10 20 30 40 50 60 70 80 90 Figure 5: Age/depth and sedimentation rate/depth relationships determined by CRS model for the sediment core at St-3. Table 1: Validation of 210Pb Ages using 137Cs.(137Cs activities, in Bq.kg-1 dry weight, in the samples of the core collected at St-3.. Sample 10-20-cm was obtained by combining all sub- samples of 2-cm thickness). LD = limit of detection Layer Ye ar 137 Cs Act. (Bq.kg -1 ) LD (Bq.kg -1 ) 0- 2 2004 <LD 1.496 2- 4 1997 <LD 1,521 4- 6 1973 <LD 1,825 6- 8 1955 1,416 ± 0,112 -- 8- 10 1938 <LD 1,240 10- 20-cm <LD 0.702 Core Profiles of Total Hydrocarbon (THC) Sedimentation rates and Total Phosphorus (TP). The sedimentation rates obtained revealed that minimal and maximal environmental perturbation occurred in 1973 and 1997 while the single relatively fast sedimentation rate observed was attributed to adverse weather conditions accompanied with flooding. 0 20 40 60 80 100 120 140 1920 1940 1960 1980 2000 2020 0,04 0,06 0,08 0,10 0,12 0,14 THC (ppm) Sed. Rate (g.cm -2 .y -1 ) Year 0 20 40 60 80 100 120 140 1920 1940 1960 1980 2000 2020 0,04 0,06 0,08 0,10 0,12 0,14 THC (ppm) Sed. Rate (g.cm -2 .y -1 ) Year Figure 6: Core Profiles of total hydrocarbon content (THC) and sedimentation rates in sediment The concentration of THC and TP revealed low concentrations in the late 1930s and high concentrations suggesting massive oil spills and substantial delivery of phosphorus from agricultural runoff from early 1970s to early 2000s. Figure 7: Core Profile of Total Phosphorus in the sediment Conclusion References Acknowledgment The study revealed the pollution records and provided evidence of these conditions in the Niger Delta Basin over the last 80 years. It is therefore surmised that since the advent of industrial activities, the Bonny estuary has been subjected to perturbations and contamination from human activities which has resulted to fluctuations in environment conditions. TH APHA (2001). Standard Methods For The Examination Of Water And Wastewater, American Public Health Association, 20 edition. This work was carried out within the framework of the International Atomic Energy Agency Regional Project RAF/7/009 “Supporting an Integrated Approach for Marine Pollution Monitoring using Nuclear Analytical Techniques”. The authors would like to thank the Moroccan authorities for hosting the fellowship “Marine Environment and Coastal Zone Management” at the Centre National de l'Energie, des Sciences et des Techniques Nucléaires.

Upload: others

Post on 25-May-2020

2 views

Category:

Documents


0 download

TRANSCRIPT

APPLYING SEDIMENT CORES AND NUCLEAR TECHNIQUES FOR POLLUTION ASSESSMENT IN THE BONNY/NEW CALABAR RIVER ESTUARY, NIGER DELTA, NIGERIA

1 1 2OMOROTIONMWAN OMOKHEYEKE , FRANCIS D. SIKOKI , ABDELMOURHIT LAISSAOUI ,

1Centre for Marine Pollution Monitoring and Seafood Safety, University of Port Harcourt, Port Harcourt, Nigeria

2Centre National de L'Energie, des Sciences et des Techniques Nucléaires (CNESTEN), B.P. 1382, R.P. 10001, Rabat, Morocco

AbstractSediment cores were collected from the Bonny Estuary in August 2011 to archive pollution records over the last 80years. Three sampling locations were selected and used for assessing the extent of pollution in the estuary. Alpha and gamma spectrometer in conjunction with the constant rate of supply model (CRS were deployed to establish the age of the sediment and the data were validated using 137Cs profiles and events that occurred within the region. The results of the activities of naturally occurring radionuclides(226Ra, 228Ra and 40k) ranged from 15 ± 2 - 34 ± 3 Bq·kg-1; 32 ± 5 - 48 ± 6 Bq·kg-1and 264 ± 29 - 462 ± 36 Bq·kg-1 respectively . The results obtained for the core profiles of stations 1 and 2 exhibited a relativity constant activity but that of station 3 exhibited significant decrease with depth which was appropriate for radiometric dating. CRS model displayed increase in bulk sediment accumulation over the past 80 years with special reference to 1938, 1955, 1973, 1997 and 2004. Cesium-137profiles were in agreement with the CRS established ages. The sedimentation rates obtained ranged from 0.019 to 0.034g.cm-2.y-1. The data further revealed that minimum and maximum environmental perturbations occurred in the early 1970s and late1990s respectively. Core profiles of total hydrocarbon content ranged from 0.001 to 130.80 ppm and total phosphorus 0.01 to 0.499mg/g. The observed profiles had peaks corresponding chronologically to severe environmental perturbations resulting from massive oil spills and substantial delivery of phosphorus from agricultural runoffs between early 1970s and early 2000s. It is therefore surmised that since the advent of industrial activities the estuary has been subject to perturbations and contamination from human activities which has resulted to fluctuations in environment conditions.

Keywords: Pollution archiving, total hydrocarbon content, 137Cs, radiometric dating, CRS model

INTRODUCTIONNigeria has experienced remarkable increase in industrial activities; particularly in its oil and gas sector. These activities which are centred mainly in the Niger Delta area have generated massive wealth for the nation. The Niger delta is bounded to the south by the Atlantic Ocean and covers about 50% of the total length of the Nigerian Coastline and it is situated in the Gulf of Guinea, located between 5° E to 8° E longitude and 4° N to 6° N latitude.

The coastal areas of Nigeria, particularly the Niger Delta Basin have suffered debilitating environmental degradation and pollution from human activities such as oil industry operations, manufacturing and municipal discharges. These activities became heightened following the discovery of crude oil in the late 1950s but have assumed even greater dimensions since the early 1970s when oil prospecting became the mainstay of the Nigerian economy. This scenario has undermined basic ecosystem services such as water quality and land productivity (NDES, 1999). The consequences of this have been the decline in health conditions, standard of living, socio-economic well-being and loss of income of the indigenous populace. However, the government has demonstrated concern for environmental protection and resource conservation but unfortunately, empirical data providing evidence of pollution stocks over the last 80 years is lacking. Thus, in order to maintain and improve the quality of the unique environmental resource endowment and the physical characteristics of the coastal areas, assessing pollution stocks using sediment cores and nuclear techniques is essential.

Sediment cores were retrieved from shallow marginal areas at three stations (Fig.1) belonging to the upper Bonny Estuary in August 2011 using an Uwitec gravity corer of 10 cm internal diameter. Three cores, 32; 30 and 20cm depth were collected from station 1 (St-1); station 2 (St-2) and station 3 (St-3) respectively. In addition, sediment surface samples (6 cm depth) were also collected, from the three stations during different months (August, October and December 2011, and February and May 2012) covering rainy and dry seasons.

The objectives of this research paper are to evaluate profiles of pollution stocks dating back some 80 years, identify peaks in the disturbances, and Identify possible sources of pollution.

Sample Collection and Preparation

MATERIALS AND METHODS

R I C A

AF

Nigeria

The samplingsite

*St-2

*St-1

*St-3

R I C A

AF

Nigeria

The samplingsite

R I C A

AF

Nigeria

The samplingsite

*St-2

*St-1

*St-1

*St-3 *St-3

Figure 1: The study area showing the sampling locations.

The sediment cores were immediately transported after retrieval to the laboratory for pre-treatment and conditioning prior to radiometric analyses. Each core was sectioned into 2 cm slices and wet sub-samples were weighed and then dried in an oven, using a constant temperature of 80°C during 24 h. Dry samples were weighed again and the content of water in each stratigraphic level was calculated for the three cores. Bulk densities were determined from water content and particle density of each slice. Finally, dried sediment was ground in a mortar to fine powder and homogenised for subsequent alpha and gamma emitters analyses. Organic matter content was calculated as the difference in weight between the dried sediment and the ash obtained following ignition at 550ºC for 24 h.

Radiometric Measurements: 210The activity of Po was determined using alpha-ray spectrometry using silicon surface barrier detectors (EG&G) coupled to a PC running

MaestroTM data acquisition software while gamma emitting radionuclides were measured using gamma-ray spectrometer.

Total Hydrocarbon and Total Phosphorus Analyses:All samples were analyzed as described in Standard Methods for the Examination of Water and Wastewater (APHA, 2001).

Trends of Naturally Occurring Radionuclides

The activities of naturally occurring radionuclides 226Ra , 228Ra, and 40K , were all in the range of the values reported for coastal regions . The spatial and temporal variations displayed fairly uniform distribution with 226Ra while 228Ra displayed some variability with lowest activities during the dry season than wet season

228 228 214 226 212 228 40[ Ac( Ra), Bi( Ra), Pb( Th) and K]

Spatial and Temporal Trends

Station - 1 Station -2 Station - 3

ST

1( fe

b )

ST

1(m

ay )

ST

1(a u

g )

ST

1(o c t)

ST

1(d e

c )

ST

2( fe

b )

ST

2(m

ay )

ST

2(a u

g )

ST

2( o c

t)

ST

2( d e

c )

ST

3( fe b )

ST

3(m

ay )

ST

3(a u

g )

ST

3( o c

t)

ST

3( d e

c )

0,0

0,2

0,4

0,6

0,8

1,0

1,2

20

30

40

50

60

70

80

226 Ra228 Ra226 Ra/ 228 Ra

Activity(B

q/k

g)

226 R

a/228 R

a

Figure 2: Activity concentrations of 226Ra and 228Ra in different months at the three stations. Activities are in Bq.kg-1 dry weight and uncertainties are 1-ó statistical errors. Variation of 226Ra to 228Ra ratio is also plotted

Vertical DistributionsCore profiles of 228Ra 212Pb and 40K displayed fairly homogenous distributions throughout the cores with the only exception for 40K in St-3. A relatively visible increase of this radionuclide concentration in the basal 6-cm of the core was observed. This enhancement of 40K may be attributed to the different origin of particles present in the deepest layers of the core that may contain more fine-grained clay sediment than the rest of the core. In addition, vertical distributions of organic matter content are also depicted in Fig. 3 for each coring site.

Depthi

n sedi

ment(

cm)

228Ra (Bq/kg)

30

25

20

15

10

5

020 40 60 20 30 40 50 60

212Pb (Bq/kg)

300 400 500 600

40K (Bq/kg)

Station-1

30

25

20

15

10

5

020 40 60 80 45 55 65 200 400 600

Station-2

20

15

10

5

040 50 60 70 300 400 500 600

Station-3

40 50 60 70

22 24 26 28

25 26 27 28

24 25 26

O. M. %

Depthi

n sedi

ment(

cm)

228Ra (Bq/kg)

30

25

20

15

10

5

020 40 60 20 30 40 50 60

212Pb (Bq/kg)

300 400 500 600

40K (Bq/kg)

Station-1

228Ra (Bq/kg)

30

25

20

15

10

5

020 40 60

228Ra (Bq/kg)

30

25

20

15

10

5

020 40 60 20 30 40 50 60

212Pb (Bq/kg)

20 30 40 50 60

212Pb (Bq/kg)

300 400 500 600

40K (Bq/kg)

300 400 500 600

40K (Bq/kg)

Station-1

30

25

20

15

10

5

020 40 60 80 45 55 65 200 400 600

Station-2

30

25

20

15

10

5

020 40 60 80

30

25

20

15

10

5

020 40 60 80 45 55 6545 55 65 200 400 600200 400 600

Station-2

20

15

10

5

040 50 60 70 300 400 500 600

Station-3

40 50 60 70

20

15

10

5

040 50 60 70

20

15

10

5

040 50 60 70 300 400 500 600300 400 500 600

Station-3

40 50 60 7040 50 60 70

22 24 26 2822 24 26 28

25 26 27 2825 26 27 28

24 25 2624 25 26

O. M. %

228 212 40Figure 3. Vertical distributions of Ra, Pb and K in the three sediment cores collected from the Bonny Estuary. Activities are in Bq·kg-1 dry weight and errors are 1-ó statistical uncertainties

Radiometric DatingRadiometric dating was achieved for station 3 with the unsupported 210 Pb exhibiting significant decrease with depth while stations 1 and 2 did not exhibit significant decrease in 210Pb with depth, but rather relatively constant activities with discrete maxima and minima. Therefore, these cores (St-1 and St-2) were qualified as incomplete and disturbed, and were excluded from calculations of sedimentation rates, ages and total inventories of 210Pbxs.

30

25

20

15

10

5

00 10 20 30 40 50 80 120 160 200 240

210Pbtot (Bq/kg)226Ra (Bq/kg)

Depth

in se

dimen

t(cm)

30

25

20

15

10

5

00 50 100 150 200

210Pbxs (Bq/kg)

30

25

20

15

10

5

040 60 80 100 120

212Pbxs (Bq/kg)

30

25

20

15

10

5

0

0 20 40 60 80 100 120 140

Depth

in se

dimen

t(cm)

210Pbtot (Bq/kg)226Ra (Bq/kg)

20

15

10

5

020 40 60 80 100

226Ra (Bq/kg)210Pb (Bq/kg)

Depth

in se

dimen

t(cm)

20

15

10

5

00 20 40 60 80 100

210Pbxs (Bq/kg)

Station-3

Station-2

Station-130

25

20

15

10

5

00 10 20 30 40 50 80 120 160 200 240

210Pbtot (Bq/kg)226Ra (Bq/kg)

Depth

in se

dimen

t(cm)

30

25

20

15

10

5

00 50 100 150 200

210Pbxs (Bq/kg)

30

25

20

15

10

5

00 10 20 30 40 50 80 120 160 200 240

210Pbtot (Bq/kg)226Ra (Bq/kg)

Depth

in se

dimen

t(cm)

30

25

20

15

10

5

00 10 20 30 40 50 80 120 160 200 240

210Pbtot (Bq/kg)226Ra (Bq/kg)

Depth

in se

dimen

t(cm)

30

25

20

15

10

5

00 50 100 150 200

210Pbxs (Bq/kg)

30

25

20

15

10

5

00 50 100 150 200

210Pbxs (Bq/kg)

30

25

20

15

10

5

040 60 80 100 120

212Pbxs (Bq/kg)

30

25

20

15

10

5

0

0 20 40 60 80 100 120 140

Depth

in se

dimen

t(cm)

210Pbtot (Bq/kg)226Ra (Bq/kg)

30

25

20

15

10

5

040 60 80 100 120

212Pbxs (Bq/kg)

30

25

20

15

10

5

040 60 80 100 120

212Pbxs (Bq/kg)

30

25

20

15

10

5

0

0 20 40 60 80 100 120 140

Depth

in se

dimen

t(cm)

210Pbtot (Bq/kg)226Ra (Bq/kg)

30

25

20

15

10

5

0

0 20 40 60 80 100 120 140

Depth

in se

dimen

t(cm)

210Pbtot (Bq/kg)226Ra (Bq/kg)

210Pbtot (Bq/kg)226Ra (Bq/kg)

20

15

10

5

020 40 60 80 100

226Ra (Bq/kg)210Pb (Bq/kg)

Depth

in se

dimen

t(cm)

20

15

10

5

00 20 40 60 80 100

210Pbxs (Bq/kg)

20

15

10

5

020 40 60 80 100

226Ra (Bq/kg)210Pb (Bq/kg)

Depth

in se

dimen

t(cm)

20

15

10

5

020 40 60 80 100

226Ra (Bq/kg)210Pb (Bq/kg)

Depth

in se

dimen

t(cm)

20

15

10

5

00 20 40 60 80 100

210Pbxs (Bq/kg)

20

15

10

5

00 20 40 60 80 100

210Pbxs (Bq/kg)

Station-3

Station-2

Station-1

226 210 210Figure 4: Ra, total Pb and Pb activity profiles in the sediment cores collected from the Bonny Estuary. Activities, with 1-ó statistical errors, are all in Bq·kg-1 dry xs

weight and line are only for guidance

The constant rate of supply (CRS) model displayed increase in bulk sediment accumulation over the past 80 years with special reference to 1938, 1955, 19731997 and 2004. The data were validated using 137Cs (Table 1) and were in agreement with the CRS established age.

Sed

im. r

ate

(g.c

m-2

.y-1

)

Depth in sediment (cm)

0 2 4 6 8 100,00

0,05

0,10

0,15

0,20

CR

S a

ge (y

)

0 2 4 6 8 100

10

20

30

40

50

60

70

80

90

Sed

im. r

ate

(g.c

m-2

.y-1

)

Depth in sediment (cm)

0 2 4 6 8 100,00

0,05

0,10

0,15

0,20

Sed

im. r

ate

(g.c

m-2

.y-1

)

Depth in sediment (cm)

0 2 4 6 8 100,00

0,05

0,10

0,15

0,20

CR

S a

ge (y

)

0 2 4 6 8 100

10

20

30

40

50

60

70

80

90

CR

S a

ge (y

)

0 2 4 6 8 100

10

20

30

40

50

60

70

80

90

Figure 5: Age/depth and sedimentation rate/depth relationships determined by CRS model for the sediment core at St-3.

Table 1: Validation of 210Pb Ages using 137Cs.(137Cs activities, in Bq.kg-1 dry weight, in the samples of the core collected at St-3.. Sample 10-20-cm was obtained by combining all sub-samples of 2-cm thickness).

LD = limit of detection

Layer Ye ar 137Cs Act. (Bq.kg-1) LD (Bq.kg-1)

0- 2 2004

<LD

1.496

2- 4 1997

<LD

1,521

4- 6 1973

<LD

1,825

6- 8 1955

1,416 ± 0,112

--

8- 10 1938 <LD 1,240

10- 20-cm <LD 0.702

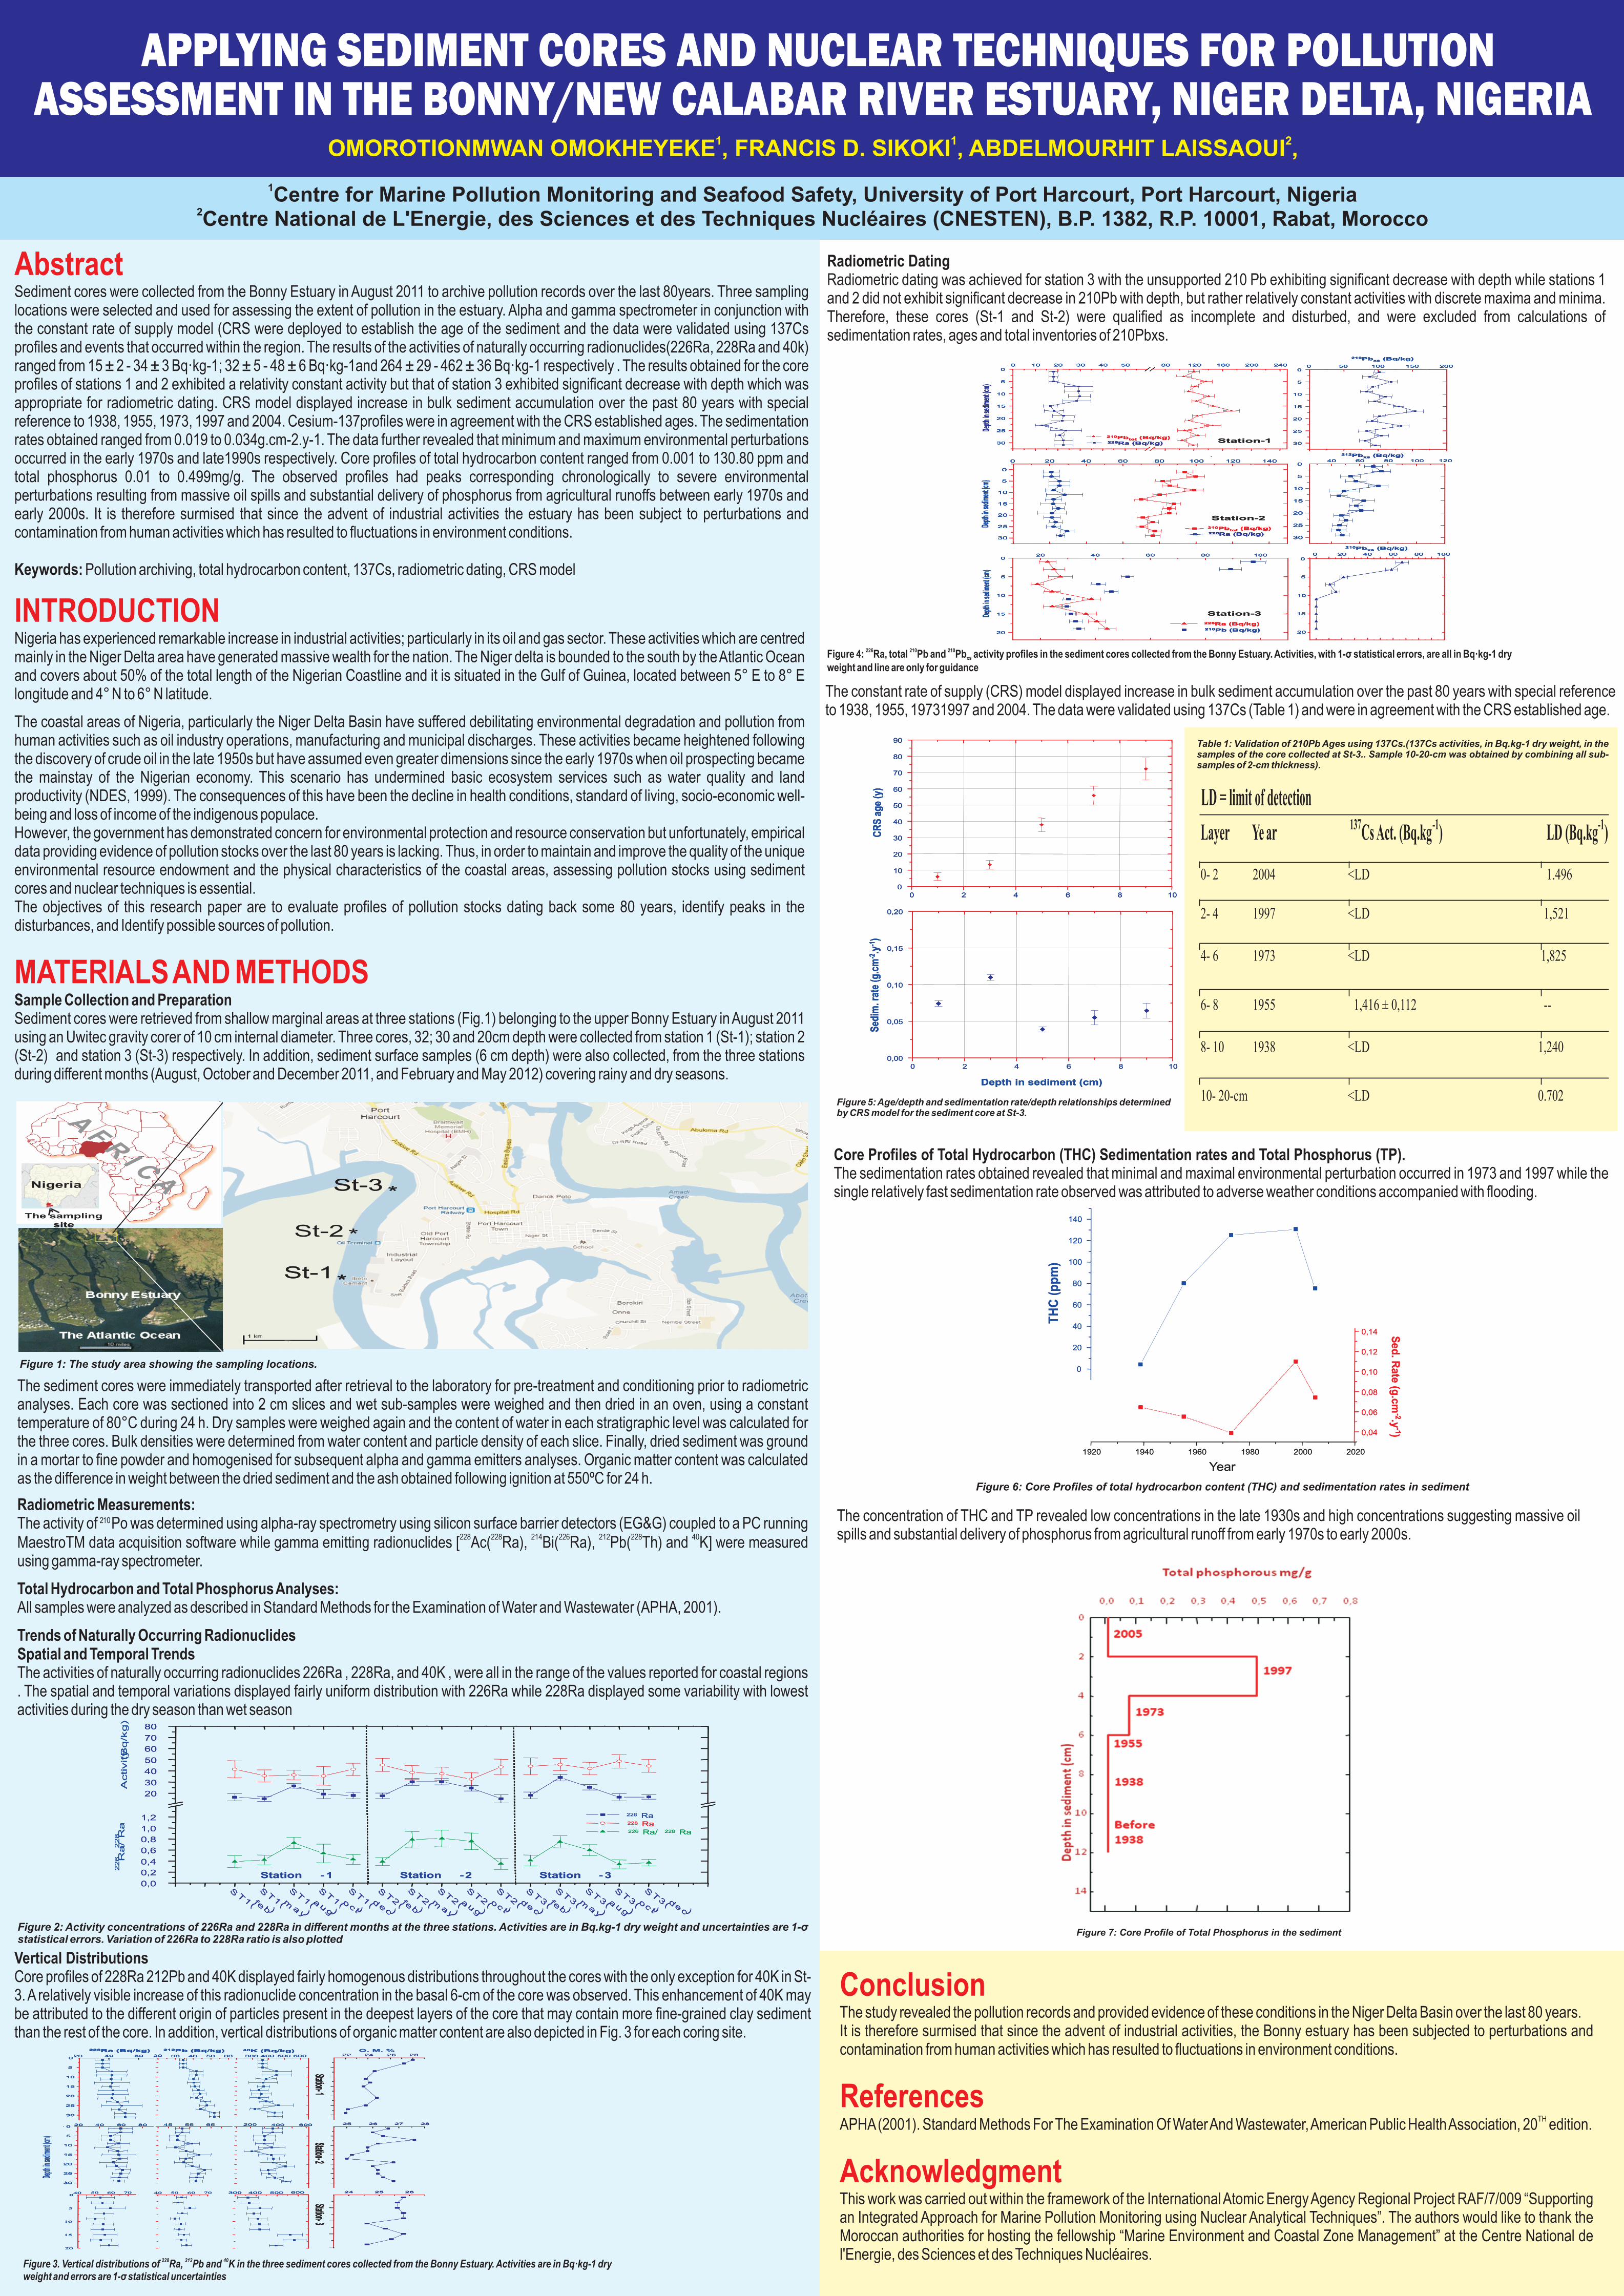
Core Profiles of Total Hydrocarbon (THC) Sedimentation rates and Total Phosphorus (TP).The sedimentation rates obtained revealed that minimal and maximal environmental perturbation occurred in 1973 and 1997 while the single relatively fast sedimentation rate observed was attributed to adverse weather conditions accompanied with flooding.

0

20

40

60

80

100

120

140

1920 1940 1960 1980 2000 2020

0,04

0,06

0,08

0,10

0,12

0,14

TH

C (

pp

m)

Se

d. R

ate

(g.c

m-2.y

-1)

Year

0

20

40

60

80

100

120

140

1920 1940 1960 1980 2000 2020

0,04

0,06

0,08

0,10

0,12

0,14

TH

C (

pp

m)

Se

d. R

ate

(g.c

m-2.y

-1)

Year

Figure 6: Core Profiles of total hydrocarbon content (THC) and sedimentation rates in sediment

The concentration of THC and TP revealed low concentrations in the late 1930s and high concentrations suggesting massive oil spills and substantial delivery of phosphorus from agricultural runoff from early 1970s to early 2000s.

Figure 7: Core Profile of Total Phosphorus in the sediment

Conclusion

References

Acknowledgment

The study revealed the pollution records and provided evidence of these conditions in the Niger Delta Basin over the last 80 years. It is therefore surmised that since the advent of industrial activities, the Bonny estuary has been subjected to perturbations and contamination from human activities which has resulted to fluctuations in environment conditions.

THAPHA (2001). Standard Methods For The Examination Of Water And Wastewater, American Public Health Association, 20 edition.

This work was carried out within the framework of the International Atomic Energy Agency Regional Project RAF/7/009 “Supporting an Integrated Approach for Marine Pollution Monitoring using Nuclear Analytical Techniques”. The authors would like to thank the Moroccan authorities for hosting the fellowship “Marine Environment and Coastal Zone Management” at the Centre National de l'Energie, des Sciences et des Techniques Nucléaires.