apportionment schemes
DESCRIPTION
Apportionment Schemes. Dan Villarreal MATH 490-02 Tuesday, Sept. 15, 2009. But first…a quick PSA. What is Apportionment?. - PowerPoint PPT PresentationTRANSCRIPT

Apportionment Schemes
Dan VillarrealMATH 490-02Tuesday, Sept. 15, 2009

Sept. 15, 2009 Apportionment Schemes
But first…a quick PSA

Sept. 15, 2009 Apportionment Schemes
What is Apportionment?
The apportionment problem is to round a set of fractions so that their sum is maintained at original value. The rounding procedure must not be an arbitrary one, but one that can be applied constantly. Any such rounding procedure is called an apportionment method.

Sept. 15, 2009 Apportionment Schemes
Example
In the 1974-75 NHL season, the Stanley Cup Champion Philadelphia Flyers won 51 games, lost 18 games, and tied 11 games.
Won: 51 63.75% 64%Lost: 18 22.5% 23%Tied: 11 13.75% 14%
But this adds up to 101%, an impossibility!

Sept. 15, 2009 Apportionment Schemes
Dramatis Personae
George Washington Alexander Hamilton Thomas Jefferson Daniel Webster
Delaware Virginia

Sept. 15, 2009 Apportionment Schemes
The Constitution
Amendment 14, Section 2:
Article I, Section 2:“The actual Enumeration shall be made within three Years after the first Meeting of the Congress of the United States, and within every subsequent Term of ten Years, in such Manner as they shall by Law direct. The Number of Representatives shall not exceed one for every thirty Thousand, but each State shall have at Least one Representative”
“Representatives shall be apportioned among the several States according to their respective numbers, counting the whole number of persons in each State”

Sept. 15, 2009 Apportionment Schemes
The First Apportionment
For the third session of Congress (1793-1795) House of Representatives set at 105 15 states U.S. Population: 3,615,920
3,615,920
105= 34,437 people/district

Sept. 15, 2009 Apportionment Schemes
Standard Divisors
34,437 is our standard divisor for 1790. More generally,
SDt =
Where HSt is the size of the House of Representatives (or whatever overall body) for year t.
Poptotal
HSt

Sept. 15, 2009 Apportionment Schemes
Quotas
The number of Congressional districts a state should get is its quota:
Qi =
Take Delaware, for example…
Popi
SDt

Sept. 15, 2009 Apportionment Schemes
If only it were that easy…
THERE’S NO SUCH THING AS .613
CONGRESSPERSONS.Hence the need for apportionment schemes, a way to map the quotas in R onto apportionments in Z.

Sept. 15, 2009 Apportionment Schemes
If only it were that easy…State Population Quota
Virginia 630,560 18.310
Massachusetts 475,327 13.803
Pennsylvania 432,879 12.570
North Carolina 353,523 10.266
New York 331,589 9.629
Maryland 278,514 8.088
Connecticut 236,841 6.878
South Carolina 206,236 5.989
New Jersey 179,570 5.214
New Hampshire 141,822 4.118
Vermont 85,533 2.484
Georgia 70,835 2.057
Kentucky 68,705 1.995
Rhode Island 68,446 1.988
Delaware 55,540 1.613
Totals 3,615,920 105

Sept. 15, 2009 Apportionment Schemes
More on quotas
The lower quota is the quota rounded down (or the integer part of the quota):
LQi = ⌊Qi⌋
The upper quota is the quota rounded up:
UQi = ⌈Qi⌉ = ⌊Qi + 1⌋

Sept. 15, 2009 Apportionment Schemes
If only it were that easy…State Population Quota LQ UQ
Virginia 630,560 18.310 18 19
Massachusetts 475,327 13.803 13 14
Pennsylvania 432,879 12.570 12 13
North Carolina 353,523 10.266 10 11
New York 331,589 9.629 9 10
Maryland 278,514 8.088 8 9
Connecticut 236,841 6.878 6 7
South Carolina 206,236 5.989 5 6
New Jersey 179,570 5.214 5 6
New Hampshire 141,822 4.118 4 5
Vermont 85,533 2.484 2 3
Georgia 70,835 2.057 2 3
Kentucky 68,705 1.995 1 2
Rhode Island 68,446 1.988 1 2
Delaware 55,540 1.613 1 2
Totals 3,615,920 105 97 112

Sept. 15, 2009 Apportionment Schemes
Alexander Hamilton
1755-1804 One author of Federalist Papers First Secretary of the Treasury
Most importantly for our purposes, devised the Hamilton Method for apportioning Congressional districts to states

Sept. 15, 2009 Apportionment Schemes
The Hamilton Method
State i receives either its lower quota or upper quota in districts; those states that receive their upper quota are those with the greatest fractional parts

Sept. 15, 2009 Apportionment Schemes
Back to 1790State Population Quota Frac. Part
Virginia 630,560 18.310 .310
Massachusetts 475,327 13.803 .803
Pennsylvania 432,879 12.570 .570
North Carolina 353,523 10.266 .266
New York 331,589 9.629 .629
Maryland 278,514 8.088 .088
Connecticut 236,841 6.878 .878
South Carolina 206,236 5.989 .989
New Jersey 179,570 5.214 .214
New Hampshire 141,822 4.118 .118
Vermont 85,533 2.484 .484
Georgia 70,835 2.057 .057
Kentucky 68,705 1.995 .995
Rhode Island 68,446 1.988 .988
Delaware 55,540 1.613 .613
State Frac. Part
Kentucky .995
South Carolina .989
Rhode Island .988
Connecticut .878
Massachusetts .803
New York .629
Delaware .613
Pennsylvania .570
Vermont .484
Virginia .310
North Carolina .266
New Jersey .214
New Hampshire .118
Maryland .088
Georgia .057

Sept. 15, 2009 Apportionment Schemes
If only it were that easy…State Population Quota LQ UQ Apportionment
Virginia 630,560 18.310 18 19 18
Massachusetts 475,327 13.803 13 14 14
Pennsylvania 432,879 12.570 12 13 13
North Carolina 353,523 10.266 10 11 10
New York 331,589 9.629 9 10 10
Maryland 278,514 8.088 8 9 8
Connecticut 236,841 6.878 6 7 7
South Carolina 206,236 5.989 5 6 6
New Jersey 179,570 5.214 5 6 5
New Hampshire 141,822 4.118 4 5 4
Vermont 85,533 2.484 2 3 2
Georgia 70,835 2.057 2 3 2
Kentucky 68,705 1.995 1 2 2
Rhode Island 68,446 1.988 1 2 2
Delaware 55,540 1.613 1 2 2
Totals 3,615,920 105 97 112 105

Sept. 15, 2009 Apportionment Schemes

Sept. 15, 2009 Apportionment Schemes
Back to Square One
President Washington vetoed the Apportionment Bill because he believed, following the counsel of Edmund Randolph and Thomas Jefferson, that it was unconstitutional:
ADE 2 1
PopDE 55,540 30,000= <

Sept. 15, 2009 Apportionment Schemes
The Alabama Paradox
The Hamilton Method was Congress’s preferred method of apportionment from 1850 to 1900.
In 1881, the Alabama Paradox was first discovered.
The Census Bureau, as a matter of course, calculated apportionments for a range of House sizes; in this case, 275-350
Something interesting and very weird happened between the tables for HS = 299 and 300…

Sept. 15, 2009 Apportionment Schemes
The Alabama Paradox
US population in 1880 was 49,369,595

Sept. 15, 2009 Apportionment Schemes
The Alabama Paradox
US population in 1880 was 49,369,595 For HS = 299, SD = 165,116

Sept. 15, 2009 Apportionment Schemes
The Alabama Paradox
US population in 1880 was 49,369,595 For HS = 299, SD = 165,116 For HS = 300, SD = 164,565

Sept. 15, 2009 Apportionment Schemes
The Alabama Paradox
US population in 1880 was 49,369,595 For HS = 299, SD = 165,116 For HS = 300, SD = 164,565
Population
Alabama 1,262,794
Illinois 3,078,769
Texas 1,592,574

Sept. 15, 2009 Apportionment Schemes
The Alabama Paradox
US population in 1880 was 49,369,595 For HS = 299, SD = 165,116 For HS = 300, SD = 164,565
HS = 299Population LQ Frac. A
Alabama 1,262,794 7 .647
Illinois 3,078,769 18 .646
Texas 1,592,574 9 .645

Sept. 15, 2009 Apportionment Schemes
The Alabama Paradox
US population in 1880 was 49,369,595 For HS = 299, SD = 165,116 For HS = 300, SD = 164,565
HS = 299Population LQ Frac. A
Alabama 1,262,794 7 .647 8
Illinois 3,078,769 18 .646 18
Texas 1,592,574 9 .645 9

Sept. 15, 2009 Apportionment Schemes
The Alabama Paradox
US population in 1880 was 49,369,595 For HS = 299, SD = 165,116 For HS = 300, SD = 164,565
HS = 299 HS = 300Population LQ Frac. A LQ Frac. A
Alabama 1,262,794 7 .647 8 7 .674
Illinois 3,078,769 18 .646 18 18 .708
Texas 1,592,574 9 .645 9 9 .677

Sept. 15, 2009 Apportionment Schemes
The Alabama Paradox
US population in 1880 was 49,369,595 For HS = 299, SD = 165,116 For HS = 300, SD = 164,565
HS = 299 HS = 300Population LQ Frac. A LQ Frac. A
Alabama 1,262,794 7 .647 8 7 .674 7
Illinois 3,078,769 18 .646 18 18 .708 19
Texas 1,592,574 9 .645 9 9 .677 10

Sept. 15, 2009 Apportionment Schemes
Back to 1793…
This particular issue with the Hamilton Method was not discovered until 1881, but the Constitutional constraints meant that it could not be used in 1793.
A new method was proposed by Thomas Jefferson: the Jefferson Method.

Sept. 15, 2009 Apportionment Schemes
Thomas Jefferson
Biographical Information:
You know this all already…
Had the good fortune never to take a class in Morton Hall

Sept. 15, 2009 Apportionment Schemes
The Jefferson Method Rather than use the standard divisor SD, the
Jefferson Method uses the population of the smallest district, d.
Each state receives an adjusted quota; this will need to be rounded down the actual apportionment:
Ai = ⌊ ⌋Popi
d

Sept. 15, 2009 Apportionment Schemes
The Jefferson Method In 1793, Jefferson used d = 33,000, so
AVA = 630,560 / 33,000 = 19.108 = 19⌊ ⌋ ⌊ ⌋
ADE = 55,540 / 33,000 = 1.683 = 1⌊ ⌋ ⌊ ⌋
But how do we determine d in the first place?

Sept. 15, 2009 Apportionment Schemes
Finding the Critical Divisor
Start with the lower quota of each state; this is its tentative apportionment, ni.Next, find the critical divisor for each state:
Popi
ni + 1
For example, dVA = 630,560 / (18 + 1) = 33,187
dDE = 55,540 / (1 + 1) = 27,770
di =

Sept. 15, 2009 Apportionment Schemes
The Critical Divisor
The critical divisor for each state is the divisor for which the state will be entitled to ni + 1 seats.
For example, if d > 27,770, Delaware gets only 1 seat, but for d ≤ 27,770, Delaware gets 2.
But then Virginia gets 630,560 / 27,770 = ⌊ ⌋22.707 = 22 seats. This will surely result in an ⌊ ⌋
overfull House Thus, d will need to be greater than 27,770

Sept. 15, 2009 Apportionment Schemes
The Jefferson Method
Step 1: Assume a tentative apportionment of the lower quota for each state: ni = LQi
Step 2: Determine the critical divisor di for each state and rank by di
Step 3: If any seats remain to be filled, grant one to the state with the highest di; recompute di for this state since its ni has now increased by 1.
Step 4: Iterate Step 3 until the House is filled.

Sept. 15, 2009 Apportionment Schemes
The Jefferson Method
This method actually was used for the 1793 apportionment, and it resulted in Virginia receiving 19 seats to Delaware’s one.
Used until about 1840 Not subject to the Alabama paradox But fails to satisfy the quota condition…
Sept. 15, 2009 Apportionment Schemes
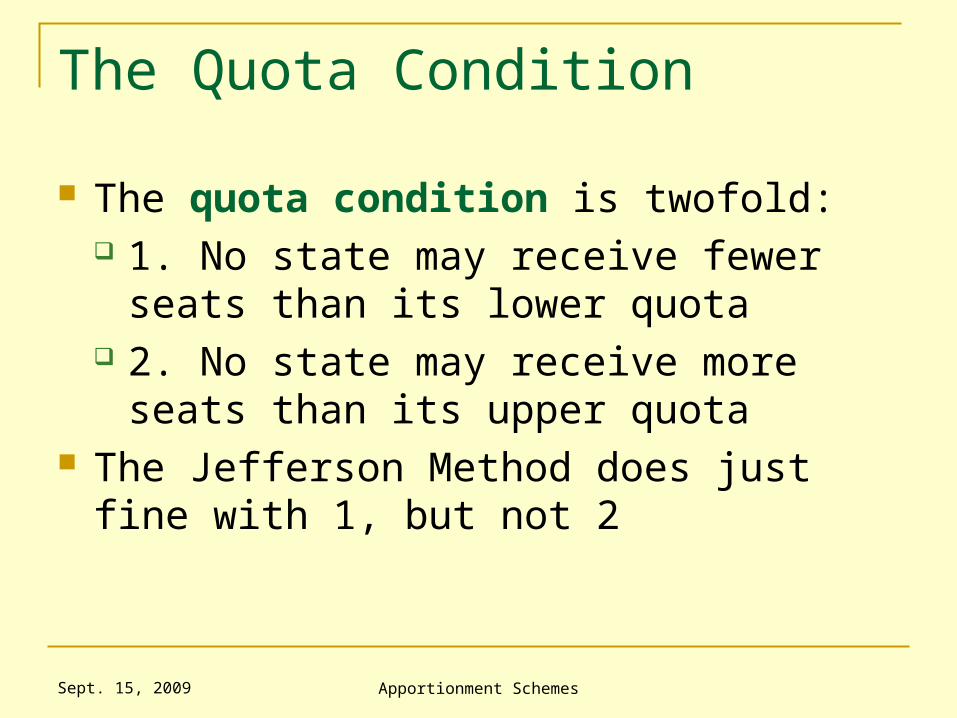
The Quota Condition
The quota condition is twofold: 1. No state may receive fewer seats than its
lower quota 2. No state may receive more seats than its
upper quota The Jefferson Method does just fine with 1, but
not 2

Sept. 15, 2009 Apportionment Schemes
Example U.S. population in 1820 was 8,969,878, with a
House size of 213, so SD = 8,969,878 / 213 = 42,112
New York had a population of 1,368,775:
QNY = 1,368,775 / 42,112 = 32.503 So if the quota condition was satisfied, New
York’s delegation should be either 32 or 33 Using the Jefferson Method and d = 39,900, we
actually get 34 seats for New York
Sept. 15, 2009 Apportionment Schemes
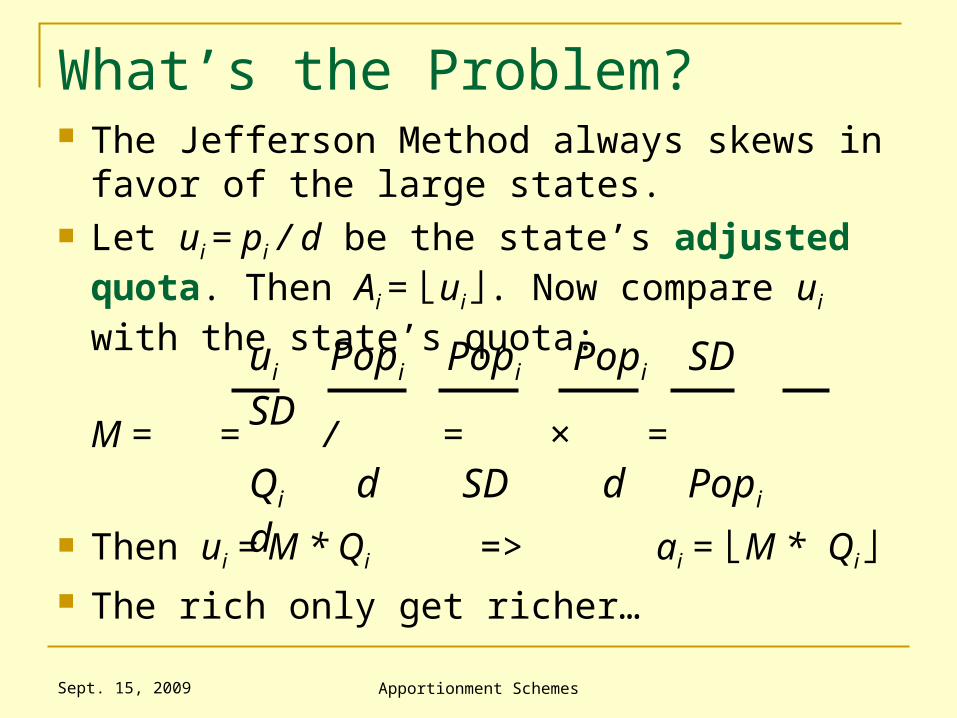
What’s the Problem? The Jefferson Method always skews in favor of
the large states. Let ui = pi / d be the state’s adjusted quota. Then
Ai = ⌊ui . Now compare ⌋ ui with the state’s quota:
M = = / = × =
Then ui = M * Qi => ai = ⌊M * Qi⌋ The rich only get richer…
ui Popi Popi Popi SD SD
Qi d SD d Popi d

Sept. 15, 2009 Apportionment Schemes
The Webster Method
Daniel Webster devised an apportionment method that was similar in nature to Jefferson’s, but that did not unconditionally favor large states.
Used for 1840-1850 reapportionments, then 1900-1930

Sept. 15, 2009 Apportionment Schemes
The Webster Method Step 1: Determine SD, and find the quota Qi for
each state i. Step 2: Round each quota up or down and let this
be the tentative apportionment ni for each state. Step 3: Determine the total apportionment at this
point. 3 cases: 1. The total apportionment equals HS 2. The total apportionment is greater than HS 3. The total apportionment is less than HS

Sept. 15, 2009 Apportionment Schemes
Adjusting the Apportionment
If we have an overfill, at least one or more seats needs to be pared off. Let the critical divisor be di
- = pi / (ni - 1/2). The state with the smallest di-
will be the next to lose a seat. Conversely, if we have an underfill, we need to
add more seats. Let the critical divisor be di
+ = pi / (ni + 1/2). The state with the smallest di+
will be the next to gain a seat. Iterate either process until done.

Sept. 15, 2009 Apportionment Schemes
Large State Bias
How does the Webster Method avoid susceptibility to the large-state bias exhibited by the Jefferson Method?
We get a similar expression for M: M = SD/d

Sept. 15, 2009 Apportionment Schemes
Large State Bias
M > 1 when there is an underfill, thus in this circumstance, the larger states are more likely to receive another seat
But when there is an overfill and we must subtract, M < 1, and the larger states are more likely to get a seat subtracted
Equally likely to get an overfill or underfill Thus, equally likely that the Webster Method will
favor neither large nor small
Sept. 15, 2009 Apportionment Schemes
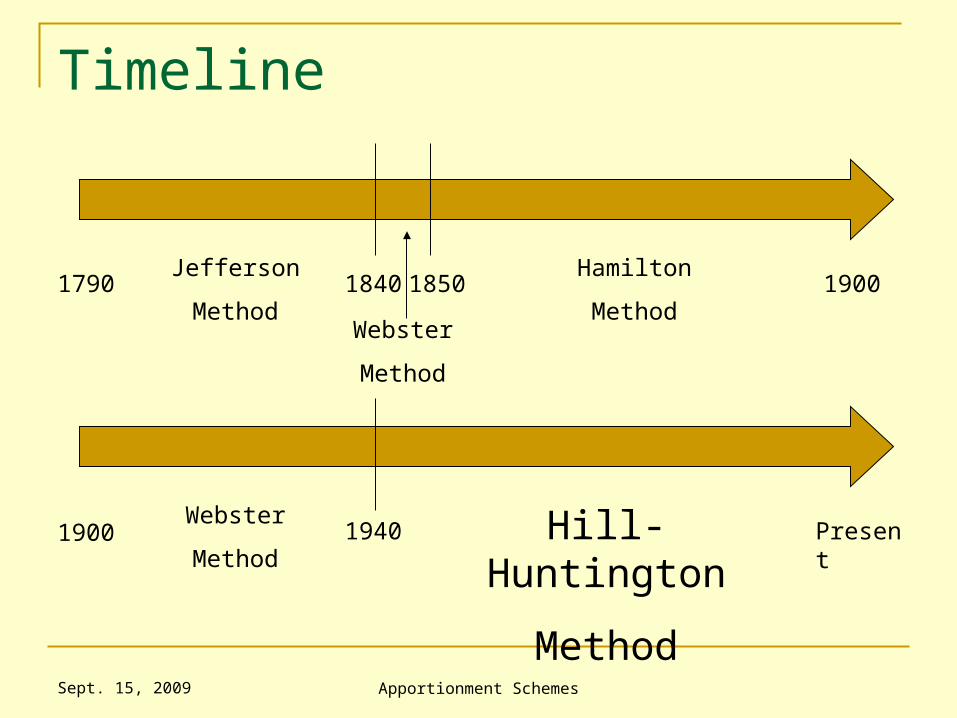
Timeline
1790 1840 1850 1900
1900 1940 Present
Jefferson
MethodWebster
Method
Hamilton
Method
Webster
MethodHill-Huntington
Method

Sept. 15, 2009 Apportionment Schemes
Hill-Huntington Method Step 1: Start with assumption that each state gets
1 seat (i.e., set ni = 1 for all i) Step 2: Calculate the priority value for each state
Popi
(ni(ni + 1))1/2
Step 3: The state with the greatest PVi is granted the next seat, increasing its tentative apportionment ni by 1; recalculate this state’s PVi
Step 4: Iterate Step 3 until the House is filled.
PVi,n =

Sept. 15, 2009 Apportionment Schemes
Hill-Huntington in 2000
US population in 2000: 281,421,906 435 seats in the House California population: 33,871,648 Texas population: 20,851,820 PVCA,1 = 33,871,648 / (2)1/2 = 23,992,697 PVTX,1 = 20,851,820 / (2)1/2 = 14,781,356 PVCA,2 = 33,871,648 / (6)1/2 = 13,852,190 http://www.census.gov/population/censusdata/
apportionment/00pvalues.txt

Sept. 15, 2009 Apportionment Schemes
The Population Paradox
The Hill-Huntington Method is immune to the Alabama paradox, but may violate the quota condition.
In the 1970s, two mathematicians attempted to devise a method that was immune to both violations, and they did…but another paradox popped up: the population paradox.
This paradox occurs when the population of one state increases at a greater rate than others, but fails to gain a seat.

Sept. 15, 2009 Apportionment Schemes
The Population Paradox
Exercise 10, COMAP page 535:
State Old Census
Q A
A 5,525,381
B 3,470,152
C 3,864,226
D 201,203
Tot 13,060,962

Sept. 15, 2009 Apportionment Schemes
The Population Paradox
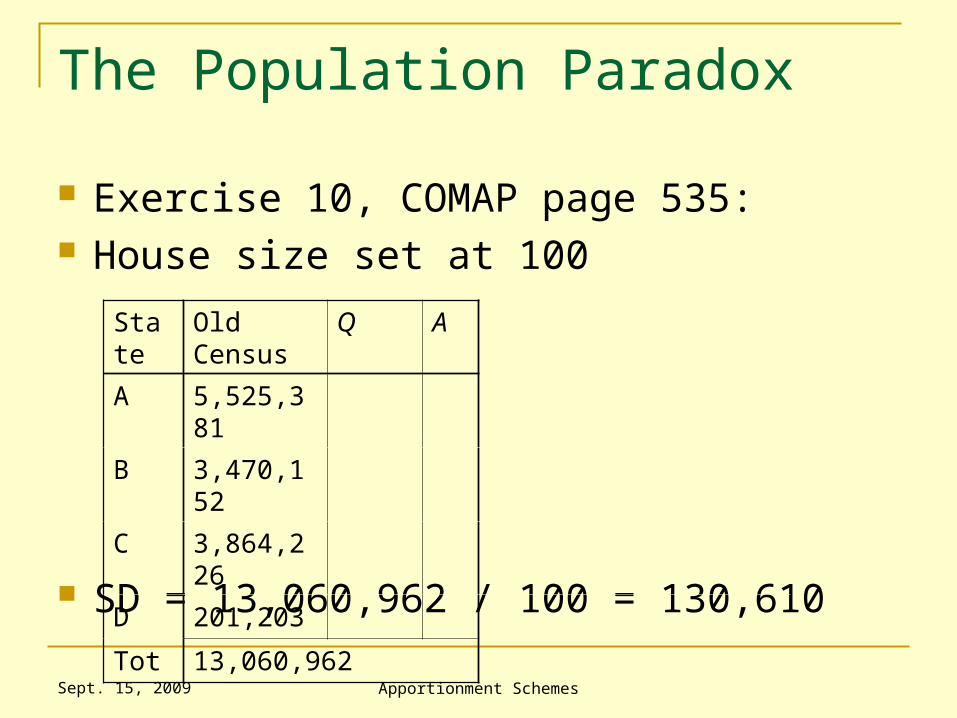
Exercise 10, COMAP page 535: House size set at 100
State Old Census
Q A
A 5,525,381
B 3,470,152
C 3,864,226
D 201,203
Tot 13,060,962
Sept. 15, 2009 Apportionment Schemes
The Population Paradox
Exercise 10, COMAP page 535: House size set at 100
SD = 13,060,962 / 100 = 130,610
State Old Census
Q A
A 5,525,381
B 3,470,152
C 3,864,226
D 201,203
Tot 13,060,962

Sept. 15, 2009 Apportionment Schemes
The Population Paradox
Exercise 10, COMAP page 535: House size set at 100
SD = 13,060,962 / 100 = 130,610
State Old Census
Q A
A 5,525,381 42.304
B 3,470,152 26.569
C 3,864,226 29.586
D 201,203 1.540
Tot 13,060,962

Sept. 15, 2009 Apportionment Schemes
The Population Paradox
Exercise 10, COMAP page 535: House size set at 100
SD = 13,060,962 / 100 = 130,610
State Old Census
Q A
A 5,525,381 42.304
B 3,470,152 26.569
C 3,864,226 29.586
D 201,203 1.540
Tot 13,060,962

Sept. 15, 2009 Apportionment Schemes
The Population Paradox
Exercise 10, COMAP page 535: House size set at 100
SD = 13,060,962 / 100 = 130,610
State Old Census
Q A
A 5,525,381 42.304 42
B 3,470,152 26.569 27
C 3,864,226 29.586 30
D 201,203 1.540 1
Tot 13,060,962

Sept. 15, 2009 Apportionment Schemes
The Population Paradox
Exercise 10, COMAP page 535: House size set at 100
State Old Census
Q A New Census Q A
A 5,525,381 42.304 42 5,657,564
B 3,470,152 26.569 27 3,507,464
C 3,864,226 29.586 30 3,885,693
D 201,203 1.540 1 201,049
Tot 13,060,962 13,251,770

Sept. 15, 2009 Apportionment Schemes
The Population Paradox
Exercise 10, COMAP page 535: House size set at 100
SD = 13,251,770 / 100 = 132,518
State Old Census
Q A New Census Q A
A 5,525,381 42.304 42 5,657,564 42.693
B 3,470,152 26.569 27 3,507,464 26.468
C 3,864,226 29.586 30 3,885,693 29.322
D 201,203 1.540 1 201,049 1.517
Tot 13,060,962 13,251,770

Sept. 15, 2009 Apportionment Schemes
The Population Paradox
Exercise 10, COMAP page 535: House size set at 100
SD = 13,251,770 / 100 = 132,518
State Old Census
Q A New Census Q A
A 5,525,381 42.304 42 5,657,564 42.693 43
B 3,470,152 26.569 27 3,507,464 26.468 26
C 3,864,226 29.586 30 3,885,693 29.322 30
D 201,203 1.540 1 201,049 1.517 2
Tot 13,060,962 13,251,770

Sept. 15, 2009 Apportionment Schemes
The Population Paradox
Exercise 10, COMAP page 535: House size set at 100
State D lost population, yet gained a seat!
State Old Census
Q A New Census Q A
A 5,525,381 42.304 42 5,657,564 42.693 43
B 3,470,152 26.569 27 3,507,464 26.468 26
C 3,864,226 29.586 30 3,885,693 29.322 30
D 201,203 1.540 1 201,049 1.517 2
Tot 13,060,962 13,251,770

Sept. 15, 2009 Apportionment Schemes
SO MANY PARADOXES!!!
The apportionment methods that Congress has used have either violated the quota condition (Jefferson, Webster, Hill-Huntington) or the Alabama and population paradoxes (Hamilton)
The quota method (never used by Congress) violates the population paradox
Is this just another instance of that old joke?

Sept. 15, 2009 Apportionment Schemes
SO MANY PARADOXES!!! It turns out that this is endemic to the situation Theorem “No apportionment method that satisfies
the quota condition is free of paradoxes” (COMAP, p. 519)
Proof The only methods that are free of paradoxes are the divisor methods (Jefferson, Webster, Hill-Huntington). But the divisor methods are all subject to violating the quota condition.
Thus, we are basically screwed.

Sept. 15, 2009 Apportionment Schemes
Hill-Huntington…in 1790!State Population Quota J
Virginia 630,560 18.310 19
Massachusetts 475,327 13.803 14
Pennsylvania 432,879 12.570 13
North Carolina 353,523 10.266 10
New York 331,589 9.629 10
Maryland 278,514 8.088 8
Connecticut 236,841 6.878 7
South Carolina 206,236 5.989 6
New Jersey 179,570 5.214 5
New Hampshire 141,822 4.118 4
Vermont 85,533 2.484 2
Georgia 70,835 2.057 2
Kentucky 68,705 1.995 2
Rhode Island 68,446 1.988 2
Delaware 55,540 1.613 1
Totals 3,615,920 105 105

Sept. 15, 2009 Apportionment Schemes
Hill-Huntington…in 1790!State Population Quota J H
Virginia 630,560 18.310 19 18
Massachusetts 475,327 13.803 14 14
Pennsylvania 432,879 12.570 13 13
North Carolina 353,523 10.266 10 10
New York 331,589 9.629 10 10
Maryland 278,514 8.088 8 8
Connecticut 236,841 6.878 7 7
South Carolina 206,236 5.989 6 6
New Jersey 179,570 5.214 5 5
New Hampshire 141,822 4.118 4 4
Vermont 85,533 2.484 2 2
Georgia 70,835 2.057 2 2
Kentucky 68,705 1.995 2 2
Rhode Island 68,446 1.988 2 2
Delaware 55,540 1.613 1 2
Totals 3,615,920 105 105 105

Sept. 15, 2009 Apportionment Schemes
Hill-Huntington…in 1790!State Population Quota J H H-H
Virginia 630,560 18.310 19 18 18
Massachusetts 475,327 13.803 14 14 14
Pennsylvania 432,879 12.570 13 13 12
North Carolina 353,523 10.266 10 10 10
New York 331,589 9.629 10 10 10
Maryland 278,514 8.088 8 8 8
Connecticut 236,841 6.878 7 7 7
South Carolina 206,236 5.989 6 6 6
New Jersey 179,570 5.214 5 5 5
New Hampshire 141,822 4.118 4 4 4
Vermont 85,533 2.484 2 2 3
Georgia 70,835 2.057 2 2 2
Kentucky 68,705 1.995 2 2 2
Rhode Island 68,446 1.988 2 2 2
Delaware 55,540 1.613 1 2 2
Totals 3,615,920 105 105 105 105

Sept. 15, 2009 Apportionment Schemes
The point of the story being… Delaware should’ve gotten 2 seats.

Sept. 15, 2009 Apportionment Schemes
Selected Sources COMAP, For All Practical Purposes, 7th ed.
(2006), Chapter 14 Wikipedia (multiple pages) http://www.usconstitution.net/const.html http://www2.census.gov/prod2/statcomp/
documents/1880-01.pdf http://www.ams.org/featurecolumn/archive/
apportion2.html

Sept. 15, 2009 Apportionment Schemes
Photo Credits
Images: George Washington: http://www.morallaw.org/images/George%20Washington
%20portrait.gif Alexander Hamilton:
http://igs.berkeley.edu/library/hot_topics/2008/Dec.2008/Images/Alexander_Hamilton_portrait_by_John_Trumbull_1806.jpg
Jefferson: http://www.usnews.com/dbimages/master/3165/FE_DA_080128moore_vert_20410.jpg
Webster: http://en.wikipedia.org/wiki/Daniel_Webster Delaware: http://www.national5and10.com/images/grey%20Delawhere%20t-
shirt.JPG Virginia: http://wwp.greenwichmeantime.com/time-zone/usa/virginia/images/state-
flag-virginia.jpg Constitution:
http://cache.boston.com/bonzai-fba/Globe_Photo/2008/08/15/we__1218837534_8547.jpg
Veto: http://kraigpaulsen.com/blog/wp-content/uploads/2009/05/veto.png