approaches for tensile testing of braided composites … · approaches for tensile testing of...
TRANSCRIPT

APPROACHES FOR TENSILE TESTING OF BRAIDED COMPOSITES For angleply composites, lamina tension and compression strengths are commonly determined by applying classical lamination theory to test data obtained from testing of angleply composite specimens. For textile composites such as 2D triaxial braids, analysis is more complex and standard test methods do not always yield reliable strength measurements. This paper describes recent research focused on development of more reliable tensile test methods for braided composites and presents preliminary data for various approaches. The materials investigated in this work have 0°/±60° 2D triaxial braid architecture with nearly equal fiber volume fraction in each of the three fiber directions. Flat composite panels are fabricated by resin transfer molding (RTM) using six layers of the braided preform aligned along the 0° fiber direction. Various epoxy resins are used as matrix materials. Single layer panels are also fabricated in order to examine local variations in deformation related to the braid architecture. Specimens are cut from these panels in the shape of standard straight-sided coupons, an alternative “bowtie” geometry, and an alternative “notched” geometry. Axial tensile properties are measured using specimens loaded along the 0°fiber direction. Transverse tensile properties are measured using specimens loaded perpendicular to the 0° fibers. Composite tubes are also fabricated by RTM. These tubes are tested by internal pressurization using a soft rubbery material sealed between the inside diameter of the tube and the load fixtures. The ends of the tube are unconstrained, so the primary load is in the hoop direction. Tubes are fabricated with the 0° fibers aligned along the tube axis by overbraiding the preform on a mandrel. Since the loading is in the hoop direction, testing of the overbraided tube provides a measure of transverse tensile strength. Previous work has indicated that straight-sided coupons yield a transverse tensile strength that is much lower than the expected material strength because of premature edge-initiated failure. Full-field strain measured during transverse tensile tests clearly showed accumulation of edge damage prior to failure. In the current work, high speed video and testing of single layer specimens are used to investigate potential failure mechanisms in more detail. High speed video clearly shows the edge initiation in six layer transverse tensile test coupons. Specimens with the bowtie geometry and the notched geometry minimize this edge effect and yield significantly higher transverse tensile strength values compared to the straight-sided coupons. However, bowtie and notched specimens geometries are not ideal because of the non-uniform stress and strain fields in the region of failure. Testing of tubes using internal pressurization eliminates edge-initiated failure and provides a more uniform state of stress and strain. Preliminary results indicate that bowtie, notched, and tube specimens yield comparable values for transverse tensile strength and that these values are much higher than the strength measured using a straight-sided coupon.
https://ntrs.nasa.gov/search.jsp?R=20110008612 2018-07-16T13:17:00+00:00Z
National Aeronautics and Space Administration
www.nasa.govPresented at CompTest 2011, 14-16 February, 2011, Lausanne, Switzerland 1
Approaches for Tensile Testing of Braided Composites
Gary D. Roberts and Jonathan A. SalemNASA Glenn Research Center, Cleveland, Ohio
Justin L. BailOhio Aerospace Institute, Cleveland, Ohio
Lee W. Kohlman and Wieslaw K. BiniendaThe University of Akron, Akron, Ohio
Richard E. MartinCleveland State University, Cleveland, Ohio
National Aeronautics and Space Administration
www.nasa.govPresented at CompTest 2011, 14-16 February, 2011, Lausanne, Switzerland 2
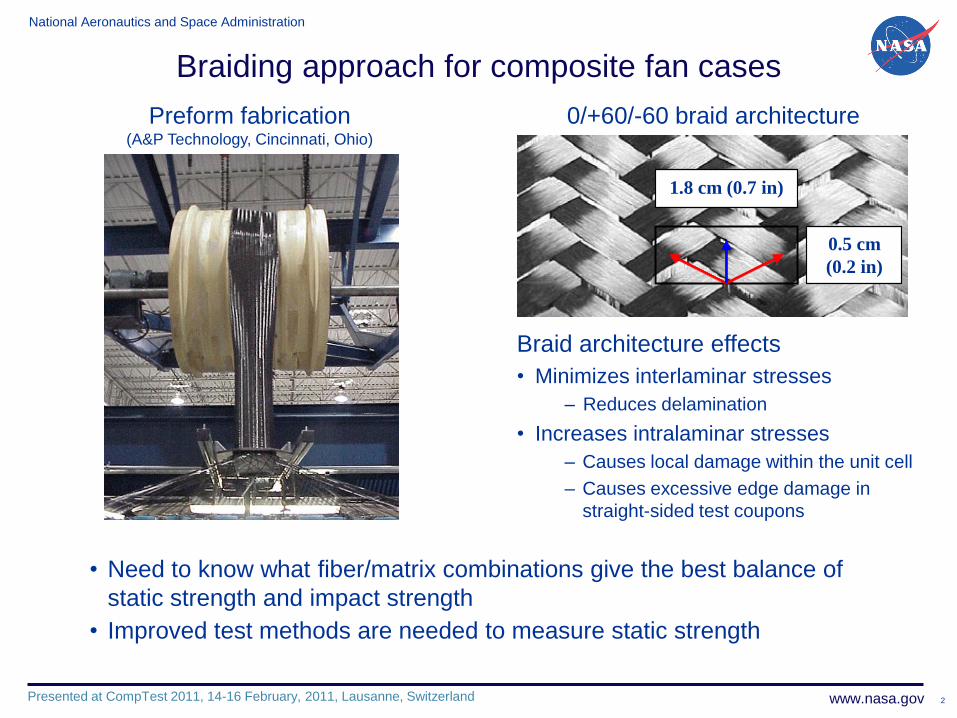
Braiding approach for composite fan cases
1.8 cm (0.7 in)
0.5 cm
(0.2 in)
1.8 cm (0.7 in)
0.5 cm
(0.2 in)
Braid architecture effects
• Minimizes interlaminar stresses
‒ Reduces delamination
• Increases intralaminar stresses
– Causes local damage within the unit cell
– Causes excessive edge damage in
straight-sided test coupons
Preform fabrication(A&P Technology, Cincinnati, Ohio)
0/+60/-60 braid architecture
• Need to know what fiber/matrix combinations give the best balance of
static strength and impact strength
• Improved test methods are needed to measure static strength
National Aeronautics and Space Administration
www.nasa.govPresented at CompTest 2011, 14-16 February, 2011, Lausanne, Switzerland 3
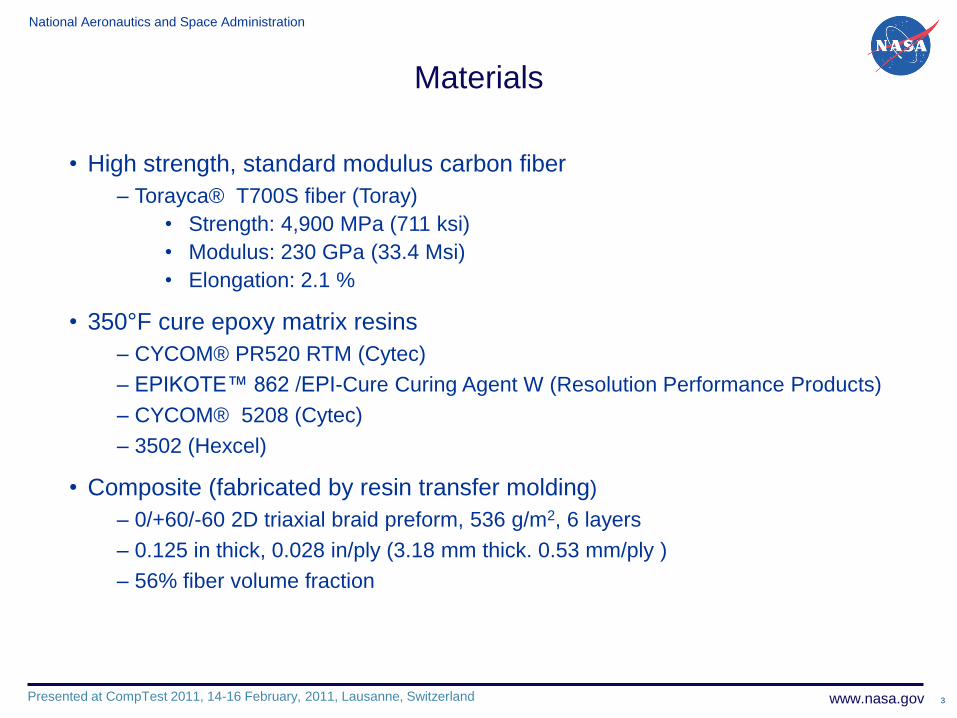
Materials
• High strength, standard modulus carbon fiber
– Torayca® T700S fiber (Toray)
• Strength: 4,900 MPa (711 ksi)
• Modulus: 230 GPa (33.4 Msi)
• Elongation: 2.1 %
• 350°F cure epoxy matrix resins
– CYCOM® PR520 RTM (Cytec)
– EPIKOTE™ 862 /EPI-Cure Curing Agent W (Resolution Performance Products)
– CYCOM® 5208 (Cytec)
– 3502 (Hexcel)
• Composite (fabricated by resin transfer molding)
– 0/+60/-60 2D triaxial braid preform, 536 g/m2, 6 layers
– 0.125 in thick, 0.028 in/ply (3.18 mm thick. 0.53 mm/ply )
– 56% fiber volume fraction
National Aeronautics and Space Administration
www.nasa.govPresented at CompTest 2011, 14-16 February, 2011, Lausanne, Switzerland 4
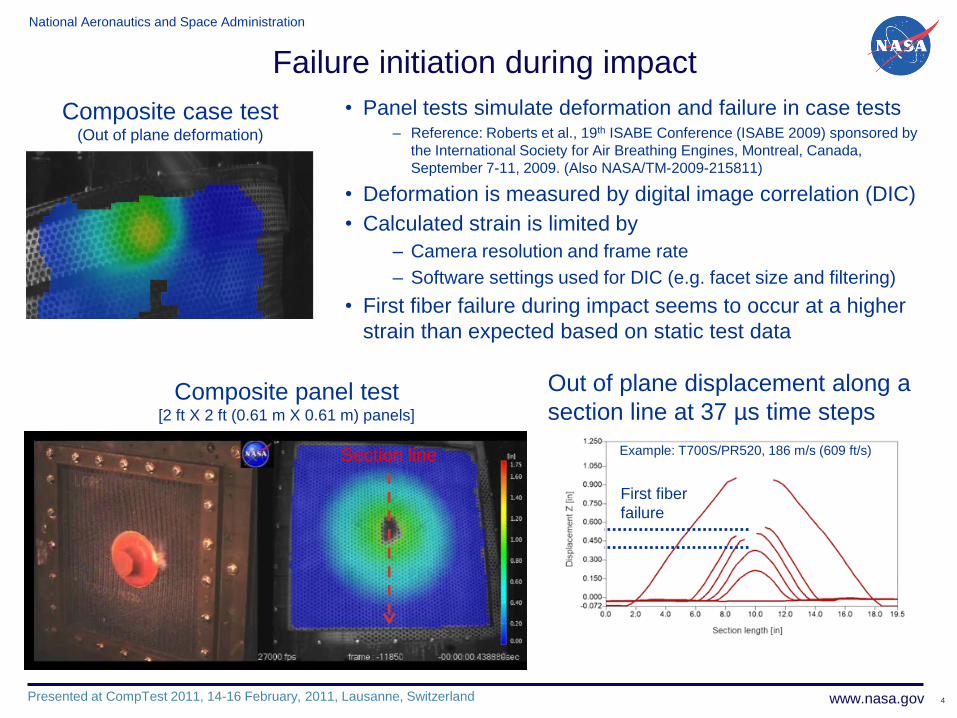
Failure initiation during impact
Composite panel test[2 ft X 2 ft (0.61 m X 0.61 m) panels]
Out of plane displacement along a
section line at 37 µs time steps
• Panel tests simulate deformation and failure in case tests‒ Reference: Roberts et al., 19th ISABE Conference (ISABE 2009) sponsored by
the International Society for Air Breathing Engines, Montreal, Canada,
September 7-11, 2009. (Also NASA/TM-2009-215811)
• Deformation is measured by digital image correlation (DIC)
• Calculated strain is limited by
– Camera resolution and frame rate
– Software settings used for DIC (e.g. facet size and filtering)
• First fiber failure during impact seems to occur at a higher
strain than expected based on static test data
Composite case test(Out of plane deformation)
First fiber
failure
Section line Example: T700S/PR520, 186 m/s (609 ft/s)
National Aeronautics and Space Administration
www.nasa.govPresented at CompTest 2011, 14-16 February, 2011, Lausanne, Switzerland 5
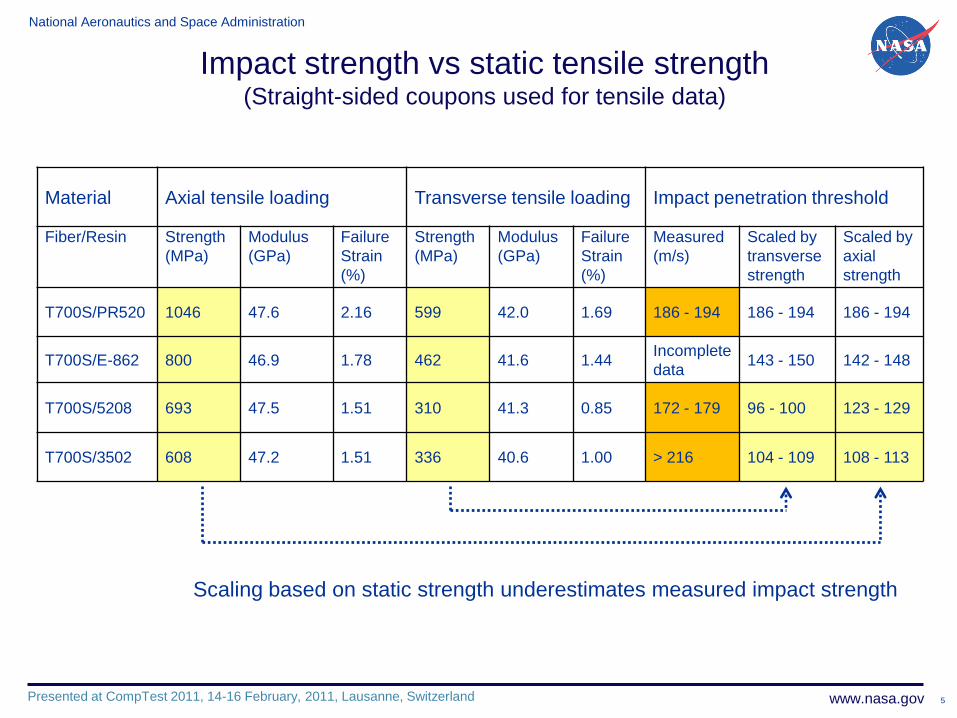
Impact strength vs static tensile strength(Straight-sided coupons used for tensile data)
Material Axial tensile loading Transverse tensile loading Impact penetration threshold
Fiber/Resin Strength
(MPa)
Modulus
(GPa)
Failure
Strain
(%)
Strength
(MPa)
Modulus
(GPa)
Failure
Strain
(%)
Measured
(m/s)
Scaled by
transverse
strength
Scaled by
axial
strength
T700S/PR520 1046 47.6 2.16 599 42.0 1.69 186 - 194 186 - 194 186 - 194
T700S/E-862 800 46.9 1.78 462 41.6 1.44Incomplete
data143 - 150 142 - 148
T700S/5208 693 47.5 1.51 310 41.3 0.85 172 - 179 96 - 100 123 - 129
T700S/3502 608 47.2 1.51 336 40.6 1.00 > 216 104 - 109 108 - 113
Scaling based on static strength underestimates measured impact strength
National Aeronautics and Space Administration
www.nasa.govPresented at CompTest 2011, 14-16 February, 2011, Lausanne, Switzerland 6
Limitations of straight-sided coupons for measuring strength
National Aeronautics and Space Administration
www.nasa.govPresented at CompTest 2011, 14-16 February, 2011, Lausanne, Switzerland 7
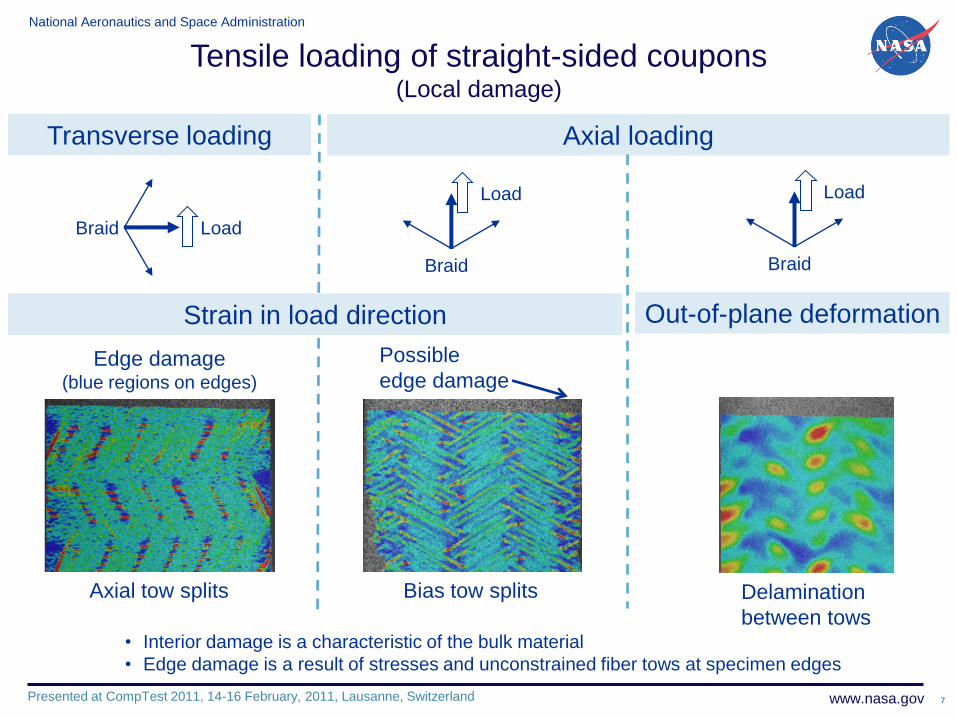
Axial loading
Out-of-plane deformation
Transverse loading
LoadBraid
Load
Braid
Axial tow splits
Tensile loading of straight-sided coupons(Local damage)
Delamination
between tows
Edge damage(blue regions on edges)
Bias tow splits
• Interior damage is a characteristic of the bulk material
• Edge damage is a result of stresses and unconstrained fiber tows at specimen edges
Load
Braid
Strain in load direction
Possible
edge damage
National Aeronautics and Space Administration
www.nasa.govPresented at CompTest 2011, 14-16 February, 2011, Lausanne, Switzerland 8
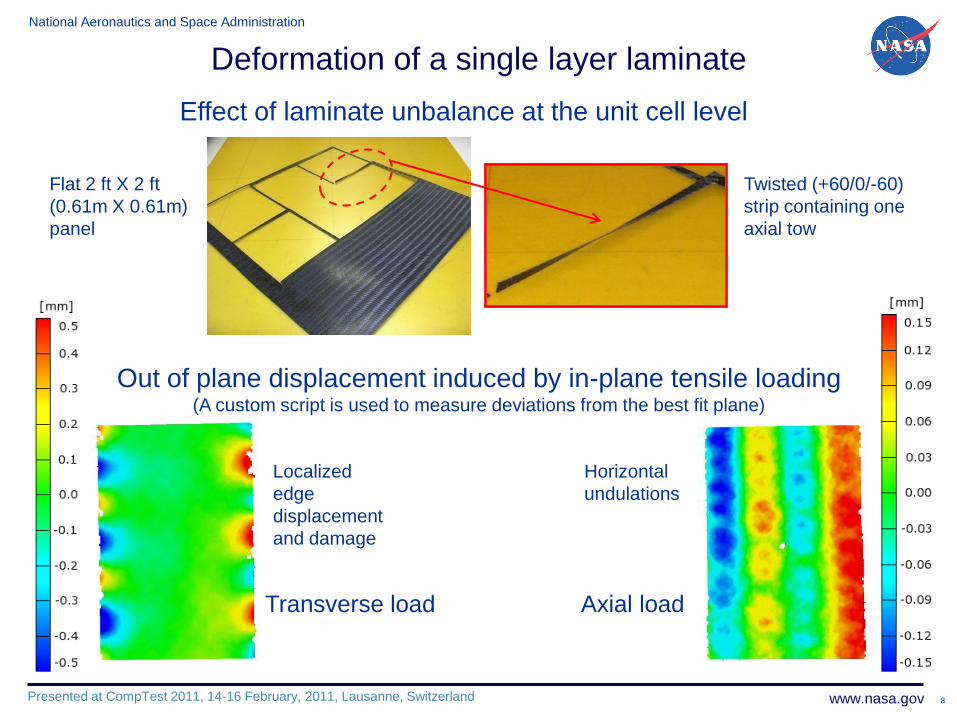
Deformation of a single layer laminate
Flat 2 ft X 2 ft
(0.61m X 0.61m)
panel
Twisted (+60/0/-60)
strip containing one
axial tow
Out of plane displacement induced by in-plane tensile loading(A custom script is used to measure deviations from the best fit plane)
Axial loadTransverse load
Localized
edge
displacement
and damage
Horizontal
undulations
Effect of laminate unbalance at the unit cell level
National Aeronautics and Space Administration
www.nasa.govPresented at CompTest 2011, 14-16 February, 2011, Lausanne, Switzerland 9
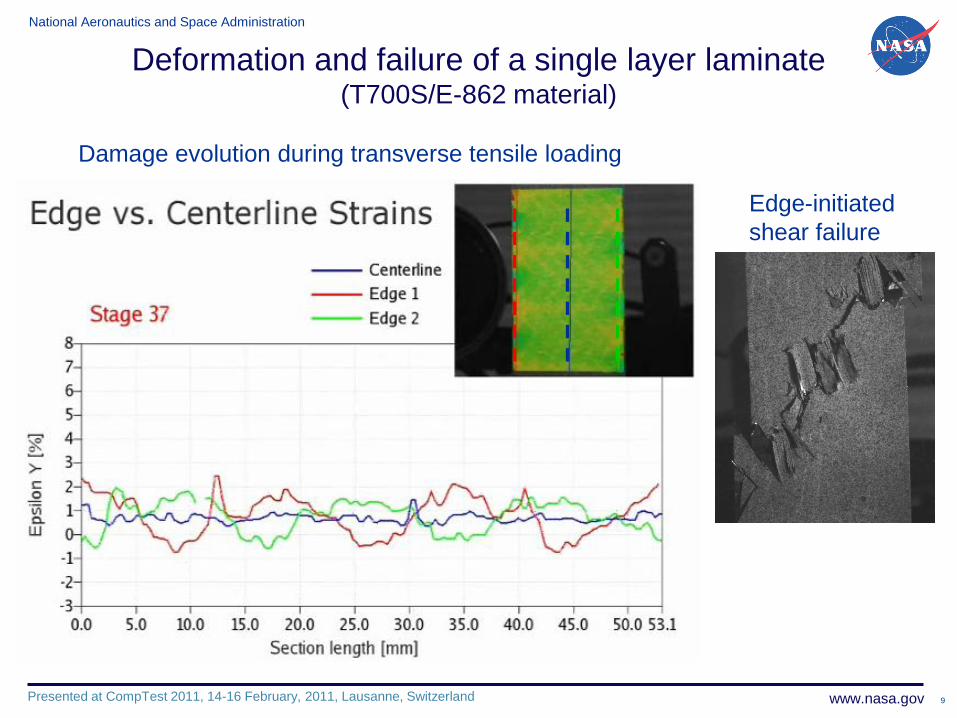
Deformation and failure of a single layer laminate(T700S/E-862 material)
Damage evolution during transverse tensile loading
Edge-initiated
shear failure
National Aeronautics and Space Administration
www.nasa.govPresented at CompTest 2011, 14-16 February, 2011, Lausanne, Switzerland 10
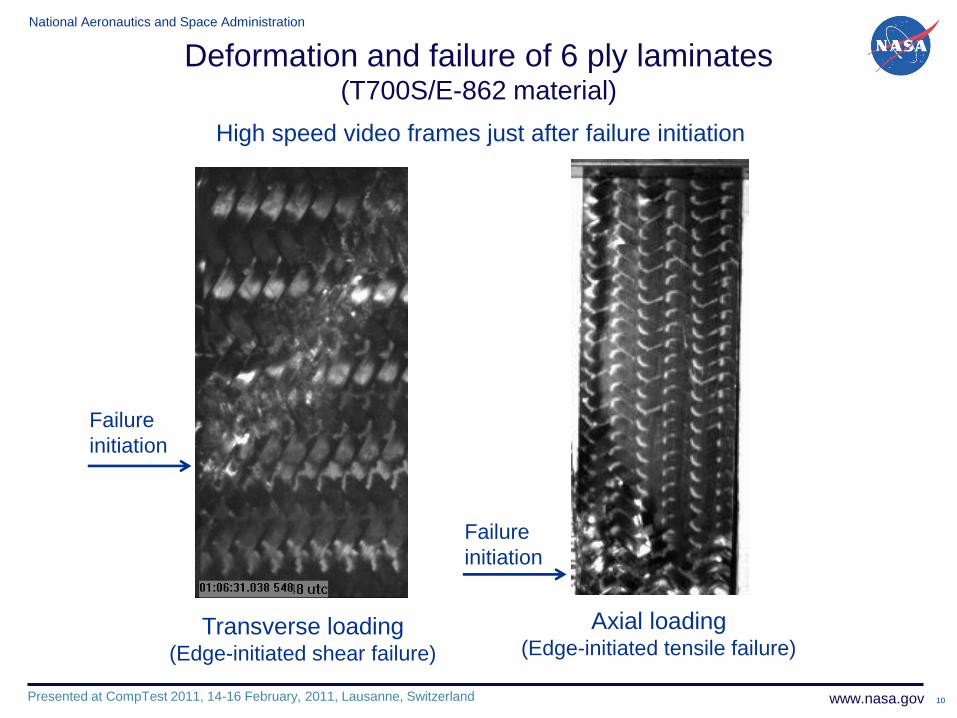
Deformation and failure of 6 ply laminates(T700S/E-862 material)
Axial loading(Edge-initiated tensile failure)
High speed video frames just after failure initiation
Transverse loading(Edge-initiated shear failure)
Failure
initiation
Failure
initiation
National Aeronautics and Space Administration
www.nasa.govPresented at CompTest 2011, 14-16 February, 2011, Lausanne, Switzerland 11
Alternative approaches for measuring tensile strength
National Aeronautics and Space Administration
www.nasa.govPresented at CompTest 2011, 14-16 February, 2011, Lausanne, Switzerland 12
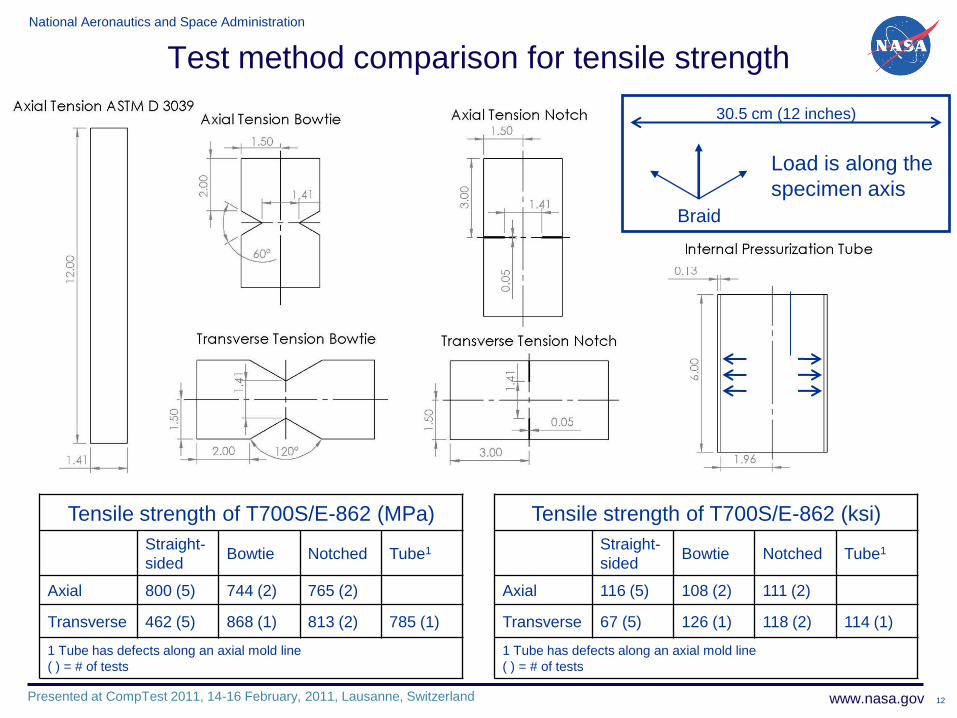
Test method comparison for tensile strength
Tensile strength of T700S/E-862 (MPa)
Straight-
sidedBowtie Notched Tube1
Axial 800 (5) 744 (2) 765 (2)
Transverse 462 (5) 868 (1) 813 (2) 785 (1)
1 Tube has defects along an axial mold line
( ) = # of tests
Tensile strength of T700S/E-862 (ksi)
Straight-
sidedBowtie Notched Tube1
Axial 116 (5) 108 (2) 111 (2)
Transverse 67 (5) 126 (1) 118 (2) 114 (1)
1 Tube has defects along an axial mold line
( ) = # of tests
Braid
Load is along the
specimen axis
30.5 cm (12 inches)
National Aeronautics and Space Administration
www.nasa.govPresented at CompTest 2011, 14-16 February, 2011, Lausanne, Switzerland 13
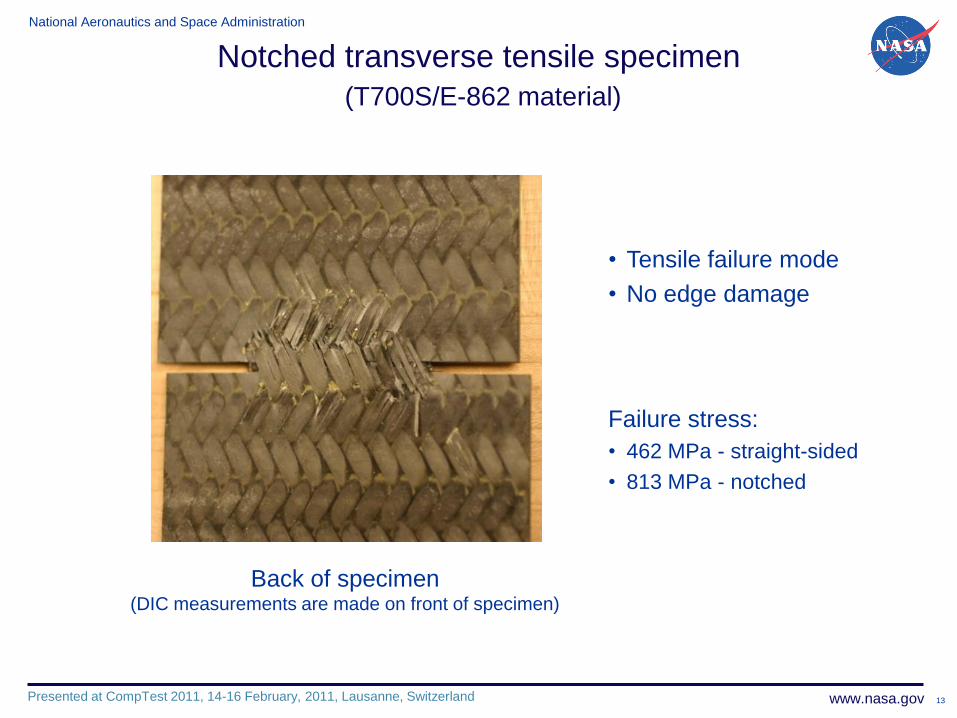
Notched transverse tensile specimen
(T700S/E-862 material)
• Tensile failure mode
• No edge damage
Back of specimen(DIC measurements are made on front of specimen)
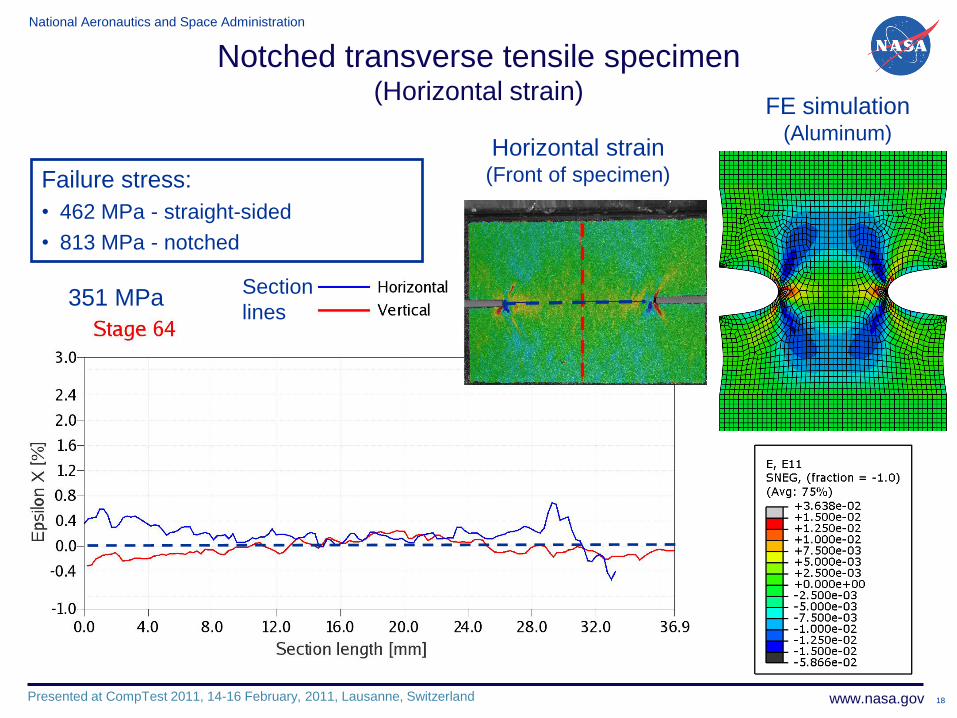
Failure stress:
• 462 MPa - straight-sided
• 813 MPa - notched

National Aeronautics and Space Administration
www.nasa.govPresented at CompTest 2011, 14-16 February, 2011, Lausanne, Switzerland 14
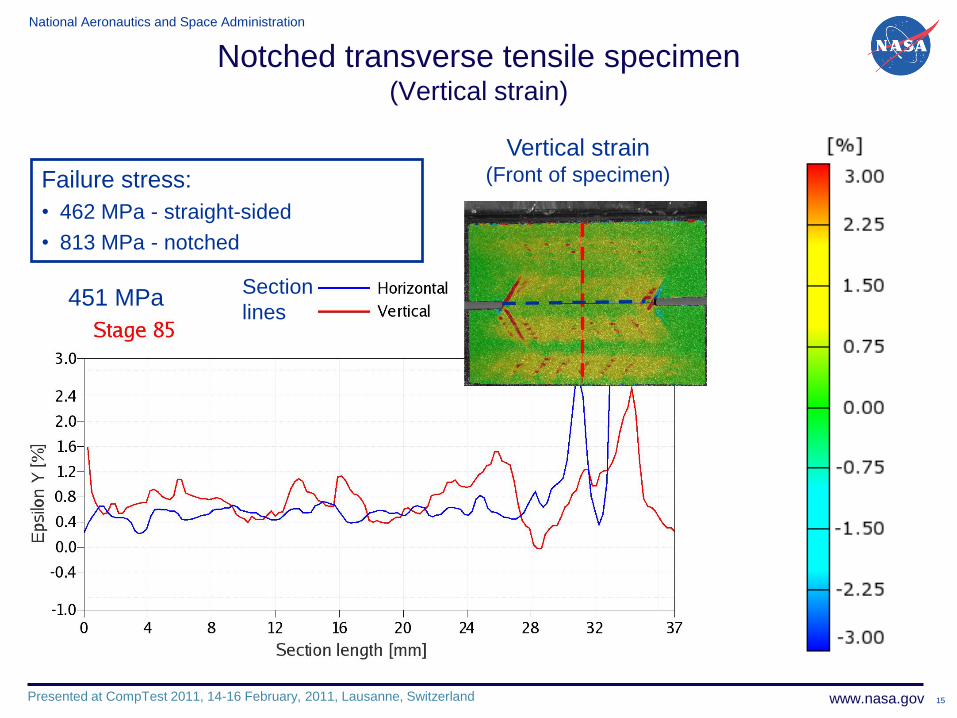
Notched transverse tensile specimen(Vertical strain)
351 MPa
Vertical strain(Front of specimen)
Section
lines
Failure stress:
• 462 MPa - straight-sided
• 813 MPa - notched
National Aeronautics and Space Administration
www.nasa.govPresented at CompTest 2011, 14-16 February, 2011, Lausanne, Switzerland 15
Notched transverse tensile specimen(Vertical strain)
451 MPa
Vertical strain(Front of specimen)
Section
lines
Failure stress:
• 462 MPa - straight-sided
• 813 MPa - notched
National Aeronautics and Space Administration
www.nasa.govPresented at CompTest 2011, 14-16 February, 2011, Lausanne, Switzerland 16
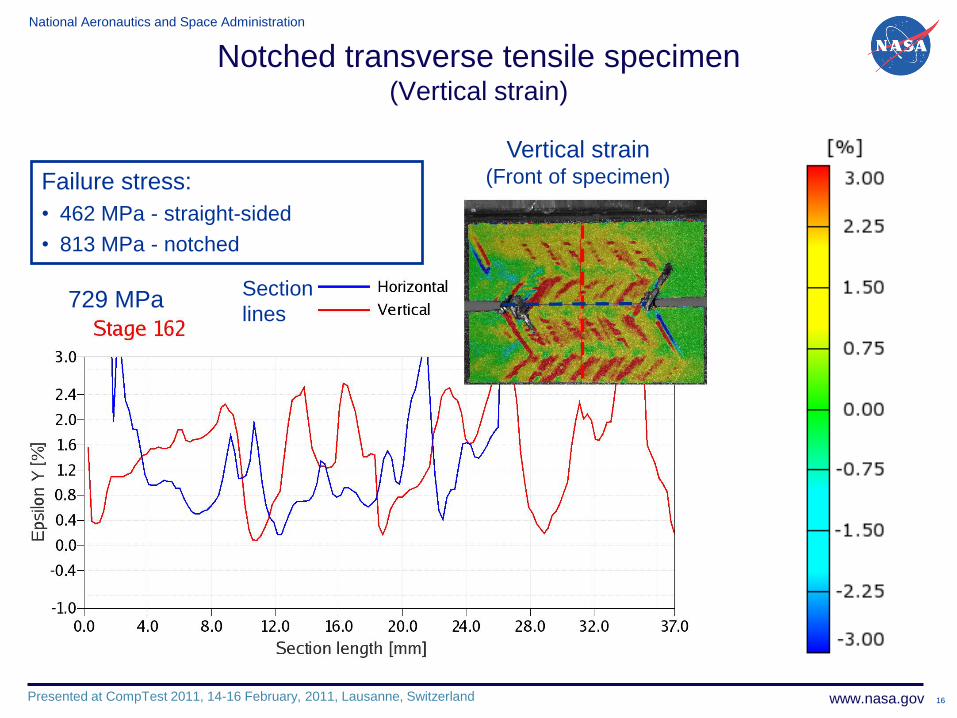
Notched transverse tensile specimen(Vertical strain)
729 MPa
Vertical strain(Front of specimen)
Section
lines
Failure stress:
• 462 MPa - straight-sided
• 813 MPa - notched
National Aeronautics and Space Administration
www.nasa.govPresented at CompTest 2011, 14-16 February, 2011, Lausanne, Switzerland 17
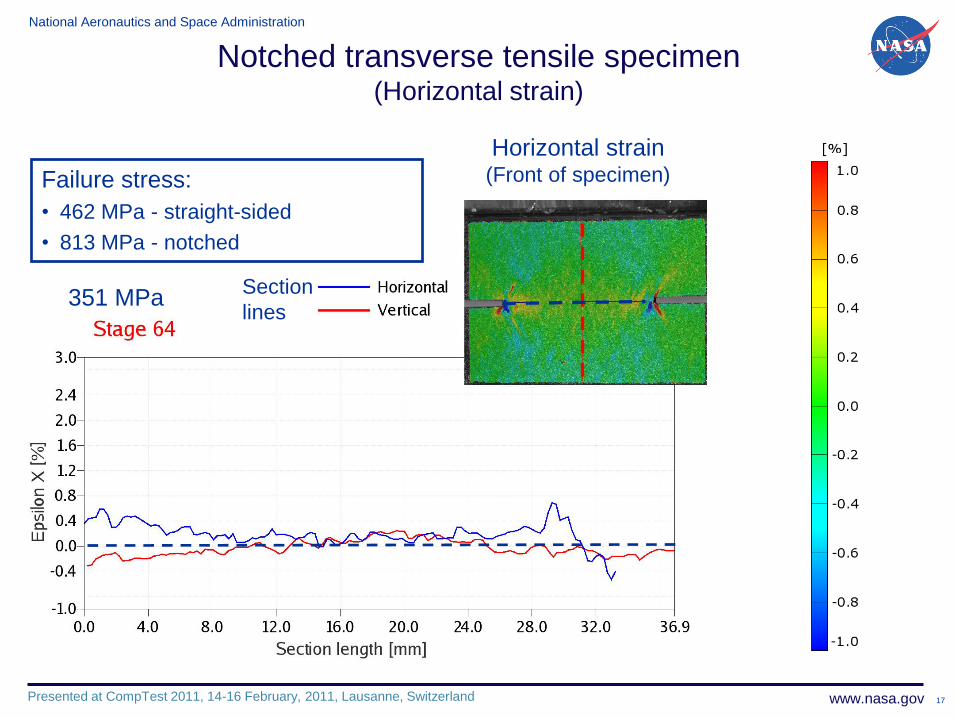
Notched transverse tensile specimen(Horizontal strain)
351 MPa
Horizontal strain(Front of specimen)
Section
lines
Failure stress:
• 462 MPa - straight-sided
• 813 MPa - notched
National Aeronautics and Space Administration
www.nasa.govPresented at CompTest 2011, 14-16 February, 2011, Lausanne, Switzerland 18
Notched transverse tensile specimen(Horizontal strain)
FE simulation(Aluminum)
351 MPa
Horizontal strain(Front of specimen)
Section
lines
Failure stress:
• 462 MPa - straight-sided
• 813 MPa - notched

National Aeronautics and Space Administration
www.nasa.govPresented at CompTest 2011, 14-16 February, 2011, Lausanne, Switzerland 19
Notched transverse tensile specimen(Horizontal strain)
451 MPa
Horizontal strain(Front of specimen)
Section
lines
Failure stress:
• 462 MPa - straight-sided
• 813 MPa - notched

National Aeronautics and Space Administration
www.nasa.govPresented at CompTest 2011, 14-16 February, 2011, Lausanne, Switzerland 20
Notched transverse tensile specimen(Horizontal strain)
729 MPa
Horizontal strain(Front of specimen)
Section
lines
Failure stress:
• 462 MPa - straight-sided
• 813 MPa - notched
National Aeronautics and Space Administration
www.nasa.govPresented at CompTest 2011, 14-16 February, 2011, Lausanne, Switzerland 21
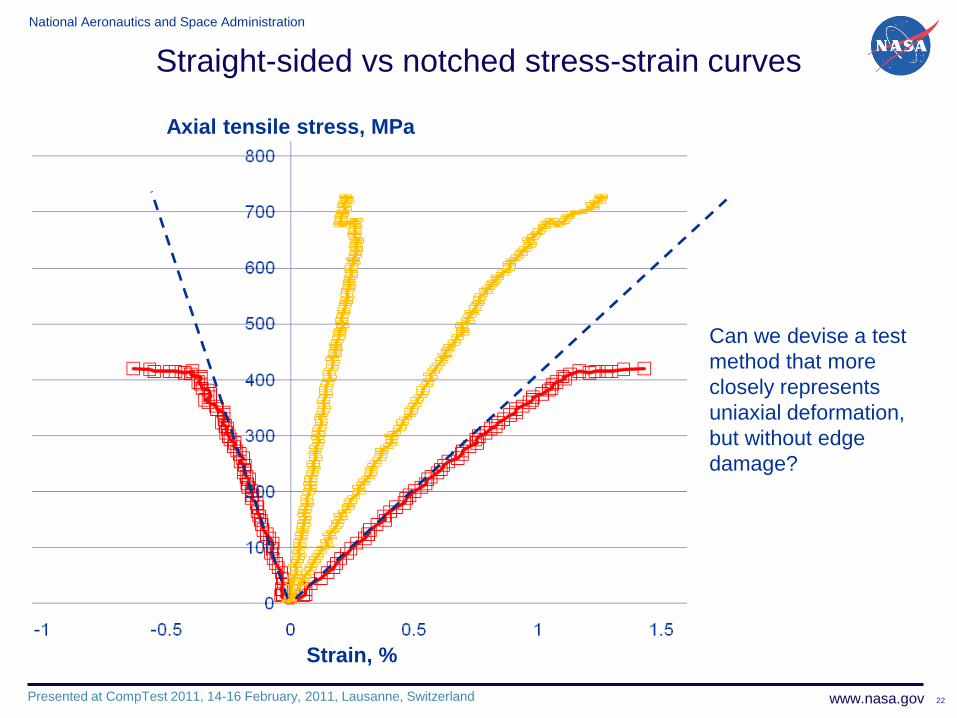
Straight-sided vs notched stress-strain curves
Strain is measured by
tracking points to eliminate
artificial strains associated
with cracking
Straight-sided _____Uniaxial load
Poisson’s ratio = 0.29
Notched _____Multiaxial load
Axial
strain
Transverse
strain
Strain, %
Axial tensile stress, MPa
National Aeronautics and Space Administration
www.nasa.govPresented at CompTest 2011, 14-16 February, 2011, Lausanne, Switzerland 22
Straight-sided vs notched stress-strain curves
Strain, %
Axial tensile stress, MPa
Can we devise a test
method that more
closely represents
uniaxial deformation,
but without edge
damage?

National Aeronautics and Space Administration
www.nasa.govPresented at CompTest 2011, 14-16 February, 2011, Lausanne, Switzerland 23
Tube specimens
Data is collected as a
series of cross-sections “Unwrapped” CT image shows fiber architecture in individual plies
Local distortion of the preform can be detected
Preform overbraided on a mandrel
Examination of braid architecture by X-ray computed tomography (CT)
Fabrication by resin transfer molding (RTM)
Cured tube dimensions
• Diameter: 3.9 in (9.9 cm)
• Wall thickness: 0.125 in (3.2 mm)
• Length: 24 in (61 cm)

National Aeronautics and Space Administration
www.nasa.govPresented at CompTest 2011, 14-16 February, 2011, Lausanne, Switzerland 24
6”
4.2”
Dia
met
er
3.9”
Mid-PlaneStresses in a 6 inch tube with 2 inch pressure zone
(Isotropic, homogeneous material with composite material modulus)
Tube testingAnalysis for partial internal pressurization
• Peak stress occurs near the
mid-plane
• Small edge stress reduces the
chance of edge initiated failure
• Mid-plane stress state is
multiaxial with a dominant hoop
stress (transverse tensile)
Hoop
AxialShear
National Aeronautics and Space Administration
www.nasa.govPresented at CompTest 2011, 14-16 February, 2011, Lausanne, Switzerland 25
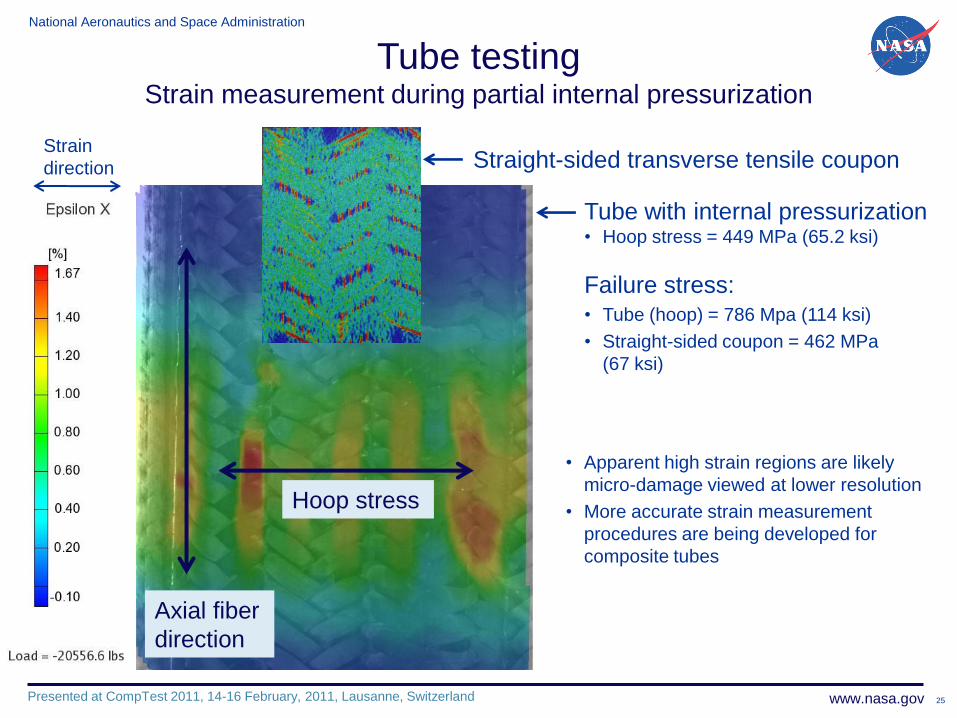
Tube testingStrain measurement during partial internal pressurization
Straight-sided transverse tensile coupon
Tube with internal pressurization• Hoop stress = 449 MPa (65.2 ksi)
Failure stress:• Tube (hoop) = 786 Mpa (114 ksi)
• Straight-sided coupon = 462 MPa
(67 ksi)
Strain
direction
Axial fiber
direction
Hoop stress
• Apparent high strain regions are likely
micro-damage viewed at lower resolution
• More accurate strain measurement
procedures are being developed for
composite tubes
National Aeronautics and Space Administration
www.nasa.govPresented at CompTest 2011, 14-16 February, 2011, Lausanne, Switzerland 26
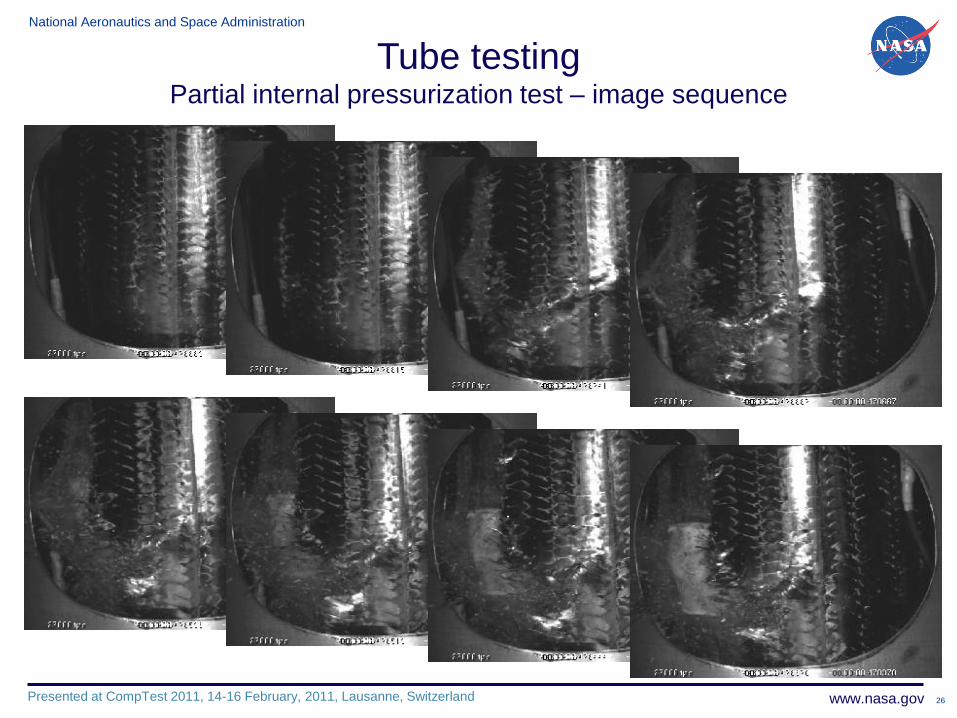
Tube testingPartial internal pressurization test – image sequence
National Aeronautics and Space Administration
www.nasa.govPresented at CompTest 2011, 14-16 February, 2011, Lausanne, Switzerland 27
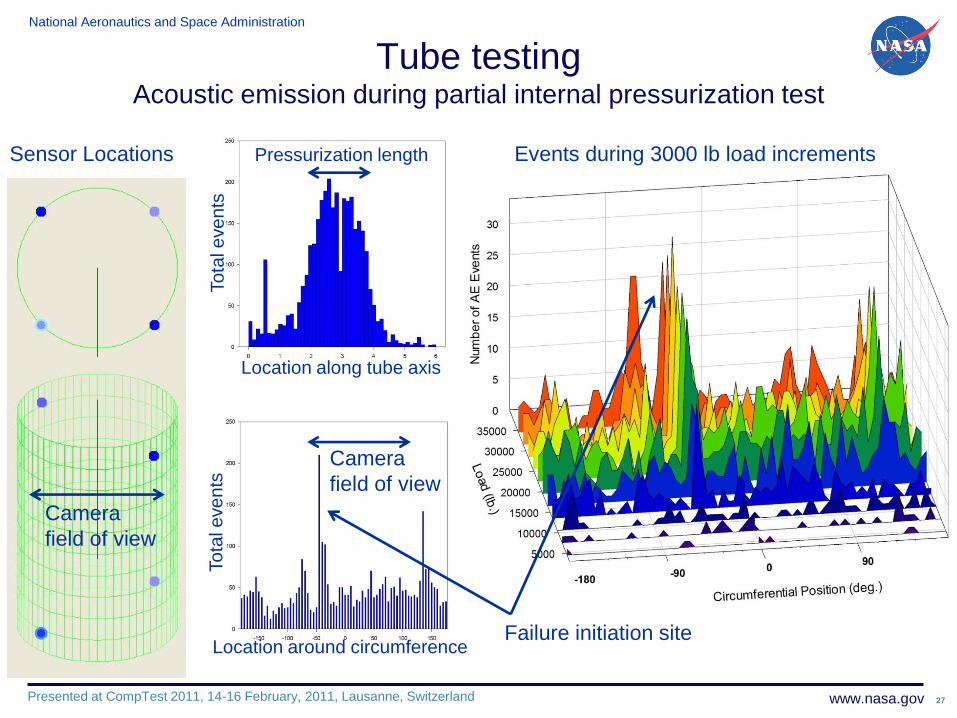
Tube testingAcoustic emission during partial internal pressurization test
Sensor Locations
To
tal e
ve
nts
Location along tube axis
Pressurization length
To
tal e
ve
nts
Location around circumference
Camera
field of view
Camera
field of view
Events during 3000 lb load increments
Failure initiation site
National Aeronautics and Space Administration
www.nasa.govPresented at CompTest 2011, 14-16 February, 2011, Lausanne, Switzerland 28
Summary
• Straight-sided coupons yield low tensile strength values– Edge-initiated failure occurs in transverse and possibly in axial loading
– Shear failure occurs in transverse loading
• Bowtie and notched coupons provide a more realistic strength
• Notched coupons provide a simple test method for strength
– Specimens are easy to fabricate
– The same shape is used for axial and transverse tests (or other orientations)
– Failure occurs in a tensile mode for transverse tests
– The effect of the multiaxial stress state needs to be investigated
• Partial internal pressurization of tubes provides a measurement of
transverse tensile strength in an nearly uniaxial load condition
– Failure is free of edge effects
– The transverse tensile (hoop) stress is uniform near the tube mid-plane
– Axial and shear stress components are small at the failure initiation site