approaches to measuring disadvantage at a small area level: children and older people presentation...
TRANSCRIPT
Approaches to measuring disadvantage at a small area level: children and older people
Presentation to Measuring Disadvantage and Outcomes Based Reporting Workshop at Defining Diversity ACTCOSS Conference, November 4 – 5th 2010, Canberra
Justine McNamara
2
Acknowledgements
● This presentation showcases work funded by ARC Discovery Grant DP1094318, ARC Discovery Grant DP664429 and ARC Linkage Grant LP775396
● Many people have contributed to the work presented here, including the investigators and funding partners on the above grants, and the authors of papers from which the material presented here has been drawn

3
Overview of presentation
● Small areas
● Measuring child disadvantage: child social exclusion risk
● Disadvantage among older people: two worlds of ageing
4
Small areas
Increasing interest in Australia in examining geographical differences in advantage and disadvantage:
● Work by Vinson and others
● To what extent was economic boom shared equally?
● Are inequalities widening?
● Neighbourhood effects
● ‘locational disadvantage’ part of social inclusion agenda
● Place-based service planning
5
Challenges in small area measurement
To name a few:
● Data, data, data
● Small sample sizes
● Choice of geographical unit
● ‘Modifiable areal unit problem’
● Ecological fallacy
6
Child social exclusion risk
7
Conceptualising social inclusion/exclusion
Very large literature on conceptualising and measuring social exclusion, and much debate.
Issues include:
- Differences between social exclusion and poverty
- Individual/structural
- Relational aspects
- Normative judgements
- Overlap of risk/causal factors with outcomes
- How important is persistence/intergenerational issues
- Wide and deep exclusion

8
Social exclusion and children
● Levitas et al. (2007)UK work on matrix of social exclusion measures which can be applied to different age groups
● UK social exclusion and poverty audit indicators for children (Opportunity for All)
● SPRC Australian work on social exclusion measures related to children
● Small but increasing number of international small area indicators of child deprivation/disadvantage (eg UK, South Africa)

9
Measuring child social exclusion risk at a small area level
● Earlier ARC-funded research into child social exclusion, leading to development of NATSEM’s original Child Social Exclusion (CSE) Index
● Work under new grant (2010 – 2012):
- Further development and refinement of CSE Index
- Creation of an index of youth social exclusion risk
- More analysis
● Unit of analysis: Statistical Local Area (SLA)
10
Some additional conceptual and measurement issues
● Data availability, especially for some concepts/dimensions
● The role (and availability) of data on children’s subjective well-being
● Importance of policy relevance
● Composite index vs individual variables
● Use of domains
11
Refining the index
● Re-examination of conceptual and measurement frameworks
● Investigation of new sources of data/variables
● Re-visiting methodology (first version used Principal Components Analysis to create index – similar to SEIFA indexes; this version we are creating domains, using PCA within domains and then equal weighting to combine domains)
● Comparing results
● WORK IN PROGRESS

12
Domains and variables used for original and first revision of NATSEM CSE index
Domains Variables Original CSE index First revision
Socio-economic Single parent family √ √
In bottom income quintile √ √
No family member completing year 12 √ √
Highest occupation of family members √ ×
No parent working √ √
Engagement No internet at home √ √
No parent volunteering √ √
No motor vehicle √ √
Housing Public housing √ ×
High renting cost × √
Health services & disability
Ratio of GPs × √
Ratio of dentists × √
Children with disability × √
13
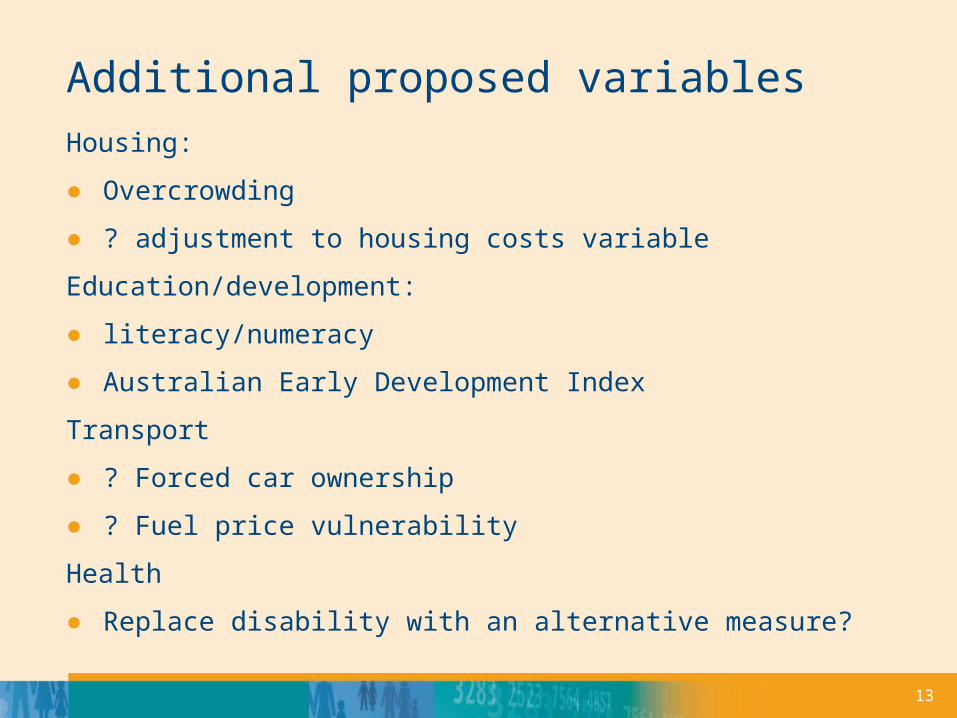
Additional proposed variables
Housing:
● Overcrowding
● ? adjustment to housing costs variable
Education/development:
● literacy/numeracy
● Australian Early Development Index
Transport
● ? Forced car ownership
● ? Fuel price vulnerability
Health
● Replace disability with an alternative measure?
14
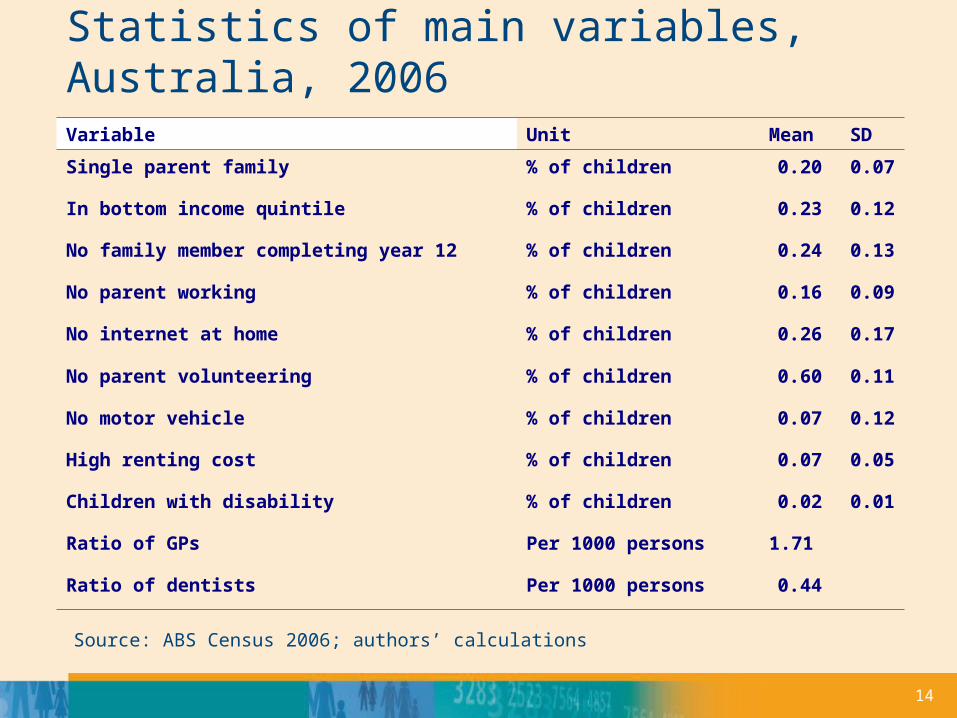
Statistics of main variables, Australia, 2006
Variable Unit Mean SD
Single parent family % of children 0.20 0.07
In bottom income quintile % of children 0.23 0.12
No family member completing year 12 % of children 0.24 0.13
No parent working % of children 0.16 0.09
No internet at home % of children 0.26 0.17
No parent volunteering % of children 0.60 0.11
No motor vehicle % of children 0.07 0.12
High renting cost % of children 0.07 0.05
Children with disability % of children 0.02 0.01
Ratio of GPs Per 1000 persons 1.71
Ratio of dentists Per 1000 persons 0.44
Source: ABS Census 2006; authors’ calculations
15
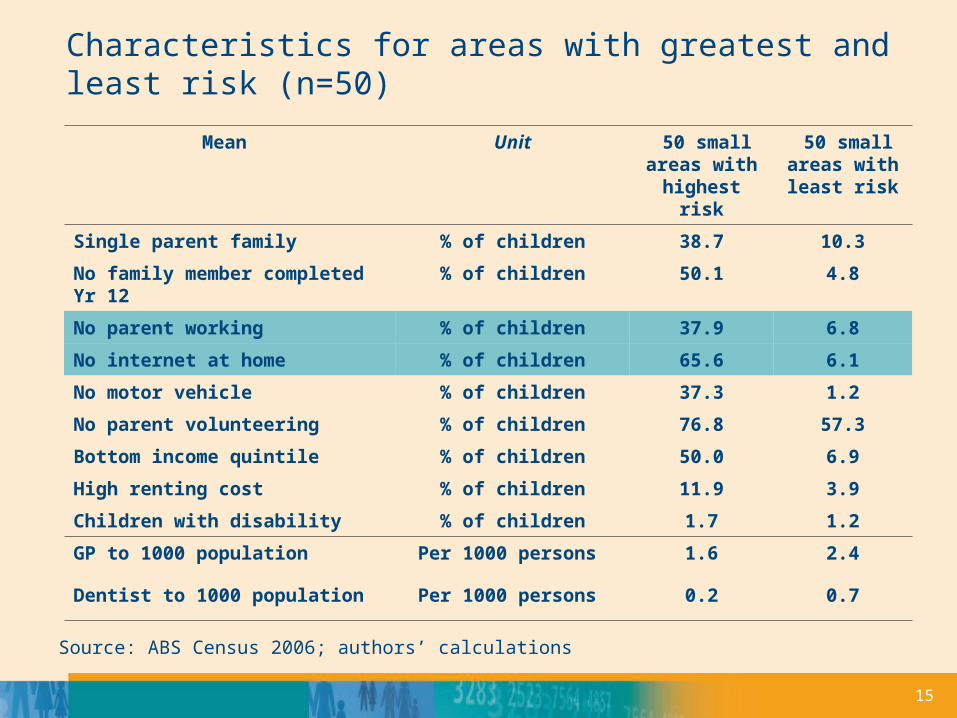
Characteristics for areas with greatest and least risk (n=50)
Mean Unit 50 small areas with
highest risk
50 small areas with least risk
Single parent family % of children 38.7 10.3
No family member completed Yr 12 % of children 50.1 4.8
No parent working % of children 37.9 6.8
No internet at home % of children 65.6 6.1
No motor vehicle % of children 37.3 1.2
No parent volunteering % of children 76.8 57.3
Bottom income quintile % of children 50.0 6.9
High renting cost % of children 11.9 3.9
Children with disability % of children 1.7 1.2
GP to 1000 population Per 1000 persons 1.6 2.4
Dentist to 1000 population Per 1000 persons 0.2 0.7
Source: ABS Census 2006; authors’ calculations
16
Two worlds of ageing
17
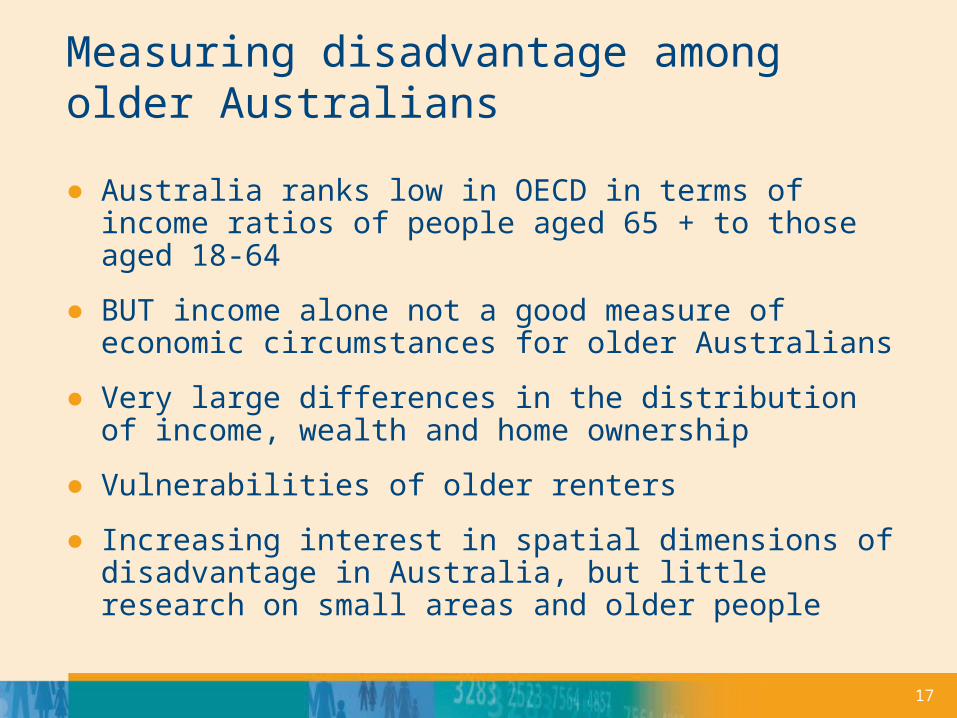
Measuring disadvantage among older Australians
● Australia ranks low in OECD in terms of income ratios of people aged 65 + to those aged 18-64
● BUT income alone not a good measure of economic circumstances for older Australians
● Very large differences in the distribution of income, wealth and home ownership
● Vulnerabilities of older renters
● Increasing interest in spatial dimensions of disadvantage in Australia, but little research on small areas and older people
18
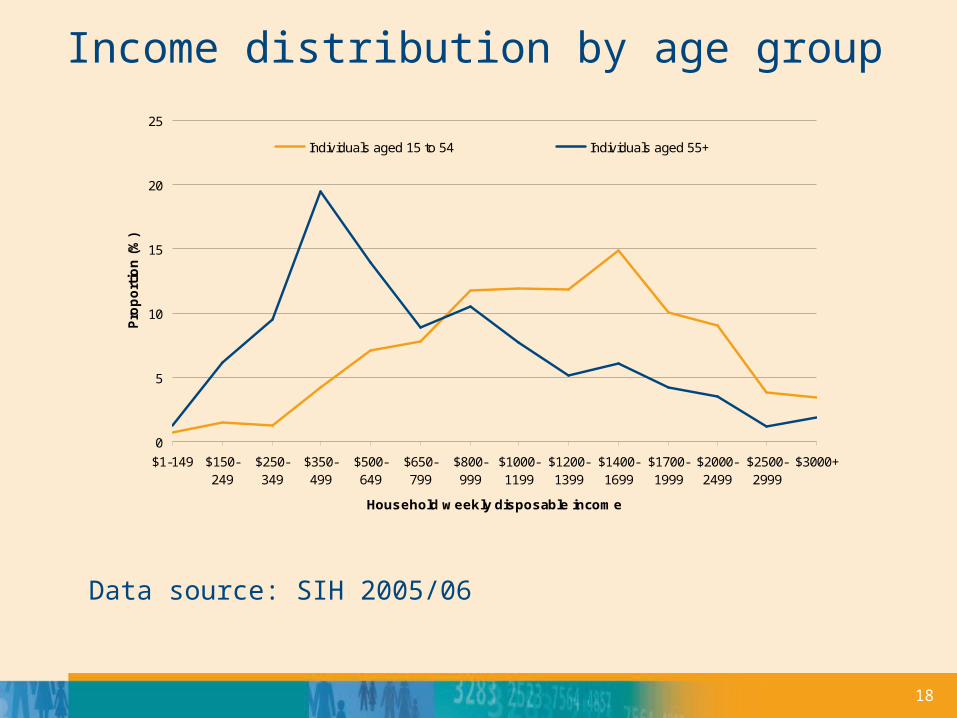
Income distribution by age group
0
5
10
15
20
25
$1-149 $150-249
$250-349
$350-499
$500-649
$650-799
$800-999
$1000-1199
$1200-1399
$1400-1699
$1700-1999
$2000-2499
$2500-2999
$3000+
Household weekly disposable income
Pro
po
rtio
n (
%)
Individuals aged 15 to 54 Individuals aged 55+
Data source: SIH 2005/06
19
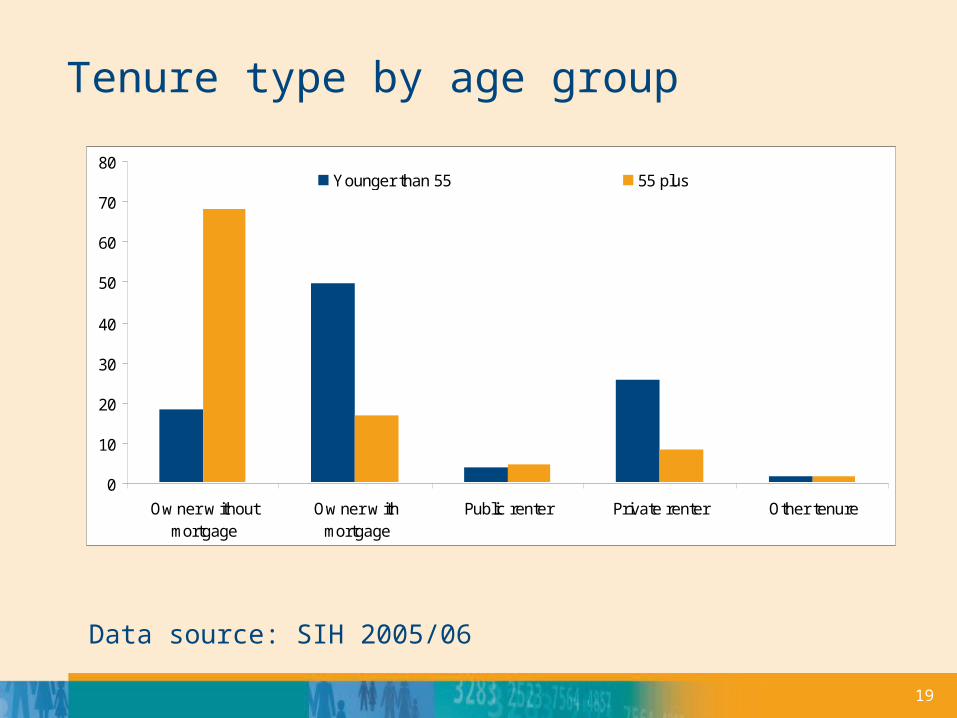
Tenure type by age group
Data source: SIH 2005/06
0
10
20
30
40
50
60
70
80
Ow ner w ithoutmortgage
Ow ner w ithmortgage
Public renter Private renter Other tenure
Younger than 55 55 plus
20
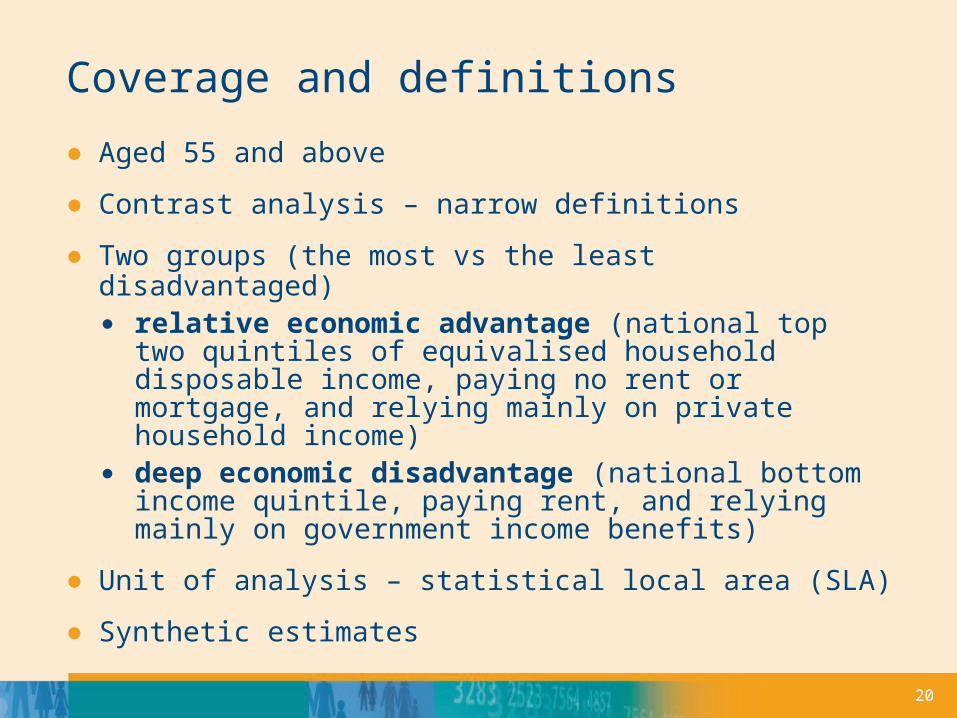
Coverage and definitions
● Aged 55 and above
● Contrast analysis – narrow definitions
● Two groups (the most vs the least disadvantaged)● relative economic advantage (national top two
quintiles of equivalised household disposable income, paying no rent or mortgage, and relying mainly on private household income)
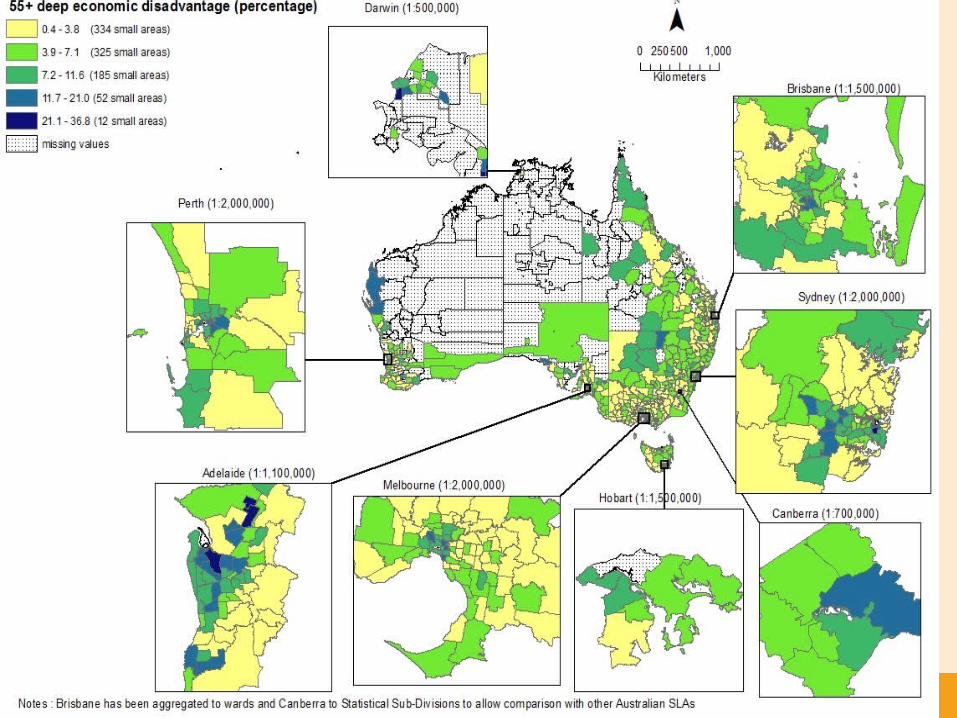
● deep economic disadvantage (national bottom income quintile, paying rent, and relying mainly on government income benefits)
● Unit of analysis – statistical local area (SLA)
● Synthetic estimates
21
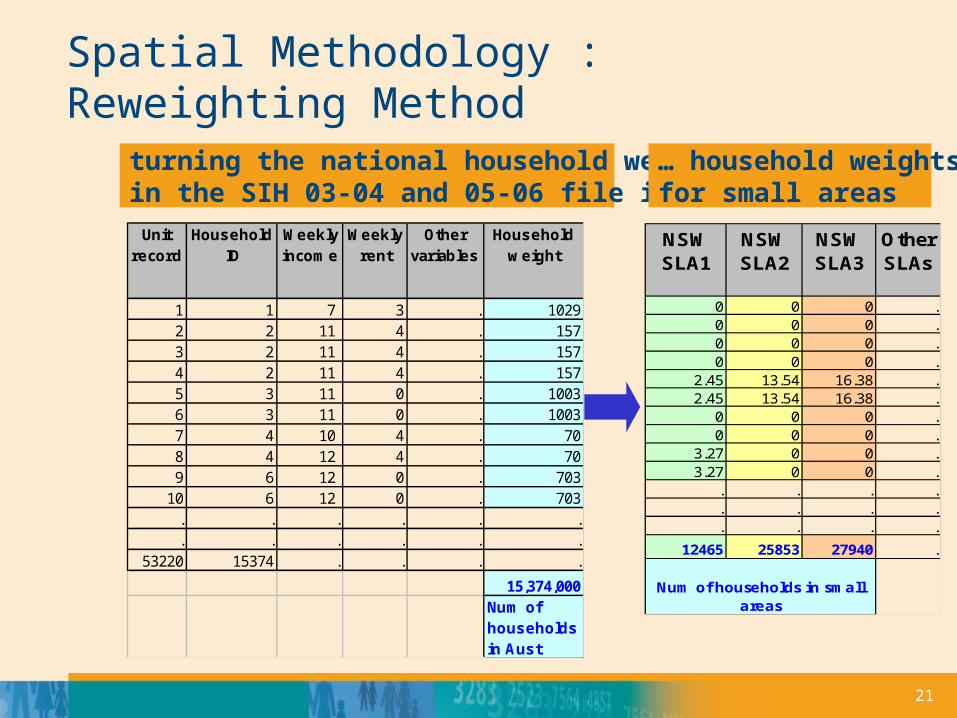
Spatial Methodology : Reweighting Method
turning the national household weights in the SIH 03-04 and 05-06 file into …
… household weightsfor small areas
Unit record
Household ID
Weekly income
Weekly rent
Other variables
Household weight
1 1 7 3 . 10292 2 11 4 . 1573 2 11 4 . 1574 2 11 4 . 1575 3 11 0 . 10036 3 11 0 . 10037 4 10 4 . 708 4 12 4 . 709 6 12 0 . 703
10 6 12 0 . 703. . . . . .. . . . . .
53220 15374 . . . .
15,374,000Num of households in Aust
NSW SLA1
NSW SLA2
NSW SLA3
Other SLAs
0 0 0 .0 0 0 .0 0 0 .0 0 0 .
2.45 13.54 16.38 .2.45 13.54 16.38 .
0 0 0 .0 0 0 .
3.27 0 0 .3.27 0 0 .
. . . .
. . . .
. . . .
12465 25853 27940 .
Num of households in small areas
22
● Map or 2
23
Other work includes:● Interactive maps of child (available now) and older adult
(coming soon) wellbeing and synthetic estimates of poverty rates and housing stress: www.natsem.canberra.edu.au
● Measuring persistence of social exclusion among older Australians
● Work on particular aspects of disadvantage (children in households where no parent is in paid work; child housing disadvantage; income poverty among lone person households)
● Youth social exclusion risk
24
References
Abello, A., Gong, C., McNamara, J. and Daly, A. (2010) Spatial dimensions of child social exclusion risk: widening the scope (2010). Presented at the 11th Institute of Family Studies Conference, Melbourne, 7 – 9 July 2010.
Gong, C., McNamara, J. , Vidyattama, Y., Miranti, R., Tanton, R., Harding, A. and Kendig, H. (2009) Two worlds of ageing: spatial microsimulation estimates of small area advantage and disadvantage among older Australians. Paper presented at the ARCRNSISS Methods, Tools and Technologies Workshop, Newcastle, 10-11 December 2009
Harding, A., McNamara, J., Daly, A., and Tanton, R., (2009), 'Child social exclusion: an updated index from the 2006 Census', Australian Journal of Labour Economics, Volume 12 Number 1, 41-64
McNamara, J., Gong, C., Miranti, R., Vidyattama, Y., Tanton, R, Harding, A. and Kendig, H. (2009). ‘The geography of advantage and disadvantage for older Australians: insights from spatial microsimulation’. Paper presented at the British Society for Population Studies Annual Conference, University of Sussex, UK, September 9 - 11 2009.
www.natsem.canberra.edu.au