approaches to zero net energy cost effectiveness in new homes
TRANSCRIPT

1
Energy Research and Development Division
FINAL PROJECT REPORT
Approaches to Zero Net Energy Cost Effectiveness in New Homes
Gavin Newsom, Governor
April 2021 | CEC-500-2021-025

2
PREPARED BY:
Primary Authors:
Max Wei1
Sang Hoon Lee1
Hung-Chia Yang1
Sarah Price1
Jeff Greenblatt1
Tianzhen Hong1
Brian Conlon2
Lucy McKenzie2
Zachary Ming2
Bob Hendron3
Alea German3
1Lawrence Berkeley National Laboratory
One Cyclotron Road
Berkeley, California 94720
Phone: 510-486-4000
http://www.lbl.gov
2E3
44 Montgomery St,
San Francisco, CA 94104
Phone: 415-391-5100
http://www.ethree.com
3Frontier Energy
1000 Broadway #410
Oakland, CA 94607
Phone: 510-444-870
http://www.frontierenergy.com
Contract Number: EPC-16-002
PREPARED FOR:
California Energy Commission
Brad Williams
Project Manager
Virginia Lew
Office Manager
ENERGY EFFICIENCY RESEARCH OFFICE
Laurie ten Hope
Deputy Director
ENERGY RESEARCH AND DEVELOPMENT DIVISION
Drew Bohan
Executive Director
DISCLAIMER
This report was prepared as the result of work sponsored by the California Energy Commission. It does not necessarily
represent the views of the Energy Commission, its employees, or the State of California. The Energy Commission, the
State of California, its employees, contractors, and subcontractors make no warranty, express or implied, and assume
no legal liability for the information in this report; nor does any party represent that the uses of this information
will not infringe upon privately owned rights. This report has not been approved or disapproved by the California
Energy Commission, nor has the California Energy Commission passed upon the accuracy or adequacy of the infor-
mation in this report.

i
ACKNOWLEDGEMENTS
The research team acknowledges and thanks the participants in this study’s expert elicitation
process, members of the technical advisory committee, supporting partner Southern California
Edison (SCE), Michelle Thomas, Senior Manager for Energy Codes & Standards and zero net
energy at SCE, Jeff Maguire and Scott Horowitz of the National Renewable Energy Laboratory
for their technical support on the BEopt modeling tool, the California Energy Commission’s
(CEC) codes and standards team (Bill Pennington, Mazi Shirakh, and Danny Tam) for their
valuable inputs, Stephen Meyers of Lawrence Berkeley National Laboratory for information
regarding large appliances, Zack Subin and Amber Mahone at E3 for their input on renewable
natural gas, Garth Torvestad of Consol and Ram Narayanamurthy of EPRI for technical
discussions, Bill Dakin and Dave Springer of Frontier Energy for their inputs regarding building
measures, Jenifer Jackson for CBECC-Res modeling support during the measure screening
process, and CEC Contract Agreement Manager Brad Williams for his steady support of the
project.
ii
PREFACE
The California Energy Commission’s (CEC) Energy Research and Development Division
supports energy research and development programs to spur innovation in energy efficiency,
renewable energy and advanced clean generation, energy-related environmental protection,
energy transmission and distribution and transportation.
In 2012, the Electric Program Investment Charge (EPIC) was established by the California
Public Utilities Commission to fund public investments in research to create and advance new
energy solutions, foster regional innovation and bring ideas from the lab to the marketplace.
The CEC and the state’s three largest investor-owned utilities—Pacific Gas and Electric
Company, San Diego Gas & Electric Company and Southern California Edison Company—were
selected to administer the EPIC funds and advance novel technologies, tools, and strategies
that provide benefits to their electric ratepayers.
The CEC is committed to ensuring public participation in its research and development
programs that promote greater reliability, lower costs, and increase safety for the California
electric ratepayer and include:
• Providing societal benefits.
• Reducing greenhouse gas emission in the electricity sector at the lowest possible cost.
• Supporting California’s loading order to meet energy needs first with energy efficiency
and demand response, next with renewable energy (distributed generation and utility
scale), and finally with clean, conventional electricity supply.
• Supporting low-emission vehicles and transportation.
• Providing economic development.
• Using ratepayer funds efficiently.
Approaches to Zero Net Energy Cost Effectiveness in New Homes is the final report for the
Pathways to More Cost-Effective ZNE Homes project (Contract Number: EPC-16-002)
conducted by Lawrence Berkeley National Laboratory. The information from this project
contributes to Energy Research and Development Division’s EPIC Program.
For more information about the Energy Research and Development Division, please visit the
CEC’s research website (www.energy.ca.gov/research/) or contact the CEC at

iii
ABSTRACT
This report summarizes detailed modeling of new residential zero net energy homes in
California to provide information for future Title 24 building codes using the state’s time
dependent valuation method. The researchers derived an updated set of time dependent
valuation values for 2022 to more accurately estimate future energy costs, and rooftop
photovoltaic compensation rates for exported power were assumed to be less favorable than
the current net energy metering policy to emulate future anticipated state policy. The project
used Building Energy Optimization Tool software to provide cost-optimized building designs for
all-electric and mixed-fuel single-family homes across all 16 California climate zones and for
eight-unit multifamily buildings in 3 climate zones. The researchers performed detailed
modeling for onsite battery storage and precooling to evaluate the cost effectiveness of these
measures under various assumptions for future battery costs and control algorithms.
The research found that optimally designed single-family and multifamily homes result in lower
customer lifecycle costs for all-electric and mixed-fuel cases in all climate zones studied, but
generally with higher initial costs. Optimally designed all-electric single-family homes are
comparable in lifecycle costs to mixed-fuel homes in most climate zones, and single-family and
multifamily homes can benefit from not having to build natural gas infrastructure to the home.
Lower future battery costs and a moderate degree of controllability can enable cost-effective
battery storage with a wider range of battery sizes than currently permitted in California. For
precooling, a single-day control schedule can optimize precooling to achieve a large fraction of
the benefits. For battery storage and daytime precooling, electricity rates with a greater
degree of time-dependence will enable greater potential benefits.
Keywords: zero net energy homes, building decarbonization, electrification, energy efficiency,
cost-effective zero net energy homes, battery storage, demand shifting, demand response,
precooling
Please use the following citation for this report:
Max Wei, Sang Hoon Lee, Hung-Chia Yang, Sarah Price, Jeff Greenblatt, Tianzhen Hong, Brian
Conlon, Lucy McKenzie, Zachary Ming, Bob Hendron, and Alea German. 2021.
Approaches to Zero Net Energy Cost Effectiveness in New Homes. California Energy
Commission. Publication Number: CEC-500-2021-025.

iv

v
TABLE OF CONTENTS
Page
ACKNOWLEDGEMENTS ......................................................................................................... i
PREFACE ............................................................................................................................ ii
ABSTRACT ......................................................................................................................... iii
EXECUTIVE SUMMARY ........................................................................................................1
Introduction .....................................................................................................................1
Project Purpose ................................................................................................................1
Project Approach ..............................................................................................................2
Project Results .................................................................................................................2
Policy Implications .........................................................................................................3
Technology/Knowledge Transfer/Market Adoption (Advancing the Research to Market) ........4
Benefits to California ........................................................................................................4
CHAPTER 1: Introduction ....................................................................................................7
Zero Net-Energy Definition................................................................................................7
ZNE Design and Energy Supply Options .............................................................................7
Grid Harmonization ..........................................................................................................9
Key Research Questions ................................................................................................. 10
Report Organization ....................................................................................................... 10
CHAPTER 2: Project Approach ........................................................................................... 11
Time Dependent Valuation Update for 2022 ..................................................................... 11
Updates for 2022 Base Time dependent valuation ......................................................... 12
Energy Modeling Approach ............................................................................................. 14
BEopt Modeling Tool .................................................................................................... 14
Residential Prototype Energy Models ............................................................................ 14
Modeling Assumptions ................................................................................................. 14
Title 24 Measures and ZNE Measures .............................................................................. 15
2019 Title 24 Updates .................................................................................................. 16
ZNE Measures ............................................................................................................. 16
Miscellaneous Electric Loads ......................................................................................... 17
Storage Analysis Approach .............................................................................................. 18
Battery Storage ........................................................................................................... 18
Battery Storage Sizing ................................................................................................. 20

vi
Precooling Analysis Approach .......................................................................................... 20
Community Renewables Approach ................................................................................... 22
Renewable Natural Gas ................................................................................................ 22
Community Solar ......................................................................................................... 23
Expert Elicitation ............................................................................................................ 24
Survey Design ............................................................................................................. 24
CHAPTER 3: Project Results ............................................................................................... 26
Energy Model Simulation Results ..................................................................................... 26
Cost Effectiveness of All-Electric vs. Mixed-Fuel Homes .................................................. 26
BEopt Measures for Cost-Effectiveness.......................................................................... 36
Photovoltaic Orientation Sensitivity ............................................................................... 38
Photovoltaic Export Rate Sensitivity: Avoided Cost for Export versus Net Energy
Metering 2.0 ............................................................................................................... 39
Time Dependent Valuation Sensitivity: 2022 Base Case versus Higher Renewables Case .. 40
Storage ......................................................................................................................... 41
Battery Storage ........................................................................................................... 41
Precooling ................................................................................................................... 49
Renewable Natural Gas................................................................................................... 55
Forecasted Renewable Natural Gas Supply and Production Costs .................................... 55
Forecasted Demand for Renewable Natural Gas ............................................................ 56
Cost-Effectiveness of Renewable Natural Gas Home Compared to the Prescriptive Home . 58
Implementation Challenges for Renewable Natural Gas ................................................. 60
Community Solar ............................................................................................................ 61
Providing Zero Net Energy Compliance at Lower Cost .................................................... 61
Feasibility .................................................................................................................... 62
Nonparticipant Impacts ................................................................................................ 62
Potential Community Renewables Solutions ................................................................... 63
Expert Elicitation Key Findings ......................................................................................... 64
CHAPTER 4: Technology/Knowledge/Market Transfer Activities ............................................ 66
CHAPTER 5: Conclusions ................................................................................................... 68
Building Energy Modeling Key Findings ............................................................................ 68
Community Renewables: Community Solar and Renewable Natural Gas Key Findings ......... 69
Battery Storage Key Findings .......................................................................................... 69
Precooling Key Findings .................................................................................................. 70

vii
Policy Implications .......................................................................................................... 70
Future Work................................................................................................................... 71
CHAPTER 6: Benefits to Ratepayers ................................................................................... 73
LIST OF ACRONYMS .......................................................................................................... 75
REFERENCES .................................................................................................................... 78
APPENDIX A: Previous Work and Additional Information on Modeling Approach .................. A-1
APPENDIX B: Building Modeling Results ............................................................................ B-1
APPENDIX C: Expert Elicitation Protocol and Summary Results........................................... C-1
LIST OF FIGURES
Page
Figure 1: California Net Load Curve ......................................................................................9
Figure 2: Average Day Base Case 2022 Time dependent valuation Components,
Climate Zone 12 ................................................................................................................ 13
Figure 3: Average Day Higher Renewables 2022 Time dependent valuation, Components
Climate Zone 12 ................................................................................................................ 13
Figure 4: Prototype Buildings for Modeling in BEopt ............................................................ 14
Figure 5: Cooling Setpoint Schedules for Optimal Precooling Selection.................................. 22
Figure 6: Cost-Effectiveness Optimization Results for Single-Family Home ............................ 26
Figure 7: Reference Points: Electricity/Natural Gas Consumption and Photovoltaic Electricity
Generation ....................................................................................................................... 27
Figure 8: Cost-Effective Minimum Points: Electricity/Natural Gas Consumption and Photovoltaic
Electricity Generation ........................................................................................................ 28
Figure 9: Time dependent valuation-Zero Net Energy Points: Electricity/Natural Gas
Consumption and Photovoltaic Electricity Generation ........................................................... 28
Figure 10: Life-Cycle Cost of All-Electric and Mixed-Fuel Homes at Cost-Optimal Design Point 29
Figure 11: Initial Cost of All-Electric and Mixed-Fuel Homes at Cost-Optimal Design Points .... 30
Figure 12: CO2 Emissions for All-Electric and Mixed-Fuel Homes at Cost-Minimum
Design Points .................................................................................................................... 31
Figure 13: Single-Family Electricity/Natural Gas Consumption and Photovoltaic Electricity
Generation ....................................................................................................................... 33

viii
Figure 14: Life-Cycle Cost at Cost-Optimal Design Points — All-Electric and Mixed-Fuel Single-
Family Homes ................................................................................................................... 33
Figure 15: Initial Cost of All-Electric at Cost-Optimal Design Points — Mixed-Fuel Single-Family
Homes ............................................................................................................................. 34
Figure 16: Multi-Family 8-Unit Building Electricity/Natural Gas Consumption and Photovoltaic
Electricity Generation for Baseline and Cost-Optimal............................................................ 35
Figure 17: Life-Cycle Cost and Cost-Optimal Design Points — All-Electric and Mixed-Fuel 8-Unit
Multi-Family Building ......................................................................................................... 35
Figure 18: Initial Cost at Cost-Optimal Design Points — All-Electric and Mixed-Fuel 8-Unit Multi-
Family Buildings ................................................................................................................ 36
Figure 19: Climate Zone 13 Results of Cost-Effectiveness Measures on Electricity and Carbon
Dioxide Emission Savings................................................................................................... 37
Figure 20: Annual Average Hourly Profile — Carbon Dioxide Emissions for Individual Measures
and Measure Package ....................................................................................................... 38
Figure 21: Photovoltaic Electricity Generation by Module Orientation and Effect on
Life-Cycle Cost .................................................................................................................. 38
Figure 22: Energy-Related Cost Optimization Under Avoided Cost for Export and Net Energy
Metering 2.0 Policy ............................................................................................................ 39
Figure 23: Life-Cycle Cost Under Different Photovoltaic Electricity Overgeneration Export
Policies ............................................................................................................................. 40
Figure 24: Life-Cycle Cost Under 2022 Base Case versus Higher Renewables Case ................ 41
Figure 25: Selection of Time-Dependent Value-Zero Net Energy Battery Size ........................ 42
Figure 26: Storage Net Bill Savings Less Battery Costs (30-Year Net Present Value) .............. 43
Figure 27: Optimal Sizing of Two-Hour Battery, Minimum 2 Kilowatt-Hour, Average Cost –
No Reduction .................................................................................................................... 45
Figure 28: Time dependent valuation Benefits Less Battery Costs, 30-year Net Present Value,
Average Cost – No Reduction............................................................................................. 45
Figure 29: Optimal Sizing of Two-Hour Battery, Average Cost-Reducing Over Time ............... 46
Figure 30: Time dependent valuation Benefits Less Battery Costs, 30-year Net Present Value,
Average Cost-Reducing Over Time ..................................................................................... 47
Figure 31: Selection of Optimal Battery Size: Average Cost-Reducing Over Time ................... 48
Figure 32: Optimal Sizing of Two-Hour Battery and Time Dependent Valuation Net Benefits
Less Battery Costs ............................................................................................................. 49
Figure 33: Example Day of Base Cooling Load vs. Precooling Load ....................................... 50
Figure 34: Annual Net Load Comparison of Cooling Schedules by Climate Zone .................... 51

ix
Figure 35: 30-Year Net Time Dependent Valuation Cost Comparison of Cooling Schedules by
Climate Zone .................................................................................................................... 52
Figure 36: 30-Year Net Time Dependent Valuation Cost Savings of Individual and Optimal
Precooling Schedules Relative to Base Cooling .................................................................... 53
Figure 37: 30-Year Net Time Dependent Valuation Cost Savings of Precooling with Optimal
Setpoint Selection Under Rate Structure Sensitivities ........................................................... 54
Figure 38: California Renewable Natural Gas Supply Curves Under Two Scenarios, 2030 ....... 56
Figure 39: Forecasted 2030 Renewable Natural Gas Supply and Gas Demand ....................... 58
Figure 40: Time Dependent Valuation Cost-Effectiveness Comparison — Renewable Natural
Gas Mixed-Fuel vs. 2019 Code-Compliant Mixed-Fuel Prescriptive Home ............................... 59
Figure 41: California Energy Commission 2019 Code-Compliant Mixed-Fuel Home versus Fossil
Natural Gas Replaced by 100 Percent Renewable Natural Gas .............................................. 60
Figure A-1: Energy Price Impacts of Time Dependent Valuation Scenario Updates: Modeled
2026 Hourly Energy Prices for Seasonal Average Day in PG&E Valley ................................. A-8
Figure B-1: Optimal Sizing of 2hr Battery (Minimum 2kWh): Average Cost-Reducing over Time,
2100 ft2 All-electric Home, Base 2022 TDV ....................................................................... B-9
Figure B-2: TDV Net Benefits Less Battery Costs (30-year NPV): Average Cost-Reducing over
Time, 2100 ft2 All-electric Home, Base 2022 TDV .............................................................. B-9
Figure B-3: Optimal Sizing of 2hr Battery (Minimum 2kWh): Low Cost-Reducing over Time,
2100 ft2 Mixed Fuel Home, Base 2022 TDV ......................................................................B-10
Figure B-4: TDV Net Benefits Less Battery Costs (30-year NPV): Low Cost-Reducing over Time,
2100 ft2 Mixed Fuel Home, Base 2022 TDV ......................................................................B-11
Figure B-5: Cost Differences Between Residential, Commercial, and Utility-Scale Solar
Photovoltaic ...................................................................................................................B-13
Figure B-6: Unsubsidized Levelized Cost of Energy – Solar Photovoltaic Comparison .........B-14
LIST OF TABLES
Page
Table 1: Zero Net Energy Design and Energy Supply Options.................................................8
Table 2: Estimated Cost and Savings for Two Miscellaneous Electric Loads Options ............... 18
Table A-1: Description and Underlying Methodology of Time Dependent Valuation
Components ................................................................................................................... A-2
Table A-2: Updates to Base Case TDV Values for 2023–2052, Relative to Values Used for 2019
TDV Values ..................................................................................................................... A-5

x
Table A-3: Modified Assumptions in Higher Renewables Time Dependent Valuation Sensitivity
Case, Relative to Base Case ............................................................................................. A-7
Table A-4: Relevant Updates to 2019 Title 24 Envelope Prescriptive Requirements ............. A-9
Table A-5: Relevant Updates to 2019 Title 24 HVAC Prescriptive Requirements..................A-10
Table A-6: Relevant Updates to 2019 Title 24 Water Heating Prescriptive Requirements.....A-11
Table A-7: Relevant Updates to 2019 Title 24 Prescriptive Requirements for
Other Features...............................................................................................................A-12
Table A-8: Envelope Options for Zero Net Energy Homes .................................................A-13
Table A-9: Heating, Ventilation, and Air Conditioning Options for Zero Net Energy Homes .A-16
Table A-10: Hot Water Options for ZNE Homes ................................................................A-17
Table A-11: Other Options for ZNE Homes.......................................................................A-17
Table A-12: Summary of BEopt Inputs for MELs Options Considered for ZNE Homes ..........A-20
Table B-1: Single-family 2,100 ft2 all-electric and mixed-fuel homes lifecycle cost savings and
increased initial construction cost ..................................................................................... B-1
Table B-2: Multi-family 8unit all-electric and mixed-fuel building lifecycle cost savings per unit
and increased initial construction cost per unit for cost-minimum design compared to Title 24
2019 baseline, using 2022 TDV values and avoided cost for solar PV exports ...................... B-1
Table B-3: Measure package for the most cost-effective single-family 2100 ft2 all-electric
homes ............................................................................................................................ B-1
Table B-4: Measure package for the most cost-effective single-family 2100 ft2 mixed-fuel
homes ............................................................................................................................ B-3
Table B-5: Measure package for the most cost-effective single-family 2700 ft2 all-electric
homes ............................................................................................................................ B-6
Table B-6: Measure package for the most cost-effective single-family 2700 ft2 mixed-fuel
homes ............................................................................................................................ B-6
Table B-7: Measure package for the most cost-effective multi-family 8-unit all-electric
building .......................................................................................................................... B-7
Table B-8: Measure package for the most cost-effective multi-family 8-unit mixed-fuel
building .......................................................................................................................... B-8
Table B-9: Estimated Gas Demand from New Residential Construction in California, 2017 ..B-12
Table B-10: Natural gas consumption in California, 2016 (MMcf) .......................................B-13

1
EXECUTIVE SUMMARY
Introduction California is a pre-eminent testing ground for low-cost and low-greenhouse gas (GHG) energy
strategies for a decarbonized economy. The state has aggressive economywide GHG reduction
goals for 2030, 2045, and 2050 with a 40 percent reduction target for 2030 from the 1990
level and an 80 percent reduction goal in 2050. More recently, the state set the target of zero
GHG emissions from the electricity sector by 2045, and then-Governor Edmund G. Brown, Jr.
announced a goal of net zero carbon emissions statewide by 2045.
In the building sector, California passed legislation in 2018 specifically targeting GHG
emissions reduction from building heating. California also requires the reduction of high global
warming potential refrigerants in the state by 40 percent below 2013 levels by 2030. For new
homes, the state set a policy goal of zero net energy new homes by 2020 and zero net energy
new commercial buildings by 2030. California’s Title 24 Energy Code (Title 24) has become
successively more stringent over time with greater accommodation for electric appliances, and
for the first time, 2019 Title 24 building code has a prescriptive requirement that all new
homes have rooftop solar photovoltaic.
Project Purpose California’s GHG emissions reduction goals and the overarching goal of decarbonizing the
state’s entire economy, and the building sector, necessitate that new buildings have emissions
as close to zero as possible and are cost effective to build. This report examines the most cost-
effective options for achieving zero net energy homes for future building code cycles that will
support California's GHG reduction goals.
In a future with zero to near-zero electricity sector emissions, lower carbon dioxide emissions
can be achieved with all-electric homes compared to mixed-fuel homes (that is, homes with
appliances that are supplied by both conventional natural gas and electricity). The falling
prices of rooftop solar photovoltaic and battery storage and the increasing availability of supply
options such as community solar and renewable natural gas will affect zero net energy new
home cost-effectiveness and must be considered in plans for achieving state emissions
reduction goals.
This study explores the following questions with the goal of informing future state building
codes and standards:
1. What is the cost-effectiveness of all-electric homes compared to mixed-fuel homes,
considering anticipated policy revisions for rooftop solar compensation and updates to
key inputs in cost-effectiveness methods?
2. What are the viability and policy considerations and/or barriers for community
renewable energy supply sources (community solar and renewable natural gas)?
3. What are the benefits and cost impacts of battery storage and precooling?
4. What are the policy implications of these research findings?

2
Project Approach The approach of this work included: (1) conducting an expert elicitation process among key
stakeholders such as builders and utility contacts (expert elicitation refers to formal procedures
for obtaining and combining expert judgments and is not a simple survey instrument); (2)
using the National Renewable Energy Laboratory Building Energy Optimization software tool,
BEopt, for building energy modeling and cost optimization; (3) providing technoeconomic
analysis and policy considerations for community renewables; and (4) performing a detailed
sensitivity study for battery storage and precooling impacts as a function of battery storage
cost, battery controllability, and precooling control schedules. Since building modeling results
are targeted for the 2022 code cycle, lower compensation rates are assumed for exported
electricity from solar photovoltaic (“avoided cost for exports”) in anticipation of further
evolution of net energy metering policy for rooftop solar.
Building energy modeling is based on three prototype buildings used by the California Energy
Commission (CEC): two single-family homes and one multi-family building. Optimized building
designs are generated using BEopt, which uses the EnergyPlus simulation engine. BEopt
calculates the life-cycle cost of building energy efficiency measures including capital and
operating costs. Key inputs include the set of candidate energy efficiency measures, building
measure costs, utility rates, rooftop photovoltaic capital costs, fixed charges, and net
photovoltaic compensation rates.
The time-dependent value-based time-of-use rate approach is most consistent with the state’s
current codes and standards rulemaking process. Time dependent values for electricity and
natural gas are based on the concept that the value of a unit of energy consumed or energy
generated varies depending on the time of day and the season of the year. However, the CEC
is evaluating cost-effectiveness options for the 2022 code cycle that are based on source-
energy and/or that provide more direct weighting to reductions in GHG emissions. In this
work, the researchers computed and used newly derived time dependent valuation values for
2022 for the cost-effectiveness analysis since alternative cost-effectiveness metrics and
methods were not available.
Policy analysis for community solar and renewable natural gas supply options included an
assessment of current and future policies for community solar and renewable natural gas, an
assessment of future available supply and costs, and competing demands for renewable
natural gas.
Scenarios for battery storage included future battery costs and the degree of controllability of
battery operation. Precooling effects are provided as a function of precooling set-point
temperature schedules.
Project Results The project resulted in several key findings summarized here, described in more detail in
Chapter 5, and include results on all-electric and mixed-fuel new homes costs; community
renewables; battery storage; precooling; and policy implications. Key input assumptions that
differ from current assumptions for 2019 Title 24 homes include the use of updated time-
dependent values for 2022 and the assumption of avoided cost for exports for rooftop solar

3
photovoltaic compensation rather than the more favorable net energy metering 2.0
compensation. Some key findings include:
• New all-electric homes with cost-optimized designs have lower costs on a 30-year life-cycle
cost basis than 2019 Title 24–compliant all-electric reference homes for all climate zones;
similarly, cost-optimized designs for mixed-fuel new homes have lower life-cycle costs than
2019 Title 24–compliant mixed-fuel reference homes in all climate zones.
• New all-electric homes with cost-optimized designs are comparable to cost-optimized mixed
fuel homes on a life-cycle cost basis across most climate zones and have significantly lower
carbon dioxide emissions. All-electric home costs can benefit from reduced infrastructure
costs for gas lines.
• Community solar — systems where electricity production is shared by more than one
household — present an alternative zero net energy pathway with the potential for lower
cost to Californians compared to onsite rooftop solar photovoltaics (PV). However, existing
community solar programs are not financially attractive to participants and do not
adequately satisfy CEC zero net energy compliance criteria. There is an important
opportunity for the development of new community solar programs that are cost-effective
for participants, improve non-participant impacts relative to the status quo, and satisfy CEC
zero net energy compliance criteria.
• Using renewable natural gas for zero net energy compliance presents significant challenges
in cost-effectiveness, competing demands in hard-to-decarbonize sectors (industry,
trucking), and supply uncertainties.
• For residential storage to contribute to the state’s zero net energy goals and be cost-
effective to the participant, storage control algorithms must consistently and reliably
respond to price signals that are more closely aligned with time-dependent values than
current time-of-use rates and with less favorable net energy metering compensation for
grid exports than the current net energy metering 2.0 policy.
• An optimized precooling schedule that dynamically chooses a setpoint schedule each day to
minimize time dependent valuation costs (hourly net load multiplied by time-dependent
values) often uses more kilowatt-hours (kWh) than the base case setpoint schedule.
• An optimized precooling schedule could save up to 26 percent of net time dependent
valuation by shifting electricity consumption from high-cost evening peak periods to lower
cost afternoon hours and reducing the amount of power that is exported to the grid at low
avoided cost compensation.
• The research team finds that a single setpoint schedule for all days that is customized by
climate zone could provide much of the precooling cost savings provided by an optimized
schedule, while being simpler to implement and not requiring forecasting.
Policy Implications
• All-electric homes are attractive for their lower overall carbon dioxide emissions than
mixed-fuel homes and are cost effective for all climate zones compared to all-electric 2019
Title 24 compliant homes.
• With tighter building shells and energy-efficient lighting, energy-efficient large appliances
(clothes dryers and washers, dishwashers, refrigerators, cooktop stoves, and ovens) and

4
plug loads (miscellaneous electric loads) are increasingly important for life-cycle energy
costs.
• With the intent to provide more viable community solar zero net energy compliance
options, the research team provides two potential designs including a ratepayer-funded
green tariff and an upfront green tariff.
• Storage systems optimized to maximize net time dependent valuation benefits are often
smaller than the current Title 24 minimum size of 5 kWh and common commercially
available sizes like the 13.5 kWh Tesla Powerwall.
• Several policy elements are needed to realize the savings from precooling in new
residential construction: the installation of occupant controlled smart thermostats in new
construction; sufficiently time-differentiated price signals to customers or to aggregators to
encourage customers to pre-cool; and greater customer education efforts to communicate
the financial and comfort benefits of precooling and reiterate customer control and opt-out
options.
Technology/Knowledge Transfer/Market Adoption (Advancing the Research to Market) The research team is transferring the knowledge produced through this study in several ways.
First, this report discusses the methods and results in detail. Second, the team presented the
project results in a panel at the 2018 American Council for an Energy-Efficient Economy
Summer Session, “Net Zero: Moving Beyond 1 Percent of Homes,” in Pacific Grove, California.
The conference provided an opportunity for stakeholders to meet and discuss the effects of
electrification on cost-effectiveness of zero net energy homes, provide feedback on technical
inputs of this work, and learn about best-practice implementations for all-electric, zero net
energy and “zero energy-ready” homes, or those that are at least 40 percent to 50 percent
more energy efficient than a typical new home. Lawrence Berkeley National Laboratory will
present the project results in various stakeholder meetings, including the American Society of
Heating, Refrigerating and Air-Conditioning Engineers 2020 Building Performance Analysis
Conference & SimBuild in Chicago, both in August 2020.
Technical advisory committee members — stakeholders from utilities, government agencies,
and academia — helped to develop assumptions and review results during development and in
final form. The committee’s participation ensured that they understood the benefits of this
work and can use the results to direct future programs and studies.
Finally, Lawrence Berkeley National Laboratory anticipates publishing the results of this
analysis in a journal publication in 2021.
Benefits to California This research is important to ratepayers because it provides cost-effective zero net energy
designs for all-electric and mixed-fuel homes and identifies the conditions under which battery
storage and precooling options can be cost-effective. All-electric designs, if adopted by
contractors, architects, building owners, residents, and property owners, can lower annual
energy costs and realize an average of 38 percent annual carbon dioxide savings compared to
mixed-fuel family homes. All-electric homes with onsite solar or community solar agreements

5
could insulate consumers from future volatility in natural gas prices and increasing electricity
prices from the grid.
Increasing the adoption of all-electric zero net energy homes across California will improve the
health and safety of ratepayers by reducing criteria pollutants from natural gas combustion.
Reduction of natural gas consumption by broader adoption of alternatives such as electrically
powered heat pump-based water heating and space heating, will improve consumer and
neighborhood safety by reducing natural gas distribution, possible leakage, and combustion for
onsite heat generation.
Transitioning to zero net energy all-electric new single-family and multi-family homes by 2023
would result in more than 50 metric tons of carbon dioxide cumulative savings from 2023–
2050, with about 0.62 billion therms of natural gas savings in 2050, resulting in 3.3 million
metric tons net carbon dioxide savings in 2050. These calculations assume 4.9 million new all-
electric zero net energy homes from 2023 to 2050, or about 175,000 homes per year, and
corresponds to about 127 therms per year of natural gas savings and about 0.67 metric tons
of carbon dioxide savings per year per home.
All-electric homes with onsite solar PV coupled with electricity storage offer the potential for
greater ratepayer resiliency, fewer power outages, and reduced potential hazards associated
with power outages. For example, ratepayers can still receive air conditioning service during a
heat wave-induced power outage. As “distributed heating” technologies (onsite photovoltaic
systems and heat pump heating) become more prevalent, consumers would rely less on the
natural gas system and the electricity grid.
This research also sets the groundwork for the future Title 24 building cycle with new time
dependent valuations for 2022 and a “high renewables” time dependent valuation case with a
lower GHG target in 2030 of 30 million tonnes of carbon dioxide electricity in the electricity
sector, new zero net energy building designs, and new battery storage and precooling cases.

6
7
CHAPTER 1: Introduction
California is a pre-eminent testing ground for low-cost and low-greenhouse gas (GHG) energy
strategies for a decarbonized economy. The state has aggressive economy-wide GHG
reduction goals for 2030 and 2045 with a 40 percent reduction target for 2030 from the 1990
level (Senate Bill 32, Pavley, Chapter 249, Statutes of 2016) and an 80 percent reduction goal
in 2050 (Executive Order S-3-05, 2005). More recently, the state set the target of zero GHG
emissions from the electricity sector by 2045 (Senate Bill 100, De León, Chapter 312, Statutes
of 2018) and then-Governor Edmund G. Brown, Jr. announced a goal of net zero carbon
emissions statewide by 2045 (Executive Order B-55-18, 2018). In the building sector,
California passed legislation in 2018, specifically targeting GHG emissions reduction from
building heating (Assembly Bill 3232, Friedman, Chapter 373, Statutes of 2018). California also
requires the reduction of high global warming potential refrigerants in the state by 40 percent
below 2013 levels by 2030 (Senate Bill 1383, Lara, Chapter 395, Statutes of 2016). For new
homes, the state has the policy goal of zero net energy new homes by 2020 (California Energy
Commission and California Public Utilities Commission 2015) and zero net energy new
commercial buildings by 2030. Title 24 building codes have become successively more
stringent with greater accommodation for electric appliances, and for the first time, 2019 Title
24 building code has a prescriptive requirement for all new homes to have rooftop solar
photovoltaic (PV).
Zero Net-Energy Definition Zero net energy (ZNE) buildings have various definitions and may be based onsite or source
energy (United States Department of Energy [USDOE] 2015). The California definition for ZNE,
“TDV-ZNE,” is based on time dependent valuation (TDV) factors (State of California 2016):
“Based on the unit of a single project, a ZNE building is one in which the value of the
energy produced by onsite renewable energy resources is equal to the value of the
energy consumed annually by the building measured using the time dependent
valuation (TDV) metric.”
TDV values for electricity can shift the value of onsite renewable energy such as rooftop solar
PV. TDV values are also expected to change as the mix of electricity supply changes over time.
In particular, as more solar PV is brought online per the SB 100 target for high levels of
renewable electricity, the value of electricity generation at midday is reduced. The TDV
method also results in extreme hourly spikes in electricity valuation that may not be reflected
in utility prices.
ZNE Design and Energy Supply Options Table 1 shows ZNE design and energy supply options. The first row shows that ZNE homes
can be built as “mixed-fuel” consisting of a mix of natural gas-fired and electricity powered
appliances or as all-electric homes. Mixed-fuel homes have historically been the most common

8
type of new home and typically use gas1 for heating applications such as space heating, water
heating, and cooking (stoves). All-electric homes use electricity for heating, cooling, cooking,
drying, and other purposes and typically do not include a gas line to the home.
Table 1: Zero Net Energy Design and Energy Supply Options
Mixed-Fuel
(Gas & Electric Home)
All-Electric Home (Electricity for heating,
air conditioning, cooking, drying, etc.)
Onsite Solar PV Natural Gas + Rooftop PV All-Electric + Rooftop PV
Community Renewables Renewable Natural Gas +
Rooftop PV
All-Electric + Community
Solar
Table 1 shows a comparison of ZNE design and energy supply options for mixed-fuel and all-electric
homes.
Source: Lawrence Berkeley National Laboratory
The first column of Table 1 shows energy supply options for ZNE homes. Both mixed-fuel and
all-electric homes can have onsite rooftop solar PV, while “community renewables” refers to
two specific energy supply options: (1) renewable natural gas (RNG) together with rooftop PV;
and (2) community solar, or “shared solar,” in the case of all-electric homes. RNG refers to
methane-derived emissions (CH4) primarily from landfills, municipal solid waste (MSW),
wastewater plants, and dairy operations. Community solar refers to a solar PV installation at a
site near but separate from the site of the home, a portion of whose output is associated with
one residential home. Technology options thus are limited to “in-paradigm” or conventional
options and do not include options such as combined heat and power (CHP), distributed
heating, hydronic heating, or synthetic natural gas (SNG) derived from hydrogen and carbon
dioxide (CO2).
New ZNE homes from 2015 onward are expected to make up about 32 percent of housing
stock by 2050 (M. Wei et al. 2019) and from 10 to 28 percent of the natural gas demand and
about 28 percent of the electricity demand2 in 2050. Though new housing starts were only
130,000 per year in 2018 compared to nearly 14 million housing units,3 they are projected to
increase by about 10 percent per year the next few years.4
1 “Gas,” as referred to here, and in the context of ZNE new homes, refers to natural gas. The report uses this
nomenclature for simplicity.
2 The fraction of new ZNE home energy demand versus total residential demand in 2050 is dependent on several
factors including the rate of retrofits and the rate of electrification in new and existing homes. The ranges given here are for scenarios with high electrification and no electrification and with almost all existing homes retrofitted by 2050.
3 https://factfinder.census.gov/faces/nav/jsf/pages/community_facts.xhtml?src=bkmk, accessed December 31, 2018
4 Los Angeles Times article: http Scope: SF, MF, 15 California climate zoness://www.latimes.com/projects/la-
pol-ca-next-california-economy/

9
Grid Harmonization As more solar PV is added to the grid from both centralized solar, concentrating solar thermal,
and rooftop PV, there is greater recognition of the need for “grid harmonization,” or the
concept that additional resources added to the grid should take into account the need to
maintain grid stability, reliability, and maximal use of grid resources. The well-documented
California net load curve, or “duck-curve” (Figure 1), is one important manifestation of the
issues arising from adding increasing amounts of intermittent renewable solar and wind
resources to the grid.
Figure 1: California Net Load Curve
Figure 1 shows the California average hourly net load curve, in megawatts, for 2014.
Source: California Independent Systems Operator 2014
“Net load” is defined as total system load minus generation from wind and solar. Figure 1
shows net load in 2012 and 2013 and projected net load in subsequent years. For increasing
amounts of solar generation with its diurnal shape of early afternoon peaking output, the duck
curve highlights four important problems:(1) over-generation during the early afternoon; (2)
high evening peak load; (3) sharp mid-morning down-ramps; and (4) substantial evening up-
ramps.
Current net energy metering (NEM) policy does not allow a rooftop solar PV whose annual
output exceeds site-level electricity demand in kilowatt-hours (kWh). For the duck curve,
several mitigations are pertinent in the case of ZNE homes with their increasing amounts of
solar PV: (1) flexible loads or demand shifting as in precooling a home or shifting electric

10
vehicle charging to better coincide with solar peak output times; and (2) energy storage, such
as battery storage or thermal storage to store electricity during peak daytime hours for use
later in the day.5
A greater role for energy storage is expected in the near term with anticipated cost reductions
in battery storage (Kittner et al, 2017 and Lazard, 2019). Similarly, precooling can facilitate
greater use of solar PV output by shifting cooling demand in the late afternoon or early
evening to earlier in the day. Thus, it is important to model potential benefits of energy
storage and precooling.
Key Research Questions This study explores the following key questions with the goal of informing future state building
codes and standards (for example, 2022 Title 24 building code):
1. What is the cost-effectiveness of all-electric homes compared to mixed-fuel homes,
considering anticipated future policy revisions for rooftop solar compensation and
updates to key inputs in cost-effective methods?
2. What are the viability and policy considerations and/or barriers for community
renewable energy supply sources (community solar and RNG)?
3. What are the benefits and cost effects of battery storage and precooling?
4. What are the policy implications of the resultant research findings?
Report Organization The remainder of this report is organized as follows: Chapter 2 describes the study approach;
Chapter 3 summarizes key findings; Chapter 4 discusses technology, knowledge, and market
transfer activities; and Chapter 5 discusses conclusions and areas for follow-up work. Several
appendices provide study assumptions and additional technical details.
5 Systemwide, a number of additional approaches can contribute to mitigation of these issues including
increasing regional coordination, renewable generation diversity, more flexible non-solar and non-solar generation resources, and use of over generated power for chemical storage, for example, power to gas or power to
hydrogen.

11
CHAPTER 2: Project Approach
Time Dependent Valuation Update for 2022 Currently, California Title 24 building codes and energy efficiency standards are developed
based upon the cost-effectiveness of energy efficiency measures in new buildings. The
standards promote measures that have a positive benefit-cost ratio from a modified participant
cost perspective. The project team is aware that the California Energy Commission (CEC) is
reviewing the use of this method, but this report uses the existing, cost-effectiveness-based
method. Given the likely changes to this method, the research team did not provide total
resource cost test results in this report.
Beginning with the 2005 standards update, TDV has been used in the cost-effectiveness
calculation for Title 24. The concept behind TDV is that energy efficiency measure savings
should be valued differently depending on the specific hours of the year in which the savings
occur, to better reflect the actual costs of energy to consumers, to the utility system, and to
society. While the details of the Title 24 TDV method can be complex, at its root the concept
of TDV is quite simple: it holds the total cost of energy constant at forecasted retail price
levels but gives more weight to on-peak hours and less weight to off-peak hours.
TDV is based on a series of annual hourly values for electricity cost (and monthly costs for
natural gas) in a given weather year.6 TDV values are developed for each of the 16 climate
zones.7 The key components of the electricity TDV factors include:
• Marginal Cost of Electricity – variable by hour – The shape of the hourly marginal cost
of generation is developed using the CEC’s PLEXOS production simulation dispatch
model (developed by Energy Exemplar). The price shape from the production simulation
model is then adjusted to reflect the natural gas price forecast as well as the following
non-energy costs of energy: transmission and distribution, emissions, ancillary services,
and peak capacity.
• Revenue Neutrality Adjustment – fixed cost per hour – The remaining, fixed
components of total annual utility costs that go into retail rates (taxes, metering, billing
costs, and so forth) are then calculated and spread over all hours of the year. The
result, when added to the hourly marginal cost of electricity, is an annual total
electricity cost valuation that corresponds to the total electricity revenue requirement of
the utilities.
For each climate zone, the marginal cost of electricity is calculated as the sum of seven
components (generation energy, system capacity, ancillary services, system losses,
6 In official updates, TDV values are matched to CEC-adopted typical weather year files for the 16 California
climate zones. Because this analysis required weather-correlated data for zones outside of California, these projected TDV values were matched to 2013 historical weather to ensure consistent conditions across the West.
7 Note that these use CTZ weather files used in the calculation of 2019 TDV values.

12
transmission and distribution capacity, CO2 emissions, and avoided renewable resources) each
of which is summarized in Table A1 in Appendix A. Each of these components are estimated
for each hour in a typical weather year and forecasted into the future for 30 years. The 30-
year present values of the forecasts are calculated with a 3% real discount rate
TDV are calculated in life cycle dollars per unit of energy for each hour and climate zone in
California. For the purposes of building code compliance, they are converted to units of
kBTU/kWh and kBTU/therm using fixed multipliers. This is done because of a long-standing
precedent of using ‘source energy’ factors in building code analysis, which is familiar with
many practitioners. In addition, conversion to energy units prevents confusion between a long-
term estimate of consumer bill savings based on a California average over 30 years and
specific customer bill savings in a specific year and location.
Updates for 2022 Base Time dependent valuation
For this project, the research team calculated two sets of TDV values for the 2022–2052
period:
1) A “Base Case” set, which approximates energy costs under currently adopted policies
(including 50 percent renewable portfolio standard by 2030) and the CEC’s 2017
Integrated Energy Policy Report (IEPR) mid-demand case forecasts
2) A “Higher Renewables” set, which uses the California Public Utilities Commission (CPUC)
Integrated Resource Plan (IRP) 30 million metric tons (30MMT) by 2030 case, resulting
in a California Independent System Operator (California ISO) generation portfolio
corresponding to a nearly 70 percent renewable portfolio standard (RPS).
Figure 2 and Figure 3 show hourly 2022 TDV values under the two cases, averaged across the
full year. In both cases, the peak hour shifts slightly later than the TDV values used in the
CEC’s 2019 Title 24 Building Code cycle, with lower energy costs in the middle of the day and
a higher overall peak. The Higher Renewables case shows higher average TDV values in each
hour, due primarily to higher RPS and capacity values (and despite lower energy costs in the
middle of the day during higher solar production). Appendix A provides additional detail on
these cases.

13
Figure 2: Average Day Base Case 2022 Time dependent valuation Components, Climate Zone 12
Figure shows the base case 2022 TDV components across an average day in climate zone 12. The total
2022 TDV is the sum of all components in each hour.
Source: Lawrence Berkeley National Laboratory
Figure 3: Average Day Higher Renewables 2022 Time dependent valuation, Components Climate Zone 12
Figure shows the higher renewables scenario 2022 TDV components across an average day in climate
zone 12.
Source: Lawrence Berkeley National Laboratory
0
2
4
6
8
10
12
1 2 3 4 5 6 7 8 9 10 11 12 13 14 15 16 17 18 19 20 21 22 23 24
$/k
Wh
30
-ye
ar P
rese
nt
Val
ue
Hour
T&D
Capacity
RPS Adder
Emissions
Ancillary Services
Losses
Energy
Retail Adjustment
2019 TDV
2016 TDV
0
2
4
6
8
10
12
1 2 3 4 5 6 7 8 9 10 11 12 13 14 15 16 17 18 19 20 21 22 23 24
$/k
Wh
30
-ye
ar P
rese
nt
Val
ue
Hour
T&D
Capacity
RPS Adder
Emissions
Ancillary Services
Losses
Energy
Retail Adjustment
2019 TDV
2022 Base
TDV

14
Energy Modeling Approach
BEopt Modeling Tool
The residential building energy modeling uses BEopt. BEopt provides capabilities to evaluate
residential building designs and identify cost-optimal efficiency packages for whole-house
energy savings along the path to ZNE. BEopt offers energy performance simulation of the
single energy efficiency design, parametric runs, and cost-based optimizations for both new
construction and existing home retrofits of single-family and multi-family buildings. BEopt
provides energy performance analysis based on the residential building characteristics, such as
architecture; heating, ventilating, and air conditioning (HVAC) systems; appliances; and
occupancy-related operations, reflecting climates and tariffs. The National Renewable Energy
Laboratory (NREL) developed BEopt; its underlying simulation engine uses the U.S. DOE’s
EnergyPlus. The use of BEopt tool for energy analysis is described in detail in an earlier
Navigant report (Navigant Consulting Inc 2015).
Residential Prototype Energy Models
Building energy modeling is based upon three prototype residential buildings shown in Figure
4: two single-family homes and one multi-family building.8 These prototype models were
developed by the CEC for testing of the Alternative Calculation Method with the compliance
CBECC-Res software (CEC 2015).
Figure 4: Prototype Buildings for Modeling in BEopt
Figure shows the three prototype buildings used for energy modeling in this study.
Source: Lawrence Berkeley National Laboratory
Modeling Assumptions
BEopt calculates the annualized energy-related life-cycle-cost of the building design with
efficiency measure packages. The energy-related cost includes the measure cost, utility costs,
and replacement costs.
Key inputs include the set of energy conservation measures, measure costs, and rooftop PV
capital costs, fixed charges, and net PV compensation rates. Input cost assumptions are a key
aspect of ZNE homes. For this work, costs are primarily based on NREL’s National Residential
Efficiency Measures Database (NREL, 2018b) supplemented by additional sources including
expert elicitation inputs. For this study, utility rate inputs use TDV-based time of use (TOU)
electricity rates as a proxy for future utility rates. Note that a fixed annual rate was used for
8 The research team also developed a prototype 18-unit multi-family building but run-times in BEopt were
untenably long and more critically, unstable, and the decision was made to drop this case.

15
natural gas rates (average TDV-based rate) since BEopt does not allow seasonally varying
natural gas rates.
The BEopt tool finds optimal measure packages using TDV-based life-cycle energy costs. The
research team finds that the TDV-based hourly utility rate approach is the most consistent with
the state’s current codes and standards rulemaking process, although the CEC is evaluating
cost-effectiveness options for the 2022 code cycle that may be based on source-energy and/or
provide more direct weighting to GHG emissions reductions. The TDV utility rate is based on
the projected 2022 TDV values, which provides 8760-hour utility rates. Solar PV electricity
generation surplus power compensation rates use 2017 avoided cost for export (ACE) rates
using the following retail rate adjustments by investor-owned utility in dollars per kilowatt-hour
($/kWh): Pacific Gas and Electric (PG&E) at $0.131/kWh; San Diego Gas and Electric (SDG&E)
at $0.118/kWh; and Southern California Edison (SCE) at $0.131/kWh (CPUC 2018) to reflect
NEM policy evolution of less favorable rooftop PV compensation. Hourly CO2 emission factors
are derived by the Energy and Environmental Economics Inc. (E3) team, using the emission
rates methodology from the 2019 TDV update.9
Annualized energy-related costs are the annualized energy related cash flows, which include
full annualized utility bills plus annualized capital cost values over 30 years for the improved
cost case, subtracted from the costs for the reference case (Title 24 energy efficiency
prescriptive case with PV). Cash flows consist of equipment capital costs, installation costs,
replacement costs, utility bill payments, and residual values. Key assumptions include the
following: inflation 2.4 percent, discount rate 3 percent, energy escalation 0 percent, and no
tax credit of capital cost for PV incentives. Community solar costs, bio-methane supply curves,
and natural gas demand projections are based on the literature (Jaffe 2016) and draw upon
other studies by research team member E3 (Energy and Environmental Economics Inc. 2018).
Title 24 Measures and ZNE Measures Promising efficiency measures for both single-family and multi-family homes were identified
for each California climate zone, along with realistic estimates of the installed cost of each
measure. An initial screening was performed by Frontier Energy to develop a manageable set
of candidate measures that could be included in a more formal optimization process. Measures
with a lower cost per TDV savings than PVs using CBECC-Res were prioritized in the measure
selection process. The final pre-screened measures and costs were used as inputs to the
BEopt models that predicted optimal pathways to ZNE in a variety of contexts.
Approximately 22 measures were considered but ultimately rejected for the final optimization
process for one of the following reasons:
• Low energy savings relative to cost based on the team’s experience
9 Hourly systemwide average natural gas heat rates for each year (MMBtu/MWh) are multiplied by the carbon
content of natural gas (tons/MMBtu) to produce hourly emissions rates for grid electricity (tons CO2/MWh), not
yet accounting for RPS energy. For each year, this set of hourly emissions rates are weighted by a unitized renewable generation shape and multiplied by that year’s RPS percentage target to produce the average rate of avoided CO2/MWh from RPS. For each year, this average rate of avoided CO2/MWh from RPS is subtracted from
the initial hourly rates, which results in the final hourly CO2 emission rates of grid electricity.

16
• Highly uncertain technical performance or cost
• Impossible to model accurately in BEopt
• Redundancy (for example, R-40 insulation when R-38 and R-42 are included)
The baseline for all energy simulations was the prescriptive requirements of the 2019 update
to Title 24, Part 6. Energy savings and cost impacts for ZNE measures were analyzed relative
to this baseline. Because the measure selection process for this project occurred in parallel to
the Title 24 rulemaking process, the research team encountered some challenges keeping the
baseline up to date. In some cases, new options in BEopt were necessary to match the specific
requirements of Title 24, but BEopt provides sufficient flexibility to simulate nearly all code
requirements accurately. Some of the ZNE measures were more challenging to model in
BEopt, especially in the context of large multi-family buildings with centralized systems. Similar
difficulties were encountered when developing cost models for some of the newer technologies
on the path to ZNE. The following sections discuss the technical and cost details of the
baseline and ZNE measures considered for this project. Battery storage and precooling were
not modeled in BEopt but were separate analysis modules that were characterized after cost-
optimal building designs were generated by BEopt.
2019 Title 24 Updates
Several updates were made to the Title 24 Part 6 prescriptive requirements during the 2019
code change cycle. The updates relevant to the simulations performed for this study are
summarized by end-use category in Tables A-4 through A-7 in Appendix A. Final changes to the
2019 alternative calculation method were not available prior to the modeling phase of this
project and are not necessarily reflected in the results.
ZNE Measures
A broad range of energy efficiency measures was included as options for achieving ZNE. The
performance characteristics and incremental cost assumptions are summarized in Tables A-8
through A-11 in Appendix A. All incremental costs are relative to the corresponding
prescriptive requirements of the 2019 update to Title 24, as specified earlier in Tables A-4
through A-7 in Appendix A.
Several viable options were not included in the final BEopt analysis for various reasons as
described in Appendix A: mini-split heat pumps in single-family homes; slab insulation and
central heat pump water heaters (HPWH) and solar hot water for multi-family buildings.
Limitations of BEopt energy modeling for these measures are discussed in Appendix A

17
Miscellaneous Electric Loads
One of the most challenging end uses to address in new construction is miscellaneous electric
loads (MELs). MELs constitute about 2000 kWh per year in a typical home, with about 13
percent growth projected by 2030 (Energy Information Administration 2015). Standby loads,
which comprise about 25 percent of the MELs end use (U.S. DOE 2011a), are often targeted
for energy efficiency improvements because they contribute limited value to homeowners.
LBNL has estimated that 30 percent of standby loads can be eliminated through optimal
occupant behavior (LBNL 2019). There is also room for improvement when MELs are in active
mode but not in use, such as when a television is left on in another room. Convenient methods
for homeowners to easily or automatically turn off electronic devices that are not in use can
have a significant impact on MEL energy, but there can be a trade-off with occupant
satisfaction if such controls react improperly.
MELs have not generated much attention in California building energy codes because builders
have limited ability to control them. California Title 20 appliance standards and the Energy Star
program have made significant progress improving the efficiency of specific product
categories, but technology changes so rapidly that it is difficult for regulatory and certification
programs to keep pace. Despite the challenges, a few promising energy efficiency measures
are available for addressing MELs using smart controls and other technologies.
The research team identified two viable market-ready MELs reduction measures that appear to
have the potential for both significant energy savings and strong market acceptance:
1. Tier 2 advanced power strips with infrared and occupancy sensor. A Tier 2
advanced power strip with occupancy sensor turns off devices based on total power
fluctuations (constant power indicates standby mode) for all connected devices if the
room is unoccupied. Devices are also shut down if there is a lack of remote-control
activity, again when the room is unoccupied, which saves active mode energy.
2. Optimal occupant behavior, smart plugs with smartphone. Smart plugs or
sockets with energy monitoring can be used with smartphones and/or voice recognition
systems. This technology makes it much more convenient for occupants to identify
individual MELs that are high energy users at any given time and turn them off through
voice commands or remotely using a smartphone.
Several emerging technologies for reducing MELs were investigated, but despite promising
savings projections, were deemed to be insufficiently developed or unproven in occupied
homes:
• Direct current (DC) networks for better compatibility with PV, battery charging (15 percent
MELs savings achievable today, 25 – 50 percent at maturity)
• Low energy ground-fault circuit interrupters (GFCI) (25 percent of GFCI power)
• Efficient security systems (2 percent of security system power)
• Low standby remote-control systems (5 percent savings, presumably for relevant systems)
• Variable power wi-fi (25 – 50 percent savings for wi-fi)
• Power management user interface (5 percent of MELs)
• Mobile design practices applied to other plug loads (10 percent of MELs)

18
• ZNE-ready plug loads (2 percent of MELs)
• Gaming system efficiency (1 percent of MELs)
• Wide bandgap power supplies (1 percent of MELs)
• Energy savings and cost estimates are shown in Table 2 for the two near-term measures.
Additional details and BEopt inputs for the measures are included in Table A-12
Appendix A. The emerging technology measures just listed were not included in the
optimization process because cost is impossible to predict with confidence.
Table 2: Estimated Cost and Savings for Two Miscellaneous Electric Loads Options
Measure First Cost
Percent Reduction in MELs
Annual Electricity Savings
Advanced Power Strips with
Occupancy Sensor (2)
$126 6 percent 134 kWh
Smart Plugs (10), Smart Phones, Voice Recognition
$420 16 percent 358 kWh
Source: Lawrence Berkeley National Laboratory
Storage Analysis Approach
Battery Storage
The research team assessed (a) the optimal size of residential battery storage systems and (b)
the cost-effectiveness to the participant (the party that purchases the storage). Both outcomes
were analyzed using the CEC’s existing TDV method for two future sets of TDV values: the
“Base 2022” case and “Higher Renewables” case (as previously described) for the years 2023
– 2052.
Electricity retail rate structures are uncertain over the 30-year time frame used in the CEC’s
Title 24 analyses, so TDV values are used to capture the theoretical costs of energy to the
homeowner, assuming rates are designed to capture these costs and as in the BEopt building
modeling.
The research team’s analysis was run assuming:
• Each residential battery storage system can only charge from a rooftop PV system, and
that PV system is sized to offset the building’s electricity annual load. This is consistent
with requirements for receiving Title 24 compliance credit, as well as California’s NEM and
Self-Generation Incentive Program (SGIP) rules.
• Battery storage systems have a two-hour duration, that is, system capacity in kilowatt-
hours equal to the rated electrical power in kilowatts (kW) multiplied by two.
• Any exports from solar PV and battery storage to the grid are compensated at avoided
system cost, that is, the TDV values without the retail rate adder.
In addition to these assumptions, the research team ran:
• Two home sizes: 2,100 and 2,700 square-foot (ft2) single-family homes. Homes modeled
were with the input home designs taken at the cost minimum of BEopt output. This design
point typically falls short of TDV-ZNE for both all-electric and mixed-fuel homes, and the

19
battery storage analysis can be viewed as a post-processing analysis to study the extent to
which battery storage can be added to produce net benefits and the degree to which TDV-
ZNE can be achieved with the addition of battery storage. Note that this is a two-step
process in this case and is not a global optimization of energy efficiency measures, rooftop
PV size, and battery storage since battery storage is not a modeled measure in BEopt.
• Five battery use cases, intended to capture response to less sophisticated price signals
(details in Appendix A):
o Optimized Dispatch, which assumes that each battery is dispatched to maximize
TDV values in each hour of each year, with perfect foresight
o Shuffled Dispatch, which assumes that each battery dispatches against hourly
TDV values from a similar day (approximating forecast error), by “shuffling” days
of TDV values among other days that share the same day of the week and
month, i.e., random reassignment of TDV days within the same month and day
of the week.
o TOU Dispatch, under which batteries are assumed to dispatch in response to on-
peak and off-peak TOU periods
o Basic Dispatch, under which batteries are assumed to charge on solar PV net
exports and discharge when load again exceeds PV production
o Backup Dispatch, which assumes that batteries are only used to provide backup
power. According to reports from Itron, Inc. and E3 evaluating California’s SGIP,
this was the most common use case for residential battery storage as of the end
of 201710
• Three battery storage cost trajectories, to capture the significant uncertainty in future
storage prices:
o An “Average Cost, with No Reduction” case, which assumes costs cited in
Lazard’s “Levelized Cost of Storage Analysis – Version 5.0” (Lazard 2019) for
systems installed in 2023 and does not assume any reduction in battery storage
costs when systems are replaced in 2043
o An “Average Cost, Reducing Over Time” case, which begins with the same costs
as the Average Cost, with No Reduction case, but assumes 2023 and 2043 costs
are 64 percent and 47 percent of 2018 costs, respectively11
o A “Low Cost, Reducing Over Time” case, which uses recent Tesla Powerwall 2.0
installed costs collected by LBNL and assumes the same percentage cost
reduction as the “Average Cost, Reducing Over Time” case
• Two use case sensitivities with current TOU rates, to approximate how battery storage
would optimally dispatch and be compensated under existing 4:00 to 9:00 p.m. TOU rates
of the investor-owned utility that corresponds to each climate zone (CZ):
10 See “Self Generation Incentive Program Reports,” http://www.cpuc.ca.gov/general.aspx?id=7890.
11 Based on a forthcoming journal paper by Amol Phadke, et al. of LBNL.

20
o Current TOU rate under NEM 2.0, which reflects current policy, compensating
grid exports from PV or battery storage at the retail rate less non-bypassable
charges
o Current TOU rate under ACE, which reflects the anticipated trend in grid export
compensation policy, compensating grid exports at the average avoided cost for
each TOU period
Battery Storage Sizing
While rooftop PV has an established sizing convention of installing a capacity that will offset
the building’s annual load, residential battery storage does not have such a well-defined rule of
thumb. The best battery size for a given household depends on many factors, including
desired and/or achievable battery control or dispatch behavior, building load, and market
availability. Current guidance on battery sizing in the 2019 Title 24 Residential Compliance
Manual requires batteries be at least 5 kWh to be eligible for compliance credit. It also
requires batteries to operate under one of three control strategies, which are designed to
provide cost savings to the grid and customer to varying degrees. No upper limit on sizing is
specified in Title 24, but in practice, the size is limited by diminishing marginal net benefits, as
costs continue to increase while additional benefits begin to decline as battery size increases.
Because this analysis views battery storage through the lens of Title 24 cost-effectiveness,
each battery case is optimally sized to maximize net benefits to the homeowner, subject to the
parameters of that case. That is, the battery’s charging and discharging are valued with TDV
values to calculate the battery’s net present value (NPV) benefits, and the upfront and ongoing
costs of purchasing and maintaining a battery for 30 years are subtracted from these benefits
to arrive at the system’s net benefits. Net benefits are calculated for a range of battery
capacities (minimum 2 kWh), and the size that yields the highest net benefits is selected as
the optimal size.12
An alternative method of sizing battery storage to meet TDV-ZNE was analyzed as a
sensitivity. This method increases battery storage size under different use cases until the
annual electricity TDV value produced by the PV and battery storage arbitrage zeroes out the
TDV value of the building’s annual electric load.
Precooling Analysis Approach The team ran an analysis on precooling methods. The analysis was designed to capture the
cost-effectiveness to the participant, using TDV values, of different cooling strategies that can
be used to ensure the indoor temperature does not exceed a maximum comfort threshold of
78°F(26°C), which is an industry standard threshold, currently used in the CEC’s Title 24
residential building simulation software CBECC Res.
The research team modeled three thermostat setpoint schedules:
12 For example, consider the following case: 2,100 ft2 mixed-fuel home in CZ 10 under Base 2022 TDV values, operating with Optimized Dispatch in the Average Cost – Reducing over Time battery cost scenario. This battery maximizes its net benefits at a 9.5 kWh size, so the net benefits provided by a 9.5 kWh battery operating under
these conditions is are shown for this case.

21
1. Base: The thermostat is dispatched such that the home’s temperature is permitted to
rise above the 78°F (26°C) comfort threshold when the building is unoccupied. This
matches the base setting in CBECC Res.
2. Constant 78°F (26°C): The thermostat is dispatched such that the home’s temperature
may not rise above 78°F (26°C).
3. Precooling: The thermostat is dispatched such that the home is cooled below 78°F
(26°C) and allowed to drift back up to a 78°F (26°C) threshold to avoid coincidence of
cooling load with peak TDV hours. This schedule often uses more kWh than the Base
schedule but saves TDV by:
o Shifting electricity consumption from high-grid-cost evening peak periods to
lower cost afternoon hours.
o Using excess energy from rooftop PV systems, reducing grid export penalties.
To model these schedules, the team undertook the following steps:
1. The minimum cost building prototypes from the BEopt analysis were selected for mixed-
fuel and all-electric 2,100 ft2 homes in all 16 CZs and 2,700 ft2 in 3 CZs (38 prototypes
total). In EnergyPlus, the team simulated annual hourly loads of these buildings with 14
different cooling setpoint schedules for each house prototype: Base, Constant 78, and
12 precooling schedules (Figure 5). The precooling setpoints were selected by varying
the temperature and length of precooling before the TDV peak period.
2. For each day of the year, the “Optimal” precooling schedule was selected, that is, the
schedule that resulted in the lowest net TDV (net load multiplied by TDV).
3. The team compared the annual net TDV of these optimized precooling schedules
against the net TDV of the same house prototypes operated under the Constant 78°F
(26°C) and Base setpoint schedules for the entire cooling season.
4. The team compared the annual net TDV of individual precooling schedules against
Optimal and Base set point schedules.
5. The analysis was repeated using current and feasible TOU rate structures13 in place of
TDV values to determine whether precooling provides bill savings under rates that are
less granular and dynamic than hourly TDV values.
13 PG&E E-TOU-B for climate zones 1-5, 11-13; SCE TOU-D-4-9PM for climate zones 6, 8-10, 15, 16; SDG&E
TOU-DR-SES for climate zones 7, 14.

22
Figure 5: Cooling Setpoint Schedules for Optimal Precooling Selection
Figure shows optimal precooling schedules based on time of day.
Source: Lawrence Berkeley National Laboratory
Community Renewables Approach
Renewable Natural Gas
The research team examined the potential to replace conventional natural gas with RNG. RNG
in this case is assumed to be pipeline-quality methane sourced from biomass. RNG can be
produced from various biomass sources and various biochemical pathways, and can be used
as a substitute for, or blended with, fossil-based natural gas uses, including building end-uses,
transportation, electricity production, and industrial heating. Though RNG combustion emits
greenhouse gases in the same manner as combusting fossil-based (or “conventional”) natural
gas, CO2 produced by RNG combustion does not result in a net increase over natural emissions
from biomass decomposition. In addition, RNG production can create lower total upstream
emissions, due to avoided fossil-based extraction and processing-related emissions, and for
some RNG sources, methane capture and conversion to CO2. The California Air Resources
Board’s (CARB) greenhouse gas inventory assumptions define RNG as a carbon neutral fuel
source, that is, CO2 produced by RNG combustion does not result in a net increase over
natural emissions from biomass decomposition. Currently, most RNG is sourced from landfills,
municipal solid waste, wastewater treatment plants, and dairies.
72
75
78
727578
727578
727578
727578
727578
727578
727578
727578
727578
727578
727578
727578
1 2 3 4 5 6 7 8 9 10 11 12 13 14 15 16 17 18 19 20 21 22 23 24
7275788184
constant 78 F
2 hours of 75 F pre-cooling
4 hours of 75 F pre-cooling
6 hours of 75 F pre-cooling
8 hours of 75 F pre-cooling
10 hours of 75 F pre-cooling
2 hours of 72 F pre-cooling
4 hours of 72 F pre-cooling
6 hours of 72 F pre-cooling
8 hours of 72 F pre-cooling
10 hours of 72 F pre-cooling
Begin
nin
g o
f TD
V P
eak P
eri
od
6 hours of 75 F pre-cooling2 hours offset
10 hours of 75 F pre-cooling, 2 hours offset
← 2
base case – CBECC Res Default
← 2
Hour of Day
Se
tpo
int
Te
mpe
ratu
re (
F)

23
Under the simple definition of a ZNE home — one that produces as much energy as it
consumes over the course of a year — a home cannot be zero net energy while using more
energy that is produced off site than is generated on site, over the course of a year. However,
in Title 24 2019 building energy efficiency standards, the CEC has provided a more flexible
definition that allows for ZNE compliance using off-site gas production and/or off-site,
community-based solar. The research team’s assumption in this investigation is that the CEC
will continue to allow off-site energy production for ZNE homes and will assess a mixed-fuel
home as ZNE compliant as long as it only uses energy sources that are classified by state
agencies as carbon neutral.
E3 used their PATHWAYS model,14 with data from Jaffe (Jaffe, et al., 2016) and the U.S. DOE’s
Billion-Ton Report (Langholtz, Stokes, & Eaton, 2016) to create forecasted RNG supply curves
for California in 2030. E3 has also estimated economywide RNG demand curves as part of their
prior PATHWAYS analyses for California, to assess how much of the resource may be needed
to meet the state’s climate goals.
E3 further estimated the potential demand for RNG from new residential construction were it
to be required for ZNE compliance in mixed-fuel homes. They used two sources:
1. Annual gas consumption per new home. Estimates of annual household site natural gas
consumption for the single-family , multi-family and mobile home types in the Western
region were taken from the U.S. Energy Information Administration (EIA) Residential
Energy Consumption Survey (Energy Information Administration, 2013).
2. The number of new homes. Estimates of new homes of each type added annually were
obtained from the CEC’s 2015 IEPR report mid-demand statewide housing forecast.
The research team compares these demand curves with supply curves for RNG to form
conclusions about the feasibility and cost of requiring RNG for ZNE compliance in new
residential construction. The research team also provides an analysis of the TDV cost-
effectiveness from the participant’s perspective for:
• New mixed-fuel-with-RNG residential construction versus the CEC’s 2019 prescribed home.
• New mixed-fuel-with-RNG residential construction versus new all-electric (this analysis
incorporates fuel costs only, that is, it excludes infrastructure cost differences).
Community Solar
The research team performed a qualitative analysis, backed by simple back-of-the-envelope
calculations and figures from other literature, to assess the potential benefits of community
solar for ZNE compliance. They used three criteria to assess these potential benefits:
1. Ability to provide ZNE compliance at a lower cost.
2. Ability to provide a potential option for ZNE compliance where rooftop solar PV is
infeasible.
3. Ability to reduce costs to ratepayers who do not install solar PV.
14 For more details on E3’s PATHWAYS model, see
https://www.arb.ca.gov/cc/scopingplan/california_pathways_model_framework_jan2017.pdf

24
Expert Elicitation An expert elicitation is a structured process for collecting subjective estimates of uncertain
quantities based on the careful assessment by experts who are knowledgeable about the issue
of interest (in this case, the building cost of ZNE homes) through a series of interviews with
experts (Meyer & Booker 2001; Morgan 2014). Interviews can be performed in different
modes, and the most common way to collect an expert judgment is through face-to-face
elicitation. Expert elicitation has become increasingly common as a tool to develop credible
estimates when data are lacking or when it involves projections of future conditions that are
very different from the current status quo. This approach is intended to capture a
representation of the views of informed experts rather than deriving a probability distribution
of estimates with statistical significance; therefore, the appropriate number of experts to be
included in an expert elicitation depends heavily on the topic.
ZNE building is a relatively new area in the United States, and currently, only a few states
have pledged to adopt ZNE policy goals within the next couple of decades. Even in California,
which currently mandates the highest building energy efficiency standards in the nation, the
number of new housing starts that can achieve ZNE remains low.15 The future prospect of
building technologies used in ZNE homes and the degree to which policy support is needed to
achieve a higher level of ZNE adoption partially depends on the future costs of building ZNE
homes. While data on current costs related to building ZNE homes are already sparse, future
cost estimates are close to non-existent. In this study, the research team sought inputs from
experts from custom and production home building sectors and policy analysts to obtain a
range of perspectives on ZNE home adoption in California as well as cost estimates of building
ZNE homes.
Survey Design
The expert elicitation was designed to address the following research questions to help the
CEC make informed decisions related to ZNE policy:
• What are the current and future cost estimates of building measures for residential ZNE
construction? And what are the key cost reduction areas for TDV-ZNE implementation?
• What are the relative costs of all-electric versus mixed-fuel homes?
• What is the potential for community renewables, storage, and demand response in ZNE
implementation?
• What are the market barriers and key challenges for ZNE implementation?
The survey was structured into three main sections: (1) costs related to building measures, (2)
costs related to non-building components, and (3) costs related to an entire ZNE home. Last,
the elicitation concluded with a section of open-ended questions. The research team
intentionally separated the costs between building measures and non-building components
because little focus has been put on soft costs in most ZNE studies and the team wanted to
elicit experts’ insights to address market barriers related to soft costs of building ZNE homes.
15 According to the Net Zero Energy Coalition’s 2017 Inventory Report, California remains a volume leader in
ZNE residential buildings in the U.S., with around 5,300 units in stock in 2017. Report available at: http://netzeroenergycoalition.com/zero-energy-inventory/

25
In the section focused on building measures, the team included a total of 16 buildings
measures, which are based on efficiency features mandated by Title 24. The section focused
on non-building components consists of design costs, permitting expenses, inspection costs,
marketing costs, construction-related costs, utility infrastructure costs, and an option for
experts to add other cost items if they see fit. Current cost estimates were elicited for each
building measure and non-building component. However, given the high level of uncertainty
and subjectivity embedded in future cost estimates, experts were asked to select only up to
five building measures and two non-building components for which they felt comfortable
providing future cost estimates. In addition, the research team explicitly asked experts about
any emerging building technology or innovative development in each category that may
potentially have a significant impact on cost reduction in ZNE homes. In the section focused
on the entire ZNE home, the team asked experts two sets of questions. The first set asked
about the cost difference between building a Title 24 code-compliant home and a ZNE home
as of 2017. The second set of questions asked about the future cost of building a ZNE home in
2021 and 2026 compared to the cost of building a ZNE home in 2017. More details on the
survey protocol can be found in Appendix C. The final version of the expert elicitation
questionnaire is included in Appendix D.
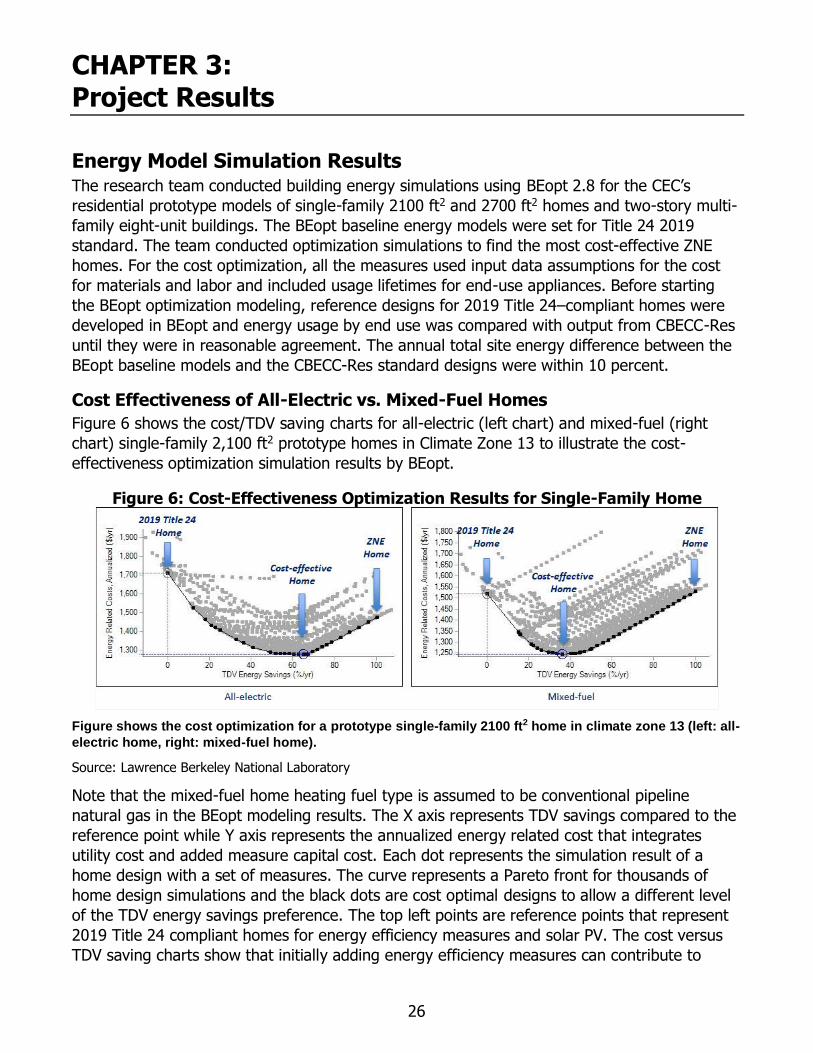
26
CHAPTER 3: Project Results
Energy Model Simulation Results The research team conducted building energy simulations using BEopt 2.8 for the CEC’s
residential prototype models of single-family 2100 ft2 and 2700 ft2 homes and two-story multi-
family eight-unit buildings. The BEopt baseline energy models were set for Title 24 2019
standard. The team conducted optimization simulations to find the most cost-effective ZNE
homes. For the cost optimization, all the measures used input data assumptions for the cost
for materials and labor and included usage lifetimes for end-use appliances. Before starting
the BEopt optimization modeling, reference designs for 2019 Title 24–compliant homes were
developed in BEopt and energy usage by end use was compared with output from CBECC-Res
until they were in reasonable agreement. The annual total site energy difference between the
BEopt baseline models and the CBECC-Res standard designs were within 10 percent.
Cost Effectiveness of All-Electric vs. Mixed-Fuel Homes
Figure 6 shows the cost/TDV saving charts for all-electric (left chart) and mixed-fuel (right
chart) single-family 2,100 ft2 prototype homes in Climate Zone 13 to illustrate the cost-
effectiveness optimization simulation results by BEopt.
Figure 6: Cost-Effectiveness Optimization Results for Single-Family Home
Figure shows the cost optimization for a prototype single-family 2100 ft2 home in climate zone 13 (left: all-
electric home, right: mixed-fuel home).
Source: Lawrence Berkeley National Laboratory
Note that the mixed-fuel home heating fuel type is assumed to be conventional pipeline
natural gas in the BEopt modeling results. The X axis represents TDV savings compared to the
reference point while Y axis represents the annualized energy related cost that integrates
utility cost and added measure capital cost. Each dot represents the simulation result of a
home design with a set of measures. The curve represents a Pareto front for thousands of
home design simulations and the black dots are cost optimal designs to allow a different level
of the TDV energy savings preference. The top left points are reference points that represent
2019 Title 24 compliant homes for energy efficiency measures and solar PV. The cost versus
TDV saving charts show that initially adding energy efficiency measures can contribute to
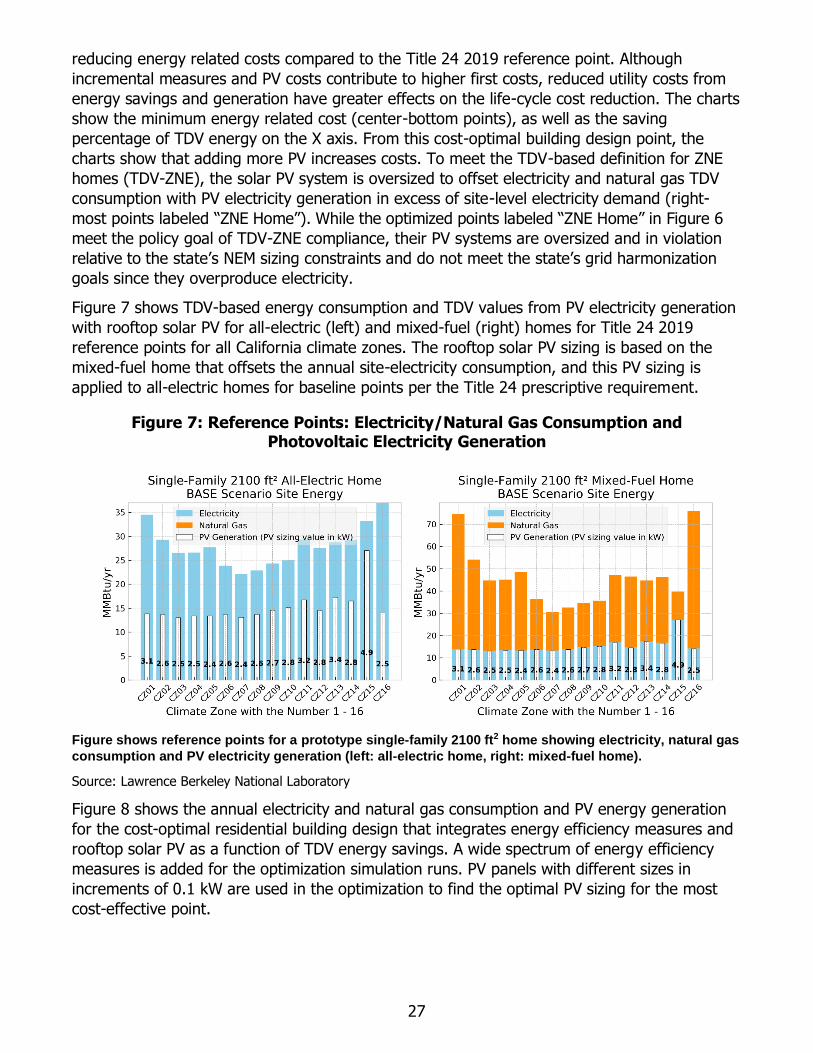
27
reducing energy related costs compared to the Title 24 2019 reference point. Although
incremental measures and PV costs contribute to higher first costs, reduced utility costs from
energy savings and generation have greater effects on the life-cycle cost reduction. The charts
show the minimum energy related cost (center-bottom points), as well as the saving
percentage of TDV energy on the X axis. From this cost-optimal building design point, the
charts show that adding more PV increases costs. To meet the TDV-based definition for ZNE
homes (TDV-ZNE), the solar PV system is oversized to offset electricity and natural gas TDV
consumption with PV electricity generation in excess of site-level electricity demand (right-
most points labeled “ZNE Home”). While the optimized points labeled “ZNE Home” in Figure 6
meet the policy goal of TDV-ZNE compliance, their PV systems are oversized and in violation
relative to the state’s NEM sizing constraints and do not meet the state’s grid harmonization
goals since they overproduce electricity.
Figure 7 shows TDV-based energy consumption and TDV values from PV electricity generation
with rooftop solar PV for all-electric (left) and mixed-fuel (right) homes for Title 24 2019
reference points for all California climate zones. The rooftop solar PV sizing is based on the
mixed-fuel home that offsets the annual site-electricity consumption, and this PV sizing is
applied to all-electric homes for baseline points per the Title 24 prescriptive requirement.
Figure 7: Reference Points: Electricity/Natural Gas Consumption and Photovoltaic Electricity Generation
Figure shows reference points for a prototype single-family 2100 ft2 home showing electricity, natural gas
consumption and PV electricity generation (left: all-electric home, right: mixed-fuel home).
Source: Lawrence Berkeley National Laboratory
Figure 8 shows the annual electricity and natural gas consumption and PV energy generation
for the cost-optimal residential building design that integrates energy efficiency measures and
rooftop solar PV as a function of TDV energy savings. A wide spectrum of energy efficiency
measures is added for the optimization simulation runs. PV panels with different sizes in
increments of 0.1 kW are used in the optimization to find the optimal PV sizing for the most
cost-effective point.

28
Figure 8: Cost-Effective Minimum Points: Electricity/Natural Gas Consumption and Photovoltaic Electricity Generation
Figure shows the cost-effective minimum points for a single-family 2100 ft2 showing the electricity, natural
gas consumption and PV electricity generation (left: all-electric home, right: mixed-fuel home).
Source: Lawrence Berkeley National Laboratory
Figure 9 shows energy consumption and generation for TDV-ZNE home designs. For both all-
electric and mixed fuel homes, the rooftop solar PV system overproduces electricity and is in
violation of NEM requirements. Note that even in the all-electric case, the solar PV system
overproduces electricity because the hourly shape of TDV values described in Chapter 2
provides less value for solar PV in the middle of the day and the PV system must be oversized
to fully compensate the TDV value of onsite electricity consumption.
Figure 9: Time dependent valuation-Zero Net Energy Points: Electricity/Natural Gas Consumption and Photovoltaic Electricity Generation
Figure shows the TDV-ZNE points for a single-family 2100 ft2 home showing electricity, natural gas
consumption and PV electricity generation (left: all-electric home, right: mixed-fuel home).
Source: Lawrence Berkeley National Laboratory
Figure 10 shows the life-cycle cost and Figure 11 the initial construction cost of the cost-
effective designs for all-electric (left) and mixed-fuel (right) prototype single-family 2100 ft2

29
homes. The life-cycle cost refers to the total cost of ownership for 30 years, which includes
mortgage payments, replacement costs, utility bill payments, and residual values. The
underlying assumptions include 30 years of the project analysis period, 3 percent of the
discount rate, 4 percent of the mortgage interest rate, and 28 percent of the marginal income
tax rate used for annual tax deductions. The initial construction cost refers to the initial
investment cost to build the house including construction materials and labor costs. A range of
infrastructure costs is shown for mixed-fuel homes, as natural gas connection costs must be
considered when comparing to all-electric homes. These can vary depending on the degree of
infrastructure required but typically vary between $1,000 and $10,000 per home. The mixed-
fuel home chart from Figure 10 and Figure 11 shows this cost range for the natural gas-related
infrastructure costs, centered at an assumed median point of $3,000 per home infrastructure
cost.
All-electric homes benefit from avoiding the cost of building natural gas infrastructure to the
home, and all-electric single-family home life-cycle costs are comparable to mixed-fuel homes
in most climate zones (Figure 10) with an average of 38 percent less annual GHG emissions
than mixed-fuel homes. All-electric homes are less favorable compared to mixed-fuel homes in
climate zones with high heating demand and low cooling demand (for example, CZ01 and
CZ16) since the lack of cooling operation reduces the heat pump cost savings that can accrue
from operation in both heating and cooling modes.
Figure 10: Life-Cycle Cost of All-Electric and Mixed-Fuel Homes at Cost-Optimal Design Point
Figure shows lifecycle cost of all-electric and mixed-fuel single-family 2100 ft2 homes at cost-optimal
design point for all California climate zones, using 2022 TDV values and avoided cost for solar PV exports
(left: all-electric home, right: mixed-fuel home).
Source: Lawrence Berkeley National Laboratory

30
Figure 11: Initial Cost of All-Electric and Mixed-Fuel Homes at Cost-Optimal Design Points
Figure shows initial cost of all-electric and mixed-fuel single-family 2100 ft2 homes for all California
climate zones at cost-optimal design points (left: all-electric home, right: mixed-fuel home).
Source: Lawrence Berkeley National Laboratory
All-electric single-family new homes (2100 ft2) can realize life-cycle cost savings compared to
2019 Title 24–compliant all-electric homes using updated TDV values for 2022 and less
generous net energy metering solar PV compensation (avoided cost for exports rather than the
current NEM 2.0. The life-cycle cost minimum of all-electric homes generally includes more
energy efficient heat pumps for heating and cooling and an average of 1kW more of additional
rooftop solar PV than mixed-fuel homes. This results in higher upfront initial construction cost
but lower life-cycle costs as shown in Table B-15 in Appendix B. Life-cycle cost savings from
cost minimum designs vary from $3,697 to $10,797 across all climate zones, but initial costs
are from $2,235 to $10,081 higher. The research team finds several energy efficiency
measures that provide life-cycle cost savings in all climate zones: ducts in conditioned space,
plug load reduction (optimal occupant behavior with smart control), hot water pipe insulation
(R-5), and more energy efficient clothes dryers (vented electric CEF 4.5). Most climate zones
would also benefit from more energy efficient clothes washers (standard front-loading CEE
Tier 2) and more energy efficient refrigerators (bottom freezer, EF 21.3).
Similarly, mixed-fuel homes with more aggressive efficiency measures can realize life-cycle
cost savings but with increased initial costs. Life-cycle cost savings from cost minimum designs
compared to Title 24–compliant homes vary from $1,151 to $9,142 across all climate zones,
but initial costs are from $1,887 to $4,397 higher. The cost-minimum mixed-fuel homes can
have smaller PV systems than Title 24–compliant homes, which are designed to offset the
annual site electricity consumption, since the efficiency measures decrease site electricity
consumption. The research team finds several measures that provide life-cycle cost savings in
all climate zones: ducts in conditioned space, hot water pipe insulation (R-5), more energy
efficient clothes dryers (vented gas CEF 3.48), and more efficient cooking ranges (max tech
gas cooktops). Several climate zones would also benefit from more energy efficient gas
furnaces (92.5 percent AFUE) and central air conditioning (SEER 15-16).
Figure 12 shows CO2 emissions for 30 years of all-electric and mixed-fuel single-family 2100 ft2
homes with cost-optimal designs for all California climate zones. Hourly CO2 emission factors

31
from E3 were used for the CO2 emission calculation for electricity consumption, and 11.7
pounds CO2/therm emission factor was used for the natural gas CO2 emissions. CO2 emissions
reflect the net electric load after PV generation for each hour. All-electric homes have an
average of 38 percent lower emissions.
Figure 12: CO2 Emissions for All-Electric and Mixed-Fuel Homes at Cost-Minimum Design Points
Figure shows CO2 emissions for all-electric and mixed-fuel single-family 2100 ft2 homes for all California
climate zones at cost-minimum design points (left: all-electric home, right: mixed-fuel home).
Source: Lawrence Berkeley National Laboratory
Tables B-3 and B-4 in Appendix B show the measures selected for the most cost-effective
home designs for the single-family 2100 ft2 all-electric and mixed-fuel homes respectively.
The packages show that energy efficient home appliances such as clothes dryers and clothes
washers, plug load reduction from smart controls, hot water pipe insulation, ducts in finished
space, advanced HVAC systems, and air tightness are general key measures throughout
climate zones and fuel types. Energy efficient walls and attics are advantageous for hot
climate zones. Lighting systems and windows in the baseline models offer energy efficient
technology, and there is no opportunity for further cost-effective energy savings. Triple pane
windows with low-emissivity technology that minimizes heat from outside in the summer and
retain indoor heat are not yet cost-effective due to their high cost, but higher production rates
could reduce costs significantly in the future.
More energy efficient refrigerators and dishwashers are beneficial for all-electric homes, while
cooking ranges with advanced technology and condensing tankless water heaters are
measures that are cost-effective for mixed-fuel homes.
The all-electric prototype models have heat pump water heaters (HPWH). A more energy
efficient HPWH is beneficial for all-electric homes for larger single-family homes and multi-
family buildings.
Figure 13 and Figure 16 show the simulation results for single-family, 2700 ft2 homes and
multi-family eight-unit buildings, respectively, for annual electricity and natural gas
consumption and PV energy generation in climate zones 3, 10, and 13. Each figure shows site
energy consumption and PV electricity generation for all-electric and mixed-fuel design homes

32
for different climate zones representing 2019 Title 24 compliant designs (left). The energy
performance of the most cost-effective homes and ZNE homes are included for 2700 ft2 homes
but only the cost-effective design for multi-family buildings. Note that BEopt optimization
simulation run time takes more than seven days (using 2.5 gigahertz [GHz] CPU and 36 core
processor computer) for multi-family buildings, which limited the scope of the optimization to
find the minimum cost-effectiveness designs.
Figure 14 and Figure 17 show the life-cycle cost of the cost-effective scenarios for all-electric
(left) and mixed-fuel (right) prototype single-family 2700 ft2 homes and multi-family eight-unit
building. The mixed-fuel single-family home includes natural gas connection costs varying
between $2,000 and $16,0000. Multi-family buildings are assumed to have a natural gas
connection cost that ranges from $500 to $2,000 per unit. Figure 15 and Figure 18 show initial
cost.
For eight-unit all-electric multifamily homes (CZ03, CZ10, CZ13), the research team finds that
cost-optimized homes can have designs that have lower life-cycle cost than Title 24–compliant
all-electric baseline homes with $3,156 to $5,346 in lower life-cycle cost but an increased
initial cost of $1,844 to $2,692 on a per unit basis (Table B-2 in Appendix B). Compared to the
reference Title 24–compliant homes, cost-minimum all-electric homes in all three climate zones
have more efficient mini-split heat pumps, air leakage at two to three air changes per hour
(ACH), R-5 hot water pipe insulation, and more efficient refrigerators (bottom freezer EF 19.8)
and clothes washers and dryers (front loading CEE Tier 2 and vented electric CEF 4.5,
respectively).
Similarly, eight-unit mixed-fuel multi-family homes (CZ03, CZ10, CZ13) can achieve lower life-
cycle costs than Title 24–compliant mixed-fuel baseline homes with $963 to $1,887 lower life-
cycle costs but with an increased initial cost of $1,390 to $1,954 on a per unit basis (Table B-2
in Appendix B). Compared to the reference Title 24–compliant design cost, cost-minimum
homes in all three climate zones have air leakage at two ACH, vented unfinished attic with
ceiling R-49 Gr-1 cellulose, R-5 hot water pipe insulation, plug loads with smart control, and
more energy efficient refrigerator, cooking range, and clothes dryer (bottom freezer EF 19.8,
gas cooktop max tech, and vented gas CEF 3.48, respectively). In the warmer climate zones
(CZ10, CZ13), a radiant barrier and more efficient central air conditioner are also installed
(SEER 15).
For multi-family home cost-optimal designs (CZ03, CZ10, CZ13), the research team finds that
all-electric initial costs can be lower than those of mixed-fuel homes from the elimination of
ducts and the adoption of ductless mini-split heat pumps. All-electric life-cycle costs are
slightly higher than mixed-fuel costs since per unit cost savings for avoided natural gas
infrastructure are lower than for single-family homes. Assuming natural gas infrastructure
savings ranging from $500/unit to $2,000/unit, the team estimates about 4 to 6 percent or 2
to 4 percent higher life-cycle costs respectively for all-electric multi-family homes compared to
mixed-fuel homes.

33
Figure 13: Single-Family Electricity/Natural Gas Consumption and Photovoltaic Electricity Generation
Figure shows modeled electricity use, natural gas use, and PV generation for the 2700 ft2 single family
model (left: baseline, center: cost-optimized, right: ZNE).
Source: Lawrence Berkeley National Laboratory
Figure 14: Life-Cycle Cost at Cost-Optimal Design Points — All-Electric and Mixed-
Fuel Single-Family Homes
Figure shows life-cycle cost of all-electric and mixed-fuel single-family 2700 ft2 homes for California
climate zones 3, 10, and 13 at cost-optimal design points, using 2022 TDV values and avoided cost for
solar PV exports (left: all-electric home, right: mixed-fuel home).
Source: Lawrence Berkeley National Laboratory

34
Figure 15: Initial Cost of All-Electric at Cost-Optimal Design Points — Mixed-Fuel Single-Family Homes
Figure shows Initial cost of all-electric and mixed-fuel single-family 2700 ft2 homes for California climate
zones 3, 10, and 13 at cost-optimal design points (left: all-electric home, right: mixed-fuel home).
Source: Lawrence Berkeley National Laboratory
Table B-6 in Appendix B shows the measures selected for the most cost-effective home
designs for 2700 ft2 single-family homes in climate zones 03,10,13 for all-electric and mixed-
fuel homes, and Source: Lawrence Berkeley National Laboratory
Table B-7 shows the measures for the most cost-effective multi-family 8-unit all-electric
building.
Table B-8 in Appendix B shows the selected measures for the multi-family eight-unit buildings.
The packages show that energy efficient home appliances such as clothes dryers, clothes
washers, plug load reduction from smart controls, hot water pipe insulation, ducts in finished
space, advanced HVAC systems, and air tightness are key measures throughout climate zones
and fuel types.

35
Figure 16: Multi-Family 8-Unit Building Electricity/Natural Gas Consumption and Photovoltaic Electricity Generation for Baseline and Cost-Optimal
Figure shows modeled electricity use, natural gas use, and PV generation for the multi-family 8-unit
model (left: baseline, right: cost-optimized).
Source: Lawrence Berkeley National Laboratory
Figure 17: Life-Cycle Cost and Cost-Optimal Design Points — All-Electric and Mixed-Fuel 8-Unit Multi-Family Building
Figure 17 shows life-cycle cost at cost-optimal design points for all-electric and mixed-fuel 8-unit multi-
family buildings for California climate zones 3, 10, and 13 (left: all-electric building, right: mixed-fuel
building).
Source: Lawrence Berkeley National Laboratory

36
Figure 18: Initial Cost at Cost-Optimal Design Points — All-Electric and Mixed-Fuel 8-Unit Multi-Family Buildings
Figure 18 shows the initial cost at the cost optimal design points for all-electric and mixed-fuel 8-unit
multi-family buildings for California climate zones 3, 10, and 13 (left: all-electric home, right: mixed-fuel
home).
Source: Lawrence Berkeley National Laboratory
BEopt Measures for Cost-Effectiveness
This section shows the energy and CO2 emission savings effect of frequently selected
individual efficiency measures for cost-optimal designs: large appliances, plug load reduction,
air source heat pump, duct, and hot water pipe insulation. Large appliances include
dishwashers, clothes dryers, clothes washers, and refrigerators. Figure 19 shows how
individual measures can save electricity and CO2 emissions relative to the 2019 Title 24–
compliant baseline home— for example, a 2100 ft2 all-electric home for climate zone 13. High
efficiency air source heat pumps and ducts in finished space show the highest energy savings.
Plug load reduction from optimal occupant behavior with smart control technology also has a
high electricity saving potential. Among major appliances, clothes dryers show high energy
savings, followed by refrigerators with bottom freezers. All measures were then modeled to
see the integrated impact of all measures on electricity and CO2 emission savings.
Figure 20 illustrates hourly CO2 emission profiles (annual average) for the selected package of
measures in climate zone 13, which shows a night-time demand peak and appreciable peak
reduction for this set of cost-optimal design measures.

37
Figure 19: Climate Zone 13 Results of Cost-Effectiveness Measures on Electricity and Carbon Dioxide Emission Savings
Figure 19 shows the electricity (top) and CO2 emission (bottom) savings of individual measures at the
cost-optimal design point for a 2100 ft2 all-electric home for California climate zone 13.
Source: Lawrence Berkeley National Laboratory

38
Figure 20: Annual Average Hourly Profile — Carbon Dioxide Emissions for Individual Measures and Measure Package
Figure 20 shows the annual average hourly CO2 emission profiles for the indicated measures in California
climate zone 13.
Source: Lawrence Berkeley National Laboratory
Photovoltaic Orientation Sensitivity
The baseline prototype models have PV systems with south-facing module orientation, which
generates the most electricity generation as shown in Figure 21 (left) for a single-family
2100ft2 all-electric home at the cost-effective design point. PV module orientation to the
southwest is the most beneficial to reduce the utility cost under the TDV 2022-based hourly
pricing utility rate structure, followed by a west-facing orientation. As shown in Chapter 2,
electricity generation in the late afternoon has a greater value for the life-cycle cost
optimization with the TDV metric, benefitting these two orientations. Figure 21 (right) shows
the life-cycle cost for different PV module orientations.
Figure 21: Photovoltaic Electricity Generation by Module Orientation and Effect on
Life-Cycle Cost
Figure 21 shows the annual electricity generation (left) and the life-cycle cost (right) for a single-family
2100ft2 all-electric home at the cost-effective design point as a function of PV module orientation.
Source: Lawrence Berkeley National Laboratory

39
Photovoltaic Export Rate Sensitivity: Avoided Cost for Export versus Net Energy Metering 2.0
The baseline analysis uses the avoided cost for export (ACE) rate for hours when PV electricity
generation exceeds electricity demand. The team compared this ACE rate to NEM 2.0 rates for
climate zones 3, 10, and 13. Under NEM 2.0, there is a component known as non-bypassable
charges (Pacific Gas & Electric: 0.023 $/kWh, San Diego Gas & Electric: 0.021 $/kWh,
Southern California Edison: 0.019 $/kWh). The compensation rate for grid exports in this case
is the retail rate reduced by the non-bypassable charges. Consumers earn much less credit
under the ACE rate structure, where electricity exported from residential solar to the grid is
valued at the TDV value less the retail rate adder.
Figure 22 shows the single-family 2100 ft2 all-electric home in climate zone 3 under ACE (left)
and NEM 2.0 (right) PV electricity export rate. The left optimization chart under ACE rate
shows that adding more PV does not help reduce energy-related costs since there are many
hours for which PV electricity generation is greater than the home electricity consumption,
and, for those hours, consumers earn much less credit than what they pay for electricity.
However, the cost optimization under NEM 2.0 illustrates that the exported electricity is still
beneficial to reduce the utility bill for consumers. Figure 23 shows the total life-cycle cost
differences between ACE and NEM2.0 rates, showing that NEM2.0 is more favorable to
consumers when PV modules are added in moving from the base point to the minimum cost
points.
All-electric home designs and costs are a sensitive function of NEM assumptions. Assuming a
NEM 2.0 regime with higher compensation for PV exports, all-electric single-family home life-
cycle cost savings vary from $7,200 to $8,200 for climate zones 3, 10, and 13 at the cost-
minimum design point compared to the case of avoided cost for export as net energy bill
savings would be much higher under NEM 2.0.
Figure 22: Energy-Related Cost Optimization Under Avoided Cost for Export and Net Energy Metering 2.0 Policy
Figure 22 shows the single-family 2100 ft2 all-electric home in climate zone 3 under the avoided cost for
export (left) and the NEM 2.0 (right) PV electricity export rate.
Source: Lawrence Berkeley National Laboratory

40
Figure 23: Life-Cycle Cost Under Different Photovoltaic Electricity Overgeneration Export Policies
Figure 23 shows the total life-cycle cost differences between avoided-cost for export and NEM2.0 rates,
showing that NEM2.0 is more favorable to consumers when PV modules are added from the base design
points to the minimum cost points. (2100 ft2 single family home).
Source: Lawrence Berkeley National Laboratory
Time Dependent Valuation Sensitivity: 2022 Base Case versus Higher
Renewables Case
TDV values are important inputs when conducting the cost-effectiveness optimization
simulation. The research team uses TDV values derived for 2022 for the baseline optimization
analysis. A sensitivity analysis was also performed to compare the cost-effectiveness under
this base case versus the Higher Renewables TDV case described in Chapter 2. Figure 24
compares the life-cycle cost with the baseline TDV 2022 values compared to Higher
Renewables TDV case values. The life-cycle cost at the minimum cost point is between $700
and $1700 higher for the Higher Renewables TDV case.

41
Figure 24: Life-Cycle Cost Under 2022 Base Case versus Higher Renewables Case
Figure 24 compares the life-cycle cost for the baseline TDV values for 2022 compared to those values for
the Higher Renewables TDV case.
Source: Lawrence Berkeley National Laboratory
Storage The research team analyzed two forms of energy storage: battery storage and precooling. The
buildings used in this storage analysis are the BEopt minimum cost home designs for the
specified fuel type, square footage, climate zone, and TDV sensitivity.
Battery Storage
The team’s analysis revealed that under Basic and TOU dispatch, battery storage cannot
achieve TDV-ZNE (that is, cannot enable the building to consume and produce equal amounts
of electricity TDV over each year). Battery storage responding to more dynamic price signals
(such as under Shuffled and Optimal dispatch algorithms) can achieve TDV-ZNE (see Figure
25), though these solutions may not be cost-effective to the participant. While batteries
dispatching against more dynamic price signals could achieve TDV-ZNE, batteries operating
with Basic and TOU dispatch could not, as they are not as effective in capturing storage
arbitrage value.

42
Figure 25: Selection of Time-Dependent Value-Zero Net Energy Battery Size
Figure 25 shows the TDV of net load as a function of battery size for four different dispatch algorithms for
2100 ft2 Mixed Fuel home, Base 2022 TDV, CZ 10 (triangles indicate battery size at which TDV-ZNE is
reached).
Source: Lawrence Berkeley National Laboratory
Further, if compensated under current TOU rates and NEM policies, battery storage is not
projected to be cost-effective to the participant, even assuming storage costs reduce over time
(see Figure 26).16 The timing of the TOU periods and magnitude of the rates do not provide
sufficient signal or compensation to generate enough arbitrage value to offset battery costs.
Because the penalties for exporting in the avoided cost for exports use cases are about four
times higher than the non-bypassable charges in the NEM 2.0 use cases, battery storage
provides more bill savings under avoided cost for exports than under NEM 2.0.
16 That is, even assuming 2023 and 2043 costs are 64 percent and 47 percent of 2018 costs, as in the “Average
Cost – Reducing Over Time” case.
-12,000
-9,000
-6,000
-3,000
0
3,000
6,000
9,000
12,000
15,000
2 3 4 5 6 7 8 9 10 11 12 13 14 15
TD
V o
f N
et
Loa
d (
$2
02
3)
Battery Size (kWh)
Optimal
Shuffled
TOU
Basic
Dispatch

43
Figure 26: Storage Net Bill Savings Less Battery Costs (30-Year Net Present Value)
Figure 26 shows storage net bill savings less Battery Costs (30-year NPV) assuming Average Cost-
Reducing over Time battery cost and 2100 ft2 Mixed Fuel Home with current TOU rates
Source: Lawrence Berkeley National Laboratory
Given that electricity retail rate structures are uncertain over the 30-year time frame used in
the CEC’s Title 24 analyses, the research team sought to further analyze cost-effectiveness
under the TDV framework. For this analysis, electricity consumed behind the meter by the
building’s load is valued at the full TDV, while electricity exported from residential solar to the
grid is valued at the TDV, less the retail rate adder (the avoided cost portion of the TDV). PV
systems are sized to offset the building’s annual electricity load. This analysis further assumes
that batteries may only charge on rooftop solar PV, as this is a requirement for receiving Title
24 compliance credit.
Recall that the analysis used five different battery use cases (see Storage Control Algorithms in
Appendix A for details):
1. Optimized Dispatch, which assumes that each battery is dispatched to maximize TDV
values in each hour of each year, with perfect foresight
2. Shuffled Dispatch, which assumes that each battery dispatches against hourly TDV
values from a “similar” day, by “shuffling” the same day of the week within the same
month
3. TOU Dispatch, under which batteries are assumed to dispatch in response to on-peak
and off-peak TOU periods
4. Basic Dispatch, under which batteries are assumed to charge on solar PV net exports
and discharge when load again exceeds PV production
-4,000
-3,000
-2,000
-1,000
0
1,000
2,000
3,000
4,000
CZ0
1
CZ0
2
CZ0
3
CZ0
4
CZ0
5
CZ0
6
CZ0
7
CZ0
8
CZ0
9
CZ1
0
CZ1
1
CZ1
2
CZ1
3
CZ1
4
CZ1
5
CZ1
6
Net
Bil
l Sav
ings
–B
atte
ry C
ost
(N
PV
$2
02
3)
Avoided Costfor Exports
NEM 2.0
Grid Export Value

44
5. Backup Dispatch, which assumes that batteries are used only to provide backup power.
According to reports from Itron, Inc. and E3 evaluating California’s SGIP, this was the
most common use case for residential battery storage as of the end of 2017.17
In this analysis, battery storage value generally comes from:
1. Avoiding generation and distribution capacity peaks: value comes from displacing grid
electricity consumption with battery electricity during high TDV periods
2. Avoiding “export penalties”: because PV generation is more valuable serving building
load than when exported to the grid, battery storage provides value by shifting solar
energy that would have been exported to a time when the building would have been
consuming energy from the grid
3. Energy arbitrage: in the future, penetration of solar generation is expected to be high
enough that the difference in energy prices between hours with and without solar
generation (particularly in the spring when system load is low) could be large enough to
provide arbitrage value
In this analysis, each battery case is optimally sized to maximize net benefits (TDV value
minus battery costs) to the homeowner. Figure 27 shows the optimal sizes of 64 battery use
cases (4 use cases by 16 CZs) installed in a 2100 ft2 mixed-fuel home under Base 2022 TDV
values, Average Cost, with No Cost Reduction. Figure 28 shows the corresponding total net
benefits.
The use cases in Figure 27 and Figure 28 illustrate that if battery storage costs do not decline,
optimally sized battery storage systems would be very small, and few use cases would provide
net benefits to the homeowner if battery storage was valued using TDV values. In Figure 27,
the optimal capacity of all but two systems is the analysis’s minimum size of 2 kWh: any
additional capacity would be more costly than beneficial. As shown in Figure 28, the total net
benefits of these systems are negative for all but three systems — that is, only three of these
use cases are cost-effective, and by small margins.
17 See “Self Generation Incentive Program Reports,” http://www.cpuc.ca.gov/general.aspx?id=7890

45
Figure 27: Optimal Sizing of Two-Hour Battery, Minimum 2 Kilowatt-Hour, Average Cost – No Reduction
Figure 27 shows the optimal sizing of 2hr battery (minimum 2kWh) for the Average Cost-No Reduction
battery cost case, 2100 ft2 Mixed Fuel Home, Base 2022 TDV Values.
Source: Lawrence Berkeley National Laboratory
Figure 28: Time dependent valuation Benefits Less Battery Costs, 30-year Net Present Value, Average Cost – No Reduction
Figure 28 shows Net TDV Benefits Less Battery Costs (30-year NPV) for the Average Cost-No Reduction
battery cost case, 2100 ft2 Mixed Fuel Home, Base 2022 TDV
Source: Lawrence Berkeley National Laboratory
If battery storage costs decline from present average costs, optimal battery sizes and
associated TDV net benefits are expected to increase. Figure 29 shows the same home as
Figure 28, this time assuming that battery costs come down according to the Average Cost-
0.0
0.5
1.0
1.5
2.0
2.5
3.0
3.5
4.0
CZ0
1
CZ0
2
CZ0
3
CZ0
4
CZ0
5
CZ0
6
CZ0
7
CZ0
8
CZ0
9
CZ1
0
CZ1
1
CZ1
2
CZ1
3
CZ1
4
CZ1
5
CZ1
6
3.0 2.4 2.4 2.3 2.3 2.4 2.3 2.4 2.5 2.6 2.9 2.5 2.9 2.5 4.0 2.3
Op
tim
al
Sto
rag
e C
ap
aci
ty (
kWh
)
Optimal
Shuffled
TOU
Basic
Dispatch
PV Capacity(kW)
-10,000
-9,000
-8,000
-7,000
-6,000
-5,000
-4,000
-3,000
-2,000
-1,000
0
1,000
CZ0
1
CZ0
2
CZ0
3
CZ0
4
CZ0
5
CZ0
6
CZ0
7
CZ0
8
CZ0
9
CZ1
0
CZ1
1
CZ1
2
CZ1
3
CZ1
4
CZ1
5
CZ1
6
Ne
t T
DV
Be
ne
fit
–N
PV
Ba
tte
ry C
ost
($
20
23
)
Optimal
Shuffled
TOU
Basic
Backup
Dispatch

46
Reducing over Time case.18 Under this cost trajectory, battery storage is optimally sized above
the 2kWh minimum for many use cases. As shown in Figure 30, some of these use cases show
positive cost-effectiveness margins.
Figure 29: Optimal Sizing of Two-Hour Battery, Average Cost-Reducing Over Time
Figure 29 shows the optimal Sizing of 2hr Battery (Minimum 2kWh) with the Average Cost-Reducing over
Time battery cost case, 2100 ft2 Mixed Fuel Home, Base 2022 TDV
Source: Lawrence Berkeley National Laboratory
18 Recall that this case begins with the same costs as the ‘‘Average Cost, with No Reduction” case, but assumes
2023 and 2043 costs are 64 percent and 47 percent of 2018 costs, respectively
0.0
2.0
4.0
6.0
8.0
10.0
12.0
14.0
CZ0
1
CZ0
2
CZ0
3
CZ0
4
CZ0
5
CZ0
6
CZ0
7
CZ0
8
CZ0
9
CZ1
0
CZ1
1
CZ1
2
CZ1
3
CZ1
4
CZ1
5
CZ1
6
3.0 2.4 2.4 2.3 2.3 2.4 2.3 2.4 2.5 2.6 2.9 2.5 2.9 2.5 4.0 2.3
Op
tim
al
Sto
rag
e C
ap
aci
ty (
kWh
)
Optimal
Shuffled
TOU
Basic
Dispatch
PV Capacity(kW)

47
Figure 30: Time dependent valuation Benefits Less Battery Costs, 30-year Net Present Value, Average Cost-Reducing Over Time
Figure 30 shows Net TDV Benefits Less Battery Costs (30-year NPV) for the Average Cost-Reducing over
Time battery cost case, 2100 ft2 Mixed Fuel Home, Base 2022 TDV
Source: Lawrence Berkeley National Laboratory
Also notable is the variation in optimal battery size and net benefits, depending on climate
zone and use case. Three factors cause this variation:
• Climate Zone: variation of timing in PV generation, load, and TDV peaks results in different
battery storage arbitrage value by CZ
• Dispatch Algorithm: dispatch algorithms responding to more granular pricing signals
provide more arbitrage value per kWh of battery storage, and improved dispatch leads to
larger batteries if sized to maximize TDV net benefits
• Building Load: optimally sized batteries are larger for homes with higher electric load (and
therefore larger PV systems to offset annual kWh). Larger all-electric homes will see larger
optimally sized battery storage systems. See Figure B-1 and Figure B-2 in Appendix B.
The research team also finds that if the home builder sizes the battery (or is mandated to size
the battery) to maximize net benefits under one dispatch method, but then operates the
battery using a less optimal dispatch method or as backup, it could result in net costs. Figure
31 illustrates how total net benefits change with battery capacity under the four modeled
dispatch methods. The diamonds represent the battery size that maximizes net benefits for the
relevant dispatch method. In this example, an optimally sized battery under Optimal dispatch
would be 9.5 kWh and would net $5,380 in TDV arbitrage value over 30 years if operated
under Optimal dispatch (that is, with perfect foresight in response to an hourly signal that
perfectly matches TDV). However, if the homeowner operates the 9.5 kWh battery under
Shuffled, TOU, or Basic dispatch, it would provide $2,400 net benefits, $4,530 net costs, or
$4,450 net costs, respectively.
-15,000
-10,000
-5,000
0
5,000
10,000
15,000
CZ0
1
CZ0
2
CZ0
3
CZ0
4
CZ0
5
CZ0
6
CZ0
7
CZ0
8
CZ0
9
CZ1
0
CZ1
1
CZ1
2
CZ1
3
CZ1
4
CZ1
5
CZ1
6
Ne
t T
DV
Be
ne
fit
–N
PV
Ba
tte
ry C
ost
($
20
23
)
Optimal
Shuffled
TOU
Basic
Backup
Dispatch

48
Figure 31: Selection of Optimal Battery Size: Average Cost-Reducing Over Time
Figure 31 shows if a home builder sizes the battery (or is mandated to size the battery) to maximize net
benefits under one dispatch method, but then operates the battery using a less optimal dispatch method
or as backup, it could result in net costs.
Source: Lawrence Berkeley National Laboratory
A further implementation issue is the small size of optimal battery storage systems found in
this analysis relative to the current Title 24 minimum size of 5 kWh and common commercially
available sizes like the 13.5 kWh Tesla Powerwall. This should be considered by the CEC as
part of any market analysis performed to support the inclusion of battery storage in building
codes.
The research team also ran a sensitivity analysis using the Higher Renewables 2022 TDV
values. As shown in Figure 32 with higher penetration of renewables, residential battery
storage could become cost-effective in some CZs, even with no cost reduction (not shown in
the figure). This is because battery storage is expected to see more arbitrage value per kWh
under high renewables, especially with more optimized dispatch. Less advanced dispatch
methods may not be able to capture the additional arbitrage value in the peaky Higher
Renewables TDV as well as Optimal dispatch. In interpreting these Higher Renewables results,
it is important to consider the broader storage market. Though the peakier TDV values seen in
the Higher Renewables case may be more favorable to residential battery storage, this higher
arbitrage value could also encourage the installation of additional grid-level or commercial
behind-the-meter storage. While services provided by residential storage differ somewhat from
those of larger batteries, an influx of lower-cost (due to economies of scale) non-residential
energy storage could soak up some of the arbitrage value, reducing the cost-effectiveness of
residential storage.
-15,000
-12,000
-9,000
-6,000
-3,000
0
3,000
6,000
9,000
2 3 4 5 6 7 8 9 10 11 12 13 14 15
Ne
t T
DV
Be
ne
fit
–N
PV
Ba
tte
ry C
ost
($
20
23
)
Battery Size (kWh)
Optimal
Shuffled
TOU
Basic
Dispatch

49
Figure 32: Optimal Sizing of Two-Hour Battery and Time Dependent Valuation Net Benefits Less Battery Costs
Figure 32 shows that optimal storage capacity (left) and TDV Net Benefits less Battery Costs (right) are
nearly always higher with Higher Renewables 2022 TDV than Base 2022 TDV, for the Average Cost-
Reducing over Time battery cost scenario, 2100 ft2 Mixed Fuel Home
Source: Lawrence Berkeley National Laboratory
The research team ran a final, more optimistic case on battery storage costs by starting with
today’s lowest battery storage costs (rather than the industry average) and assumed that
these costs will decline in the future.19 Then the battery size that maximizes TDV net benefits
could be quite large and provide large net benefits (see Figure B-1 through Figure B-4 in
Appendix B).
A final and important caveat to this analysis is that it does not compare the cost-effectiveness
of residential battery storage to precooling or to distribution system-sited battery storage.
Though residential battery storage is cost effective to the homeowner under some dispatch
methods, battery cost trajectories, and climate zones, it may not be cost effective compared to
larger scale storage sited at the distribution system, or compared to other potential forms of
load management such as precooling or load shifting from electric vehicles. Ongoing analysis
by E3 for the California Public Utilities Commission is delving further into the question of cost-
effectiveness of residential- and commercially sited storage versus distribution system-sited
battery storage.
Precooling
Precooling provides similar benefits to battery storage. Whereas batteries store low-cost
electricity to discharge when electricity costs are high, precooling arbitrages low and high
electricity costs by storing cool air in advance of later, more expensive hours. Both forms of
19 See description of “Low Cost-Reducing Over Time” in Methods chapter
0.0
2.0
4.0
6.0
8.0
10.0
12.0
14.0
Bas
e
Hi R
e
Bas
e
Hi R
e
Bas
e
Hi R
e
2.4 2.4 2.6 2.6 2.9 3.0
CZ03 CZ10 CZ13
Opt
imal
Sto
rage
Cap
acit
y (k
Wh)
Optimal
Shuffled
TOU
Basic
Dispatch
PV Capacity(kW)
-15,000
-10,000
-5,000
0
5,000
10,000
15,000
Bas
e
Hi R
e
Bas
e
Hi R
e
Bas
e
Hi R
e
CZ03 CZ10 CZ13
Net
TD
V B
enef
it –
NPV
Bat
tery
Cos
t ($2
023)
Optimal
Shuffled
TOU
Basic
Backup
Dispatch

50
storage cause the home to use more energy in aggregate due to efficiency losses but reduce
costs to the grid (and to the customer, if price signals correlate with grid costs).
Precooling often uses more kWh than the Base setpoint schedule,20 but saves electricity costs
in two main ways, as illustrated in Figure 33.
1. Precooling shifts electricity consumption from high-cost evening peak periods to lower
cost afternoon hours.
2. Because precooling is more coincident with rooftop solar PV generation than Base Case
cooling, the energy that would have been exported to the grid at low avoided cost
compensation is used by the building’s load.
Figure 33: Example Day of Base Cooling Load vs. Precooling Load
Figure 33 shows how precooling can shift demand to earlier in the day, better aligning cooling load with
solar PV output and avoiding hours with high TDV values.
Source: Lawrence Berkeley National Laboratory
The Base Case cooling setpoint schedule in the California Building Energy Code Compliance
residential standards compliance software (CBECC-Res) was designed to save energy by not
running air conditioning when the building is unoccupied during midday. However, with higher
penetration of solar depressing midday energy costs and rooftop solar required by Title 24,
even setting the thermostat to constant 78°F (26°C) could be less expensive than the Base
schedule. For example, for the all-electric 2100 ft2 home in CZ 10, the Constant 78°F (26°C)
schedule adds 44 kWh of annual net load relative to the Base Case (1 percent of gross load in
Base Case), but saves $672 in TDV net costs (5 percent less than Base Case) over the 30-year
lifetime.
To further investigate the potential for precooling, the research team simulated annual hourly
building loads under 14 different cooling setpoint schedules (described in Chapter 2). For each
20 Recall that under this setpoint schedule, the thermostat is dispatched so that the home’s temperature is
permitted to rise above the 78° comfort threshold when the building is unoccupied. This Base setpoint schedule
matches the base setting in CBECC Res building simulation software for the 2019 Title 24 standards.
0
100
200
300
400
500
600
0.0
0.5
1.0
1.5
2.0
2.5
1 2 3 4 5 6 7 8 9 10 11 12 13 14 15 16 17 18 19 20 21 22 23 24
30-y
ear
NP
V T
DV
(2
02
3 $
/kW
h)
kWh
Hour
0
500
1,000
1,500
2,000
2,500
3,000
3,500
0.0
0.5
1.0
1.5
2.0
2.5
1 2 3 4 5 6 7 8 9 10 11 12 13 14 15 16 17 18 19 20 21 22 23 24
TDV
kWh
Hour
PV kWh Base Cooling kWh Pre-cooling kWh
0
500
1,000
1,500
2,000
2,500
3,000
3,500
0.0
0.5
1.0
1.5
2.0
2.5
1 2 3 4 5 6 7 8 9 10 11 12 13 14 15 16 17 18 19 20 21 22 23 24
TDV
kWh
Hour
PV kWh TDV Base Cooling kWh Pre-cooling kWh

51
day, the setpoint schedule with the lowest TDV costs (hourly net load multiplied by TDV
values) was selected to make up an Optimal setpoint schedule. Figure 34 and Figure 35 show
how the annual net load and net TDV costs vary by CZ between the Base, Constant 78°F
(26°C), and Optimal precooling setpoint schedules. CZs 1, 3, and 5 have little to no cooling
load. In most CZs, Optimal precooling uses the most kWh, followed by Constant 78, and then
the Base Case (which has a net load of zero in each CZ because PV systems in this analysis
are sized to offset annual electricity loads). However, Optimal precooling shows the least TDV
costs, followed by Constant 78° F (26°C), and then the Base Case. The exception is hot, arid
CZ 15, where Optimal precooling is still the least cost option, but a Constant 78°F (26°C)
schedule is higher cost than the Base Case.
Figure 34: Annual Net Load Comparison of Cooling Schedules by Climate Zone
Figure 34 shows annual net load for 2100 ft2 Mixed Fuel Homes under three different cooling schedules.
In most CZs, the Optimal precooling schedule uses the most kWh.
Source: Lawrence Berkeley National Laboratory
0
50
100
150
200
250
300
350
400
450
An
nu
al
Ne
t Lo
ad
(kW
h)
Base Constant 78 Optimal

52
Figure 35: 30-Year Net Time Dependent Valuation Cost Comparison of Cooling Schedules by Climate Zone
Figure 35 shows that although Optimal Cooling Schedule uses more energy (Fig. 34), the net TDV costs
are lower than the Base case and the Constant 78°F (26°C) Case for for 2100 ft2 Mixed Fuel Homes in all
climate zones.
Source: Lawrence Berkeley National Laboratory
This Optimal precooling analysis uses perfect foresight of cooling loads and TDV values, which
is impossible to replicate in practice. However, further analysis revealed that a single setpoint
schedule for all days could provide most of the precooling savings. As shown in Figure 36, in
all but 3 of the 14 home types, an individual precooling setpoint schedule can return much of
the Optimal precooling bill savings. Longer (8:00 a.m. – 6:00 p.m., 10 hours) and cooler (72°F
[26°C]) precooling setpoint schedules tend to create more savings. Selecting one precooling
schedule may provide most of the benefits as daily optimal selection and be simpler to
implement.
0
2,000
4,000
6,000
8,000
10,000
12,000
14,000
16,000
18,000
20,000
TD
V C
ost
-TD
V R
even
ue (
$ N
PV)
Base Constant 78 Optimal

53
Figure 36: 30-Year Net Time Dependent Valuation Cost Savings of Individual and Optimal Precooling Schedules Relative to Base Cooling
Figure 36 shows that a non-optimized single setpoint schedule can realize a high fraction of precooling
savings obtained from optimal setpoint scheduling in most climate zones.
Source: Lawrence Berkeley National Laboratory
Like battery storage, precooling also provides value by avoiding grid consumption at peak
periods and shifting PV generation to be consumed behind the meter instead of exporting to
the grid for low compensation. Because dynamic rates enable this value, the project team
designed TOU rate sensitivities like the ones in the battery storage analysis. Along with the
optimal setpoint selection for each day using TDV values shown above, this selection was
performed using TDV values averaged into TOU periods of current rates and two versions of
30-year NPV of current TOU rates: grid exports valued at ACE and grid exports valued at retail
less non-bypassable charges (NEM 2.0).21
If customers see current TOU rates rather than TDV values, then cost savings to customers
and the grid from precooling are much lower. The muted price signals in current TOU rates
lack enough variation between TOU periods to provide arbitrage value for precooling (see
Figure 37). The current TOU rate with NEM 2.0 provides the lowest savings because there is
little incentive for precooling to avoid PV exports.
21 TDV and TDV averaged by TOU period cases also value grid exports at avoided cost.
TDV Savings (Percent Reduction of Base Setpoint TDV Cost)
Cons
tant
4pm
-6pm
2pm
-6pm
12pm
-6pm
10am
-6pm
8am
-6pm
4pm
-6pm
2pm
-6pm
12pm
-6pm
10am
-6pm
8am
-6pm
10am
-4pm
6am
-4pm
Opt
imal
Best
Non-
optimized
Setpoint
% of
Optimal
All Sched
SavingsSqft CZ 78° All Schedule
2,100 CZ01 0% 0% 0% 0% 0% 0% 0% 0% 0% 0% 0% 0% 0% 0% No Cooling N/A
2,100 CZ02 0% 3% 4% 4% 4% 4% 2% 3% 3% 3% 3% 1% 1% 7% 72 10am-6pm 65%
2,100 CZ03 0% 0% 0% -1% -1% -1% 0% 0% 0% 0% 0% 0% 0% 0% No Cooling N/A
2,100 CZ04 2% 5% 8% 10% 10% 10% 5% 6% 6% 6% 6% 4% 4% 13% 72 10am-6pm 74%
2,100 CZ05 0% 0% 0% 0% -1% -1% 0% 0% 0% 0% 0% 0% 0% 0% No Cooling N/A
2,100 CZ06 1% -3% -3% -3% -3% -4% 0% 1% 1% 1% 1% 2% 2% 6% 75 10am-4pm 43%
2,100 CZ07 1% 1% 1% 2% 1% 1% 2% 4% 4% 4% 4% 4% 4% 9% 75 10am-6pm 50%
2,100 CZ08 4% 0% 2% 6% 6% 6% 2% 6% 8% 8% 8% 10% 9% 16% 75 10am-4pm 61%
2,100 CZ09 5% 3% 6% 10% 12% 12% 4% 7% 10% 11% 11% 11% 11% 19% 72 8am-6pm 66%
2,100 CZ10 5% 5% 8% 12% 15% 15% 6% 10% 12% 13% 12% 11% 10% 20% 72 8am-6pm 76%
2,100 CZ11 7% 10% 16% 21% 23% 23% 11% 15% 17% 18% 18% 13% 12% 25% 72 10am-6pm 93%
2,100 CZ12 4% 8% 13% 17% 18% 18% 8% 11% 12% 13% 13% 8% 8% 21% 72 10am-6pm 87%
2,100 CZ13 7% 9% 12% 16% 18% 17% 9% 13% 14% 15% 15% 11% 11% 20% 72 10am-6pm 88%
2,100 CZ14 6% 5% 9% 12% 15% 15% 6% 9% 12% 13% 13% 14% 14% 18% 72 8am-6pm 81%
2,100 CZ15 -2% -2% -2% -2% -1% -2% -2% -1% -1% -1% -2% -1% -4% 3% 75 10am-6pm N/A
2,100 CZ16 0% 0% 0% 0% -1% -1% 0% 1% 1% 1% 1% 1% 0% 3% 75 12pm-6pm 28%
2,700 CZ03 0% 0% 0% -1% -1% -1% 0% 0% 0% 0% 0% 0% 0% 1% No Cooling N/A
2,700 CZ10 7% 7% 12% 19% 22% 22% 9% 13% 16% 17% 17% 14% 14% 26% 72 10am-6pm 86%
2,700 CZ13 8% 11% 16% 21% 24% 24% 11% 16% 18% 19% 19% 14% 14% 25% 72 10am-6pm 95%
% of
Optimal
All Sched
Savings72° Pre-cooling 75° Pre-cooling

54
Figure 37: 30-Year Net Time Dependent Valuation Cost Savings of Precooling with Optimal Setpoint Selection Under Rate Structure Sensitivities
Figure 37 shows the net TDV cost saving from precooling is small unless more time differentiated utility
rate structures are in place such as TDV-based hourly rates.
Source: Lawrence Berkeley National Laboratory
An important benefit of these precooling schedules is that they will actually increase
customers’ comfort levels compared to Basic setpoint schedules: under precooling, homes are
already cool when customers arrive home.
Three elements are needed to realize the savings from precooling in new residential
construction.22 First, the CEC should require or credit the installation of occupant controlled
smart thermostats in new construction. This technology is required to enable future control of
cooling loads by aggregators or utilities, if and when customers agree to provide this control.
Second, the price signal to customers or to aggregators (such as Nest, Honeywell, Ecobee, and
others) needs to be sufficiently time-differentiated to incent customers to pre-cool. This could
be, for example, through greater differentials between TOU rate periods and a change in NEM
policy. Third, customer education efforts are needed to communicate the financial and comfort
benefits of precooling and reiterate customer control and opt-out options. These education
efforts could be undertaken by the CEC, the CPUC, aggregators, and/or utilities. The research
team expects that with these three elements in place, customers are likely to take up
precooling as a means to increase their comfort while lowering their electric bills.
22 While the BEopt building prototypes used in this analysis were not selected to optimize for precooling, their
efficient shells store cool air well enough to benefit from precooling. Older vintages or other building designs may
interact differently with precooling setpoint schedules.
0
500
1,000
1,500
2,000
2,500
3,000
3,500
4,000
30
-yr
NP
V S
avi
ng
s fr
om
Pre
-coo
ling
($20
23)
TDV Current TOU Rate:AC for Exports
Current TOU Rate:NEM 2.0

55
Renewable Natural Gas
Forecasted Renewable Natural Gas Supply and Production Costs
The delivered cost of RNG includes several components: feedstock costs, conversion costs,
upgrading/injection, and pipeline connection (see Appendix B for a detailed description of
these costs).
The cost to produce RNG may remain high since many biomass producers are small operations
that do not have RNG collection and delivery as their primary objective. Thus, RNG plants may
not be able to achieve sufficient production levels necessary to reach economies of scale that
can bring down costs. Engagement with potential RNG providers can also be challenging since
prospective RNG providers may require significant financial incentives to change their
processes, staffing, and, technologies since they do not consider RNG production part of their
primary business. Financing of new equipment can also represent a significant challenge and
cost.
E3 used its PATHWAYS model,23 with data from Jaffe (Jaffe, et al., 2016) and the U.S. DOE’s
Billion-Ton Report (Langholtz, Stokes, & Eaton, 2016) to create forecasted RNG supply curves
for California in 2030. The year 2030 represents a milestone in evaluating the state’s policy
targets and a useful timeframe for consideration of the initial effects of 2023 building code
changes. The curves in Figure 38 estimate the annual quantity of RNG that suppliers may be
willing to provide at each all-in production and transportation cost, which includes all the cost
components described in the preceding text. Note that these supply curves do not include
advanced biofuels from purpose-grown crops (since purpose-grown crops can have ill effects
on land use and other resource cycles, and the forecasted supply of purpose-grown crops is
highly uncertain). They do, however, include non-purpose-grown woody biomass and crop
residual-derived RNG (under the assumption that RNG development from these sources
increases in the next decade). These curves also do not account for the retail markup added
by sellers of RNG.
23 For more details on E3’s PATHWAYS model, see
https://www.arb.ca.gov/cc/scopingplan/california_pathways_model_framework_jan2017.pdf

56
Figure 38: California Renewable Natural Gas Supply Curves Under Two Scenarios, 2030
Figure 38 shows supply curve scenarios for renewable natural gas in 2030.
Source: E3 PATHWAYS analysis (Mahone, et al., 2018)
The left-hand curve in Figure 38 depicts a baseline RNG supply curve that includes in-state
California biomass feedstocks projected by the U.S. DOE’s Billion Ton Study supplemented by
the better resolution in Jaffe et al. (2016) on waste biogas sources. This supply curve includes
landfill, MSW, dairies, and woody biomass, and excludes any assumed purpose-grown crops.
The right-hand curve shows an RNG supply curve that assumes California also has access to
the state’s population-weighted share of total U.S. biomass feedstocks, and assumes all
available, non-cellulosic feedstock is converted to RNG.
The lowest-cost portion of both supply curves is composed of RNG from large landfill facilities
that are also located near existing natural gas pipelines. These are followed by a mix of
wastewater treatment plants, MSW, more expensive landfill sources and cellulosic feedstocks.
Dairies generally produce the most expensive RNG, and the supply curves begin to climb
steeply as existing and more economic resources are exhausted. The far-right portions of the
supply curve are due to smaller or more difficult-to-access and expensive sources of RNG from
all the supply categories.
These supply curves suggest that RNG is likely to be an energy resource with limited supply in
California. In addition, the cost of RNG is expected to increase rapidly as cheaper sources of
biogas close to existing pipeline infrastructure are exhausted. The curves also illustrate the
significant uncertainty surrounding the future cost of RNG to an individual homeowner.
Depending on the demand for this resource in the future, individual homeowners could see a
very wide range of costs.
Forecasted Demand for Renewable Natural Gas
The research team combined two sources to estimate the potential demand for RNG from new
residential construction were it to be required for ZNE compliance in mixed fuel homes. Table
$0
$10
$20
$30
$40
$50
$60
$70
$80
$90
$100
$110
$120
0 100 200 300 400 500 600
All
-in
Pro
du
ctio
n a
nd
Tra
nsp
ort
atio
n C
ost
(2
02
3$
/MM
Btu
)
RNG Supply (Trillion Btu)
In-stateonly
Population-weightedU.S. share, excluding purpose-grown crops

57
B-9 in Appendix B provides the resulting annual estimate of natural gas demand, 10 trillion
British thermal units (TBtu), from new residential construction for 2017.
There is likely to be significant future demand for RNG from sources other than new residential
construction. New construction is only a tiny share of the total residential building stock —
which also needs to decarbonize to meet the state’s climate goals — and residential buildings
represent only about 19 percent of total gas consumption in the state. The commercial sector
currently uses gas to heat spaces, and the transportation sector uses natural gas for vehicle
fuel (Table B-10 in Appendix B).
As California’s climate goals ramp up over the next few decades, the state will require low-
carbon alternatives to serve these gas end uses. In many cases, this will involve moving to
electrified technologies powered by low-carbon electricity. However, some end uses, such as
chemical manufacturing, process heating in glass, cement, and other materials fabrication
have thus far proved difficult or prohibitively expensive to electrify.
E3 has estimated RNG demand curves as part of its prior PATHWAYS analyses for California, to
assess how much of the resource may be needed to meet the state’s climate goals. Figure 39
depicts the same RNG supply curves E3 used in its PATHWAYS model, with data from Jaffe
(Jaffe, et al., 2016) and the U.S. DOE’s Billion-Ton Report (Langholtz, Stokes, & Eaton, 2016)
to create forecasted RNG supply curves for California in 2030. The year 2030 represents a
milestone in evaluating the state’s policy targets and a useful timeframe for consideration of
the initial effects of 2023 building code changes. The curves in Figure 38 estimate the annual
quantity of RNG that suppliers may be willing to provide at each all-in production and
transportation cost, which includes all the cost components described in the preceding text.
Note that these supply curves do not include advanced biofuels from purpose-grown crops
(since purpose-grown crops can have ill effects on land use and other resource cycles, and the
forecasted supply of purpose-grown crops is highly uncertain). They do, however, include non-
purpose-grown woody biomass and crop residual-derived RNG (under the assumption that
RNG development from these sources increases in the next decade). These curves also do not
account for the retail markup added by sellers of RNG.
Figure 39 shows forecasted economywide RNG demand for 2030, assuming no building
electrification. This includes demand from residential, commercial, transportation and industrial
sectors, but excludes gas demand from electric generators. The figure also shows 2015
demand for reference.
Natural gas demand (excluding electricity generation) is projected to decrease over time: the
2030 demand scenario assumes (1) improvements in residential and commercial energy
efficiency as the building stock turns over, (2) implementation of California’s climate policy
drives a 30 percent improvement in natural gas use efficiency for industrial end uses, and (3)
reduced demand from petroleum industries as petroleum use from vehicles declines to meet
California’s climate goals. However, even with these reductions in gas demand, a large gap still
exists between RNG supply and the gas demand under this scenario that meets California’s
climate goals: 2015 and 2030 gas demand of approximately 1,600 and 1,300 TBtu, respectively,
greatly exceed the largest potential supply of 520 TBtu shown.

58
Figure 39: Forecasted 2030 Renewable Natural Gas Supply and Gas Demand
Figure 39 shows that in-state and California’s share of U.S. renewable natural gas is much lower than
estimated gas demand in 2030 (excluding gas demand for electricity generation).
Source: Lawrence Berkeley National Laboratory
Thus, even with projected technology and infrastructure improvements, it is evident that RNG
will likely be a scarce resource. If RNG is used as a ZNE compliance option, homeowners and
home developers will likely be competing with other end uses for RNG and biomass
feedstocks. These competing demands will include existing residential and commercial
buildings, industrial end uses that have fewer alternatives to continued gas consumption, as
well as transportation subsectors. Current state policy tends to push available and low-cost
RNG supplies into electricity generation or transportation. Onsite production of RNG at many
landfills, dairies or MSW facilities is co-located with onsite electricity generation. For RNG use
as transportation fuels, climate externalities are taken into consideration through existing
policies (the Low Carbon Fuel Standard [LCFS] and the United States Renewable Fuels
Standard [RFS]. These credits allow RNG produced for transportation fuel to receive both the
market price for RNG and the additional LCFS and RFS credits, resulting in more cost-effective
RNG for transportation. Homeowners may, therefore, see high and uncertain prices for RNG.
Different end uses also have varying options for alternative energy supply and ease of
electrification. For instance, even within the residential and commercial building sector, which
faces fewer challenges to electrification compared to industrial end uses, it is more difficult to
electrify existing buildings than new construction. Given the limited trajectories across all
industries that enable California to meet its 2050 carbon reduction goals, policymakers may
wish to direct the state’s limited RNG supply to end uses with fewer, or less cost-effective,
greenhouse gas mitigation alternatives.
Cost-Effectiveness of Renewable Natural Gas Home Compared to the Prescriptive Home
RNG mixed-fuel ZNE homes are not cost-effective by the current standard of comparison, that
is, using TDV values to compare to the CEC’s reference mixed-fuel, 2019 Title 24 code-
$0
$10
$20
$30
$40
$50
$60
$70
$80
$90
$100
$110
$120
0 200 400 600 800 1,000 1,200 1,400 1,600 1,800
All
-in
Pro
du
ctio
n a
nd
Tra
nsp
ort
ati
on
Co
st
(20
23
$/M
MB
tu)
RNG Supply (Trillion Btu)
In-stateonly
Population-weightedU.S. share, excluding purpose-grown crops
2030 gas demand with no building
electrification (excluding electricity
generation)
2015 gas demand (excluding electricity generation)

59
compliant home. Mixed-fuel RNG ZNE homes are forecast to be more expensive than the
reference fossil mixed-fuel home due to the cost premium of RNG over fossil-based natural
gas. The RNG on the very lowest end of the supply curves shown previously is forecast to
have a delivered price of approximately $27 per million British thermal units (MMBtu) in 2020.
Assuming a delivered fossil natural gas price of $17/MMBtu, this represents a $6/MMBtu cost
premium for RNG. As shown in Figure 40Figure 40:, this equates to $4,000 TDV-weighted over
the assumed 30-year life of the building in 2023. In reality, there is likely to be a very limited
quantity at this lowest supply cost, which is sourced from landfill resources that have low
upgrading and pipeline costs. The premium that homeowners would pay for RNG is expected
to increase as total RNG demand increases and the lowest-priced RNG sources are no longer
the marginal resource.
Figure 40: Time Dependent Valuation Cost-Effectiveness Comparison — Renewable Natural Gas Mixed-Fuel vs. 2019 Code-Compliant Mixed-Fuel Prescriptive Home
Figure 40 shows that sourcing a mixed-fuel home with renewable natural gas instead of fossil natural gas
would incur $4,007 additional cost (TDV premium over life of home).
Source: Lawrence Berkeley National Laboratory
Further, unlike the ZNE compliance option of rooftop solar (for which a new homeowner can
pay an upfront cost for compliance), the use of RNG requires the continual purchase of fuel at
future market prices. This makes cost-effectiveness over the lifetime of the home difficult to
ensure. A long-term contract for RNG could address this concern, but since RNG prices are
subject to high levels of price uncertainty, suppliers and homeowners may not wish to commit
to long-range future contracts for this fuel.
This analysis suggests that the RNG mixed-fuel home will not pass the CEC’s cost-effectiveness
standard in the 2022 cycle. It could, however, be offered as a compliance option. This option
could potentially include a blended RNG and fossil-based natural gas mix to reduce costs to
the homeowner, though this would mean that homes would not exclusively use energy
sources that are defined by state agencies as carbon neutral.
Assuming that the ultimate goal of ZNE is for homes to use only energy sources that are
classified as carbon neutral, it is useful to compare the cost-effectiveness of new all-electric
$4,007 TDV premium over fossil natural gas over the life of the home
0
10,000
20,000
30,000
40,000
50,000
60,000
2019 Prescriptivemixed fuel home
Mixed fuel home with100% of natural gas
use replaced with RNG
TD
V w
eig
hte
d $
(2
02
3$
)
Fossil natural gas TDV
RNG TDV
Electricity TDV

60
versus new mixed-fuel-with-RNG homes as shown in Figure 41. Note that this comparison only
considers the cost of fuel and does not analyze the capital cost differences of each type of
residential construction. Again, the parity price for RNG is $27.36/MMBtu (retail), which is at
the low end of the forecasted RNG supply curve in 2020. Any higher price would make the
new mixed-fuel-with-RNG home more expensive than the new all-electric home.
Figure 41: California Energy Commission 2019 Code-Compliant Mixed-Fuel Home versus Fossil Natural Gas Replaced by 100 Percent Renewable Natural Gas
Figure 41 shows that to achieve equivalent annual energy cost on a TDV-weighted basis, a 2019 code
compliant mixed-fuel home would need RNG at a retail price of $21.36/MMBtu.
Source: Lawrence Berkeley National Laboratory
Implementation Challenges for Renewable Natural Gas
There are some key challenges around ensuring ZNE compliance that would need to be
addressed to offer RNG as a ZNE compliance option. Unlike the ZNE compliance options of
rooftop solar, in which a new homeowner can pay an upfront cost for compliance, use of RNG
requires the continual purchase of fuel at future market prices. Policy administrators would
need to ensure that homeowners continue to purchase RNG instead of fossil-based natural
gas. This could be achieved through:
• Long-term contracts for RNG
• An upfront, lump-sum payment for building lifetime RNG use
• A credit system, like renewable energy credits, under which the carbon-neutral attribute
of the RNG is tracked.
Each of these solutions faces barriers. Because RNG prices are subject to high levels of price
uncertainty, suppliers and utilities may not wish to commit to long-range future contracts or
upfront lump-sum payments for this fuel. This would also have the impact of creating two
customer classes for natural gas that see very different prices, with a higher gas rate for
homeowners in new homes and a lower gas rate for homeowners in existing homes. This
could be viewed by customers as unfair. A credit system is certainly feasible, but has not yet
Parity RNG price:$27.36/MMBtu retail
($14.82/MMBtu wholesale)
0
10,000
20,000
30,000
40,000
50,000
60,000
All-electric home Prescriptive mixedfuelhome with 100% ofnatural gas use replaced
with RNG
TDV
-we
igh
ted
$ (2
023$
)
Electricity TDV
RNG TDV

61
been established, and would require significant coordination among the CEC, CPUC, and gas
companies.
Community Solar The dominant source of generation for new ZNE homes is expected to be rooftop solar
participating in the NEM program. However, community renewables provide many potential
advantages relative to rooftop solar, including (1) providing ZNE compliance at a lower cost,
(2) providing a potential option for ZNE compliance where rooftop solar is infeasible, and (3)
reducing the costs to ratepayers who do not install solar.
Providing Zero Net Energy Compliance at Lower Cost
Installing solar in larger installations, as in community solar projects, can take advantage of
economies of scale that are not available to rooftop solar at the level of a single home. This
decreases the installed cost on a dollar per watt ($/Watt) basis. NREL estimates that as of the
first quarter of 2016, larger-scale solar (200kW) costs almost 40 percent less than residential
rooftop solar, due largely to reductions in soft costs on a per-watt basis (see Figure B-5 in
Appendix B).
The kWh production can also be higher for community solar systems than for rooftop. Rooftop
solar is constrained by the limitations of the roof on which it is being installed. Community
solar can be installed on sites that do not face these constraints, so that the tilt and azimuth of
the panels can be configured to maximize solar production over the course of the year.
Additionally, community solar panels can be installed in areas that are free from tree and
building shade, which can limit the production of some rooftop systems in the morning or
evening.
The cost benefits of community solar apply whether the installation is close to the home load
receiving ZNE compliance credit, such as within the same municipality, or further from the
load, such as within the same utility service territory.
This combination of lower installed cost on a $/Watt basis and higher output suggest that
community solar could meet ZNE goals at a lower total cost to California than mandated
residential solar. For example, a 2016 study of the levelized cost in dollars per megawatt-hour
($/MWh) of solar PV at varying scales estimated that community solar systems cost
approximately 40 percent less than residential rooftop solar (see Figure B-6 in Appendix B).
Distributed solar today is increasingly being installed in conjunction with energy storage and
smart inverter devices, a trend that many expect to increase in the coming years. Smart
inverters can control the output of the rooftop solar system in response to the needs of the
broader electric system, specifically through voltage control and volt/volt-ampere reactive
(VAR) or reactive power optimization. This responsive control can increase the value of the
output of the solar system to the utility. Energy storage can increase the value of solar to the
grid, by storing excess solar production and discharging in hours when system costs are
highest (for example, when natural gas peaking units are running or there is a general system
capacity shortage). Just as these smart inverters and energy storage systems can be installed
with rooftop solar systems, they can also be installed in conjunction with community solar
projects. Thus, the existence of these technologies does not lessen the relative cost
advantages of community solar outlined above.

62
Feasibility
While some new homes can feasibly install rooftop solar, for many new homes it is not
feasible. New homes that are built near trees or other tall buildings often experience
significant shading that makes the installation of solar panels impractical. Similarly, the
orientation, size or roof design of some homes may make it infeasible to install solar arrays
that produce enough electricity to offset annual use. For example, in the northern hemisphere
solar panels oriented toward the south produce significantly more output than solar panels
oriented toward the north. This optimal orientation may not be available for all homes. For
some homes, the available roof area may be inadequate for the quantity of solar panels
needed, regardless of orientation. Finally, even if a home can feasibly install a rooftop system
that is optimally oriented and free from substantial shading, there is the potential that it may
not be able to interconnect to the local distribution system, due to constraints such as
distribution system overloading or other engineering requirements (California Public Utilities
Commission, 2019). The possibility of a rejected interconnection request will increase as
penetrations of distributed solar on California’s grid continue to increase. For these homes
where rooftop solar is infeasible or impractical, community solar is the only viable ZNE
compliance option.
Nonparticipant Impacts
Rooftop solar is cost-effective to participants (that is, those customers who install rooftop
solar) under a variety of configurations, climate zones, and potential NEM tariff reforms.
However, NEM does increase rates for non-participating customers through a cost-shift
(California Public Utilities Commission, 2013). Under NEM, the utility purchases renewable
energy from participating customers at a price equivalent to the full retail rate, which is
expected to average $0.20/kWh in California by 2020. (E3; NORESCO, 2017). The difference
between this $0.20/kWh and the value of the solar energy, which is approximately
$0.10/kWh,24 is a cost borne by all other non-participating ratepayers. The $0.10/kWh residual
cost-shift, when multiplied by the number of expected new homes, creates a cost impact to
non-participating ratepayers of approximately $80 million per year in 2020 and rising to $240
million per year by 2022.25 These costs increase rates to non-participating customers. In
contrast, if the utility were able to construct community renewables for a levelized price lower
than this retail rate ($0.20/kWh), the impacts on non-participating customers would be
reduced. Based on the forecasted prices of large-scale community solar listed described
previously, these systems can be constructed for 40 percent to 60 percent less than the full
retail rate of $0.20/kWh.26 This suggests that there are cost reduction opportunities for the
utilities to pursue on behalf of their non-NEM customers that could mitigate rate impacts.
24 2019 CEC TDV model (average of all TDV components except for Retail Rate Adder).
25 $0.10/kWh cost-shift multiplied by 8000 kWh/yr per new home, multiplied by approximately 100,000 new
home starts per year.
26 $2.13/W and $1.42/W equates to $0.12/kWh and $0.08/kWh, which is 42 percent and 61 percent less than the $0.20/kWh retail rate, respectively. Assumptions: 18 percent capacity factor, 7 percent nominal discount rate,
25-year PV system life.

63
Potential Community Renewables Solutions
There are solutions that the CEC, CPUC, and investor-owned utilities could collectively pursue
as a workable and attractive new community renewables program for ZNE compliance. The
research team presents two hypothetical community renewables programs. The treatment
here is not meant to be comprehensive or exhaustive, however, nor to address all the
challenges and barriers associated with community renewables such as ownership structures,
capital sources, cash flow issues, incentive options, and past examples from other states.
Ratepayer-Funded Green Tariff
A ratepayer-funded green tariff could be designed to meet the three criteria described
previously: (1) providing ZNE compliance at lower cost, (2) providing a potential option for
ZNE compliance where rooftop solar is infeasible, and (3) reducing the costs to ratepayers who
do not install solar. In this hypothetical program, the load-serving entity (LSE) would commit
to procuring renewable energy for a new home. The incremental cost of this renewable energy
would be recovered from all ratepayers, to make the program cost-effective for the
participant. At an estimated community renewable cost premium of $0.02/kWh, this program
would create a cost to non-participants of approximately $16 million in 2020,27 which is
substantially less than the $80 million 2020 non-participant cost impact that is predicted from
rooftop solar participating in NEM as it is currently defined. Because the LSE would administer
this program, it could provide a streamlined verification process to building departments to
ensure that the community renewables meet all necessary ZNE compliance criteria. In
particular, the fact that this solution is cost-effective to the participant should reduce concerns of subscriber attrition.
Upfront Green Tariff
Another option is an upfront green tariff. In this case, the owner or builder of a new home
would have the option to purchase a 30-year supply of community renewable electricity to be
attributed to the home as a ZNE compliance measure in lieu of installing rooftop solar. The
cost of this option would be set as the net present value of the cost premium of community
renewable solar power over standard electric power. This amount would vary for each home,
but under today’s prices would total approximately $2,000 per home.28 This payment would
fund LSE investments in community solar assets that would be used to serve to the home.
Once the new homeowner had paid the upfront charge, he or she would receive full electric
service from the LSE at standard electric service rates.
Since the participant bears the cost premium of community renewable energy in this case,
there is no cost impact to other ratepayers. However, because this option imparts a significant
additional cost to the homeowner, it is not cost-effective to the participant. It therefore cannot
be mandated by the CEC for ZNE compliance but may be offered as a compliance option.
Since it is not cost-effective to the participant, it is not clear that this option would encourage
community renewables as a ZNE compliance mechanism at scale. Most homeowners are likely
27 Assumes 8,000 kWh/yr per new home, $0.02/kWh community renewables premium, 100,000 new home starts in 2020. Nominal dollars.
28 8000 kWh/yr, $0.02/kWh community renewable premium, 30-yr life, 7 percent discount rate.

64
to prefer rooftop solar with NEM. However, this option would provide homes with an
alternative compliance option where rooftop is infeasible or otherwise unwanted by the
homeowner. It also may be more popular with home builders and developers, who are
sensitive to home listing prices and may prefer to add the $2,000 upfront cost of this program
rather than the full upfront cost of a rooftop solar system.
Expert Elicitation Key Findings Results from the expert elicitation process were used to determine overall important cost
considerations from a range of California builders and to ground-truth important cost
estimates and cost deltas for important ZNE measure costs such as air source heat pumps,
advanced framing, gas infrastructure costs, and battery storage costs. In many cases, it was
difficult to elicit expert opinion on the exact same measures with the same units that were
used as inputs to the BEopt modeling tool since builders may operate with different sets of
units and often associate aggregated costs with packages of measures. For these cases, the
expert elicitation process provided valuable qualitative information, but their inputs were not
directly usable to inform BEopt cost inputs.
A summary of key findings from the expert elicitation task is provided here with a fuller
discussion of expert inputs on ZNE construction costs in Appendix C.
Current and Future Costs
• Several builders think there is lower cost for all-electric homes vs. mixed-fuel homes
since the savings from avoided gas infrastructure outweighs the cost increases from
electric HVAC and water heating systems.
• Future costs are highly uncertain, but builders noted that heat pump HVAC system
costs could drop 5 percent to 20 percent between now and 2026 and that solar PV
system costs could decline by another 5 percent to 10 percent between now and 2026.
• Many builders expressed the following: the sooner that full ZNE compliance is required,
the sooner that cost reductions associated with building ZNE homes will occur.
Status and Outlook for All-Electric Homes
• All-electric homes have air quality advantages in that gas-fired appliances may create
indoor air quality issues in increasingly airtight homes.
• All-electric may be the end goal, but the market may not be ready for a wholesale shift.
• Eliminating gas could be wasteful since gas is cheap and large-scale infrastructure
exists. Remaining gas customers would bear the operational and maintenance expenses
for the existing gas infrastructure.
• As there is a consistent demand for gas cooktops, gas dryers, and gas furnaces, some
production home builders still plan to have a full gas infrastructure in place so they can
provide gas as an option for home buyers.
Community Renewables and Storage/Demand Response
• Most experts hold a positive attitude toward community solar but also noted the
regulatory challenges and complexity of making it workable in practice.

65
• Among interviewees, only a few custom home builders have installed energy storage in
their ZNE homes, and none of them had implemented any demand response
management system. Production home builders appear more hesitant to try these
technologies mainly because of the costs, unless they receive funding opportunities to
partner with utilities and research institutes
Market Awareness and Policies
• Builders mentioned a general lack of awareness and knowledge of ZNE homes among
home buyers, and builders lack incentives to develop ZNE homes. Establishing an
appraisal system to better capture the financial benefits and added value of ZNE homes
becomes critical to overcome market barriers from lack of knowledge for both builders
and home buyers.
• Care should be taken in the marketing and capabilities of ZNE home. For example,
some experts have seen other builders become involved in lawsuits as a result of
promoting ZNE homes as having a “zero energy bill” or marketing energy efficient home
as ZNE homes.
• Having a clear policy target would facilitate greater ZNE adoption among home builders.

66
CHAPTER 4: Technology/Knowledge/Market Transfer Activities
The knowledge produced through this study is being transferred in several ways. First, this
report discusses the methods and results in detail and will be made available to other
research, standards and codes, and deployment teams. For example, the research team has
shared data and methods for its precooling analysis with Frontier Energy in its work for the
Statewide Utility Team to develop code change proposals for the 2020 California Building
Energy Efficiency Standards (Title 24, Part 6). This sharing of data and method approaches will
be helpful for the CASE report that will analyze whether the demand-flexibility credit for
precooling should be changed. The Statewide Utility Team is comprised of PG&E, SCE, SDG&E,
and Los Angeles Department of Water and Power (LADWP).
The team presented the project results in a panel at the 2018 ACEEE Summer Session, “Net
Zero: Moving beyond 1% of Homes,” held in Pacific Grove, California. This conference
provided an opportunity for stakeholders to meet and discuss the effects of electrification on
cost-effectiveness of ZNE homes, provide feedback on technical inputs of this work, and learn
about best-practice implementations for all-electric, ZNE and ZNE-ready homes. LBNL will
continue to present the project results in various stakeholder meetings, including the ASHRAE
2020 Building Performance Analysis Conference & SimBuild, both in August 2020. The team
expects these conference presentations will help to stimulate further industry-wide discussions
and thinking on ZNE home designs, all-electric ZNE home cost effectiveness, the role of
battery storage, and opportunities for precooling for bill savings and/or peak demand
reductions. As previously discussed, the research team will make available its data, methods,
and results to other research teams or interested stakeholders to support other efforts in code
and standards development and techno-economic analysis for ZNE homes.
Additionally, the technical advisory committee for this project included stakeholders from
utilities, government agencies, and academia. Through their participation in this project they
have helped in the development of assumptions and have reviewed the results as they were
developed and in their final form. This will ensure that they understand the benefits of this
work and that the results can be used to direct future programs and studies.
Finally, LBNL anticipates publishing the results of this analysis in a journal. The article is in
preparation; publication is expected in 2021. This will make the data, methods, and results of
this work broadly available to the research, development, and deployment (RD&D)
communities on a national and international level. In addition to communicating and archiving
the key findings of this work to a wider audience, this publication will also provide an
opportunity to highlight to other RD&D stakeholders key areas and opportunities for further
cost reductions and other important areas for follow up work (for example, passive homes,
thermal storage integration, and greater characterization of the potential cost savings from
pre-fabricated components).

67
This study has helped to prepare the CEC and E3 for the development of final 2022 TDV
values, helped the CEC improve their production cost grid modeling (using the PLEXOS tool),
and has informed E3’s work on non-residential solar policies.
68
CHAPTER 5: Conclusions
In conclusion, the research team finds the following key findings from this work:
Building Energy Modeling Key Findings
• New all-electric 2,100 ft2 homes with cost-optimized designs have lower costs on a 30-
year life-cycle cost basis than 2019 Title 24–compliant all-electric reference homes for
all climate zones; similarly, cost-optimized designs for mixed-fuel new 2,100 ft2 homes
have lower life-cycle costs than 2019 Title 24–compliant mixed-fuel reference homes in
all climate zones.
• New all-electric 2,100 ft2 homes with cost-optimized designs are comparable to cost-
optimized mixed fuel homes on a life-cycle cost basis across most climate zones and
have significantly lower CO2 emissions (average of 38 percent, or 26 metric tons,
lower).
• All-electric home costs can benefit from eliminating natural gas infrastructure costs.
• For all-electric homes, higher performance heat pump systems with greater energy
efficiency (for example, SEER 22 and HSPF 10 heat pumps) are cost-effective for
climate zones with high cooling energy demand.
• Greater energy efficiency in large appliances, plug-load management, hot water pipe
insulation, and ducts in conditioned space are cost-effective measures across climate
zones and building types.
• All-electric single-family homes with cost-optimized designs have an average solar PV
system size 1 kW larger than mixed-fuel homes to offset increased electricity
consumption.
• When annual total solar PV electricity generation is greater than the annual total site
electricity consumption, cost-effectiveness cannot be achieved under the less generous
solar PV compensation policy assumed here (avoided cost for exports).
• PV system orientation facing southwest and west is advantageous compared to south
when optimizing life-cycle cost due to coincidence with higher TDV values in the late
afternoon.
• Full ZNE homes (TDV-ZNE29) can be achieved by oversizing solar PV systems (without
storage) to offset the TDV of a building’s total annual site energy usage with TDV from
PV-generated electricity. However, this violates NEM policy that solar PV output not
exceed site electricity consumption.
29 Full ZNE homes (“TDV-ZNE”) refers to homes that meet the TDV-based ZNE definition described in the
Introduction. Homes that are 2019 Title 24 compliant are not TDV-ZNE since they would require much larger PV
systems and violate NEM policy.

69
Community Renewables: Community Solar and Renewable Natural Gas Key Findings
• Community solar — systems where electricity production is shared by more than one
household — present an alternative ZNE pathway with the potential to provide the
same environmental benefits at a lower cost to Californians compared to onsite rooftop
solar PV.
• Existing community solar programs are not financially attractive to participants and do
not adequately satisfy CEC-outlined ZNE compliance criteria. There is an important
opportunity for the development of new community solar programs that are cost-
effective for participants, improve non-participant impacts relative to the status quo,
and satisfy CEC ZNE-compliance criteria.
• Using renewable natural gas (RNG) for ZNE compliance presents significant challenges
in cost-effectiveness, competing demands in hard-to-decarbonize sectors (industry,
trucking), and supply uncertainties. Given the importance of the limited RNG supply to
the state’s broader GHG goals and the available alternatives to achieve ZNE compliance
in new residential construction, there may be more valuable uses for RNG in meeting
the state’s climate goals than in new residential construction.
Battery Storage Key Findings
• For residential storage to contribute to the state’s ZNE goals and be cost-effective to
the participant, storage control algorithms must consistently and reliably respond to
price signals that are more closely aligned with TDV values than current TOU rates and
with less favorable NEM compensation for grid exports than the current NEM 2.0 policy.
This could be achieved through, for example, dynamic pricing (with some assurance of
customer response), direct utility control, or aggregation services, and NEM policy that
compensates exported electricity at avoided cost.
• If storage is dispatched a) according to current TOU periods, or b) to charge on solar
PV net exports and discharge when load exceeds PV production (“Basic” dispatch),
storage cannot achieve TDV-ZNE.30 Conversely, battery storage that is assumed to
respond to TDV price signals added to cost-optimized all-electric home designs can
achieve TDV-ZNE.
• If compensated under current TOU rates and NEM2.0 policies, storage is not projected
to be cost-effective to the participant even if storage costs reduce over time.31
• If storage systems are instead compensated according to TDV values and sized to
maximize net TDV benefits,32 potential benefits from storage depend upon future
30 That is, enable the building to consume and produce equal amounts of electricity TDV over each year.
31 Assuming that 2023 and 2043 costs are 64 percent and 47 percent of 2018 costs, respectively, and based on
a forthcoming journal paper by Amol Phadke, et al. of LBNL.
32 TDV benefits for 2022 to 2052 minus storage costs.

70
storage cost trajectories. If storage costs decline from present average costs,33 storage
generally sees net TDV benefits, provided the storage is not simply used for backup
power.
• Optimal battery size and associated net benefits vary greatly, depending on climate
zone, dispatch algorithm, and building load.
• Storage systems optimized to maximize net TDV benefits are often smaller than the
current Title 24 minimum size of 5 kWh. This should be considered by the CEC as part
of any market analysis performed to support the inclusion of battery storage in building
codes.
• This analysis does not compare the cost-effectiveness of residential storage to
distribution system-sited storage. Though residential storage is cost effective to the
homeowner under some dispatch methods, battery cost trajectories, and in some
climate zones, it may not be cost effective compared to larger scale storage sited at the
distribution system (or compared to other potential forms of load management such as
demand response from air conditioning or electric vehicles).
Precooling Key Findings
• The CEC’s current tool for calculating new home energy consumption, CBECC-Res,
currently models a cooling setpoint schedule that enables the home’s temperature to
rise above the 78°F (26°C) comfort threshold when the building is unoccupied (referred
to in this report as the “Base Case” schedule). An optimized precooling schedule that
instead dynamically chooses a setpoint schedule each day to minimize TDV costs
(hourly net load multiplied by TDV values) often uses more kWh than the Base Case
setpoint schedule.
• An optimized precooling schedule could save up to 26 percent of net TDV by shifting
electricity consumption from high-cost evening peak periods to lower cost afternoon
hours and reducing the amount of power that is exported to the grid at low avoided
cost compensation.
• A fully optimized precooling control algorithm is impossible to implement, as it requires
perfect foresight of TDV values and cooling needs. However, the research team finds
that a single setpoint schedule for all days that is customized by climate zone could
provide much of the precooling cost savings provided by an optimized schedule, while
being simpler to implement and not requiring forecasting.
• An important benefit of these precooling schedules is that they will increase customers’
comfort levels compared to Base Case setpoint schedules.
Policy Implications
• All-electric homes are attractive for their lower overall CO2 emissions than mixed-fuel
homes and are cost effective for all climate zones compared to all-electric 2019 Title 24
compliant homes.
33Assuming that 2023 and 2043 costs are 64 percent and 47 percent of 2018 costs, respectively.

71
• With tighter building shells and energy-efficient lighting, energy-efficient large
appliances (clothes dryers and washers, dishwashers, refrigerators, cooktop stoves, and
ovens) are increasingly important for life-cycle energy costs.
• Similarly, plug loads (miscellaneous electric loads, or MELs,) represent a growing
fraction of electricity usage, and plug load reduction measures in this study, such as
advanced power strip and smart plugs, show promise as cost-effective energy
measures.
• With the intent to provide more viable community solar ZNE compliance options, the
research team provides two potential designs including a ratepayer-funded Green Tariff
and an Upfront Green Tariff.
• Storage systems optimized to maximize net TDV benefits are often smaller than the
current Title 24 minimum size of 5 kWh and common commercially available sizes like
the 13.5 kWh Tesla Powerwall. Any market analysis performed to support the inclusion
of battery storage in building codes should consider this fact.
• Three elements are needed to realize the savings from precooling in new residential
construction.
o The CEC should require or credit the installation of occupant controlled
communicating smart thermostats in new construction. This technology is
required to enable future control of cooling loads by aggregators or utilities if
customers agree to provide this control.
o The price signal to customers or to aggregators needs to be sufficiently time-
differentiated to encourage customers to pre-cool.
o Customer education efforts are needed to communicate the financial and comfort
benefits of precooling and reiterate customer control and opt-out options. These
education efforts could be undertaken by the CEC, the CPUC, aggregators,
and/or utilities. The research team expects that with these three elements in
place, customers are likely to take up precooling to increase their comfort while
lowering their electric bills.
Future Work This project did not consider some available options: passive homes, homes which rely on
prefabricated components, high-rise apartment buildings, thermal storage, hydronic heating
district heating, and CHP units. Each of these options has potential to some degree and are
deserving of consideration for follow up.
The study also did not focus on lower income/affordable units although basic structural
designs may be similar for affordable units compared to market-rate units. Nor did the study
quantify grid interactions or grid support that can be provided by electrified end uses in the
context of ZNE homes. Both are important topics that should continue to be modeled and
quantified.
Combined heat and power units, or self-contained distributed energy systems that provide
both onsite power and heating, are most cost-effective where there is sufficient year-round
heating load. Waste heat from a power generation unit could be used for water heating
throughout the year. However, CHP units are generally more cost effective for units that are

72
sized larger than residential unit sizes, since the cost per kW is more attractive at larger
system sizes — for example, greater than 50 to 100kW systems for commercial buildings (M.
Wei et al. 2014). Also, the CO2 savings and criteria emissions savings from CHP systems
versus grid electricity and conventional natural-gas fired building heating is greater in locations
where the supply of grid electricity has large fractions of coal-based power, which is not the
case for California (Wei 2018 encyclopedia).
Energy efficiency from ZNE homes also offers intangible benefits from greater comfort and
health from indoor/outdoor air quality and potentially greater productivity from ZNE building
goals. This study did not quantify those benefits, although it would be an informative area for
follow-up work.
Passive homes, thermal storage integration, and greater characterization of potential cost
savings from prefabricated components are important areas for follow-up work. As noted
above, modeling of mini-split heat pumps in single-family homes is needed. Additionally,
modeling of ZNE home designs and subdivisions can be extended to include other sectors such
as transportation (for example, optimal ZEV battery charging and discharging), water, and
waste for more integrated system design. These types of systems are most readily designed
and implemented for new developments.
Thus, new housing in California represents an opportunity to meet multiple policy objectives
including ZNE goals, grid harmonization, greater resilience to climate change, affordability, and
greater water and resource conservation.

73
CHAPTER 6: Benefits to Ratepayers
This research is important to ratepayers because it provides approaches for cost-effective ZNE
designs for all-electric and mixed-fuel homes and identifies the conditions under which battery
storage and precooling options can be cost-effective. All-electric designs, if adopted by
contractors, architects, building owners, residents, and property owners, can lower annual
energy costs and realize an average of 38 percent annual CO2 savings compared to mixed-fuel
family homes. All-electric homes with onsite solar or community solar agreements could
insulate consumers from future volatility in natural gas prices and increasing electricity prices
from the grid.
Increasing the adoption of all-electric ZNE homes across California will improve the health and
safety of ratepayers by reducing criteria pollutants from natural gas combustion. To the extent
that natural gas consumption will be reduced with greater adoption of alternatives such as
electrically powered heat pump-based water heating or space heating, consumer and
neighborhood safety will be improved by reducing natural gas distribution, possible leakage,
and combustion for onsite heat generation.
Transitioning to ZNE all-electric new single-family and multi-family homes by 2023 would
result in more than 50 Mt CO2 cumulative savings from 2023–2050 with about 0.62 billion
therms of natural gas savings in 2050, resulting in 3.3 million metric tons net CO2 savings in
2050.34 (Note that this represents savings from shifting from a baseline of gas and electric ZNE
new homes to all-electric ZNE homes starting in 2023). The criteria emissions avoided from
natural gas combustion in 2050 are estimated to be 1,080 tons of nitrogen oxides (NOx),
1,290 tons of carbon monoxide (CO), and 180 tons of volatile organic compounds (VOC).
With all-electric homes with onsite solar PV coupled with electricity storage, there is the
potential for greater resilience in buildings, fewer power outages, and reduced potential
hazards associated with power outages. Onsite PV/heat pump heating with storage or solar
thermal water heating systems will provide greater reliability of water and space heating
service in times of natural disaster, blackouts, or earthquakes. As “distributed heating”
technologies such as this become more prevalent, consumers would be less reliant on the
natural gas system and the electricity grid. Similarly, onsite PV with storage can provide air
conditioning service during a power outage and improve the health and safety of the most
vulnerable populations in intense heat waves. Precooling can also improve residential comfort
by providing a cooler home when residents come home in the late afternoon.
This work provides intangible ratepayer benefits by providing a detailed modeling framework
for ZNE single-family and multi-family homes. An aggressive ZNE building path may provide
intangible benefits for the state as a technological and/or industrial leader in various energy
34 This assumes 4.9 million new all-electric ZNE homes from 2023 to 2050, or about 175,000 homes per year,
and corresponds to about 127 therms per year of natural gas savings and about 0.67 metric tons of CO2 savings
per year per home.

74
technologies, energy systems, and energy deployments (for example, heat pump systems,
demand response controls, electrical and thermal storage). There is also value provided to
other regions and states by demonstrating that California is serious about tackling the long-
term climate challenge, and studies such as this one can serve as both an example and a call
for further action, both within and outside California.
This research also sets the groundwork for the future Title 24 building cycle with new time
dependent valuations for 2022 and a “High Renewables” time dependent valuation case with a
lower GHG target in 2030 of 30MMt CO2e in the electricity sector, new zero net energy
building designs, and new battery storage and precooling cases.

75
LIST OF ACRONYMS
Term Definition
AB 3232 California Assembly Bill 3232, Friedman, Chapter 373, Statutes of 2018
ACE avoided cost for export
ACH air changes per hour
AFUE annual fuel utilization efficiency
BEopt Building Energy Optimization Tool
California ISO California Independent System Operator
California ARB California Air Resources Board
CEE Consortium for Energy Efficiency
CEF combined energy factor
CH4 methane gas
CHP combined heat and power
CO2 carbon dioxide
Community solar community solar, or shared solar, refers to a nearby site separate from
the site of the home, with a solar PV installation, a portion of whose output is associated with one residential home.
CPUC California Public Utilities Commission
CZ climate zone
DC direct current
Demand shifting A type of demand response in which a given electricity load is shifted to a different time of the day, usually to better align with a more favorable electricity rate.
$/kWh dollars per kilowatt-hour
$/Watt dollars per Watt
EF energy factor
E3 Energy and Environmental Economics, Inc.
EIA United States Energy Information Administration
EPIC Electric Program Investment Charge. Created by the California Public Utilities Commission in December 2011, supports investments in clean
energy technologies that benefit electricity ratepayers of Pacific Gas and Electric Company, Southern California Edison Company, and San Diego
Gas & Electric Company.
ft2 square feet of area
GHG greenhouse gas, including CO2, CH4, N2O, and many common refrigerant gases

76
Term Definition
Grid
harmonization
Grid harmonization refers to the concept of adding electricity generation
or load in such a way that the grid is not impacted negatively. For example, adding large amounts of solar PV to the grid can result in over
generation during certain times of the year; and introducing electricity storage or demand shifting with large amounts of solar PV can provide
better grid harmonization.
HPHW heat pump water heater
HVAC heating, ventilating, and air conditioning
IEPR Integrated Energy Policy Report
IRP integrated resource plan
kW kilowatts
kWh kilowatt-hours
LBNL Lawrence Berkeley National Laboratory
LCFS Low Carbon Fuel Standard
LSE load-serving entity
MEL miscellaneous electric loads
MMBtu million British thermal units
MMcf million cubic feet
MMT million metric tons
MSW municipal solid waste
NEM, NEM 2.0 Net energy metering. Allows customers who generate their own energy
("customer-generators") to serve their energy needs directly onsite and to receive a financial credit on their electric bills for any surplus energy
fed back to their utility.35 NEM 2.0 refers to the current NEM policy for rooftop PV in California.
NPV net present value
NREL National Renewable Energy Laboratory
OC occupancy sensor
Precooling Precooling is a type of demand shifting where a building is pre-cooled to better coincide with the profile output of solar PV or to coincide with
periods of low utility rates.
PV photovoltaic
RFS Renewable Fuel Standard
RNG renewable natural gas. Usually refers to methane which is derived from
renewable sources such as biogas from landfills, municipal solid waste, wastewater plants, and dairies.
35 http://www.cpuc.ca.gov/general.aspx?id=3800, accessed April 26, 2019

77
Term Definition
SB 1477 California Senate Bill 1477, Stern, Chapter 378, Statutes of 2018
SB 32 California Senate Bill 32, Pavley, Chapter 249, Statutes of 2016
SB 100 California Senate Bill 100, De León, Chapter 312, Statutes of 2018
SB 1383 California Senate Bill 1383, Lara, Chapter 395, Statutes of 2016
SEER seasonal energy efficiency ratio
SGIP Self-Generation Incentive Program
Smart grid Smart grid is the thoughtful integration of intelligent technologies and innovative services that produce a more efficient, sustainable, economic,
and secure electrical supply for California communities.
SNG synthetic natural gas
TBtu trillion British thermal units
TDV Time dependent valuation used in the cost-effectiveness calculations for Title 24. The concept behind TDV is that energy efficiency measure savings should be valued differently depending on which hours of the
year the savings occur, to better reflect the actual costs of energy to consumers, to the utility system, and to society. At its root the concept
of TDV is quite simple: it holds the total cost of energy constant at forecasted retail price levels but gives more weight to on-peak hours
and less weight to off-peak hours. TDV is based on a series of annual hourly values for electricity cost (and monthly costs for natural gas) in a given weather year.
TOU time-of-use
ZNE Zero net energy. In buildings, there are different definitions for ZNE
depending on source or site energy. In California, the definition for ZNE is based on TDV: “Based on the unit of a single project, a ZNE building is one where the value of the energy produced by onsite renewable
energy resources is equal to the value of the energy consumed annually by the building measured using the Time Dependent Valuation metric.”
Title 24 Building
Code
Building code for California including energy efficiency measures; revised
every three years.
Time of use rates (TOU)
TOU rates refer to customer utility rates that vary as a function of time.
U.S. DOE United States Department of Energy

78
REFERENCES
CA AB 3232. AB-3232 Zero-emissions buildings and sources of heat energy. (2018).
CA SB 100. SB-100 California Renewables Portfolio Standard Program: emissions of
greenhouse gases. (2018).
CA SB 1383. SB-1383 Short-lived climate pollutants: methane emissions: dairy and livestock:
organic waste: landfills. (2016).
CA SB 1477. SB-1477 Low-emissions buildings and sources of heat energy. (2018).
CA SB 32. SB-32 California Global Warming Solutions Act of 2006: emissions limit. (2016).
California ISO. (2016). Fast Facts: What the duck curve tells us about managing a green grid.
California Statewide Utility Codes and Standards Program. (2011). Residential Roof Envelope
Measures.
CEC. (2015). 2016 Alternative Calculation Method Approval Manual for the 2016 Building
Energy Efficiency Standards Title 24, Part 6, and Associated Administrative Regulations
in Part 1.
CEC. (2017a). High Performance Attics – Final Report, Measure Number: 2019-RES-ENV2-F,
Residential Envelope.
CEC. (2017b). High Performance Walls – Final Report, Measure Number: 2019-RES-ENV1-F,
Residential Envelope.
CEC, & CPUC. (2015). New Residential Zero Net Energy Action Plan 2015-2020.
Clemen, R.T., & Winkler, R.L. (1999). Combining Probability Distributions From Experts in Risk
Analysis. Risk Analysis, 19(2), 187–203. https://doi.org/10.1023/A:1006917509560
Cooke, R.M., & Goossens, L.L.H.J. (2008). TU Delft expert judgment data base. Reliability
Engineering & System Safety, 93(5), 657–674. https://doi.org/https://doi.org/10.1016/
j.ress.2007.03.005
CPUC. (2018). Net Energy Metering (NEM). Retrieved June 4, 2019, from https://www.cpuc.
ca.gov/General.aspx?id=3800
Curtright, A.E., Morgan, M.G., & Keith, D.W. (2008). Expert Assessments of Future
Photovoltaic Technologies. Environmental Science & Technology, 42(24), 9031–9038.
https://doi.org/10.1021/es8014088
Davis Energy Group, Misti Bruceri & Associates LLC, & Enercomp Inc. (2017). CALGreen All-
Electric Cost Effectiveness Study. San Francisco, CA.
Desroches, L.B., Garbesi, K., Kantner, C., Van Buskirk, R., & Yang, H.C. (2013). Incorporating
experience curves in appliance standards analysis. Energy Policy, 52, 402–416. https://
doi.org/10.1016/j.enpol.2012.09.066

79
Energy and Environmental Economics Inc. (E3). (2014). Time Dependent Valuation of Energy
for Developing Building Efficiency Standards: 2016 Time Dependent Valuation (TDV)
Data Sources and Inputs.
Energy and Environmental Economics Inc. (E3). (2018). Energy and environmental policy.
Retrieved June 4, 2019, from https://www.ethree.com/our-work/expertise/energy-
environmental-policy/
Energy Information Administration. (2015). Annual Energy Outlook (AEO). Washington, DC.
German, A. (2017). Final Report. California Statewide Codes and Standards Enhancement
(CASE) Program.
Hendron, R., & Hoeschele, M. (2018). Energy Savings Potential and Cost-Effectiveness Analysis
of High Efficiency Windows in California. San Francisco, CA.
Hoen, B., Adomatis, S., Jackson, T., Graff-Zivin, J., Thayer, M., Klise, G.T., & Wiser, R. (2017).
Multi-state residential transaction estimates of solar photovoltaic system premiums.
Renewable Energy Focus, 19–20, 90–103. https://doi.org/https://doi.org/10.1016/j.ref.
2017.05.006
Hoeschele, M., E., Weitzel, A., & German, R.C. (2015). Evaluation of Ducts in Conditioned
Space for New California Homes, PG&E Emerging Technologies Program Project
Number: ET13PGE1062.
Hora, S.C., Fransen, B.R., Hawkins, N., & Susel, I. (2013). Median Aggregation of Distribution
Functions. Decision Analysis, 10(4), 279–291. https://doi.org/10.1287/deca.2013.0282
Jaffe, A.M. (2016). The Feasibility of Renewable Natural Gas as a Large-Scale, Low Carbon
Substitute Contract No. 13-307: Prepared for the California Air Resources Board and the
California Environmental Protection Agency.
Kittner, N., Lill, F. & Kammen, D. (2017). Energy Storage Deployment and Innovation for the
Clean Energy Transition. Nat Energy 2, 17125 doi:10.1038/nenergy.2017.125
Lazard. (2019). Lazard’s levelized cost of energy analysis—version5.0.
https://www.lazard.com/media/451087/lazards-levelized-cost-of-storage-version-50-
vf.pdf
LBNL. (2019). Standby Power. Retrieved June 4, 2019, from https://standby.lbl.gov/faq/
Levinson, R.M., Chen, S.S., Ban-Weiss, G.A., Gilbert, H.E., Berdahl, P.H., Rosado, P.J., …
Kirchstetter, T.W. (2016). Next-Generation Factory-Produced Cool Asphalt Shingles:
Phase 1 Final Report. Berkeley, CA.
Mahone, A., Subin, Z., Kahn-Lang, J., Allen, D., Li, V., Moor, G. De, … Price, S. (2018). Deep
Decarbonization in a High Renewables Future Updated Results from the California
PATHWAYS Model.

80
Meyer, M.A., & Booker, J.M. (2001). Eliciting and Analyzing Expert Judgment: A Practical
Guide. ASA-SIAM Series on Statistics and Applied Mathematics.
Morgan, M.G. (2014). Use (and abuse) of expert elicitation in support of decision making for
public policy. Proceedings of the National Academy of Sciences, 111(20), 7176–7184.
https://doi.org/10.1073/pnas.1319946111
Navigant Consulting Inc. (2015). Strategy and Impact Evaluation of Zero-Net-Energy
Regulations on Gas- Fired Appliances, Phase I Technology Report Prepared for:
Southern California Gas Company Emerging Technologies Team, Reference No.:
174473. Boulder, CO.
NREL. (2018a). Building Energy Optimization Tool. Retrieved June 3, 2019, from https://beopt.
nrel.gov/
NREL. (2018b). National Residential Efficiency Measures Database v3.1.0. Retrieved June 4,
2019, from https://remdb.nrel.gov/
State of California. Executive Order S-3-05. (2005).
State of California. (2016). Definition of Zero Net Energy (ZNE) for California State Agency
Compliance with Executive Order B-18-12.
State of California. Executive Order B-55-18 To Achieve Carbon Neutrality. (2018).
U.S. DOE. (2011a). Building America Analysis Spreadsheets. Retrieved June 4, 2019, from
https://www.energy.gov/eere/buildings/building-america-analysis-spreadsheets
U.S. DOE. (2011b). U.S. Billion-Ton Update: Biomass Supply for a Bioenergy and Bioproducts
Industry.
U.S. DOE. (2015). A Common Definition for Zero Energy Buildings.
U.S. DOE. (2016a). Technical Support Document: Energy Efficiency Program For Consumer
Products: Residential Central Air Conditioners and Heat Pumps.
U.S. DOE. (2016b). Technical Support Document: Energy Efficiency Program For Consumer
Products: Residential Furnaces.
Valmiki, M., & Corradini, A. (2016). Energy Savings of Tier 2 Advanced Power Strips in
Residential AV Systems. San Francisco, CA.
Wei, J., Pande, A., Chappell, C., Christie, M., & Dawe, M. (2016). Codes and Standards
Enhancement Initiative (CASE): Residential Ducts in Conditioned Space / High
Performance Attics. TRC Energy Services. San Francisco, CA.
Wei, M., Lipman, T., Mayyas, A., Chien, J., Shuk Chan, H., Gosselin, D., … James, B.D. (2014).
A Total Cost of Ownership Model for Low Temperature PEM Fuel Cells in Combined Heat
and Power and Backup Power Applications LBNL-6772E.

81
Wei, M., Mayyas, A., E Lipman, T., Breunig, H., Scataglini, R., Han Chan, S., … Saggiorato, N.
(2019). Fuel Cell Systems: Total Cost of Ownership: A Volume in the Encyclopedia of
Sustainability Science and Technology, Second Edition. https://doi.org/10.1007/978-1-
4939-7789-5_1020
Wei, M., Smith, S.J., & Sohn, M.D. (2017). Non-constant learning rates in retrospective
experience curve analyses and their correlation to deployment programs. Energy Policy,
107 (May), 356–369. https://doi.org/10.1016/j.enpol.2017.04.035
Wiser, R., Jenni, K., Seel, J., Baker, E., Hand, M., Lantz, E., & Smith, A. (2016). Expert
elicitation survey on future wind energy costs. Nature Energy, 1, 16135. Retrieved from
https://doi.org/10.1038/nenergy.2016.135. https://www.communitysolarvalueproject.
com/uploads/2/7/0/3/27034867/2016_04_11_integrating_dr_guide_web.pdf.
Weissman, S. and A.M. Brockway. 2018. Community Solar in California: A Missed Opportunity.
Center for Sustainable Energy. https://energycenter.org/sites/default/files/docs/nav/
policy/resources/Community_Solar_in_California-A_Missed_Opportunity.pdf.

A-1
APPENDIX A: Previous Work and Additional Information on Modeling Approach
Previous Work A study by Navigant (2015) examined costs of TDV-ZNE homes in Southern California starting
from 2016 Title 24 building codes and considering mixed-fuel and all-electric fuel
configurations. Since this study adhered to the TDV-ZNE requirement that ZNE homes must
offset 100 percent of their TDV consumption, resultant mixed fuel homes have large PV sizes
that can overproduce electricity during certain periods of the year (i.e., these designs are not
“grid harmonized”). The study focuses on single-family homes, does not provide as much
characterization for multi-family homes, and focuses on current costs but also includes some
limited modeling of homes with future anticipated costs.
Deason et al. 2018 describe benefits, barriers, and supporting policies to all-electric homes
from a national perspective. This study finds that electrification of end uses in buildings is
most cost-effective electrification is most cost-effective in new residential buildings, where a
single heat pump can provide heating and cooling, where gas infrastructure costs can be
avoided (e.g., in new all-electric buildings or communities), and where winters are mild. The
study authors find that many existing policies bear on electrification, sometimes in unintended
ways. Rapid and widespread electrification would require revisions to numerous policies
including electricity rate design, building codes and appliance standards, Incentives, outreach,
education, and energy efficiency program targets that require reduction of total electricity
usage. The study highlights that key potential policy enablers include time-varying rates, ZNE
building codes (electricity usage being readily offset by onsite generation), demand response
programs, and payments for flexible loads
DEG et al. 2017 present all-electric cost-effectiveness for all-electric designs that exceed the
requirements of the 2016 Title 24 building code. A key difference from the current study is
that their analysis uses a customer-based lifecycle cost (LCC) approach to evaluating cost
effectiveness based on investor-owned utility rates with NEM2.0 rooftop solar compensation
policy, whereas the CEC LCC methodology (and the current study) uses Time Dependent
Valuation (TDV) as the primary metric for energy savings. PV systems are sized in two ways:
PV systems sizing to offset approximately 80 percent of estimated annual electricity
consumption in a gas/electric home; or sized to offset 100 percent of estimated building site
electricity use (total kWh). In all cases for single-family 2450 ft2 and 8-unit multifamily, all-
electric homes are found to have a lifecycle benefit ratio of greater than 1.0.
A recent study by(Mahone et al., 2018), assesses the energy savings, greenhouse gas savings,
impacts to the electric grid and overall economics of residential building electrification for
customers across several regions of California. E3 modeled the performance and costs of both
all-electric new construction homes and existing homes retrofitted with heat pump HVAC
systems and heat pump water heaters. These were compared to mixed-fuel homes that use
natural gas and electricity. The study finds that all-electric new construction results in savings

A-2
of $130-$540 per year relative to a gas-fueled home over the life of the equipment. There are
cost savings to developers from elimination of costs to lay down gas lines as well as to
homeowners, who will see lower bills.
In support of the state’s policy goals for ZNE buildings, the CEC has also supported projects to
facilitate the modeling of ZNE homes. Milne et al 2017 have developed new software tools to
evaluate building envelope performance and a quick-sketch design tool to help Californians
create non-residential buildings that exceed the 2013 Title 24 Energy Efficiency Standard and
even to approach ZNE.
A recent study has examined the impacts of ZNE communities on the distribution grid.
Narayanamurthy et al. 2017 details the design, deployment, construction, selling, and
occupying of 20 homes built to California Title 24 ZNE standard with electrified heating. The
goal of this study was to understand if the transformers, laterals, load blocks and feeders had
sufficient capacity using today’s planning methods. To alleviate distribution impact, these
homes were set up with controllable loads and with behind-the-meter energy storage. Two
important take-aways from the project were that the control strategy of energy storage could
either strengthen or in some cases, accentuate distribution problems, and that modeling tools
still have a way to go to address the prominent or “needle” peaks or spikes in power demand
that will be more common in future buildings.
Time Dependent Valuation Methodology
Table A-1: Description and Underlying Methodology of Time Dependent Valuation Components
Component Description
Basis of Annual
Forecast
Basis of
Hourly Shape
Marginal Energy Avoided
Costs
Generation Energy
Estimate of hourly marginal wholesale value of energy
adjusted for losses between the point of
the wholesale transaction and the
point of delivery
Modified IEPR Production Simulation
Results for 2023-2030,
escalated based on gas
price forecasts thereafter
Modified IEPR Production Simulation Results

A-3
Component Description
Basis of Annual
Forecast Basis of
Hourly Shape
Marginal
Energy Avoided
Costs
System Capacity The marginal cost of
procuring Resource Adequacy resources in
the near term. In the longer term, the additional payments
(above energy and ancillary service market
revenues) that a generation owner would require to build
new generation capacity to meet
system peak loads
Fixed costs of a
new simple-cycle
combustion turbine, less net revenue
from energy and AS markets
Effective Load
Carrying Capacity track
Marginal Energy
Avoided Costs
Ancillary Services The marginal cost of providing system
operations and reserves for electricity grid reliability
Scales with the value of energy
Directly linked with energy
shape
Marginal
Energy Avoided
Costs
System Losses The costs associated
with additional electricity generation to
cover system losses
Utility loss
factors by season and
peak period applied to energy value
Directly linked
with energy shape
Marginal
Energy Avoided
Costs
Transmission and
Distribution Capacity
The costs of expanding
transmission and distribution capacity to
meet customer peak loads
Survey of
investor owned utility
transmission and distribution deferral values
from recent general rate
cases
Hourly allocation
factors calculated using a regression
hourly temperature data and distribution
feeder load data

A-4
Component Description
Basis of Annual
Forecast Basis of
Hourly Shape
Marginal
Energy Avoided
Costs
CO2 Emissions The cost of carbon
dioxide emissions (CO2) associated with
the marginal generating resource
2017 IEPR Directly linked
with energy shape based on
implied heat rate of marginal generation, with
bounds on the maximum and
minimum hourly value
Marginal Energy
Avoided Costs
Avoided RPS The cost reductions from being able to
procure a lesser amount of renewable
resources while meeting the Renewable
Portfolio Standard (percentage of retail electricity usage).
Premium for renewable
generation calculated
using levelized renewable
costs from CPUC RPS Calculator
Constant allocation factor,
does not vary by hour
Retail Rate
Adder
The components above
are scaled to match the average retail rate
through the retail rate adder.
2017 IEPR
retail rate forecast
Constant
allocation factor, does not vary by
hour
Source: Lawrence Berkeley National Laboratory
Base Case Time Dependent Valuation DV Values Table A-2 provides detail on the updated assumptions that the research team made for the
Base Case TDV values for 2023–2052. All changes are described relative to the inputs used for
the 2019 TDV values.

A-5
Table A-2: Updates to Base Case TDV Values for 2023–2052, Relative to Values Used for 2019 TDV Values
Element Description of update
Generation
Energy
We used CEC’s PLEXOS model updated for the CEC’s 2017 Integrated Energy
Policy Report Update (IEPR). The results are shown in Figure 2.
This update included changes to:
• Generator fuel prices. Most notably, natural gas prices declined 33
percent. This lower generation cost is expected to lead to cheaper,
more flexible resources, putting downward pressure on prices
• Carbon prices, which increased 36 percent compared, putting upward
pressure on energy prices
• The modeling of electricity exchange between California and out-of-
state entities. Previously, the CEC’s PLEXOS cases did not include
significant constraints on the export of energy from California, instead
assuming that other states would absorb any renewable
overgeneration. The updated PLEXOS case used for this report models
all WECC entities and transmission constraints.
• Generation resources, including a) the resources needed to meet the 50
percent RPS by 2030 required by SB350 (50 percent RPS assumed for
all years post 2030), and b) announced and anticipated plant
retirements
The research team made the following changes to the CEC’s PLEXOS model:
• Repaired parametric characteristics of several hydro generators, which
had offsetting impacts on increasing and reducing the flexibility of
generation in the model
• Enforced curtailment penalties on solar and wind plants in the model to
eliminate no-cost curtailment of renewable energy.
System
Capacity
Higher renewable penetration displaces generation from gas combustion
turbines (CTs), which decreases their capacity factors. Lower capacity factors for CTs translates to a reduction in their energy revenue, so they require more
compensation through the capacity market. Because CTs are the marginal capacity resource, capacity value increases.
CO2 Emissions
A 36 percent increase in monetized carbon price increased the average emissions value. Higher penetration of solar in the updated generation fleet
reduced the emissions value during the middle of the day.

A-6
Element Description of update
Retail Rates
Statewide average electric retail rates in IEPR 2017’s forecast are 3 percent
lower than those used for 2019 TDV values.
In periods with low load and high renewable generation, renewable
curtailment causes negative energy prices, which reduces the otherwise constant retail adder component of the TDV values. Because the retail adder
component is applied as an adjustment to ensure the annual average TDV equals the average retail rate, the reduction of the retail adder in curtailment periods causes the retail adder to be higher in all other periods.
Source: Lawrence Berkeley National Laboratory
Higher Renewables Time Dependent Valuation Sensitivity Case The research team created a second, sensitivity set of 2023–2052 TDV values that aimed to
provide insight into the effects of a potential future with even higher renewable penetration
than the Base Case.
For this case, the research team integrated results from the RESOLVE cases run by E3 for the
California Public Utilities Commission (CPUC) Integrated Resource Planning process in 2017.
Specifically, the team used the ‘IRP 30 Million Metric Tons (30MMT) case’, which models the
least-cost approach to reaching statewide electric sector emissions of 30 MMT in 2030.This
case results in a CAISO generation portfolio corresponding to a nearly 70 percent RPS in 2030
versus the SB350-required 50 percent by 2030 that is represented in the Base 2022 TDV
values.36
The additional generation resources in the 30MMT case consist largely of solar, plus some
wind, geothermal, and grid-level battery and pumped storage.
36 In September 2018, SB 100 was approved which increased the 2030 RPS target to 60 percent from the 50
percent target in SB350. This increase in RPS target was passed after E3 computed their updated TDV values. The SB 100 TDV values for electricity are thus in between those for the ‘Base’ case and the ‘Higher Renewables’
case.

A-7
Table A-3: Modified Assumptions in Higher Renewables Time Dependent Valuation Sensitivity Case, Relative to Base Case
Element Description of update
Generation
Energy
The RESOLVE generation resources that are incremental to those in the Base
Case PLEXOS runs were mapped to California and out-of-state zones in PLEXOS
Changes in energy price shapes from 2019 TDV to Base 2022 TDV continue directionally in the Higher Renewables case (see Figure 2).
• A lower “duck belly” as additional solar penetration depresses average
energy prices during the middle of the day
• Curtailment of renewables in the low load, high solar and hydro spring
months becomes so prevalent that the average day has negative
energy prices
• An assumed 6,300 MW (vs. 1,300 MW in the Base Case) of grid-level
battery and pumped storage does reduce some of the hourly variability
and renewable curtailment
System Capacity
The higher renewable penetration referenced in the cell above displaces generation from gas combustion turbines (CTs), which decreases their
capacity factors. Lower capacity factors for CTs translates to a reduction in their energy revenue, so they require more compensation through the capacity
market. Because CTs are the marginal capacity resource, capacity value increases.
CO2 Emissions
Higher solar penetration continues to reduce the average emissions value during the middle of the day
Retail Rates
Annual average retail rates of electricity from the 30MMT RESOLVE case were
added to the TDV model. A higher average cost of renewable generation over conventional resources increases the average retail adder relative to the Base
Case 2022 TDV values.
With negative energy prices occurring more frequently than the Base Case 2022 TDV values, the retail adder is pushed more to hours without solar
curtailment.
Source: Lawrence Berkeley National Laboratory

A-8
Figure A-1: Energy Price Impacts of Time Dependent Valuation Scenario Updates: Modeled 2026 Hourly Energy Prices for Seasonal Average Day in PG&E Valley
Source: Lawrence Berkeley National Laboratory
-10
0
10
20
30
40
50
60
70
1 2 3 4 5 6 7 8 9 10 11 12 13 14 15 16 17 18 19 20 21 22 23 24
Winter
-10
0
10
20
30
40
50
60
70
1 2 3 4 5 6 7 8 9 10 11 12 13 14 15 16 17 18 19 20 21 22 23 24
Summer
-10
0
10
20
30
40
50
60
70
1 2 3 4 5 6 7 8 9 10 11 12 13 14 15 16 17 18 19 20 21 22 23 24
Spring
-10
0
10
20
30
40
50
60
70
1 2 3 4 5 6 7 8 9 10 11 12 13 14 15 16 17 18 19 20 21 22 23 24
Fall
TDV 2019 TDV 2022: Base TDV 2022: Higher Renewables
Spring has lowest prices,
due to low loads and high
renewables (i.e., low net load)
“Duck belly” shape becomes even more pronounced in Higher Renewables
Scenario
Additional solar in Higher
Renewables push average Spring prices
below $0/MWh.
Shoulder hour prices proportionately higher than 2019 TDVs
Ene
rgy
($/M
Wh)
Ene
rgy
($/M
Wh)

A-9
Figure A-1 shows how the changes for each TDV scenario described above impact energy prices
modeled in PLEXOS.
Source: Lawrence Berkeley National Laboratory
Storage Control Algorithms
1. Optimized Dispatch, which assumes that each battery is dispatched to maximize TDV
values in each hour of each year, with perfect foresight
2. Shuffled Dispatch, which assumes that each battery dispatches against hourly TDV
values from a 'similar' day, by 'shuffling' the same day of the week within the same
month. This dispatch approach is designed to reflect a situation in which homeowners
are provided with hourly TDV signals but face some forecast error rather than having
perfect foresight.
3. Time of Use (TOU) Dispatch, under which batteries are assumed to dispatch in
response to on-peak and off-peak TOU periods. The research team implemented this
approach by averaging TDV values across on-peak and off-peak TOU periods for
existing 4-9pm TOU rates of the investor-owned utility that corresponds to each CZ37
4. Basic Dispatch, under which batteries are assumed to charge on solar PV net exports
and discharge when load again exceeds PV production.
5. Backup Dispatch, which assumes that batteries are only used to provide backup power.
According to reports from Itron, Inc. and E3 evaluating California’s SGIP, this was the
most common use case for residential battery storage as of the end of 2017.38 Because
the value of backup power is based on specific events, no dispatch was modeled for this
system. The value shown for these systems in each use case is simply the cost of a
battery sized to maximize net benefits under Basic dispatch, which is much smaller than
capacities typical of backup batteries.
2019 Title 24 Prescriptive Requirements
Table A-4: Relevant Updates to 2019 Title 24 Envelope Prescriptive Requirements
Component 2016 Code 2019 Code Update
Exterior Walls 2x6 R-21 + 1" R-4: 0.051
U-factor (CZ 1-5, 8-16) 2x4 R-15 + 1" R-4: 0.065 U-factor (CZ 6-7)
SINGLE-FAMILY:
2x6 R-21 + 1" R-5: 0.048 U-factor (CZ 1-5, 8-16) No change (CZ 6-7)
MULTIFAMILY:
No change (CZ 1-16)
Wall to Garage /
Kneewall
2x6 R-21 (CZ 1-5, 8-16)
2x4 R-15 (CZ 6-7)
No change (CZ 1-16)
37 PG&E E-TOU-B for CZs 1-5, 11-13; SCE TOU-D-4-9PM for CZs 6, 8-10, 15, 16; SDG&E TOU-DR-SES for CZs 7,
14
38 See “Self Generation Incentive Program Reports,” http://www.cpuc.ca.gov/general.aspx?id=7890

A-10
Component 2016 Code 2019 Code Update
Foundation Type &
Insulation
Uninsulated slab (CZ 1-15)
R-7 slab perimeter insulation (CZ 16)
No change (CZ 1-16)
Floor (Above
Garage / Cantilever)
R-19 between framing No change (CZ 1-16)
Roof/Ceiling Insulation & Attic
Type
Vented w/ R-38 at ceiling, R-13 under roof deck (tile roof); R-18
under deck (asphalt) (CZ 4, 8-16)
Vented w/ R-38 at ceiling only (CZ 1-2) Vented w/ R-30 at ceiling only
(CZ 3, 5-7)
SINGLE-FAMILY:
Vented w/ R-38 at ceiling, R-19
under roof deck (tile roof) (CZ 4, 8-16)
No change (CZ 1-3, 5-7)
MULTIFAMILY:
Vented w/ R-38 at ceiling, R-19
under roof deck (tile roof) (CZ 4, 8, 9, 11-15)
No change (CZ 1-3, 5-7, 10, 16)
Roofing Material & Color
Cool roof: ≥0.20 solar reflectance, ≥0.75 thermal
emittance (CZ 10-15)
No change (CZ 1-16)
Radiant Barrier Yes (CZ 2-3, 5-7) No change (CZ 1-16)
Window Properties:
U-Value / SHGC
Vinyl Low-E: 0.32 / 0.25
(CZ 1-16) 0.50 SHGC (CZ 1, 3, 5)
Vinyl Low-E: 0.30 / 0.23 (CZ 1-16)
0.35 SHGC (CZ 1, 3, 5, 16)
Opaque Doors No requirement (default
assumption of 0.50 U-value) (CZ 1-16)
Insulated, ≤0.20 U-value (CZ 1-16)
Quality Installation No Yes (full R-value)
House Infiltration 5 ACH50 assumed (7 ACH50 for multifamily) (CZ 1-16)
No change (CZ 1-16)
Source: Lawrence Berkeley National Laboratory
Table A-5: Relevant Updates to 2019 Title 24 HVAC Prescriptive Requirements
Component 2016 Code 2019 Code Update
System Type &
Description
Ducted gas furnace & A/C
Heat pump (if proposed is electric heating)
No change
Heating Efficiency
(AFUE, COP or HSPF)
78 AFUE
8.2 HSPF (if proposed is electric heating)
No change
Cooling Efficiency (SEER/EER)
14 SEER, 12.2 EER 14 SEER, 11.7 EER

A-11
Component 2016 Code 2019 Code Update
Duct Location &
Insulation
Attic, R-8 insulation (CZ 1-2, 4, 8-16)
R-6 (CZ 3,5-7) Multifamily: ducts in conditioned
space
No change
Mechanical Ventilation
Exhaust, 2010 ASHRAE 62.2 Exhaust, 2016 ASHRAE 62.2
Nighttime Ventilation Cooling
Whole house fan, 1.5 cfm/ft2 (CZ 8-14)
Multifamily: none
No change
Duct Leakage Tested, 5 percent No change
Verified Fan Watt Draw
0.58 W/cfm 0.45 W/cfm
Source: Lawrence Berkeley National Laboratory
Table A-6: Relevant Updates to 2019 Title 24 Water Heating Prescriptive
Requirements
Component 2016 Code 2019 Code Update
System Type & Description
Tankless gas Central large gas water heater for multifamily if proposed is central
SINGLE-FAMILY:
Tankless gas Heat pump (if proposed is
electric water heating) located in the garage if one exists &
conditioned space if not.
MULTIFAMILY:
Central large gas water heater (if proposed is central) Individual gas water heaters
(if proposed is individual)
Water Heater Efficiency
0.82 EF (tankless) 80 percent thermal efficiency
(central)
0.82 EF (tankless) 2.0 UEF (HPWH)
80 percent thermal efficiency (central)
Solar DHW: System Description + Solar
Fraction
SINGLE-FAMILY:
No requirement
MULTIFAMILY:
20 percent solar fraction (CZ 1-9),
35 percent solar fraction (CZ 10-16)
No change
Distribution Type All pipes insulated All pipes insulated Compact distribution (if proposed is electric water heating)

A-12
Component 2016 Code 2019 Code Update
Drain Water Heat
Recovery
No requirement Serving showers only, 70 percent
efficiency (if proposed is electric water heating)
Hot Water Fixtures 2 gpm showerhead, 1.2 gpm bath
faucets, 1.8 gpm kitchen faucets, 1.28 gal/flush toilet
No change
Source: Lawrence Berkeley National Laboratory
Table A-7: Relevant Updates to 2019 Title 24 Prescriptive Requirements
for Other Features
Component 2016 Code 2019 Code Update
Lighting Type 100 percent high-efficacy No change
Lighting Controls Vacancy sensors No change
Refrigerator Meet federal minimum standards No change
Dishwasher Meet federal minimum standards No change
Cooking No requirement No change
Clothes Washer Meet federal minimum standards No change
Clothes Dryer Meet federal minimum standards No change
Home Energy Management System
No requirement No change
Solar PV No requirement Meet EDR target to be set by CEC,
~100 percent electricity use of mixed fuel home
Storage No requirement No change
Demand Response No requirement No change
Source: Lawrence Berkeley National Laboratory

A-13
Table A-8: Envelope Options for Zero Net Energy Homes
Component Option Incremental Cost vs 2019 Title 24* Cost Data Source
Wood Stud R-23 fiberglass batt,
Grade 1, 2x6, 24 inch o.c., framing
factor=0.17
$0.28/ft2 (CZ 1-5, 8-16)
$0.50/ft2 (CZ 6-7)
BEopt
Wall
Sheathing
1" XPS, R-5 SINGLE-FAMILY:
$0.00/ft2 (CZ 1-5, 8-16)
$0.18/ft2 (CZ 6-7)
MULTIFAMILY:
$0.18/ft2 (CZ 1-16)
BEopt
Wall Sheathing
2" XPS, R-10 SINGLE-FAMILY:
$0.67/ft2 (CZ 1-5, 8-16)
$0.85/ft2 (CZ 6-7)
MULTIFAMILY:
$0.85/ft2 (CZ 1-16)
(German, 2017)
Wall Sheathing
2" polyiso, R-12 SINGLE-FAMILY:
$1.08/ft2 (CZ 1-5, 8-16)
$1.26/ft2 (CZ 6-7)
MULTIFAMILY:
$1.26/ft2 (CZ 1-16)
(German, 2017)
Unfinished
Attic
Roof R-38 Open Cell
Spray Foam, Unvented
SINGLE-FAMILY:
Ceiling -$1.61/ft2 / Roof: $4.74/ft2 (CZ 1-2)
Ceiling -$1.29/ft2 / Roof: $4.74/ft2 (CZ 3, 5-7)
Ceiling -$1.61/ft2 / Roof:
$4.02/ft2 (CZ 4, 8-16)
MULTIFAMILY:
Ceiling -$1.61/ft2 / Roof: $4.74/ft2 (CZ 1-2)
Ceiling -$1.29/ft2 / Roof: $4.74/ft2 (CZ 3, 5-7)
Ceiling -$1.61/ft2 / Roof:
$4.02/ft2 (CZ 4, 8, 9, 11-15)
Ceiling: -$1.61/ft2 / Roof:
$4.16/ft2 (CZ 10, 16)
BEopt

A-14
Component Option Incremental Cost vs 2019 Title 24* Cost Data Source
Unfinished Attic
Roof R-49 Open Cell Spray Foam,
Unvented
SINGLE-FAMILY:
Ceiling -$1.61/ft2 / Roof:
$5.92/ft2 (CZ 1-2)
Ceiling -$1.29/ft2 / Roof:
$5.92/ft2 (CZ 3, 5-7)
Ceiling -$1.61/ft2 / Roof: $5.20/ft2 (CZ 4, 8-16)
MULTIFAMILY:
Ceiling -$1.61/ft2 / Roof:
$5.92/ft2 (CZ 1-2)
Ceiling -$1.29/ft2 / Roof: $5.92/ft2 (CZ 3, 5-7)
Ceiling -$1.61/ft2 / Roof: $5.20/ft2 (CZ 4, 8, 9, 11-15)
Ceiling: -$1.61/ft2 / Roof: $5.34/ft2 (CZ 10, 16)
BEopt
Unfinished
Attic
Ceiling R-49 Grade-1
Cellulose, Vented
SINGLE-FAMILY:
$0.44/ft2 (CZ 1-2)
$0.76/ft2 (CZ 3, 5-7)
Ceiling: $0.44/ft2 / Roof: -
$0.72/ft2 (CZ 4, 8-16)
MULTIFAMILY:
$0.44/ft2 (CZ 1-2)
$0.76/ft2 (CZ 3, 5-7)
Ceiling: $0.44/ft2 / Roof: -
$0.72/ft2 (CZ 4, 8, 9, 11-15)
Ceiling: $0.44/ft2 / Roof: -
$0.58/ft2 (CZ 10, 16)
BEopt
Unfinished Attic
Ceiling R-60 Gr-1 Cellulose, Vented
SINGLE-FAMILY:
$0.88/ft2 (CZ 1-2)
$1.20/ft2 (CZ 3, 5-7)
Ceiling: $0.88/ft2 / Roof: -$0.72/ft2 (CZ 4, 8-16)
MULTIFAMILY:
$0.88/ft2 (CZ 1-2)
$1.20/ft2 (CZ 3, 5-7)
Ceiling: $0.88/ft2 / Roof: -$0.72/ft2 (CZ 4, 8, 9, 11-15)
Ceiling: $0.88/ft2 / Roof: -$0.58/ft2 (CZ 10, 16)
BEopt

A-15
Component Option Incremental Cost vs 2019 Title 24* Cost Data Source
Roof Material Cool Roof medium color asphalt, 0.25
reflectance 0.85 emittance
$0.06/ft2 (California Statewide Utility Codes and
Standards Program, 2011)
Roof Material Cool Roof light color asphalt, 0.40
reflectance 0.85 emittance
$0.50/ft2 (Levinson et al., 2016)
Radiant
Barrier
Yes (attic insulation
cases w/ no below roof deck insulation)
$0.12/ft2 (CZ 1, 4, 8-16)
$0.00/ft2 (CZ 2-3, 5-7)
(J. Wei, Pande,
Chappell, Christie, & Dawe, 2016)
Windows Low-E, double-pane, non-metal, argon-
filled, low SHGC (U 0.25, SHGC 0.23)
$4.23/ft2 (Hendron & Hoeschele, 2018)
Windows Low-E, triple-pane,
nonmetal, air-filled, high SHGC: (U 0.22, SHGC 0.44)
$7.00/ft2 (Hendron & Hoeschele,
2018)
Air Leakage 5 ACH50 SINGLE-FAMILY:
$0.00/ft2
MULTIFAMILY:
$0.02/ft2
BEopt
Air Leakage 4 ACH50 SINGLE-FAMILY:
$0.02/ft2
MULTIFAMILY:
$0.04/ft2
BEopt
Air Leakage 3 ACH50 SINGLE-FAMILY:
$0.06/ft2
MULTIFAMILY:
$0.08/ft2
BEopt
Air Leakage 2 ACH50 SINGLE-FAMILY:
$0.17/ft2
MULTIFAMILY:
$0.19/ft2
BEopt
* A-8 ft2 of exterior wall area for wall insulation measures, ceiling area for attic floor insulation, roof area
for roof deck insulation and radiant barriers, window area for advanced windows, and conditioned floor
area for air leakage.
Source: Lawrence Berkeley National Laboratory

A-16
Table A-9: Heating, Ventilation, and Air Conditioning Options for Zero Net Energy Homes
Component Option
Incremental Cost
vs 2019 Title 24 Cost Data Source
Mechanical Ventilation
Balanced HRV system, 2016 ASHRAE 62.2,
70 percent efficiency, 0.3 W/cfm
$669.34 BEopt
Central Air Conditioner
15 SEER, 13 EER SINGLE-FAMILY:
$123.00 for 3 tons
MULTIFAMILY:
$61.50 for 1.5 tons
BEopt
Central Air Conditioner
16 SEER, 13 EER, 2-speed
SINGLE-FAMILY:
$247.00 for 3 tons
MULTIFAMILY:
$123.50 for 1.5 tons
BEopt
Furnace 92.5 AFUE gas
furnace
$452 for 60 kBtuh BEopt
Air Source Heat pump
SEER 15, 8.5 HSPF $217.50 BEopt+50 percent based on previous projects
Air Source
Heat pump
SEER 16, 8.6 HSPF $435.00 BEopt+50 percent
based on previous projects
Air Source
Heat pump
SEER 18, 9.3 HSPF $871.50 BEopt+50 percent
based on previous projects
Air Source Heat pump
SEER 22, 10 HSPF $1743.00 BEopt+50 percent based on previous
projects
Mini-Split Heat Pump
for Multifamily Building
(15kBtu/hr)
SEER 20, 10.3 HSPF $295.50 BEopt+50 percent based on previous
projects
Mini-Split Heat Pump
Multifamily Building (15kBtu/hr)
SEER 25.3, 10.3 HSPF $510.50 BEopt+50 percent based on previous
projects
Ducts In Finished Space $2.55/ft2 (CZ 1-2, 4, 8-16)
$2.63/ft2 (CZ 3, 5-7)
BEopt
Source: Lawrence Berkeley National Laboratory

A-17
Table A-10: Hot Water Options for ZNE Homes
Component Option Incremental Cost vs 2019 Title 24 Cost Data Source
Water Heater Gas Condensing
Tankless, 0.92 EF
$429 (Davis Energy Group,
Misti Bruceri & Associates LLC, &
Enercomp Inc, 2017)
Water Heater HPWH, 50 gal, 3.7
UEF
$422 (Davis Energy Group et
al., 2017)
Distribution R-5, PEX, Demand $0.48/ft pipe + $300 pump BEopt
Solar Water Heating
20 ft2/unit $6859 BEopt scaled based on collector area
Solar Water Heating
40 ft2/unit $7179 BEopt
Source: Lawrence Berkeley National Laboratory
Table A-11: Other Options for ZNE Homes
Component Option Incremental Cost vs 2019 Title 24 Cost Data Source
Refrigerator Bottom freezer, EF=21.3 $458.81 BEopt
Cooking Range
Gas cooktop (Optimized Burner/Grates)/Gas Self-Cleaning Oven
-Free Standing (Baseline + Standby-SMPS + Electronic
Spark Ignition + Forced Convection + Reduced Conduction Losses)
$43.84 Federal Energy Efficiency Standards
and/or Compliance Certification
Database39
Cooking
Range
Electric Smooth Cooktops
Standby - SMPS, Automatic power down, Induction/ Electric
Self-Cleaning Oven - Free Standing (Baseline + Standby -
SMPA+ Forced Convection + Oven Separator + Reduced Conduction Losses)
$327.31 Federal Energy
Efficiency Standards and/or Compliance
Certification Database43
Dishwasher Dishwasher Gap Fill_1,
86 kWh/unit/yr
$74.00 Federal Energy
Efficiency Standards and/or Compliance
Certification Database43
39 https://www.regulations.doe.gov/certification-data/#q=Product_Group_s percent3A*

A-18
Component Option Incremental Cost vs 2019 Title 24 Cost Data Source
Dishwasher Dishwasher Maximum Available, 69 kWh/unit/yr
$160.00 Federal Energy Efficiency Standards
and/or Compliance Certification
Database43
Clothes
Washer
Standard Front-loading CEE
Tier 2
$334.10 Federal Energy
Efficiency Standards and/or Compliance
Certification Database43
Clothes Dryer Vented Gas Standard: Modulating Heat EF 4.7
$57.80 Federal Energy Efficiency Standards
and/or Compliance Certification
Database43
Clothes Dryer Vented Gas Standard: Max-Tech EF 5.0
$170.50 Federal Energy Efficiency Standards
and/or Compliance Certification Database43
Clothes Dryer Vented Elec Standard: Energy
Star EF 3.93
$35.30 Federal Energy
Efficiency Standards and/or Compliance
Certification Database43
Clothes Dryer Vent-less Elec Standard: Heat Pump Dryer (Max-Tech) EF 4.5
$755.60 Federal Energy Efficiency Standards
and/or Compliance Certification
Database43
PV System 0.1 kW incremental for single-family, 0.5 kW incremental for multi-family
$3.00/W BEopt
Source: Lawrence Berkeley National Laboratory
Options not included in the final BEopt analysis:
• Mini-Split heat pumps in single-family homes: Several questions about the
installed performance of mini-split heat pumps compared to the seasonal performance
suggested by SEER/HSPF ratings remain unresolved. AHRI 210/240-2008 does not test
variable capacity systems under a realistic range of operating conditions, including
under low-load and extreme temperature conditions. As a result, HSPF and SEER
ratings often imply greater savings compared to single-speed heat pumps than
observed in laboratory and field tests. A new standard for variable speed heat pumps is

A-19
currently under development by the Canadian Standards Association with support from
U.S. partners including PG&E, but there is insufficient data on real equipment tested
using this procedure to justify a particular methodology for adjusting performance
characteristics in BEopt. The 2019 update to the Title 24 Alternative Calculation Method
(ACM) includes new rules for modeling mini-split heat pumps, but the updated ACM was
not yet available when the optimization analysis was performed for this project.
Additionally, there was a fair amount of discontent expressed by manufacturers during
the ACM Public Workshop at CEC. The sizing of mini-splits for single-family homes in
BEopt was also an issue with undersized units being deployed for large homes. For this
study, mini-split heat pumps were applied to the multifamily prototype model with all-
electric apartment units. The cooling capacity for each apartment unit is less than 1 ton,
thus 1.25 ton (15 kBtu/hr) mini-split heat pump systems are used for multifamily all-
electric scenario analysis.
• Slab insulation: The preliminary modeling results for slab insulation measures
indicated excellent cost-effectiveness, but upon closer examination the energy savings
calculations appeared unrealistic from a building science standpoint. By comparing
results from the latest version of BEopt (2.8) to the previous version (2.7), the team
was able to determine that one of the updates included a new ground heat transfer
model40 that predicted smaller cooling and heating loads when slab insulation is used,
instead of higher cooling loads as predicted by the earlier version of the software. Given
that NREL is no longer able to provide technical support for BEopt and explain the
difference, the team decided that the modeling results were suspect and removed slab
insulation from the optimization.
• Central heat pump water heaters (HPWH) and solar hot water for multifamily
buildings: Although central hot water systems can be modeled in BEopt, there is no
ability to model a central heat pump water heater with high accuracy. In addition, an
extensive search for reliable cost data did not result in a cost equation in which the
research team had enough confidence to include central HPWHs in the optimization.
Instead, individual heat pump water heaters were modeled, recognizing this measure
would not be as cost-effective as a central system for larger multi-family buildings. A
similar situation arose with solar hot water, where BEopt performs the analysis on a
per-unit basis for multi-family buildings. A central solar system would likely be much
more cost-effective, but BEopt does not currently have the ability to model the energy
savings accurately.
MELs reduction measures savings estimates
1. Tier 2 advanced power strips with infrared (IR) and occupancy sensor. The occupancy
sensor helps prevent false positives and increases occupant satisfaction but results in
missed opportunities for savings. In one California field study, the occupancy sensor
reduced energy savings from 29 percent to 25 percent of connected loads, but
increased persistence of savings from 83 percent to 87 percent. There was also a large
implied takeback effect of about 43 percent, indicating that occupants may have been
less conscientious about turning off devices knowing that the controls will do it
40 BEopt version changelog: https://beopt.nrel.gov/sites/default/files/exes/Changelog.txt

A-20
automatically (Valmiki & Corradini, 2016). The measure assumes two power strips are
installed, both on audio visual systems. There may also be energy savings potential for
computers and peripherals, but insufficient data for residential applications are available
to estimate savings accurately. A 1-watt continuous power draw is assumed for each
APS.
2. Optimal occupant behavior, smart plugs with smartphone. This measure assumes smart
sockets are installed on 10 outlets in each house and enable optimal energy conserving
behavior by occupants, reducing total standby and active loads by 16 percent. Savings
is assumed to be higher than the APS measure because the takeback effect would be
eliminated, but the research team has not identified any field studies that demonstrate
whether occupants fully utilize this technology.
Table A-12: Summary of BEopt Inputs for MELs Options Considered for ZNE Homes
Option Name
Annual Electricity Use
(kWh/unit/yr)
Multiplier
(frac)
DR Automatic
Control
Material
Costs Lifetime
Labor
Costs
Optimal occupant behavior, smart
plugs w/smartphone
(calculated by BEopt)
71.4 percent
FALSE $420 10 $0
Tier 2 Advanced
Power Strips (2) with IR and occupancy
sensor
(calculated by
BEopt)
79.9
percent
FALSE $126 10 $0
Source: Lawrence Berkeley National Laboratory
The multiplier column in Table A-12 includes several components:
• An adjustment factor (85 percent) to align the BEopt default MELs energy use with the
Title 24 assumption
• The expected energy savings for connected MELs
• A small 1-watt continuous power draw for the APS
• An unknown takeback effect for the APS measure, which is reflected in the savings
because it is based on field testing with real occupants. An earlier study indicated 43
percent without occupancy sensors, and the team expects the effect to be much lower.
The smart plugs measure specifically excludes takeback effects because it is designed
to optimize behavior.
Expert Elicitation Background and Approach
In recent years, expert elicitation has been widely used to support decision-making in energy
technology studies. Green Growth Knowledge Platform (GGKP) Research Committee examined
all the expert elicitation studies performed on energy technologies since 2007 and summarized
the differences in key characteristics by technology type (GGKP 2016). Many of these studies
focus on eliciting experts’ views on cost evolution conditional on RD&D levels and providing
evidence to support public research and development investments. For instance, Anadon et al.
(2011) conducted an expert elicitation study to seek recommendations on the level of federal

A-21
RD&D funding needed to simulate innovation in a range of energy technology areas and to
assess the impact of RD&D investment on their future cost and performance under different
funding scenarios. In some other studies, no explicit RD&D assumption is made in the
elicitation questions. A more recent study published by (Wiser et al., 2016) relied on an online
expert elicitation survey with more than 100 global wind experts to gain a better
understanding of the magnitude of future wind energy cost reductions and to identify the
opportunities of those potential cost reductions without specifying any R&D funding
assumption.
Here, the main body of the survey elicits experts’ informed judgement on current and future
cost estimates for building ZNE homes in California. As building costs can vary vastly
depending on the size of the home, the research team encouraged experts to refer to either
the single-family or multi-family prototype models used in the research team’s building energy
modeling work to calibrate their cost estimates. To properly represent the level of uncertainty
in experts’ cost estimates, the elicitation was structured to ask experts to provide the 5th
percentile value first, then the 95th percentile value, and lastly their best estimate inside the
5th to 95th percentile range. The team also encouraged experts to re-evaluate their lower-
and upper-bound estimates before providing their best estimate in order to minimize the over-
confidence and cognitive heuristic biases commonly observed in expert elicitations(Curtright,
Morgan, & Keith, 2008). When answering future cost estimates for two points in time, 2021
and 2026, two policy adoption scenarios reflecting different hypothetical ZNE adoption rates in
California were presented for experts to consider explicitly. The first is a “Business as Usual”
scenario, which assumes that policies will remain the same as they are currently, and that new
housing starts will gradually reach full ZNE by 2026. The second is a “Full ZNE Compliance”
scenario, which represents a very aggressive ZNE adoption scenario that will require that all
new residential buildings in California achieve ZNE by 2021. The goal was to see whether
different policy adoption scenarios would impact the cost projection of ZNE homes in California
and, if so, by how much.

B-1
APPENDIX B: Building Modeling Results

B-1
Table B-1: Single-family 2,100 ft2 all-electric and mixed-fuel homes lifecycle cost savings and increased initial construction cost
Bldg/ Fuel Type CZ
Lifecycle cost ($) Initial cost ($)
Baseline Cost-min. Savings Baseline Cost-min. Inc. Cost
SF2100, All-Electric
CZ01 $91,072 $82,904 $8,168 $73,747 $78,997 $5,250
CZ02 $82,394 $76,524 $5,871 $72,520 $81,980 $9,460
CZ03 $78,703 $74,441 $4,262 $71,242 $78,862 $7,620
CZ04 $80,125 $74,701 $5,424 $73,585 $81,363 $7,778
CZ05 $79,649 $74,541 $5,109 $71,194 $78,623 $7,429
CZ06 $74,862 $70,448 $4,414 $71,214 $77,963 $6,749
CZ07 $72,531 $68,209 $4,322 $70,362 $76,041 $5,679
CZ08 $74,962 $71,264 $3,697 $73,633 $79,428 $5,795
CZ09 $79,618 $74,446 $5,172 $74,185 $80,028 $5,843
CZ10 $81,977 $76,339 $5,638 $74,485 $81,245 $6,760
CZ11 $89,395 $80,538 $8,857 $75,685 $83,190 $7,505
CZ12 $84,797 $77,347 $7,450 $74,485 $82,671 $8,186
CZ13 $90,382 $81,948 $8,434 $76,285 $83,297 $7,012
CZ14 $84,825 $77,162 $7,663 $74,737 $81,354 $6,617
CZ15 $94,972 $84,175 $10,797 $80,785 $83,020 $2,235
CZ16 $96,567 $85,781 $10,786 $73,837 $83,918 $10,081
SF2100, Mixed-Fuel
CZ01 $84,186 $79,255 $4,931 $75,680 $79,628 $3,948
CZ02 $78,089 $75,109 $2,980 $74,957 $78,894 $3,937
CZ03 $73,482 $71,833 $1,649 $73,945 $78,342 $4,397
CZ04 $75,773 $73,668 $2,105 $75,770 $78,839 $3,069
CZ05 $73,834 $71,737 $2,096 $73,379 $77,137 $3,758
CZ06 $71,646 $69,790 $1,856 $73,651 $76,278 $2,627
CZ07 $68,567 $67,416 $1,151 $72,786 $74,943 $2,157
CZ08 $72,222 $70,638 $1,584 $76,057 $78,651 $2,594

B-2
Bldg/ Fuel Type CZ
Lifecycle cost ($) Initial cost ($)
Baseline Cost-min. Savings Baseline Cost-min. Inc. Cost
CZ09 $77,017 $73,828 $3,189 $76,609 $78,951 $2,342
CZ10 $79,429 $75,830 $3,598 $76,922 $79,360 $2,438
CZ11 $86,242 $80,324 $5,918 $78,122 $81,234 $3,112
CZ12 $81,237 $77,113 $4,124 $76,922 $79,720 $2,798
CZ13 $87,477 $82,120 $5,356 $78,722 $81,520 $2,798
CZ14 $82,133 $77,156 $4,977 $76,949 $80,053 $3,104
CZ15 $94,406 $85,264 $9,142 $83,222 $85,109 $1,887
CZ16 $85,012 $78,957 $6,055 $75,784 $78,190 $2,406
Single-family all-electric and mixed-fuel homes lifecycle cost savings and increased initial construction cost for cost-minimum design compared to
Title 24 2019 baseline, using 2022 TDV values and avoided cost for solar PV exports.
Source: Lawrence Berkeley National Laboratory

B-1
Table B-2: Multi-family 8unit all-electric and mixed-fuel building lifecycle cost savings per unit and increased initial construction cost per unit for cost-minimum
design compared to Title 24 2019 baseline, using 2022 TDV values and avoided cost for solar PV exports
Building Type
Fuel Type CZ
Life-cycle cost ($) per
Unit Initial cost ($) per Unit
Baseline
Cost-minimu
m Saving
s Baselin
e
Cost-minimu
m Increase
d Cost
MF8unit
All-Electric
CZ03 $51,305 $48,149 $3,156 $29,393 $31,238 $1,844
CZ10 $53,236 $49,342 $3,894 $30,238 $32,930 $2,692
CZ13 $57,812 $52,467 $5,346 $30,948 $33,268 $2,320
Mixed-Fuel
CZ03 $46,316 $45,353 $963 $33,269 $34,878 $1,609
CZ10 $48,924 $47,459 $1,465 $34,051 $35,440 $1,390
CZ13 $52,447 $50,560 $1,887 $34,739 $36,693 $1,954
Source: Lawrence Berkeley National Laboratory
Table B-3: Measure package for the most cost-effective single-family 2100 ft2 all-
electric homes
Building Type CZ
Fuel Type Measures
SF2100 CZ01 All-Electric
Air Source Heat Pump: SEER 22, 10 HSPF; Ducts: In Finished Space; Hot Water Pipe Insulation: R-5; Clothes Washer:
Standard Front-loading CEE Tier 2; Clothes Dryer: Vented Elec CEF 3.93; Plug Loads: Optimal occupant behavior with smart
control; PV System: 3.1 kW;
SF2100 CZ02 All-
Electric
Air Source Heat Pump: SEER 22, 10 HSPF; Ducts: In Finished
Space; Hot Water Pipe Insulation: R-5; Refrigerator: Bottom freezer EF 21.3; Dishwasher: Energy Star; Clothes Washer:
Standard Front-loading CEE Tier 2; Clothes Dryer: Vented Elec CEF 3.93; Plug Loads: Optimal occupant behavior with smart
control; PV System: 4.1 kW;
SF2100 CZ03 All-Electric
Ducts: In Finished Space; Hot Water Pipe Insulation: R-5; Dishwasher: Energy Star; Clothes Washer: Standard Front-loading CEE Tier 2; Clothes Dryer: Vented Elec CEF 3.93; Plug
Loads: Optimal occupant behavior with smart control; PV System: 4.1 kW;
SF2100 CZ04 All-
Electric
Air Source Heat Pump: SEER 16, 8.6 HSPF; Ducts: In Finished
Space; Hot Water Pipe Insulation: R-5; Refrigerator: Bottom freezer EF 21.3; Clothes Washer: Standard Front-loading CEE Tier 2; Clothes Dryer: Vented Elec CEF 3.93; Plug Loads:
Optimal occupant behavior with smart control; PV System: 3.9 kW;

B-2
Building Type CZ
Fuel Type Measures
SF2100 CZ05 All-Electric
Air Source Heat Pump: SEER 16, 8.6 HSPF; Ducts: In Finished Space; Hot Water Pipe Insulation: R-5; Clothes Washer:
Standard Front-loading CEE Tier 2; Clothes Dryer: Vented Elec CEF 3.93; Plug Loads: Optimal occupant behavior with smart
control; PV System: 3.9 kW;
SF2100 CZ06 All-
Electric
Wood Stud: R-23 Fiberglass Batt, Gr-1, 2x6, 16 in o.c.; Ducts:
In Finished Space; Hot Water Pipe Insulation: R-5; Refrigerator: Bottom freezer EF 21.3; Dishwasher: Energy
Star; Clothes Washer: Standard Front-loading CEE Tier 2; Clothes Dryer: Vented Elec CEF 3.93; Plug Loads: Optimal
occupant behavior with smart control; PV System: 3.6 kW;
SF2100 CZ07 All-
Electric
Ducts: In Finished Space; Hot Water Pipe Insulation: R-5;
Refrigerator: Bottom freezer EF 21.3; Dishwasher: Energy Star; Clothes Washer: Standard Front-loading CEE Tier 2;
Clothes Dryer: Vented Elec CEF 3.93; Plug Loads: Optimal occupant behavior with smart control; PV System: 3.2 kW;
SF2100 CZ08 All-
Electric
Ducts: In Finished Space; Hot Water Pipe Insulation: R-5;
Refrigerator: Bottom freezer EF 21.3; Clothes Washer: Standard Front-loading CEE Tier 2; Clothes Dryer: Vented Elec CEF 3.93; Plug Loads: Optimal occupant behavior with smart
control; PV System: 3.4 kW;
SF2100 CZ09 All-Electric
Ducts: In Finished Space; Hot Water Pipe Insulation: R-5; Refrigerator: Bottom freezer EF 21.3; Clothes Washer:
Standard Front-loading CEE Tier 2; Clothes Dryer: Vented Elec CEF 3.93; Plug Loads: Optimal occupant behavior with smart control; PV System: 3.6 kW;
SF2100 CZ10 All-
Electric
Air Source Heat Pump: SEER 22, 10 HSPF; Ducts: In Finished
Space; Hot Water Pipe Insulation: R-5; Refrigerator: Bottom freezer EF 21.3; Dishwasher: Energy Star; Clothes Washer:
Standard Front-loading CEE Tier 2; Clothes Dryer: Vented Elec CEF 3.93; Plug Loads: Optimal occupant behavior with smart control; PV System: 3.4 kW;
SF2100 CZ11 All-
Electric
Unfinished Attic: Ceiling R-60 Gr-1 Cellulose, Vented; Radiant
Barrier: Yes; Air Source Heat Pump: SEER 18, 9.3 HSPF; Ducts: In Finished Space; Hot Water Pipe Insulation: R-5;
Refrigerator: Bottom freezer EF 21.3; Clothes Washer: Standard Front-loading CEE Tier 2; Clothes Dryer: Vented Elec CEF 3.93; Plug Loads: Optimal occupant behavior with smart
control; PV System: 4.2 kW;

B-3
Building Type CZ
Fuel Type Measures
SF2100 CZ12 All-Electric
Air Source Heat Pump: SEER 22, 10 HSPF; Ducts: In Finished Space; Hot Water Pipe Insulation: R-5; Refrigerator: Bottom
freezer EF 21.3; Clothes Washer: Standard Front-loading CEE Tier 2; Clothes Dryer: Vented Elec CEF 3.93; Plug Loads:
Optimal occupant behavior with smart control; PV System: 3.9 kW;
SF2100 CZ13 All-Electric
Air Source Heat Pump: SEER 22, 10 HSPF; Ducts: In Finished Space; Hot Water Pipe Insulation: R-5; Refrigerator: Bottom
freezer EF 21.3; Dishwasher: Energy Star; Clothes Washer: Standard Front-loading CEE Tier 2; Clothes Dryer: Vented Elec
CEF 3.93; Plug Loads: Optimal occupant behavior with smart control; PV System: 4.0 kW;
SF2100 CZ14 All-Electric
Unfinished Attic: Ceiling R-60 Gr-1 Cellulose, Vented; Air Leakage: 4 ACH50; Air Source Heat Pump: SEER 18, 9.3
HSPF; Ducts: In Finished Space; Hot Water Pipe Insulation: R-5; Clothes Washer: Standard Front-loading CEE Tier 2;
Clothes Dryer: Vented Elec CEF 3.93; Plug Loads: Optimal occupant behavior with smart control; PV System: 3.8 kW;
SF2100 CZ15 All-Electric
Unfinished Attic: Ceiling R-49 Gr-1 Cellulose, Vented; Radiant Barrier: Yes; Air Leakage: 4 ACH50; Air Source Heat Pump:
SEER 15, 8.5 HSPF; Ducts: In Finished Space; Hot Water Pipe Insulation: R-5; Clothes Dryer: Vented Elec CEF 3.93; Plug
Loads: Optimal occupant behavior with smart control; PV System: 4.9 kW;
SF2100 CZ16 All-Electric
Unfinished Attic: Ceiling R-49 Gr-1 Cellulose, Vented; Air Source Heat Pump: SEER 18, 9.3 HSPF; Ducts: In Finished
Space; Hot Water Pipe Insulation: R-5; Dishwasher: Energy Star; Clothes Washer: Standard Front-loading CEE Tier 2;
Clothes Dryer: Vented Elec CEF 3.93; Plug Loads: Optimal occupant behavior with smart control; PV System: 4.8 kW;
Source: Lawrence Berkeley National Laboratory
Table B-4: Measure package for the most cost-effective single-family 2100 ft2
mixed-fuel homes
Building Type CZ
Fuel Type Measures
SF2100 CZ01 Mixed-Fuel
Furnace: Gas, 92.5 percent AFUE; Ducts: In Finished Space; Water Heater: Gas Tankless, Condensing; Hot Water Pipe
Insulation: R-5; Cooking Range: Gas Cooktop Max Tech; Clothes Dryer: Vented Gas CEF 3.48; PV System: 3.1 kW;

B-4
Building Type CZ
Fuel Type Measures
SF2100 CZ02 Mixed-Fuel
Unfinished Attic: Ceiling R-49 Gr-1 Cellulose, Vented; Furnace: Gas, 92.5 percent AFUE; Ducts: In Finished Space; Water
Heater: Gas Tankless, Condensing; Hot Water Pipe Insulation: R-5; Cooking Range: Gas Cooktop Max Tech; Clothes Dryer:
Vented Gas CEF 3.48; Plug Loads: Advanced Power Strips with IR and occupancy sensor; PV System: 2.6 kW;
SF2100 CZ03 Mixed-Fuel
Unfinished Attic: Ceiling R-49 Gr-1 Cellulose, Vented; Furnace: Gas, 92.5 percent AFUE; Ducts: In Finished Space; Water
Heater: Gas Tankless, Condensing; Hot Water Pipe Insulation: R-5; Cooking Range: Gas Cooktop Max Tech; Clothes Dryer:
Vented Gas CEF 3.48; Plug Loads: Advanced Power Strips with IR and occupancy sensor; PV System: 2.5 kW;
SF2100 CZ04 Mixed-Fuel
Central Air Conditioner: SEER 16 EER 13.5 2-speed; Furnace: Gas, 92.5 percent AFUE; Ducts: In Finished Space; Hot Water
Pipe Insulation: R-5; Cooking Range: Gas Cooktop Max Tech; Clothes Dryer: Vented Gas CEF 3.48; Plug Loads: Advanced
Power Strips with IR and occupancy sensor; PV System: 2.5 kW;
SF2100 CZ05 Mixed-Fuel
Furnace: Gas, 92.5 percent AFUE; Ducts: In Finished Space; Water Heater: Gas Tankless, Condensing; Hot Water Pipe
Insulation: R-5; Cooking Range: Gas Cooktop Max Tech; Clothes Dryer: Vented Gas CEF 3.48; PV System: 2.4 kW;
SF2100 CZ06 Mixed-
Fuel
Wood Stud: R-23 Fiberglass Batt, Gr-1, 2x6, 16 in o.c.; Ducts:
In Finished Space; Hot Water Pipe Insulation: R-5; Cooking Range: Gas Cooktop Max Tech; Clothes Dryer: Vented Gas CEF 3.48; Plug Loads: Advanced Power Strips with IR and
occupancy sensor; PV System: 2.6 kW;
SF2100 CZ07 Mixed-Fuel
Ducts: In Finished Space; Hot Water Pipe Insulation: R-5; Cooking Range: Gas Cooktop Max Tech; Clothes Dryer:
Vented Gas CEF 3.48; Plug Loads: Advanced Power Strips with IR and occupancy sensor; PV System: 2.4 kW;
SF2100 CZ08 Mixed-Fuel
Central Air Conditioner: SEER 16 EER 13.5 2-speed; Ducts: In Finished Space; Hot Water Pipe Insulation: R-5; Cooking
Range: Gas Cooktop Max Tech; Clothes Dryer: Vented Gas CEF 3.48; Plug Loads: Advanced Power Strips with IR and
occupancy sensor; PV System: 2.6 kW;
SF2100 CZ09 Mixed-Fuel
Central Air Conditioner: SEER 16 EER 13.5 2-speed; Ducts: In Finished Space; Hot Water Pipe Insulation: R-5; Cooking Range: Gas Cooktop Max Tech; Clothes Dryer: Vented Gas
CEF 3.48; Plug Loads: Advanced Power Strips with IR and occupancy sensor; PV System: 2.7 kW;

B-5
Building Type CZ
Fuel Type Measures
SF2100 CZ10 Mixed-Fuel
Air Leakage: 4 ACH50; Central Air Conditioner: SEER 16 EER 13.5 2-speed; Ducts: In Finished Space; Hot Water Pipe
Insulation: R-5; Cooking Range: Gas Cooktop Max Tech; Clothes Dryer: Vented Gas CEF 3.48; Plug Loads: Advanced
Power Strips with IR and occupancy sensor; PV System: 2.8 kW;
SF2100 CZ11 Mixed-Fuel
Unfinished Attic: Ceiling R-60 Gr-1 Cellulose, Vented; Air Leakage: 4 ACH50; Central Air Conditioner: SEER 16 EER 13.5
2-speed; Furnace: Gas, 92.5 percent AFUE; Ducts: In Finished Space; Hot Water Pipe Insulation: R-5; Cooking Range: Gas
Cooktop Max Tech; Clothes Dryer: Vented Gas CEF 3.48; Plug Loads: Advanced Power Strips with IR and occupancy sensor; PV System: 3.2 kW;
SF2100 CZ12 Mixed-
Fuel
Central Air Conditioner: SEER 16 EER 13.5 2-speed; Furnace:
Gas, 92.5 percent AFUE; Ducts: In Finished Space; Hot Water Pipe Insulation: R-5; Cooking Range: Gas Cooktop Max Tech;
Clothes Dryer: Vented Gas CEF 3.48; Plug Loads: Advanced Power Strips with IR and occupancy sensor; PV System: 2.8 kW;
SF2100 CZ13 Mixed-
Fuel
Central Air Conditioner: SEER 16 EER 13.5 2-speed; Furnace:
Gas, 92.5 percent AFUE; Ducts: In Finished Space; Hot Water Pipe Insulation: R-5; Cooking Range: Gas Cooktop Max Tech;
Clothes Dryer: Vented Gas CEF 3.48; Plug Loads: Advanced Power Strips with IR and occupancy sensor; PV System: 3.4 kW;
SF2100 CZ14 Mixed-
Fuel
Unfinished Attic: Ceiling R-60 Gr-1 Cellulose, Vented; Air
Leakage: 4 ACH50; Central Air Conditioner: SEER 16 EER 13.5 2-speed; Furnace: Gas, 92.5 percent AFUE; Ducts: In Finished
Space; Hot Water Pipe Insulation: R-5; Cooking Range: Gas Cooktop Max Tech; Clothes Dryer: Vented Gas CEF 3.48; Plug
Loads: Advanced Power Strips with IR and occupancy sensor; PV System: 2.8 kW;
SF2100 CZ15 Mixed-Fuel
Unfinished Attic: Ceiling R-49 Gr-1 Cellulose, Vented; Radiant Barrier: Yes; Air Leakage: 4 ACH50; Central Air Conditioner:
SEER 15 EER 13; Ducts: In Finished Space; Hot Water Pipe Insulation: R-5; Cooking Range: Gas Cooktop Max Tech;
Clothes Dryer: Vented Gas CEF 3.48; Plug Loads: Advanced Power Strips with IR and occupancy sensor; PV System: 4.9 kW;

B-6
Building Type CZ
Fuel Type Measures
SF2100 CZ16 Mixed-Fuel
Unfinished Attic: Ceiling R-49 Gr-1 Cellulose, Vented; Central Air Conditioner: SEER 16 EER 13.5 2-speed; Furnace: Gas,
92.5 percent AFUE; Ducts: In Finished Space; Water Heater: Gas Tankless, Condensing; Hot Water Pipe Insulation: R-5;
Cooking Range: Gas Cooktop Max Tech; Clothes Dryer: Vented Gas CEF 3.48; PV System: 2.5 kW;
Source: Lawrence Berkeley National Laboratory
Table B-5: Measure package for the most cost-effective single-family 2700 ft2 all-
electric homes
Building Type CZ
Fuel Type Measures
SF2700 CZ03 All-Electric
Air Source Heat Pump: SEER 16, 8.6 HSPF; Ducts: In Finished Space; Water Heater: HPWH, 50 gal UEF3.7; Hot Water Pipe
Insulation: R-5; Dishwasher: Energy Star; Clothes Washer: Standard Front-loading CEE Tier 2; Clothes Dryer: Vented Elec
CEF 3.93; Plug Loads: Optimal occupant behavior with smart control; PV System: 4.5 kW;
SF2700 CZ10 All-Electric
Air Leakage: 4 ACH50; Air Source Heat Pump: SEER 22, 10 HSPF; Ducts: In Finished Space; Water Heater: HPWH, 50 gal
UEF3.7; Hot Water Pipe Insulation: R-5; Refrigerator: Bottom freezer EF 21.3; Clothes Washer: Standard Front-loading CEE
Tier 2; Clothes Dryer: Vented Elec CEF 3.93; Plug Loads: Optimal occupant behavior with smart control; PV System: 4.0 kW;
SF2700 CZ13 All-
Electric
Wall Sheathing: R-10 XPS; Air Source Heat Pump: SEER 22,
10 HSPF; Ducts: In Finished Space; Water Heater: HPWH, 50 gal UEF3.7; Hot Water Pipe Insulation: R-5; Refrigerator:
Bottom freezer EF 21.3; Clothes Washer: Standard Front-loading CEE Tier 2; Clothes Dryer: Vented Elec CEF 3.93; Plug
Loads: Optimal occupant behavior with smart control; PV System: 4.8 kW;
Source: Lawrence Berkeley National Laboratory
Table B-6: Measure package for the most cost-effective single-family 2700 ft2
mixed-fuel homes
Building Type CZ
Fuel Type Measures
SF2700 CZ03 Mixed-Fuel
Air Leakage: 4 ACH50; Furnace: Gas, 92.5 percent AFUE; Ducts: In Finished Space; Water Heater: Gas Tankless,
Condensing; Hot Water Pipe Insulation: R-5; Cooking Range: Gas Cooktop Max Tech; Clothes Dryer: Vented
Gas CEF 3.48; Plug Loads: Advanced Power Strips with IR and occupancy sensor; PV System: 2.8 kW;

B-7
Building Type CZ
Fuel Type Measures
SF2700 CZ10 Mixed-Fuel
Unfinished Attic: Ceiling R-60 Gr-1 Cellulose, Vented; Air Leakage: 3 ACH50; Central Air Conditioner: SEER 15 EER
13; Ducts: In Finished Space; Water Heater: Gas Tankless, Condensing; Hot Water Pipe Insulation: R-5;
Cooking Range: Gas Cooktop Max Tech; Clothes Dryer: Vented Gas CEF 3.48; Plug Loads: Advanced Power Strips with IR and occupancy sensor; PV System: 3.4 kW;
SF2700 CZ13 Mixed-
Fuel
Unfinished Attic: Ceiling R-60 Gr-1 Cellulose, Vented; Air
Leakage: 3 ACH50; Central Air Conditioner: SEER 15 EER 13; Furnace: Gas, 92.5 percent AFUE; Ducts: In Finished
Space; Hot Water Pipe Insulation: R-5; Cooking Range: Gas Cooktop Max Tech; Clothes Dryer: Vented Gas CEF 3.48; Plug Loads: Advanced Power Strips with IR and
occupancy sensor; PV System: 4.0 kW;
Source: Lawrence Berkeley National Laboratory
Table B-7: Measure package for the most cost-effective multi-family 8-unit all-
electric building
Building
Type CZ
Fuel
Type Measures
MF8unit CZ03 All-Electric
Air Leakage: 3 ACH50; Mini-Split Heat Pump: SEER 20, 10.3 HSPF; Hot Water Pipe Insulation: R-5; Refrigerator:
Bottom freezer EF 19.8; Clothes Washer: Standard Front-loading CEE Tier 2; Clothes Dryer: Vented Elec CEF 3.93; Plug Loads: Optimal occupant behavior with smart
control; PV System: 15.0 kW (3);
MF8unit CZ10 All-Electric
Wall Sheathing: R-10 XPS; Air Leakage: 3 ACH50; Mini-Split Heat Pump: SEER 25.3, 13.4 HSPF; Hot Water Pipe
Insulation: R-5; Refrigerator: Bottom freezer EF 19.8; Clothes Washer: Standard Front-loading CEE Tier 2;
Clothes Dryer: Vented Elec CEF 3.93; Plug Loads: Optimal occupant behavior with smart control; PV System: 16.0 kW;
MF8unit CZ13 All-
Electric
Air Leakage: 2 ACH50; Mini-Split Heat Pump: SEER 25.3,
13.4 HSPF; Hot Water Pipe Insulation: R-5; Refrigerator: Bottom freezer EF 19.8; Clothes Washer: Standard Front-
loading CEE Tier 2; Clothes Dryer: Vented Elec CEF 3.93; Plug Loads: Optimal occupant behavior with smart control; PV System: 17.5 kW;
Source: Lawrence Berkeley National Laboratory

B-8
Table B-8: Measure package for the most cost-effective multi-family 8-unit mixed-fuel building
Building
Type CZ
Fuel
Type Measures
MF8unit CZ03 Mixed-Fuel Unfinished Attic: Ceiling R-49 Gr-1 Cellulose, Vented; Air Leakage: 2 ACH50; Hot Water Pipe Insulation: R-5;
Refrigerator: Bottom freezer EF 19.8; Cooking Range: Gas Cooktop Max Tech; Clothes Dryer: Vented Gas CEF 3.48; Plug Loads: Optimal occupant behavior with smart
control; PV System: 15.0 kW;
MF8unit CZ10 Mixed-Fuel Unfinished Attic: Ceiling R-49 Gr-1 Cellulose, Vented; Radiant Barrier: Yes; Air Leakage: 2 ACH50; Central Air
Conditioner: SEER 15 EER 13; Hot Water Pipe Insulation: R-5; Refrigerator: Bottom freezer EF 19.8; Cooking Range: Gas Cooktop Max Tech; Clothes Dryer: Vented
Gas CEF 3.48; Plug Loads: Optimal occupant behavior with smart control; PV System: 16.0 kW;
MF8unit CZ13 Mixed-Fuel Wall Sheathing: R-10 XPS; Unfinished Attic: Ceiling R-60
Gr-1 Cellulose, Vented; Radiant Barrier: Yes; Air Leakage: 2 ACH50; Central Air Conditioner: SEER 15 EER 13; Hot Water Pipe Insulation: R-5; Refrigerator: Bottom freezer
EF 19.8; Cooking Range: Gas Cooktop Max Tech; Clothes Dryer: Vented Gas CEF 3.48; Plug Loads: Optimal
occupant behavior with smart control; PV System: 17.5 kW;
Source: Lawrence Berkeley National Laboratory

B-9
Figure B-1: Optimal Sizing of 2hr Battery (Minimum 2kWh): Average Cost-Reducing over Time, 2100 ft2 All-electric Home, Base 2022 TDV
Figure B-1 shows that the optimal sizing of 2hr battery for the Average Cost-reducing over Time battery
cost case for a single family all-electric home is very high for the optimal dispatch case and about 2-7kW
for other dispatch cases.
Source: Lawrence Berkeley National Laboratory
Figure B-2: TDV Net Benefits Less Battery Costs (30-year NPV): Average Cost-Reducing over Time, 2100 ft2 All-electric Home, Base 2022 TDV
Figure B-2 shows the net benefits less battery costs for all-electric single family homes for the Average Cost-Reducing over Time battery cost case is mostly above zero except for the backup dispatch case.
Source: Lawrence Berkeley National Laboratory
0.0
2.0
4.0
6.0
8.0
10.0
12.0
14.0
16.0
18.0
20.0
CZ0
1
CZ0
2
CZ0
3
CZ0
4
CZ0
5
CZ0
6
CZ0
7
CZ0
8
CZ0
9
CZ1
0
CZ1
1
CZ1
2
CZ1
3
CZ1
4
CZ1
5
CZ1
6
5.5 4.1 4.3 3.9 4.0 3.6 3.2 3.5 3.6 3.5 4.2 3.9 4.1 3.8 4.9 4.9
Op
tim
al
Sto
rag
e C
ap
aci
ty (
kWh
)
Optimal
Shuffled
TOU
Basic
Dispatch
PV Capacity(kW)
-15,000
-10,000
-5,000
0
5,000
10,000
15,000
CZ0
1
CZ0
2
CZ0
3
CZ0
4
CZ0
5
CZ0
6
CZ0
7
CZ0
8
CZ0
9
CZ1
0
CZ1
1
CZ1
2
CZ1
3
CZ1
4
CZ1
5
CZ1
6
Ne
t T
DV
Be
ne
fit
–N
PV
Ba
tte
ry C
ost
($
20
23
)
Optimal
Shuffled
TOU
Basic
Backup
Dispatch

B-10
Storage Sensitivity with Optimistic Battery Storage Costs Storage case with optimistic case on battery storage costs, by starting with today’s lowest
(rather than industry average) battery storage costs and assuming that these costs will decline
in the future41. As expected, this lower battery storage cost case suggests larger batteries and
higher net benefits than the cases previously shown.
Figure B-3: Optimal Sizing of 2hr Battery (Minimum 2kWh): Low Cost-Reducing over Time, 2100 ft2 Mixed Fuel Home, Base 2022 TDV
Figure B-3 shows the optimal sizing for 2hr battery can be very large in with low-cost battery storage cost
assumptions.
Source: Lawrence Berkeley National Laboratory
41 See description of ‘Low Cost-Reducing Over Time’ in Methodology chapter
0.0
5.0
10.0
15.0
20.0
25.0
30.0
35.0
40.0C
Z01
CZ0
2
CZ0
3
CZ0
4
CZ0
5
CZ0
6
CZ0
7
CZ0
8
CZ0
9
CZ1
0
CZ1
1
CZ1
2
CZ1
3
CZ1
4
CZ1
5
CZ1
6
3.0 2.4 2.4 2.3 2.3 2.4 2.3 2.4 2.5 2.6 2.9 2.5 2.9 2.5 4.0 2.3
Op
tim
al
Sto
rag
e C
ap
aci
ty (
kWh
)
Optimal
Shuffled
TOU
Basic
Dispatch
PV Capacity(kW)

B-11
Figure B-4: TDV Net Benefits Less Battery Costs (30-year NPV): Low Cost-Reducing over Time, 2100 ft2 Mixed Fuel Home, Base 2022 TDV
Figure B-4 shows that with low cost battery storage assumptions, battery storage can be cost effective
for optimal, shuffled, and basic dispatch.
Source: Lawrence Berkeley National Laboratory
Renewable Natural Gas Cost Components
• Feedstock costs: Costs required to collect biogas, the raw input for RNG production, are
described as feedstock costs. MSW has negative feedstock costs associated with it since
the use of MSW to produce biogas reduces landfill tipping fees. These costs may be low or
zero on a marginal basis if biogas is already collected (as is often required at landfills and
wastewater treatment plants (WWTPs)). Dairies can face more significant feedstock costs
from collecting manure for central processing, though these also may become lower over
time on a marginal basis as the California Air Resources Board (CARB) works to address
methane emissions from dairy as part of its Short-Lived Climate Pollutant Reduction
Strategy.42 Advanced biofuels are likely to face higher feedstock costs, as they require
collecting residues that are currently not collected.
• Conversion costs: Costs associated with converting the feedstock into methane. These
apply to dairy and MSW sources (e.g. the purchase and operation of bacteria digesters) as
well as advanced biofuels (e.g. the purchase and operation of gasification equipment), but
not to landfill gas or WWTPs.
• Upgrading/Injection: Specialized technology and infrastructure may be needed to process
the biogas to meet commercial natural gas quality standards. Landfill, MSW, dairy and
WWTP sources may need to upgrade equipment used to collect and process biogas into
RNG.
42 See https://www.arb.ca.gov/cc/shortlived/shortlived.htm
-10,000
-5,000
0
5,000
10,000
15,000
20,000
25,000
30,000
CZ0
1
CZ0
2
CZ0
3
CZ0
4
CZ0
5
CZ0
6
CZ0
7
CZ0
8
CZ0
9
CZ1
0
CZ1
1
CZ1
2
CZ1
3
CZ1
4
CZ1
5
CZ1
6
Ne
t T
DV
Be
ne
fit
–N
PV
Ba
tte
ry C
ost
($
20
23
)
Optimal
Shuffled
TOU
Basic
Backup
Dispatch

B-12
• Pipeline connection: Costs are associated with the technology and infrastructure needed to
deliver the RNG to distribution pipelines. Costs can vary widely depending on the distance
from the biogas source to the pipeline and the volume of RNG being produced: per-unit
costs are lower for larger-volume resources due to the fixed cost of connection being
spread out over more RNG production. As an example, dairies may be located further from
distribution pipelines, but are frequently clustered, which yields benefits in transportation
costs.
Forecasted demand for Renewable Natural Gas Estimates are based on the following:
1. Annual gas consumption per new home. Estimates of annual household site
natural gas consumption for the single-family (SF), multi-family (MF) and mobile home
(MH) types in the West region were taken from the U.S. Energy Information
Administration (EIA) Residential Energy Consumption Survey (RECS) (Energy
Information Administration, 2013); and
2. The number of new homes. Estimates of new homes of each type added annually
were obtained from the CEC’s 2015 IEPR report (CEC, 2015) mid-demand statewide
housing forecast.
Table B-9: Estimated Gas Demand from New Residential Construction in California, 2017
Type 2017 demand (MMcf)
New single-family homes in 2017 128,975
Gas consumption per new single-family home (MMBtu) 59
New multi-family homes in 2017 81,484
Gas consumption per new multi-family home (MMBtu) 26
New mobile homes in 2017 3,034
Gas consumption per new mobile home (MMBtu) 49
Total new construction gas consumption (TBtu) 10
Table B-9 shows the estimated gas demand from residential new construction in California in 2017
Source: CEC 2015 mid demand statewide housing forecast by climate zone

B-13
Table B-10: Natural gas consumption in California, 2016 (MMcf)
Use 2016 demand (MMcf)
Lease Fuel Consumption 39,615
Plant Fuel Consumption 1,545
Pipeline and Distribution Use 22,460
Residential Consumption 411,828
Commercial Consumption 236,967
Industrial Consumption 774,504
Vehicle Fuel Consumption 19,395
Deliveries to Electric Power Consumers 671,152
Total Consumption 2,177,467
Table B-10 shows the 2016 consumption of natural gas in California, by end use.
Source: (Energy Information Administration, 2013)
Figure B-5: Cost Differences Between Residential, Commercial, and Utility-Scale
Solar Photovoltaic
Figure B-5 shows the lower cost for solar PV with increasing project size.
Source: NREL, U.S. Solar Photovoltaic System Cost Benchmark: Q1 2016, September 2016, https://www.nrel.gov/docs/fy16osti/67142.pdf

B-14
Figure B-6: Unsubsidized Levelized Cost of Energy – Solar Photovoltaic Comparison (Lazard)
Figure B-6 shows the unsubsidized levelized cost of energy that compares solar PV systems.
Source: Lazard (2019)

C-1
APPENDIX C: Expert Elicitation Protocol and Summary Results
Survey Protocol In choosing the elicitation mode, considering the great number of building measures included
in the survey, the research team decided to carry out face-to-face elicitations to allow
researchers to have more control over the pace of the elicitation and provide clarifications
when necessary. The option of conducting elicitations through online video conference
software was also offered in case face-to-face was unfeasible for researchers or experts. A
diverse pool of expert candidates was selected from different sectors and industries. The list of
experts was mostly drawn from pre-existing in-house building professional contacts and from
Department of Energy43 and Zero Energy Project44 website. For this study, the research team
initially identified around 30 home builders and policy analysts with expertise on the costs of
ZNE homes in California and completed eight interviews during the period of November 2017
to June 2018.
The entire elicitation process proceeded in two phases. The first phase was the pilot study and
the second was the formal elicitation. The pilot study helped researchers fine-tune the design
of the survey, including improving the clarity of the questions, adjusting the length when
necessary, and making sure the questions asked covered the objectives of the research
project. Out of the eight interviews completed, three were conducted during the pilot study
and the rest were conducted during the formal elicitation. Given that the interview protocol
and questionnaire was not changed significantly between two phases, the team included
responses from both phases in the analysis.
Once experts agreed to participate in the elicitation, they were provided a short online survey
where they identified their area of expertise in terms of fuel type, housing type, and climate
zone that they have the most experience with. The elicitation then focused on the areas of
expertise they identified as most familiar to them. Prior to the elicitation the experts were
provided with supplementary material relevant to their expertise, as well as the expert
elicitation questions so they could familiarize themselves with the elicitation process in
advance. To keep experts from being identifiable, only the aggregated and de-identified data
are presented in this report.
All elicitations were performed by researchers who also took part in designing the survey. In
most cases, researchers followed a standardized survey interviewing technique which only
provided scripted information to respondents. However, researchers would sometimes engage
in a conversational interviewing approach to clarify to respondents the meaning of questions
43 The Department of Energy Zero Energy Ready Home, more information is available at: https://www.energy.
gov/eere/buildings/zero-energy-ready-home
44 The Zero Energy Project is a non-profit educational organization focusing on helping the home construction
industry to move towards zero net energy homes and near zero net energy homes. Website is available at: https://zeroenergyproject.org/

C-2
when required. In the formal elicitation stage, the completion time of each elicitation averaged
around two and a half hours. During the entire elicitation period, participating experts were
given full access to researchers via telephone or email for any additional concerns or question
they might have.
Expert Elicitation Summary This section summarizes inputs elicited from experts to address the following key research
questions:
• What are the current and future cost estimates of building measures for residential ZNE
construction? And what are the key cost reduction areas for TDV-ZNE implementation?
• What are the relative costs of all-electric versus mixed fuel homes?
• What is the potential for community renewables, storage, and demand response in ZNE
implementation?
• What are the market barriers and key challenges for ZNE implementation?
Ranges of quantitative estimates are provided to support statements when available,
otherwise most of the questions are addressed qualitatively. A detailed summary of experts’
responses concerning current and future cost estimates can be found in this Appendix.
Key Takeaways Related to Current and Future Cost Estimates
Experts identified a few areas that they consider as the more impactful cost contributors to
building ZNE homes in California. Among all the building measures, having better quality
insulation and air sealing in the building envelope is the key to achieving ZNE, and having a
well-insulated home will help reduce the need of HVAC capacity. It is estimated to cost an
additional $4,000 for advanced framing in walls and attics in a standard-sized production
home, the biggest cost increment by shifting from code compliant to ZNE homes. However,
this cost increase associated with building a higher performance envelope has less to do with
any material or technology innovation, instead it has more to do with the design change,
namely the integrated design process. Most experts agreed that initially there must be a
steeper learning curve in adopting this new design approach; however, as builders get more
experienced, the cost is expected to go down by 25 percent in the coming years under the
current CEC policy guideline. If the full ZNE compliance took place sooner, then it would help
drive down the cost even faster. The second largest cost contributor is the HVAC system,
estimated to be between $2,000 and $2,500 more in ZNE homes than code compliant homes.
In ZNE homes, both production and custom home builders chose the use of heat pump
systems rather than gas furnaces paired with split system air conditioners commonly seen in
mixed-fuel conventional homes. Typically, a ZNE home does not have as much heating and
cooling needs because of its well-insulated envelope, and heat pump capacity can be sized
down which helps reduce the cost difference. Most experts think that HVAC equipment is not a
particularly innovative industry, and they have not seen any huge breakthroughs that will
change the cost drastically. However, they expect that heat pump HVAC system cost would
naturally come down by 5 percent to 20 percent between now and 2026 as technology ramps
up and gains higher market saturation.

C-3
Another prominent cost contributor could be windows when builders start installing triple-pane
windows. As of today, triple-pane windows are a hot topic in the construction industry;
however, their high price tag and heavy weight are perceived as immense barriers for builders,
especially production home builders. Among all the experts that the research team spoke with,
only a few custom home builders had installed triple-pane windows in ZNE homes, and most
of those products were manufactured in Europe. There is still an unsettled debate over
whether it is really worth spending tens of thousands of dollars for triple-pane windows per
home. Some manufactures are working on developing technologies that can make triple-pane
windows lighter and more cost effective. One company is developing a super thin film triple-
pane which has a middle pane that is like a hanging film in between a dual-pane frame. This
design makes it lighter and easier for installation. Windows made of uPVC (unplasticized
polyvinyl chloride) might help bring the cost down while providing great sound and thermal
insulation. Mainstreaming good quality triple-pane windows and increasing U.S. manufacturing
capability would definitely help make it a more attractive choice for builders; however, most
experts think there is still a long way to go before the market is ready for them. Given the
complexity and uncertainty in the window manufacturing industry, experts were not able to
provide future cost estimates with confidence. Lastly, the PV system, when it is purchased,
could make up to a significant portion of the cost premium related to ZNE homes. Depending
on the policy mandate, the rate of price decline in PV technology could play a major role in
impacting the course of future ZNE costs. Most experts predict that PV system costs could
decline by another 5 percent to10 percent between now and 2026.
For non-building measures, almost all experts focused on the importance of having a good
design when building ZNE homes and how implementing an integrated design process can
significantly help lower the construction costs. Most custom home builders apply a design-build
model where they have their own in-house team that does both the design and construction of
a project. Their services would range from architectural design, structural engineering, and
energy modeling to site construction. The total design cost for a small custom ZNE home is
estimated to be around $30,000 to $35,000. For some production ZNE builders, the biggest
cost difference related to design is centered around investing more time, about 30 hours in
total per year, for team-wide review across departments for each plan than code compliant
homes. This practice manifests the core of an integrated design process and ensures that
different departments, such as drafting, contract, modeling, marketing, etc., are in sync with
each other resulting in more effective collaboration. Undoubtedly there is going to be a
learning curve at first, but team members gain experience and knowledge each time they build
ZNE homes, so less time will be needed in the future. Besides incorporating an integrated
design process, providing continuing education opportunities allows team members to acquire
the skills and knowledge needed for effectively building ZNE homes, which could ultimately
reduce future labor costs. Even though advanced performance envelopes do not necessarily
require any innovative building material or ground-breaking technology, it does require a skilled
worker who knows how to install it properly. Builders who are willing to make investments into
providing ongoing training for their management and trades have more success in building ZNE
homes. In some instances, even building material manufacturers are involved in designing and
delivering staff training.

C-4
All-Electric versus Mixed Fuel Homes
Experts’ views on whether there is a cost difference for the shift from mixed fuel homes to all-
electric homes are split between building ZNE homes on land with existing gas infrastructure
or not. For those who think there is a cost decrease associated with the shift, the main
argument is that gas infrastructure is not needed in all-electric new construction; therefore,
the savings from avoiding installing gas infrastructure could outweigh cost increases from
more expensive electric HVAC and water heating system. It is worth noting that the cost
saving from infrastructure can vary depending on the location of the property (rural versus
urban) and the size of the community. Major utilities across California offer different amounts
of gas main extension allowances per gas appliances.45 Builders located in regions where
higher allowances are provided bear less additional costs associated with gas infrastructure.
The cost savings from avoiding gas infrastructure diminish on a per home basis in larger
communities as well. The range of estimated cost savings from avoiding gas infrastructure can
be very different, from $3,000-$5,000 to $10,000 per home depending on the size of home.
However, in most cases where there is already existing gas infrastructure, and experts expect
cost increases from fuel switching would mostly come from heat pump space heating and
cooling, electric water heater, and induction cooktop. The total estimated cost premium
related to fuel switching from gas to electric appliances in the Central Valley ranges from
$3,500 to $3,800.
Experts hold different perspectives on the future of all-electric homes. Some custom builders
think all-electric homes are necessary when you build airtight ZNE homes; otherwise using
gas-fired appliances may create in-door air quality hazards. Some builders think all-electric is
the end goal, but they do not believe the market is ready for the shift. On the other hand,
some experts think since gas is still relatively cheap and the infrastructure already exists in
many places, removing gas completely would be wasteful and create burden on a subset of
communities, meaning that remaining gas customers would bear the operation and
maintenance expenses for the existing gas infrastructure. As there is a consistent demand for
certain gas-fired appliances from home buyers, such as: gas cooktops, gas dryers, and gas
furnaces, many builders, especially production home builders, still plan to have full gas
infrastructure in place so that they can provide gas as an option for home buyers.
Community Renewables, Storage and Demand Response
The discussion related to community renewables has mostly centered on the role of
community solar in ZNE implementation. Most experts hold a positive attitude toward
community solar but also note the complexity of making it actually feasible. There are three
main challenges that community solar faces: (1) physical challenges, concerning the physical
location of community solar and assessment of related insurance or liability hazard (2)
regulatory challenges, related to ways in which program design interacts with existing policy
and regulations, and (3) economic challenges, in terms of the ownership structure,
subscription pricing, and bill credit calculation. In order to remove these barriers, state-level
45 Gas main extension allowance works as credit for gas usage from qualifying natural gas appliances. The type
of gas appliances or equipment installed at home determine the amount of credit that may reduce the
construction costs of gas main extensions.

C-5
policymakers and regulators will have to work with utilities to create a supportive regulatory
environment to expand the distributed solar market. They will also have to think through
issues related to load management resulting from rising solar penetration.
One phenomenon that many energy policy researchers observe when increasing levels of
variable generation resources (i.e., solar PV and wind) are added to the electric grid system is
the unique change in the electric load shape, known as the “duck curve” (California ISO,
2016). The duck curve is observed when there is a sizeable imbalance between peak demand
and solar generation which imposes grid operation challenges for system operators.
Maintaining reliability in the grid system requires balancing both variable demand and variable
supply and having controllable resources with ramping flexibility and the ability to react quickly
depending on grid conditions. Many policy makers are considering integrating companion
measures, such as energy storage and demand response in community solar program design
to alleviate the duck curve and mitigate variability from growing penetration of solar PV.
However, when the research team spoke to the experts, only a few custom home builders had
installed energy storage in their ZNE homes and none of them had implemented any demand
response management system. Production home builders are more hesitant to try these
technologies mainly because of the costs, unless they receive funding opportunities to partner
with utilities and research institutes. Besides the high cost, there are still some critical issues
that need to be resolved (first and foremost is the proper sizing of the storage under different
scenarios), and these issues are addressed in more detail in Chapter 3 of this report.
Market Barriers and Key Challenges
As stressed by experts from both custom and production home construction, many building
technologies required in ZNE homes already exist, what matters the most is incorporating an
integrated design process which requires all building development team members to work
collaboratively throughout the entire building process starting from the design stage. This
approach would require thinking about every aspect of the building process ahead of time
including HVAC, plumbing, lighting and wiring, site planning, framing, etc., and sometimes the
floor plan may need to be redesigned to take into account high performance attics and
advanced framing walls. For instance, building 2x6 walls would mean having thicker walls, so
builders would have to either build in or out to accommodate the thicker walls. If builders did
not integrate the 2x6 wall insulation into their design process as early as land acquisition, they
would very likely have to build in resulting in the home having less square footage, which
would trigger downstream impacts on the layout of stairways, cabinets, bathroom, etc. Even
though integrated design process may seem time-consuming at first, having everyone working
as a team results in a much smoother building process and avoids the need for design revision
which will lead to project delay and budget increases.
Many of the builders who have implemented the integrated a design process approach in
building ZNE homes, stressed that the cost difference between a ZNE home and a Title 24
compliance home in equivalent size and climate zone is not as substantial as some builders
might think. The problem is that there are only very few ZNE examples in the market to
demonstrate how to get it done properly and cost effectively, so the majority of builders are
still hesitant to begin building ZNE homes and adopting an integrated design process. This
common cost myth toward ZNE homes further contributes to builders’ unwillingness to strive
for better home efficiency performance. In particular, builders located in milder climate zones

C-6
might have limited energy saving potential and therefore, installing high efficiency measures is
often not their top priority.
In addition, most home listing services do not show a differentiation in home value based on
the energy savings and energy features. This coupled with home buyers having a lack of
awareness and knowledge, while builders face a lack of incentives creates a challenge for ZNE
homes to gain traction in the market. Establishing an appraisal system to accurately evaluate
the added value of ZNE homes becomes critical to fill this lack of knowledge for both builders
and home buyers.
The construction industry is extremely litigious, especially in California; therefore, fear of
litigation is universal among builders, and any potential legal issues related to building ZNE
homes may prevent them from adopting full ZNE designs. ZNE homes are still a relatively
novel concept in the building industry, not only do builders struggle with what ZNE homes
actually mean and what the benefits are, but so do homebuyers. Most legal issues arise when
builders do not fully understand the nuances between full ZNE homes (TDV-based) and simply
zero energy homes (kWh-based) and when there is miscommunication between the marketing
team and homebuyers in terms of the promised energy savings. Different interpretations of
ZNE homes could directly impact the solar capacity needed to install on homes. If the
delivered energy savings did not align with the homebuyers’ expectation, builders may face
legal challenges. Some experts have seen other builders become involved in lawsuits as a
result of promoting ZNE homes as having a “zero energy bill” or marketing energy efficient
home as ZNE homes. These kinds of lawsuits happen more often to highly segmented builders
who outsource their marketing team, sales agent, and energy consultants so that the nuances
do not get communicated well across entities and disconnection may occur.
Expert Elicitation Conclusions
Results from the expert elicitation study show that ZNE residential new construction in
California is feasible; however, it is not yet mainstream. With very few ZNE examples in the
market to demonstrate how to properly and cost effectively achieve ZNE, builders are still
hesitant to commit to building ZNE homes. Even though (Hoen et al., 2017) showed that new
homes with purchased PV system have higher premium at about $3.58/watt, most builders are
discouraged by the fact that some other energy efficiency features are not being accurately
reflected in the current appraisal system. Similarly, experts emphasized builders being
discouraged by a fear of litigation given that the construction industry is extremely litigious.
With ZNE construction being a novel field, and there being a lack of clarity on definitions and
metrics, builders fear increases in susceptibility to litigation.
Experts noted that successful ZNE residential new construction projects signify that the
necessary technologies exist and are available, it is a matter of understanding what changes
need to be made to the design plan and how to properly and effectively implement it.
According to experts’ responses, the most impactful building measures for meeting ZNE
requirements relate to improving insulation and air sealing in building envelopes, they also
noted that the cost premium associated with ZNE homes mainly comes from higher
performance envelopes and the installation of heat pump systems. At first builders will
experience a steeper learning curve, but as they gain more experiences and create greater
demand for those building materials, the building envelope cost is expected to decrease by

C-7
around 25 percent in the coming years, and potentially a greater price decline would occur if
the full ZNE compliance took place sooner. Experts also anticipate a natural cost reduction in
heat pump systems as the technology gains traction in the HVAC market. Experts also note
that technology advancements in windows, PV, storage, and demand response could take
place, however there are many uncertainties associated with these developments making it
hard for experts to predict their future costs and potential for impacting overall costs
associated with ZNE construction.
As California has put “decarbonization” on the center stage of its state-wide environmental policy
strategy to combat the immense threat caused by climate change, this study attempts to
explore how that policy shift would impact the future of ZNE in California, specifically on the
topic of electrification in residential new construction. In this expert elicitation, the research
team explicitly asked experts about their views on a shift from mixed fuel homes to all-electric
homes and the associated cost implication. The responses are split between two scenarios,
one is building ZNE homes on land with existing gas infrastructure and the other is building
ZNE homes on land without existing gas infrastructure. In the first scenario, experts would
expect a cost increase between $3,500 and $3,800 related to fuel switching the HVAC system,
water heating system, and cooking product. In the second scenario, experts would expect cost
savings from not having to install the gas infrastructure in all-electric new construction. In
terms of the future perspectives of all-electric homes in California, the team received mixed
reviews from experts. Some experts think all-electric homes are necessary for healthy indoor
air quality when the envelope is airtight. Some experts also think all-electric homes are the
end goal but that the market is not ready for the shift yet. On the other hand, some experts
see removing gas completely from residential homes wasteful because gas is still relatively
cheap, and the infrastructure already exists in many places. For the production home market,
there is still a consistent demand for certain gas-fired appliances from home buyers; hence,
most production home builders will plan to include gas-fired appliances as options in their
community.
Despite all the cost increments related to ZNE construction and market barriers faced by
builders, there are areas that builders can focus on to alleviate some of those cost premiums.
Most notably, experts from both custom and production home construction repeatedly stressed
the significant benefits of incorporating an integrated design process and providing ongoing
training to team members including building contractors, HVAC equipment contractors,
electricians, etc. An integrated design approach to ZNE construction requires collaboration on
all aspects of the building process starting at the design stage which results in a smoother
process down the road. A second key area experts discussed was focusing resources on team
training to enable all members of the team to continuously obtain new knowledge by attending
courses and conferences focused on ZNE construction. Although experts have differing
experiences with ZNE, it was noted that having a clear policy target and improved modeling
tools that recognize all energy efficiency measures would get a long way in promoting ZNE
among home builders. Lastly, if full ZNE compliance happens sooner it would greatly help to
drive prices down probably faster for each measure than if it weren’t to happen until later.
At last, even though the expert elicitation approach is being used in several energy research
studies now, to the research team’s knowledge this is the first time this approach has been
used in the ZNE research area to acquire cost estimates on various building measures. The

C-8
research team acknowledges that the study approach is not without limitations. In the survey
design, building measures were broken down similarly to how they are broken down in Title 24
and experts were asked to assess each measure using the same metric provided in BEopt. This
led to a total of 16 building measures for experts to consider, and in some cases, experts were
only able to provide answers to some of the measures or sometimes experts were not used to
thinking of costs in pre-defined metrics. Therefore, the sample size of the responses differs
across measures and cost estimates are based on a few different units, which created a
challenge in aggregating the results. Additionally, as experts came from both the for-profit and
not-for-profit sector, their business practices can be very different and so can their views on
the future of ZNE adoption. Experts were asked to only provide cost estimates based on their
own experiences, so given the variety of backgrounds, their current costs and future cost
projection can differ widely. Many researchers have studied which the best method is to
aggregate elicitation results, but little agreement is reached (Clemen & Winkler, 1999; Cooke
& Goossens, 2008; Hora, Fransen, Hawkins, & Susel, 2013). For the present study, the
research team simply presents the range of expert distributions in the results section and
notes the differences in each context underlying those distributions (Morgan, 2014). The
tradeoff associated with this approach is that the elicitation results cannot be directly used in
any numerical calculation. However, it is hoped that by providing the range of expert
distributions, the team ground-truths the variation in costs of building ZNE homes in California
and gains insights on the effectiveness of various building measures.
Expert Elicitation Responses: Building Measures
Note: Conventional building practices/measures and associated current cost estimates are
based on a single-family reference home that is (1) using mixed fuel, (2) located in CZ12
(reference city: Stockton), and (3) sized around 1,700 ft2.
Note: The response summary for each measure does not necessarily represent the view of all
experts we spoke with. We did our best providing a range of different views on various
measures; however, there are cases where only a small subset of experts provided answers to
the questions, especially when related to the current and future cost estimates.

C-9
Building Envelope
Exterior Walls
Topic Expert Elicitation Responses
Current Building
Practices
Conventional homes:
• Framing: 2x4 with 16 o.c.
• Cavity insulation: R-15 fiberglass
• Exterior sheathing: R-4
• Current cost estimate: ~$8,800 (material +labor)
ZNE homes:
• Framing: 2x6 with 24 o.c.
• Cavity insulation: R-21 to R-30 blown-in fiberglass/cellulose
• Exterior sheathing: R-8 plywood/OSB
• Current cost estimate: Extra $1,000 to $2,000 on advanced framing, depending on the size of the home
Future Costs *7 respondents considered this an impactful cost contributor
Business as usual scenario:
• There is going to be diminishing return. At first there is greater saving potential but overtime the savings will reduce.
• The cost might go down by 25 percent in 2021, another 15 percent in 2026, eventually tapering off.
Full ZNE scenario:
• If full ZNE compliance happens sooner, it will probably help drive the price down faster.
• The cost might go down by 50 percent in 2021, another 25 percent in 2026, then 10 percent, then 5 percent.
Emerging Technologies
• Reaching advanced framing in ZNE, has less to do with any breakthrough technology, and more to do with a willingness to learn
how to construct walls using 2x6 with 24 o.c.
• Alternative emerging technologies:
o Prefab walls: currently not cost effective but prefabbing in a factory might mean a better quality product. It could become more
important in 5 to 10 years.
o AeroBarrier: a product for air sealing that allows easier installation.
The cost is still high but could be more cost effective if savings in labor costs outweigh the additional cost.
o Concrete walls: Use thermal mass as a passive energy storage; however, it will be a long time before this would become game changing

C-10
Topic Expert Elicitation Responses
General
Comments • Experts specialized in custom home construction identified the
importance of doing proper air sealing and weather stripping, at an
additional cost of $1,400.
• As compared to conventional framing, builders could save 10 percent to 20 percent of lumber from doing advanced framing.
• Envelope insulation and air sealing are the most impactful cost contributors in ZNE home construction.
Slab Foundation Insulation
Topic Expert Elicitation Responses
Current Building
Practices
Conventional homes usually do not use slab foundation insulation.
For production builders it is not cost effective, especially in the Central Valley.
ZNE homes:
• Custom builders typically do slab on grade with insulation below it.*
• The insulation uses 3” to 4” EPS (expanded polystyrene) foam with 2-pound density, which is around R-12 to R-16 value.
• Current cost estimate: ~$1.5 per ft2 of a 3” EPS foam at 2-pound density (price varies constantly)
*The measure of slab foundation insulation is removed from consideration in the modeling work because of an error in the
software input on ground to floor heat transfer.
Future Costs *0 respondent considered this an impactful cost contributor
Emerging Technologies N/A
General Comments N/A
Attic Insulation
Topic Expert Elicitation Responses
Current Building Practices
Conventional homes:
• Vented attic is more common: R-38 to R-49 fiberglass loose fill; R-20 in milder climates.
• Radiant barriers, when used, are put at gable ends in vented attic.
• Current cost estimate: around $2,550 total (no radiant barrier)
ZNE homes:
• Unvented attic with insulation under the roof deck is more common: R-28 fiberglass batts or Owens-Corning products.
• Current cost estimates: Extra $2,000 to $2,600 for R-38 fiberglass batt and wiring; Extra $3,000 to $3,900 for R-38 Owens Corning system
Future Costs *2 respondents considered this an impactful cost contributor
No future cost estimate for attic insulation were provided.

C-11
Topic Expert Elicitation Responses
Emerging Technologies • There is not much technology innovation happening here. The key is training contractors on proper installation.
General Comments • The choice between vented versus unvented attic is largely driven by design, construction, and budget.
• The cost associated with building higher performance attics has less to do with the material and construction cost and more to do with the design change. This creates a high barrier
to entry for most builders.
• Envelope insulation and air sealing are the most impactful cost contributors in ZNE home construction.
Roof Insulation
Topic Expert Elicitation Responses
Current Building
Practices
Conventional homes:
• Vented attics are more common: R-19 batt
• Current cost estimate: around $1,600
ZNE homes:
• For unvented attics, some use a dense packed blown-in blanket approach to insulate the rafters, with 2” of rigid insulation on top of the roof sheathing
• Current cost estimate: N/A
Future Costs *4 respondents considered this an impactful cost contributor.
Generally, in the short term, there might be greater initial savings,
with cost reductions slowing down in the long term. Reductions are mainly from labor.
Business as usual scenario:
• There will be about a 3 percent to 5 percent reduction between now and 2021, then maybe 10 percent to 12 percent reduction between now and 2026.
Full ZNE scenario:
• There will be about a 5 percent to 8 percent reduction between now and 2021, then maybe a 10 percent to 12 percent reduction between now and 2026.
Emerging Technologies • There isn’t much technology innovation here.
• Prefabbing framing could become more important, but it still has a long way to go. For instance, structural insulated panels
(SIPs) could probably get a better insulated envelope and roof.
General Comments • Envelope insulation and air sealing are two of the most impactful cost contributors in ZNE home construction.

C-12
Roofing
Topic Expert Elicitation Responses
Current Building
Practices
Conventional homes:
• Most builders use clay tiles and they normally do not have a cool roof rating.
• Current cost estimate: N/A
ZNE homes:
• Custom builders use metal roofs for longevity reason; some production builders use concrete tiles.
• Current cost estimates: around $6 per ft2.
Future Costs *1 respondent considered this an impactful cost contributor
No future cost estimate for roofing.
Emerging Technologies N/A
General Comments • The type of roofing used is highly driven by design.
• Roofing material has less impact on achieving ZNE as compared to other features.
Windows
Topic Expert Elicitation Responses
Current Building Practices
Conventional homes:
• Windows area is about 14 percent to 16 percent of total floor area
• U-value/SHGC: 0.31/0.22
• Current cost estimate: around $5,000 (material + labor)
ZNE homes:
• Windows area is about 20 percent to 25 percent of total floor area
• U-value/SHGC: 0.14/0.24 (triple-pane); 0.25/0.21 (double-pane)
• Current cost estimate: $40,000 to $50,000 per home (including triple-pane windows and doors, both from European models)
Future Costs *6 respondents considered this an impactful cost contributor.
Mainstreaming good quality triple-pane windows and increasing
U.S. manufacturing capability would bring the cost down. Costs may go up or down for future costs, but some experts think
window costs will become a smaller part of total cost when more U.S. manufacturers take it on.
Business as usual scenario:
• Best estimate is that the cost stays flat in 2021. No future cost estimate provided for 2026
Full ZNE scenario:
• No future cost estimate provided for 2021 and 2026

C-13
Topic Expert Elicitation Responses
Emerging Technologies • One company is working on a super thin film triple-pane where the middle pane is like a hanging film in between a dual-pane
frame, which makes it lighter.
• Windows made of uPVC (unplasticized polyvinyl chloride) might be becoming a cost-effective way to make triple-pane windows that provide great sound and thermal insulation.
General Comments • For windows, daylighting drives window design; it is really about solar control and design for shading, an area where integrated design comes into play.
• Most custom builders order triple-pane windows from Europe, many of them said it’s difficult to find them manufactured in
the U.S.
• There is an unsettled debate on whether it is really worth spending extra money on triple-pane windows in milder climate area.
• Triple-pane windows are hot in the construction industry now, but there are still some perceived barriers to wider adoption:
its size and weight and its high costs.
HVAC Equipment
Heating/Cooling System
Topic Expert Elicitation Responses
Current Building
Practices
Conventional homes (mixed fuel):
• Split system AC with 14-16 SEER and 2-3 ton capacity
• Gas furnace with 92 percent to 95 percent AFUE
• Current cost estimate: around $6,000 (material and labor)
ZNE homes (all-electric):
• Heat pump split system with 9.5-13 HSPF, 16-21 SEER and 3-ton capacity
• Current cost estimate: Around $8,000 total (material + labor); around $5,000 for equipment only
Future Costs *3 respondents considered this an impactful cost contributor
HVAC system cost would naturally come down as technology ramps up on higher end systems. Experts do not think there will be
any real difference between the two scenarios.
Business as usual scenario:
• The cost may come down by 5 percent to 10 percent between now and 2021 and by no more than 15 percent to 20 percent
between now and 2026.
Full ZNE scenario:
• The cost may come down by 5 percent to 10 percent between now and 2021 and by no more than 15 percent to 20 percent
between now and 2026.

C-14
Topic Expert Elicitation Responses
Emerging Technologies • As noted by many experts, HVAC is slow moving/slowly innovating industry, and they haven’t seen any huge
breakthrough that will really change costs.
• Geothermal heat pumps or ground source heat pumps could be an alternative HVAC system to air source heat pumps and achieve higher efficiency in certain climate zones. However, the
setup costs are generally higher than air source heat pumps.
General Comments • Heat pump system makes up one of the largest cost increases in the transition to ZNE.
• Heat pump capacity can be sized down when the home is very insulated.
• It’s a choice that builders will need to make; if you build an airtight and well insulated home, then the HVAC equipment will
be a very minor thing.
Distribution System
Topic Expert Elicitation Responses
Current Building
Practices
Conventional homes (mixed fuel):
• R-4 in conditioned space (sealed attic)/ R-8 in unconditioned space (vented attic)
• Current cost estimate: around $1,700 (material + labor)
ZNE homes (all-electric):
• No duct if using ductless mini split heat pump system which is usually installed in conditioned attic space.
• Current cost estimate: N/A
Future Costs *0 respondents considered this an impactful cost contributor.
Emerging Technologies N/A
General Comments N/A
Mechanical Ventilation
Topic Expert Elicitation Responses
Current Building Practices
Conventional homes:
• Most builders still use an exhaust fan
• Current cost estimate: $450 (material + labor)
ZNE homes:
• Custom home builders: HRV (heat recovery ventilation), ERV (energy recovery ventilation), mostly manufactured in Europe
• Production home builders: a balanced strategy consisting of a continuous exhaust fan and an electronically communicated motor.
• Current cost estimate: $5,000 to $7,000 for an European-made HRV including labor
Future Costs *1 respondent considered this an impactful cost contributor.
No future cost estimate provided.

C-15
Topic Expert Elicitation Responses
Emerging Technologies N/A
General Comments N/A
Ventilation Cooling
Topic Expert Elicitation Responses
Current Building Practices
Conventional homes:
• Whole house fan
• Current cost estimate: around $800 (material + labor)
ZNE homes:
• No whole house fan because HRV is in use already
• Current cost estimate: N/A
Future Costs *1 respondent considered this an impactful cost contributor.
No future cost estimate provided for ventilation cooling.
Emerging Technologies N/A
General Comments N/A
Water Heating Equipment
Water Heating System
Topic Expert Elicitation Responses
Current ZNE Compared with Conventional
building practices
Conventional homes (mixed fuel):
• Tankless gas water heater (95 percent or 98 percent efficiency)
• Current cost estimate: around $2,000 (material + labor)
ZNE homes (all-electric):
• Heat pump water heater at HSPF=5; EF=2.5-3.8; and 50-80 gallon storage tank.
• Current cost estimate:
o $3,000 to $7,000 with material and labor for single unit purchase (depending on the equipment used), typically around $5,500.
o Production home builders could get it at a much lower price because of large volume commitment to
the manufacturer.
Future Costs *3 respondents considered this an impactful cost contributor.
Similarly, to HVAC equipment, experts do not think there will be
any real difference between the two scenarios.
Business as usual scenario:
• The cost may come down by 5 percent to 10 percent between now and 2021 and by no more than 15 percent to 20 percent between now and 2026.
Full ZNE scenario:
• The cost may come down by 5 percent to 10 percent between now and 2021 and by no more than 15 percent to 20 percent
between now and 2026.

C-16
Topic Expert Elicitation Responses
Emerging Technologies • Given the high efficiency performance that heat pump water heaters can deliver, experts do not know of any better up-and-
coming technology coming along.
General Comments • The current cost of a heat pump water heater is still too high for production builders, so they would opt for tankless gas
water heater, especially if there is gas available.
Solar Water Heating
Topic Expert Elicitation Responses
Current Building Practices
None of the experts we spoke with have installed solar water heating in their ZNE homes.
Future Costs *0 respondents considered this an impactful cost contributor.
Emerging Technologies N/A
General Comments • Some experts considered it before but all determined that it is still too expensive and not cost effective. The installation is too complicated and requires too much maintenance.
Appliances, Lighting and Plug Loads
Lighting Package
Topic Expert Elicitation Responses
Current Building Practices
Conventional homes:
• Normally a combination of LED and CFL
• The control type is just meeting Title 24 standards
• Current cost estimate: N/A
ZNE homes:
• Use all LED
• Generally, the control type meets Title 24 standards, but sometimes will be upgraded to smart light switches (controlled by mobile devices) in custom home construction.
• Current cost estimate: About an extra $300-$400 going from 60 percent to 80 percent LED to 100 percent LED
Future Costs *2 respondents considered this an impactful cost contributor.
Lighting cost has already come down pretty significantly, LEDs
specifically. It is probably already starting to get to the diminishing return part of that cycle.
Business as usual and full ZNE scenario:
• About 3 percent to 5 percent reduction between now and 2021, then further reduction should be capped around 5 percent to 8 percent (basically until the cost drops to the same level as
incandescent light bulbs)
• No specific future cost estimate for controls
Emerging Technologies N/A
General Comments N/A

C-17
Home Energy Management System (HEMS)
Topic Expert Elicitation Responses
Current Building
practices
Conventional homes:
• Do not use energy management system
• Current cost estimate: N/A
ZNE homes:
• Several experts mentioned “SiteSage” and it can monitor at the circuit level
• “Schneider Wiser” energy panel (including a main and a sub-panel) is another product used by experts.
• Current cost estimate: around $1,400 for the “SiteSage” equipment plus a few hours of installation, in the end it’s about
$1,700 in total.
Future Costs *0 respondents considered this an impactful cost contributor.
Emerging Technologies N/A
General Comments • Some experts pointed out that the main thing that is currently missing in the code is that the EDR scores for plug-loads and
appliances are stagnant, so any savings from them are not appreciated in the code (in other words, no incentives for builders to install higher efficiency appliances)
• HEMS could be the solution if there is ever any agreement on what the definition of HEMS is and some means for
demonstrating that less energy is consumed by plug-loads and appliances through HEMS.
• Some experts expressed that if they can get Title 24 credit for high efficiency appliances and HEMS, they will start doing that.
Renewable, Storage and Demand Response
Solar PV
Topic Expert Elicitation Responses
Current Building Practices
Conventional homes:
• Do not have solar PV system installed
• Current cost estimate: N/A
ZNE homes:
• Builders are about 50/50 between purchased and leased system.
• Current cost estimate for a purchased system: around $20,000* for a 6.5 kW system; around $17,000* for a 4 kW
system
• Current cost estimate for a leased system: about 20 cents per kWh the system is estimated to generate in the year. (Tesla’s solar roof)
*Price does not include rebate

C-18
Topic Expert Elicitation Responses
Future Costs *3 respondents considered this an impactful cost contributor.
• It’s hard to tell what the future cost of PV will be because it will probably depend on policy mandate.
• One expert estimated that assuming there is a ZNE mandate, PV costs could go down by another 5 percent in 2021 and 10 percent in 2026.
Emerging Technologies N/A
General Comments • The key question to think about is how to handle load shifting and how to mitigate the duck curve. Energy storage and control mechanisms can be part of the solution, but not all.
Something is going to have to come from the energy provider level (i.e., utility).
Energy Storage and Demand Response
Topic Expert Elicitation Responses
Current Building Practices Conventional homes:
• Do not have energy storage in place
• Current cost estimate: N/A
ZNE homes:
• Most experts use Tesla “Powerwall” with 14 kWh capacity
• Current cost estimate: around $10,000 (after incentives).
Future Costs • *1 respondent considered this an impactful cost contributor.
• It is hard to tell what the future cost of energy storage and demand response will be. It partly depends on how much R&D
money is going into those technologies.
• Most experts think that energy storage could drop fairly dramatically in the next 5 years, but don’t have an exact prediction.
Emerging Technologies N/A
General Comments • The key question to think about is how to handle load shifting and how to mitigate the duck curve. Energy storage and control mechanisms can be part of the solution, but not all.
Something is going to have to come from the energy provider level (i.e., utility).
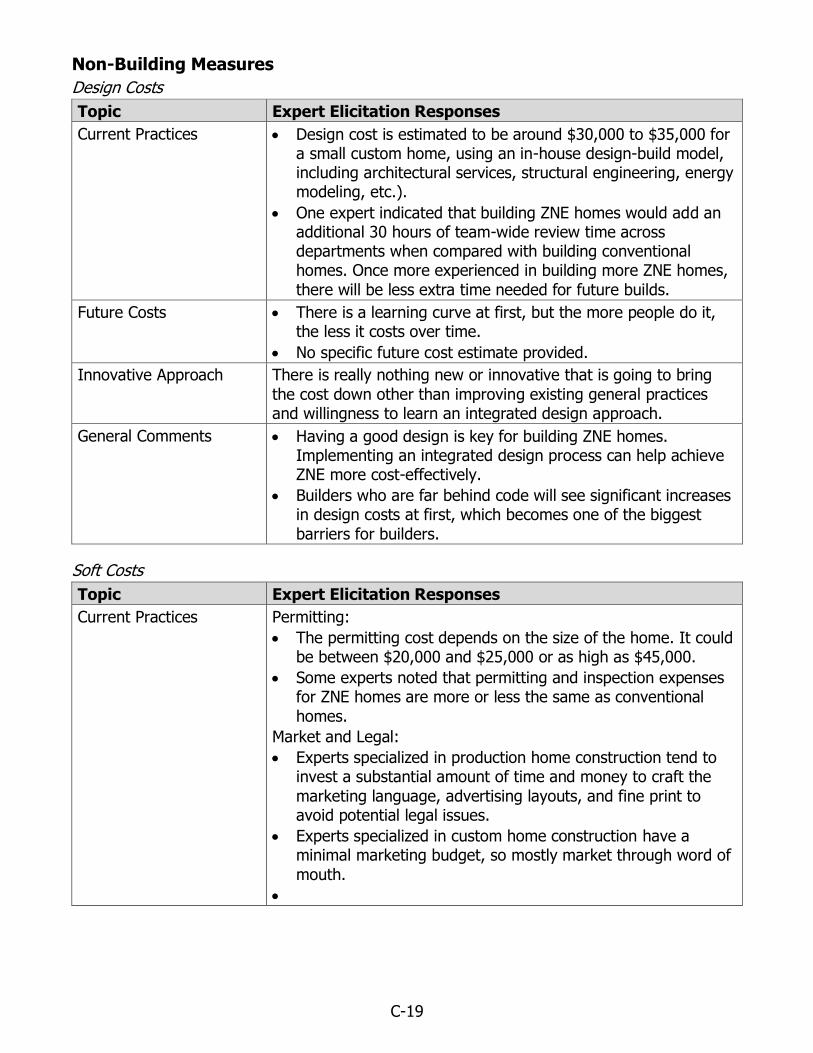
C-19
Non-Building Measures
Design Costs
Topic Expert Elicitation Responses
Current Practices • Design cost is estimated to be around $30,000 to $35,000 for a small custom home, using an in-house design-build model, including architectural services, structural engineering, energy modeling, etc.).
• One expert indicated that building ZNE homes would add an additional 30 hours of team-wide review time across departments when compared with building conventional homes. Once more experienced in building more ZNE homes,
there will be less extra time needed for future builds.
Future Costs • There is a learning curve at first, but the more people do it, the less it costs over time.
• No specific future cost estimate provided.
Innovative Approach There is really nothing new or innovative that is going to bring
the cost down other than improving existing general practices and willingness to learn an integrated design approach.
General Comments • Having a good design is key for building ZNE homes. Implementing an integrated design process can help achieve ZNE more cost-effectively.
• Builders who are far behind code will see significant increases in design costs at first, which becomes one of the biggest
barriers for builders.
Soft Costs
Topic Expert Elicitation Responses
Current Practices Permitting:
• The permitting cost depends on the size of the home. It could be between $20,000 and $25,000 or as high as $45,000.
• Some experts noted that permitting and inspection expenses for ZNE homes are more or less the same as conventional
homes.
Market and Legal:
• Experts specialized in production home construction tend to invest a substantial amount of time and money to craft the
marketing language, advertising layouts, and fine print to avoid potential legal issues.
• Experts specialized in custom home construction have a minimal marketing budget, so mostly market through word of
mouth.
•

C-20
Topic Expert Elicitation Responses
Current Practices (cont’d) Insurance and Liability:
• These expenses are typically sales-based and dependent on the building type. Custom homes usually are perceived as higher risk than production homes or multi-family homes.
• These expenses are mostly wrapped up in all aspects of the building costs, such as design costs, construction costs, etc.
Future Costs • Permitting expenses will likely go up in the future as the code gets more complicated.
• Insurance costs in California are expected to go up due to significant impacts of climate change.
Innovative Approach There is really nothing new or innovative that is going to bring the cost down other than improving existing general practice.
General Comments • Soft costs will change the way the market changes, but it is not specific to ZNE construction.
Construction Costs
Topic Expert Elicitation Responses
Current Practices • Experts specialized in building high performance homes said there is only minimal additional cost related to construction for ZNE compared with non-ZNE homes. The team may take
an extra 20-30 hours per year to review ZNE design.
• For small custom homes, construction cost is around $250 to $300 per ft2 including excavation.
Future Costs • Management and trades training could drop time from 20 to 30 hours to 10 to 15 hours per year. Training should be an ongoing thing, important to educate the staff on a regular basis.
Innovative Approach There is really nothing new or innovative that is going to bring
the cost down other than improving existing general practice.
General Comments • Continued management and trades training is key for building ZNE homes. However, additional money and time investment
on training creates barriers for builders.
• It goes a long way when the manufacturer of the product gets involved in designing and delivering staff training of proper installation.
Utility Infrastructure Cost
Topic Expert Elicitation Responses
Current Practices • Gas infrastructure cost estimate: around $15,000 (gas infrastructure and plumbing contractors in a 3,000 ft2 custom
single-family home)
• Electric power line installation cost estimate: the range can be as wide as $10,000 to $100,000 (typically $20,000) in remote area.

C-21
Topic Expert Elicitation Responses
Future Costs *1 respondent considered this an impactful cost contributor.
Innovative Approach N/A
General Comments • Generally, there is cost savings from not having to put in gas infrastructure, but the amount of savings could depend on the location of the property and the size of the community.
• Utilities in Northern California put more effort into incentivizing all-electric homes.
• Most production home builders still provide a gas option for various appliances, such as cooktop, furnace, water heat, etc.
Whole Home Costs
In this section, we asked experts two sets of questions. The first set of questions asked about
the cost difference between building a Title 24 code compliant home and a ZNE home as of in
2017. The second set of questions asked about the future cost of building a ZNE home in 2021
and 2026 as compared to the cost of building a ZNE home in 2017. Experts can express the
cost difference in absolute dollar value or in percentage term. We realize that the responses
we received were quite different from one expert to another, so found it more appropriate to
interpret those values separately by individual experts along with its underlying context.

C-22
Cost Comparison46
Production Home Construction:
2016 Title 24 Home in 2017
ZNE Home in 2017 ZNE Home in 2021 & 2026
• $150,000 to $160,000 for a regular home that is a bit beyond code.*
• The construction cost is around $6,000 more to build a ZNE home when considering only what is
technically needed (envelope insulation and
HVAC). If including all possible upgrades
(additional smart light switches, energy monitoring electrical
panels, smart thermostats, etc.), the cost premium
could be up to $9,000 to $10,000.
• The rate of change in ZNE basic cost premium depends on how cost of envelope insulation and
HVAC equipment evolve over time. Given the
future cost estimates provided previously, that
$6,000 cost differential could drop by 18 percent in 2021 and by 26 percent
in 2026.
• If all possible updates are included. The $10,000 ZNE cost premium could
drop by as much as 50 percent in next decade.
*For a just code compliant home, the cost would be a little bit lower.
Custom Home Construction:
2016 Title 24 Home in 2017
ZNE Home in 2017 ZNE Home in 2021 & 2026
• For basic custom homes at 2,000 ft2, the average cost for code compliant
home is around $250/ft2
• Some custom builders could build a non-energy efficient home with a much higher price tag by
putting fancier finishes that are not related to
efficiency.
• To build a ZNE custom home, the cost is around $300 per ft2, or 20
percent more than code compliant home (with the exact same finishes and
design, the only difference is to invest in higher
efficiency measures).
• Most experts expect the cost of ZNE homes to be the same in 2021. Further
down the road, it is expected that ZNE cost could go down as
products are available at a lower cost. One of the
biggest driving factors would be the future cost of PV system.
46 Total cost of building a home can vary widely depending on factors such as location, type of home, finishes
and design style. To make the responses comparable, we summarized responses in a manner that total costs of
homes built in similar climate zones and with similar styles are presented in the same row.

C-23
2016 Title 24 Home in 2017
ZNE Home in 2017 ZNE Home in 2021 & 2026
• For custom builders who only build ZNE homes in higher income neighborhoods, the
average cost is $400 to $500 per ft2
• When comparing to other homes in the same area,
the cost differential is somewhere between cost
parity to 5 percent max (if not including PV system cost).
• For a 3,000 ft2 code compliant home in the Bay
Area, the cost is about $900,000.
• The incremental cost of doing ZNE home is
$15,000, and another $18,000 for PV system.