appropriate intellectual property protection and economic
TRANSCRIPT

Aa
Ya
b
c
d
a
ARRAA
KIIGPUD
1
(esndtf
caaCpeRt
0d
Research Policy 41 (2012) 358– 375
Contents lists available at SciVerse ScienceDirect
Research Policy
j our nal ho me p ag e: www.elsev ier .com/ locate / respol
ppropriate intellectual property protection and economic growth in countriest different levels of development
ee Kyoung Kima, Keun Leeb, Walter G. Parkc,∗, Kineung Chood
Korea Institute of Intellectual Property, Republic of KoreaSeoul National University, Republic of KoreaAmerican University, United StatesRepublic of Korea Naval Academy, Republic of Korea
r t i c l e i n f o
rticle history:eceived 30 April 2010eceived in revised form 7 September 2011ccepted 11 September 2011vailable online 5 October 2011
eywords:nnovationmitation
a b s t r a c t
This paper examines how the role of patents and utility models in innovation and economic growth variesby level of economic development. Using a panel dataset of over 70 countries, we find that patent protec-tion is an important determinant of innovation and that patentable innovations contribute to economicgrowth in developed countries, but not in developing. Instead, in developing economies, a minor formof intellectual property rights (IPRs) – namely utility models – is conducive to innovation and growth,controlling for other factors. Using Korean firm level data as a case study, we find that utility modelinnovations contribute to firm performance when firms are technologically lagging and that those minorinnovations can be a learning device and thus a stepping stone for developing more patentable inven-
rowthatentstility modelseveloping economies
tions later on. Upon reaching higher levels of technological capabilities, firms become more reliant uponpatents and less on utility models. Thus the lesson here is that patent protection enhances innovationand economic growth in countries where the capacity to conduct innovative research exists. Where thiscapacity is weaker, a system that provides incentives to conduct minor, incremental inventions is moreconducive to growth. The significance of this paper is to emphasize the importance not just of the strengthof IPRs but of the appropriate type of IPRs for economic development.
. Introduction
This paper addresses the role of intellectual property rightsIPRs) in the economic growth of countries at different levels ofconomic development. It addresses two issues. The first is whethertronger IPRs, particularly patent rights, are appropriate for the eco-omic growth of countries regardless of their stage of economicevelopment. The second, and related, issue is whether the sameypes of intellectual properties are appropriate for countries at dif-erent levels of economic development.
The possibility that IPRs could have differential effects onountries at different stages of economic development has beencknowledged in a World Bank publication (Fink and Maskus, 2005)nd partly addressed in global intellectual property reforms (seeommission on IPR, 2002). For example, transitional periods wererovided for developing and least developed countries. In addition,
xtensions to comply with the Trade-Related Intellectual Propertyights Agreement (TRIPS) have also been granted to poor coun-ries (until 2013). Local circumstances and needs have also been∗ Corresponding author. Tel.: +1 202 885 3774.E-mail address: [email protected] (W.G. Park).
048-7333/$ – see front matter © 2011 Elsevier B.V. All rights reserved.oi:10.1016/j.respol.2011.09.003
© 2011 Elsevier B.V. All rights reserved.
addressed, for example in policies related to essential medicinesand public health.
Our contribution is to study not only the strength of IPRs but alsothe different types of IPRs that would be appropriate for countriesat different stages of economic development. Our starting point isthat innovation in many developing countries is of the adaptive,imitative type. Under the intellectual property systems of certaincountries, inventors of adaptive, imitative innovations can havetheir inventions protected, for example through a utility model(or petty patent). Through adaptation, imitation, and incrementalinnovation, firms in developing economies can acquire knowledgeand enjoy some learning-by-doing (Suthersanen, 2006). The inno-vations they produce may not have the inventive step to merit aregular patent, but they may qualify for this second-tier industrialproperty right; namely, a utility model. The absence of this type ofindustrial property right may reduce incentives to engage in incre-mental innovation, which may be more suitable for local needs, astepping stone for further technological progress, and the type ofinnovation which best utilizes local capabilities.
To date, there have been no formal, comprehensive empiricalanalyses of patents and utility models from a development per-spective. In academic and policy debates, whether in the contextof developed or developing countries, the focus has been on the

h Poli
adOito
pocbdtcstooigilKaBTit
rbtctcctmoiw(imbTee
sSupat
2
l
s
a
Y.K. Kim et al. / Researc
ppropriate strength of IPRs.1 While the original TRIPS agreementoes not deal with utility models, the World Intellectual Propertyrganization (WIPO) has recently considered the usefulness of util-
ty model systems for lower income countries.2 Our study shouldherefore generate further interest in examining alternative meansf protecting IPRs at the international level.
Indeed our empirical analysis studies the different roles ofatents and utility models in the innovation and economic growthf countries at different levels of economic development, and dis-usses why these different types of industrial property rights maye more appropriate for different groups of countries. We first con-uct our analysis using a large panel data set of countries to assesshe impact of utility model laws. We then isolate one developingountry in our sample, namely South Korea, in order to conduct apecific case study. Korea’s case is illuminating. Due to its limitedechnological capability before the mid-1980s, it depended heavilyn reverse engineering, importation of technology, and imitation inrder to fulfill its technological needs (Kim, 1997). Moreover, localnventors tended to modify or adapt existing or imported technolo-ies, and obtained utility model protection for their incrementalnnovations. By the late 1990s, Korea became one of the world’seading patenting nations. For example, U.S. patents granted tooreans rose from 14 in 1982 to 3562 in 1999, and the share of Kore-ns in U.S. patents granted rose from 0.01% to 2.32% (USPTO, 2009).y 1999, Korea ranked seventh in terms of U.S. patents granted.he question is whether all of these events are connected: did util-ty model protection provide incentives to innovate and help pavehe way for increased technological development?
As an overview, our main finding is that the importance of patentights and utility model protection to innovation and growth variesy level of technological development. We find that patent protec-ion contributes to innovation and economic growth in developedountries but not in developing. This is consistent with the viewhat patent protection matters to industrial activities only afterountries have achieved a threshold level of indigenous innovativeapacity along with an extensive science and technology infras-ructure (Kim, 1997; Lall and Albaladejo, 2001). In contrast, utility
odel protection weakly affects innovation and growth in devel-ped countries but allows developing economies to build up theirndigenous innovative capacities. In our analysis of Korean firms,
e find that when firms are technologically lagging, utility modelsor minor inventions) contribute to firm growth and to their capac-ty to produce (future) patentable inventions. Once firms become
ore technologically advanced, their performance is driven lessy utility model innovations and more by patentable innovations.hese results thus indicate that different types of intellectual prop-rty rights are more appropriate for countries at different stages ofconomic development.
This paper is organized as follows: Section 2 reviews previoustudies on the effects of IPRs on innovation and economic growth.ection 3 provides a brief comparison between patent rights andtility models, and briefly discusses the experience of utility modelrotection in Korea. Section 4 discusses our theoretical frameworknd empirical methodology, and Section 5 our data. Section 6 con-ains the main empirical results, and Section 7 concludes.
. Previous literature
Previous empirical studies focus on how the strength of intel-ectual property protection, particularly patent protection, relates
1 See Commission on IPR (2002) and Correa (2000) for a review of policy discus-ions.
2 See http://www.wipo.int/sme/en/ip business/utility models/utility models.htmnd http://www.wipo.int/sme/en/ip business/acquire protection.htm.
cy 41 (2012) 358– 375 359
to innovation and growth, not on the nature of the instrumentused to protect innovation. Few of these studies examine the rela-tionship between growth and IPRs by different income groups.Consequently, few if any address the type of protection that isappropriate for countries or firms at different levels of technologicalcapability.
Moreover, previous empirical work on the relationship betweenIPRs and economic growth has almost exclusively used a measureof patent protection. Formal analyses of utility models are quitescant. To organize ideas, we can classify previous empirical studiesin two ways: those that examine the impact of patent rights directlyon output growth, and those that do so indirectly by examining afactor that contributes to output growth, such as R&D or innova-tion. For example, Gould and Gruben (1996) and Falvey et al. (2006)find instances where patent protection has a significant influenceon economic growth. Other empirical studies, however, do not finda direct effect of patent protection on growth but an indirect one.For example, Park and Ginarte (1997) find that patent protectionaffects factor accumulation which in turn affects economic growth(see also Thompson and Rushing, 1999). Hence, more recent studiesexamine the relationship between patent protection and a deter-minant of growth, like innovation or R&D (see Varsakelis, 2001;Kanwar and Evenson, 2003). These studies find that R&D/GDP ratiosare positively related to the strength of patent rights, conditionalon other factors. Other studies use patents granted in the U.S.as a measure of innovation. For example, Schneider (2005) findsthat stronger patent rights have a positive effect on innovation indeveloped countries only, while Chen and Puttitanun (2005) find apositive effect for large developing economies. The main limitationof these previous studies from our perspective is that they do notexamine alternative means of protecting industrial property rights.
It is useful to inquire, though, whether in developing countriespatents are an effective instrument for appropriating the returnsto innovation. In a well-known survey of U.S. firms, Cohen et al.(2000) find that firms patent for various purposes other than merelyas a mechanism for appropriating returns. For example, posses-sion of patent rights plays an important role in litigation (to deterthreats of infringement suits or countersuits) and in cross-licensingnegotiations, where firms can better gain access to rivals’ technolo-gies if they are able to reciprocate with their own patent rights.However, the survey finds that smaller firms or inventors are lessable to utilize patents for those purposes and hence are dissuadedfrom availing themselves of patent protection. Litigation costs areespecially onerous for small firms since they have lower levels ofoutput over which to spread the overhead costs of legal protec-tion (e.g. legal staff). Furthermore, smaller firms or inventors havefewer and perhaps less valuable technologies to offer in cross-licensing negotiations. The implication for developing economiesis that to the extent that a large share of inventors there is small,patents would not be very effective instruments for appropriatingreturns or accessing technologies.3 This may explain why develop-ing economies do not engage as intensively in producing patentableinnovations and why something like utility models may serve as auseful alternative outlet for emerging innovation.
Some development economists have discussed alternatives topatent rights, such as utility models. Evenson and Westphal (1995,p. 2288) make the following observation:
“Strong IPRs can be a powerful instrument for encouragingmany forms of investment at all levels of technological develop-ment if they are sufficiently focused on promoting those forms
3 Mazzoleni and Nelson (1998) also discuss how strong, broad patents in lessdeveloped countries, by creating entry barriers, could impede the development ofindigenous manufacturing capabilities.

3 h Poli
admWmtioap
edtuanc
3
phoehiHit
a2ataitoisntpptm(
aatT
60 Y.K. Kim et al. / Researc
of investment which are respectively important at each level.More imagination than has previously been given to their designis clearly in order. Breeders’ rights and utility models exemplifythe gains in creativity in this area. Utility model protection, forexample, is actively sought in the few countries, like Korea, thatgrant it. Moreover, the evidence suggests that it stimulates thekinds of minor, adaptive inventions that are important in theearly to middle phases of technological development.”
Empirical evidence on the effects of utility models on innovationnd growth, however, is scant and based largely on anecdotal evi-ence. Kumar (2002), for example, argues that in East Asia, utilityodels helped initiate a culture of patenting and innovation. Theorld Bank (2002) documents case studies in Brazil where utilityodels allowed domestic producers to adapt foreign innovations
o local needs and conditions. More formal econometric evidences provided in Maskus and McDaniel (1999) which studies the usef utility models in Japan and finds that such protection on bal-nce had positive impacts on the growth of Japanese total factorroductivity.
In this paper, we go beyond anecdotal evidence to presentconometric evidence on the role of utility models in economicevelopment. Specifically, our study extends previous research inhe following ways: (1) we examine both conventional patents andtility model protection as potential determinants of innovationnd economic growth; (2) we control for the income group or tech-ological capabilities of different countries; and (3) we utilize bothountry-level and firm-level panel data.
. Patents and utility models
This section briefly describes some key differences betweenatents and utility models, and motivates our analysis by showingow their roles may differ for countries or firms at different stagesf technological development. Both patents and utility models arexclusive rights granted for an invention, which allow the rightsolder to prevent others from commercially using the protected
nvention without his authorization for a limited period of time.owever, beyond this basic definition, differences exist between
nvention patents and utility models, based on standards of inven-iveness and legal requirements.
Patents are granted for inventions that are novel, non-obvious,nd have industrial applicability. They are typically granted for0 years duration from the date of application, cover productsnd processes, undergo substantive examination, and are costlyo obtain (filing fees, attorney costs, and translation fees, wherepplicable). Utility models are second-tier protection for minornventions, such as devices, tools and implements, particularly inhe mechanical, optical, and electronic fields.4 Processes or meth-ds of production are typically excluded. The duration of protections typically 6–10 years. Utility models are generally less expen-ive to apply for and do not require substantive examination (forovelty, non-obviousness, and industrial applicability). The inven-ive step required is small; the invention typically must exhibit aractical or functional advantage over existing prior art. Since theerceived threshold inventive step of utility models is much lower
han that of patents, in practice utility models are sought for small,arginal innovations which may not meet the patentability criteriaBeneito, 2006).5 Thus, utility models and patents differ in that they
4 See Bently and Sherman (2001) for a legal discussion of utility models.5 For example, utility models are granted to devices embodying a creative idea
pplicable to the shape, structure or other technological aspects of a product, suchs an improved device capable of reducing the amount of water used to flush aoilet, or a bottle cork remover capable of operating faster than known devices.hose devices are not patentable but inventive enough for utility model protection.
cy 41 (2012) 358– 375
protect different types of innovations. Patents protect innovationsof relatively high inventiveness and utility models protect those ofrelatively low inventiveness.
Not all countries that provide patent rights protect utility mod-els, such as the U.S. and U.K. The few developed countries thatprotect utility models include Germany, Japan, and some Euro-pean countries. Countries that protect them are largely developingeconomies (former or current), such as Korea, Taiwan, China, andMalaysia. In some cases, utility models are the dominant form ofIPRs. For example, in China, utility models accounted for nearlytwo-thirds of the total intellectual property rights granted, whilepatents accounted for 10%, during 1985–1998. Even though theshare of utility models in total IPRs has declined in China, they stillaccount for about half at present.
Korea is also among those developing countries where utilitymodels have been intensively exploited. In 1961 the Korean gov-ernment revised its entire system of intellectual property lawsand established its first autonomous IPR system, protecting bothconventional and minor innovations. Since the technological capa-bilities of Korean firms had been lagging during the 1960s and1970s, firms relied heavily upon on imported technologies and onreverse engineering and adapting them for local needs (Kim, 1997;Lee et al., 2003). This very exercise enabled them to learn fromforeign technologies. Accordingly, Korean inventors actively filedfor utility model protection for their incremental innovations (Leeand Kim, 2010). Indeed, as shown in Fig. 1, the number of utilitymodel applications exceeded that of invention patents until theearly 1990s. In the 1970s and the early 1980s, the ratio of util-ity models to patents was nearly two to three. This ratio beganto decline after 1984 when the ratio peaked at over 6 that year.Although patent and utility models applications were both stillrising, the composition began to shift.
Since the mid-1980s, Korea began to have valuable patentableassets of its own to protect, as much as foreign companies hadsuch assets that they wanted protected within Korea. Major IPRreforms were legislated in the mid-1980s, and since 1987 therewas an abrupt rise in the strength of patent protection and anenlarged scope of protection. Substance patents for pharmaceuti-cal and chemical materials and products were newly introduced,as well as protection for computer software and materials. Theterm of patent protection was also extended from 12 years to 15.Finally, by 1995, patent applications exceeded the number of utilitymodel applications. These trends correspond with the transforma-tion of Korea from a nation with limited technological resourcesand capabilities to one of the leading patenting nations.
The next section discusses our methodology for investigatingmore formally the roles played by patents and utility models ineconomic growth, especially in developing countries.
4. Empirical framework and methodology
4.1. Overview
We specify a production function in which output depends on,among other factors, knowledge capital. ‘Knowledge’ capital variesin sophistication and inventive steps. For analytical tractability, weposit two types: industrial knowledge that is patentable and knowl-edge that derives from minor inventive activity. In other words, weassume two kinds of knowledge capital inputs: patentable innova-tions and utility model innovations. Granted, this is a simplification,since patentable innovations also vary in quality and inventive
steps, as do utility models; in some cases, some patentable innova-tions appear rather minor. However, comparatively speaking, thepool of patentable innovations tends to represent inventions thatare more major than that of utility model innovations.
Y.K. Kim et al. / Research Policy 41 (2012) 358– 375 361
del apS RIS (K
tafittnptscTdm(fdidiml
p(tttaliatampiha
epi
Fig. 1. Patent and utility moource: Data are compiled by the authors using KIPRIS data downloadable from KIP
The relative importance of these two types of knowledge capitalo production depends on the nature of the products and the associ-ted nature of the technology used in their production. For example,rms or countries that produce a greater mix of high-end ratherhan low-end goods are more likely to utilize patentable innova-ions than minor. In technologically lagging economies or firms, theature of production is such that it tends to involve less R&D, sinceroduct designs are often duplicated or creatively imitated fromhose of technologically advanced economies (Kim, 1997). In thisense, an economy’s dependence on these two types of knowledgeapital is expected to vary by level of technological development.he production of more advanced economies is less likely to beependent on utility model innovations, if at all, and that the pri-ary motivation for granting them might be based on legal grounds
e.g. providing recourse against unfair appropriation of effort, evenor minor inventive efforts) rather on the promotion of industrialevelopment.6 In contrast, the production of developing economies
s likely to be dependent more on utility model innovations. Again,ifferent countries vary but we consider two main groups – high
ncome and middle-to-low income countries – and expect utilityodels to have a stronger contribution to the production of the
atter group.Next, we specify an innovation production function in which
atentable innovations are a function of research and developmentR&D), among other factors. The production of patentable innova-ions also depends on the environment for innovation, for examplehe level of patent protection and other factors that can augmenthe productivity of R&D in generating patentable innovations, suchs human capital. Another potential contributor, in the context ofower income countries, is that of a learning effect from past util-ty model innovations – that experience with this can enhance thebility to conduct more innovative research and hence the produc-ivity of R&D invested in developing patentable innovations. Thebility of technologically lagging producers to benefit from utilityodel innovations depends on there being a legal system which
rotects commercially useful minor inventions. Every economy
s likely to conduct minor, adaptive innovations to some extent;owever, these innovations can also be copied and misappropri-ted; hence, legal property rights over them should give minor6 For example, copyright laws can protect both the economic and moral inter-sts of creators. Likewise, developed countries may provide intellectual propertyrotection for minor inventions based on motives beyond business and economic
nterests.
plications of Korean firms.orean Intellectual Property Rights Information Service) website.
inventors stronger incentives to produce them and seek to com-mercialize them. The role of utility model laws and utility modelinnovations is also likely to vary by the level of economic develop-ment, being more consequential in developing economies than inwell-developed.
There are two related issues here: first, the economic influenceof utility model laws, and second, the economic contribution ofminor inventions produced under such systems or laws. They arerelated issues in that without a utility model system, there would,by definition, be no registered utility model innovations, just asthere would be no patents without a patent system, but the absenceof utility model laws would not necessarily preclude minor inven-tive activity, just as we cannot assume that no inventive activityoccurs if no patent systems existed. Furthermore, the (observed)registered utility models under a utility model system do not rep-resent the universe of all minor inventions produced under thatsystem (i.e., the unobserved), any more than patented innovationsrepresent the universe of all innovations. Nonetheless, these twoissues present two specific tasks: to demonstrate the impacts ofa utility model system and to measure the contribution of utilitymodel innovations, both on economic development. We carry outeach task with a different dataset, while building upon a commonempirical framework and methodology.
We test the importance of utility model laws to developingeconomies using a panel dataset of countries. Using this sample,we can compare the differences in growth rate and innovationbetween utility model regimes and non-utility model regimes.7 Wethen examine the usefulness of minor inventions in technologicallylagging economies by using a sample of Korean firms. During thesample period, Korea provided utility model protection throughout,so that there is no time variation in the adoption of utility modelshere as there is in the international sample, but there were consid-erable variations in utility model innovation activity. Thus, we usethe Korean firm level data to measure the contribution of minorinventions to production and patentable innovations. We discussmore explicitly below how utility models expand production pos-sibilities and innovation.
7 At present, no index of the strength of utility model laws and enforcement exist,and thus we use a dummy variable to indicate the presence or absence of utilitymodel laws (across countries and over time). This should provide sufficient datavariation since most countries did not have utility model systems during the sampleperiod.

362 Y.K. Kim et al. / Research Policy 41 (2012) 358– 375
the top
4
tt
Z
wteoiaitd
P
U
wltmiuicLPR1ubiamo
nootitveiap
where � = n(1 − ˛1 − ˛2) is the speed of adjustment. Solving (2)from t − 1 to t yields the following equation for estimation (wherewe now use the subscript t to index time and i to index the unit
Fig. 2. Utility model and patent applications of
.2. Theoretical models
Knowledge capital, Z, is a function of both patentable innova-ions (P) and minor innovations or utility model innovations (U);hat is,
= Z(P, U|D) (1)
here P and U are imperfect substitutes. The marginal rate ofechnical substitution of patentable innovations for utility mod-ls is expected to be lower for more developed economies (i.e.ne patentable innovation, for example, can substitute for severalncremental innovations). The bar ‘|’ denotes the conditional oper-tor and D an indicator of technological development, where D = 1ndicates a high level (and 0 otherwise). The purpose is to qualifyhat the relationships involving utility model laws and innovationepend on the technological development of a country or firm.
Based on our discussions earlier, we postulate the following:
= P(IPR, U, . . . |D), PU > 0 (2)
= U(UML, . . . |D), UUML > 0 (3)
here IPR denotes the level of patent rights and UML utility modelaws. Eq. (2) also allows for the possibility that, conditional on theechnological level of the firm or economy, experience with utility
odel innovations can affect the capacity to produce patentablennovations (with appropriate lags, not shown to avoid clutteringp the conceptual analysis). Fig. 2, for example, illustrates the
ndustrial property filing behavior of the top ten Korean patentingompanies. These include companies such as Samsung Electronics,G Electronics, Daewoo Electronics, and Hyundai Automotives.rior to the 1990s, these top patenting companies hardly patented.ather, they sought tens of thousands of utility models. But by995, they filed more patent applications than applications fortility models. These stylized trends suggest a potential linketween past utility model innovations and current patentable
nnovations in developing economies – namely that firms thatre technologically lagging can build upon their experiences withinor innovations to help generate patentable innovations later
n, which is the basis for Eq. (2).Eq. (3) expresses the point that – conditional on the level of tech-
ological development of the firm or economy – the productionf utility model innovations is a positive function of the existencef laws protecting utility models. The underlying assumption ishat firms and small inventors have a greater incentive to engagen minor inventive activity if the rewards to it are appropriablehrough legal protection. Like patentable innovations, minor inno-ations are also subject to free riding by third parties, perhaps more
asily so since they are inventions of small step. Not only therefores the intensity of minor inventive activity likely to be greater inn economy that legally provides utility model protection, ceterisaribus, but the system also provides inventors of utility model10 Korean patent applicant firms (as of 1995).
innovations a means for staking their claims – hence we can expectthese inventors to file utility model applications for their minor butcommercially useful innovations. Note that we do not posit utilitymodel innovations as a function of past patentable innovations –that is, a dynamic learning effect from past patents to current util-ity models – although we admit that there is some possibility thatthe R&D process leading to patents could also generate some minorinventions (as by-products) and improvements that could generateutility models (UMs).8
Our empirical objective is to examine the effects of utility modellaws (UML) and the kinds of innovations they protect (U) on innova-tion and economic growth. Thus, the rest of this sub-section focuseson two equations: an equation for innovation and an equation foreconomic growth. Both are dynamic equations, and we describe thederivations of each in turn.
First, the derivation of the growth equation follows Mankiw et al.(1992), Caselli et al. (1996), and Bond (2002). We extend their mod-els by incorporating knowledge capital. For example, consider thefollowing steady state production function in efficiency units:
y∗ = k˛1z˛2 (4)
where y* = Y*/AN is output per efficiency worker, k = K/AN physi-cal capital per efficiency worker, and z = Z/AN knowledge capitalper efficiency worker. N denotes labor force (or population) and Atechnical efficiency, assumed to be labor augmenting. For now, wesuppress subscripts indexing time or country (firm).
The capital accumulation equations are k = sKy − nk and z =sZy − nz for physical and knowledge capital respectively, wheresK and sZ are the rates of investment in physical and knowledgecapital and n = N/N. (To avoid cluttering up the derivation of thegrowth equation, we suppress depreciation rates of capital andthe exogenous growth rate of A.) Taking the natural log of (1),time-differentiating the result, and substituting the accumulationequations into it, and then further linearizing the result aroundsteady-state shows that the instantaneous growth rate of outputper efficiency worker is inversely related to the positive deviationof the natural log of y above its steady state level:
d ln y
dt= −�(ln y − ln y∗) (5)
8 We thank the editor (Ashish Arora) for raising this issue. Thus, we have doneadditional regressions (available upon request) to support our reasoning behind theasymmetric specification in Eqs. (2) and (3), where P is a function of U, but not viceversa. See also footnote 24.

h Poli
(
wetc
s
Wruptoo
s
aof
s
wociia
pHa(t
P
wsswfAwpc
w(p
l
wfi
vB
Y.K. Kim et al. / Researc
country or firm)):
� ln(Y
N
)it
= �0 + �1 ln(Y
N
)it−1
+ �2 ln sZit + �3 ln sKit
+ �4 ln nit + �i + �t + εit (6)
here �1 = −(1 − e−�), and � i, � t, and εit are the individual fixedffects, time effects, and spherical error term respectively. As inhe previous literature, we think of sK broadly to include humanapital (h) as well as physical (non-human) capital (�) formation:
Kit = �ϕ1it h
ϕ2it
hen all relevant data are available, our best specification for theate of knowledge capital investment is sZ = sZ(p, u), where p and
are patenting and utility model intensities respectively (that is, = P/N and u = U/N). Recall from Eq. (3) that utility model innova-ions are assumed to be a function of utility model laws. We utilizeur firm-level data to assess the effects of utility model innovationsn economic growth, so that for our firm-level sample,
Zit = p�1it u
�2it−j
nd we utilize country-level data to study differences in growthwing to variations in the presence of utility model laws, so thator our international sample,
Zit = p�1+D�3it exp{(�2 + D�4)UMLit−j}
here UML = 1 indicates that utility model laws exist (and UML = 0therwise). As we introduced earlier, D = 1 indicates a high incomeountry in our cross-country sample (and D = 0 a middle and lowncome country). Note that we will be taking into account that util-ty model innovations or the adoption of utility model laws willffect economic growth with a lag (to be specified further below).
Our second equation of interest is the following knowledgeroduction function, as based on Pakes and Griliches (1980) andausman et al. (1984), in which patenting is a function of researchnd development (R) and the efficiency of knowledge production) due to internal and external factors (such as institutions relatedo knowledge production):
∗it = itR
ˇiteit (7)
here is the disturbance term. The above equation is for theteady-state level of patenting. Patenting is not likely to adjust to itsteady state level immediately but with a lag. One reason has to doith R&D adjustment costs (such as the costs of altering research
acilities or the workforce) which affect the decision to patent.nother is that innovation is a sequential, cumulative processhereby current patentable innovations build upon or improverevious patentable innovations. This dynamic dependence can beaptured using the following partial adjustment model:
PitPit−1
=(P∗it
Pit−1
)
0 < < 1 (8)
here measures the speed of adjustment. Thus, substituting7) into (8) and taking natural logs yields the following dynamicatenting equation which we will estimate9:
n Pit = �0 + �1 ln Pit−1 + �2 ln Rit + �3 ln it + �i + �t + vit (9)
here �1 = (1 − ) and �2 = ˇ, and �i, �t, and vit are the individualxed effect, time effect, and spherical error term respectively.
9 Other studies of innovation behavior have also incorporated a lagged dependentariable; see for example, Adams and Clemmons (2008), Bloom et al. (2002), andosch et al. (2005).
cy 41 (2012) 358– 375 363
As per Eq. (2), patenting can, within the context of lower incomecountries and the firms therein, depend on past utility model inno-vations; that is, experience with utility model innovations helpsaugment the technical efficiency of patenting, along with otherfactors such as openness (o), human capital (h), and the strengthof relevant institutions. Using the firm-level sample, we study howutility model innovations per se can enhance patenting (with a lagof j periods, to be discussed further in the next sections):
it = (hit, oit, U(UMLit−j, . . .)) = h�4it o
�5it U
�6it−j
Using the international sample, we can study how specific insti-tutions related to knowledge production, such as the strength ofpatent protection (IPR), as well as variations in the availability ofutility model systems, can enhance patenting:
it = (hit, oit, U(UMLit−j, . . .), IPRit)
= h�4it o
�5it exp{(�6 + D�7)UMLit−j}IPR�8+D�9
it
where, as before, D is a dummy variable indicating a high incomecountry when equal to one and UML is a dummy variable indicatingthat utility model protection is available when equal to one. Mostcountries have adopted patent systems and thus we can employa continuous index that gauges the strength of patent laws. But asubstantial number of countries have not adopted a utility modelsystem (or at least not until very recently) and hence there is a greatdegree of cross-country variation in the UML dummy.
One of our key ideas is that the efficiency of knowledge produc-tion is affected not only by the availability of patent rights but alsoby that of a utility model system (with a lag) which protects minorinventions. In developing countries that are at an early stage of eco-nomic development, as was the case in the past with some of today’sdeveloped countries, like Japan, firms are at lower levels of tech-nological capabilities, and thus largely produce minor inventions.But as they accumulate technological learning and enhance theirtechnological capabilities, they would be better able to producepatentable inventions at later stages. If this is the case, it is impor-tant to recognize and protect minor forms of inventions. To capturethe dynamic effects of utility model adoptions on patentable inno-vations, and to show how their effects are conditional upon thestages of economic development, we lag the UML variable andinteract it with the dummy variable (D) that distinguishes betweenhigher and lower income countries. We find that the lags shouldbe long enough to consider the underlying processes at work, suchas, first, the adoption of a utility model system intensifying minorinventive activity, and then the increased experience with minorinventive activity leading to greater technological learning and arise in patentable inventions.
To summarize, the equations to be estimated are (6) and (9).Next, we discuss the data issues related to estimating these equa-tions at the both country and firm levels.
4.3. Empirical issues
Our empirical analysis begins with the country level sample,where we estimate the innovation Eq. (9) first and then estimate thegrowth Eq. (6). In Eq. (9), for the international sample, the depen-dent variable is the natural log of U.S. patents granted. To measure
human capital, we consider both the quantity of resources and theeducational level. We use working age population to control forlabor resources in innovation rather than the number of scientistsand researchers due to data limitations in developing countries. Forthe educational level of human capital, we use the share of the pop-ulation (per million) with PhD degrees in science and engineering
3 h Poli
esaefAaot
paimiWtcfieits
ioaBnmnam
slpsfovKf
snGofbHf
nI
dEetmo
oa
64 Y.K. Kim et al. / Researc
arned in the U.S.10 More educated economies are likely to havetronger capacities to absorb innovations made elsewhere (Nelsonnd Phelps, 1966). The trade orientation of a country can also influ-nce its propensity to innovate. Relatively more open economiesace relatively more competition and have less sheltered markets.s such, they are compelled to invest relatively more in R&D (Chennd Puttitanun, 2005; Aghion et al., 2001). To measure the degreef openness of an economy, we use the Fraser Institute’s index ofhe freedom to trade internationally.
Next, in Eq. (6), the dependent variable is the growth rate ofer capita GDP. We use the population growth rate to proxy for nnd the secondary school enrollment rate to proxy for h. Patentingntensity (p) is measured as the ratio of U.S. patents granted per
illion working age persons. The intensity of innovation is definedn terms of the working age population to control for country size.
e also focus on patents awarded in the U.S. since they are likelyo represent the relatively high value innovations developed by aountry, given that patenting in the U.S. is rather costly, and thatrms would largely do so if the expected value of the patent rightxceeds the cost. Furthermore, since patent examination and grant-ng standards vary across countries, focusing on patents granted inhe U.S. helps to avoid variations in patenting due to differences inuch standards.11
For the international sample, we use a dummy variable tondicate whether a country provides utility model protection andbserve how variations in this variable across countries are associ-ted with differences in cross-country growth rates and innovation.ut its coefficient should be interpreted with caution. We shouldot presume its significance to suggest that in other non-utilityodel countries that minor inventions are not produced or have
o impacts. Rather, the coefficient estimate captures the marginaldditional effects on growth (or innovation) of adopting a utilityodel system.For the firm level estimation of the growth Eq. (6), we use
ales growth as our dependent variable. The RHS therefore includesagged sales (in natural logs), in addition to the natural logs ofatentable and utility model innovations. We also control for firmize (number of employees) and firm age.12 Firm age helps controlor efficiencies due to entrepreneurs learning about their abilitiesver time (Jovanovic, 1982; Evans, 1987). Our measure of inno-ation (i.e. patents and utility models) is the applications filed byorean firms. Since we are examining a single country, we do not
ace issues of differences in international granting standards.A key function of a patent is to help a company achieve
ufficient returns on its investment and commercialization of aew technology (Geroski et al., 1993; Geroski and Machin, 1993;ranstrand, 1999). Thus, if this function is fulfilled, the productf the innovative process should be associated with superior per-ormance. Previous empirical findings show a positive association
etween patents and corporate performance at the firm level.13owever, several limiting factors make it difficult for firms to profitrom their innovations, such as the inability to prevent other firms
10 This variable probably underestimates human capital since scientists and engi-eers also earned their PhDs from their home country or other countries, e.g. Canada,
srael, UK, Korea, France, Germany, and Australia.11 In Eq. (6), the measure of knowledge inputs are patents and utility models. Weo not control for R&D as well. Given that patents are already function of R&D inq. (9), we are assuming that these two measures of knowledge are comprehensivenough to reflect the effects of R&D. When we actually add R&D in the regressions,he results do not change with regard to the impacts of these two variables; utility
odels are significant in the early period only, while patents and R&D are significantnly in the later period. The results are available upon request.12 We do not have information on the schooling of firm employees.13 See Ernst (2001) for a survey of this literature. Studies find that at least onef two patent indicators – either simple counts of patent applications or patentsdjusted for quality – is found to have a positive impact on firm performance.
cy 41 (2012) 358– 375
from copying their technology, the high cost of or limited accessto capital and technology, the challenges of putting a product intoproduction in time, and the high cost of marketing (Lee et al.,2003). Thus, firms that are at their early developmental stageswith limited resources may find incremental innovation moreadvantageous in helping to position themselves in existing mar-kets at low cost. Hence Eq. (6) will help determine whether utilitymodels, representing incremental innovations, contribute to theperformance of firms whose technologies are below the frontier.
For the innovation Eq. (9) at the firm level, we also modelpatents as a function of lagged patents, past utility models, R&Dexpenditures, and firm size dummies. Firm size helps control foreconomies of scale in generating patents due to the fixed costs ofmaintaining a legal department that handles intellectual propertymatters (Lerner, 1995; Lanjouw and Lerner, 1996). As we employannual firm-level data, we find persistence in the data and thus con-trol for second period lags as well. One and two-year lagged R&Dexpenditures are included to incorporate time lags in knowledgeproduction (Pakes and Griliches, 1980; Hausman et al., 1984).
Eq. (9) at the firm level also helps us test whether knowledgeacquired through past utility model applications provide a step-ping stone for further technological progress. But the accumulationof knowledge that allows firms to generate future new patentableinventions is an incremental process and therefore takes quite sometime. For this reason we modeled and examined relatively long laglengths (e.g. five years). For both Eqs. (6) and (9) we control for firmfixed effects, year effects, and industry effects.
4.4. Estimation methodology
Eqs. (6) and (9) will be estimated by the two-step system Gen-eralized Method of Moments (GMM), as well as by OLS and fixedeffect (FE) estimations.14 When the results from the FE model andthe GMM are different (mostly in terms of the significance of thecoefficients), we provide the results of the Hausman test to showwhich one is consistent. In general, the GMM results are advanta-geous since the method can take care of the possible endogeneityof explanatory variables, as well as omitted variable biases. Theconsistency of GMM estimation, though, depends on the instru-ments being valid (i.e. no correlation between the error term andthe instruments) and on the absence of second order serial correla-tion in the first differences of the residuals; both assumptions willbe tested using the Sargan–Hansen (SH) and Arellano–Bond (AB)tests for second-order autocorrelation, respectively.
This estimation method has other advantages. As discussed inCaselli et al. (1996) and Bond (2002), it deals with cases where theregressors (e.g. investment rates) are endogenous. These endoge-nous regressors can be instrumented with variables that are at leastlagged twice and with their differenced equivalents. Otherwise,both OLS and fixed effects (FE) estimation will yield biased esti-mates of the coefficient of the lagged dependent variable, though inopposite directions. More specifically, OLS estimation results in anupward bias due to the positive correlation between the AR(1) termand the individual effect (� i or �i), whereas FE estimation results ina downward bias due to the leading negative correlations betweenthe within-transformed AR(1) term and the within-transformederror term (Nickell, 1981). Therefore, if system GMM properly con-trols for endogeneity, we expect the coefficient of the AR(1) term
to lie between the OLS estimate, which is biased upwards, and thefixed-effect estimate, which is biased downwards (Bond, 2002).14 See Arellano and Bond (1991) and Blundell and Bond (1998) for details. In one-step system-GMM, the weighting matrix makes use of differenced errors, whereasin the two-step version, the one-step residuals are used to compute a new weightingmatrix.

h Poli
5
aassaaDi1rtsstit(su
aKiuWidPdsttttfaw
cruswptaaG
lcsrdm
KrUt
Y.K. Kim et al. / Researc
. Datasets and basic descriptions
Appendix A summarizes our data sources. For the country-levelnalysis, we utilize data from the World Development Indicatorslong with other data, such as an index of patent rights. A panel dataet has been assembled for 1975–2003 and divided into five-yearpans, except for the last sub-period of 2000–2003. Five-year aver-ging is used to smooth out business cycles. GDP and related datare in constant 2000 international purchasing power parity dollars.ata on patent protection levels come from Park (2008), where an
ndex of patent protection is available for over 120 countries from960 to 2005 (every five years). The index provides a score thateflects a given country’s overall level of patent rights and restric-ions at a given point in time. The underlying data are based ontatutory and case laws, which interpret and apply the statutes. Thetrength of patent rights is a composite index measuring the dura-ion of protection, subject matter that is patentable, membershipn international treaties, enforcement mechanisms available, andhe degree to which limitations on patent holders are not imposedsuch as compulsory licensing). The index ranges from 0 (no patentystem) to 5 (strongest level of protection). Our information ontility model laws comes from Greene (2010).
For the firm level analysis, a panel data set has been assemblednnually from 1970 to 1995. This specific period in the course oforea’s economic development should suffice for our analysis since
t covers the transition of Korea from a middle-to-low-income,nderdeveloped country to a high-income, industrialized country.e compiled a detailed database of firm-level patenting and util-
ty model applications and matched the data to the firms’ financialata. Patent and utility model data are from the Korea Intellectualroperty Rights Information System (KIPRIS) and financial, operatingata from Lee et al. (2007, 2008).15 These data are the most exten-ive firm level data in Korea. From a population of 17,165 firms inhe dataset, we pulled out 3635 firms. The selection criterion washat a firm applied for at least one utility model or patent. We limithe analysis to this subset of the data since our goal is to understandhe differential impacts of utility models and patents on firm per-ormance as well as the impact of utility models on patenting. Salesnd related data are deflated using the industry-level GDP deflatorhere the base year is 1995.16
Table 1 presents summary statistics and correlations of theountry level data for the full sample and for different utility modelegimes. Less patenting has been conducted by countries that havetility model systems. For more perspective, Table 2 divides ourample of countries according to their intensities of patenting andhether they provide utility model protection as of 2000, and com-ares their per capita GDP levels and growth rates. The table showshat countries with above median patenting intensity have on aver-ge a higher per capita GDP and growth rate. Countries which havedopted utility model laws also have on average a higher per capitaDP.
Table 3 shows summary statistics and correlations for the firmevel data. Patent applications and utility models have a positiveorrelation, suggesting that firms that seek patent protection alsoeek utility models. Note that R&D expenditures have a higher cor-
elation with patents than with utility models. This may reflect theifferent characteristics between inventive innovation and incre-ental innovation. As Beneito (2006) analyzed, utility models tend15 Lee et al. (2007, 2008) constructed their data from the firm-level database of theorea Information Service (KIS). This database covers firms subject to external auditeports, namely those firms with more than 7 billion won assets (about 5.8 million.S. dollars if 1 USD equals 1200 Korean Won). Thus, small scale companies with less
han 7 billion won assets, such as microenterprises, are excluded from our sample.16 Industry level GDP deflators are from the Bank of Korea.
cy 41 (2012) 358– 375 365
to be associated more with external contract R&D while patentsmore with in-house R&D activities.
6. Empirical results
6.1. Country-level results
First, there is a preliminary issue to be addressed. Our key inter-est is whether utility model protection has a statistically significantassociation with economic growth. However, there may be a self-selection problem: countries with greater growth potential maybe the ones that adopt a utility model system, rather than achievefaster growth as a result of a utility system. To address this selec-tion issue, we conducted a logit regression to study the adoptionof a utility model system, using both economic growth and GDPper capita as determinants (see Table 4). In addition, legal ori-gin dummies, such as French and German origins, are included.The benchmark legal origin is British. Indeed, utility model lawsare more likely to exist under a civil law system, such as that inGermany, Korea, and Japan, rather than under a common law sys-tem, such as that of the U.K. and U.S.
As shown in Table 4, the growth rate and GDP per capita arenot statistically significant determinants of the adoption of a utilitymodel system. Even when the sample is divided by income level,no statistically significant relationship is found between economicgrowth and utility model adoption. Rather, utility model adoption isdetermined by the legal origin of the countries, which is consistentwith several studies emphasizing the role of legal and ethnic originsas the sources of institutional differences, such as Acemoglu et al.(2001) and La Porta et al. (2008).
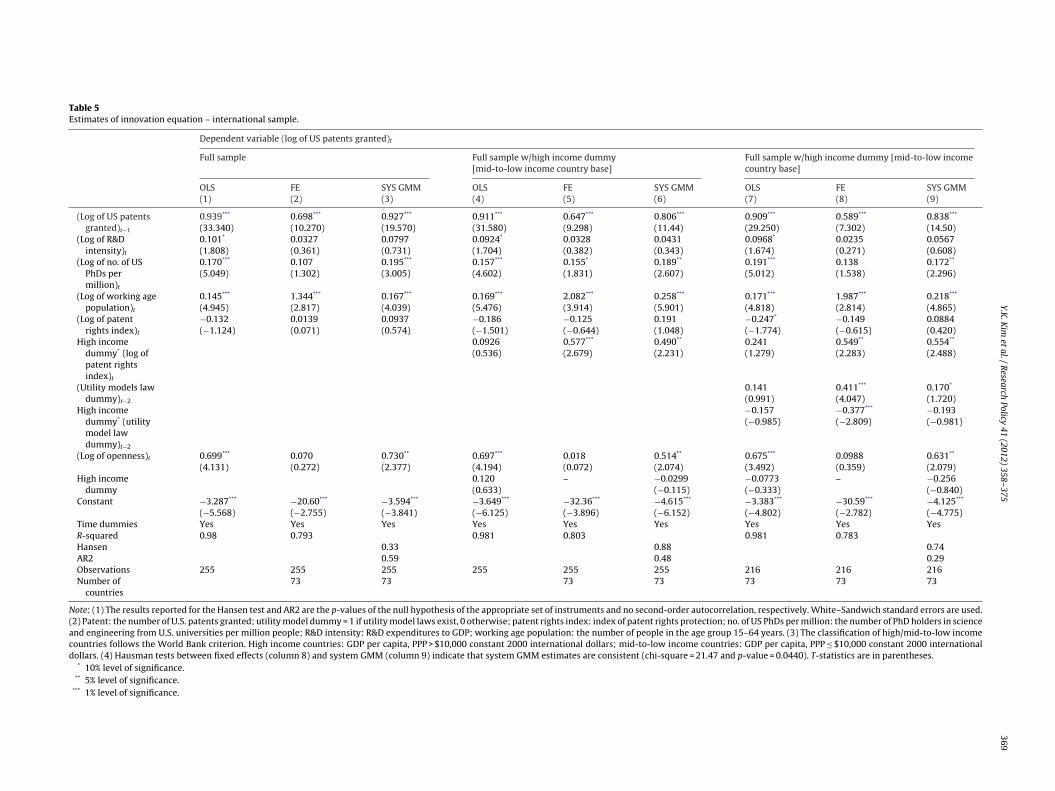
To best explain the effects of utility model adoption at theaggregate level, we find it more useful to discuss the estimates ofthe innovation model first, i.e. Eq. (9), before the growth Eq. (6).Throughout, we control for time effects using period dummies (butare not shown to conserve space). Table 5 presents our estimates ofinnovation Eq. (9) using three different methods: OLS, Fixed Effects(FE), and system GMM. While these methods yield similar resultswith regards to the coefficients of the variables of our main interest,we attach our highest reliability on the GMM results for the reasonsdiscussed above, such as endogeneity and omitted variable prob-lems. As we discussed earlier, system GMM, if valid, should producea coefficient estimate of lagged GDP per capita lying between theOLS and FE estimates. Indeed, we find this to be the case in ourresults. Other tests (AR2 and Sargan/Hansen tests) could not rejectthe null hypothesis of no serial correlation and instrument validity.
We thus focus mainly on the system GMM results of Table 5. Afirst issue is whether patent protection has a statistically significantassociation with our measure of innovation, namely patenting, andwhether this association also varies by level of economic develop-ment. From columns 1–3 of Table 5, we see that patent protection isnot a statistically significant determinant of patenting, under OLS,FE, or GMM. However, when the influence of patent protectionon patenting is analyzed by level of economic development, wefind that the strength of patent protection has a significant, pos-itive association with the patentable innovations of high-incomecountries (based on the FE and GMM results), while it has a statis-tically insignificant coefficient for middle-to-low income countriesunder OLS, FE, and GMM (see columns 4–6 of Table 5). From col-umn 6, the measured net effect of the strength of patent protectionon patenting in high income countries is 0.681 (=0.191 + 0.490),where the latter is the coefficient of the interaction term between
the high income country dummy and the patent rights index. Totest its significance, we ran an additional regression to find thatthe impact of patent protection in high income countries is signif-icantly different from zero, while it is negative and significant in
366 Y.K. Kim et al. / Research Policy 41 (2012) 358– 375
Table 1ASample statistics: international sample.
Variable Full sample Countries with utility model system Countries without utilitymodel system
Mean Std. dev. Mean Std. dev. Mean Std. dev.
GDP per capita growth rate (5-yearaverage) proportion
0.06 0.21 0.07 0.16 0.06 0.17
GDP per capita annual growth rateproportion
0.14 0.04 0.015 0.053 0.012 0.052
Patent rights index 2.3 1.00 2.38 1.03 2.18 0.93Investment to GDP (%) 23.2 9.2 22.67 7.69 21.67 7.77Population growth (%) 1.8 1.7 1.63 1.55 1.93 1.16Working age population (million
people)22.3 77.2 27.92 88.96 26.99 81.79
Number of US PhDs per million 2.7 6.5 2.47 5.71 4.10 8.86Enrollment of secondary education
(per population of correspondingage group)
59.8 34.0 61.44 35.72 54.01 34.67
Number of U.S. patents granted 2040 12,008 1330 5188.38 4662 21,665.55Total R&D expenditure to GDP (%) 1.11 0.92 1.16 0.86 1.20 1.10Index of freedom to trade
internationally6.2 1.61 6.44 1.47 5.78 1.82
GDP per capita (PPP, constant 2000international dollars)
7842.5 8020.5 8290.57 7843.40 7715.12 8963.25
Note: Country list:
(1) Utility model system: Angola, Argentina, Australia, Austria, Belgium, Benin, Burkina Faso, Bulgaria, Bolivia, Brazil, Botswana, Central African Republic, Canada, Switzerland,Chile, China, Cameroon, Congo, Rep., Colombia, Costa Rica, Czech Republic, Germany, Denmark, Algeria, Ecuador, Egypt, Arab Rep., Spain, Ethiopia, Finland, France, Ghana,Greece, Guatemala, Hong Kong, Honduras, Haiti, Hungary, Indonesia, Ireland, Italy, Japan, Kenya, Korea, Rep., Lithuania, Morocco, Mexico, Mali, Mauritania, Malaysia, Niger,Netherlands, Panama, Peru, Philippines, Poland, Portugal, Romania, Russian Federation, Rwanda, Senegal, El Salvador, Somalia, Slovak Republic, Syrian Arab Republic,Chad, Togo, Thailand, Turkey, Taiwan, Ukraine, Uruguay, Venezuela, RB, Vietnam.
(2) No utility model system: Burundi, Bangladesh, Cyprus, Dominica, Fiji, United Kingdom, Grenada, Guyana, India, Iran, Islamic Rep., Iraq, Iceland, Israel, Jamaica, Jordan,Liberia, Sri Lanka, Luxembourg, Madagascar, Malta, Myanmar, Mozambique, Mauritius, Malawi, Nigeria, Nicaragua, Norway, Nepal, New Zealand, Pakistan, Papua NewGuinea, Paraguay, Saudi Arabia, Sudan, Singapore, Sierra Leone, Sweden, Swaziland, Trinidad and Tobago, Tunisia, Tanzania, Uganda, United States, South Africa, Congo,Dem. Rep., Zambia, Zimbabwe.
Table 1BSample correlations: international sample.
Full sample
GDP per capita Patent intensity Utility model Patent rights index R&D intensity
GDP per capita 1Patent intensity 0.6918 1Utility model laws 0.0296 −0.0302 1Patent rights index 0.719 0.5746 0.3362 1R&D intensity 0.6698 0.7623 −0.0164 0.5819 1
Table 2Sample GDP per capita and growth by intensity of patenting and utility models laws, 1975–2003.
Patenting intensity
Below (and equal to) median Above median
Utility model laws
No3412.5 10,324.00.046 0.081(11) (37)
Yes4547.5 10,708.30.048 0.078(23) (50)
Note: Patenting intensity is U.S. patents granted per local (own-country) working age population. In each entry, the top figure is GDP per capita, the middle italicized figureis the average five-year growth rate, and the bottom number in parentheses is the number of countries in that group as of the year 2000.
Table 3ASample statistics: firm level sample.
Mean Std. dev. Min Max
Utility models 2 71.6 0 10,630Patent 1 61.8 0 10,077Sales (million USD) 134 550 0.0004 16,083R&D expenditure (million USD) 1.4 16 0 983Employees 1140.7 7083.5 2 841,050Sales growth (proportion) 0.1 0.4 −6.0 7.2Investment (%) 5.3 11.6 −21 112.1Firm age 9.0 11.0 1 100
Note: Sales and R&D expenditures were in constant 1995 Korean won and converted to U.S. dollars.

Y.K. Kim et al. / Research Policy 41 (2012) 358– 375 367
Table 3BSample correlations: firm level sample.
Utility models Patent Employees Sales growth Investment rate Firm age R&D expenditure
Utility models 1.00Patent 0.75 1.00Employees 0.18 0.16 1.00Sales growth 0.01 0.01 −0.004 1.00
−
mitoaievt
uiltpovvidtcctiphfidofalt
iovasv
eo
iovta
cig
Investment rate 0.02 0.02 0.02
Firm age 0.04 0.04 0.07
R&D expenditure 0.47 0.70 0.22
iddle to low income countries.17 Thus our findings illustrate themportance of examining the impacts of patent protection on coun-ries by different levels of development. Previous empirical studiesn the relationship between patent rights and R&D (e.g. Kanwarnd Evenson, 2003; Varsakelis, 2001) have not explicitly exam-ned countries by income group. The result supports our argumentsarlier that patents may not be very effective mechanisms in inno-ation among firms or inventors that are relatively small and unableo utilize patents for litigation or cross-licensing negotiations.
In columns 7–9 of Table 5, we include the dummy variable fortility model laws to examine whether a system that protects minor
nventions enhances innovation potential. For the estimation, weagged the dummy variable for utility model laws by two periodso take into consideration first the lagged effect of utility modelrotection on incremental innovations and another lagged effectf incremental innovations on the production of patentable inno-ations. We also included an interaction term between the dummyariable for utility model laws and a dummy variable for highncome countries to take into consideration the level of economicevelopment. The results show that the effect of utility model pro-ection on innovation seems specific to middle and low incomeountries, as shown by the statistically significant positive coeffi-ient estimate of 0.411 at the 1% level of significance according tohe FE results, or the coefficient estimate of 0.170 at the 10% signif-cance level according to the GMM results. On the other hand, theresence of utility model laws in high income countries seems toave a lower impact on patenting, as seen from the negative coef-cient of the interaction term between the high income countryummy and the utility model dummy, suggesting that the effectsf utility model laws in mid-to-low income countries might be dif-erent from those in high income countries. We also verified byn additional regression that the dummy variable for utility modelaws has a statistically insignificant and negative association withhe patenting of developed countries.18
Thus, our results show that utility models protection can be anmportant factor affecting the production of patentable innovationsnly in middle-to-low income countries. In addition, the controlariables all have the expected sign. The variables like workingge population, number of PhDs, and openness, consistently havetrong explanatory power, but the significance of the R&D intensityariable varies.
Table 6 presents estimates of the growth Eq. (6) from a differ-nt and, we believe, interesting perspective. Patenting intensity isur measure of patentable innovations. In columns 1–3, we see that,
17 In this regression, we use the patent rights index, a dummy for middle-to-lowncome countries, and its interaction with the patent rights index, together withther control variables. In this regression model, the coefficient of the patent rightsariable captures its impacts on the baseline group (high income countries) and iturns out to be statistically significant at the 1% significance level. The results arevailable upon request.18 That is, we re-ran a regression using a dummy variable for mid-to-low incomeountries so that the coefficient of the utility model law dummy represents thempact of utility models protection for the high income countries as the baselineroup.
0.17 1.000.19 −0.06 1.000.01 0.02 0.05 1.00
controlling for other factors, the intensity of patenting is significant(at the 5% level of statistical significance), but the dummy variablefor utility model laws is statistically insignificant. In columns 4–6 ofTable 6, we repeat the analysis shown in columns 1–3 by incorpo-rating the high income country dummy. First, patenting intensityin middle-to-low income countries has a negative but statisticallyinsignificant association with GDP per capita growth in all of theOLS, FE, and GMM results. But the impact of patenting intensity ongrowth is much larger in high income countries, as can be seen fromthe positive coefficient of the interaction term between the highincome country dummy and patenting intensity – this coefficientbeing statistically significant at the 1% level of statistical signifi-cance. From column 6, the measured net effect of patent intensityon growth in high income countries is 0.0683 (=−0.027 + 0.953,where the former is the coefficient of the patenting intensity ofmiddle-to-low income countries and the latter the coefficient ofthe interaction term between the high income country dummyand patenting intensity). An explanation for this result is that inmiddle-to-low income countries, patents raise the cost of doingbusiness, via royalties and licensing fees. These in turn raise thecost of production by making technological inputs more expensive.These costs may not be too burdensome for firms in high-incomecountries, but in middle-to-low income countries, these costs arelikely to be a more significant share of the cost of production. Thus agreater dominance of proprietary technologies may be a hindranceor at least not conducive to the growth of middle and lower incomeeconomies. This result is consistent with Lee and Kim (2009), whichalso finds the relationship between patenting and growth to be pos-itively and significantly related among higher income, but not lowerincome, countries.19
In contrast, the dummy variable for utility model laws inmiddle-to-low income countries has a positive and statisticallysignificant association with the growth rate in all of the OLS, FE, andGMM results. It has a statistically significant positive coefficientestimate of 0.0907 at the 5% level (see column 6 of Table 6); follow-ing Hausman test results, we refer to the system GMM results incolumn 6.20 Moreover, the negative interaction term between thedummy variable for utility model laws and the dummy variable forhigh income countries suggests that the utility model system has asmaller impact on economic growth in high income countries thanit has in middle-to-low income countries. For high income coun-tries, the measured net effect of utility model protection on GDPper capita growth is positive (specifically 0.0157 = 0.0907 − 0.075,where the latter is the coefficient estimate of the interaction term).
We confirmed with an additional regression that the overall effectof utility model protection on the growth of GDP per capita in highincome countries is insignificant.21 The intuition for this finding is19 Lee and Kim (2009) focus on the determinants of long run growth, such as inno-vation, institutions, and human capital, but not on the relationship between IPRsand innovation.
20 The test finds that the system GMM estimator is consistent (i.e. chi-square = 35.53 and p-value = 0.000), while the fixed effects results are not.
21 Again, in this regression, we use a dummy for utility model law, a dummy formiddle-to-low income countries, and its interaction with the dummy for utility

368 Y.K. Kim et al. / Research Policy 41 (2012) 358– 375Ta
ble
4Lo
git
regr
essi
ons
on
uti
lity
mod
el
adop
tion
.
Dep
end
ent
vari
able
s:
uti
lity
mod
el
du
mm
y
Logi
t
Logi
t
Full
sam
ple
(1)
Hig
h
inco
me
cou
ntr
ies
(2)
Mid
-to-
low
inco
me
cou
ntr
ies
(3)
Full
sam
ple
(4)
Hig
h
inco
me
cou
ntr
ies
(5)
Mid
-to-
low
inco
me
cou
ntr
ies
(6)
(Log
of
GD
P
per
cap
ita)
t0.
0399
(0.3
81)
−0.1
88(−
0.44
1)−0
.079
1(−
0.45
7)(5
-Yea
r
aver
age
GD
P
per
cap
ital
grow
th) t
0.30
7(0
.417
)1.
436
(0.7
90)
0.28
5(0
.341
)Fr
ench
lega
l ori
gin
du
mm
y
2.61
7***
(9.2
49)
1.93
6***
(4.0
76)
3.11
4***
(7.2
33)
2.60
5***
(8.9
03)
1.80
5***
(3.5
61)
3.10
3***
(7.6
11)
Ger
man
lega
l ori
gin
du
mm
y
3.78
3***
(9.3
55)
3.34
6***
(6.9
70)
3.71
0***
(5.2
70)
3.70
3***
(8.9
42)
3.35
4***
(6.6
27)
3.82
7***
(4.8
65)
Con
stan
t
−4.9
68**
*(−
5.56
6)−1
.327
(−0.
323)
−5.5
86**
*(−
4.17
8)−3
.446
***
(−9.
868)
−3.2
29**
*(−
5.28
1)−3
.815
***
(−8.
021)
Tim
e
du
mm
ies
Yes
Yes
Yes
Yes
Yes
Yes
Log
like
lih
ood
−287
.6
−92.
76
−188
.3
−254
.7
−77.
45
−174
.1W
ald
chi2
181.
40
69.1
8
105.
80
142.
00
57.4
0
84.9
0p-
Val
ue
0.00
0.00
0.00
0.00
0.00
0.00
Obs
erva
tion
s
672
214
458
545
175
370
Not
e:
(1)
Log
of
GD
P
per
cap
ita:
a
loga
rith
mic
term
of
GD
P
per
cap
ita
(PPP
, con
stan
t
2000
inte
rnat
ion
al
$);
5-ye
ar
aver
age
GD
P
per
cap
ital
grow
th:
a
grow
th
rate
(pro
por
tion
)
of
GD
P
per
cap
ita;
Fren
ch
lega
l ori
gin
du
mm
y
=
1
if
aco
un
try
has
Fren
ch
lega
l ori
gin
, 0
oth
erw
ise;
Ger
man
orig
in
du
mm
y
=
1
if
a
cou
nty
has
Ger
man
lega
l ori
gin
, 0
oth
erw
ise.
(2)
The
clas
sifi
cati
on
of
hig
h/m
id-t
o-lo
w
inco
me
cou
ntr
ies
foll
ows
the
Wor
ld
Ban
k
crit
erio
n. H
igh
inco
me
cou
ntr
ies:
GD
P
per
cap
ita,
PPP
>
$10,
000
con
stan
t
2000
inte
rnat
ion
al
dol
lars
;
Mid
-to-
low
inco
me
cou
ntr
ies:
GD
P
per
cap
ita,
PPP
≤
$10,
000
con
stan
t
2000
inte
rnat
ion
al
dol
lars
.T-
stat
isti
cs
are
in
par
enth
eses
. ***
, **,
and
*
ind
icat
e
1%, 5
%, a
nd
10%
leve
ls
of
sign
ifica
nce
, res
pec
tive
ly.
Fig. 3. The composition of R&D expenditure in Korea.
that the required inventive step between a patent and utility modeldiffers. Hence, developing countries that are mostly engaged inincremental or adaptive R&D are more likely to resort to utilitymodels; for example, China, Russia, and Brazil, have been activelyexploiting utility models. Among these countries, their researchand innovation are likely to be geared more towards adaptingexisting technologies to local needs or developing innovationsthat are more appropriate for their economic circumstances. Thus,as the results show, we find that utility model protection doesmatter to the economic growth of this group of countries. Incountries that make such protection available, the small inventorsand entrepreneurs have greater incentives and opportunities topursue minor inventive activity and adapt it to local productionneeds since their research outputs are recognized and protectedwith utility model protection. In countries that do not providepetty patent protection, agents may have less incentive to investin adaptive, incremental R&D.
As for the control variables, population growth and secondaryschool enrollment rates have mixed signs and significance lev-els, but the physical capital investment variable has a consistentlysignificant positive influence on growth. The coefficient of thelagged dependent variable is negative and statistically significant atconventional levels, indicating conditional convergence in growthrates across countries, a result that is consistent with previousempirical work.
To summarize, our finding here is that a second-tier form ofintellectual property protection, namely utility models, helps makeit possible for a developing country to build its technological capac-ity. Incremental, adaptive R&D leads to innovations that qualifyfor such utility model protection and provides a foundation uponwhich to eventually produce patentable innovations. What theseresults suggest is that strong or weak IP protection is not the keyissue for developing countries. Rather it is whether such coun-tries have the appropriate kind of intellectual property protection,a point that is relatively neglected in current policy debates and inprevious research. We next turn to a further corroboration of thispoint using Korean firm level data.
6.2. Firm level results
Table 7 presents the results of estimating Eq. (6) using a firm’sannual sales growth as the dependent variable. Our goal here is
model law, together with other control variables, so that the baseline group is thehigh income countries. Thus, the coefficient of the dummy for utility model lawin this regression represents the impacts for the high income countries, and theestimate for it turns out to be positive but insignificant. The coefficient estimateof the dummy for utility models in high income countries is 0.016. The results areavailable upon request.
Y.K.
Kim
et al.
/ R
esearch Policy
41 (2012) 358– 375369
Table 5Estimates of innovation equation – international sample.
Dependent variable (log of US patents granted)t
Full sample Full sample w/high income dummy[mid-to-low income country base]
Full sample w/high income dummy [mid-to-low incomecountry base]
OLS(1)
FE(2)
SYS GMM(3)
OLS(4)
FE(5)
SYS GMM(6)
OLS(7)
FE(8)
SYS GMM(9)
(Log of US patentsgranted)t−1
0.939***
(33.340)0.698***
(10.270)0.927***
(19.570)0.911***
(31.580)0.647***
(9.298)0.806***
(11.44)0.909***
(29.250)0.589***
(7.302)0.838***
(14.50)(Log of R&D
intensity)t
0.101*
(1.808)0.0327(0.361)
0.0797(0.731)
0.0924*
(1.704)0.0328(0.382)
0.0431(0.343)
0.0968*
(1.674)0.0235(0.271)
0.0567(0.608)
(Log of no. of USPhDs permillion)t
0.170***
(5.049)0.107(1.302)
0.195***
(3.005)0.157***
(4.602)0.155*
(1.831)0.189**
(2.607)0.191***
(5.012)0.138(1.538)
0.172**
(2.296)
(Log of working agepopulation)t
0.145***
(4.945)1.344***
(2.817)0.167***
(4.039)0.169***
(5.476)2.082***
(3.914)0.258***
(5.901)0.171***
(4.818)1.987***
(2.814)0.218***
(4.865)(Log of patent
rights index)t
−0.132(−1.124)
0.0139(0.071)
0.0937(0.574)
−0.186(−1.501)
−0.125(−0.644)
0.191(1.048)
−0.247*
(−1.774)−0.149(−0.615)
0.0884(0.420)
High incomedummy* (log ofpatent rightsindex)t
0.0926(0.536)
0.577***
(2.679)0.490**
(2.231)0.241(1.279)
0.549**
(2.283)0.554**
(2.488)
(Utility models lawdummy)t−2
0.141(0.991)
0.411***
(4.047)0.170*
(1.720)High income
dummy* (utilitymodel lawdummy)t−2
−0.157(−0.985)
−0.377***
(−2.809)−0.193(−0.981)
(Log of openness)t 0.699***
(4.131)0.070(0.272)
0.730**
(2.377)0.697***
(4.194)0.018(0.072)
0.514**
(2.074)0.675***
(3.492)0.0988(0.359)
0.631**
(2.079)High income
dummy0.120(0.633)
– −0.0299(−0.115)
−0.0773(−0.333)
– −0.256(−0.840)
Constant −3.287***
(−5.568)−20.60***
(−2.755)−3.594***
(−3.841)−3.649***
(−6.125)−32.36***
(−3.896)−4.615***
(−6.152)−3.383***
(−4.802)−30.59***
(−2.782)−4.125***
(−4.775)Time dummies Yes Yes Yes Yes Yes Yes Yes Yes YesR-squared 0.98 0.793 0.981 0.803 0.981 0.783Hansen 0.33 0.88 0.74AR2 0.59 0.48 0.29Observations 255 255 255 255 255 255 216 216 216Number of
countries73 73 73 73 73 73 73
Note: (1) The results reported for the Hansen test and AR2 are the p-values of the null hypothesis of the appropriate set of instruments and no second-order autocorrelation, respectively. White–Sandwich standard errors are used.(2) Patent: the number of U.S. patents granted; utility model dummy = 1 if utility model laws exist, 0 otherwise; patent rights index: index of patent rights protection; no. of US PhDs per million: the number of PhD holders in scienceand engineering from U.S. universities per million people; R&D intensity: R&D expenditures to GDP; working age population: the number of people in the age group 15–64 years. (3) The classification of high/mid-to-low incomecountries follows the World Bank criterion. High income countries: GDP per capita, PPP > $10,000 constant 2000 international dollars; mid-to-low income countries: GDP per capita, PPP ≤ $10,000 constant 2000 internationaldollars. (4) Hausman tests between fixed effects (column 8) and system GMM (column 9) indicate that system GMM estimates are consistent (chi-square = 21.47 and p-value = 0.0440). T-statistics are in parentheses.
* 10% level of significance.** 5% level of significance.
*** 1% level of significance.

370Y.K
. K
im et
al. /
Research
Policy 41 (2012) 358– 375
Table 6Estimates of growth equation – international sample.
Dependent variable (5-year average GDP per capita growth rate)t
W/both utility model dummy (t − 2) and log of patent intensity (t) High income interaction w/both utility model dummy(t − 2) and log of patent intensity (t)
OLS(1)
FE(2)
SYS GMM(3)
OLS(4)
FE(5)
SYS GMM(6)
(Log of GDP per capita)t−1 −0.0556**
(−2.075)−0.151(−1.411)
−0.106**
(−2.068)−0.0501**
(−2.030)−0.156(−1.472)
−0.0965*
(−1.898)(Log of population growth)t −0.0137
(−1.511)−0.0102(−0.524)
−0.0387*
(−1.871)−0.0129(−1.167)
−0.0125(−0.654)
−0.0217(−0.889)
(Log of investment)t 0.246***
(7.873)0.209***
(2.645)0.448***
(6.275)0.249***
(7.893)0.210***
(2.656)0.431***
(6.330)(Log of secondary school
enrollment)t
0.0520**
(2.265)0.0245(0.705)
0.0499(0.802)
0.0518**
(2.319)0.034(0.964)
0.161**
(2.099)(Utility models law
dummy)t−2
0.014(0.894)
0.070(1.630)
−0.0107(−0.270)
0.0482*
(1.830)0.102**
(2.122)0.0907**
(2.014)High income dummy*
(utility model lawdummy)t−2
−0.054(−1.610)
−0.133***
(−2.671)−0.075(−0.935)
(Log of patent intensity)t 0.0145**
(2.303)0.018(0.889)
0.0319**
(2.371)−0.004(−0.447)
0.002(0.125)
−0.027(−1.167)
High income dummy* (logof patent intensity)t
0.0207**
(2.052)0.0460*
(1.666)0.0953***
(2.705)High income dummy 0.020
(0.484)– −0.200
(−1.200)Constant −0.395**
(−2.041)0.671(0.665)
−0.573(−1.647)
−0.472**
(−2.517)0.621(0.623)
−1.102***
(−2.752)Time dummies Yes Yes Yes Yes Yes YesR-squared 0.380 0.221 0.401 0.234Hansen 0.32 0.6AR2 0.34 0.68Observations 299 299 299 299 299 299Number of countries 90 90 90 90 90 90
Note: (1) The results reported for the Hansen test and AR2 are the p-values of the null hypothesis of the appropriate set of instruments and no second-order autocorrelation, respectively. White–Sandwich standard errors areused. (2) Patent rights index: index of patent rights protection; log of GDP per capita: a logarithmic term of GDP per capita (PPP, constant 2000 international $); population growth: a growth rate of population; secondary schoolenrollment: rate of secondary school enrollment; investment: ratio of gross capital formation to GDP. Utility model dummy = 1 if utility model laws exist, 0 otherwise; patent rights index: index of patent rights protection. (3)The classification of high/mid-to-low income countries follows the World Bank criterion. High income countries: GDP per capita, PPP > $10,000 constant 2000 international dollars; mid-to-low income countries: GDP per capita,PPP ≤ $10,000 constant 2000 international dollars. (4) Hausman tests between fixed effects (column 5) and system GMM (column 6) indicate that system GMM estimates are consistent (chi-square = 35.53 and p-value = 0.0002).T-statistics are in parentheses.
* 10% level of significance.** 5% level of significance.
*** 1% level of significance.

Y.K.
Kim
et al.
/ R
esearch Policy
41 (2012) 358– 375371
Table 7Impacts of utility models and patents on firm performance – Korean firm sample.
Dependent variable (annual sales growth rate)t
Full sample 1970–1986 1987–1995
OLS(1)
FE(2)
SYS GMM(3)
OLS(4)
FE(5)
SYS GMM(6)
OLS(7)
FE(8)
SYS GMM(9)
(Log of sales)t−1 −0.0836***
(−9.691)−0.391***
(−18.49)−0.168***
(−5.883)−0.103***
(−6.287)−0.559***
(−12.11)−0.168***
(−3.881)−0.0783***
(−7.656)−0.452***
(−19.30)−0.207***
(−8.887)(Log of utility model)t−1 0.00466*
(1.662)0.0122**
(2.553)0.00934(0.874)
0.0149**
(2.071)0.0572***
(3.397)0.0473**
(2.141)0.00272(0.884)
0.00361(0.894)
0.00456(0.448)
(Log of patent)t−1 0.0175***
(5.993)0.0108**
(2.506)0.0250**
(2.435)0.0222**
(2.215)0.0126(0.911)
−0.0192(−0.987)
0.0162***
(5.233)0.00712*
(1.746)0.0529***
(4.958)(Log of investment)t−1 0.0294***
(13.240)0.0158***
(7.996)0.0461***
(6.093)0.0292***
(6.022)0.00906**
(2.084)0.0163(1.072)
0.0291***
(11.730)0.0135***
(6.110)0.0371***
(5.375)(Log of employees)t−1 0.0736***
(9.356)0.161***
(7.336)0.153***
(4.355)0.0697***
(5.091)0.114***
(2.966)0.112**
(2.468)0.0739***
(7.757)0.179***
(7.415)0.168***
(6.134)(Log of firm age)t −0.0631***
(−11.37)0.0086(0.277)
−0.0431***
(−3.564)−0.0349***
(−2.789)0.2(1.598)
−0.00369(−0.162)
−0.0702***
(−11.14)0.00859(0.256)
−0.0339**
(−2.188)Constant 1.361***
(6.012)5.757***
(18.530)2.216***
(6.934)1.820***
(7.435)8.759***
(9.188)7.784(1.463)
1.209***
(9.420)6.999***
(20.180)2.795***
(9.687)Year dummies Yes Yes Yes Yes Yes Yes Yes Yes YesIndustry dummies Yes Yes Yes Yes Yes Yes Yes Yes YesR-squared 0.131 0.313 0.166 0.381 0.121 0.338Hansen 0.67 0.54 0.28AR2 0.795 0.625 0.583Observations 14359 14359 14359 3034 3034 3034 11325 11325 11325Number of firms 1717 1717 1717 861 861 861 1708 1708 1708
Note: (1) Year dummies for 1970–1995 and industry dummies for 21 industries are included. Utility model refers to number of utility model applications, patent to number of patent applications, investment to ratio of investmentto assets, and employees to number of employees. White–Sandwich standard errors are used. (2) The results of the full sample model and the 1970–1986 model are mixed. Hausman tests between fixed effects estimates andsystem GMM indicate that system GMM is consistent in both models (i.e. chi-square = 3888.5 and p-value = 0.000 for the full sample, and chi-square = 1508.09 and p-value = 0.00 for the 1970–1986 sample). T-statistics are inparentheses.
* 10% level of significance.** 5% level of significance.
*** 1% level of significance.

372 Y.K. Kim et al. / Research Policy 41 (2012) 358– 375
Fig. 4. The establishment of corporate R&D centers by year and field (Korea, 1981–1995).S
tfp1ge(hafic
fipIgenbastctgbKm
witdsc1RgBri
tb
T
note that larger firms (by size of employment) tend to produce morepatentable innovations, a feature of Schumpeterian-type models.
23 The reason that the utility model variables are lagged five to six years is that weare dealing with annual firm level data. Earlier in our country level panel data, eachsingle time period was five years in length (i.e. quinquennial). Thus a five-to-six yearannual lag corresponds to our cross-country lag of one to two periods. We would alsoargue that five-to-six year lags would be a reasonable time period of learning in orderfor real innovation to take place, particularly since utility model experiences provideincremental learning. In that case, an extended cumulative period of learning isrequired to develop greater inventive potential.
24 In Table 8, patenting is a function of past utility models, controlling for otherfactors. There is also the possibility raised earlier that utility models might be afunction of patents. We have performed a check on this to find that lagged patents(t − 5, t − 6) are not significant in contributing to current utility model innovations
ource: Korea Industrial Technology Association webpage (www.koita.or.kr).
o test the hypothesis that utility models contribute to firm per-ormance. We find that the contributions of utility models andatents depend on the time period. First, for the entire period970–1995, patents dominate utility models in explaining salesrowth, as shown in column 3.22 This is consistent with previousmpirical findings underlining the economic significance of patentssee Ernst, 2001). The investment and labor control variables eachave significant positive associations with sales growth, while thege of a firm has a significant negative association (i.e. youngerrms generally have faster growth in sales). The latter result isonsistent with Jovanovic (1982) and Evans (1987).
When the sample is split by period around the mid-1980s, wend a kind of role reversal. The mid-1980s are in fact a turningoint for Korea’s technological development (Lee and Kim, 2010).
ts indigenous R&D capabilities began to grow markedly. The aggre-ate R&D/GDP ratio was less than 1% before this point in time andxceeded 2.5% soon after (see Fig. 3). The share of private R&D inational R&D was less than half before the early 1980s and was 80%y the late 1980s. The number of corporate R&D centers in Korealso began to increase substantially after the mid-1980s. As Fig. 4hows, there were 45 such centers in 1981. But by the mid-1980s,he number increased more than five-fold. The rise in the number oforporate R&D centers indicates that more Korean firms were ableo fund their own internal R&D activities. It was also then that therowth rate of utility model filings began to decline and the num-er of patent applications to rise. Overall, it is widely perceived thatorean technological capabilities had made some jump during theid-1980s.Our regressions find that during the period when Korean firms
ere still technologically lagging (i.e. 1970–1986), incrementalnnovations have a positive impact on firm performance, con-rolling for other variables (see column 6). However, patentso not have a statistically significant effect. Thus, this stronglyupports the view that utility models are a good strategy for a late-omer’s growth, particularly at its early stages. But for the period987–1995, when Korea had acquired greater technological and&D capabilities, patents significantly and positively explain salesrowth, while utility model applications do not (see column 9).y the time a firm achieves greater technological competence, itelies less on minor innovations for its performance and more onnventive, patentable innovations – hence the role reversal.
The implication here is that utility model innovations are likelyo be quite appropriate for companies that are resource-poor orelow the technological frontier. Patent protection is likely to be
22 We discuss the system GMM results since they are consistent. See notes toable 7.
more conducive to innovation after companies have reached somecritical technological capability; that is, once they have the capacityand wherewithal to produce innovations with sufficient inventivesteps to qualify for patent protection.
Finally, the results in Table 8 show the estimates of Eq. (9) forthe firm level data. The objective here is to test the hypothesis thatpast utility models can stimulate future patentable innovations.The argument is that utility model innovations and filings allowfirms to engage in learning-by-innovating, however incrementally,and to accumulate technological capabilities. Here, the knowledgeproduction function model is augmented with one and two-yearlagged patents and R&D to control for persistence in patenting.Utility models are lagged 5 and 6 years to incorporate the fea-ture that learning-by-innovating is occurring incrementally.23 Bothlagged utility models and patents have positive associations withthe flow of new patents, as shown in column 6. That is, the newpatentable innovations of firms build upon their past utility modelknowledge as well as their past, more inventive knowledge.24 Theresults support the hypothesis that through adaptation, imitation,and incremental innovation, firms acquire some learning-by-doing(Suthersanen, 2006). Note, however, that once past knowledgeaccumulation (from both utility model and patentable innovation)is considered, the twice lagged R&D expenditure loses its statisticalsignificance, as shown in columns 3 and 6. A reason could be thatolder R&D is reflected in the lagged patenting variables. Lastly, we
(which is in sharp contrast to the results in Table 8 where lagged utility models aresignificantly related to current patents). These “asymmetric” results suggest thatfirm-level utility model and patentable innovations are not really driven by com-mon time varying effects, but that there is a feedback from utility model learningand experience to later patenting, but not from patenting experience to later utilitymodel innovations. As Fig. 2 shows, the leading Korean IP firms no longer file thatmany utility model applications. This interesting pattern suggests that the dynamiclearning relationship (from past UMs to current patents) is subject to change and ismost applicable at certain stages of a firm’s development.

Y.K.
Kim
et al.
/ R
esearch Policy
41 (2012) 358– 375373
Table 8Impact of past patents and utility models on new knowledge generation – Korean firm sample.
Dependent variable (log of patent application)t
OLS(1)
FE(2)
SYS GMM(3)
OLS(4)
FE(5)
SYS GMM(6)
(Log of patent application)t−1 0.592***
(33.560)0.438***
(19.460)0.721***
(15.390)0.577***
(32.250)0.420***
(18.600)0.539***
(21.690)(Log of patent application)t−2 0.358***
(19.350)0.279***
(13.440)0.159***
(3.979)0.334***
(17.800)0.250***
(13.020)0.258***
(12.560)(Log of utility model application)t−5 0.0446***
(3.607)0.0569***
(3.673)0.0841**
(2.329)(Log of utility model application)t−6 0.0350***
(2.782)0.0557***
(4.010)0.0397*
(1.865)(Log of R&D expenditure)t−1 0.0120***
(6.116)0.0102***
(4.170)0.0204*
(1.859)0.0119***
(6.024)0.00987***
(4.125)0.0165**
(1.974)(Log of R&D expenditure)t−2 0.00966***
(4.800)0.0103***
(4.050)0.00103(0.269)
0.00906***
(4.481)0.00973***
(3.870)0.00338(0.935)
Firm size dummy (51–300 employees) −0.00497(−0.137)
−0.00659(−0.215)
−0.00567(−0.156)
0.0057(0.125)
Firm size dummy (301–1000 employees) 0.0118(0.316)
0.0165(0.461)
0.0112(0.302)
0.0437(0.871)
Firm size dummy (more than 1000 employees) 0.167***
(4.191)0.208***
(4.213)0.162***
(4.072)0.266***
(4.655)Constant −0.298**
(−2.523)−0.706***
(−7.010)−0.283***
(−3.014)−0.239**
(−2.026)−0.637***
(−6.447)(0.186)(−1.459)
Year dummies Yes Yes Yes Yes Yes YesIndustry dummies Yes Yes Yes Yes Yes YesR-squared 0.776 0.501 0.778 0.506Hansen 0.72 0.770AR2 0.156 0.206Observations 9903 9903 9903 9903 9903 9903Number of firms 1464 1464 1464 1464 1464 1464
Note: Year dummies for 1970–1995 and industry dummies for 21 industries are included. R&D expenditures are in thousands of constant 1995 Korean Won. T-statistics are in parentheses.* 10% level of significance.
** 5% level of significance.*** 1% level of significance.

3 h Poli
7
ogpfiFanotiwaatdi
vrimrblvibawoiwa
stovoiiaa
otmSe
A
fpNEKRewED
74 Y.K. Kim et al. / Researc
. Conclusions
This paper extends previous empirical research on the effectsf intellectual property protection on innovation and economicrowth by focusing on the relative role of two types of protection:atents and utility models. We exploited both country level andrm level data. The results from both datasets are complementary.irst, in high income economies, differences in economic growthnd innovation can be explained by variations in patent rights, butot by variations in the provision of utility models, controlling forther variables. In middle-to-low income countries, the reverse ishe case. Correspondingly, in the Korean firm level data, patentablennovations matter positively and significantly to firm growth,
hile utility model innovations matter insignificantly, when firmsre technologically advanced. The reverse is the case when firmsre technologically lagging: utility model innovations matter posi-ively and significantly to firm growth while patentable innovationso not. Furthermore, utility model innovations can be an important
nput into the generation of future patentable innovations.Thus the chief lesson in this paper is that what matters to inno-
ation and growth is not only the strength of intellectual propertyights but also the type of protection. For example, the availabil-ty of legal protection for minor, adaptive inventions should be
ost useful to firms with low technological capacities and limitedesources. In developing markets, patents raise the cost of doingusiness and innovation. This cost tends to be more onerous for
ower income economies. In contrast, a utility model system pro-ides an alternative way for such economies to create incentives fornnovation, albeit incremental, without affecting the cost of doingusiness adversely, and while providing the technological inputsppropriate for local needs. For more developed firms and firmsith better access to resources, such as those in the more devel-
ped countries, patent protection plays a more important role in thennovation process than do utility model laws. The longer terms and
ider breadth associated with patents provide incentives to creatend commercialize innovations with larger inventive steps.
The experience of Korean firms and the country level analysesuggest that the design and strength of intellectual property sys-ems should be tailored to the indigenous technological capacitiesf firms in order to best provide the appropriate incentives for inno-ation. Current academic and policy debates have largely focusedn the effects of strong patents and copyrights, of raising develop-ng country standards to developed country levels, and restrictingmitation, piracy, and infringement in developing countries. Lessttention has been paid towards the effects of other types of IPRsnd the growth-enhancing capacity of imitative innovation.
Future research could explore other national case studies (sayther developing countries in Asia or Latin America) to examineheir experiences with the different types of IPRs, such as utility
odels, industrial designs, trade secrets, copyrights, or trademarks.econdly, it would be useful to investigate the issues by sector; forxample, agriculture, electronics, and machinery.
cknowledgements
We would like to thank the editor and two anonymous refereesor very constructive comments. We also thank seminar partici-ants at the U.S. International Trade Commission, Washington, DC,ovember 2010, and conference participants at the Internationalconomic Association, Beijing, July 4–8, 2011, for their feedback.eun Lee and Kineung Choo gratefully acknowledge a Nationalesearch Foundation of Korea Grant funded by the Korean Gov-
rnment (NRF-2010-330-B00093). Part of this paper was writtenhile Yee Kyoung Kim was a visiting scholar at the Department ofconomics, American University during 2007–2008. She thanks theepartment of Economics for its hospitality.
cy 41 (2012) 358– 375
Appendix A. Data sources
Symbols used Variable and sources
Country-level data Firm-level data
Y/N GDP per capita in purchasing powerparity constant 2000 internationaldollars. World Bank, WorldDevelopment Indicators
Sales, in constant1995 Korean WonLee et al. (2007,2008)
N, n Total population and populationgrowth. World Bank, WorldDevelopment Indicators and StatisticalYearbook of the Republic of China,Government of Taiwan
P U.S. Patent GrantsU.S. Patent and Trademark Office,www.uspto.gov
Patent applicationsby Korean firms.Korea IntellectualProperty RightsInformationSystem (KIPRIS),www.kipris.or.kr
U Utility model applications. WorldIntellectual Property Office, Geneva,Industrial Property Statistics, variousissues
Utility modelapplications byKorean firms.Korea IntellectualProperty RightsInformationSystem (KIPRIS),www.kipris.or.kr
� Gross capital formation as a % of GDP.World Bank, World DevelopmentIndicators
Change in fixedassets as apercentage of totalassetsLee et al. (2007,2008)
R Research and developmentexpenditures as a % of GDP. UNESCOStatistical Yearbook (Paris, France) andStatistical Yearbook of the Republic ofChina, Government of Taiwan
Research anddevelopmentexpenditures, inconstant 1995Korean WonLee et al. (2007,2008)
IPR, UML Index of patent rights and utility modellawsPark (2008) and Greene (2010)
O Index of freedom to tradeinternationally, aggregating measuresof restraints that affect internationalexchange: (1) taxes on internationaltrade, (2) regulatory trade barriers, (3)size of the trade sector relative toexpected, (4) black-market exchangerates and (5) international capitalmarket controls. Fraser Institute,Economic Freedom of the World,Vancouver, Canada
h, � Secondary school enrollment (% ofgross). This ratio is the total suchenrollment, regardless of age, to thepopulation of the age group thatofficially corresponds to the level ofsecondary educationHerrera and Pang (2005), Barro and Lee(2001)Working age population (15–64 years).World Bank, World DevelopmentIndicatorsNumber of PhDs in science andengineering from US universities.National Science Foundation Scienceand Engineering Indicators,Washington, DC
Other Legal originsLa Porta et al. (2008)
Number ofemployeesLee et al. (2007,
2008)
h Poli
R
A
A
A
A
B
B
BB
B
B
B
C
C
C
C
C
E
E
E
F
F
G
G
G
G
G
H
H
Y.K. Kim et al. / Researc
eferences
cemoglu, D., Johnson, S., Robinson, J., 2001. The colonial origins of compara-tive development: an empirical investigation. American Economic Review 91,1369–1401.
dams, J., Clemmons, R., 2008. The origins of scientific discoveries. National Bureauof Economic Research Working Paper No. 13823, Cambridge, MA.
ghion, P., Harris, C., Howitt, P., Vickers, J., 2001. Competition, imitation, and growthwith step-by-step innovation. Review of Economic Studies 68, 467–492.
rellano, M., Bond, S., 1991. Some tests of specification for panel data: Monte Carloevidence and an application to employment equations. Review of EconomicStudies 58, 277–297.
arro, R.J., Lee, J., 2001. International data on educational attainment: updates andimplications. Oxford Economic Papers 3, 541–563.
eneito, P., 2006. The innovative performance of in-house and contracted R&D interms of patents and utility models. Research Policy 35, 502–517.
ently, L., Sherman, B., 2001. Intellectual Property Law. Oxford University Press.loom, N., Griffith, R., van Reenan, J., 2002. Do R&D tax credits work? Evidence from
a panel of countries 1979–1997. Journal of Public Economics 85, 1–31.lundell, R., Bond, S., 1998. Initial conditions and moment restrictions in dynamic
panel data models. Journal of Econometrics 87, 115–143.ond, S., 2002. Dynamic panel data models: a guide to micro data methods and
practice. Portuguese Economic Journal 1, 141–162.osch, M., Lederman, D., Maloney, W., 2005. Patenting and research and develop-
ment: a global view. World Bank Policy Research Working Paper No. 3739.aselli, F., Esquivel, G., Lefort, F., 1996. Reopening the convergence debate: a new
look at cross-country growth empirics. Journal of Economic Growth 1, 363–389.hen, Y., Puttitanun, T., 2005. Intellectual property rights and innovation in devel-
oping countries. Journal of Development Economics 78, 474–498.ohen, W., Nelson, R., Walsh, J., 2000. Protecting their intellectual assets: appropri-
ability conditions and why U.S. manufacturing firms patent (or not). NationalBureau of Economics Research Working Paper No. 7552, Cambridge, MA.
ommission on Intellectual Property Rights, 2002. Integrating Intellectual Prop-erty Rights and Development Policy, London. http://www.iprcommission.org/graphic/documents/final report.htm.
orrea, C., 2000. Intellectual Property Rights, the WTO, and Developing Countries.ZED Books, London.
rnst, H., 2001. Patent applications and subsequent changes of performance: evi-dence from time-series cross-section analyses on the firm level. Research Policy30, 143–157.
vans, D.S., 1987. Tests of alternative theories of firm growth. Journal of PoliticalEconomy 95 (4), 657–674.
venson, R., Westphal, L., 1995. Technological change and technology strategy. In:Behrman, J., Srinivasan, T.N. (Eds.), Handbook of Development Economics, vol.3A. North-Holland, Amsterdam, pp. 2209–2299.
alvey, R., Foster, N., Greenaway, D., 2006. Intellectual property rights and economicgrowth. Review of Development Economics 10, 700–719.
ink, C., Maskus, K. (Eds.), 2005. Intellectual Property and Development. World Bank,Washington, DC.
eroski, P.A., Machin, S., 1993. Innovation, profitability and growth over the businesscycle. Empirica 20, 35–50.
eroski, P.A., Machin, S., Van Reenen, J., 1993. The profitability of innovating firms.Rand Journal of Economics 24 (2), 198–211.
ould, D.M., Gruben, W., 1996. The role of intellectual property rights in economicgrowth. Journal of Development Economics 48, 323–350.
ranstrand, O., 1999. The Economics and Management of Intellectual Property.Edward Elgar, Cheltenham, UK.
reene, A.M. (Ed.), 2010. Designs and Utility Models Throughout the World. Thom-son Reuters.
ausman, J., Hall, B., Griliches, Z., 1984. Econometric models for count data with anapplication to the patents–R&D relationship. Econometrica 52 (4), 909–938.
errera, S., Pang, G., 2005. Efficiency of public spending in developing countries:an efficiency frontier approach. Policy Research Working Paper Series No. 3645,World Bank.
cy 41 (2012) 358– 375 375
Jovanovic, B., 1982. Selection and evolution of industry. Econometrica 50, 649–670.
Kanwar, S., Evenson, R., 2003. Does intellectual property protection spur technolog-ical change? Oxford Economic Papers 55, 235–264.
Kim, L., 1997. Imitation to Innovation: The Dynamics of Korea’s Technological Learn-ing. Harvard Business School Press, Boston.
Kumar, J., 2002. Intellectual property rights, technology, and economic develop-ment: experiences of Asian countries. Research and Information System for theNon-Aligned and Other Developing Countries Discussion Paper No. 25.
Lall, S., Albaladejo, M., 2001. Indicators of the relative importance of IPRs in devel-oping countries. A paper commissioned by ICTSD/UNCTAD.
Lanjouw, J.O., Lerner, J., 1996. Preliminary injunctive relief: theory and evidencefrom patent litigation. National Bureau of Economic Research Working PaperNo. 5689, Cambridge, MA.
La Porta, R., Lopez-de-Silanes, F., Shleifer, A., 2008. Economic consequences of legalorigins. Journal of Economic Literature 46 (2), 285–332.
Lee, K., Kim, B.Y., 2009. Both institutions and policies matter but differently at dif-ferent income groups of countries: determinant of long-run economic growthrevisited. World Development 37 (3), 533–549.
Lee, K., Kim, Y.K., 2010. IPR and technological catch-up in Korea. In: Odagiri, H., Goto,A., Sunami, A., Nelson, R. (Eds.), Intellectual Property Rights, Development andCatch-up. Oxford University Press, London.
Lee, K., Park, D., Lim, C., 2003. Industrial property rights and technological develop-ment in the Republic of Korea. WIPO Policy Monograph, April, Geneva.
Lee, K., et al., 2007. Evolution of the Firms in Korea since 1945, Vol. I: Construction ofthe Database for the 1976–2005 Period and Descriptive Analysis. Seoul NationalUniversity Press, Seoul (in Korean).
Lee, K., et al., 2008. Evolution of the Firms in Korea since 1945, Vol. II: Construction ofthe Database for the 1956–1977 Period and Descriptive Analysis. Seoul NationalUniversity Press, Seoul (in Korean).
Lerner, J., 1995. Patenting in the shadow of competitors. Journal of Law and Eco-nomics 38, 563–595.
Mankiw, G., Romer, D., Weil, D., 1992. A contribution to the empirics of economicgrowth. Quarterly Journal of Economics 107, 407–437.
Maskus, K., McDaniel, C., 1999. Impacts of the Japanese patent system on produc-tivity growth. Japan and the World Economy 11, 557–574.
Mazzoleni, R., Nelson, R., 1998. The benefits and costs of strong patent protection: acontribution to the current debate. Research Policy 27, 273–284.
Nelson, R., Phelps, E., 1966. Investment in humans, technological diffusion, andeconomic growth. American Economic Review 56, 59–75.
Nickell, S., 1981. Biases in dynamic models with fixed effects. Econometrica 49,1417–1426.
Pakes, A., Griliches, Z., 1980. Patents and R&D at the firm level: a first report. Eco-nomics Letters 5, 377–381.
Park, W., 2008. International patent protection: 1960–2005. Research Policy 37,761–766.
Park, W., Ginarte, J., 1997. Intellectual property rights and economic growth. Con-temporary Economic Policy 15, 51–61.
Schneider, P., 2005. International trade, economic growth, and intellectual propertyrights: a panel data study of developed and developing countries. Journal ofDevelopment Economics 78, 529–547.
Suthersanen, U., 2006. Utility models and innovation in developing countries. TheInternational Centre for Trade and Sustainable Development Issue Paper 13,UNCTAD.
Thompson, M., Rushing, F., 1999. Empirical analysis of the impact of patent protec-tion on economic growth: an extension. Journal of Economic Development 24,67–76.
USPTO, 2009. Patent Statistics Reports: 2009, Available at www.uspto.gov/web/offices/ac/ido/oeip/taf/tafp.html.
Varsakelis, N., 2001. The impact of patent protection, openness, and national cultureon R&D investment: a cross-country empirical investigation. Research Policy 30,1059–1068.
World Bank, 2002. Global Economic Prospects and Developing Countries. OxfordUniversity Press, New York.