approximate function for heavy water properties computation-durmayaz
DESCRIPTION
Heavy water propertiesTRANSCRIPT
Nuclear Engineering and Design 178 (1997) 309–329
Approximate functions for the fast computation of thethermodynamic properties of heavy water
Ahmet Durmayaz *Institute for Nuclear Energy, Istanbul Technical Uni6ersity, Maslak, Istanbul TR-80626, Turkey
Abstract
A set of some approximate functions derived for the fast computation of the thermodynamic properties of heavywater at saturation, in subcooled liquid and superheated vapor states is presented. To derive these functions, the datagiven in the steam tables by Hill et al. AECL 7531 (1981) were accurately and successfully fitted with curves by usingthe least-squares method. Specific volume (or density), specific enthalpy, specific entropy, constant-pressure specificheat and temperature at saturation were approximated by a number of piecewise continuous functions of pressurewhereas pressure at saturation was approximated by a piecewise continuous function of temperature for heavy water.Density in subcooled liquid state, specific volume in superheated vapor state, specific enthalpy, specific entropy andconstant-pressure specific heat in both of these states were also approximated as piecewise continuous functions ofpressure and temperature for heavy water. The correlations presented in this study can be used in the two-phasethermalhydraulic system analysis of CANDU-PHW reactor with confidence. © 1997 Elsevier Science S.A.
1. Introduction
The fast, accurate and efficient generation ofthe thermodynamic properties of heavy water atsaturation, in subcooled liquid and superheatedvapor states is of importance for the design, engi-neering applications and LOCA analysis with thetwo-phase flow models of nuclear reactors thatare cooled and/or moderated by heavy water. Thethermodynamic properties used in these analysesare generally calculated by proper interpolationmethods (linear, hermitian, etc.) applied to thethermodynamic tables which are stored in com-puter memory. These interpolation methods re-
quire a search algorithm to select the properthermodynamic values from the tables in additionto inputting a large amount of data. Hence, theuse of the interpolation algorithms requires con-siderably large computer CPU time. As an exam-ple of using the interpolation polynomials for thispurpose, the thermodynamic properties of heavywater (D2O) were approximated by piecewise Her-mite interpolation polynomials in the CATHENAcode. A more complete description of this code(formerly called ATHENA) can be seen inRichards et al. (1985). Additionally, a descriptionof the piecewise Hermite interpolation polynomi-als used in the code cited above can be found inLiner et al. (1988).
The values of the thermodynamic propertieslisted in the tables for heavy water by Hill et al.
* Fax: +90 212 2853884; e-mail: [email protected]
0029-5493/97/$17.00 © 1997 Elsevier Science S.A. All rights reserved.
PII S0029 -5493 (97 )00235 -5
A. Durmayaz / Nuclear Engineering and Design 178 (1997) 309–329310
(1981) were generated from the Helmholtz freeenergy function which is an analytic equation ofstate. The use of the Helmholtz free energy func-tion for this purpose was also given by Kestin etal. (1984), by Kestin and Sengers (1986), and byHill et al. (1982). Equations for all thermody-namic properties can be generated by using thecombinations of appropriate derivatives of thisfunction. The formulation set given by these refer-ences, was also given provisional acceptance byIAPS. However, it is very important that thethermodynamic properties and their derivativesbased on the Helmholtz free energy function forheavy water in subcooled liquid and superheatedvapor states are given as functions of two inde-pendent variables, namely density and tempera-ture, which are different from the independentvariables used in the thermalhydraulic systemanalysis in two-phase flows. Therefore, such kindof formulation set is inappropriate for the two-phase flow analysis.
An alternative choice is to use approximatefunctions for the fast computation of the thermo-dynamic properties. Such kind of functions devel-oped for light water at saturation were given byGarland and Hoskins (1988) and for light waterin subcooled liquid and superheated vapor stateswere given by Garland and Hand (1989).
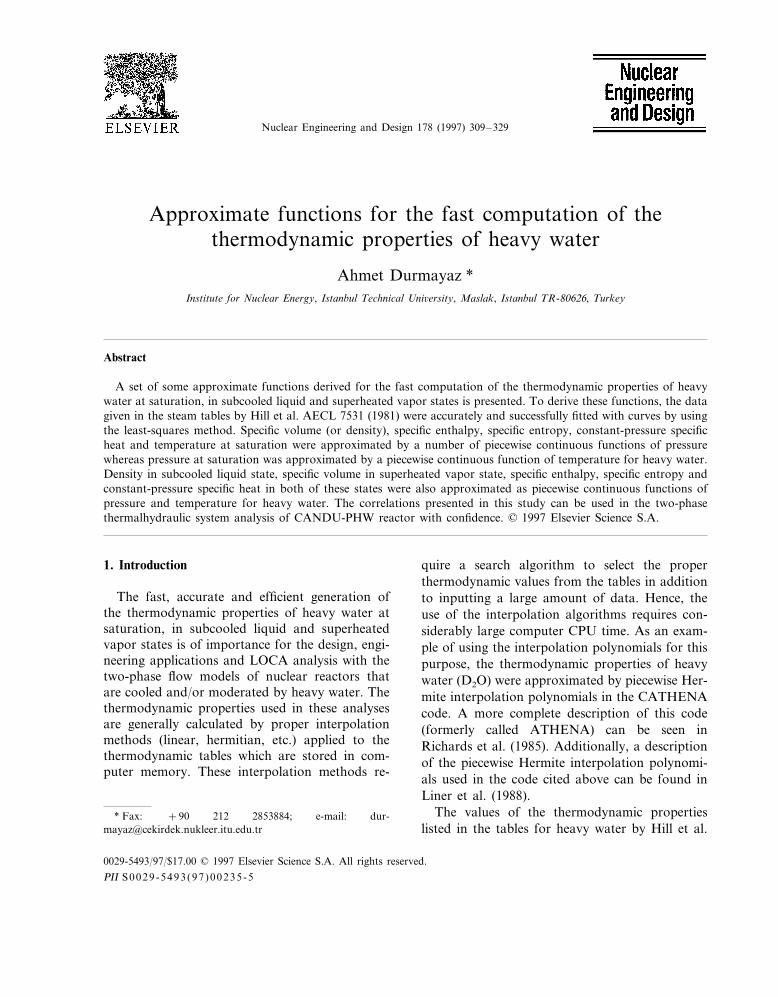
Fig. 2. Density and its derivative with respect to saturationpressure for gas phase at saturation.
In this study, a set of approximate functions forthe fast computation of the thermodynamic prop-erties of heavy water at saturation, in subcooledliquid and superheated vapor states is presented.This set of functions was derived by Durmayaz(1995) to use in the LOCA analysis for the nearstagnation flow in the fuel channel of a CANDUreactor following a postulated small break in theinlet feeder. Detailed information is given belowabout the approximation method, which was alsoused by Garland and Hoskins (1988) and by
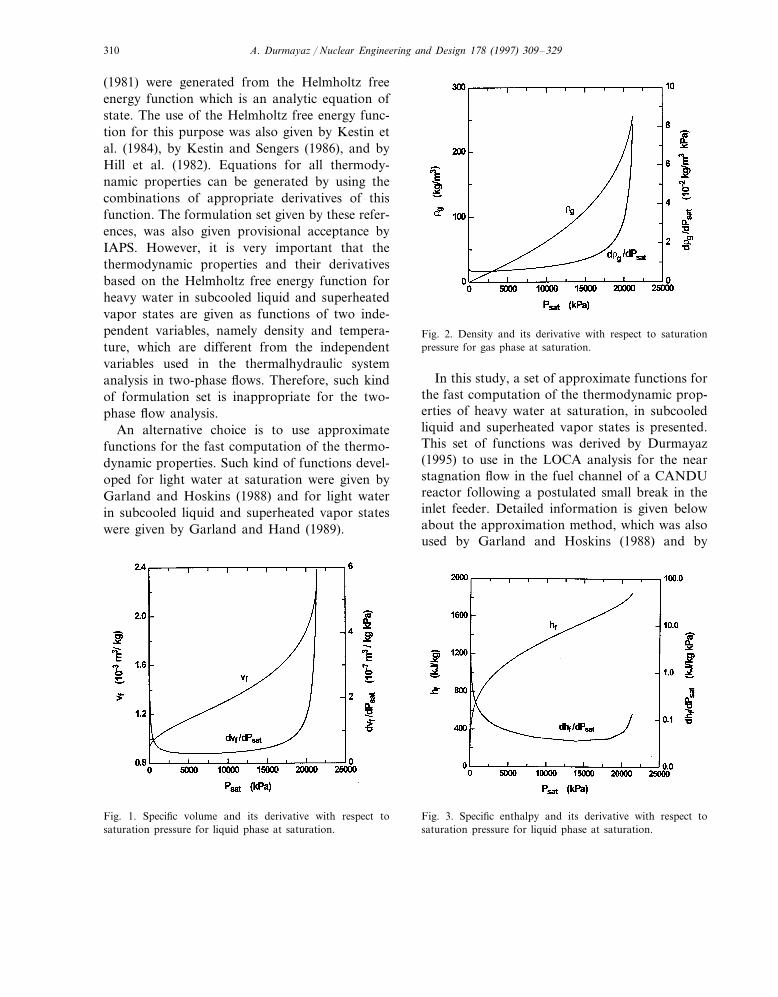
Fig. 1. Specific volume and its derivative with respect tosaturation pressure for liquid phase at saturation.
Fig. 3. Specific enthalpy and its derivative with respect tosaturation pressure for liquid phase at saturation.

A. Durmayaz / Nuclear Engineering and Design 178 (1997) 309–329 311
Fig. 4. Specific enthalpy and its derivative with respect tosaturation pressure for gas phase at saturation. Fig. 6. Specific entropy and its derivative with respect to
saturation pressure for gas phase at saturation.
Garland and Hand (1989), and about the set offormulation.
2. Approximation method
The data given in the steam tables by Hill et al.(1981) for the thermodynamic properties of heavywater at saturation, in subcooled liquid and su-perheated vapor states were accurately and suc-cessfully fitted with curves by using the
least-squares method in order to obtain someappropriate functions. The approach used in de-veloping these correlations is to minimize the sumof the squares of the deviations from the datagiven in the reference steam tables. During thecurve fitting operations, the pressure or tempera-ture range for each of the properties at saturationand the pressure-temperature ranges for each ofthe properties in single-phase liquid or vapor
Fig. 7. Constant-pressure specific heat and its derivative withrespect to saturation pressure for liquid phase at saturation.
Fig. 5. Specific entropy and its derivative with respect tosaturation pressure for liquid phase at saturation.

A. Durmayaz / Nuclear Engineering and Design 178 (1997) 309–329312
Tab
le1
Coe
ffici
ents
and
expo
nent
sus
edin
Eq.
(7)
for6 f
for
diff
eren
tra
nges
ofus
e
bc
a 0e
a 1R
ange
ofus
e(k
Pa)
a 2a 3
a 4a 5
0.0
0.0
0.0
0.66
015
Psa
tB2.
02.
8120
7×10
−6
−3.
2891
4×10
−7
−9.
7302
9×10
−6
1.73
177×
10−
5−
1.53
382×
10−
59.
0947
2×−
4
2.59
83×
10−
10
3.91
703×
10−
12
0.0
0.0
0.0
2.05
Psa
tB10
.08.
0453
5×10
−7
9.02
885×
10−
46.
8869
2×10
−8
−8.
9194
2×10
−9
0.0
0.0
0.0
10.05
Psa
t546
.09.
1823
9×10
−1
41.
2555
6×10
−6
9.02
33×
10−
4−
1.46
553×
10−
11
9.85
586×
10−
10
−3.
8373
2×10
−8
0.0
0.0
0.0
7.28
531×
10−
60.
4086
46.0B
Psa
t545
00.
00.
00.
08.
9331
1×10
−4
0.0
9.10
067×
10−
43.
3377
6×10
−6
0.0
0.50
2345
0BP
satB
1500
0.0
0.0
0.0
0.0
0.0
0.0
0.0
15005
Psa
t545
002.
2574
6×10
−2
39.
5447
1×10
−4
−4.
5584
2×10
−1
93.
8641
4×10
−1
5−
1.79
758×
10−
11
7.77
743×
10−
8
0.0
0.0
0.0
4500B
Psa
t515
000
9.82
43×
10−
44.
6682
7×10
−8
−3.
4232
4×10
−1
23.
2632
4×10
−1
6−
1.52
425×
10−
20
3.49
64×
10−
25
0.0
0.0
0.0
1500
0BP
sat5
1690
00.
0−
1.53
85×
10−
40.
04.
354×
10−
16
−1.
73×
10−
11
2.72
3×10
−7
0.0
−7.
6062
1×10
−6
0.0
0.0
0.0
1690
0BP
satB
1900
06.
6377
×10
−1
0−
2.57
563×
10−
14
3.78
083×
10−
19
0.03
4053
5918
990
0.0
0.0
1900
05P
sat5
2020
02.
6041
7×10
−2
11.
1393
7×10
−1
11.
7653
4×10
−3
9.60
015×
10−
8−
6.04
877×
10−
18
1.07
981×
10−
14
8.46
354×
10−
20
1.63
387×
10−
720
190
0.0
0.0
2020
0BP
sat5
2140
0−
1.69
935×
10−
11
1.80
208×
10−
13
−1.
7314
7×10
−1
61.
9094
195×
10−
3

A. Durmayaz / Nuclear Engineering and Design 178 (1997) 309–329 313
Tab
le2
Coe
ffici
ents
and
expo
nent
sus
edin
Eq.
(8)
for
rg
for
diff
eren
tra
nges
ofus
e
a 4a 5
bc
eR
ange
ofus
e(k
Pa)
a 2a 0
a 3a 1
0.0
−3.
2994
×10
−5
8.55
78×
10−
30.
00.
9459
0.66
015
Psa
t52.
00.
00.
00.
00.
00.
08.
6254
6×10
−3
0.94
162.
0BP
sat5
7.5
0.0
0.0
−1.
1532
4×10
−4
0.0
0.0
0.0
0.0
0.0
0.0
8.76
874×
10−
30.
9365
7.5B
Psa
t550
.00.
00.
00.
0−
4.85
16×
10−
4
0.0
0.0
0.0
8.67
814×
10−
30.
9382
50.0B
Psa
tB25
08.
73×
10−
40.
00.
00.
00.
08.
0415
4×10
−3
0.94
9825
05P
sat5
500
0.0
0.0
0.0
0.01
9659
80.
00.
00.
00.
00.
06.
9825
2×10
−3
0.96
9150
0BP
sat5
1000
0.0
0.0
0.0
0.08
1991
40.
00.
00.
05.
2152
1×10
−3
1.00
5710
00B
Psa
tB19
500.
00.
00.
00.
2991
30.
03.
3858
1×10
−3
1.05
632
19505
Psa
t530
000.
00.
8026
150.
00.
00.
00.
00.
00.
00.
01.
6995
2×10
−3
1.13
3330
00B
Psa
tB48
001.
9264
20.
00.
00.
00.
06.
256×
10−
41.
2407
48005
Psa
tB65
000.
00.
04.
081
0.0
0.0
0.0
0.0
0.0
0.0
1.84
6×10
−4
1.36
8765
005
Psa
t583
000.
00.
00.
07.
1843
0.0
3.02
275×
10−
51.
5549
8300B
Psa
tB10
400
12.3
5935
0.0
0.0
0.0
0.0
0.0
0.0
2.55
289×
10−
61.
8059
1040
05P
satB
1240
00.
00.
019
.779
160.
00.
00.
00.
00.
00.
07.
4047
4×10
−8
2.16
2312
4005
Psa
tB14
400
0.0
0.0
0.0
30.2
155
0.0
0.0
0.0
5.84
747×
10−
10
2.64
714
4005
Psa
t515
900
43.4
059
0.0
0.0
0.0
0.0
0.0
0.0
1590
0BP
satB
1820
01.
9075
3×10
−1
96.
7764
4×10
−1
13.
9176
1×10
−7
6.22
×10
−3
7.76
793×
10−
9−
6.95
623×
10−
15
0.0
0.01
8561
418
190
0.0
0.0
1820
05P
sat5
2000
02.
0115
2×10
−6
1.03
421×
10−
10
1.95
229×
10−
13
155.
798
−4.
446×
10−
11
1.74
657×
10−
14
1999
00.
00.
020
000B
Psa
t521
200
198.
348
0.03
3670
7−
8.96
932×
10−
64.
4850
1×10
−8

A. Durmayaz / Nuclear Engineering and Design 178 (1997) 309–329314
Fig. 8. Constant-pressure specific heat and its derivative withrespect to saturation pressure for gas phase at saturation.
Error=100)Fapp−Fref
Fref
)(%) (1)
while Fapp is the value of any thermodynamicproperty calculated by using the approximationfunctions and Fref is the value of the same prop-erty seen in the reference steam tables.
2.1. Properties at saturation
The properties at saturation can be representedby a number of functions containing only oneindependent variable: pressure or temperature. Inthis study, specific volume (or density), specificenthalpy, specific entropy, constant-pressure spe-cific heat and temperature at saturation were ap-proximated by a number of piecewise continuousfunctions of pressure whereas pressure at satura-tion was approximated by a piecewise continuousfunction of temperature for heavy water.
Some of these properties obtained by piecewisecontinuous functions and their derivatives withrespect to pressure are plotted in Figs. 1–9. It caneasily be seen that each of these functions andtheir derivatives gives a smooth continuous curve.
2.2. Subcooled liquid state
In subcooled liquid state, density, specific en-thalpy, specific entropy and constant-pressure spe-cific heat were approximated by some piecewisecontinuous functions of pressure and temperature.If pressure and specific enthalpy are considered asthe independent variables, first, temperature iscomputed from the specific enthalpy correlation,Eqs. (18) and (18a), in subcooled liquid state byusing root finding algorithms such as NewtonRaphson or Regula Falsi methods. Then, theother properties are computed by using pressureand temperature as the independent variables.The method to derive the approximation func-tions in subcooled liquid state is given in detailbelow.
Consider an arbitrary thermodynamic propertyF=F(P, T) for heavy water in subcooled liquidstate and expand it into a Taylor series. The firsttwo terms of the Taylor expansion of F in pres-sure about the saturation point corresponding tothe temperature T are:
states were divided into several subregions toobtain higher accuracy since it was observed thatany given property could not be fitted accuratelyover the entire range with a single function. Spe-cial care was also taken to ensure that the slopesof the fitted curves are continuous across theboundaries since discontinuities in the slopes cancause undue distortions at the boundaries of thesubregions.
The error for each approximate function is alsodefined as:
Fig. 9. Saturation temperature and its derivative with respectto saturation pressure.

A. Durmayaz / Nuclear Engineering and Design 178 (1997) 309–329 315
Table 3Coefficients and exponents used in Eq. (9) for hf for different ranges of use
a0 fa1 a2 c e Range of use (kPa)
0.6601BPsatB2.40.00.0−463.1372 0.00.1246487.73680.0 0.0 474.3497−449.6439 0.1277 0.0 2.45Psat56.5
−405.974 0.0 0.0 431.97675 0.1375 0.0 6.5BPsatB24245Psat5600.00.15091377.364−346.8479 0.00.0
0.0 0.0 318.12035 60BPsat51500.167315 0.0−277.930.0 0.0 246.077 150BPsat54000.1914 0.0−184.2785
−74.8603 0.0 0.0 175.094 0.2228 0.0 400BPsat59000.0 0.0 102.40472.2187 0.2717 0.0 900BPsat53000
353.2485 0.0 3000BPsatB85000.00.390827.19280.0721.6373 0.0 85005Psat513 7000.64641.63160.00.0
0.0 1.41484.834×10−4 0.01148.3684 0.0 13 700BPsatB18 6004.465691.492×10−170.0 0.00.0 18 6005Psat520 2001506.2541
−4886805.5 −57.0067 7.01378×10⁻⁴ 0.0 0.0 580415.0 20 200BPsat521 400
F(P, T)=Ff(T)+(F(P
)T
[P−Psat(T)]. (2)
Since properties at saturation, Ff(T), presentedin Section 3 were approximated as functions ofpressure rather than temperature, the temperatureT in the first term of Eq. (2) will have to bechanged to its corresponding saturation pressure,Psat, by using Eq. (16). Therefore Eq. (2) becomes:
F(P, T)=Ff(Psat(T))+(F(P
)T
[P−Psat(T)]. (3)
In subcooled liquid state, the thermodynamicproperties are strong functions of temperaturewhereas they are weak functions of pressure.Therefore the derivative of the function F withrespect to pressure will be a slowly varying, al-most constant function. Hence, Eq. (3) can berearranged to give:
R(T)=(F(P
)T
=F−Ff
P−Psat
. (4)
For a given temperature, this derivative wascalculated over each of the subdivided ranges andthen averaged. The resulting averages were fittedwith functions of temperature.
2.3. Superheated 6apor state
In superheated vapor state, the thermodynamic
properties may vary strongly with both pressureand temperature. Consider again an arbitrarythermodynamic property F=F(P, T), then ex-pand it into a Taylor series. The first two terms ofthe Taylor expansion of F in temperature aboutthe saturated vapor point corresponding to thepressure P are:
F(P, T)=Fg(P)+(F(T
)P
[T−Tsat(P)]. (5)
Since the derivative is a sensitive function ofboth pressure and temperature, Eq. (5) can berearranged to give:
R(P, T)=(F(T
)P
=F−Fg
T−Tsat
. (6)
This derivative was evaluated and fitted withsome functions of pressure and temperature. It isdifficult to fit this derivative since R(P, T) is afunction of two independent variables.
The reason for using Eqs. (2) and (5) is that thefirst terms in each of these equations are thedominant terms, which were fitted very accuratelyat saturation, and errors in the fitting of R(T) inEq. (4) and R(P, T) in Eq. (6) will not be as largeas they would if these properties were fitted di-rectly, without reference to the value of the satu-ration properties.
A. Durmayaz / Nuclear Engineering and Design 178 (1997) 309–329316
Tab
le4
Coe
ffici
ents
and
expo
nent
sus
edin
Eq.
(10)
for
h gfo
rdi
ffer
ent
rang
esof
use
cd
a 0e
a 1R
ange
ofus
e(k
Pa)
a 2a 3
a 4b
168.
6551
0.05
0.13
740.
6601B
Psa
t510
0.0
0.0
0.0
0.0
0.0
2166
.013
1.96
7122
11.1
156
1.0
0.0
0.15
6210B
Psa
tB50
0.0
0.0
0.0
0.0
299.
5196
1.0
0.08
93505
Psa
t516
00.
00.
020
29.3
920.
00.
00.
013
890.
05.
00.
0029
5116
0BP
satB
500
1159
7.97
40.
00.
00.
00.
00.
080
.293
20.
00.
250
05P
satB
1000
0.0
2284
.995
0.0
0.0
0.0
−0.
0293
0.0
0.0
73.2
730.
00.
210
005
Psa
tB30
0023
07.7
9186
50.
0−
0.02
410.
063
.256
60.
00.
2130
005
Psa
tB50
000.
023
29.0
0.0
0.0
0.0
−0.
0233
204
0.0
0.0
0.0
50005
Psa
t510
500
2582
.395
650.
0143
079
−3.
3696
9×10
−6
1.96
082×
10−
10
−5.
5558
4×10
−1
50.
00.
00.
00.
010
500B
Psa
tB16
000
0.0
2689
.69
0.0
−4.
7783
1×10
−1
18.
7408
9×10
−7
−0.
0200
070.
0−
0.24
5479
0.0
0.0
0.0
1600
05P
sat5
1880
01.
4809
7×10
−5
−3.
3553
×10
−1
00.
039
08.3
009
0.0
0.0
0.0
1880
0BP
sat5
2040
00.
01.
4764
×10
−4
1988
1.20
41−
2.76
788
0.0
−2.
6681
2×10
−9
2039
0−
0.07
2497
60.
00.
00.
020
400B
Psa
t521
467
−4.
4964
5×10
−5
4.97
61×
10−
8−
4.38
706×
10−
11
2207
.595
A. Durmayaz / Nuclear Engineering and Design 178 (1997) 309–329 317
Tab
le5
Coe
ffici
ents
and
expo
nent
sus
edin
Eq.
(11)
for
s ffo
rdi
ffer
ent
rang
esof
use
bc 1
c 2e 1
a 0e 2
a 1R
ange
ofus
e(k
Pa)
a 2a 3
a 4a 5
0.0
0.0
0.0
0.0
0.0
−0.
1229
850.
66015
Psa
tB1.
80.
0159
342
0.39
8931
−0.
7185
470.
8674
39−
0.35
2894
0.0
0.0
0.0
−0.
0198
780.
00.
0198
273
0.0
1.85
Psa
t53.
00.
1837
48−
0.10
5636
0.02
5212
5−
2.26
244×
10−
3
0.0
2.66
210.
00.
0815
0.0
0.0
3.0B
Psa
t515
1.54
8×10
−7
−2.
5720
39−
2.34
7×10
−3
1.61
1×10
−4
−7.
631×
10−
6
0.0
0.48
71−
13.8
068
0.16
66−
0.01
13.4
0375
415B
Psa
t585
0.0
0.0
0.0
0.0
0.0
0.0
0.12
75−
20.2
062
0.26
45−
0.01
0.0
85B
Psa
tB33
020
.133
290.
00.
00.
00.
00.
01.
2869
0.0
0.12
8−
1.04
667
0.0
0.0
3305
Psa
t593
00.
00.
00.
00.
00.
00.
8106
0.0
0.16
150.
00.
093
0BP
sat5
2500
−0.
4043
20.
00.
00.
00.
00.
00.
3763
0.0
0.21
990.
00.
3614
225
00B
Psa
tB57
000.
00.
00.
00.
00.
00.
00.
00.
00.
00.
00.
057
005
Psa
t512
000
2.03
4696
−1.
7958
6×10
−1
78.
6763
7×10
−1
3−
1.71
232×
10−
82.
2136
×10
−4
0.0
0.0
0.0
0.0
0.0
1200
0BP
sat5
1720
02.
4522
548.
1057
2×10
−5
8.85
135×
10−
10
−1.
7870
6×10
−1
35.
2401
1×10
−1
80.
00.
00.
00.
00.
00.
00.
017
200B
Psa
t520
000
2.24
902×
10−
16
24.6
3978
7−
4.88
947×
10−
34.
1885
1×10
−7
−1.
5816
2×10
−1
1
2090
0.0
0.0
0.0
0.0
0.0
2000
0BP
sat5
2100
03.
9334
91.
2444
3×10
−4
5.21
091×
10−
83.
7846
7×10
−1
11.
4322
6×10
−1
40.
020
900.
00.
00.
00.
00.
021
000B
Psa
t521
600
0.0
3.94
149
−1.
4205
4×10
−5
1.25
436×
10−
12
−1.
5632
3×10
−9
7.86
877×
10−
7

A. Durmayaz / Nuclear Engineering and Design 178 (1997) 309–329318
Tab
le6
Coe
ffici
ents
and
expo
nent
sus
edin
Eq.
(12)
for
s gfo
rdi
ffer
ent
rang
esof
use
c 1c 2
c 3e 1
e 2a 0
e 3a 1
Ran
geof
use
(kP
a)a 2
a 3a 4
b
10.9
702
−1.
9693
0.0
−0.
048
−0.
10.
00.
00.
00.
66015
Psa
t530
.00.
00.
00.
0−
0.74
8064
0.0
0.0
1403
.587
96.
291
−67
2.09
16−
0.00
46−
0.1
−0.
0130
.0B
Psa
t530
00.
0−
729.
4911
0.0
0.0
7514
8.6
−72
55.5
10.
0−
0.00
01−
0.00
10.
00.
030
0BP
sat5
700
0.0
−67
885.
030.
00.
00.
00.
00.
042
.252
8−
5.24
151
0.0
−0.
015
−0.
10.
070
0BP
satB
1200
0.0
0.0
0.0
−29
.353
619
56.3
724
−9.
1127
90.
0−
0.01
5−
40.1
4351
9−
0.1
0.0
0.0
12005
Psa
t520
000.
00.
00.
00.
00.
00.
00.
00.
00.
00.
00.
020
00B
Psa
tB50
006.
4021
85.
8249
6×10
−16
−1.
0772
7×10
−11
8.17
719×
10−
8−
3.79
694×
10−
4
0.0
0.0
0.0
0.0
0.0
0.0
6.15
393
50005
Psa
tB11
000
−1.
7296
6×10
−4
1.48
637×
10−
8−
8.60
568×
10−
131.
9537
8×10
−17
0.0
0.0
0.0
0.0
0.0
0.0
0.0
0.0
1100
05P
sat5
1740
05.
7353
8−
8.93
649×
10−
183.
5207
4×10
−13
−4.
9467
2×10
−9
−2.
5837
2×10
−5
0.0
6.48
023×
10−
30.
00.
00.
00.
00.
00.
017
400B
Psa
tB20
000
−5.
5629
8×10
−7
2.11
454×
10−
11−
3.03
427×
10−
16−
23.0
8881
0.0
0.0
0.0
0.0
0.0
0.0
0.0
2000
05P
sat5
2100
04.
8644
8×10
−7
66.1
4712
3−
9.42
612×
10−
30.
0−
8.44
907×
10−
12
2055
0.0
−1.
6072
7×10
−4
0.0
0.0
0.0
0.0
0.0
0.0
2100
0BP
sat5
2146
70.
00.
0−
5.84
047×
10−
144.
5496
1
A. Durmayaz / Nuclear Engineering and Design 178 (1997) 309–329 319
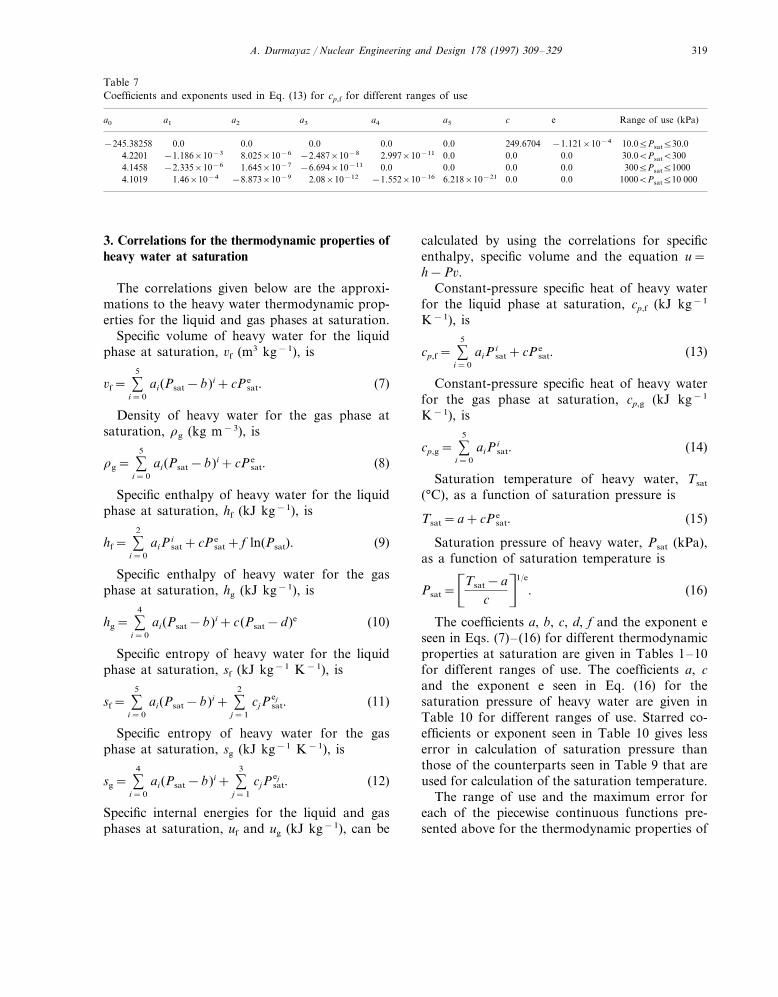
Table 7Coefficients and exponents used in Eq. (13) for cp,f for different ranges of use
a1a0 a2 ea3 a4 a5 c Range of use (kPa)
0.0 10.05Psat530.00.00.0−245.38258 −1.121×10−4249.67040.00.0−1.186×10⁻³ 8.025×10⁻⁶ −2.487×10⁻⁸ 2.997×10−114.2201 0.0 0.0 0.0 30.0BPsatB300
3005Psat510000.00.04.1458 0.0−2.335×10⁻⁶ 0.0−6.694×10−111.645×10⁻⁷
1000BPsat510 0000.02.08×10−124.1019 −8.873×10⁻⁹ 0.06.218×10−21−1.552×10−161.46×10⁻⁴
3. Correlations for the thermodynamic properties ofheavy water at saturation
The correlations given below are the approxi-mations to the heavy water thermodynamic prop-erties for the liquid and gas phases at saturation.
Specific volume of heavy water for the liquidphase at saturation, 6f (m3 kg−1), is
6f= %5
i=0
ai(Psat−b)i+cP esat. (7)
Density of heavy water for the gas phase atsaturation, rg (kg m−3), is
rg= %5
i=0
ai(Psat−b)i+cP esat. (8)
Specific enthalpy of heavy water for the liquidphase at saturation, hf (kJ kg−1), is
hf= %2
i=0
aiPisat+cP e
sat+ f ln(Psat). (9)
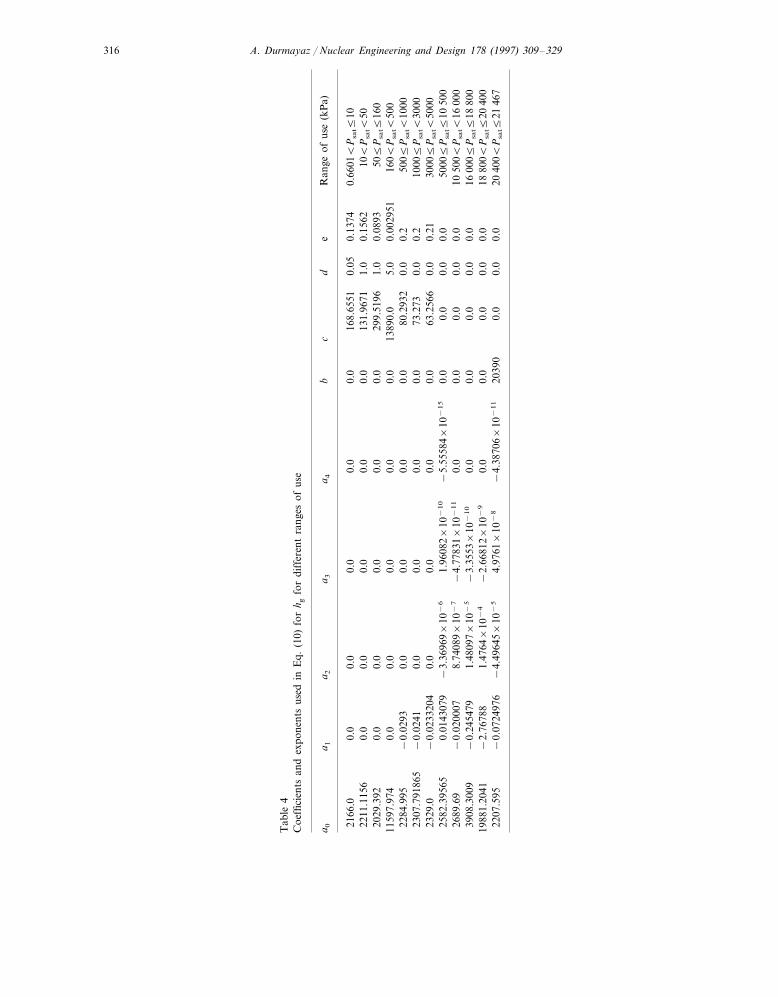
Specific enthalpy of heavy water for the gasphase at saturation, hg (kJ kg−1), is
hg= %4
i=0
ai(Psat−b)i+c(Psat−d)e (10)
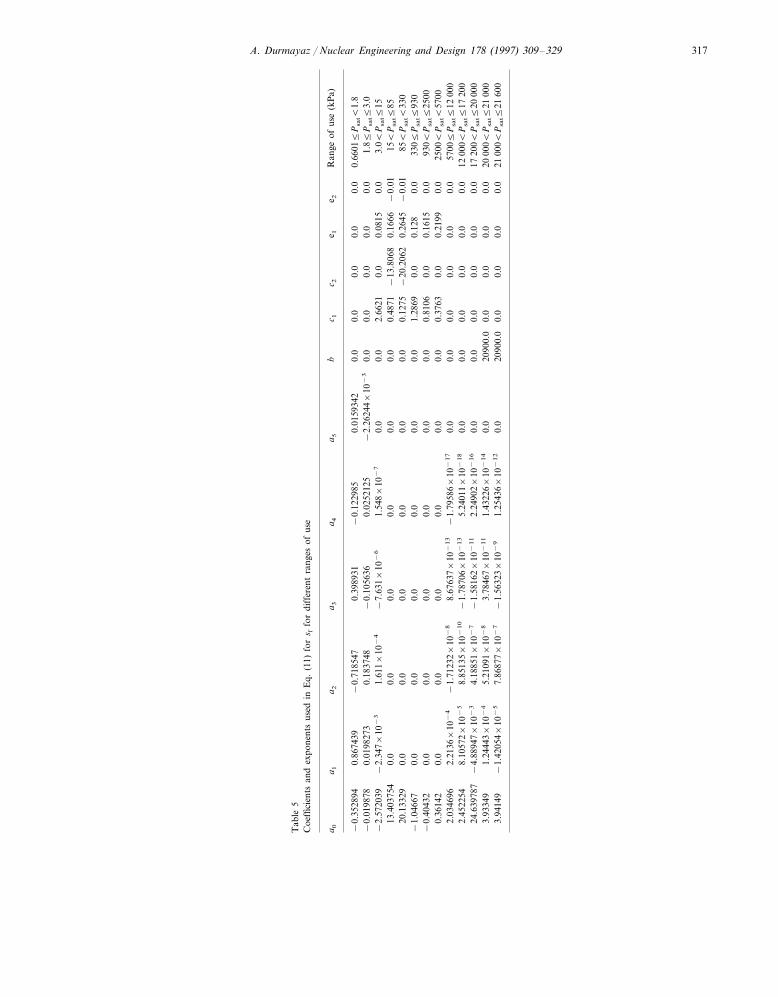
Specific entropy of heavy water for the liquidphase at saturation, sf (kJ kg−1 K−1), is
sf= %5
i=0
ai(Psat−b)i+ %2
j=1
cjPejsat. (11)
Specific entropy of heavy water for the gasphase at saturation, sg (kJ kg−1 K−1), is
sg= %4
i=0
ai(Psat−b)i+ %3
j=1
cjPejsat. (12)
Specific internal energies for the liquid and gasphases at saturation, uf and ug (kJ kg−1), can be
calculated by using the correlations for specificenthalpy, specific volume and the equation u=h−P6.
Constant-pressure specific heat of heavy waterfor the liquid phase at saturation, cp,f (kJ kg−1
K−1), is
cp,f= %5
i=0
aiPisat+cP e
sat. (13)
Constant-pressure specific heat of heavy waterfor the gas phase at saturation, cp,g (kJ kg−1
K−1), is
cp,g= %5
i=0
aiPisat. (14)
Saturation temperature of heavy water, Tsat
(°C), as a function of saturation pressure is
Tsat=a+cP esat. (15)
Saturation pressure of heavy water, Psat (kPa),as a function of saturation temperature is
Psat=�Tsat−a
cn1/e
. (16)
The coefficients a, b, c, d, f and the exponent eseen in Eqs. (7)–(16) for different thermodynamicproperties at saturation are given in Tables 1–10for different ranges of use. The coefficients a, cand the exponent e seen in Eq. (16) for thesaturation pressure of heavy water are given inTable 10 for different ranges of use. Starred co-efficients or exponent seen in Table 10 gives lesserror in calculation of saturation pressure thanthose of the counterparts seen in Table 9 that areused for calculation of the saturation temperature.
The range of use and the maximum error foreach of the piecewise continuous functions pre-sented above for the thermodynamic properties of

A. Durmayaz / Nuclear Engineering and Design 178 (1997) 309–329320
Table 8Coefficients and exponents used in Eq. (14) for cp,g for different ranges of use
a3 Range of use (kPa)a2a1a0 a5a4
0.01.7349 4.288×10⁻³ −6.287×10⁻⁵ 10.05Psat560.04.403×10−7 0.01.777275 1.7×10⁻³ −6.128×10⁻⁶ 1.832×10⁻⁸ −2.821×10⁻¹¹ 1.688×10⁻¹⁴ 60.0BPsat5400
2.163×10−181.8534 6.987×10⁻⁴ −2.457×10⁻⁷ 400BPsat510001.101×10−10 −2.477×10⁻¹⁴
1000BPsat510 0001.864×10−205.066×10⁻⁴ −4.975×10−161.9209 6.837×10⁻¹²−3.985×10⁻⁸
heavy water at saturation are given in Table 11. Asummary of the approximation functions for thefast computation of the thermodynamic proper-ties of light water at saturation derived by Gar-land and Hoskins (1988) is also given in Table 11in order to compare the ranges of use and theerror limits.
Comparison of the two correlation sets with theaid of Table 11 shows that the error limits of theapproximate functions presented in this study forthe thermodynamic properties of heavy water atsaturation are much less than those developed forlight water previously. Additionally, the ranges ofuse of the correlations for heavy water mostlybegin at 0.6601 kPa whereas the ranges of use ofthe functions for light water at saturation mostlybegin at 75 kPa.
4. Correlations for the thermodynamic propertiesof heavy water in subcooled liquid state
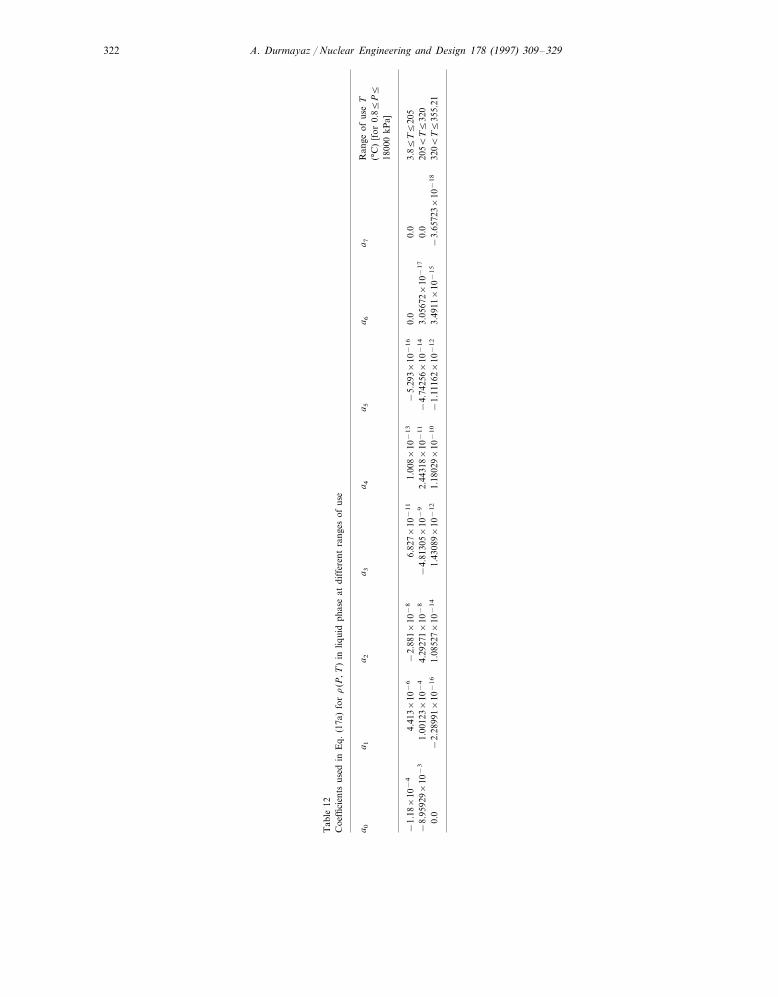
The correlations given below are the approxi-mations to the thermodynamic properties ofheavy water in subcooled liquid state when usedin conjunction with Eq. (16) for Psat. The coeffi-cients a, b and c seen in Eqs. (17a), (18a), (19a),(20) and (20a) for different thermodynamic prop-erties in subcooled liquid state are given in Tables12–15 for different ranges of use.
4.1. Density, liquid phase
The piecewise continuous function given belowis an approximation to the density, r (kg m−3), ofheavy water in subcooled liquid state in the tem-perature range of 3.8°C to Tsat and the pressure
Table 9Coefficients and exponents used in Eq. (15) for Tsat for differ-ent ranges of use
c Range of use (kPa)a e
122.399 0.1174−112.77175 0.66015PsatB1.10.1204 1.15PsatB2.4−109.6602 119.285
109.249 0.1303−99.56149 2.45Psat56.5−87.6554 97.6839 0.1424 6.5BPsatB23.0
84.9989 0.1567−73.9183 23.05PsatB60.073.64−60.649 0.1708 60.05Psat515061.5568 0.1877 150BPsat5400−45.0052
−30.1035 400BPsat590051.5347 0.2037900BPsatB14000.2114−22.8884 47.1923
40.0043−9.39078 0.2254 14005PsatB30000.2353 30005Psat585000.70657 35.4213
8500BPsat511 1000.2253−12.5021 40.49570.2105 11 100BPsatB13 700−35.812 49.76250.1812 13 7005Psat516 500−95.7685 76.4539
16 500BPsat521 6600.1051−420.0882 276.9554
Table 10Coefficients and exponents used in Eq. (16) for Psat for differ-ent ranges of use
ca Range of use (°C)e
3.85TsatB11.0−112.77175 122.399 0.117411.05TsatB22.890.1226*−107.3874* 117.01548*
0.1303 22.895Tsat539.86−99.5614* 109.24997.6839 0.1424−87.6554 39.86BTsatB65.01
−73.9183 84.9989 0.1567 65.015TsatB87.5487.545Tsat5112.650.170873.64−60.649
61.5568 0.1877−45.0052 112.65BTsat5144.530.2037 144.53BTsat5175.90−30.1035 51.5347
−22.8884 175.90BTsatB195.370.211447.19230.2254 195.375TsatB233.7540.0043−9.390780.2353 233.755Tsat5298.460.70657 35.4213
298.46BTsat5317.730.2253−12.5021 40.495749.7625 0.2105−35.812 317.73BTsatB333.7476.4539 0.1812−95.7685 333.745Tsat5348.46
348.46BTsat5370.74276.9554 0.1051−420.0875*

A. Durmayaz / Nuclear Engineering and Design 178 (1997) 309–329 321
Table 11Comparison of the approximation functions for the fast computation of the thermodynamic properties of heavy water at saturationpresented by this paper to those of light water at saturation derived by Garland and Hoskins (1988)
Light water at saturation by Garland and HoskinsHeavy water at saturation by DurmayazProperty(1988)
Range of use Psat (kPa), Tsat (°C) Maximum error, Maximum error, (%)Range of use Psat (kPa)(%)
0.66015Psat520 400 0.0086f 75–21 500 0.14020 400BPsat521 400 0.013
rg 0.66015Psat520 000 0.014 85–21 500 0.22020 000BPsat521 200 0.056
75–21 700hf 0.95Psat521 400 0.1000.0300.6601BPsat520 600 0.004hg 75–21 550 0.066
0.01620 600BPsat521 46765–21 2500.066 0.1200.66015PsatB3.0sf
3.05Psat521 600 0.00925–21 500sg 0.66015Psat520 400 0.002 0.100
0.01220 400BPsat521 46775–21 5000.029 0.0801.05Psat521 400uf
0.005 85–21 500 0.110ug 0.66015Psat520 80030–13 300cp,f 10.05Psat510 000 0.009 0.080
13 300–20 300 0.60010.05Psat510 000cp,g 0.018 50–16 000 0.120
16 000–20400 0.6000.048 0.0200.66015PsatB23.0 70–21 850Tsat
23.05Psat521 660 0.006Psat 3.85Tsat5370.74 0.032
The maximum error in the ideal range of use is typed bold face for each property.
range of 0.8–18 000 kPa. The maximum error isnot worse than 0.097% up to 300°C and below0.323% between 300 and 355.21°C.
r(P, T)=rf(Psat(T))+R(T)[P−Psat(T)] (17)
where
R(T)=0.17
375−T− %
7
i=0
aiTi. (17a)
4.2. Specific enthalpy, liquid phase
The piecewise continuous function given belowis an approximation to the specific enthalpy, h (kJkg−1), of heavy water in subcooled liquid state inthe temperature range of 20°C to Tsat and thepressure range of 2–21 000 kPa. The maximumerror is not worse than 0.079% up to 12 000 kPa,below 0.135% between 12 000 and 19 000 kPa andbelow 0.28% between 19 000 and 21 000 kPa.
h(P, T)=hf(Psat(T))+R(T)[P−Psat(T)] (18)
where
R(T)=1.32696 · 10−3−0.1656
%4
i=1
ai(b−T)i
(18a)
In determination of subcooled liquid tempera-ture by using Eq. (18), Eq. (18a) and NewtonRaphson algorithm, the maximum error is below0.29% in the temperature range of 20°C to Tsat
and the pressure range of 2–21 000 kPa.
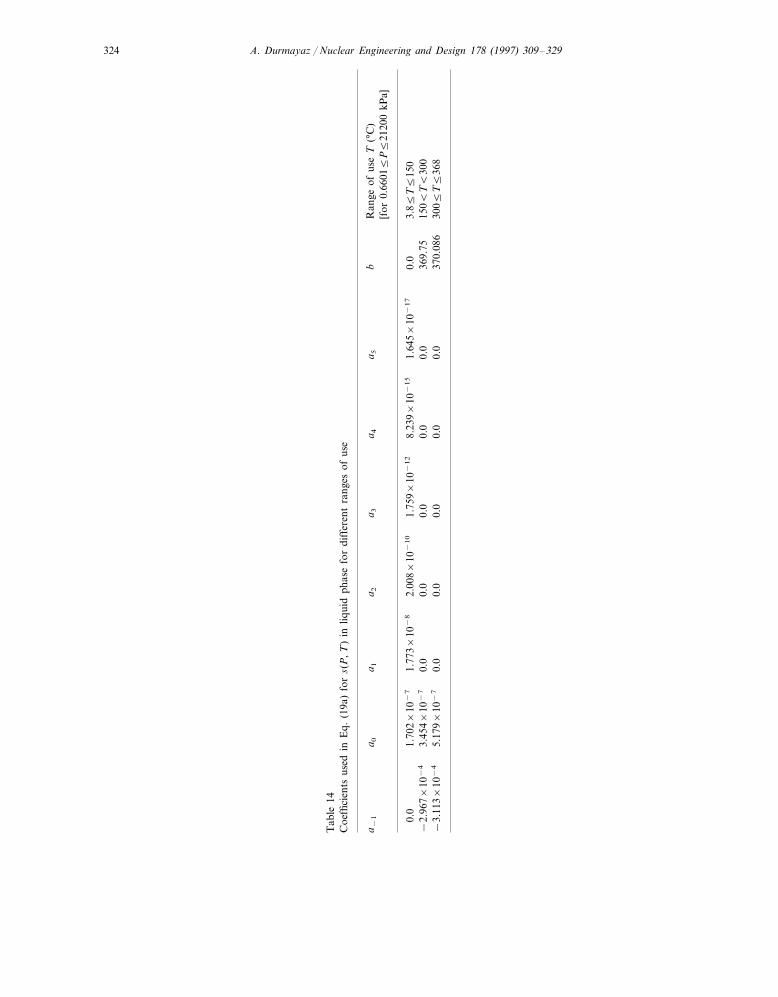
4.3. Specific entropy, liquid phase
The piecewise continuous function given belowis an approximation to the specific entropy, s (kJkg−1 K−1), of heavy water in subcooled liquidstate. The maximum error is not worse than0.087% for the temperature range of 25°C to Tsat
A. Durmayaz / Nuclear Engineering and Design 178 (1997) 309–329322
Tab
le12
Coe
ffici
ents
used
inE
q.(1
7a)
for
r(P
,T)
inliq
uid
phas
eat
diff
eren
tra
nges
ofus
e
a 4a 5
a 6a 7
Ran
geof
use
Ta 2
a 0a 3
a 1(°
C)
[for
0.85
P5
1800
0kP
a]
−5.
293×
10−
16
4.41
3×10
−6
0.0
0.0
3.85
T5
205
−2.
881×
10−
86.
827×
10−
11
1.00
8×10
−1
3−
1.18
×10
−4
3.05
672×
10−
17
0.0
205B
T5
320
−4.
7425
6×10
−1
4−
8.95
929×
10−
34.
2927
1×10
−8
1.00
123×
10−
42.
4431
8×10
−1
1−
4.81
305×
10−
9
−1.
1116
2×10
−1
2−
2.28
991×
10−
16
3.49
11×
10−
15
−3.
6572
3×10
−1
832
0BT5
355.
211.
0852
7×10
−1
41.
4308
9×10
−1
21.
1802
9×10
−1
00.
0

A. Durmayaz / Nuclear Engineering and Design 178 (1997) 309–329 323
Table 13Coefficients used in Eq. (18a) for h(P, T) in liquid phase for different ranges of use
a4 b Range of use P (kPa) [for 205T5T sat° C]a1 a2 a3
0.815094 −3.61545×10⁻⁵ 6.20387×10−85.69834×10−3 368.0 2.05P519 0000.0 0.0 369.0 19 000BP521 0001.0 0.0
and the pressure range of 3–19 200 kPa and be-low 0.147% for the temperature range of 20°C toTsat and the pressure range of 2–21 200 kPa.
s(P, T)=sf(Psat(T))+R(T)[P−Psat(T)] (19)
where
R(T)= %5
i= −1
ai(b−T)i. (19a)
4.4. Constant-pressure specific heat, liquid phase
The piecewise continuous function given belowis an approximation to the constant-pressure spe-cific heat, cp (kJ kg−1 K−1), of heavy water insubcooled liquid state in the temperature range of20°C to Tsat and the pressure range of 10–10 000kPa. The maximum error is not worse than 0.24%up to 6000 kPa and below 0.46% between 6000and 10000 kPa.
cp(P, T)=cp,f(Psat(T))+R(T)[P−Psat(T)]+c1
(20)
where
R(T)=c2−489.3951
(378.05−T)3.832 . (20a)
4.5. Specific internal energy, liquid phase
Specific internal energy of heavy water in sub-cooled liquid state, u (kJ kg−1), can be calculatedby using the correlations for specific enthalpy,specific volume (inverse of density) and the equa-tion u=h−P6 with the maximum error being notworse than 0.179% for the temperature range of20°C to Tsat and the pressure range of 2–18 000kPa.
5. Correlations for the thermodynamic propertiesof heavy water in superheated vapor state
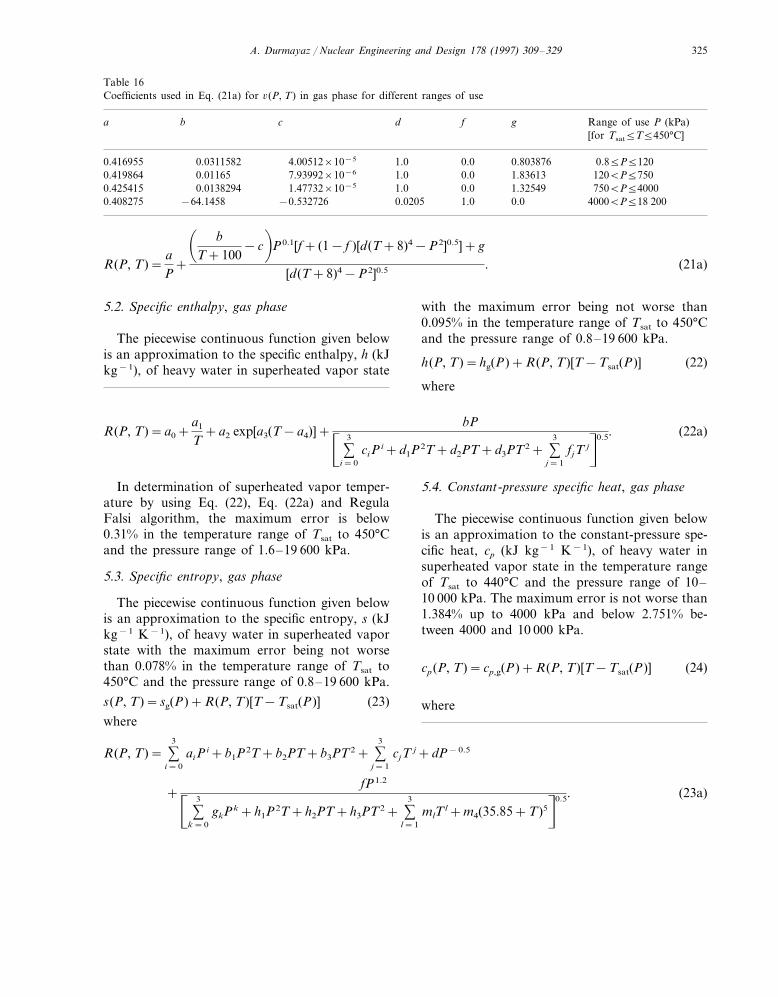
The correlations given below are the approxi-mations to the thermodynamic properties ofheavy water in superheated vapor state when usedin conjunction with Eq. (15) for Tsat. The coeffi-cients a, b, c, d, f, g and m and the exponent eseen in Eqs. (21a), (22a), (23a) and (24a) fordifferent thermodynamic properties in super-heated vapor state are given in Tables 16–19 fordifferent ranges of use.
5.1. Specific 6olume, gas phase
The piecewise continuous function given belowis an approximation to the specific volume, 6 (m3
kg−1), of heavy water in superheated vapor statein the temperature range of Tsat to 450°C and thepressure range of 0.8–18 200 kPa. The maximumerror is not worse than 0.28% up to 4000 kPa andbelow 0.99% between 4000 and 18 200 kPa.
6(P, T)=6g(P)+R(P, T)[T−Tsat(P)] (21)
where
Table 15Coefficients used in Eqs. (20) and (20a) for cp(P, T) in liquid phase fordifferent ranges of use
Range of use P (kPa), T (°C)c1 c2
105P510 000 and 205T530−0.0189 −2.8514×10⁻⁶
−4.59×10−60.0 105P51000 and 30BT5Tsat
1000BP54000 and 30BT5Tsat−2.8514×10−60.04000BP56000 and 30BT5Tsat−3.385×10−60.0
0.0 6000BP58000 and 30BT5Tsat−4.028×10⁻⁶
8000BP510 000 and 30BT5Tsat−1.51×10⁻⁶−0.02244
A. Durmayaz / Nuclear Engineering and Design 178 (1997) 309–329324
Tab
le14
Coe
ffici
ents
used
inE
q.(1
9a)
for
s(P
,T)
inliq
uid
phas
efo
rdi
ffer
ent
rang
esof
use
a 3a 4
a 5b
Ran
geof
use
T(°
C)
a 1a −
1a 2
a 0[f
or0.
66015
P5
2120
0kP
a]
0.0
1.64
5×10
−17
1.70
2×10
−7
0.0
3.85
T5
150
1.77
3×10
−8
2.00
8×10
−1
01.
759×
10−
12
8.23
9×10
−1
5
0.0
369.
7515
0BTB
300
0.0
−2.
967×
10−
40.
03.
454×
10−
70.
00.
00.
05.
179×
10−
70.
037
0.08
630
05T5
368
0.0
0.0
0.0
−3.
113×
10−
4
A. Durmayaz / Nuclear Engineering and Design 178 (1997) 309–329 325
Table 16Coefficients used in Eq. (21a) for 6(P, T) in gas phase for different ranges of use
a b c d Range of use P (kPa)f g[for Tsat5T5450°C]
0.416955 0.0311582 0.85P51204.00512×10−5 1.0 0.0 0.803876120BP57500.419864 0.01165 7.93992×10⁻⁶ 1.836131.0 0.0
1.47732×10⁻⁵ 0.0 1.32549 750BP540000.425415 0.0138294 1.00.408275 −64.1458 4000BP518 200−0.532726 0.0205 1.0 0.0
R(P, T)=aP
+
� bT+100
−c�
P0.1[f+ (1− f )[d(T+8)4−P2]0.5]+g
[d(T+8)4−P2]0.5 . (21a)
5.2. Specific enthalpy, gas phase
The piecewise continuous function given belowis an approximation to the specific enthalpy, h (kJkg−1), of heavy water in superheated vapor state
with the maximum error being not worse than0.095% in the temperature range of Tsat to 450°Cand the pressure range of 0.8–19 600 kPa.
h(P, T)=hg(P)+R(P, T)[T−Tsat(P)] (22)
where
R(P, T)=a0+a1
T+a2 exp[a3(T−a4)]+
bP� %3
i=0
ciPi+d1P2T+d2PT+d3PT2+ %3
j=1
fjT jn0.5. (22a)
In determination of superheated vapor temper-ature by using Eq. (22), Eq. (22a) and RegulaFalsi algorithm, the maximum error is below0.31% in the temperature range of Tsat to 450°Cand the pressure range of 1.6–19 600 kPa.
5.3. Specific entropy, gas phase
The piecewise continuous function given belowis an approximation to the specific entropy, s (kJkg−1 K−1), of heavy water in superheated vaporstate with the maximum error being not worsethan 0.078% in the temperature range of Tsat to450°C and the pressure range of 0.8–19 600 kPa.
s(P, T)=sg(P)+R(P, T)[T−Tsat(P)] (23)
where
5.4. Constant-pressure specific heat, gas phase
The piecewise continuous function given belowis an approximation to the constant-pressure spe-cific heat, cp (kJ kg−1 K−1), of heavy water insuperheated vapor state in the temperature rangeof Tsat to 440°C and the pressure range of 10–10 000 kPa. The maximum error is not worse than1.384% up to 4000 kPa and below 2.751% be-tween 4000 and 10 000 kPa.
cp(P, T)=cp,g(P)+R(P, T)[T−Tsat(P)] (24)
where
R(P, T)= %3
i=0
aiPi+b1P
2T+b2PT+b3PT2+ %3
j=1
cjTj+dP−0.5
+fP1.2� %
3
k=0
gkPk+h1P2T+h2PT+h3PT2+ %3
l=1
mlTl+m4(35.85+T)5n0.5. (23a)

A. Durmayaz / Nuclear Engineering and Design 178 (1997) 309–329326
Tab
le17
Coe
ffici
ents
used
inE
q.(2
2a)
for
h(P
,T)
inga
sph
ase
for
diff
eren
tra
nges
ofus
e
Ran
geof
use
P(k
Pa)
[for
Tsa
t5T5
450°
C]
300B
P5
550
550B
P5
1000
1000B
P5
2800
2800B
P5
4000
4000B
P5
6000
6000B
P5
1000
010
000B
P5
1500
015
000B
P5
1960
016B
P5
650.
85P5
1665B
P5
300
8.77
936
8.77
936
8.77
936
2.99
797
2.99
797
2.99
797
12.0
484
12.0
484
9.78
095
a 010
.067
610
.347
3−
14.5
654
−66
8.02
5−
668.
025
−66
8.02
5−
6388
.74
−14
.565
4−
6388
.74
a 1−
14.5
654
4.20
364
0.46
1977
0.59
222
−6.
9074
5a 2
4.06
839
−8.
0289
94.
0683
94.
0683
936
.695
836
.695
8−
8.30
33−
8.57
778
−6.
9074
5−
6.90
745
−0.
0000
5−
0.00
8−
0.00
8−
0.00
8−
0.00
8−
0.00
005
−0.
008
−0.
0000
5−
0.00
005
a 3−
0.00
005
−0.
0000
516
0.0
160.
016
0.0
162.
016
2.0
162.
016
2.0
162.
016
0.0
160.
016
0.0
a 41.
00.
0852
264
1.0
1.0
1.0
1.0
1.0
1.0
0.65
3461
0.62
1974
1.0
b4.
8694
9×10
646
01.6
323
25.5
210
33.2
1−
1.83
077×
108
2.02
606×
106
9.25
914×
107
c 0−
5.48
124×
106
0.0
0.0
0.0
4894
9.9
5455
.09
−15
3.16
6−
3876
6.8
−21
539.
8−
1060
3.3
−26
599.
8−
3619
5.5
c 10.
00.
00.
00.
7219
992.
7233
41.
5760
50.
7188
50.
5169
17−
4.58
711.
1931
3−
1.0
c 2−
95.7
573
−1.
0−
1.0
0.0
0.0
−2.
7124
3×10
−4
0.0
0.0
0.0
2.33
741×
10−
6−
1.36
951×
10−
60.
00.
00.
0c 3
0.01
5299
90.
01.
4385
1×10
−3
−7.
3022
1×−
3−
4.42
643×
10−
3−
2.04
974×
10−
3−
1.65
955×
10−
3−
2.81
054×
10−
30.
00.
00.
3955
42d 1
−14
.420
810
0.62
542
.748
111
.895
689
.434
6−
2.29
869
76.7
847
d 236
.865
40.
00.
00.
0d 3
0.03
6002
10.
0−
1.67
785×
10−
30.
0353
695
0.03
6947
4−
0.04
7782
90.
0180
701
0.0
0.0
−0.
9551
19−
0.04
7090
3−
5011
1.9
6387
97.0
3883
76.0
2218
22.0
2.35
87×
106
−48
355.
577
2825
.0−
4236
0.6
f 110
.00.
00.
023
6.83
7−
2329
.48
−12
51.2
8−
590.
03−
7500
.61
−34
14.0
2f 2
0.0
10.0
30.0
157.
418
213.
866
0.04
1193
82.
2880
41.
1584
80.
6003
497.
0823
92.
8733
60.
1674
9f 3
0.0
0.0
0.83
4372
0.0
A. Durmayaz / Nuclear Engineering and Design 178 (1997) 309–329 327
Table 18Coefficients used in Eq. (23a) for s(P, T) in gas phase for different ranges of use
Range of use P (kPa) [for Tsat5T5450°C]
0.85PB22.0 225P5140 140BP51000 1000BPB11 000 11 0005P518 000 18 000BP519 600
6.16662×10⁻³ 5.9217×10⁻³ 6.03405×10⁻³ 4.81826×10⁻³ 4.81826×10⁻³ 4.81826×10⁻³a0
a1 −5.03219×10⁻⁵ −1.48048×10⁻⁶ 1.74264×10⁻⁶ 0.0 0.0 0.0a2 0.00.00.06.89893×10−103.19711×10−83.05565×10−6
0.00.0−2.99361×10⁻¹³ 0.0−9.57186×10⁻¹¹−6.23545×10⁻⁸a3
−7.3344×10⁻¹⁴−1.13805×10⁻¹²−9.36868×10⁻¹⁰b1 0.00.00.00.0b2 1.38783×10⁻⁸ −1.31701×10⁻⁸ −9.67509×10⁻⁹ 0.0 0.0
0.00.0b3 2.37152×10⁻¹¹ 0.01.82997×10−11 1.12257×10⁻¹¹
−2.87624×10⁻⁶ −2.87624×10⁻⁶ −2.87624×10⁻⁶c1 −9.55276×10⁻⁶ −9.85418×10⁻⁶ −1.28919×10⁻⁵
1.79269×10⁻⁸ 2.80426×10⁻⁸ 0.0 0.0 0.0c2 1.58514×10⁻⁸
0.00.00.0−2.48958×10⁻¹¹−1.47079×10⁻¹¹−1.23685×10⁻¹¹c3
0.0 0.0 0.0d 1.00104×10⁻⁶ 1.00104×10⁻⁴ 1.00104×10⁻⁴
8.52194×10−78.52194×10−78.52194×10−70.0f 0.00.01.0 1.0 1.0g0 0.0 −8.34545×10⁻⁷ −4.28135×10⁻⁶
g1 0.0 0.0 0.0 0.0 −3.60396×10⁻³ −0.02073510.0 0.0 −1.0×10⁻⁶ −1.07037×10⁻⁶−2.0114×10⁻⁶g2 0.0
g3 1.63299×10−101.95565×10−100.00.00.00.01.70265×10−80.00.0 −1.67564×10−80.00.0h1
0.0 0.0 0.0 3.03573×10−42.44047×10−4h2 0.0−6.49484×10−83.82669×10−8h3 0.00.0 0.00.0
m1 0.0 0.0 0.0 −1.34×10⁻⁴ −5.89338×10−40.00.00.0m2 −9.88442×10⁻³−9.71333×10−30.00.0
2.51487×10−50.00.00.0 2.59554×10−50.0m3
m4 0.00.00.0 0.00.03.0×10−11
R(P, T)=a+bp(c−T)2.1+%4
i=0
dip i+ f1p3T+ f2p2T2+ f3pT3+ f4p2T+ f5pT+ f6pT2+ %4
j=1
gjT j
[h(T+8)2−p ]1.5 (24a)
where p=P/1000.
5.5. Specific internal energy, gas phase
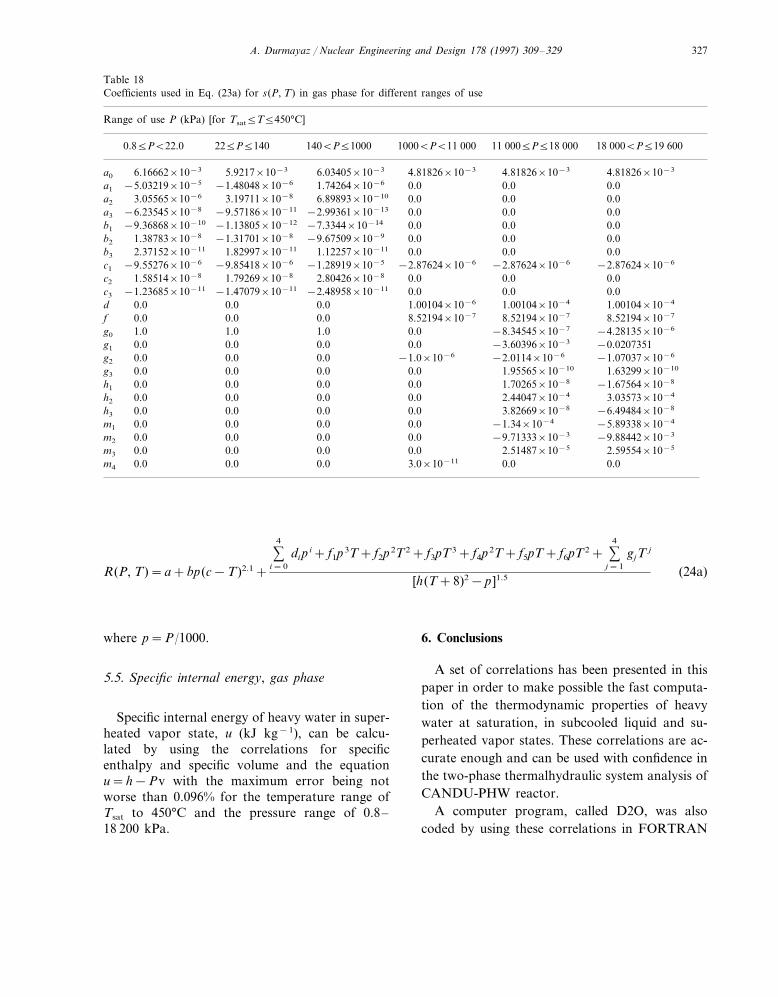
Specific internal energy of heavy water in super-heated vapor state, u (kJ kg−1), can be calcu-lated by using the correlations for specificenthalpy and specific volume and the equationu=h−Pv with the maximum error being notworse than 0.096% for the temperature range ofTsat to 450°C and the pressure range of 0.8–18 200 kPa.
6. Conclusions
A set of correlations has been presented in thispaper in order to make possible the fast computa-tion of the thermodynamic properties of heavywater at saturation, in subcooled liquid and su-perheated vapor states. These correlations are ac-curate enough and can be used with confidence inthe two-phase thermalhydraulic system analysis ofCANDU-PHW reactor.
A computer program, called D2O, was alsocoded by using these correlations in FORTRAN
A. Durmayaz / Nuclear Engineering and Design 178 (1997) 309–329328
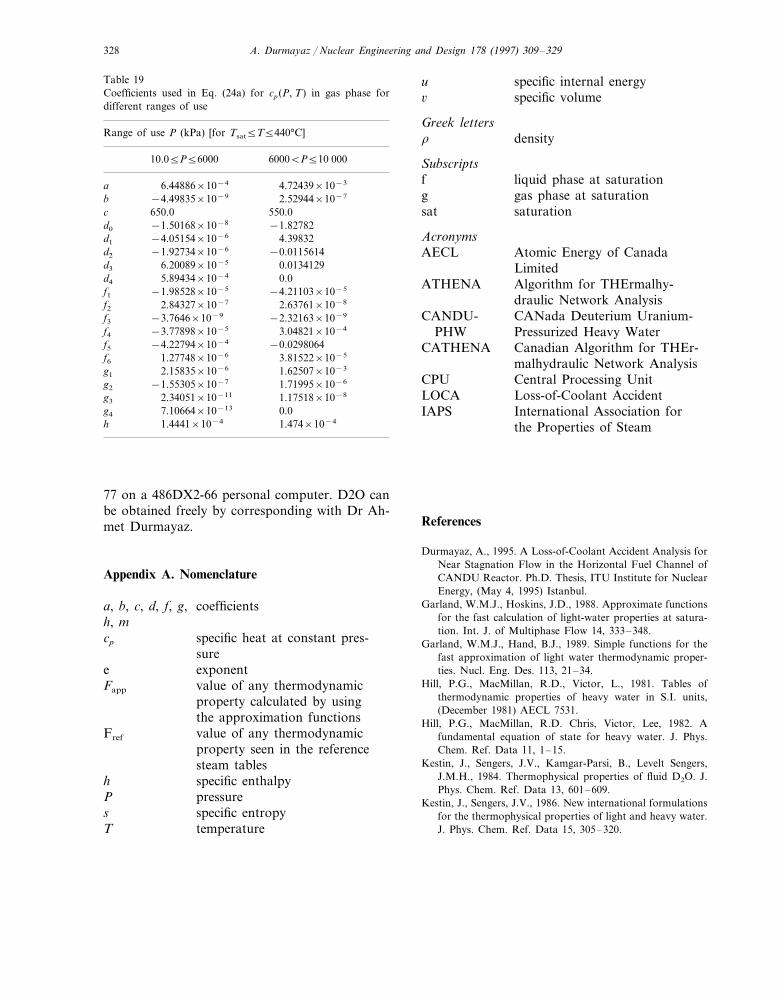
Table 19Coefficients used in Eq. (24a) for cp(P, T) in gas phase fordifferent ranges of use
Range of use P (kPa) [for Tsat5T5440°C]
10.05P56000 6000BP510 000
a 4.72439×10−36.44886×10−4
b 2.52944×10⁻⁷−4.49835×10⁻⁹
550.0650.0cd0 −1.82782−1.50168×10⁻⁸
4.39832d1 −4.05154×10⁻⁶
−1.92734×10⁻⁶ −0.0115614d2
6.20089×10⁻⁵ 0.0134129d3
d4 5.89434×10⁻⁴ 0.0−4.21103×10⁻⁵−1.98528×10⁻⁵f1
2.84327×10⁻⁷f2 2.63761×10⁻⁸
f3 −3.7646×10⁻⁹ −2.32163×10⁻⁹
−3.77898×10⁻⁵f4 3.04821×10⁻⁴
−4.22794×10⁻⁴f5 −0.0298064f6 1.27748×10⁻⁶ 3.81522×10⁻⁵
g1 2.15835×10⁻⁶ 1.62507×10⁻³
−1.55305×10⁻⁷g2 1.71995×10⁻⁶
g3 2.34051×10⁻¹¹ 1.17518×10⁻⁸
g4 7.10664×10⁻¹³ 0.01.4441×10−4h 1.474×10⁻⁴
u specific internal energyspecific volume6
Greek lettersr density
Subscriptsf liquid phase at saturationg gas phase at saturation
saturationsat
AcronymsAtomic Energy of CanadaAECLLimited
ATHENA Algorithm for THErmalhy-draulic Network Analysis
CANDU- CANada Deuterium Uranium-PHW Pressurized Heavy Water
CATHENA Canadian Algorithm for THEr-malhydraulic Network Analysis
CPU Central Processing UnitLOCA Loss-of-Coolant AccidentIAPS International Association for
the Properties of Steam
References
Durmayaz, A., 1995. A Loss-of-Coolant Accident Analysis forNear Stagnation Flow in the Horizontal Fuel Channel ofCANDU Reactor. Ph.D. Thesis, ITU Institute for NuclearEnergy, (May 4, 1995) Istanbul.
Garland, W.M.J., Hoskins, J.D., 1988. Approximate functionsfor the fast calculation of light-water properties at satura-tion. Int. J. of Multiphase Flow 14, 333–348.
Garland, W.M.J., Hand, B.J., 1989. Simple functions for thefast approximation of light water thermodynamic proper-ties. Nucl. Eng. Des. 113, 21–34.
Hill, P.G., MacMillan, R.D., Victor, L., 1981. Tables ofthermodynamic properties of heavy water in S.I. units,(December 1981) AECL 7531.
Hill, P.G., MacMillan, R.D. Chris, Victor, Lee, 1982. Afundamental equation of state for heavy water. J. Phys.Chem. Ref. Data 11, 1–15.
Kestin, J., Sengers, J.V., Kamgar-Parsi, B., Levelt Sengers,J.M.H., 1984. Thermophysical properties of fluid D2O. J.Phys. Chem. Ref. Data 13, 601–609.
Kestin, J., Sengers, J.V., 1986. New international formulationsfor the thermophysical properties of light and heavy water.J. Phys. Chem. Ref. Data 15, 305–320.
77 on a 486DX2-66 personal computer. D2O canbe obtained freely by corresponding with Dr Ah-met Durmayaz.
Appendix A. Nomenclature
a, b, c, d, f, g, coefficientsh, m
specific heat at constant pres-cp
suree exponentFapp value of any thermodynamic
property calculated by usingthe approximation functionsvalue of any thermodynamicFref
property seen in the referencesteam tables
h specific enthalpyP pressures specific entropyT temperature

A. Durmayaz / Nuclear Engineering and Design 178 (1997) 309–329 329
Liner, Y., Hanna, B.N., Richards, D.J., 1988. Piecewise Her-mite polynomial approximation of liquid–vapour thermo-dynamic properties. Am. Soc. Mech. Engineers, FluidsEng. Div. FED 72 99–102.
Richards, D.J., Hanna, B.N., Hobson, N., Ardron, K.H.,1985. ATHENA: A two-fluid code for CANDU LOCAanalysis. Presented at the 3rd Int. Conf. Reactor Thermal-hydraulics, October 15–18, Newport, Rhode Island.
..