apresentação do powerpointir.marfrig.com.br/en/documentos/3591_institutional... · 2q14 (%) 78%...
TRANSCRIPT

1Focus to Win
INSTITUTIONAL
PRESENTATION September, 2014
FOCUS TO WIN
2Focus to Win
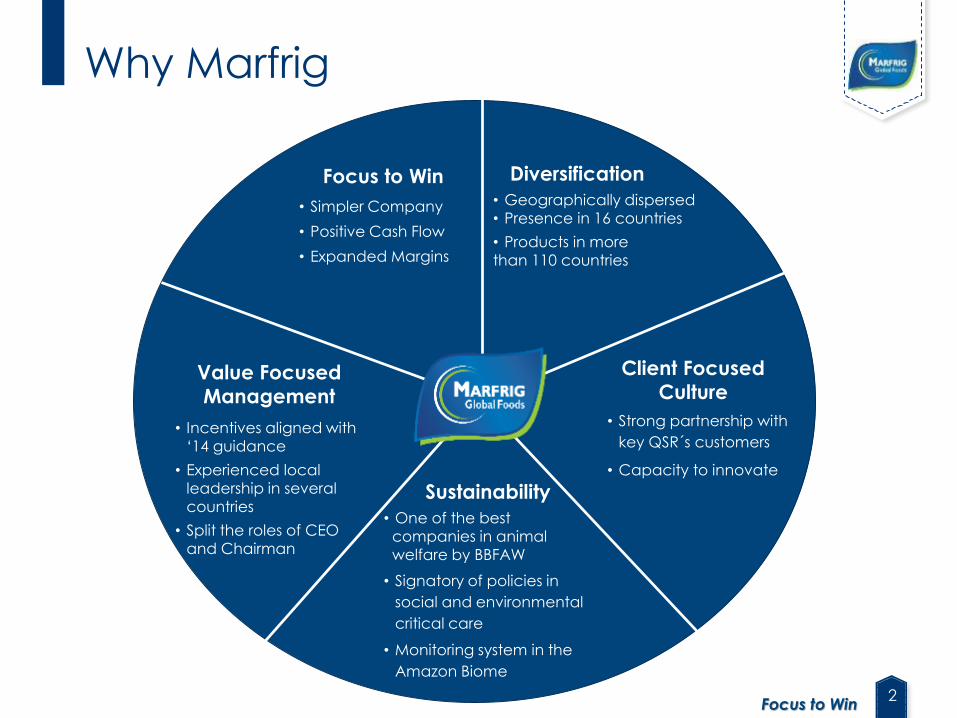
Why Marfrig
Focus to Win
• Simpler Company
• Positive Cash Flow
• Expanded Margins
Diversification
• Geographically dispersed
• Presence in 16 countries
• Products in more
than 110 countries
Value Focused
Management
• Incentives aligned with
‘14 guidance
• Experienced local
leadership in several
countries
• Split the roles of CEO
and Chairman
Sustainability
• One of the best
companies in animal
welfare by BBFAW
• Signatory of policies in
social and environmental
critical care
• Monitoring system in the
Amazon Biome
Client Focused
Culture
• Strong partnership with
key QSR´s customers
• Capacity to innovate

3Focus to Win
STRATEGIC
OVERVIEW

4Focus to Win
2Q14 breakdownby business
2Q14 breakdownby currency
2Q14 breakdownby product
Who we are | Marfrig at a glance
Net Revenue(R$ bn)
28%
29%
43%
MOY PARKKEYSTONEMARFRIG BEEF
45%
44%
9%
FURTHER PROCESSED
FRESH
OTHER
One of the world’s
largest providers of
processed food to
major restaurant
chains
FoodService
One of the largest
poultry-based
processed products
suppliers in the UK
and Europe
Retail and Food Service
World’s 3rd largest beef
producer and one of
South America’s largest
lamb suppliers
Diversified
DiversifiedAnimal
Protein Player
Strong focuson Food Service
Marfrig Group
Main Sales
Channels
Business
Description
44%
25%
20%
12%
USDEURO/POUNDREALOTHER
45%
26%
21%
9%
4.5
5.1
2Q13 2Q14
+ 15%

5Focus to Win
Non-financial Highlights
Corporate Governance: conclusion of the
transition process to separate the roles of
Chief Executive Officer and Chairman of
the Board of Directors.
Animal Welfare: Marfrig was recently
elected one the world’s best companies
in animal welfare (source: Business
Benchmark on Farm Animal Welfare,
2013), which reflects our firm commitment
to sustainability in our business chain.

6Focus to Win
STRATEGIES AND
OBJECTIVES

7Focus to Win
High single digit margins in beef business. Consistent cash generation and stricter cost management
Solid beef business
Who we were
Strong customer focus but keeping a tight grip on margins
Strong customer focus
Rapid growth Focus on profitable growth and margin expansion
Debt financed acquisitions
Accelerated organic growth
Broad based meat company
Easier to connect and to focus
Earnings volatility Earnings stability
Cash consumption Positive free cash flow
Where we are headed What have we
done so far
Uruguay returned to profitability, reduced losses in Argentina
Destination channels are being optimized
Significant margin expansion in both Moy Park and Keystone
Working to finalize JV in Indonesia and in the Middle East (Keystone)
SKU simplification in Beef Brazil, Uruguay makes up 100% ofKeystone China’s South American beef purchases
Results in line over the lastthree quarters
Cash consumption cut by R$ 1.5 billion from 1H13 to 1H14
Strategy | Business Transformation
8Focus to Win
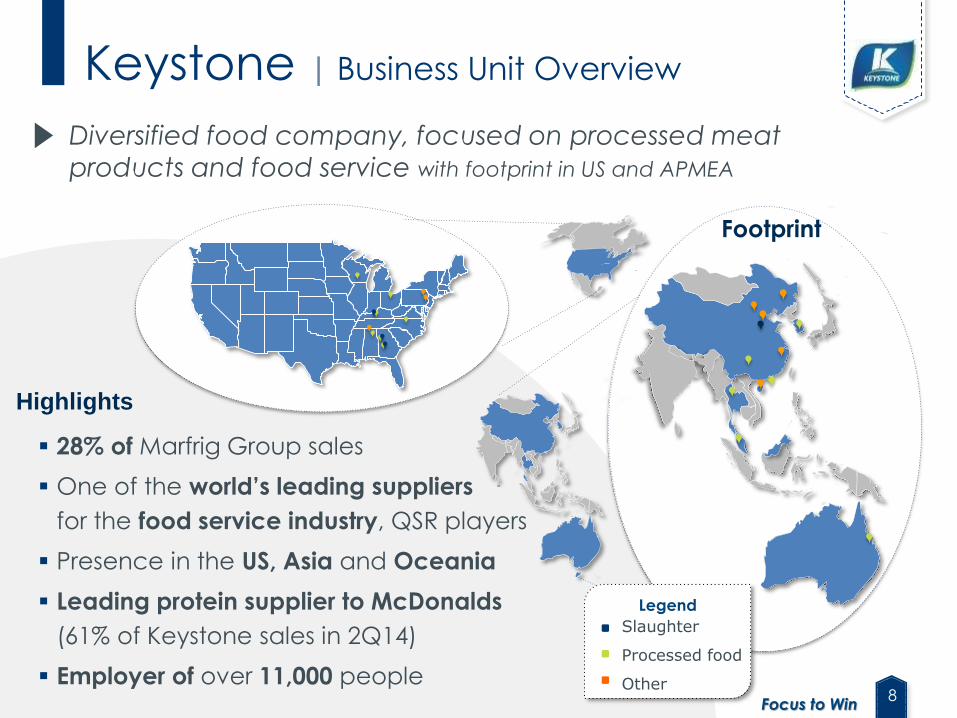
Highlights
28% of Marfrig Group sales
One of the world’s leading suppliers
for the food service industry, QSR players
Presence in the US, Asia and Oceania
Leading protein supplier to McDonalds
(61% of Keystone sales in 2Q14)
Employer of over 11,000 people
Keystone | Business Unit Overview
Footprint
Diversified food company, focused on processed meat
products and food service with footprint in US and APMEA
Legend
Slaughter
Processed food
Other
9Focus to Win
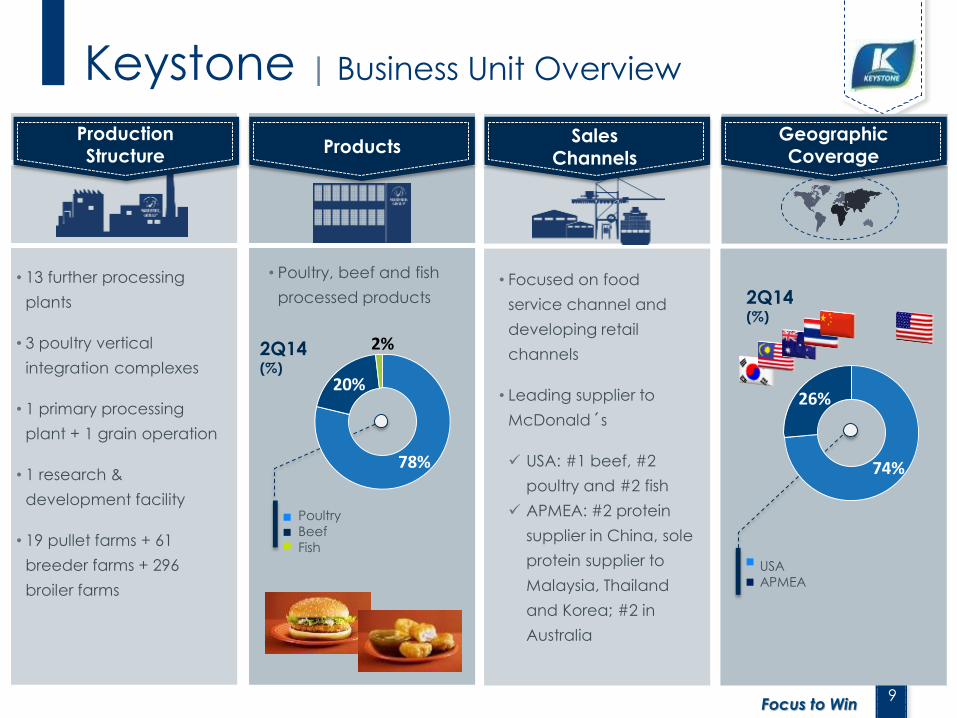
Keystone | Business Unit Overview
Geographic Presence
Geographic Coverage
Production Infrastructure
Sales ChannelsProductsProduction Structure
ProductsSales
Channels
• 13 further processing
plants
• 3 poultry vertical
integration complexes
• 1 primary processing
plant + 1 grain operation
• 1 research &
development facility
• 19 pullet farms + 61
breeder farms + 296
broiler farms
• Focused on food
service channel and
developing retail
channels
• Leading supplier to
McDonald´s
USA: #1 beef, #2
poultry and #2 fish
APMEA: #2 protein
supplier in China, sole
protein supplier to
Malaysia, Thailand
and Korea; #2 in
Australia
• Poultry, beef and fish
processed products
2Q14(%)
2Q14(%)
78%
20%
2%
Poultry
Beef
Fish
USA
APMEA
74%
26%
10Focus to Win
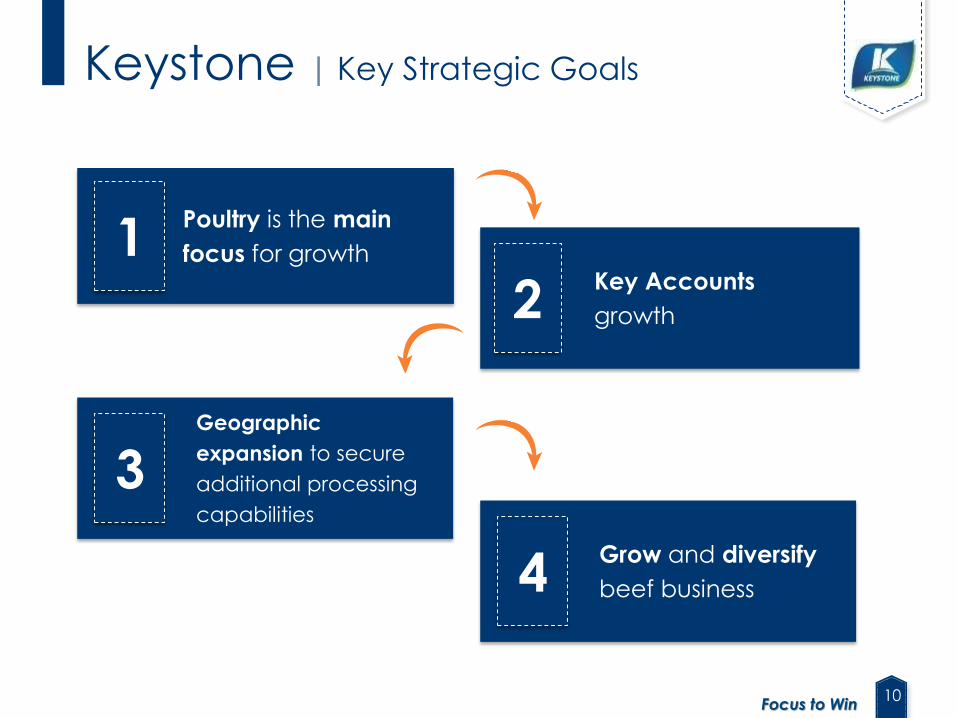
Poultry is the main
focus for growth1Key Accounts
growth2
Geographic
expansion to secure
additional processing
capabilities
3
Grow and diversify
beef business4
Keystone | Key Strategic Goals
11Focus to Win
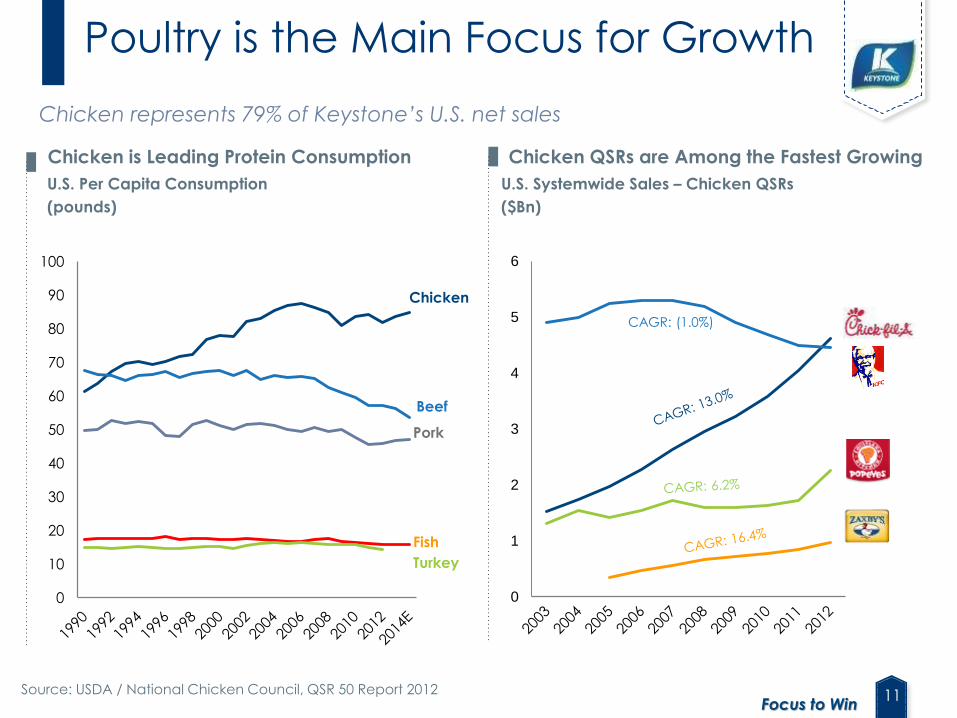
Poultry is the Main Focus for Growth
0
1
2
3
4
5
6
U.S. Systemwide Sales – Chicken QSRs
($Bn)
0
10
20
30
40
50
60
70
80
90
100
U.S. Per Capita Consumption
(pounds)
Chicken
Fish
Turkey
Pork
Beef
Chicken represents 79% of Keystone’s U.S. net sales
CAGR: (1.0%)
Chicken is Leading Protein Consumption
Source: USDA / National Chicken Council, QSR 50 Report 2012
Chicken QSRs are Among the Fastest Growing

12Focus to Win
Key Accounts Growth
Strong reputation with a diverse and high quality customer base
225 232 273362 402
39 4954
5773
264 281327
419475
2009 2010 2011 2012 2013
U.S. APMEA
16.8%
CAGR
15.6%
CAGR
Select
Key
Accounts
Attractive Growth in Key Account Sales
($MM)

13Focus to Win
Geographic Expansion to Secure
Additional Processing CapabilitiesKeystone supplies the rapidly growing QSR industry in APMEA
APMEA Overview: 4,000+ restaurants served; Facilities: 6 further processing plants; 1 primary processing plant
30%
13%12%
12%
11%
8%
6%5%
2%
1% 0%
Japan
Thailand
China
Malaysia
Korea
(%), by End-Market Country 2013
Australia
Singapore
EUOthers
Middle East
Growth Across All Markets
(MM pounds)
0
50
100
150
200
250
300
350
2004 2005 2006 2007 2008 2009 2010 2011 2012 2013
109
137
168
196
226239
257
274299
313
APMEA Growth History (Volume)
14Focus to Win
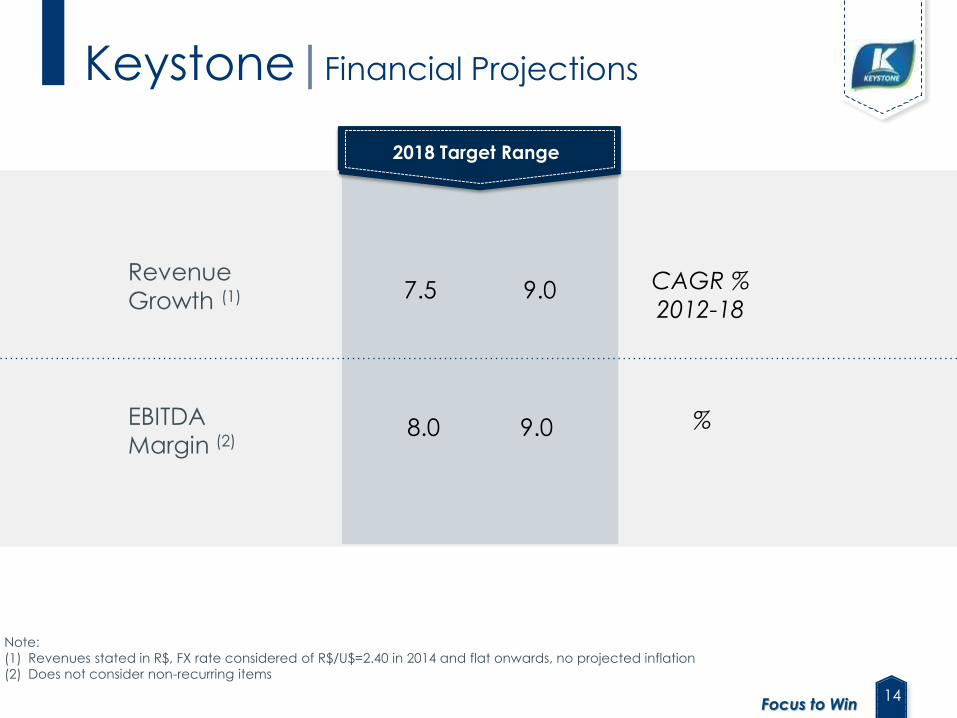
Keystone|Financial Projections
Revenue
Growth (1)
EBITDA
Margin (2)
Note:
(1) Revenues stated in R$, FX rate considered of R$/U$=2.40 in 2014 and flat onwards, no projected inflation
(2) Does not consider non-recurring items
%
CAGR %
2012-18
Faixa Alvo 2018
7.5 9.0
8.0 9.0
Faixa-alvo 2018
%
CAGR %
2012-187.0 9.0
8.0 10.0
Faixa Alvo 2018
7.5 9.0
8.0 9.0
Revenue
Growth (1)
EBITDA
Margin (2)
2018 Target Range

15Focus to Win
LegendSlaughter
Processed food
Other
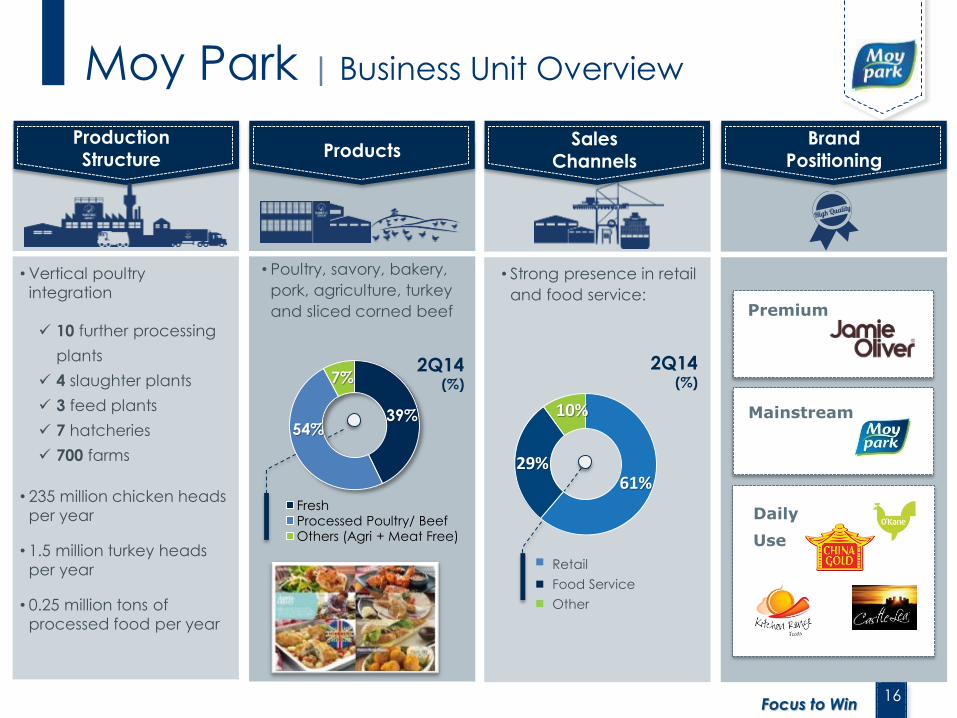
Moy Park | Business Unit Overview
26% of Marfrig Group sales
One of Europe’s leading poultry companies
Top 20 UK food business and leader in
convenience products
Northern Ireland’s largest company
Presence in the UK, Northern Ireland, France
and Holland
70 years of history
Employer of more than 8,000 people
HighlightsFootprint
Diversified protein based food company with
presence in poultry, turkey, beef and pork
16Focus to Win
Moy Park | Business Unit Overview
Production Structure
Products
• Poultry, savory, bakery,
pork, agriculture, turkey
and sliced corned beef
Brand Positioning
Premium
Mainstream
Daily
Use
Sales Channels
• Vertical poultry
integration
10 further processing
plants
4 slaughter plants
3 feed plants
7 hatcheries
700 farms
• 235 million chicken heads
per year
• 1.5 million turkey heads
per year
• 0.25 million tons of
processed food per year
2Q14(%)
• Strong presence in retail
and food service:
2012
2Q14(%)
39%54%
7%
FreshProcessed Poultry/ BeefOthers (Agri + Meat Free)
61%29%
10%
Retail
Food Service
Other

17Focus to Win
Continue expansion of
multi protein retail sales
in markets across UK,
Ireland and
Continental Europe
2
Boost presence in
the food service
distribution channel
in the UK, Ireland
and Continental
Europe
3
Moy Park | Key Strategic Goals
1
Grow core UK &
Ireland retail fresh
poultry and
convenience food
sales ahead of the
market
4Become Marfrig
global distribution
platform in Europe

18Focus to Win
Key Strengths and Investment
Positioned in the attractive UK poultry market…1
... Moy Park is a leading player in both Fresh Poultry and Convenience Food
2The company enjoys strong relationships with UK and European retailers and QSR operators…
3
Most consumed animal protein in the
UK with 728 kton sold in 2013A
Fastest growing animal protein and the
most affordable (£1,300 per ton vs.
£4,420 for Beef)
Preference for local products: 8 out of
10 shoppers would buy British when
available
#1 producer of fresh coated and
ready-to-eat poultry
It is the second largest producer in the
UK
Moy Park has brands covering the full
market
Poultry has higher growth
UK poultry production
Fresh coated poultry
Ready-to-eat poultry
#2
#1
#1
(2012A–17E CAGR in consumption volume) Retail Food Service
Larger market share in “winning”
categories and formats
Supplier to the major UK and French
QSR operators
Fast growing QSR market in France and
UK with 13-17E CAGR of 5.6% and 1.3%
Customized product solutions with Moy
Park personnel located on site of largest
clients’ facilities
1.62% 1.60%
0.13% 0.09%
Poultry Fish Pork Beef and
Veal

19Focus to WinSource: Euromonitor
UK convenience
Agri-fresh
EU convenience
Breeding Grounds
Geographical location of breeding
farms in West-Europe ensures for a
“natural” biosecurity barrier
Track record: 14% sales CAGR
since 2008 / +2.7% EBITDA margin
uplift since 2011
Strong operating cash flows
generated and re-invested to
drive future growth
Combined, the team has over
100 years of food industry
knowledge
InitiativesRelevance for
investors
Leverage poultry and beef footprint in Europe acrossUK franchise
2. Increase Presence inFood Service
Explore an increasing sales channel that will lead to sustainable growth
Tap significant opportunity with low risk and investment
1. Grow Core Business
Grow core retailfresh poultry and conveniencefood sales
3. Innovation and ChannelDevelopment
Outpace competition and increase profitability
Deliver leading consumer insights to customersDrive growth via new channels
Key Strengths and Investment
...underpinned by a strong management team with proven track-record
4Clear strategy of organic growth with multiple levers for further upside…
5…on the back of an efficient and well-invested production base6
integrated production platform
including unique poultry rearing
ensuring integrity of supply
Production footprint in Ireland
acting as natural bio-security barrier
£180m invested over the last 5 years
20Focus to Win
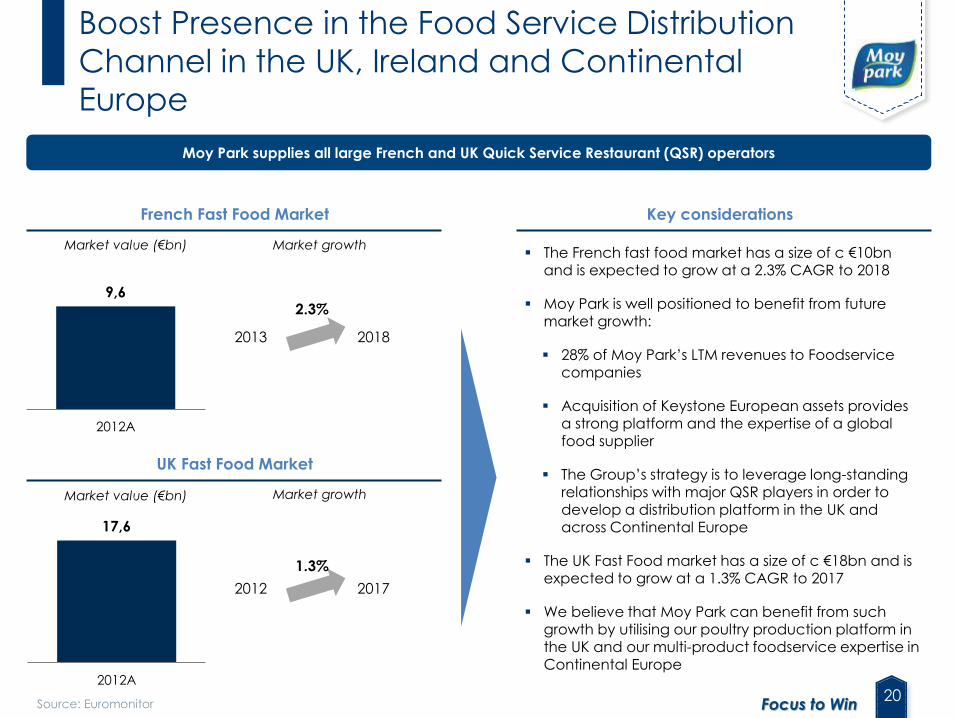
Boost Presence in the Food Service Distribution
Channel in the UK, Ireland and Continental
Europe
9,6
2012A
French Fast Food Market Key considerations
Market value (€bn)
Moy Park supplies all large French and UK Quick Service Restaurant (QSR) operators
Source: Euromonitor
The French fast food market has a size of c €10bn and is expected to grow at a 2.3% CAGR to 2018
Moy Park is well positioned to benefit from future market growth:
28% of Moy Park’s LTM revenues to Foodservice companies
Acquisition of Keystone European assets provides a strong platform and the expertise of a global food supplier
The Group’s strategy is to leverage long-standing relationships with major QSR players in order to develop a distribution platform in the UK and across Continental Europe
The UK Fast Food market has a size of c €18bn and is expected to grow at a 1.3% CAGR to 2017
We believe that Moy Park can benefit from such growth by utilising our poultry production platform in the UK and our multi-product foodservice expertise in Continental Europe
UK Fast Food Market
Market growth
17,6
2012A
Market value (€bn) Market growth
2013 2018
2.3%
2012 2017
1.3%

21Focus to Win
2nd Largest Overall Poultry Producer in the UK
and More Than Twice the Size of the Number 3
25%
B
C
D
E
A
% of total UK average bird processing per week
Market Share of Total UK Poultry Production
Source: DEFRA UK broiler slaughter, rolling 12 months to December 2013, averaged per week
Market shares are Company estimates based on third-party industry sources
Total: 17.4m birds per week
Key observations
#2 UK poultry producer provides scale and efficiency benefits which enhance Moy Park’s competitive position
Integrated supply of British-produced poultry into the convenience retail and foodservice markets provides a competitive advantage as well as a driver for growth, as end consumers value British-sourced meat
Our market share in the sale of fresh poultry to retailers offers attractive opportunities for future growth
22Focus to Win
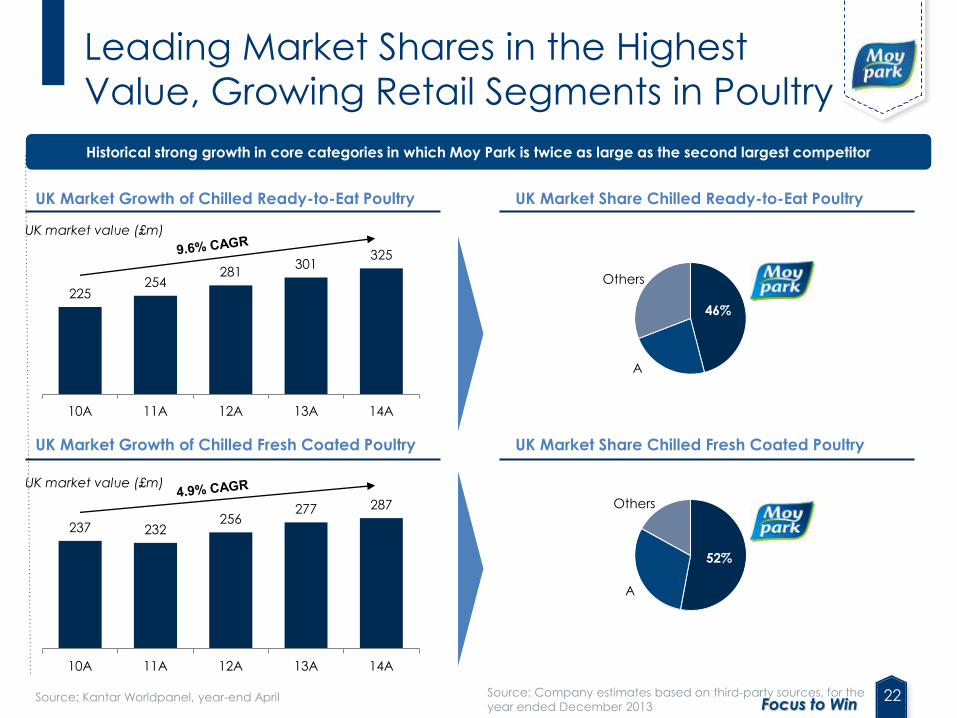
Leading Market Shares in the Highest
Value, Growing Retail Segments in Poultry
UK Market Growth of Chilled Ready-to-Eat Poultry UK Market Share Chilled Ready-to-Eat Poultry
UK Market Growth of Chilled Fresh Coated Poultry UK Market Share Chilled Fresh Coated Poultry
Source: Kantar Worldpanel, year-end April
Historical strong growth in core categories in which Moy Park is twice as large as the second largest competitor
UK market value (£m)
52%
Others
A
46%
Others
A
UK market value (£m)
Source: Company estimates based on third-party sources, for the
year ended December 2013
225254
281301
325
10A 11A 12A 13A 14A
237 232256
277 287
10A 11A 12A 13A 14A

23Focus to Win
Moy Park | Financial Projections
Note:
(1) Revenues stated in R$, FX rate considered of R$/£=3.80 in 2014 and flat onwards, no projected inflation
(2) Does not consider non-recurring items
%
CAGR %
2012-187.0 9.0
8.0 10.0
Faixa Alvo 2018
8.5 10.0
7.5 8.5
2018 Target Range
Revenue
Growth (1)
EBITDA
Margin (2)

24Focus to Win
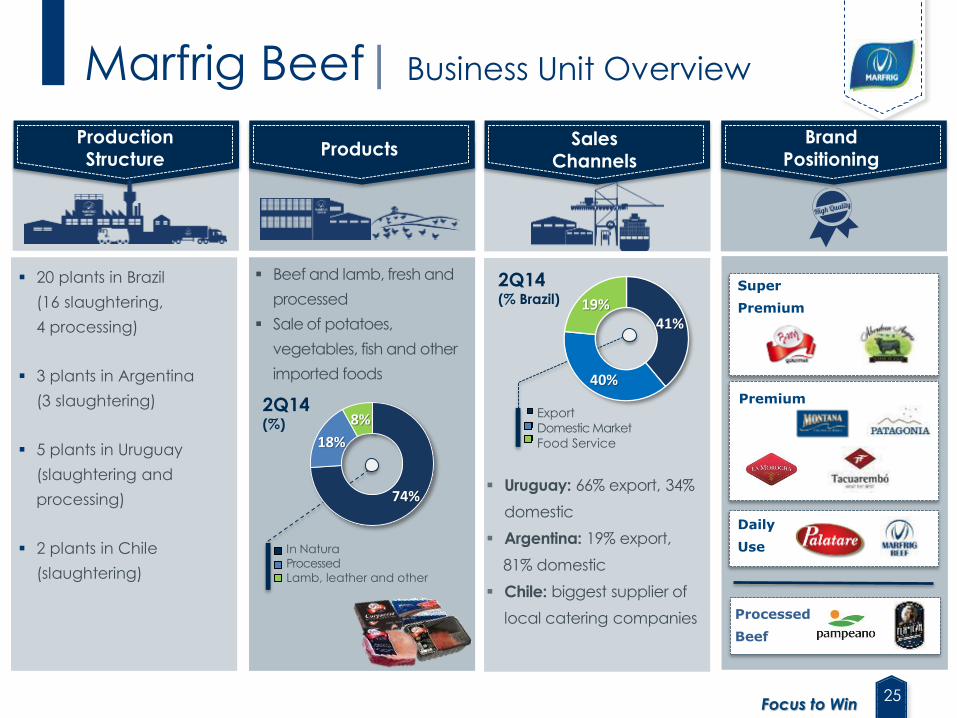
Marfrig Beef | Business Unit Overview
Highlights
46% of Marfrig Group sales
(c.36% in Brazil)
Focus on beef and lamb
Products sold in the local and
international markets
Presence in Brazil, Argentina, Uruguay
and Chile
2nd largest beef operation in Brazil
Leader in Uruguay slaughter
#1 Chilean meat importer
+22,000 employees
Legend:
Slaughter
Processed food
Other
25Focus to Win
Marfrig Beef| Business Unit Overview
Beef and lamb, fresh and
processed
Sale of potatoes,
vegetables, fish and other
imported foods
Uruguay: 66% export, 34%
domestic
Argentina: 19% export,
81% domestic
Chile: biggest supplier of
local catering companies
20 plants in Brazil
(16 slaughtering,
4 processing)
3 plants in Argentina
(3 slaughtering)
5 plants in Uruguay
(slaughtering and
processing)
2 plants in Chile
(slaughtering)
Production Structure
ProductsBrand
PositioningSales
Channels
Super
Premium
Premium
Daily
Use
Processed
Beef
Export
Domestic Market
Food Service
In Natura
Processed
Lamb, leather and other
2Q14(% Brazil)
2Q14(%)
74%
18%
8%
41%
40%
19%

26Focus to Win
Improve cash
conversion – drive
efficiencies and asset
optimization
1Top line profitable
growth – focus on
strategic distribution
channels
2
Leverage our beef
sourcing potential in
South America to
increase sales to US,
Europe and Asia
3
Marfrig Beef|Key Strategic Goals
Grow in the
value added
product segment4
27Focus to Win
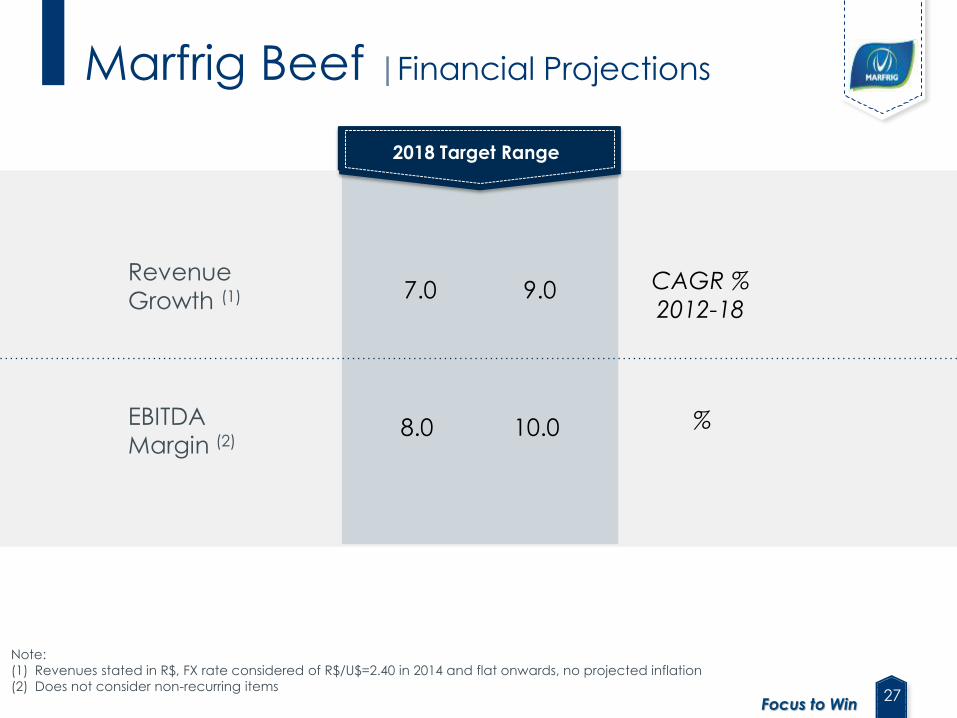
Marfrig Beef |Financial Projections
Revenue
Growth (1)
EBITDA
Margin (2)
Note:
(1) Revenues stated in R$, FX rate considered of R$/U$=2.40 in 2014 and flat onwards, no projected inflation
(2) Does not consider non-recurring items
%
CAGR %
2012-18
Faixa Alvo 2018
7.5 9.0
8.0 9.0
Faixa-alvo 2018
%
CAGR %
2012-187.0 9.0
8.0 10.0
Faixa Alvo 2018
7.0 9.0
8.0 10.0
Revenue
Growth (1)
EBITDA
Margin (2)
2018 Target Range

28Focus to Win
2Q14
FINANCIAL
PERFORMANCE

29Focus to Win
Main Accomplishments in 2Q14
• We remain on track to meeting our guidance for the year in all financial
indicators, which is an important step towards consolidating our operational
performance in line with our Focus to Win strategy.
• Sales above R$5.0 billion based on organic growth.
• EBITDA margins stable at levels above 7% in all business units for the third straight
quarter, despite the more challenging domestic market in Brazil.
• The net loss fell by 43% compared to 1Q14 and by more than 88% compared to
2Q13, representing the best result in the Company's recent history.
• Most balance sheet indicators remained stable, with the cash position
strengthening to close the quarter at over R$2.6 billion.
• Average debt cost down 90 bps, with the positive impacts observed already this
quarter.
30Focus to Win
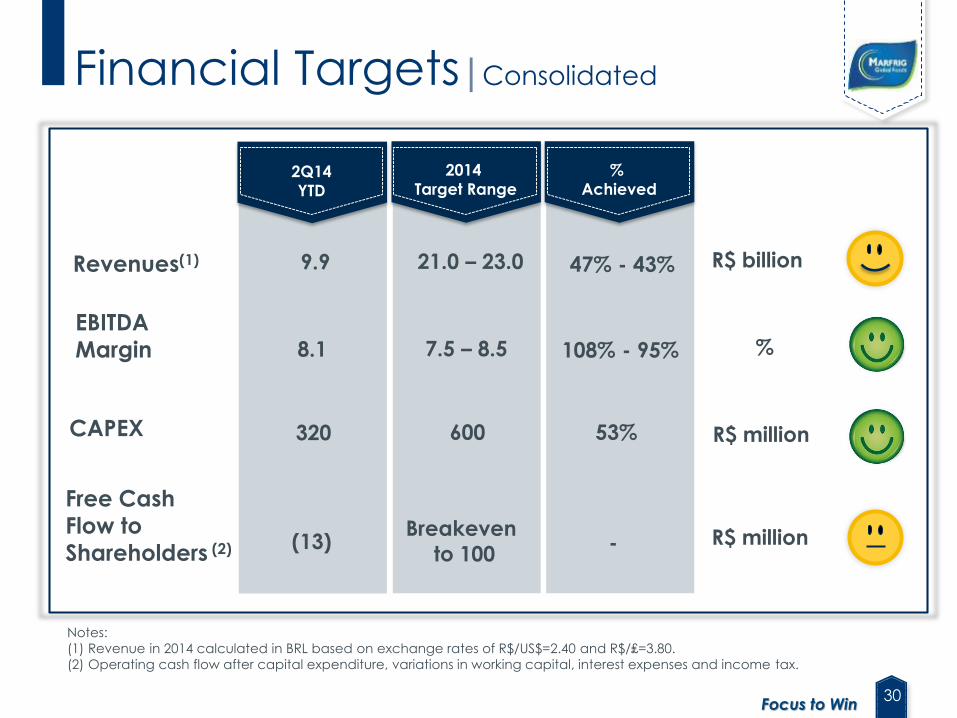
Notes:
(1) Revenue in 2014 calculated in BRL based on exchange rates of R$/US$=2.40 and R$/₤=3.80.
(2) Operating cash flow after capital expenditure, variations in working capital, interest expenses and income tax.
21.0 – 23.0
2014
Target Range
7.5 – 8.5
%
Achieved
%
R$ billion
Financial Targets|Consolidated
2Q14
YTD
47% - 43%
108% - 95%
9.9
8.1
Breakeven
to 100
R$ million
(13)
600 53%320
R$ million
EBITDAMargin
Revenues(1)
Free Cash Flow to
Shareholders (2)
CAPEX
-
31Focus to Win
2Q14 Highlights
Net Revenue / Margin
• Net Revenue in the quarter topped R$5.1 billion, with a strong performance by
exports from Brazil and solid sales growth in the international business units:
• Consolidated sales grew 14.9% from 2Q13, despite the challenging scenario in
the beef segment in Brazil's domestic market.
• The strong performance is explained in part by a record quarter in Uruguay, the
stronger sales at Moy Park and the exchange variation gain in the period.
• Moy Park: + 18.2% vs. 2Q13
• Keystone: + 10.0% vs. 2Q13
• Marfrig Beef: + 16.1% vs. 2Q13
32Focus to Win
2Q14 Highlights
Performance of Business Units
• EBITDA margin in excess of 7% at all business units for the third consecutive
quarter, signaling a new level of profitability in the Company’s operations:
• The good performance of the international operations (Moy Park and
Keystone), which accounted for 54% of consolidated revenue and 49% of
EBITDA.
• Excellent performance by Marfrig Beef in Uruguay, which counterbalanced
the challenging scenario in Brazil's domestic market.
• Moy Park: 7.0% vs. 5.9% in 2Q13
• Keystone: 7.1%, vs. 5.3% in 2Q13
• Marfrig Beef: 8.6% vs. 7.1% in 2Q13
33Focus to Win
2Q14 Highlights
Balance Sheet
• We successfully conducted a number of liability management exercises
throughout 6M14 that enabled the group to bring down its overall average
debt cost by 90 bps, from 7.9% p.y. in 1Q14 to 7% p.y. this quarter, whichgenerated annualized savings of R$60.0 million in financial expenses.
• Balance sheet ratios remained unchanged for the most part, with Net Debtdeclining from R$6.9 billion in 1Q14 to R$6.7 billion this quarter.
• All our bonds are trading in the secondary market at yields of under 7.9%.
• The cash position strengthened from R$1.8 billion at year-end 2013 to over
R$2.6 billion at the end of 6M14.
• The leverage ratio was relatively unchanged at 4x.
34Focus to Win
2Q14 HighlightsCash Flow
• Cash flow in the quarter was negative R$29.7 million, which is explained primarilyby the weaker operating performance in Brazil's domestic market, the
seasonality of investment projects that increased capital expenditure this quarter
and the reduction in interest expenses.
• This quarter, we also developed a receivables securitization vehicle (FIDC) that
we now can use as a conduit to sell non-recourse domestic receivables at
competitive interest rates.
• Moy Park and Keystone maintained positive free cash flow in the first half of2014.
• Our free cash flow position ended the first half at negative R$13.4 million.
• The reduction of over R$26 million in interest expenses in the second quarter
helped the group to cut by 43% the net loss posted in the first quarter.
• We remain committed to delivering on our 2014 Guidance.

35Focus to Win
4,455
4,944 4,9784,788
5,118
2Q13 3Q13 4Q13 1Q14 2Q14
Financial Performance|Consolidated
Net Revenue(R$ million)
Breakdown by Business(%)
2Q13 2Q14
Growth versus 2Q13:
Keystone: +10.0%
Marfrig Beef: +16.1%
Moy Park: +18.2%
25%
29%
46%
+ 14.9%
36Focus to Win
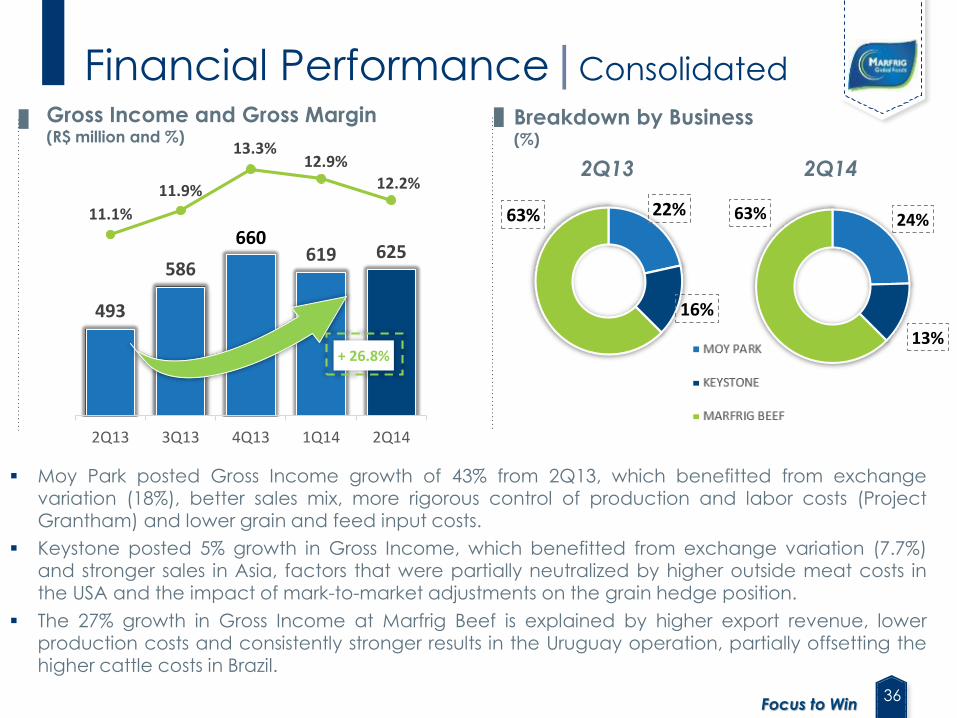
493
586
660619 625
11.1%
11.9%
13.3%12.9%
12.2%
2Q13 3Q13 4Q13 1Q14 2Q14
Breakdown by Business(%)
2Q13 2Q14
Moy Park posted Gross Income growth of 43% from 2Q13, which benefitted from exchangevariation (18%), better sales mix, more rigorous control of production and labor costs (ProjectGrantham) and lower grain and feed input costs.
Keystone posted 5% growth in Gross Income, which benefitted from exchange variation (7.7%)and stronger sales in Asia, factors that were partially neutralized by higher outside meat costs inthe USA and the impact of mark-to-market adjustments on the grain hedge position.
The 27% growth in Gross Income at Marfrig Beef is explained by higher export revenue, lowerproduction costs and consistently stronger results in the Uruguay operation, partially offsetting thehigher cattle costs in Brazil.
Financial Performance|Consolidated
Gross Income and Gross Margin(R$ million and %)
22%
16%
63% 24%
13%
63%
+ 26.8%

37Focus to Win
331 342373
357 369
7.4%
6.9%
7.5% 7.5%
7.2%
2Q13 3Q13 4Q13 1Q14 2Q14
Reduction of 20 bps in SG&A/NOR compared to 2Q13.
Moy Park registered an increase of 110 bps on higher freight and export expenses andcommercial and marketing investments to strengthen commercial ties with Key Accountsand support continued growth.
Keystone registered a drop of 220 bps in 2Q14, due to the revision of the provision for healthplans and receipt of insurance premiums, coupled with the continuous cost cutting initiatives.
Marfrig Beef registered an increase of 10 bps on increased selling expenses, driven mainly byhigher marketing expenses, which were partially offset by lower administrative expenses (e.g.,personnel and travel).
2Q13 2Q14
Breakdown by Business(%)
SG&A and SG&A/NOR(R$ million and %)
Financial Performance|Consolidated
27%
14%
59%32%
6%
62%
+ 11.4%

38Focus to Win
280
375
422403 398
6.3%
7.6%
8.5% 8.4%7.8%
2Q13 3Q13 4Q13 1Q14 2Q14
Breakdown by Business (%)
2Q13 2Q14
Consolidated Adjusted EBITDA Margin of 8.1%, in line with the target of our FOCUS TO WIN strategy
Financial Performance|Consolidated
Adjusted EBITDA and Margin(R$ million and %)
24%
24%
52%24%
25%
51%
Compared to 2Q13:
110 bps increase at Moy Park to 7.0%.
180 bps increase at Keystone to 7.1%.
150 bps increase at Marfrig Beef to 8.6%.
+ 42.1%

39Focus to Win
Net Debt – 1Q14 vs. 2Q14(R$ million)
Liquidity and Debt|Consolidated
6,8626,733
175
239
11
Dívida
Líquida1T14
Fluxo de Caixa
antes do
Capex
Capex Juros
Provisionados
Var. Cambial
da Dívida e
Caixa
Outros Dívida Líquida
2T14
(377)
(197)
38
230
177
Net Debt Cash Flow Capex Provisioned FX Variation on Other Net Debt
1Q14 before Capex Interest Cash and Debt 2Q14

40Focus to Win
* Current Liquidity = Current Assets / Current Liabilities
** Excludes the interest paid on the mandatorily
convertible debenture
Indicator 2Q14 1Q14
LTM EBITDA 1,813.6 2,275.4
Net Debt / LTM EBITDA 3.71x 3.02x
Net Debt / Annualized
Adj. EBITDA4.23x 4.25x
Net Debt / Total Assets 0.36x 0.38x
Cash and Eq. / Short
Term Debt2.52x 1.85x
Current Liquidity (*) 2.2 2.1
Duration (months) 54 52
Avg. Cost ** (p.a.) 7.0% 7.9%
Short Term (%) 11.2% 14.0%
Long Term (%) 88.8% 86.1%
In R$ (%) 4.1% 3.8%
Other Currencies (%) 95.9% 96.2%
Debt(R$ million)
Liquidity and Debt|Consolidated
2,169 1,492 1,123 1,295 1,054
6,733
8,928 7,635 7,817 7,960 8,336
2,657
11,097
9,127 8,940 9,255 9,390
Gross Debt2Q13
Gross Debt3Q13
Gross Debt4Q13
Gross Debt1Q13
Gross Debt2Q14
Cash andEquivalent
Net Debt2Q14
Long Term
Short Term

41Focus to Win
Maturity Schedule in 2Q14(R$ million)
Maturity Schedule in 1Q14(R$ million)
Short Term: R$ 1.1 billion
Liquidity and Debt|Consolidated
Short Term: R$ 1.3 billion

42Focus to Win
Cash Flow Bridge – 2Q14 (R$ million)
Cash Flow|Consolidated
As part of the ongoing efforts to improve working capital management, in 2Q14 we
focused on the line suppliers and lengthened the payment term while reducing
inventories, which dropped from 49 days in 1Q14 to 45 days this quarter. We also
recorded an impact from longer receivable terms at Marfrig Beef due to increased
exports.
(55.1)
427.0
(17.2)(26.4)
228.8
(127.6)(52.0)
377.4
(176.9)
200.6
(230.3)(29.7)
ResultadoLíquido
Itens que nãoafetam caixa
Contas areceber
de clientes
Estoques Fornecedores Outros Tributos FC Oper.antes de
Capex e Juros
Capex FC Oper. DespesaFinanceira
Fluxo decaixa livre

43Focus to Win
We recorded negative Free cash flow of R$29.7 million this quarter, which is primarily
explained by the seasonality of investment projects (R$30 million increase in capital
expenditure compared to 1Q14). On the other hand, the reduction in interest
expenses due to the liability management transactions made a positive contribution
to the result.
Free Cash Flow (after CAPEX and Interest)
(R$ million)
Cash Flow|Consolidated

44Focus to Win
6678
101 95 94
5.9%6.4%
7.6% 7.2% 7.0%
2Q13 3Q13 4Q13 1Q14 2Q14
Growth in sales revenue, influenced by the gain from exchange variation in the period (18%) and
the better domestic sales mix, especially in the UK and Ireland, with a higher concentration ofconvenience ready to eat and frozen coated poultry products.
Gross income growth of 43% from 2Q13, reflecting the investment in the Grantham Project(optimizing this processed food unit in England) that has been reducing production and laborcosts, combined with lower grains and feed input prices.
Growth of 41% in adjusted EBITDA, accompanied by margin expansion of 110 bps from 2Q13.
Moy Park 2Q14 Highlights
Net Revenue(R$ million)
Adjusted EBITDA and Margin(R$ million and %)
+ 18.2% + 41.4%
45Focus to Win
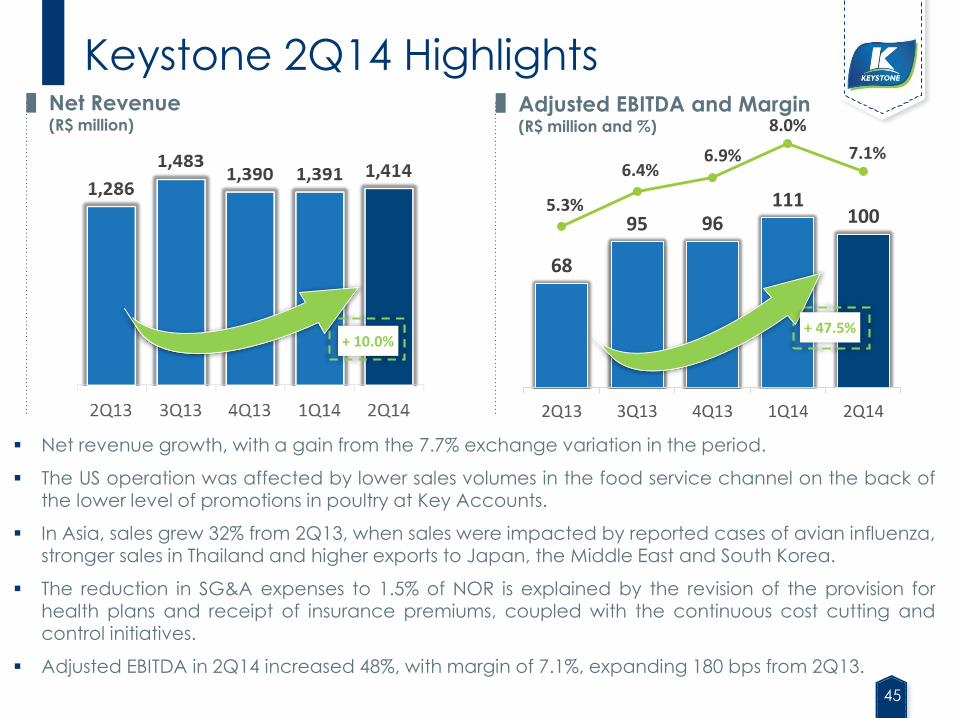
68
95 96111
1005.3%
6.4%6.9%
8.0%
7.1%
2Q13 3Q13 4Q13 1Q14 2Q14
Net revenue growth, with a gain from the 7.7% exchange variation in the period.
The US operation was affected by lower sales volumes in the food service channel on the back ofthe lower level of promotions in poultry at Key Accounts.
In Asia, sales grew 32% from 2Q13, when sales were impacted by reported cases of avian influenza,stronger sales in Thailand and higher exports to Japan, the Middle East and South Korea.
The reduction in SG&A expenses to 1.5% of NOR is explained by the revision of the provision forhealth plans and receipt of insurance premiums, coupled with the continuous cost cutting andcontrol initiatives.
Adjusted EBITDA in 2Q14 increased 48%, with margin of 7.1%, expanding 180 bps from 2Q13.
Keystone 2Q14 HighlightsNet Revenue(R$ million)
Adjusted EBITDA and Margin(R$ million and %)
+ 10.0%+ 47.5%

46Focus to Win
2,038
2,240 2,256
2,075
2,365
2Q13 3Q13 4Q13 1Q14 2Q14
145
202
226
197 203
7.1%
9.0%
10.0%9.5%
8.6%
2Q13 3Q13 4Q13 1Q14 2Q14
Net revenue growth of 16% from 2Q13, driven by the better performance of the food servicechannel in Brazil, the focus on growing exports and the average depreciation in the BRL againstthe USD of 7.7%.
Gross income grew 26.7% compared to 2Q13, mainly due to the consistent improvements in theUruguay operation and the gross income growth in the Brazilian operations due to the greaterfocus on exports.
Increase of 40% in adjusted EBITDA, with margin expansion of 150 bps from 2Q13, due to thebetter performance of the Uruguay operation and the restructuring of the Argentina operation.
Marfrig Beef 2Q14 Highlights
Net Revenue(R$ million)
Adjusted EBITDA and Margin(R$ million and %)
+ 16.1% + 39.9%

47Focus to Win
Net Income (Loss)(R$ million)
Financial Performance|Consolidated
+ 88.5%
The reduction in financial expenses contributed to reductions in the Net Loss of
43% compared to 1Q14 and 88% compared to 2Q13.
48Focus to Win
BONDS AND
EQUITY

49Focus to Win
Shareholder Structure|July, 2014
Total capital
520,747,405 shares49% Free float
253,939,253 shares
Source: Marfrig
BNDES
19.6%
MMS Part.
31.5%
Treasury0.1%
Board/Management
0.1%
6.3%
Other
42.4%
Others
1.4%
1.0%
1.3%
28.9%
26.8%
15.9%
1.4%
8.8%2.0%
0.6%
0.4%
2.2%
0.7%
8.6%

50Focus to Win
Bonds Performance| 2014
Source: Bloomberg
To Sep. 1st 2014
2020 2021
2017 2018
Repurchase
MRFG 2017
Repurchase
MRFG 2021
Retap
MRFG 2020
YTM Marfrig
51Focus to Win
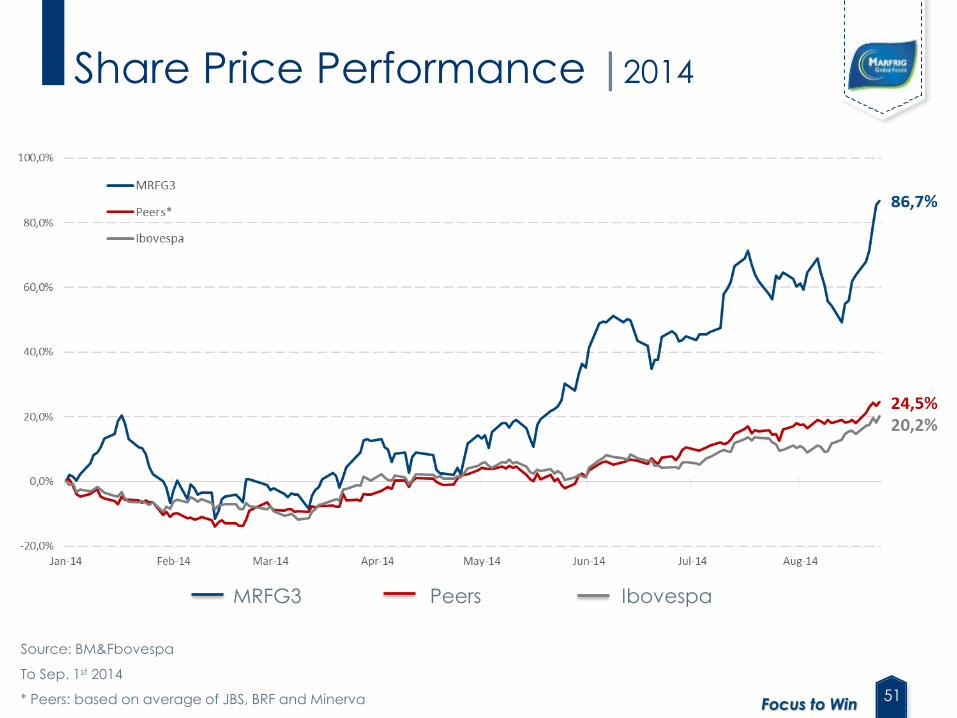
Share Price Performance |2014
MRFG3 Peers Ibovespa
Source: BM&Fbovespa
To Sep. 1st 2014
* Peers: based on average of JBS, BRF and Minerva

52Focus to Win
FINAL REMARKS
53Focus to Win
Final Remarks
Marfrig Beef
World beef demand continues to outstrip supply. The opening up of new markets toBrazilian beef leaves us optimistic on international prices. The highlights were the recent
announcements from China (2 plants authorized) and Russia (8 more plants authorized, fora total of 11 units).
Our Uruguay operation will continue to perform steadily in the 2H14.
With a potential scenario of prolonged weak consumer sentiment domestically, arelatively high cost environment and business resilience in a possible scenario of the
Brazilian real much stronger than R$2.23/US$, we have embarked on reducing the coststructure of our business. To achieve this goal, we are working with a comprehensiveproductivity agenda in our beef operation in Brazil aiming to keep the businesscompetitive and resilient. We are looking to pare back our cost structure by R$30 millionannually, with the benefits to be felt in 4Q14 through mid-2015.
The supply of cattle remains abundant in all countries in South America. In Brazil, we haveseen modest signals of cattle prices declining from the recent spike. The key question is notso much cattle prices, but rather the spread between cattle and domestic sales margins.We remain cautious on Brazil's consumer market for 3Q14, while 4Q14 is usually strong fordomestic sales.

54Focus to Win
Final Remarks
Moy Park
The business remains strong and is gaining new momentum among both existing and newclients, as shown by the recent sales trajectory.
To continue sustaining and uplifting margins, we will focus on three fronts:
improving the profitability of our convenience business by reducing SG&A expenses toeliminate unnecessary complexity;
continuing to focus on improving the profitability of our plants in France, which todayare running at EBITDA margins of around 4%, compared to negative margins a yearago;
analyzing how to best take advantage of a grain environment with structurally lower
prices, especially in 4Q14.
Our attention to customer service, responsiveness and quality will continue to receive ourutmost attention as part of our promise to our clients.
The greater exposure of the Moy Park brand during the World Cup should lead to gains in
regions where the brand carries a relevant position (United Kingdom and Ireland).

55Focus to Win
Final Remarks
Keystone
Given the current grain environment, there is no pressure on margins coming from this end.
Keystone continues to lead with best-in class SG&A management, with a ratio to sales of well below 4%.
The price scenario for third-party sourced chicken meat in the United States (we are 70%
integrated in the country) could remain challenging, though some recent signs indicate that price pressure might abate.
Our Asia operation is doing well and operating at full steam, benefitting from the impeccable track record in customer service and flawless execution in the industrial operations.

56Focus to Win
Final Remarks
Strategy
We continue to improve the group's operating performance and remain committed to our guidance. Margins have risen and remained reasonably stable for the third consecutive quarter.
We have seen a great level of interest in the beef supply chain from international investors. The current US beef picture should not change much in the near future and Australia will not be able to supply Asia by itself, given that demand continues to grow. At the same time, the industry has reached mature levels of consolidation in South America.
We continue to exploit alternatives to accelerate growth at both Moy Park and Keystone:
Moy Park successfully tapped the sterling bond market in May 2014, opening up ourstory to a host of new and important UK investors. We believe Moy Park could be well
positioned for an IPO if we decide to pursue that path.
Keystone’s growth remains centered on Asia and with a number of new selectiveclients. We have entertained a number of constructive discussions with several investorsinterested in taking a minority stake in the company in view of its prosperous future, butwe have not yet decided which path to ultimately take.
57Focus to Win
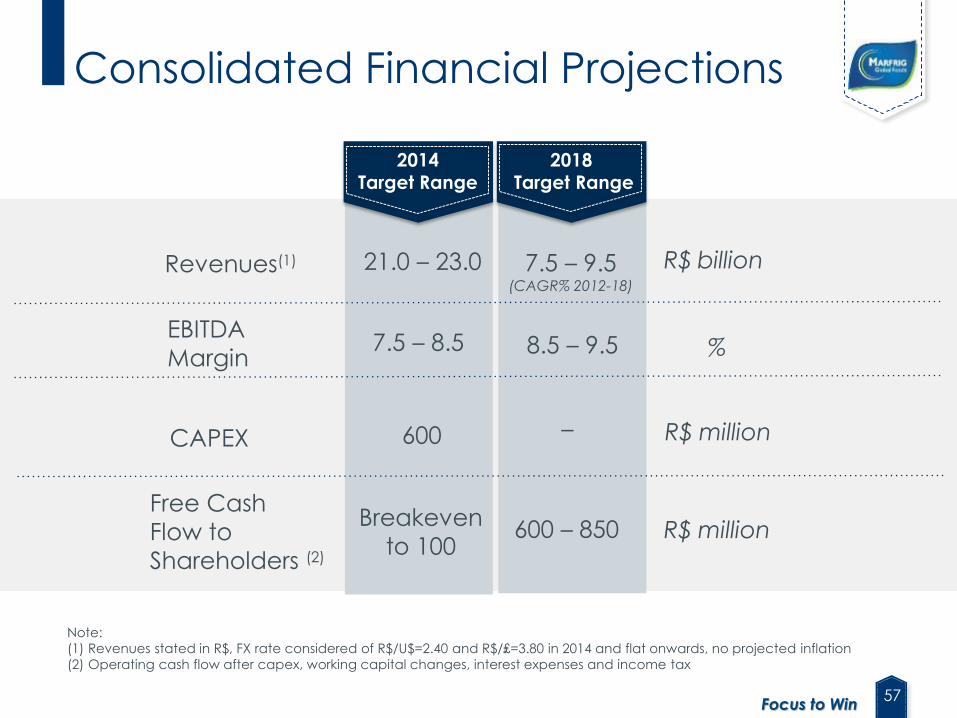
EBITDA
Margin
Note:
(1) Revenues stated in R$, FX rate considered of R$/U$=2.40 and R$/₤=3.80 in 2014 and flat onwards, no projected inflation
(2) Operating cash flow after capex, working capital changes, interest expenses and income tax
Revenues(1) 21.0 – 23.0
2014Target Range
7.5 – 9.5(CAGR% 2012-18)
7.5 – 8.5 8.5 – 9.5
2018Target Range
Free Cash
Flow to
Shareholders (2)
600 –
%
R$ billion
R$ millionCAPEX
Breakeven
to 100600 – 850 R$ million
Consolidated Financial Projections

58Focus to Win
Disclaimer
This material is a presentation of general information about MarfrigGlobal Foods S.A. and its consolidated subsidiaries (jointly the“Corporation”) on the date hereof. The information is presented insummary form and does not purport to be complete.
No representation or warranty, either expressed or implied, ismade regarding the accuracy or scope of the information herein.Neither the Company nor any of its affiliated companies,consultants or representatives undertake any responsibility for anylosses or damages arising from any of the information presented orcontained in this presentation. The information contained in thispresentation is up to date as of June 30, 2014, and, unless statedotherwise, is subject to change without prior notice. Neither theCorporation nor any of its affiliated companies, consultants orrepresentatives have signed any commitment to update suchinformation after the date hereof. This presentation should not beconstrued as a legal, tax or investment recommendation or anyother type of advice.
The data contained herein were obtained from various externalsources and the Corporation has not verified said data throughany independent source. Therefore, the Corporation makes nowarranties as to the accuracy or completeness of such data,which involve risks and uncertainties and are subject to changebased on various factors.
This presentation includes forward-looking statements. Suchstatements do not constitute historical fact and reflect the beliefsand expectations of the Corporation’s management. The words“anticipates,” “hopes,” “expects,” “estimates,” “intends,”“projects,” “plans,” “predicts,” “projects,” “aims” and other similarexpressions are used to identify such statements.
Although the Corporation believes that the expectations andassumptions reflected by these forward-looking statements arereasonable and based on the information currently available to itsmanagement, it cannot guarantee results or future events. Suchforward-looking statements should be considered with caution,since actual results may differ materially from those expressed orimplied by such statements. Securities are prohibited from beingoffered or sold in the United States unless they are registered orexempt from registration in accordance with the U.S. SecuritiesAct of 1933, as amended (“Securities Act”). Any future offering ofsecurities must be made exclusively through an offeringmemorandum. This presentation does not constitute an offer,invitation or solicitation to subscribe or acquire any securities, andno part of this presentation nor any information or statementcontained herein should be used as the basis for or considered inconnection with any contract or commitment of any nature. Anydecision to buy securities in any offering conducted by theCorporation should be based solely on the information containedin the offering documents, which may be published or distributedopportunely in connection with any security offering conductedby the Company, depending on the case.

59Focus to Win
IR Contacts
Website
www.marfrig.com.br/ir
Address
Avenida
Chedid Jafet, 222
Bloco A - 5th floor
São Paulo - SP - Brasil
+55 (11)
3792-8650
3792-8600
Telephone
@