april 2013 - hsbc global asset management · hsbc flexi debt fund pg 44 ... are gaining ground on a...
TRANSCRIPT

April 2013

Index
1
In this Issue ...
Fund Manager Commentary Pg 2
HSBC Equity Fund Pg 6
HSBC India Opportunities Fund Pg 8
HSBC Midcap Equity Fund Pg 10
HSBC Progressive Themes Fund Pg 12
HSBC Tax Saver Equity Fund Pg 14
HSBC Unique Opportunities Fund Pg 16
HSBC Dynamic Fund Pg 18
HSBC Emerging Markets Fund Pg 20
HSBC Small Cap Fund Pg 21
HSBC Brazil Fund Pg 23
Fund Managers - Equity Pg 24
Comparative Performance of Equity Schemes Pg 26
HSBC MIP - Savings Plan Pg 29
HSBC MIP - Regular Plan Pg 31
HSBC Income Fund - Investment Plan Pg 33
HSBC Income Fund - Short Term Plan Pg 35
HSBC Floating Rate Fund - Long Term Plan Pg 37
HSBC Cash Fund Pg 39
HSBC Gilt Fund Pg 41
HSBC Ultra Short Term Bond Fund Pg 42
HSBC Flexi Debt Fund Pg 44
Fund Managers - MIP & Debt Pg 46
Comparative Performance of MIP & Debt Schemes Pg 47
Fund Manager Commentary April 2013
2
Equity & MIP
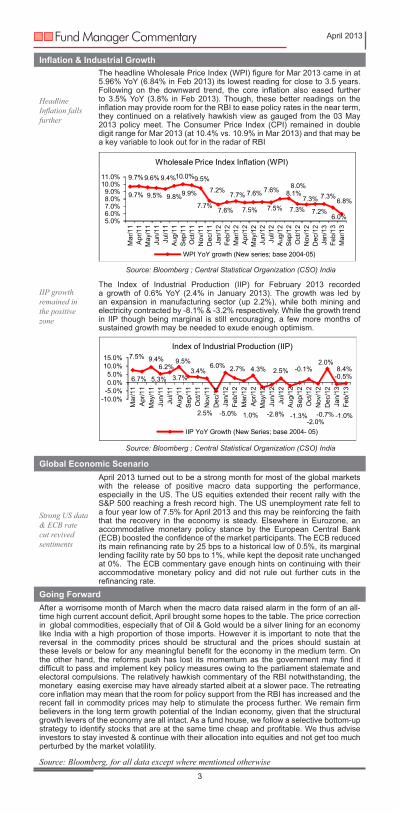
Market UpdateBuoyed by a reversal in global commodity prices, the domestic equity market rallied in April 2013 and delivered the best monthly returns since Nov 2012 With a correction in two key import items, Crude & Gold, hopes are gaining ground on a likely turnaround in India’s macro-economic indicators. There were also expectations building up domestically that a correction in commodities may rein in inflation faster than expected and the central bank may be able to embark on the loosening cycle swifter than anticipated. The RBI however stuck to a measured stance during the Annual Monetary policy meet during early May 2013 and reduced the policy repo rate by 25 bps contrary to the street optimism after the correction In commodity prices. On the other hand, a decent 4QFY13 performance by the corporate segment has also supported the positive sentiments at the market place. However, hopes of getting back to the reforms agenda received a set back as the budget session was disrupted by the opposition over the contentious issues of coal allocation & 2G spectrum scams. The finance bill being a constitutional requirement was the only bill which was passed, while the fate of the Food Security, Insurance & Pension bills appear bleak in this session. The logjam in the parliament may derail the follow - on reform measures intended by the central government and may seriously dampen the market confidence.
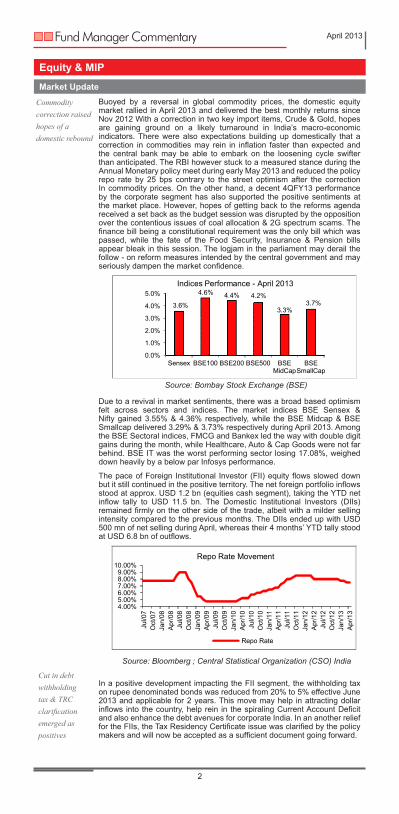
Due to a revival in market sentiments, there was a broad based optimism felt across sectors and indices. The market indices BSE Sensex & Nifty gained 3.55% & 4.36% respectively, while the BSE Midcap & BSE Smallcap delivered 3.29% & 3.73% respectively during April 2013. Among the BSE Sectoral indices, FMCG and Bankex led the way with double digit gains during the month, while Healthcare, Auto & Cap Goods were not far behind. BSE IT was the worst performing sector losing 17.08%, weighed down heavily by a below par Infosys performance.
The pace of Foreign Institutional Investor (FII) equity flows slowed down but it still continued in the positive territory. The net foreign portfolio inflows stood at approx. USD 1.2 bn (equities cash segment), taking the YTD net inflow tally to USD 11.5 bn. The Domestic Institutional Investors (DIIs) remained firmly on the other side of the trade, albeit with a milder selling intensity compared to the previous months. The DIIs ended up with USD 500 mn of net selling during April, whereas their 4 months’ YTD tally stood at USD 6.8 bn of outflows.
In a positive development impacting the FII segment, the withholding tax on rupee denominated bonds was reduced from 20% to 5% effective June 2013 and applicable for 2 years. This move may help in attracting dollar inflows into the country, help rein in the spiraling Current Account Deficit and also enhance the debt avenues for corporate India. In an another relief for the FIIs, the Tax Residency Certificate issue was clarified by the policy makers and will now be accepted as a sufficient document going forward.
Cut in debt withholding tax & TRC clarification emerged as positives
Commodity correction raised hopes of a domestic rebound
Source: Bloomberg ; Central Statistical Organization (CSO) India
Source: Bombay Stock Exchange (BSE)
0.0%
1.0%
2.0%
3.0%
4.0%
5.0%
Sensex BSE100 BSE200 BSE500 BSEMidCap
BSESmallCap
3.6%
4.6% 4.4% 4.2%
3.3% 3.7%
Indices Performance - April 2013
4.00%5.00%6.00%7.00%8.00%9.00%
10.00%
Jul/0
7O
ct/0
7Ja
n/08
Apr
/08
Jul/0
8O
ct/0
8Ja
n/09
Apr
/09
Jul/0
9O
ct/0
9Ja
n/10
Apr
/10
Jul/1
0O
ct/1
0Ja
n/11
Apr
/11
Jul/1
1O
ct/1
1Ja
n/12
Apr
/12
Jul/1
2O
ct/1
2Ja
n/13
Apr
/13
Repo Rate Movement
Repo Rate
Inflation & Industrial Growth
Headline Inflation falls further
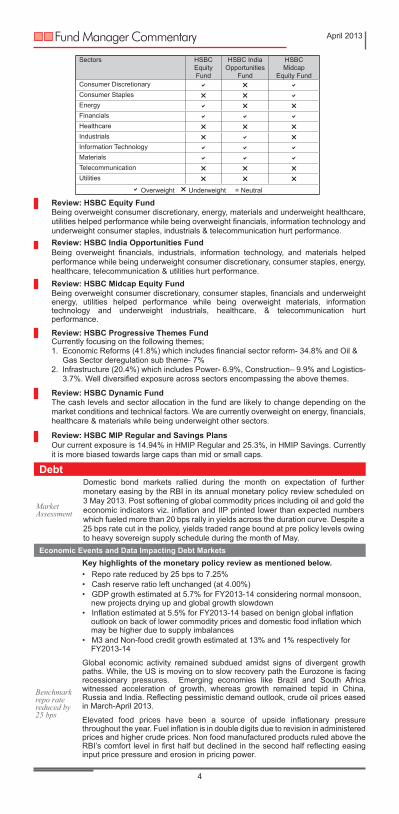
The headline Wholesale Price Index (WPI) figure for Mar 2013 came in at 5.96% YoY (6.84% in Feb 2013) its lowest reading for close to 3.5 years. Following on the downward trend, the core inflation also eased further to 3.5% YoY (3.8% in Feb 2013). Though, these better readings on the inflation may provide room for the RBI to ease policy rates in the near term, they continued on a relatively hawkish view as gauged from the 03 May 2013 policy meet. The Consumer Price Index (CPI) remained in double digit range for Mar 2013 (at 10.4% vs. 10.9% in Mar 2013) and that may be a key variable to look out for in the radar of RBI
IIP growth remained in the positive zone
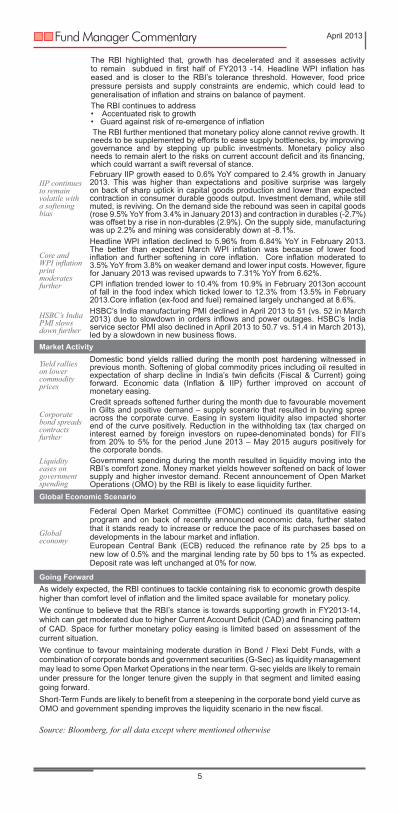
The Index of Industrial Production (IIP) for February 2013 recorded a growth of 0.6% YoY (2.4% in January 2013). The growth was led by an expansion in manufacturing sector (up 2.2%), while both mining and electricity contracted by -8.1% & -3.2% respectively. While the growth trend in IIP though being marginal is still encouraging, a few more months of sustained growth may be needed to exude enough optimism.
Global Economic Scenario
Strong US data & ECB rate cut revived sentiments
April 2013 turned out to be a strong month for most of the global markets with the release of positive macro data supporting the performance, especially in the US. The US equities extended their recent rally with the S&P 500 reaching a fresh record high. The US unemployment rate fell to a four year low of 7.5% for April 2013 and this may be reinforcing the faith that the recovery in the economy is steady. Elsewhere in Eurozone, an accommodative monetary policy stance by the European Central Bank (ECB) boosted the confidence of the market participants. The ECB reduced its main refinancing rate by 25 bps to a historical low of 0.5%, its marginal lending facility rate by 50 bps to 1%, while kept the deposit rate unchanged at 0%. The ECB commentary gave enough hints on continuing with their accommodative monetary policy and did not rule out further cuts in the refinancing rate.
Going ForwardAfter a worrisome month of March when the macro data raised alarm in the form of an all-time high current account deficit, April brought some hopes to the table. The price correction in global commodities, especially that of Oil & Gold would be a silver lining for an economy like India with a high proportion of those imports. However it is important to note that the reversal in the commodity prices should be structural and the prices should sustain at these levels or below for any meaningful benefit for the economy in the medium term. On the other hand, the reforms push has lost its momentum as the government may find it difficult to pass and implement key policy measures owing to the parliament stalemate and electoral compulsions. The relatively hawkish commentary of the RBI notwithstanding, the monetary easing exercise may have already started albeit at a slower pace. The retreating core inflation may mean that the room for policy support from the RBI has increased and the recent fall in commodity prices may help to stimulate the process further. We remain firm believers in the long term growth potential of the Indian economy, given that the structural growth levers of the economy are all intact. As a fund house, we follow a selective bottom-up strategy to identify stocks that are at the same time cheap and profitable. We thus advise investors to stay invested & continue with their allocation into equities and not get too much perturbed by the market volatility.
Source: Bloomberg, for all data except where mentioned otherwise
Fund Manager Commentary April 2013
3
Source: Bloomberg ; Central Statistical Organization (CSO) India
Source: Bloomberg ; Central Statistical Organization (CSO) India
9.7%
9.7%
9.6%
9.5%
9.4%
9.8%
10.0%
9.9%
9.5%
7.7%
7.2%
7.6%
7.7%
7.5%
7.6% 7.6%
7.5%
8.0% 8.1%
7.3% 7.2%
7.3% 7.3% 6.8%
6.0% 5.0%6.0%7.0%8.0%9.0%
10.0%11.0%
Mar
/11
Apr
/11
May
/11
Jun/
11Ju
l/11
Aug
/11
Sep
/11
Oct
/11
Nov
/11
Dec
/11
Jan/
12Fe
b/12
Mar
/12
Apr
/12
May
/12
Jun/
12Ju
l/12
Aug
/12
Sep
/12
Oct
/12
Nov
/12
Dec
/12
Jan/
13Fe
b/13
Mar
/13
Wholesale Price Index Inflation (WPI)
WPI YoY growth (New series; base 2004-05)
7.5%
6.7%
9.4%
5.3%
6.2% 9.5%
3.7% 3.4%
2.5% -5.0%
6.0% 2.7%
1.0%
4.3%
-2.8% -1.3%
2.5%
-2.0%
-0.1% 2.0%
-0.7%
8.4%
-1.0%
-0.5%
-10.0%-5.0%0.0%5.0%
10.0%15.0%
Mar
/11
Apr
/11
May
/11
Jun/
11Ju
l/11
Aug
/11
Sep
/11
Oct
/11
Nov
/11
Dec
/11
Jan/
12Fe
b/12
Mar
/12
Apr
/12
May
/12
Jun/
12Ju
l/12
Aug
/12
Sep
/12
Oct
/12
Nov
/12
Dec
/12
Jan/
13Fe
b/13
Index of Industrial Production (IIP)
IIP YoY Growth (New Series; base 2004- 05)
Fund Manager Commentary April 2013
4
Review: HSBC Progressive Themes FundCurrently focusing on the following themes; 1. Economic Reforms (41.8%) which includes financial sector reform- 34.8% and Oil & Gas Sector deregulation sub theme- 7%2. Infrastructure (20.4%) which includes Power- 6.9%, Construction– 9.9% and Logistics- 3.7%. Well diversified exposure across sectors encompassing the above themes.
Review: HSBC Dynamic FundThe cash levels and sector allocation in the fund are likely to change depending on the market conditions and technical factors. We are currently overweight on energy, financials, healthcare & materials while being underweight other sectors.
Review: HSBC MIP Regular and Savings PlansOur current exposure is 14.94% in HMIP Regular and 25.3%, in HMIP Savings. Currently it is more biased towards large caps than mid or small caps.
Review: HSBC Midcap Equity FundBeing overweight consumer discretionary, consumer staples, financials and underweight energy, utilities helped performance while being overweight materials, information technology and underweight industrials, healthcare, & telecommunication hurt performance.
Sectors HSBC Equity Fund
HSBC India Opportunities
Fund
HSBCMidcap
Equity FundConsumer Discretionary Consumer Staples Energy Financials Healthcare Industrials Information Technology Materials Telecommunication Utilities
Overweight Underweight = Neutral
Review: HSBC India Opportunities FundBeing overweight financials, industrials, information technology, and materials helped performance while being underweight consumer discretionary, consumer staples, energy, healthcare, telecommunication & utilities hurt performance.
Review: HSBC Equity FundBeing overweight consumer discretionary, energy, materials and underweight healthcare, utilities helped performance while being overweight financials, information technology and underweight consumer staples, industrials & telecommunication hurt performance.
Debt
Market Assessment
Domestic bond markets rallied during the month on expectation of further monetary easing by the RBI in its annual monetary policy review scheduled on 3 May 2013. Post softening of global commodity prices including oil and gold the economic indicators viz. inflation and IIP printed lower than expected numbers which fueled more than 20 bps rally in yields across the duration curve. Despite a 25 bps rate cut in the policy, yields traded range bound at pre policy levels owing to heavy sovereign supply schedule during the month of May.
Economic Events and Data Impacting Debt Markets
Benchmark repo rate reduced by 25 bps
Key highlights of the monetary policy review as mentioned below.• Repo rate reduced by 25 bps to 7.25%• Cash reserve ratio left unchanged (at 4.00%)• GDP growth estimated at 5.7% for FY2013-14 considering normal monsoon, new projects drying up and global growth slowdown• Inflation estimated at 5.5% for FY2013-14 based on benign global inflation outlook on back of lower commodity prices and domestic food inflation which may be higher due to supply imbalances• M3 and Non-food credit growth estimated at 13% and 1% respectively for FY2013-14 Global economic activity remained subdued amidst signs of divergent growth paths. While, the US is moving on to slow recovery path the Eurozone is facing recessionary pressures. Emerging economies like Brazil and South Africa witnessed acceleration of growth, whereas growth remained tepid in China, Russia and India. Reflecting pessimistic demand outlook, crude oil prices eased in March-April 2013.
Elevated food prices have been a source of upside inflationary pressure throughout the year. Fuel inflation is in double digits due to revision in administered prices and higher crude prices. Non food manufactured products ruled above the RBI’s comfort level in first half but declined in the second half reflecting easing input price pressure and erosion in pricing power.
The RBI highlighted that, growth has decelerated and it assesses activity to remain subdued in first half of FY2013 -14. Headline WPI inflation has eased and is closer to the RBI’s tolerance threshold. However, food price pressure persists and supply constraints are endemic, which could lead to generalisation of inflation and strains on balance of payment.The RBI continues to address• Accentuated risk to growth• Guard against risk of re-emergence of inflation The RBI further mentioned that monetary policy alone cannot revive growth. It needs to be supplemented by efforts to ease supply bottlenecks, by improving governance and by stepping up public investments. Monetary policy also needs to remain alert to the risks on current account deficit and its financing, which could warrant a swift reversal of stance.
IIP continues to remain volatile with a softening bias
February IIP growth eased to 0.6% YoY compared to 2.4% growth in January 2013. This was higher than expectations and positive surprise was largely on back of sharp uptick in capital goods production and lower than expected contraction in consumer durable goods output. Investment demand, while still muted, is reviving. On the demand side the rebound was seen in capital goods (rose 9.5% YoY from 3.4% in January 2013) and contraction in durables (-2.7%) was offset by a rise in non-durables (2.9%). On the supply side, manufacturing was up 2.2% and mining was considerably down at -8.1%.
Core and WPI inflation print moderates further
Headline WPI inflation declined to 5.96% from 6.84% YoY in February 2013. The better than expected March WPI inflation was because of lower food inflation and further softening in core inflation. Core inflation moderated to 3.5% YoY from 3.8% on weaker demand and lower input costs. However, figure for January 2013 was revised upwards to 7.31% YoY from 6.62%.CPI inflation trended lower to 10.4% from 10.9% in February 2013on account of fall in the food index which ticked lower to 12.3% from 13.5% in February 2013.Core inflation (ex-food and fuel) remained largely unchanged at 8.6%.
HSBC’s India PMI slows down further
HSBC’s India manufacturing PMI declined in April 2013 to 51 (vs. 52 in March 2013) due to slowdown in orders inflows and power outages. HSBC’s India service sector PMI also declined in April 2013 to 50.7 vs. 51.4 in March 2013), led by a slowdown in new business flows.
Market Activity
Yield rallies on lower commodity prices
Domestic bond yields rallied during the month post hardening witnessed in previous month. Softening of global commodity prices including oil resulted in expectation of sharp decline in India’s twin deficits (Fiscal & Current) going forward. Economic data (Inflation & IIP) further improved on account of monetary easing.
Corporate bond spreads contracts further
Credit spreads softened further during the month due to favourable movement in Gilts and positive demand – supply scenario that resulted in buying spree across the corporate curve. Easing in system liquidity also impacted shorter end of the curve positively. Reduction in the withholding tax (tax charged on interest earned by foreign investors on rupee-denominated bonds) for FII’s from 20% to 5% for the period June 2013 – May 2015 augurs positively for the corporate bonds.
Liquidity eases on government spending
Government spending during the month resulted in liquidity moving into the RBI’s comfort zone. Money market yields however softened on back of lower supply and higher investor demand. Recent announcement of Open Market Operations (OMO) by the RBI is likely to ease liquidity further.
Global Economic Scenario
Global economy
Federal Open Market Committee (FOMC) continued its quantitative easing program and on back of recently announced economic data, further stated that it stands ready to increase or reduce the pace of its purchases based on developments in the labour market and inflation. European Central Bank (ECB) reduced the refinance rate by 25 bps to a new low of 0.5% and the marginal lending rate by 50 bps to 1% as expected. Deposit rate was left unchanged at 0% for now.
Going ForwardAs widely expected, the RBI continues to tackle containing risk to economic growth despite higher than comfort level of inflation and the limited space available for monetary policy. We continue to believe that the RBI’s stance is towards supporting growth in FY2013-14, which can get moderated due to higher Current Account Deficit (CAD) and financing pattern of CAD. Space for further monetary policy easing is limited based on assessment of the current situation.We continue to favour maintaining moderate duration in Bond / Flexi Debt Funds, with a combination of corporate bonds and government securities (G-Sec) as liquidity management may lead to some Open Market Operations in the near term. G-sec yields are likely to remain under pressure for the longer tenure given the supply in that segment and limited easing going forward. Short-Term Funds are likely to benefit from a steepening in the corporate bond yield curve as OMO and government spending improves the liquidity scenario in the new fiscal.
Source: Bloomberg, for all data except where mentioned otherwise
Fund Manager Commentary April 2013
5

An Open Ended Diversified Equity SchemeInvestment Objective: Aims to generate long term capital growth from an actively managed portfolio of equity and equity related securities.
Issuer Market Value(` in Lacs)
% to NetAssets
Auto Bajaj Auto 1,504.32 2.75%Tata Motors 1,275.00 2.33%Hero Motocorp 1,184.00 2.16%Auto AncillariesApollo Tyres 1,158.80 2.11%Banks ICICI Bank 4,375.32 7.98%HDFC Bank 3,002.12 5.48%State Bank of India 1,811.44 3.31%Federal Bank 1,369.35 2.50%Bank of Baroda 1,223.16 2.23%CementGrasim Industries 2,344.76 4.28%Construction ProjectsLarsen & Toubro 2,117.08 3.86%Consumer Non DurablesI T C 3,946.20 7.20%Fertilisers Coromandel International 593.00 1.08%Finance HDFC 2,881.84 5.26%LIC Housing Finance 730.95 1.33%Gas GAIL (India) 948.11 1.73%Industrial Capital GoodsBharat Heavy Electricals 578.25 1.06%Minerals/Mining Coal India 957.60 1.75%Non Ferrous Metals Hindustan Zinc 2,025.55 3.70%Oil Oil & Natural Gas Corporation 2,613.60 4.77%Cairn India 1,092.00 1.99%Petroleum Products Reliance Industries 2,758.70 5.03%Bharat Petroleum Corporation 1,242.75 2.27%Pharmaceuticals Dr Reddy’s Laboratories 2,007.92 3.66%Cadila Healthcare 785.25 1.43%Power NTPC 1,101.45 2.01%Software Infosys 2,570.77 4.69%Tata Consultancy Services 1,791.92 3.27%Tech Mahindra 1,239.43 2.26%
HSBC Equity Fund (HEF) April 2013
6

Issuer Market Value(` in Lacs)
% to NetAssets
Telecom - Services Bharti Airtel 1,115.63 2.04%Textile Products Arvind 1,113.25 2.03%Total 97.55%CBLOs 1,662.31 3.03%Other Equity Investments 627.65 1.15%Net Current Assets -947.40 -1.73%Total Net Assets as on 30 April 2013 54,802.06 100.00%
Asset AllocationAuto 7.23%Auto Ancillaries 2.11%Banks 21.50%Cement 4.28%Construction Projects 3.86%Consumer Non Durables 7.20%Fertilisers 1.08%Finance 6.59%Gas 1.73%Industrial Capital Goods 1.06%Minerals/Mining 1.75%Non - Ferrous Metals 3.70%Oil 6.76%Petroleum Products 7.30%Pharmaceuticals 5.10%Power 2.01%Software 10.22%Telecom - Services 2.04%Textile - Products 2.03%Reverse Repos/CBLOs 3.03%Net Current Assets -1.73%Other Equity Investments 1.15%Total Net Assets 100.00%
Dividend DeclarationRecord Date / period of
dividend declaredDividend (` per unit)
Non-InstitutionalDividend (` per unit)
InstitutionalNAV (`) per unit(cum dividend)
HSBC Equity Fund - Dividend28-May-10 1.50 1.50 26.691119-Nov-10 2.00 2.00 29.324422-Feb-13 2.50 2.50 26.1962HSBC Equity Fund - Dividend Direct Plan22-Feb-13 2.50 2.50 26.2505
Date of Allotment 10-Dec-02Benchmark S&P BSE 200NAV (Growth) per unit(as on 30.04.13)
` 103.4724
Fund Manager Tushar PradhanSIP AvailableMinimumApplicationAmount
` 10,000` 1,000 p.m.(SIP)
Exit Load@ NilStatistical Ratios
Standard Deviation 0.86%R-Squared 0.9627Beta (Slope) 0.9102Sharpe Ratio -0.0229Annualised Expense Ratio from 01 April 2013 onwards 2.65%Portfolio Turnover 0.12
Statistical ratios disclosed as per daily returns of the last 3 years/since inception, whichever is later. @ Effective from March 1, 2013 for prospective investments. Risk free rate: 7.73% as on April 30, 2013.
HSBC Equity Fund (HEF) April 2013
7
Upon payment of dividend, the NAV per unit falls to the extent of payout and statutory levy, if any. Face value: `10 per unit.

An Open Ended Flexi-Cap Equity SchemeInvestment Objective: Seeks long term capital growth through investments across all market capitalisations, including small, mid and large cap stocks. It aims to be predominantly invested in equity & equity related securities. However it could move a significant portion of its assets towards fixed income securities if the fund manager becomes negative on equity markets.
Issuer Market Value(` in Lacs)
% to NetAssets
Auto Tata Motors 600.00 2.83%Eicher Motors 591.68 2.79%Auto Ancillaries Bosch 622.86 2.94%Apollo Tyres 579.60 2.73%Banks ICICI Bank 1,369.03 6.46%HDFC Bank 852.88 4.02%State Bank of India 600.49 2.83%Punjab National Bank 499.14 2.35%Bank of Baroda 489.27 2.31%Cement Shree Cements 607.74 2.87%ChemicalsSupreme Industries 511.61 2.41%Construction ProjectsLarsen & Toubro 684.27 3.23%Consumer Non Durables I T C 892.83 4.21%Finance HDFC 674.69 3.18%LIC Housing Finance 661.51 3.12%Power Finance Corporation 617.67 2.91%CRISIL 402.08 1.90%GasPetronet LNG 523.31 2.47%Industrial Capital GoodsCrompton Greaves 599.30 2.83%Industrial ProductsCarborundum Universal 398.72 1.88%Sintex Industries 361.15 1.70%Minerals/Mining Gujarat Mineral Development Corporation 244.27 1.15%Non - Ferrous Metals Hindalco Industries 389.00 1.83%Hindustan Zinc 235.92 1.11%Oil Oil & Natural Gas Corporation 591.33 2.79%PesticidesUnited Phosphorus 635.18 3.00%Petroleum Products Reliance Industries 713.32 3.36%Pharmaceuticals Divi's Laboratories 537.43 2.54%Dr Reddy’s Laboratories 405.64 1.91%Software Infosys 809.23 3.82%Tech Mahindra 571.95 2.70%Eclerx Services 499.65 2.36%Polaris Software Lab 432.08 2.04%Tata Consultancy Services 413.52 1.95%Telecom - ServicesBharti Airtel 350.63 1.65%Total 94.19%
HSBC India Opportunities Fund (HIOF) April 2013
8

Issuer Market Value(` in Lacs)
% to NetAssets
CBLOs 1,262.52 5.96%Other Equity Investments 521.83 2.46%Net Current Assets -553.21 -2.61%Total Net Assets as on 30 April 2013 21,200.11 100.00%
Asset AllocationAuto 5.62%Auto Ancillaries 5.67%Banks 17.98%Cement 2.87%Chemicals 2.41%Construction Projects 3.23%Consumer Non Durables 4.21%Finance 11.11%Gas 2.47%Industrial Capital Goods 2.83%Industrial Products 3.58%Minerals/Mining 1.15%Non - Ferrous Metals 2.95%Oil 2.79%Pesticides 3.00%Petroleum Products 3.36%Pharmaceuticals 4.45%Software 12.86%Telecom - Services 1.65%Reverse Repos/CBLOs 5.96%Net Current Assets -2.61%Other Equity Investments 2.46%Total Net Assets 100.00%
Dividend DeclarationRecord Date / period of
dividend declaredDividend (` per unit)
Non-InstitutionalDividend (` per unit)
InstitutionalNAV (`) per unit(cum dividend)
HSBC India Opportunities Fund - Dividend11-Dec-09 1.00 1.00 16.901319-Nov-10 1.00 1.00 18.23134-Feb-13 1.50 1.50 17.7319HSBC India Opportunities Fund - Dividend Direct Plan4-Feb-13 1.50 1.50 17.7519
Date of Allotment 24-Feb-04Benchmark S&P BSE 500NAV (Growth) per unit(as on 30.04.13)
` 35.8201
Fund Manager Tushar PradhanSIP AvailableMinimumApplication Amount
` 10,000` 1,000 p.m.(SIP)
Exit Load@ NilStatistical Ratios
Standard Deviation 0.80%R-Squared 0.9459Beta (Slope) 0.8551Sharpe Ratio -0.0229Annualised Expense Ratio from 01 April 2013 onwards 2.78%Portfolio Turnover 0.39
Statistical ratios disclosed as per daily returns of the last 3 years/since inception, whichever is later. @ Effective from March 1, 2013 for prospective investments.Risk free rate: 7.73% as on April 30, 2013.
HSBC India Opportunities Fund (HIOF) April 2013
9
Upon payment of dividend, the NAV per unit falls to the extent of payout and statutory levy, if any. Face value: `10 per unit.
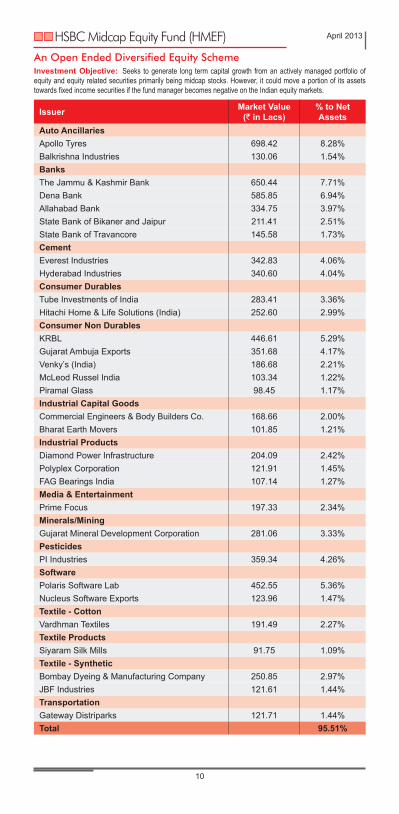
An Open Ended Diversified Equity SchemeInvestment Objective: Seeks to generate long term capital growth from an actively managed portfolio of equity and equity related securities primarily being midcap stocks. However, it could move a portion of its assets towards fixed income securities if the fund manager becomes negative on the Indian equity markets.
Issuer Market Value(` in Lacs)
% to NetAssets
Auto Ancillaries Apollo Tyres 698.42 8.28%Balkrishna Industries 130.06 1.54%Banks The Jammu & Kashmir Bank 650.44 7.71%Dena Bank 585.85 6.94%Allahabad Bank 334.75 3.97%State Bank of Bikaner and Jaipur 211.41 2.51%State Bank of Travancore 145.58 1.73%CementEverest Industries 342.83 4.06%Hyderabad Industries 340.60 4.04%Consumer Durables Tube Investments of India 283.41 3.36%Hitachi Home & Life Solutions (India) 252.60 2.99%Consumer Non DurablesKRBL 446.61 5.29%Gujarat Ambuja Exports 351.68 4.17%Venky’s (India) 186.68 2.21%McLeod Russel India 103.34 1.22%Piramal Glass 98.45 1.17%Industrial Capital GoodsCommercial Engineers & Body Builders Co. 168.66 2.00%Bharat Earth Movers 101.85 1.21%Industrial Products Diamond Power Infrastructure 204.09 2.42%Polyplex Corporation 121.91 1.45%FAG Bearings India 107.14 1.27%Media & EntertainmentPrime Focus 197.33 2.34%Minerals/Mining Gujarat Mineral Development Corporation 281.06 3.33%PesticidesPI Industries 359.34 4.26%Software Polaris Software Lab 452.55 5.36%Nucleus Software Exports 123.96 1.47%Textile - CottonVardhman Textiles 191.49 2.27%Textile ProductsSiyaram Silk Mills 91.75 1.09%Textile - Synthetic Bombay Dyeing & Manufacturing Company 250.85 2.97%JBF Industries 121.61 1.44%Transportation Gateway Distriparks 121.71 1.44%Total 95.51%
HSBC Midcap Equity Fund (HMEF) April 2013
10
Issuer Market Value(` in Lacs)
% to NetAssets
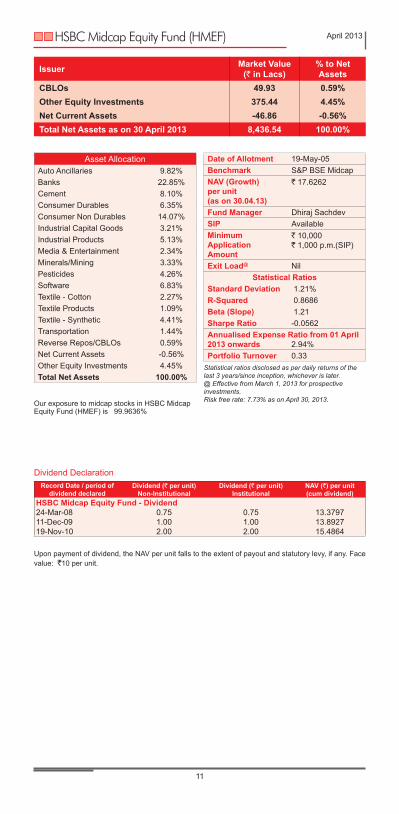
CBLOs 49.93 0.59%Other Equity Investments 375.44 4.45%Net Current Assets -46.86 -0.56%Total Net Assets as on 30 April 2013 8,436.54 100.00%
Asset AllocationAuto Ancillaries 9.82%Banks 22.85%Cement 8.10%Consumer Durables 6.35%Consumer Non Durables 14.07%Industrial Capital Goods 3.21%Industrial Products 5.13%Media & Entertainment 2.34%Minerals/Mining 3.33%Pesticides 4.26%Software 6.83%Textile - Cotton 2.27%Textile Products 1.09%Textile - Synthetic 4.41%Transportation 1.44%Reverse Repos/CBLOs 0.59%Net Current Assets -0.56%Other Equity Investments 4.45%Total Net Assets 100.00%
Dividend DeclarationRecord Date / period of
dividend declaredDividend (` per unit)
Non-InstitutionalDividend (` per unit)
InstitutionalNAV (`) per unit(cum dividend)
HSBC Midcap Equity Fund - Dividend24-Mar-08 0.75 0.75 13.379711-Dec-09 1.00 1.00 13.892719-Nov-10 2.00 2.00 15.4864
Date of Allotment 19-May-05Benchmark S&P BSE MidcapNAV (Growth) per unit(as on 30.04.13)
` 17.6262
Fund Manager Dhiraj SachdevSIP AvailableMinimumApplicationAmount
` 10,000` 1,000 p.m.(SIP)
Exit Load@ NilStatistical Ratios
Standard Deviation 1.21%R-Squared 0.8686Beta (Slope) 1.21Sharpe Ratio -0.0562Annualised Expense Ratio from 01 April 2013 onwards 2.94%Portfolio Turnover 0.33
Statistical ratios disclosed as per daily returns of the last 3 years/since inception, whichever is later. @ Effective from March 1, 2013 for prospective investments.Risk free rate: 7.73% as on April 30, 2013.
HSBC Midcap Equity Fund (HMEF) April 2013
11
Upon payment of dividend, the NAV per unit falls to the extent of payout and statutory levy, if any. Face value: `10 per unit.
Our exposure to midcap stocks in HSBC Midcap Equity Fund (HMEF) is 99.9636%

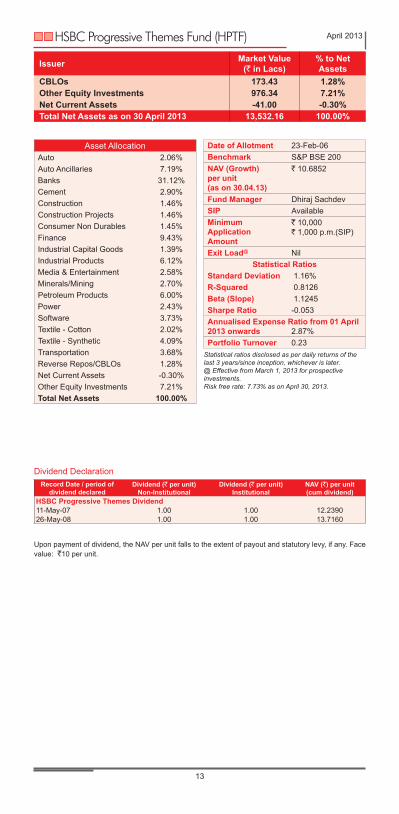
An Open Ended Flexi-Theme Equity SchemeInvestment Objective: Seeks to generate long term capital growth from an actively managed portfolio of equity and equity related securities by investing primarily in sectors, areas and themes that play an important role in, and/or benefit from India’s progress, reform process and economic development.
Issuer Market Value(` in Lacs)
% to NetAssets
Auto Tata Motors DVR 278.29 2.06%Auto Ancillaries Apollo Tyres 972.76 7.19%Banks The Jammu & Kashmir Bank 1,267.31 9.37%Dena Bank 645.39 4.77%ICICI Bank 581.83 4.30%Indian Bank 451.44 3.34%The Karnataka Bank 419.30 3.10%Allahabad Bank 325.72 2.41%Union Bank of India 318.24 2.35%United Bank of India 202.61 1.50%CementEverest Industries 392.80 2.90%ConstructionIRB Infrastructure Developers 197.46 1.46%Construction ProjectsGammon Infrastructure Projects 197.04 1.46%Consumer Non DurablesGujarat Ambuja Exports 196.80 1.45%Finance Rural Electrification Corporation 493.68 3.65%Aditya Birla Nuvo 445.59 3.29%Rane Holdings 337.00 2.49%Industrial Capital GoodsBharat Heavy Electricals 187.93 1.39%Industrial Products FAG Bearings India 425.67 3.15%Diamond Power Infrastructure 248.45 1.84%Polyplex Corporation 154.22 1.14%Media & EntertainmentPrime Focus 349.77 2.58%Minerals/MiningGujarat Mineral Development Corporation 365.08 2.70%Petroleum Products Hindustan Petroleum Corporation 610.93 4.51%Indian Oil Corporation 201.20 1.49%Power Reliance Infrastructure 328.26 2.43%Software Polaris Software Lab 504.27 3.73%Textile - Cotton Vardhman Textiles 272.80 2.02%Textile - Synthetic Bombay Dyeing & Manufacturing Company 409.46 3.03%JBF Industries 144.61 1.07%TransportationGateway Distriparks 497.48 3.68%Total 91.81%
HSBC Progressive Themes Fund (HPTF) April 2013
12
Issuer Market Value(` in Lacs)
% to NetAssets
CBLOs 173.43 1.28%Other Equity Investments 976.34 7.21%Net Current Assets -41.00 -0.30%Total Net Assets as on 30 April 2013 13,532.16 100.00%
Asset AllocationAuto 2.06%Auto Ancillaries 7.19%Banks 31.12%Cement 2.90%Construction 1.46%Construction Projects 1.46%Consumer Non Durables 1.45%Finance 9.43%Industrial Capital Goods 1.39%Industrial Products 6.12%Media & Entertainment 2.58%Minerals/Mining 2.70%Petroleum Products 6.00%Power 2.43%Software 3.73%Textile - Cotton 2.02%Textile - Synthetic 4.09%Transportation 3.68%Reverse Repos/CBLOs 1.28%Net Current Assets -0.30%Other Equity Investments 7.21%Total Net Assets 100.00%
Dividend DeclarationRecord Date / period of
dividend declaredDividend (` per unit)
Non-InstitutionalDividend (` per unit)
InstitutionalNAV (`) per unit(cum dividend)
HSBC Progressive Themes Dividend11-May-07 1.00 1.00 12.239026-May-08 1.00 1.00 13.7160
Date of Allotment 23-Feb-06Benchmark S&P BSE 200NAV (Growth) per unit(as on 30.04.13)
` 10.6852
Fund Manager Dhiraj SachdevSIP AvailableMinimumApplicationAmount
` 10,000` 1,000 p.m.(SIP)
Exit Load@ NilStatistical Ratios
Standard Deviation 1.16%R-Squared 0.8126Beta (Slope) 1.1245Sharpe Ratio -0.053Annualised Expense Ratio from 01 April 2013 onwards 2.87%Portfolio Turnover 0.23
Statistical ratios disclosed as per daily returns of the last 3 years/since inception, whichever is later. @ Effective from March 1, 2013 for prospective investments. Risk free rate: 7.73% as on April 30, 2013.
HSBC Progressive Themes Fund (HPTF) April 2013
13
Upon payment of dividend, the NAV per unit falls to the extent of payout and statutory levy, if any. Face value: `10 per unit.
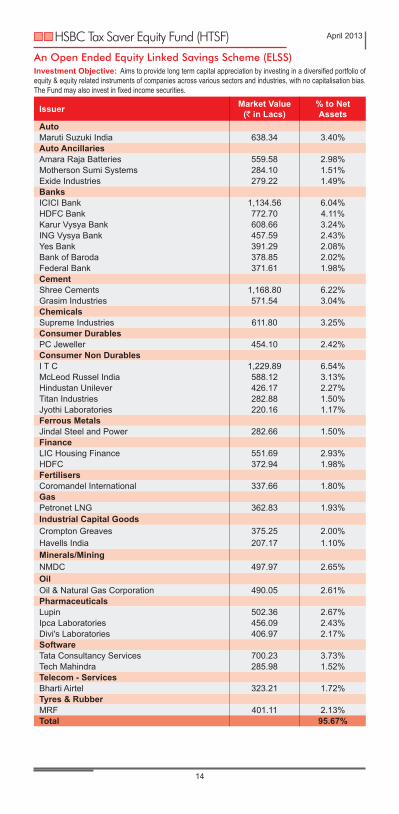
An Open Ended Equity Linked Savings Scheme (ELSS)Investment Objective: Aims to provide long term capital appreciation by investing in a diversified portfolio of equity & equity related instruments of companies across various sectors and industries, with no capitalisation bias. The Fund may also invest in fixed income securities.
Issuer Market Value(` in Lacs)
% to NetAssets
Auto Maruti Suzuki India 638.34 3.40%Auto Ancillaries Amara Raja Batteries 559.58 2.98%Motherson Sumi Systems 284.10 1.51%Exide Industries 279.22 1.49%Banks ICICI Bank 1,134.56 6.04%HDFC Bank 772.70 4.11%Karur Vysya Bank 608.66 3.24%ING Vysya Bank 457.59 2.43%Yes Bank 391.29 2.08%Bank of Baroda 378.85 2.02%Federal Bank 371.61 1.98%Cement Shree Cements 1,168.80 6.22%Grasim Industries 571.54 3.04%ChemicalsSupreme Industries 611.80 3.25%Consumer DurablesPC Jeweller 454.10 2.42%Consumer Non DurablesI T C 1,229.89 6.54%McLeod Russel India 588.12 3.13%Hindustan Unilever 426.17 2.27%Titan Industries 282.88 1.50%Jyothi Laboratories 220.16 1.17%Ferrous Metals Jindal Steel and Power 282.66 1.50%Finance LIC Housing Finance 551.69 2.93%HDFC 372.94 1.98%Fertilisers Coromandel International 337.66 1.80%GasPetronet LNG 362.83 1.93%Industrial Capital GoodsCrompton Greaves 375.25 2.00%Havells India 207.17 1.10%Minerals/MiningNMDC 497.97 2.65%OilOil & Natural Gas Corporation 490.05 2.61%Pharmaceuticals Lupin 502.36 2.67%Ipca Laboratories 456.09 2.43%Divi's Laboratories 406.97 2.17%Software Tata Consultancy Services 700.23 3.73%Tech Mahindra 285.98 1.52%Telecom - Services Bharti Airtel 323.21 1.72%Tyres & RubberMRF 401.11 2.13%Total 95.67%
HSBC Tax Saver Equity Fund (HTSF) April 2013
14

Date of Allotment 05-Jan-07Benchmark S&P BSE 200NAV (Growth) per unit(as on 30.04.13)
` 16.2609
Fund Manager Aditya KhemaniSIP AvailableMinimumApplicationAmount
` 500(Lumpsum & SIP)
Exit Load@ NilStatistical Ratios
Standard Deviation 0.82%R-Squared 0.9259Beta (Slope) 0.8511Sharpe Ratio -0.0138Annualised Expense Ratio from 01 April 2013 onwards 2.82%Portfolio Turnover 0.76
Statistical ratios disclosed as per daily returns of the last 3 years/since inception, whichever is later. @ Effective from March 1, 2013 for prospective investments. Risk free rate: 7.73% as on April 30, 2013.
Issuer Market Value(` in Lacs)
% to NetAssets
CBLOs 653.03 3.47%Other Equity Investments 303.50 1.61%Net Current Assets -143.53 -0.76%Total Net Assets as on 30 April 2013 18,797.15 100.00%
Asset AllocationAuto 3.40%Auto Ancillaries 5.97%Banks 21.89%Cement 9.26%Chemicals 3.25%Consumer Durables 2.42%Consumer Non Durables 14.62%Ferrous Metals 1.50%Finance 4.92%Fertilisers 1.80%Gas 1.93%Industrial Capital Goods 3.10%Minerals/Mining 2.65%Oil 2.61%Pharmaceuticals 7.26%Software 5.25%Telecom - Services 1.72%Tyres & Rubber 2.13%Reverse Repos/CBLOs 3.47%Net Current Assets -0.76%Other Equity Investments 1.61%Total Net Assets 100.00%
Dividend DeclarationRecord Date / period of
dividend declaredDividend (` per unit)
Non-InstitutionalDividend (` per unit)
InstitutionalNAV (`) per unit(cum dividend)
HSBC Tax Saver Equity Dividend19-Feb-10 1.00 1.00 12.8713
HSBC Tax Saver Equity Fund (HTSF) April 2013
15
Upon payment of dividend, the NAV per unit falls to the extent of payout and statutory levy, if any. Face value: `10 per unit.
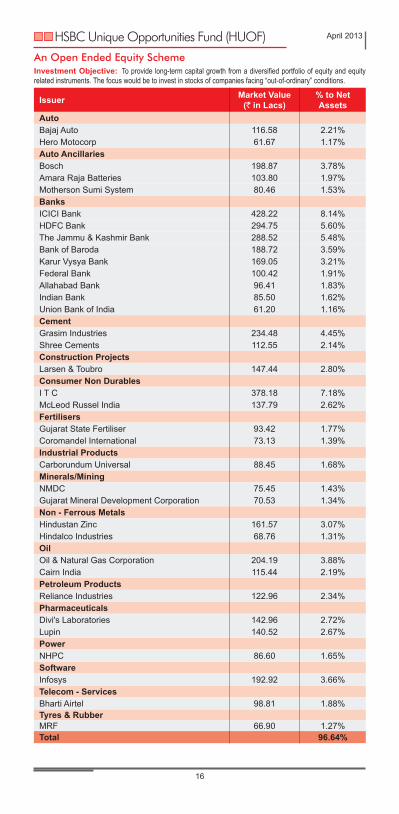
An Open Ended Equity SchemeInvestment Objective: To provide long-term capital growth from a diversified portfolio of equity and equity related instruments. The focus would be to invest in stocks of companies facing “out-of-ordinary” conditions.
Issuer Market Value(` in Lacs)
% to NetAssets
Auto Bajaj Auto 116.58 2.21%Hero Motocorp 61.67 1.17%Auto Ancillaries Bosch 198.87 3.78%Amara Raja Batteries 103.80 1.97%Motherson Sumi System 80.46 1.53%Banks ICICI Bank 428.22 8.14%HDFC Bank 294.75 5.60%The Jammu & Kashmir Bank 288.52 5.48%Bank of Baroda 188.72 3.59%Karur Vysya Bank 169.05 3.21%Federal Bank 100.42 1.91%Allahabad Bank 96.41 1.83%Indian Bank 85.50 1.62%Union Bank of India 61.20 1.16%CementGrasim Industries 234.48 4.45%Shree Cements 112.55 2.14%Construction ProjectsLarsen & Toubro 147.44 2.80%Consumer Non DurablesI T C 378.18 7.18%McLeod Russel India 137.79 2.62%FertilisersGujarat State Fertiliser 93.42 1.77%Coromandel International 73.13 1.39%Industrial Products Carborundum Universal 88.45 1.68%Minerals/MiningNMDC 75.45 1.43%Gujarat Mineral Development Corporation 70.53 1.34%Non - Ferrous Metals Hindustan Zinc 161.57 3.07%Hindalco Industries 68.76 1.31%Oil Oil & Natural Gas Corporation 204.19 3.88%Cairn India 115.44 2.19%Petroleum Products Reliance Industries 122.96 2.34%Pharmaceuticals Divi's Laboratories 142.96 2.72%Lupin 140.52 2.67%PowerNHPC 86.60 1.65%Software Infosys 192.92 3.66%Telecom - Services Bharti Airtel 98.81 1.88%Tyres & RubberMRF 66.90 1.27%Total 96.64%
HSBC Unique Opportunities Fund (HUOF) April 2013
16

Issuer Market Value(` in Lacs)
% to NetAssets
CBLOs 121.53 2.31%Other Equity Investments 26.60 0.51%Net Current Assets 28.52 0.54%Total Net Assets as on 30 April 2013 5,263.85 100.00%
Asset AllocationAuto 3.39%Auto Ancillaries 7.28%Banks 32.54%Cement 6.59%Construction Projects 2.80%Consumer Non Durables 9.80%Fertilisers 3.16%Industrial Products 1.68%Minerals/Mining 2.77%Non - Ferrous Metals 4.38%Oil 6.07%Petroleum Products 2.34%Pharmaceuticals 5.39%Power 1.65%Software 3.66%Telecom - Services 1.88%Tyres & Rubber 1.27%Reverse Repos/CBLOs 2.31%Net Current Assets 0.54%Other Equity Investments 0.51%Total Net Assets 100.00%
Date of Allotment 21-Mar-07Benchmark S&P BSE 200NAV (Growth) per unit(as on 30.04.13)
` 11.0465
Fund Manager Gaurav Mehrotra & Amaresh Mishra
SIP AvailableMinimumApplicationAmount
` 10,000` 1,000 p.m.(SIP)
Exit Load@ NilStatistical Ratios
Standard Deviation 0.88%R-Squared,m 0.9312Beta (Slope) 0.909Sharpe Ratio -0.028Annualised Expense Ratio from 01 April 2013 onwards 2.93%Portfolio Turnover 0.26
Statistical ratios disclosed as per daily returns of the last 3 years/since inception, whichever is later. @ Effective from March 1, 2013 for prospective investments. Risk free rate: 7.73% as on April 30, 2013.
HSBC Unique Opportunities Fund (HUOF) April 2013
17
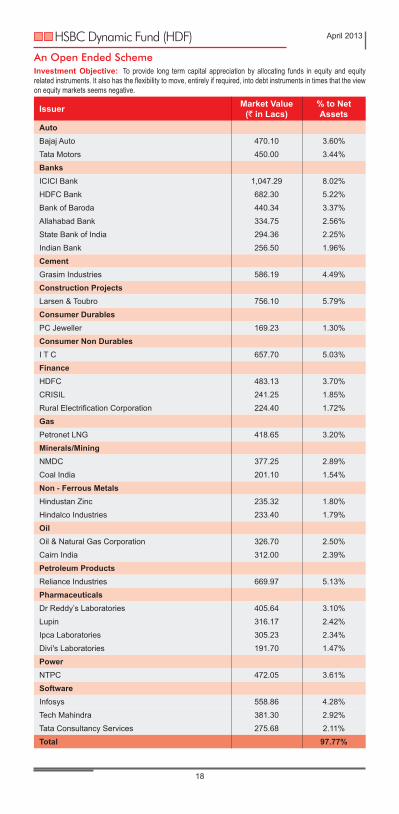
An Open Ended SchemeInvestment Objective: To provide long term capital appreciation by allocating funds in equity and equity related instruments. It also has the flexibility to move, entirely if required, into debt instruments in times that the view on equity markets seems negative.
Issuer Market Value(` in Lacs)
% to NetAssets
AutoBajaj Auto 470.10 3.60%
Tata Motors 450.00 3.44%
Banks ICICI Bank 1,047.29 8.02%
HDFC Bank 682.30 5.22%
Bank of Baroda 440.34 3.37%
Allahabad Bank 334.75 2.56%
State Bank of India 294.36 2.25%
Indian Bank 256.50 1.96%
CementGrasim Industries 586.19 4.49%
Construction ProjectsLarsen & Toubro 756.10 5.79%
Consumer DurablesPC Jeweller 169.23 1.30%
Consumer Non DurablesI T C 657.70 5.03%
Finance HDFC 483.13 3.70%
CRISIL 241.25 1.85%
Rural Electrification Corporation 224.40 1.72%
GasPetronet LNG 418.65 3.20%
Minerals/Mining NMDC 377.25 2.89%
Coal India 201.10 1.54%
Non - Ferrous Metals Hindustan Zinc 235.32 1.80%
Hindalco Industries 233.40 1.79%
Oil Oil & Natural Gas Corporation 326.70 2.50%
Cairn India 312.00 2.39%
Petroleum Products Reliance Industries 669.97 5.13%
Pharmaceuticals Dr Reddy’s Laboratories 405.64 3.10%
Lupin 316.17 2.42%
Ipca Laboratories 305.23 2.34%
Divi's Laboratories 191.70 1.47%
PowerNTPC 472.05 3.61%
Software Infosys 558.86 4.28%
Tech Mahindra 381.30 2.92%
Tata Consultancy Services 275.68 2.11%
Total 97.77%
HSBC Dynamic Fund (HDF) April 2013
18

Issuer Market Value(` in Lacs)
% to NetAssets
CBLOs 789.19 6.04%Net Current Assets -497.42 -3.81%Total Net Assets as on 30 April 2013 13,066.42 100.00%
Asset AllocationAuto 7.04%Banks 23.38%Cement 4.49%Construction Projects 5.79%Consumer Durables 1.30%Consumer Non Durables 5.03%Finance 7.26%Gas 3.20%Minerals/Mining 4.43%Non - Ferrous Metals 3.59%Oil 4.89%Petroleum Products 5.13%Pharmaceuticals 9.33%Power 3.61%Software 9.31%Reverse Repos/CBLOs 6.04%Net Current Assets -3.81%Total Net Assets 100.00%
Date of Allotment 24-Sep-07Benchmark S&P BSE 200NAV (Growth) per unit(as on 30.04.13)
` 10.0821
Fund Manager Tushar Pradhan(for Equity portion)Sanjay Shah(for Debt portion)
SIP AvailableMinimumApplicationAmount
` 10,000` 1,000 p.m.(SIP)
Exit Load@ NilStatistical Ratios
Standard Deviation 0.84%R-Squared 0.9497Beta (Slope) 0.8783Sharpe Ratio -0.031Annualised Expense Ratio from 01 April 2013 onwards 2.85%Portfolio Turnover 0.29
Statistical ratios disclosed as per daily returns of the last 3 years/since inception, whichever is later. @ Effective from March 1, 2013 for prospective investments. Risk free rate: 7.73% as on April 30, 2013.
HSBC Dynamic Fund (HDF) April 2013
19
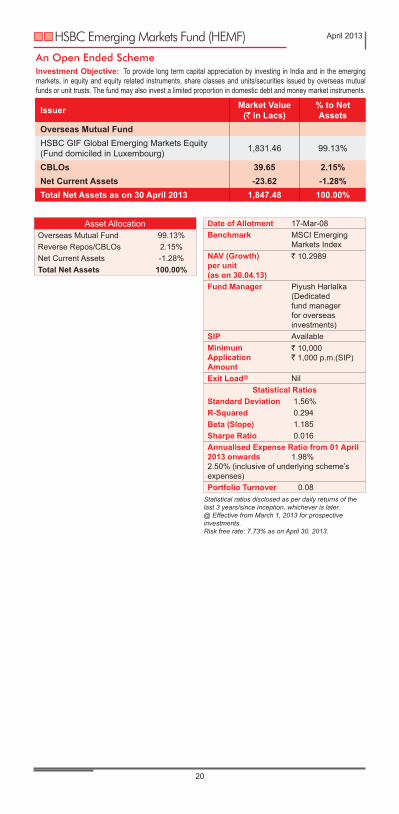
Date of Allotment 17-Mar-08Benchmark MSCI Emerging
Markets IndexNAV (Growth) per unit(as on 30.04.13)
` 10.2989
Fund Manager Piyush Harlalka (Dedicated fund manager for overseas investments)
SIP AvailableMinimumApplicationAmount
` 10,000` 1,000 p.m.(SIP)
Exit Load@ NilStatistical Ratios
Standard Deviation 1.56%R-Squared 0.294Beta (Slope) 1.185Sharpe Ratio 0.016Annualised Expense Ratio from 01 April 2013 onwards 1.98% 2.50% (inclusive of underlying scheme’s expenses)Portfolio Turnover 0.08
Statistical ratios disclosed as per daily returns of the last 3 years/since inception, whichever is later. @ Effective from March 1, 2013 for prospective investments. Risk free rate: 7.73% as on April 30, 2013.
Asset AllocationOverseas Mutual Fund 99.13%Reverse Repos/CBLOs 2.15%Net Current Assets -1.28%Total Net Assets 100.00%
Issuer Market Value(` in Lacs)
% to NetAssets
Overseas Mutual FundHSBC GIF Global Emerging Markets Equity (Fund domiciled in Luxembourg) 1,831.46 99.13%
CBLOs 39.65 2.15%Net Current Assets -23.62 -1.28%Total Net Assets as on 30 April 2013 1,847.48 100.00%
An Open Ended SchemeInvestment Objective: To provide long term capital appreciation by investing in India and in the emerging markets, in equity and equity related instruments, share classes and units/securities issued by overseas mutual funds or unit trusts. The fund may also invest a limited proportion in domestic debt and money market instruments.
HSBC Emerging Markets Fund (HEMF) April 2013
20

An Open Ended Equity SchemeInvestment Objective: To provide long term capital appreciation primarily from a diversified portfolio of equity and equity related instruments of small cap companies.
Issuer Market Value(` in Lacs)
% to NetAssets
Auto Ancillaries Pricol 89.86 6.18%Majestic Auto 31.30 2.15%Balkrishna Industries 18.39 1.27%Banks State Bank of Travancore 77.74 5.35%State Bank of Bikaner and Jaipur 69.03 4.75%The Karnataka Bank 46.42 3.19%Cement Orient Cement 112.47 7.74%Orient Paper & Industries 14.99 1.03%Chemicals India Glycols 57.55 3.96%Consumer Durables IFB Industries 66.72 4.59%Hitachi Home & Life Solutions (India) 45.53 3.13%Tube Investments of India 23.20 1.60%Consumer Non DurablesGujarat Ambuja Exports 85.46 5.88%KRBL 61.92 4.26%Globus Spirits 61.50 4.23%Greenply Industries 38.65 2.66%Lakshmi Energy and Foods 31.05 2.14%FinanceRane Holdings 99.58 6.85%Industrial Capital GoodsSanghvi Movers 39.20 2.70%Indo Tech Transformers 32.65 2.25%TIL 28.67 1.97%Industrial Products Ador Welding 49.30 3.39%PesticidesPI Industries 22.87 1.57%Software Nucleus Software Exports 128.54 8.85%Textile - Cotton RSWM 71.26 4.90%SRF 25.54 1.76%Total 98.37%
HSBC Small Cap Fund (HSCF) April 2013
21

Issuer Market Value(` in Lacs)
% to NetAssets
CBLOs 72.85 5.01%Other Equity Investments 23.09 1.59%Net Current Assets -72.20 -4.97%Total Net Assets as on 30 April 2013 1,453.11 100.00%
Asset AllocationAuto Ancillaries 9.60%Banks 13.30%Cement 8.77%Chemicals 3.96%Consumer Durables 9.32%Consumer Non Durables 19.17%Finance 6.85%Industrial Capital Goods 6.92%Industrial Products 3.39%Pesticides 1.57%Software 8.85%Textile - Cotton 6.66%Reverse Repos/CBLOs 5.01%Net Current Assets -4.97%Other Equity Investments 1.59%Total Net Assets 100.00%
Dividend DeclarationRecord Date / period of
dividend declaredDividend (` per unit)
Non-InstitutionalDividend (` per unit)
InstitutionalNAV (`) per unit(cum dividend)
HSBC Small Cap Fund - Dividend19-Nov-10 1.00 1.00 14.3053
Date of Allotment 24-Mar-08
Benchmark S&P BSE Small Cap Index
NAV (Growth) per unit(as on 30.04.13)
` 9.1804
Fund Manager Dhiraj SachdevSIP AvailableMinimumApplicationAmount
` 10,000` 1,000 p.m.(SIP)
Exit Load@ NilStatistical Ratios
Standard Deviation 1.08%R-Squared 0.8454Beta (Slope) 0.9895Sharpe Ratio -0.0881Annualised Expense Ratio from 01 April 2013 onwards 2.99%Portfolio Turnover 0.11
Statistical ratios disclosed as per returns of the last 3 years/since inception, whichever is later.@ Effective from March 1, 2013 for prospective investments.Risk free rate: 7.73% as on April 30, 2013.
HSBC Small Cap Fund (HSCF) April 2013
22
Upon payment of dividend, the NAV per unit falls to the extent of payout and statutory levy, if any. Face value: `10 per unit.
Our exposure to small cap stocks in HSBC Small Cap Fund (HSCF) is 92.2155%

Date of Allotment 06-May-11Benchmark MSCI Brazil
10/40 IndexNAV (Growth) per unit(as on 30.04.13)
` 9.633
Fund Manager Piyush Harlalka (Dedicated fund manager for overseas investments)
SIP AvailableMinimumApplicationAmount
` 10,000` 1,000 p.m.(SIP)
Exit Load@ NilStatistical Ratios
Standard Deviation 1.20%R-Squared 0.312Beta (Slope) 0.482Sharpe Ratio -0.033Annualised Expense Ratio from 01 April 2013 onwards* 1.98% 2.50% (inclusive of underlying scheme’s expenses)Portfolio Turnover 0.05
Statistical ratios disclosed as per daily returns of the last 3 years/since inception, whichever is later. @ Effective from March 1, 2013 for prospective investments. Risk free rate: 7.73% as on April 30, 2013.* Accrual & Average Net Assets are for the period 05-May-11 to 31-Mar-12.
Asset AllocationOverseas Mutual Fund 98.51%Reverse Repos/CBLOs 2.89%Net Current Assets -1.40%Total Net Assets 100.00%
Issuer Market Value(` in Lacs)
% to NetAssets
Overseas Mutual FundHSBC GIF Brazil Equity Fund (Fund domiciled in Luxembourg) 17,486.75 98.51%
CBLOs 487.35 2.89%
Net Current Assets -256.50 -1.40%
Total Net Assets as on 30 April 2013 17,717.60 100.00%
An Open-Ended Fund of Funds SchemeInvestment Objective: The primary investment objective of the Scheme is to provide long term capital appreciation by investing predominantly in units/shares of HSBC Global Investment Funds (HGIF) Brazil Equity Fund. The Scheme may, at the discretion of the Investment Manager, also invest in the units of other similar overseas mutual fund schemes, which may constitute a significant part of its corpus. The Scheme may also invest a certain proportion of its corpus in money market instruments and/or units of liquid mutual fund schemes, in order to meet liquidity requirements from time to time.
HSBC Brazil Fund (HBF) April 2013
23

Name of Scheme Fund Manager
HSBC Equity Fund Tushar Pradhan (from 29 September 2011)
HSBC India Opportunities Fund Tushar Pradhan (from 29 September 2011)
HSBC Midcap Equity Fund Dhiraj Sachdev (from 01 December 2009)
HSBC Progressive Themes Fund Dhiraj Sachdev (from 01 December 2009)
HSBC Tax Saver Equity Fund Aditya Khemani (from 24 February 2009)
HSBC Unique Opportunities Fund Gaurav Mehrotra and Amaresh Mishra (from 02 July 2012)
HSBC Dynamic Fund For Equity portion: Tushar Pradhan (from 29 September 2011) & For Debt portion: Sanjay Shah (from 14 August 2009)
HSBC Emerging Markets Fund Piyush Harlalka (from 02 July 2012)
HSBC Small Cap Fund Dhiraj Sachdev (from 01 December 2009)
HSBC Brazil Fund Piyush Harlalka (from 02 July 2012)
Fund Manager’s ExperienceTushar Pradhan Chief Investment Officer MBA (USA), B. Com.
Experience: Over 17 years of experience in Fund Management
l HSBC Asset Management (India) Private Ltd Chief Investment Officer since June 2009 onwards l AIG Global Asset Management Company (India) Private Ltd Chief Investment Officer – Equities from December 2006 to June 2009 l HDFC Asset Management Company Private Ltd Senior Fund Manager from July 2000 to Dec. 2006 l HDFC Ltd Manager – Treasury from April 1995 to June 2000
Dhiraj Sachdev B.Com., ACA, Grad CWA, Diploma in Foreign Trade Management (DFTM)
Experience:Over 16 years experience in Equity Research and Fund Management. This involved analysing various sectors and companies and presenting investment ideas to fund man-agers in India and abroad.
l HSBC Asset Management (India) Private Ltd Senior Fund Manager from December 2009 to present l HSBC Asset Management (India) Private Ltd Head of Equity-Portfolio Management Services from October 2005 to November 2009 l ASK Raymond James Securities India Private Ltd Portfolio Manager from October 2003 to September 2005 l HDFC Bank Ltd Senior Manager Equities from November 1999 to September 2003 l DSQ Software Ltd Business Analyst from June 1999 to November 1999 l Probity Research & Services Ltd (India Infoline Ltd) Research Analyst from November 1998 to May 1999 Ford Brothers Capital Services (P) Ltd Manager Research from July 1996 to Sept 1998
Fund Managers - Equity April 2013
24
l

Gaurav MehrotraPost Graduate Diploma in Business Management, Bachelor of Engineering
Experience: Over 6 years experience in research. HSBC Asset Management (India) Private Ltd Associate Vice president from September 2007 to present JPMorgan Services India Private Ltd Equity Research from August 2005 to September 2007 Tata Consultancy Services Ltd Business Analyst from June 2004 to July 2005
Aditya KhemaniB.Com. (Hons.), Post Graduate Diploma in Business Management
Experience: Over 7 years experience in research. HSBC Asset Management (India) Private Ltd Assistant Fund Manager, Equities from February 2009 to present Associate Vice President - Investment Management from October 2007 to February 2009 SBI Funds Management India Private Ltd Senior Manager - Equity Research from March 2007 to September 2007 Prudential ICICI Asset Management Company India Private Ltd Assistant Manager - Equity Research from December 2005 to February 2007 Morgan Stanley Advantage Services India Private Ltd Research Associate from May 2005 to November 2005
Amaresh Mishra Post Graduate Diploma in Business Manager Management Bachelor of Engineering (Chemical)
Experience: Over 7 years of experience in Equities & Sales l HSBC Asset Management (India) Private Ltd Assistant Fund Manager, from April 2012 till date l HSBC Asset Management (India) Private Ltd Associate Vice President - Investment Management from April 2008 to March 2012 l HSBC Asset Management (India) Private Ltd Associate Vice President - Equities from October 2007 to March 2008 l HSBC Asset Management (India) Private Ltd Associate Vice President - Sales and Distribution from March 2005 to September 2007 l Centre for Science and Environment Trainee Researcher from July 2001 to July 2002
Piyush Harlalka M.B.A, (Finance), C.A., C.S.
Experience:Over 6 years of experience in Fund Management & Research l HSBC Asset Management (India) Private Ltd Vice President – Fixed Income from April 2012 till date l HSBC Asset Management (India) Private Ltd Associate Vice President-Fixed Income from October 2010 till March 2012 l HSBC Asset Management (India) Private Ltd Associate Vice President - Investment Management, PMS, from April 2008 to October 2010 l HSBC Asset Management (India) Private Ltd Research Analyst from July 2007 to March 2008 l Batlivala & Karanai Securities Pvt. Ltd., Research Analyst from April 2006 to June 2007
Fund Managers - Equity April 2013
25
l
l
l
l
l
l
l

Funds Managed by Tushar Pradhan.
Comparative Performance of Equity Schemes April 2013
HSBC Equity Fund Date of Inception : 10 Dec 02Scheme Name & Benchmarks Apr 12 -
Mar 13Apr 11 - Mar 12
Apr 10 - Mar 11
Since Inception
HSBC Equity Fund - Growth 4.20% -8.90% 9.67% 24.76%CNX Nifty Index (Standard Benchmark) 6.93% -9.13% 10.27% 17.41%S&P BSE 200 (Scheme Benchmark) 5.41% -9.55% 7.27% 18.68%`10,000, if invested in HSBC Equity Fund - Growth, would have become `10,420 `9,110 `10,967 `98,173
`10,000, if invested in CNX Nifty Index , would have become `10,693 `9,087 `11,027 `52,409
`10,000, if invested in S&P BSE 200 , would have become `10,541 `9,045 `10,727 `58,573
HSBC India Opportunities Fund Date of Inception : 24 Feb 04Scheme Name & Benchmarks Apr 12 -
Mar 13Apr 11 - Mar 12
Apr 10 - Mar 11
Since Inception
HSBC India Opportunities Fund - Growth 0.21% -3.60% 11.00% 14.45%CNX Nifty Index (Standard Benchmark) 6.93% -9.13% 10.27% 13.06%S&P BSE 500 (Scheme Benchmark) 4.14% -9.47% 6.55% 13.22%`10,000, if invested in HSBC India Opportunities Fund - Growth, would have become `10,021 `9,640 `11,100 `34,233
`10,000, if invested in CNX Nifty Index , would have become `10,693 `9,087 `11,027 `30,608
`10,000, if invested in S&P BSE 500 , would have become `10,414 `9,053 `10,655 `31,023
26
Data for the period April to March has been considered in all cases, except for ‘Since Inception’ returns. ‘Since Inception’ (%) returns are compounded annualised, other % returns are absolute. ‘Since inception’ returns are calculated on `10 invested at inception. Standard benchmark is prescribed by SEBI for long-term equity schemes and is used for comparison purposes. Returns on `10,000 are point-to-point returns for the specific time period, invested at the start of the period. The returns provided above have been rounded off and hence there may be minor differences between point-to-point returns vis-a-vis returns indicated above.
Past performance may or may not be sustained in the future. Refer note below.
Past performance may or may not be sustained in the future. Refer note below.
Past performance may or may not be sustained in the future. Refer note below.
HSBC Dynamic Fund Date of Inception : 24 Sep 07Scheme Name & Benchmarks Apr 12 -
Mar 13Apr 11 - Mar 12
Apr 10 - Mar 11
Since Inception
HSBC Dynamic Fund - Growth 1.59% -8.24% 8.77% -0.65%CNX Nifty Index (Standard Benchmark) 6.93% -9.13% 10.27% 2.24%S&P BSE 200 (Scheme Benchmark) 5.41% -9.55% 7.27% 1.55%`10,000, if invested in HSBC Dynamic Fund - Growth, would have become `10,159 `9,176 `10,877 `9,648
`10,000, if invested in CNX Nifty Index , would have become `10,693 `9,087 `11,027 `11,303
`10,000, if invested in S&P BSE 200 , would have become `10,541 `9,045 `10,727 `10,889

Comparative Performance of Equity Schemes April 2013
27
Data for the period April to March has been considered in all cases, except for ‘Since Inception’ returns. ‘Since Inception’ (%) returns are compounded annualised, other % returns are absolute. ‘Since inception’ returns are calculated on `10 invested at inception. Standard benchmark is prescribed by SEBI for long-term equity schemes and is used for comparison purposes. Returns on `10,000 are point-to-point returns for the specific time period, invested at the start of the period. The returns provided above have been rounded off and hence there may be minor differences between point-to-point returns vis-a-vis returns indicated above.
HSBC Brazil Fund Date Of Inception : 06 May 11Scheme Name & Benchmarks Apr 12 - Mar 13 Since InceptionHSBC Brazil Fund - Growth -2.50% -1.68%MSCI Brazil 10/40 Index -14.53% -12.43%CNX Nifty Index (Standard Benchmark) 6.93% 0.22%`10,000, if invested in HBF, would have become `9,750 `9,681
`10,000, if invested in MSCI Brazil 10/40 Index, would have become `8,547 `7,772
`10,000, if invested in CNX Nifty Index , would have become `10,693 `10,042
Past performance may or may not be sustained in the future. Refer note below.
HSBC Emerging Markets Fund Date of Inception : 17 Mar 08Scheme Name & Benchmarks Apr 12 -
Mar 13Apr 11 - Mar 12
Apr 10 - Mar 11
Since Inception
HSBC Emerging Markets Fund - Growth 4.55% -6.74% 11.30% 0.70%MSCI Emerging Market Index 1.77% -7.26% 9.33% 1.25%CNX Nifty Index (Standard Benchmark) 6.93% -9.13% 10.27% 4.32%`10,000, if invested in HMEF, would have become `10,455 `9,326 `11,130 `10,360
`10,000, if invested in MSCI Emerging Market Index, would have become `10,177 `9,274 `10,933 `10,646
`10,000, if invested in CNX Nifty Index , would have become `10,693 `9,087 `11,027 `12,380
Past performance may or may not be sustained in the future. Refer note below.
Funds Managed by - Piyush Harlalka.
HSBC Unique Opportunities Fund Date of Inception : 21 Mar 07Scheme Name & Benchmarks Apr 12 -
Mar 13Apr 11 - Mar 12
Apr 10 - Mar 11
Since Inception
HSBC Unique Opportunities Fund - Growth 4.82% -9.79% 8.92% 0.79%CNX Nifty Index (Standard Benchmark) 6.93% -9.13% 10.27% 6.71%S&P BSE 200 (Scheme Benchmark) 5.41% -9.55% 7.27% 6.52%`10,000, if invested in HSBC Unique Opportunities Fund - Growth, would have become
`10,482 `9,021 `10,892 `10,486
`10,000, if invested in CNX Nifty Index , would have become `10,693 `9,087 `11,027 `14,808
`10,000, if invested in S&P BSE 200 , would have become `10,541 `9,045 `10,727 `14,648
Past performance may or may not be sustained in the future. Refer note below.
Fund Managed by Gaurav Mehrotra and Amaresh Mishra.
HSBC Tax Saver Equity Fund Date of Inception : 05 Jan 07Scheme Name & Benchmarks Apr 12 -
Mar 13Apr 11 - Mar 12
Apr 10 - Mar 11
Since Inception
HSBC Tax Saver Equity Fund - Growth 11.90% -4.42% 4.41% 7.00%CNX Nifty Index (Standard Benchmark) 6.93% -9.13% 10.27% 5.53%S&P BSE 200 (Scheme Benchmark) 5.41% -9.55% 7.27% 4.99%`10,000, if invested in HSBC Tax Saver Equity Fund - Growth, would have become `11,190 `9,558 `10,441 `15,263
`10,000, if invested in CNX Nifty Index , would have become `10,693 `9,087 `11,027 `13,995
`10,000, if invested in S&P BSE 200 , would have become `10,541 `9,045 `10,727 `13,556
Past performance may or may not be sustained in the future. Refer note below.
Fund Managed by - Aditya Khemani.

Comparative Performance of Equity Schemes April 2013
28
Data for the period April to March has been considered in all cases, except for ‘Since Inception’ returns. ‘Since Inception’ (%) returns are compounded annualised, other % returns are absolute. ‘Since inception’ returns are calculated on `10 invested at inception. Standard benchmark is prescribed by SEBI for long-term equity schemes and is used for comparison purposes. Returns on `10,000 are point-to-point returns for the specific time period, invested at the start of the period. The returns provided above have been rounded off and hence there may be minor differences between point-to-point returns vis-a-vis returns indicated above.
HSBC Small Cap Fund Date of Inception : 24 Mar 08Scheme Name & Benchmarks Apr 12 -
Mar 13Apr 11 - Mar 12
Apr 10 - Mar 11
Since Inception
HSBC Small Cap Fund - Growth -6.02% -18.39% 0.04% -2.47%S&P BSE Small Cap (Standard Benchmark) 6.93% -9.13% 10.27% 3.85%CNX Nifty (Scheme Benchmark) -14.05% -20.74% -6.06% -3.13%`10,000, if invested in HSCF, would have become `9,398 `8,161 `10,004 `8,819
`10,000, if invested in S&P BSE Smallcap, would have become `10,693 `9,087 `11,027 `12,093
`10,000, if invested in CNX Nifty, would have become `8,595 `7,926 `9,394 `8,522
Past performance may or may not be sustained in the future. Refer note below.
HSBC Progressive Themes Fund Date of Inception : 23 Feb 06Scheme Name & Benchmarks Apr 12 -
Mar 13Apr 11 - Mar 12
Apr 10 - Mar 11
Since Inception
HSBC Progressive Themes Fund - Growth -10.58% -4.28% -11.23% 0.30%CNX Nifty Index (Standard Benchmark) 6.93% -9.13% 10.27% 8.79%S&P BSE 200 (Scheme Benchmark) 5.41% -9.55% 7.27% 8.29%`10,000, if invested in HSBC Progressive Themes Fund - Growth, would have become `8,942 `9,572 `8,877 `10,215
`10,000, if invested in CNX Nifty Index , would have become `10,693 `9,087 `11,027 `18,206
`10,000, if invested in S&P BSE 200 , would have become `10,541 `9,045 `10,727 `17,624
Past performance may or may not be sustained in the future. Refer note below.
Funds Managed by - Dhiraj Sachdev.
HSBC Midcap Equity Fund Date of Inception : 19 May 05Scheme Name & Benchmarks Apr 12 -
Mar 13Apr 11 - Mar 12
Apr 10 - Mar 11
Since Inception
HSBC Midcap Equity Fund - Growth -8.82% -8.51% -10.38% 7.17%CNX Nifty Index (Standard Benchmark) 6.93% -9.13% 10.27% 13.96%S&P BSE MID CAP (Scheme Benchmark) -4.30% -9.14% 0.11% 8.43%`10,000, if invested in HSBC Midcap Equity Fund - Growth, would have become `9,118 `9,149 `8,962 `17,263
`10,000, if invested in CNX Nifty Index , would have become `10,693 `9,087 `11,027 `28,002
`10,000, if invested in S&P BSE MID CAP , would have become `9,570 `9,086 `10,011 `18,919
Past performance may or may not be sustained in the future. Refer note below.
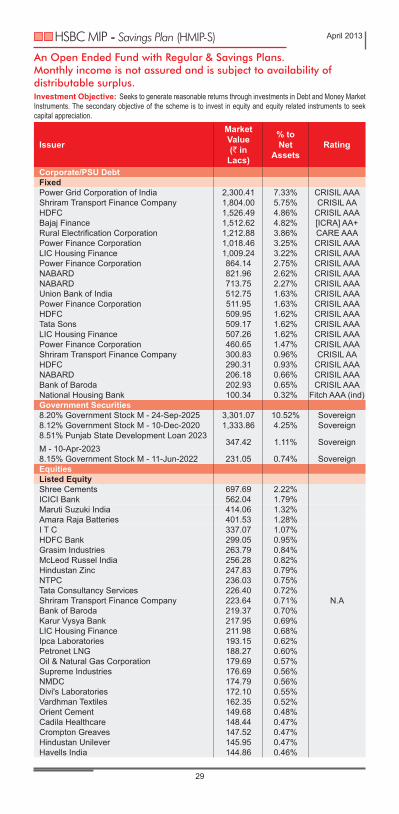
An Open Ended Fund with Regular & Savings Plans.Monthly income is not assured and is subject to availability of distributable surplus.Investment Objective: Seeks to generate reasonable returns through investments in Debt and Money Market Instruments. The secondary objective of the scheme is to invest in equity and equity related instruments to seek capital appreciation.
Issuer
MarketValue(` in
Lacs)
% toNet
AssetsRating
Corporate/PSU DebtFixedPower Grid Corporation of India 2,300.41 7.33% CRISIL AAAShriram Transport Finance Company 1,804.00 5.75% CRISIL AAHDFC 1,526.49 4.86% CRISIL AAABajaj Finance 1,512.62 4.82% [ICRA] AA+Rural Electrification Corporation 1,212.88 3.86% CARE AAAPower Finance Corporation 1,018.46 3.25% CRISIL AAALIC Housing Finance 1,009.24 3.22% CRISIL AAAPower Finance Corporation 864.14 2.75% CRISIL AAANABARD 821.96 2.62% CRISIL AAANABARD 713.75 2.27% CRISIL AAAUnion Bank of India 512.75 1.63% CRISIL AAAPower Finance Corporation 511.95 1.63% CRISIL AAAHDFC 509.95 1.62% CRISIL AAATata Sons 509.17 1.62% CRISIL AAALIC Housing Finance 507.26 1.62% CRISIL AAAPower Finance Corporation 460.65 1.47% CRISIL AAAShriram Transport Finance Company 300.83 0.96% CRISIL AAHDFC 290.31 0.93% CRISIL AAANABARD 206.18 0.66% CRISIL AAABank of Baroda 202.93 0.65% CRISIL AAANational Housing Bank 100.34 0.32% Fitch AAA (ind)Government Securities8.20% Government Stock M - 24-Sep-2025 3,301.07 10.52% Sovereign8.12% Government Stock M - 10-Dec-2020 1,333.86 4.25% Sovereign8.51% Punjab State Development Loan 2023 M - 10-Apr-2023
347.42 1.11% Sovereign
8.15% Government Stock M - 11-Jun-2022 231.05 0.74% SovereignEquitiesListed EquityShree Cements 697.69 2.22%ICICI Bank 562.04 1.79%Maruti Suzuki India 414.06 1.32%Amara Raja Batteries 401.53 1.28%I T C 337.07 1.07%HDFC Bank 299.05 0.95%Grasim Industries 263.79 0.84%McLeod Russel India 256.28 0.82%Hindustan Zinc 247.83 0.79%NTPC 236.03 0.75%Tata Consultancy Services 226.40 0.72%Shriram Transport Finance Company 223.64 0.71% N.ABank of Baroda 219.37 0.70%Karur Vysya Bank 217.95 0.69%LIC Housing Finance 211.98 0.68%Ipca Laboratories 193.15 0.62%Petronet LNG 188.27 0.60%Oil & Natural Gas Corporation 179.69 0.57%Supreme Industries 176.69 0.56%NMDC 174.79 0.56%Divi's Laboratories 172.10 0.55%Vardhman Textiles 162.35 0.52%Orient Cement 149.68 0.48%Cadila Healthcare 148.44 0.47%Crompton Greaves 147.52 0.47%Hindustan Unilever 145.95 0.47%Havells India 144.86 0.46%
HSBC MIP - Savings Plan (HMIP-S) April 2013
29

Date of Allotment 24-Feb-04Benchmark CRISIL MIP
Blended IndexNAV (Growth) per unit(as on 30.04.13)
` 22.987
Average Maturity of Portfolio
67.00 months
Modified Durationof Portfolio
45.72 months
Fund Manager Aditya Khemani(for Equity portion)Sanjay Shah &Ruchir Parekh(for Debt portion)
SIP AvailableMinimum Application AmountGrowth `10,000Quarterly Dividend `10,000Monthly Dividend `25,000SIP `1,000 p.m.Exit Load@ NilAnnualised Expense Ratio from 01 April 2013 onwards 2.46%
@ Effective from March 1, 2013 for prospective investments.
Asset AllocationCorporate/ PSU Debt 53.84%Government Securities 16.61%Cash Equivalents 0.47%Net Current Assets 3.78%Other Equity Investments 25.30%Total Net Assets 100.00%
Issuer
MarketValue(` in
Lacs)
% toNet
AssetsRating
Bharti Airtel 142.80 0.46%Titan Industries 140.76 0.45%Coromandel International 136.26 0.43%Tech Mahindra 133.46 0.43%Motherson Sumi Systems 122.10 0.39%Punjab National Bank 122.10 0.39% N.AJindal Steel and Power 101.42 0.32%PC Jeweller 97.00 0.31%Sanghvi Movers 96.60 0.31%Hindustan Dorr-Oliver 28.01 0.09%Orient Paper & Industries 19.95 0.06%Total 95.75%Cash EquivalentsCBLOs 147.31 0.47%Net Current Assets 1,187.72 3.78%Total Net Assets as on 30 April 2013 31,383.36 100.00%
Rating ProfileAAA 42.31%AA+/ AA-/ AA 11.53%Sovereign 16.61%Reverse Repo/CBLOs 0.47%Net Current Assets 3.78%Other Equity Investments 25.30%Total Net Assets 100.00%
HSBC MIP - Savings Plan (HMIP-S) April 2013
30
Dividend DeclarationRecord Date / period of
dividend declaredDividend (` per unit)
Non-InstitutionalDividend (` per unit)
InstitutionalNAV (`) per unit(cum dividend)
HSBC MIP - Savings Plan - Monthly Dividend22-Feb-13 0.05285 0.04530 12.331628-Mar-13 0.05285 0.04530 12.179626-Apr-13 0.05256 0.04478 12.3492HSBC MIP - Savings Plan - Monthly Dividend - Direct Plan22-Feb-13 0.05285 0.04530 12.353028-Mar-13 0.05285 0.04530 12.210226-Apr-13 0.05256 0.04478 12.3856HSBC MIP - Savings Plan - Quarterly Dividend14-Sep-12 0.17618 0.15101 12.040614-Dec-12 0.17618 0.15101 12.435515-Mar-13 0.17618 0.15101 12.3803HSBC MIP - Savings Plan - Quarterly Dividend - Direct Plan15-Mar-13 0.08809 0.07550 12.4028
Upon payment of dividend, the NAV per unit falls to the extent of payout and statutory levy, if any. Face value: `10 per unit.
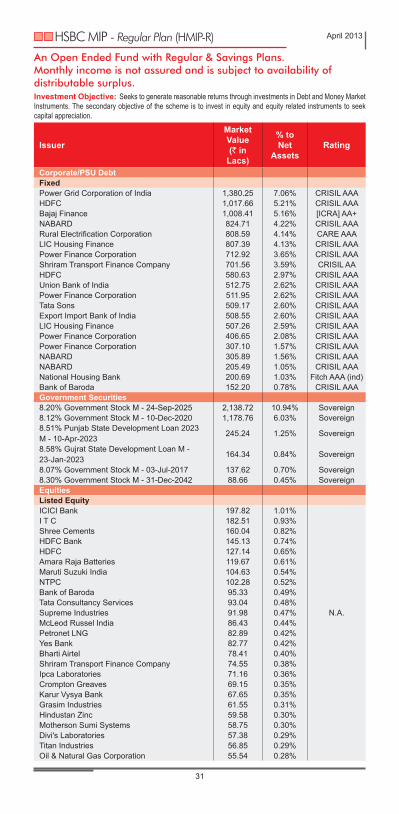
An Open Ended Fund with Regular & Savings Plans. Monthly income is not assured and is subject to availability of distributable surplus.Investment Objective: Seeks to generate reasonable returns through investments in Debt and Money Market Instruments. The secondary objective of the scheme is to invest in equity and equity related instruments to seek capital appreciation.
Issuer
MarketValue(` in
Lacs)
% toNet
AssetsRating
Corporate/PSU DebtFixedPower Grid Corporation of India 1,380.25 7.06% CRISIL AAAHDFC 1,017.66 5.21% CRISIL AAABajaj Finance 1,008.41 5.16% [ICRA] AA+NABARD 824.71 4.22% CRISIL AAARural Electrification Corporation 808.59 4.14% CARE AAALIC Housing Finance 807.39 4.13% CRISIL AAAPower Finance Corporation 712.92 3.65% CRISIL AAAShriram Transport Finance Company 701.56 3.59% CRISIL AAHDFC 580.63 2.97% CRISIL AAAUnion Bank of India 512.75 2.62% CRISIL AAAPower Finance Corporation 511.95 2.62% CRISIL AAATata Sons 509.17 2.60% CRISIL AAAExport Import Bank of India 508.55 2.60% CRISIL AAALIC Housing Finance 507.26 2.59% CRISIL AAAPower Finance Corporation 406.65 2.08% CRISIL AAAPower Finance Corporation 307.10 1.57% CRISIL AAANABARD 305.89 1.56% CRISIL AAANABARD 205.49 1.05% CRISIL AAANational Housing Bank 200.69 1.03% Fitch AAA (ind)Bank of Baroda 152.20 0.78% CRISIL AAAGovernment Securities8.20% Government Stock M - 24-Sep-2025 2,138.72 10.94% Sovereign8.12% Government Stock M - 10-Dec-2020 1,178.76 6.03% Sovereign8.51% Punjab State Development Loan 2023 M - 10-Apr-2023
245.24 1.25% Sovereign
8.58% Gujrat State Development Loan M - 23-Jan-2023
164.34 0.84% Sovereign
8.07% Government Stock M - 03-Jul-2017 137.62 0.70% Sovereign8.30% Government Stock M - 31-Dec-2042 88.66 0.45% SovereignEquitiesListed EquityICICI Bank 197.82 1.01%I T C 182.51 0.93%Shree Cements 160.04 0.82%HDFC Bank 145.13 0.74%HDFC 127.14 0.65%Amara Raja Batteries 119.67 0.61%Maruti Suzuki India 104.63 0.54%NTPC 102.28 0.52%Bank of Baroda 95.33 0.49%Tata Consultancy Services 93.04 0.48%Supreme Industries 91.98 0.47% N.A.McLeod Russel India 86.43 0.44%Petronet LNG 82.89 0.42%Yes Bank 82.77 0.42%Bharti Airtel 78.41 0.40%Shriram Transport Finance Company 74.55 0.38%Ipca Laboratories 71.16 0.36%Crompton Greaves 69.15 0.35%Karur Vysya Bank 67.65 0.35%Grasim Industries 61.55 0.31%Hindustan Zinc 59.58 0.30%Motherson Sumi Systems 58.75 0.30%Divi's Laboratories 57.38 0.29%Titan Industries 56.85 0.29%Oil & Natural Gas Corporation 55.54 0.28%
HSBC MIP - Regular Plan (HMIP-R) April 2013
31

Date of Allotment 24-Feb-04Benchmark CRISIL MIP
Blended IndexNAV (Growth) per unit(as on 30.04.13)
` 20.1484
Average Maturity of Portfolio
70.02 months
Modified Durationof Portfolio
47.64 months
Fund Manager Aditya Khemani(for Equity portion)Sanjay Shah &Ruchir Parekh(for Debt portion)
SIP AvailableMinimum Application AmountGrowth `10,000Quarterly Dividend `10,000Monthly Dividend `25,000SIP `1,000 p.m.Exit Load@ NilAnnualised Expense Ratio from 01 April 2013 onwards 2.51%@ Effective from March 1, 2013 for prospective investments.
Asset AllocationCorporate/ PSU Debt 61.23%Government Securities 20.22%Cash Equivalents 3.70%Net Current Assets -0.09%Other Equity Investments 14.94%Total Net Assets 100.00%
Issuer
MarketValue(` in
Lacs)
% toNet
AssetsRating
Jindal Steel and Power 54.82 0.28%Tech Mahindra 54.34 0.28%Infosys 53.87 0.28%Hindustan Unilever 50.79 0.26%NMDC 46.53 0.24%Havells India 46.09 0.24% N.A.Vardhman Textiles 40.12 0.21%Cadila Healthcare 39.19 0.20%Orient Cement 37.86 0.19%LIC Housing Finance 36.55 0.19%Punjab National Bank 34.56 0.18%PC Jeweller 20.64 0.11%Sanghvi Movers 8.87 0.05%Hindustan Dorr-Oliver 8.40 0.04%Orient Paper & Industries 5.05 0.03%Total 96.39%Cash EquivalentsCBLOs 723.29 3.70%Net Current Assets -17.38 -0.09%Total Net Assets as on 30 April 2013 19,548.95 100.00%
Rating ProfileAAA 52.48%AA+/ AA-/ AA 8.75%Sovereign 20.22%Reverse Repo/CBLOs 3.70%Net Current Assets -0.09%Other Equity Investments 14.94%Total Net Assets 100.00%
HSBC MIP - Regular Plan (HMIP-R) April 2013
32
Dividend DeclarationRecord Date / period of
dividend declaredDividend (` per unit)
Non-InstitutionalDividend (` per unit)
InstitutionalNAV (`) per unit(cum dividend)
HSBC MIP - Regular Plan - Monthly Dividend22-Feb-13 0.05285 0.04530 11.337528-Mar-13 0.05285 0.04530 11.261726-Apr-13 0.05256 0.04478 11.3867HSBC MIP - Regular Plan - Quarterly Dividend14-Sep-12 0.17618 0.15101 11.472214-Dec-12 0.17618 0.15101 11.664815-Mar-13 0.17618 0.15101 11.6883
Upon payment of dividend, the NAV per unit falls to the extent of payout and statutory levy, if any. Face value: `10 per unit.

An Open Ended Income SchemeInvestment Objective: Aims to provide reasonable income through a diversified portfolio of fixed income securities. The AMC’s view of interest rate trends and the nature of the Plans will be reflected in the type and maturities of securities in which the Short Term and Investment Plans are invested.
Issuer
MarketValue(` in
Lacs)
% toNet
AssetsRating
Securitised DebtFixedIndia MBS 2002 Series I-D (LIC Housing Finance) PTC 27.71 0.28% CRISIL
AAA(SO)Corporate/PSU DebtFixedPower Grid Corporation of India 920.16 9.41% CRISIL AAAState Bank of India 709.95 7.26% CRISIL AAARural Electrification Corporation 656.98 6.72% CARE AAAIndian Railway Finance Corporation 513.52 5.25% CRISIL AAAExport Import Bank of India 511.90 5.23% CRISIL AAAHDFC 508.83 5.20% CRISIL AAAPower Finance Corporation 305.54 3.12% CRISIL AAARural Electrification Corporation 254.67 2.60% CARE AAAPower Finance Corporation 204.73 2.09% CRISIL AAAPower Finance Corporation 203.33 2.08% CRISIL AAABajaj Finance 201.91 2.06% [ICRA] AA+LIC Housing Finance 201.85 2.06% CRISIL AAAShriram Transport Finance Company 200.44 2.05% CRISIL AANABARD 102.74 1.05% CRISIL AAAUnion Bank of India 102.55 1.05% CRISIL AAANABARD 101.96 1.04% CRISIL AAABank of Baroda 50.73 0.52% CRISIL AAAGovernment Securities8.20% Government Stock M - 24-Sep-2025 1,715.11 17.54% Sovereign8.12% Government Stock M - 10-Dec-2020 1,158.08 11.84% Sovereign8.51% Punjab State Development Loan 2023 M - 10-Apr-2023 337.20 3.45% Sovereign
8.30% Government Stock M - 31-Dec-2042 172.10 1.76% Sovereign8.15% Government Stock M - 11-Jun-2022 159.17 1.63% Sovereign8.25% Andhra Pradesh State Development Loan M-25-Apr-2023 125.88 1.29% Sovereign
8.07% Government Stock M - 03-Jul-2017 117.23 1.20% Sovereign8.33% Government Stock M - 09-Jul-2026 104.41 1.07% Sovereign8.58% Gujrat State Development Loan M - 23-Jan-2023 25.68 0.26% Sovereign
5.59% Government Stock M - 04-Jun-2016 0.38 0.00% SovereignTotal 99.14%Cash EquivalentsCBLOs 280.14 2.86%Reverse Repos 353.57 3.62%Net Current Assets -549.37 -5.62%Total Net Assets as on 30 April 2013 9,779.09 100.00%
HSBC Income Fund - Investment Plan (HIF-IP) April 2013
33

Date of Allotment 10-Dec-02Benchmark CRISIL Composite
Bond Fund IndexNAV (Growth) per unit(as on 30.04.13)
` 20.7725
Average Maturity of Portfolio
99.33 months
Modified Durationof Portfolio
64.11 months
Yield To Maturity* 8.23%Fund Manager Ruchir Parekh &
Sanjay ShahSIP AvailableMinimumApplicationAmount
` 10,000` 1,000 p.m.(SIP)
Exit Load@ NilAnnualised Expense Ratio from 01 April 2013 onwards Regular 1.92%Direct Plan 0.67%
@ Effective from March 1, 2013 for prospective investments.* Based on invested Amount
Asset AllocationSecuritised Debt 0.28%Corporate / PSU Debt 58.82%Government Securities 40.04%Cash Equivalents 6.48%Net Current Assets -5.62%
Dividend DeclarationRecord Date / period of
dividend declaredDividend (` per unit)
Non-InstitutionalDividend (` per unit)
InstitutionalNAV (`) per unit(cum dividend)
HSBC Income Fund - Investment Plan - Regular Option - Quarterly Dividend14-Sep-12 0.22023 0.18876 11.452314-Dec-12 0.22023 0.18876 11.453315-Mar-13 0.22023 0.18876 11.6100HSBC Income Fund - Investment Plan - Institutional Option - Quarterly Dividend12-Jun-09 0.11387 0.10598 11.029411-Sep-09 0.11387 0.10598 10.996011-Dec-09 0.11387 0.10598 11.0973
Rating ProfileAAA 54.99%AA 4.11%Sovereign 40.04%Reverse Repos/ CBLOs 6.48%Net Current Assets -5.62%
HSBC Income Fund - Investment Plan (HIF-IP) April 2013
34
Upon payment of dividend, the NAV per unit falls to the extent of payout and statutory levy, if any. Face value: `10 per unit.

An Open Ended Income SchemeInvestment Objective: Aims to provide reasonable income through a diversified portfolio of fixed income securities. The AMC’s view of interest rate trends and the nature of the Plans will be reflected in the type and maturities of securities in which the Short Term and Investment Plans are invested.
Issuer
MarketValue(` in
Lacs)
% toNet
AssetsRating
Money Market InstrumentsCPsSundaram Finance 1,970.15 1.81% [ICRA] A1+Kotak Mahindra Prime 258.41 0.24% CRISIL A1+CDsFixedOriental Bank of Commerce 6,651.54 6.12% CRISIL A1+State Bank of Mysore 4,689.25 4.31% [ICRA] A1+Punjab National Bank 2,375.55 2.19% CARE A1+Corporation Bank 2,375.03 2.18% CRISIL A1+Central Bank of India 2,371.94 2.18% CARE A1+Oriental Bank of Commerce 2,336.31 2.15% CRISIL A1+Punjab National Bank 2,335.81 2.15% CARE A1+UCO Bank 2,332.95 2.15% CRISIL A1+IDBI Bank 2,327.98 2.14% CRISIL A1+Bank of Maharashtra 1,961.93 1.80% CRISIL A1+State Bank of Patiala 1,905.83 1.75% [ICRA] A1+Andhra Bank 1,633.07 1.50% CARE A1+Kotak Mahindra Bank 916.83 0.84% CRISIL A1+Axis Bank 496.30 0.46% CRISIL A1+Indusind Bank 495.22 0.46% CRISIL A1+Vijaya Bank 494.69 0.46% CARE A1+Oriental Bank of Commerce 422.38 0.39% CRISIL A1+United Bank of India 99.78 0.09% [ICRA] A1+ICICI Bank 74.36 0.07% [ICRA] A1+Yes Bank 65.01 0.06% [ICRA] A1+Corporate/PSU Debt
FixedRural Electrification Corporation 5,441.85 5.01% CRISIL AAAPower Finance Corporation 4,095.59 3.77% CRISIL AAALIC Housing Finance 4,058.11 3.73% CRISIL AAAPower Finance Corporation 3,564.60 3.28% CRISIL AAAShriram Transport Finance Company 3,026.58 2.78% CRISIL AARural Electrification Corporation 2,728.99 2.51% CARE AAAHDFC 2,549.76 2.35% CRISIL AAATata Sons 2,545.86 2.34% CRISIL AAAPower Finance Corporation 2,543.15 2.34% CRISIL AAAHDFC 2,540.09 2.34% CRISIL AAAHDFC 2,539.85 2.34% CRISIL AAALIC Housing Finance 2,538.29 2.33% CRISIL AAAHDFC 2,535.08 2.33% CRISIL AAAExport Import Bank of India 2,533.35 2.33% CRISIL AAABajaj Finance 2,523.82 2.32% [ICRA] AA+Bajaj Finance 2,521.03 2.32% [ICRA] AA+Power Finance Corporation 2,510.30 2.31% CRISIL AAAShriram Transport Finance Company 2,206.05 2.03% CRISIL AAShriram Transport Finance Company 2,004.45 1.84% CRISIL AAExport Import Bank of India 1,544.20 1.42% CRISIL AAALIC Housing Finance 1,517.52 1.40% CRISIL AAASundaram Finance 1,158.87 1.07% [ICRA] AA+Tata Capital Financial Services 1,110.78 1.02% [ICRA] AA+Rural Electrification Corporation 1,024.90 0.94% CRISIL AAAHDFC 1,017.66 0.94% CRISIL AAAPower Grid Corporation of India 1,015.69 0.93% CRISIL AAA
HSBC Income Fund - Short Term Plan (HIF-STP) April 2013
35

Date of Allotment 10-Dec-02Benchmark CRISIL Short Term
Bond Fund IndexNAV (Growth) per unit(as on 30.04.13)
` 19.8438
Average Maturity of Portfolio
23.27 months
Modified Durationof Portfolio
18.70 months
Yield To Maturity* 8.57%Fund Manager Ruchir Parekh &
Sanjay ShahSIP AvailableMinimumApplicationAmount
` 10,000` 1,000 p.m.(SIP)
Exit Load@ Nil
Annualised Expense Ratio from 01 April 2013 onwards Regular 1.30%Institutional # 0.75%Institutional Plus # 0.65%Direct Plan 0.46%
@ Effective from March 1, 2013 for prospective investments.* Based on invested Amount# Plan(s) discontinued from accepting subscriptions w.e.f. October 01, 2012
Asset AllocationMoney Market Instruments 35.50%Corporate / PSU Debt 61.69%Cash Equivalents 0.29%Net Current Assets 2.52%
Rating ProfileAAA 83.05%AA 14.13%Reverse Repos/ CBLOs 0.29%Net Current Assets 2.52%
Dividend DeclarationRecord Date / period of
dividend declaredDividend (` per unit)
Non-InstitutionalDividend (` per unit)
InstitutionalNAV (`) per unit(cum dividend)
HSBC Income Fund - Short Term Plan - Regular Option - Monthly Dividend22-Feb-13 0.05947 0.05097 11.040928-Mar-13 0.07397 0.06340 11.076526-Apr-13 0.06031 0.05138 11.1162HSBC Income Fund - Short Term Plan - Monthly Dividend - Direct Plan26-Apr-13 0.06688 0.05698 11.1241HSBC Income Fund - Short Term Plan - Institutional Option - Monthly Dividend28-Dec-12 0.06057 0.05192 10.615124-Jan-13 0.06312 0.05410 10.635922-Feb-13 0.06114 0.05240 10.5969HSBC Income Fund - Short Term Plan - Institutional Plus Option - Monthly Dividend30-Dec-11 0.08478 0.07266 10.120027-Jan-12 0.05533 0.04742 10.086624-Feb-12 0.05663 0.04854 10.0881
HSBC Income Fund - Short Term Plan (HIF-STP) April 2013
36
Rural Electrification Corporation 1,004.53 0.92% CARE AAANational Housing Bank 702.41 0.65% Fitch AAA (ind)HDFC 580.63 0.53% CRISIL AAANABARD 571.00 0.53% CRISIL AAAShriram Transport Finance Company 503.81 0.46% CRISIL AATata Capital Financial Services 309.94 0.29% CRISIL AA+Total 97.19Cash EquivalentsCBLOs 139.25 0.13%Reverse Repos 175.75 0.16%Net Current Assets 2,743.04 2.52%Total Net Assets as on 30 April 2013 1,08,717.09 100.00%
Upon payment of dividend, the NAV per unit falls to the extent of payout and statutory levy, if any. Face value: `10 per unit.
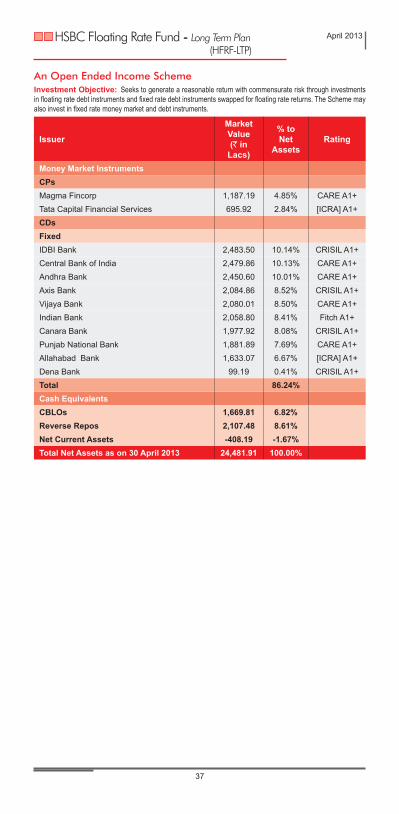
An Open Ended Income SchemeInvestment Objective: Seeks to generate a reasonable return with commensurate risk through investments in floating rate debt instruments and fixed rate debt instruments swapped for floating rate returns. The Scheme may also invest in fixed rate money market and debt instruments.
Issuer
MarketValue(` in
Lacs)
% toNet
AssetsRating
Money Market InstrumentsCPsMagma Fincorp 1,187.19 4.85% CARE A1+Tata Capital Financial Services 695.92 2.84% [ICRA] A1+CDsFixedIDBI Bank 2,483.50 10.14% CRISIL A1+Central Bank of India 2,479.86 10.13% CARE A1+Andhra Bank 2,450.60 10.01% CARE A1+Axis Bank 2,084.86 8.52% CRISIL A1+Vijaya Bank 2,080.01 8.50% CARE A1+Indian Bank 2,058.80 8.41% Fitch A1+Canara Bank 1,977.92 8.08% CRISIL A1+Punjab National Bank 1,881.89 7.69% CARE A1+Allahabad Bank 1,633.07 6.67% [ICRA] A1+Dena Bank 99.19 0.41% CRISIL A1+Total 86.24%Cash EquivalentsCBLOs 1,669.81 6.82%Reverse Repos 2,107.48 8.61%Net Current Assets -408.19 -1.67%Total Net Assets as on 30 April 2013 24,481.91 100.00%
HSBC Floating Rate Fund - Long Term Plan (HFRF-LTP)
April 2013
37
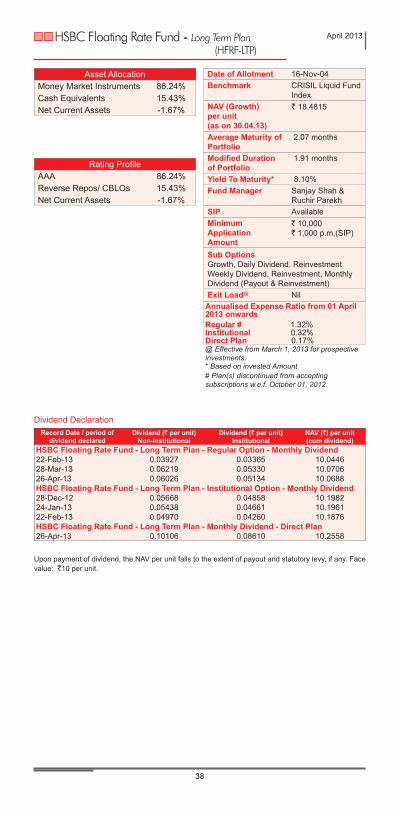
Date of Allotment 16-Nov-04Benchmark CRISIL Liquid Fund
IndexNAV (Growth) per unit(as on 30.04.13)
` 18.4815
Average Maturity of Portfolio
2.07 months
Modified Durationof Portfolio
1.91 months
Yield To Maturity* 8.10%Fund Manager Sanjay Shah &
Ruchir ParekhSIP AvailableMinimumApplicationAmount
` 10,000` 1,000 p.m.(SIP)
Sub OptionsGrowth, Daily Dividend, Reinvestment Weekly Dividend, Reinvestment, Monthly Dividend (Payout & Reinvestment)Exit Load@ Nil
Annualised Expense Ratio from 01 April 2013 onwards Regular # 1.32% Institutional 0.32%Direct Plan 0.17% @ Effective from March 1, 2013 for prospective investments.* Based on invested Amount# Plan(s) discontinued from accepting subscriptions w.e.f. October 01, 2012
Asset AllocationMoney Market Instruments 86.24%Cash Equivalents 15.43%Net Current Assets -1.67%
Dividend DeclarationRecord Date / period of
dividend declaredDividend (` per unit)
Non-InstitutionalDividend (` per unit)
InstitutionalNAV (`) per unit(cum dividend)
HSBC Floating Rate Fund - Long Term Plan - Regular Option - Monthly Dividend22-Feb-13 0.03927 0.03365 10.044628-Mar-13 0.06219 0.05330 10.070626-Apr-13 0.06026 0.05134 10.0688HSBC Floating Rate Fund - Long Term Plan - Institutional Option - Monthly Dividend28-Dec-12 0.05668 0.04858 10.198224-Jan-13 0.05438 0.04661 10.196122-Feb-13 0.04970 0.04260 10.1876HSBC Floating Rate Fund - Long Term Plan - Monthly Dividend - Direct Plan26-Apr-13 0.10106 0.08610 10.2558
Rating ProfileAAA 86.24%Reverse Repos/ CBLOs 15.43%Net Current Assets -1.67%
HSBC Floating Rate Fund - Long Term Plan (HFRF-LTP)
April 2013
38
Upon payment of dividend, the NAV per unit falls to the extent of payout and statutory levy, if any. Face value: `10 per unit.
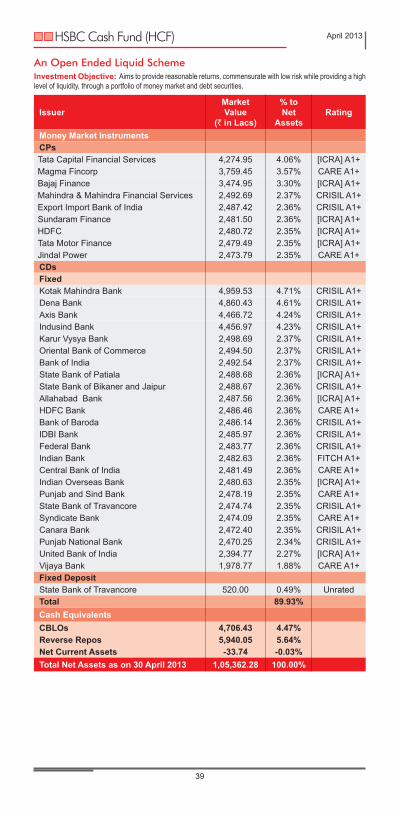
An Open Ended Liquid SchemeInvestment Objective: Aims to provide reasonable returns, commensurate with low risk while providing a high level of liquidity, through a portfolio of money market and debt securities.
IssuerMarketValue
(` in Lacs)
% toNet
AssetsRating
Money Market InstrumentsCPsTata Capital Financial Services 4,274.95 4.06% [ICRA] A1+Magma Fincorp 3,759.45 3.57% CARE A1+Bajaj Finance 3,474.95 3.30% [ICRA] A1+Mahindra & Mahindra Financial Services 2,492.69 2.37% CRISIL A1+Export Import Bank of India 2,487.42 2.36% CRISIL A1+Sundaram Finance 2,481.50 2.36% [ICRA] A1+HDFC 2,480.72 2.35% [ICRA] A1+Tata Motor Finance 2,479.49 2.35% [ICRA] A1+Jindal Power 2,473.79 2.35% CARE A1+CDsFixedKotak Mahindra Bank 4,959.53 4.71% CRISIL A1+Dena Bank 4,860.43 4.61% CRISIL A1+Axis Bank 4,466.72 4.24% CRISIL A1+Indusind Bank 4,456.97 4.23% CRISIL A1+Karur Vysya Bank 2,498.69 2.37% CRISIL A1+Oriental Bank of Commerce 2,494.50 2.37% CRISIL A1+Bank of India 2,492.54 2.37% CRISIL A1+State Bank of Patiala 2,488.68 2.36% [ICRA] A1+State Bank of Bikaner and Jaipur 2,488.67 2.36% CRISIL A1+Allahabad Bank 2,487.56 2.36% [ICRA] A1+HDFC Bank 2,486.46 2.36% CARE A1+Bank of Baroda 2,486.14 2.36% CRISIL A1+IDBI Bank 2,485.97 2.36% CRISIL A1+Federal Bank 2,483.77 2.36% CRISIL A1+Indian Bank 2,482.63 2.36% FITCH A1+Central Bank of India 2,481.49 2.36% CARE A1+Indian Overseas Bank 2,480.63 2.35% [ICRA] A1+Punjab and Sind Bank 2,478.19 2.35% CARE A1+State Bank of Travancore 2,474.74 2.35% CRISIL A1+Syndicate Bank 2,474.09 2.35% CARE A1+Canara Bank 2,472.40 2.35% CRISIL A1+Punjab National Bank 2,470.25 2.34% CRISIL A1+United Bank of India 2,394.77 2.27% [ICRA] A1+Vijaya Bank 1,978.77 1.88% CARE A1+Fixed DepositState Bank of Travancore 520.00 0.49% UnratedTotal 89.93%Cash EquivalentsCBLOs 4,706.43 4.47%Reverse Repos 5,940.05 5.64%Net Current Assets -33.74 -0.03%Total Net Assets as on 30 April 2013 1,05,362.28 100.00%
HSBC Cash Fund (HCF) April 2013
39

Date of Allotment 04-Dec-02Benchmark CRISIL Liquid Fund
IndexNAV (Growth) per unit(as on 30.04.13)
` 1178.0452
Average Maturity of Portfolio
0.99 months
Modified Durationof Portfolio
0.92 months
Yield To Maturity* 8.19%Fund Manager Ruchir Parekh &
Sanjay ShahSIP AvailableMinimumApplicationAmount
` 10,000` 1,000 p.m.(SIP)
Sub OptionsGrowth, Daily Dividend, Reinvestment Weekly Dividend, Reinvestment, Monthly Dividend (Payout & Reinvestment) Exit Load@ Nil
Annualised Expense Ratio from 01 April 2013 onwardsRegular # 1.00% Institutional # 0.35%Institutional Plus 0.03%Direct Plan 0.02%@ Effective from March 1, 2013 for prospective investments.* Based on invested Amount# Plan(s) discontinued from accepting subscriptions w.e.f. October 01, 2012
Dividend DeclarationRecord Date / period of
dividend declaredDividend (` per unit)
Non-InstitutionalDividend (` per unit)
InstitutionalNAV (`) per unit(cum dividend)
HSBC Cash Fund - Institutional Option - Monthly Dividend22-Feb-13 5.18407 4.97241 1006.596028-Mar-13 6.36248 6.10272 1008.093026-Apr-13 5.40947 5.18076 1006.9982HSBC Cash Fund - Institutional Plus Option - Monthly Dividend26-Aug-11 0.04886 0.04686 10.138329-Sep-11 0.05876 0.05636 10.150928-Oct-11 0.05244 0.05030 10.1428
Asset AllocationMoney Market Instruments 89.43%Fixed Deposit 0.49%Cash Equivalents 10.10%Net Current Assets -0.03%
Rating ProfileAAA 89.43%Fixed Deposit 0.49%Reverse Repos/ CBLOs 10.10%Net Current Assets -0.03%
HSBC Cash Fund (HCF) April 2013
40
Upon payment of dividend, the NAV per unit falls to the extent of payout and statutory levy, if any. Face value: `10 per unit.
*** Service tax on AMC fees is charged in addition to the above stated TERs .
HSBC Cash Fund
01 Apr 2013 to 07 Apr 2013***
08 Apr 2013 to 30 Apr 2013***
Average for the Month
Normal (erstwhile insti-plus)
0.01 0.03 0.03
Direct 0.01 0.02 0.02
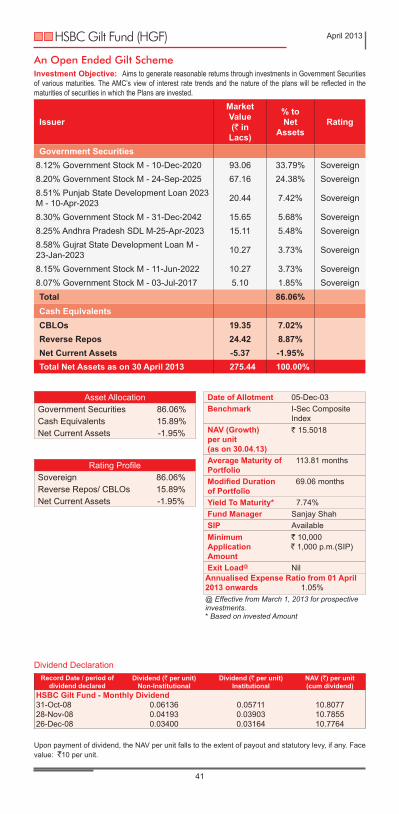
Date of Allotment 05-Dec-03Benchmark I-Sec Composite
IndexNAV (Growth) per unit(as on 30.04.13)
` 15.5018
Average Maturity of Portfolio
113.81 months
Modified Durationof Portfolio
69.06 months
Yield To Maturity* 7.74%Fund Manager Sanjay ShahSIP AvailableMinimum ` 10,000Application ` 1,000 p.m.(SIP)AmountExit Load@ Nil
Annualised Expense Ratio from 01 April 2013 onwards 1.05%@ Effective from March 1, 2013 for prospective investments.* Based on invested Amount
An Open Ended Gilt SchemeInvestment Objective: Aims to generate reasonable returns through investments in Government Securities of various maturities. The AMC’s view of interest rate trends and the nature of the plans will be reflected in the maturities of securities in which the Plans are invested.
Issuer
MarketValue(` in
Lacs)
% toNet
AssetsRating
Government Securities8.12% Government Stock M - 10-Dec-2020 93.06 33.79% Sovereign8.20% Government Stock M - 24-Sep-2025 67.16 24.38% Sovereign8.51% Punjab State Development Loan 2023 M - 10-Apr-2023 20.44 7.42% Sovereign
8.30% Government Stock M - 31-Dec-2042 15.65 5.68% Sovereign8.25% Andhra Pradesh SDL M-25-Apr-2023 15.11 5.48% Sovereign8.58% Gujrat State Development Loan M - 23-Jan-2023 10.27 3.73% Sovereign
8.15% Government Stock M - 11-Jun-2022 10.27 3.73% Sovereign8.07% Government Stock M - 03-Jul-2017 5.10 1.85% SovereignTotal 86.06%Cash EquivalentsCBLOs 19.35 7.02%Reverse Repos 24.42 8.87%Net Current Assets -5.37 -1.95%Total Net Assets as on 30 April 2013 275.44 100.00%
Dividend DeclarationRecord Date / period of
dividend declaredDividend (` per unit)
Non-InstitutionalDividend (` per unit)
InstitutionalNAV (`) per unit(cum dividend)
HSBC Gilt Fund - Monthly Dividend31-Oct-08 0.06136 0.05711 10.807728-Nov-08 0.04193 0.03903 10.785526-Dec-08 0.03400 0.03164 10.7764
Asset AllocationGovernment Securities 86.06%Cash Equivalents 15.89%Net Current Assets -1.95%
Rating ProfileSovereign 86.06%Reverse Repos/ CBLOs 15.89%Net Current Assets -1.95%
HSBC Gilt Fund (HGF) April 2013
41
Upon payment of dividend, the NAV per unit falls to the extent of payout and statutory levy, if any. Face value: `10 per unit.

An Open Ended Debt SchemeInvestment Objective: Seeks to provide liquidity and reasonable returns by investing primarily in a mix of short term debt and money market instruments.
Issuer
MarketValue(` in
Lacs)
% toNet
AssetsRating
Money Market InstrumentsCDsFixedAllahabad Bank 699.89 11.64% [ICRA] A1+Andhra Bank 699.89 11.64% CARE A1+IDBI Bank 693.91 11.54% CRISIL A1+Punjab National Bank 594.28 9.89% CARE A1+Canara Bank 494.48 8.23% CRISIL A1+State Bank of Patiala 476.46 7.93% [ICRA] A1+Oriental Bank of Commerce 475.11 7.90% CRISIL A1+Axis Bank 397.12 6.61% CRISIL A1+Vijaya Bank 396.19 6.59% CARE A1+Indian Bank 392.15 6.52% Fitch A1+Bank of Maharashtra 373.70 6.22% CRISIL A1+State Bank of Mysore 195.39 3.25% [ICRA] A1+Total 97.95%Cash EquivalentsCBLOs 74.99 1.25%Reverse Repos 94.64 1.57%Net Current Assets -46.38 -0.77%Total Net Assets as on 30 April 2013 6,011.80 100.00%
HSBC Ultra Short Term Bond Fund (HUSBF) April 2013
42

Date of Allotment 17-Oct-06Benchmark Customised
Benchmark Index**NAV (Growth) per unit(as on 30.04.13)
` 10.4956
Average Maturity of Portfolio
5.19 months
Modified Durationof Portfolio
4.79 months
Yield To Maturity* 8.16%Fund Manager Sanjay Shah &
Ruchir ParekhSIP AvailableMinimum ` 10,000Application ` 1,000 p.m.(SIP)Amount
Sub OptionsGrowth, Daily Dividend, Reinvestment Weekly Dividend, Reinvestment, Monthly Dividend (Payout & Reinvestment)Exit Load@ NilAnnualised Expense Ratio from 01 April 2013 onwards Regular # 1.32% Institutional 0.52%Institutional Plus # 0.27%Direct Plan 0.17%
@ Effective from March 1, 2013 for prospective investments.** Composite index of CRISIL Liquid Fund Index(90%) and CRISIL Short Term Bond Fund Index(10%).* Based on invested Amount
# Plan(s) discontinued from accepting subscriptions w.e.f. October 01, 2012
Asset AllocationMoney Market Instruments 97.95%Cash Equivalents 2.82%Net Current Assets -0.77%
Rating ProfileAAA 97.95%Reverse Repos/ CBLOs 2.82%Net Current Assets -0.77%
Dividend DeclarationRecord Date / period of
dividend declaredDividend (` per unit)
Non-InstitutionalDividend (` per unit)
InstitutionalNAV (`) per unit(cum dividend)
HSBC Ultra Short Term Bond Fund - Institutional Option - Monthly Dividend22-Feb-13 0.03527 0.03023 10.178528-Mar-13 0.08105 0.06947 10.230526-Apr-13 0.07954 0.06777 10.2293HSBC Ultra Short Term Bond Fund - Institutional Plus Option - Monthly Dividend28-Jan-11 0.04829 0.04501 10.382125-Feb-11 0.04125 0.03845 10.374125-Mar-11 0.05214 0.04859 10.3865
HSBC Ultra Short Term Bond Fund (HUSBF) April 2013
43
Upon payment of dividend, the NAV per unit falls to the extent of payout and statutory levy, if any. Face value: `10 per unit.
HSBC Ultra Short Term Bond Fund
01 Apr 2013 to 07 Apr 2013***
08 Apr 2013 to 30 Apr 2013***
Average for the Month
Normal (erstwhile institutional plan)
0.50 0.50 0.50
Direct 0.15 0.15 0.15
*** Service tax on AMC fees is charged in addition to the above stated TERs .
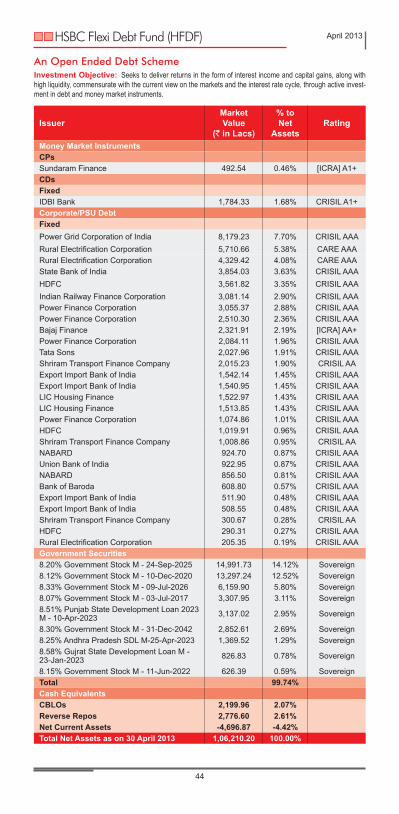
An Open Ended Debt SchemeInvestment Objective: Seeks to deliver returns in the form of interest income and capital gains, along with high liquidity, commensurate with the current view on the markets and the interest rate cycle, through active invest-ment in debt and money market instruments.
IssuerMarketValue
(` in Lacs)
% toNet
AssetsRating
Money Market InstrumentsCPsSundaram Finance 492.54 0.46% [ICRA] A1+CDsFixedIDBI Bank 1,784.33 1.68% CRISIL A1+Corporate/PSU DebtFixedPower Grid Corporation of India 8,179.23 7.70% CRISIL AAARural Electrification Corporation 5,710.66 5.38% CARE AAARural Electrification Corporation 4,329.42 4.08% CARE AAAState Bank of India 3,854.03 3.63% CRISIL AAAHDFC 3,561.82 3.35% CRISIL AAAIndian Railway Finance Corporation 3,081.14 2.90% CRISIL AAAPower Finance Corporation 3,055.37 2.88% CRISIL AAAPower Finance Corporation 2,510.30 2.36% CRISIL AAABajaj Finance 2,321.91 2.19% [ICRA] AA+Power Finance Corporation 2,084.11 1.96% CRISIL AAATata Sons 2,027.96 1.91% CRISIL AAAShriram Transport Finance Company 2,015.23 1.90% CRISIL AAExport Import Bank of India 1,542.14 1.45% CRISIL AAAExport Import Bank of India 1,540.95 1.45% CRISIL AAALIC Housing Finance 1,522.97 1.43% CRISIL AAALIC Housing Finance 1,513.85 1.43% CRISIL AAAPower Finance Corporation 1,074.86 1.01% CRISIL AAAHDFC 1,019.91 0.96% CRISIL AAAShriram Transport Finance Company 1,008.86 0.95% CRISIL AANABARD 924.70 0.87% CRISIL AAAUnion Bank of India 922.95 0.87% CRISIL AAANABARD 856.50 0.81% CRISIL AAABank of Baroda 608.80 0.57% CRISIL AAAExport Import Bank of India 511.90 0.48% CRISIL AAAExport Import Bank of India 508.55 0.48% CRISIL AAAShriram Transport Finance Company 300.67 0.28% CRISIL AAHDFC 290.31 0.27% CRISIL AAARural Electrification Corporation 205.35 0.19% CRISIL AAAGovernment Securities8.20% Government Stock M - 24-Sep-2025 14,991.73 14.12% Sovereign8.12% Government Stock M - 10-Dec-2020 13,297.24 12.52% Sovereign8.33% Government Stock M - 09-Jul-2026 6,159.90 5.80% Sovereign8.07% Government Stock M - 03-Jul-2017 3,307.95 3.11% Sovereign8.51% Punjab State Development Loan 2023 M - 10-Apr-2023 3,137.02 2.95% Sovereign
8.30% Government Stock M - 31-Dec-2042 2,852.61 2.69% Sovereign8.25% Andhra Pradesh SDL M-25-Apr-2023 1,369.52 1.29% Sovereign8.58% Gujrat State Development Loan M - 23-Jan-2023 826.83 0.78% Sovereign
8.15% Government Stock M - 11-Jun-2022 626.39 0.59% SovereignTotal 99.74%Cash EquivalentsCBLOs 2,199.96 2.07%Reverse Repos 2,776.60 2.61%Net Current Assets -4,696.87 -4.42%Total Net Assets as on 30 April 2013 1,06,210.20 100.00%
HSBC Flexi Debt Fund (HFDF) April 2013
44
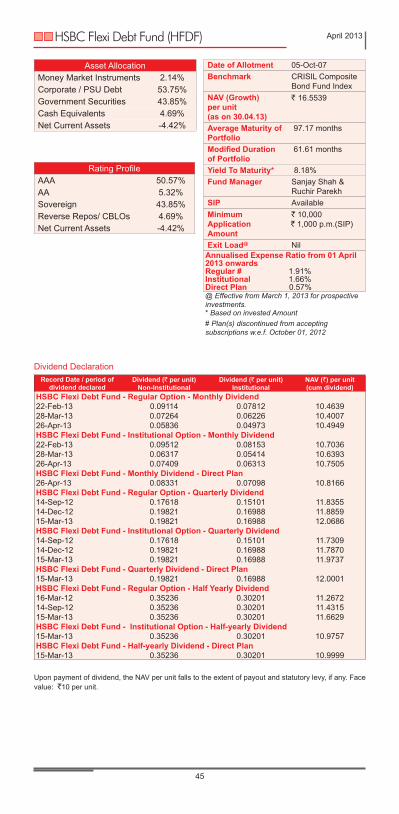
Date of Allotment 05-Oct-07Benchmark CRISIL Composite
Bond Fund IndexNAV (Growth) per unit(as on 30.04.13)
` 16.5539
Average Maturity of Portfolio
97.17 months
Modified Durationof Portfolio
61.61 months
Yield To Maturity* 8.18%Fund Manager Sanjay Shah &
Ruchir ParekhSIP AvailableMinimum ` 10,000Application ` 1,000 p.m.(SIP)AmountExit Load@ Nil
Annualised Expense Ratio from 01 April 2013 onwards Regular # 1.91%Institutional 1.66% Direct Plan 0.57%@ Effective from March 1, 2013 for prospective investments.* Based on invested Amount# Plan(s) discontinued from accepting subscriptions w.e.f. October 01, 2012
Dividend DeclarationRecord Date / period of
dividend declaredDividend (` per unit)
Non-InstitutionalDividend (` per unit)
InstitutionalNAV (`) per unit(cum dividend)
HSBC Flexi Debt Fund - Regular Option - Monthly Dividend22-Feb-13 0.09114 0.07812 10.463928-Mar-13 0.07264 0.06226 10.400726-Apr-13 0.05836 0.04973 10.4949HSBC Flexi Debt Fund - Institutional Option - Monthly Dividend22-Feb-13 0.09512 0.08153 10.703628-Mar-13 0.06317 0.05414 10.639326-Apr-13 0.07409 0.06313 10.7505HSBC Flexi Debt Fund - Monthly Dividend - Direct Plan26-Apr-13 0.08331 0.07098 10.8166HSBC Flexi Debt Fund - Regular Option - Quarterly Dividend14-Sep-12 0.17618 0.15101 11.835514-Dec-12 0.19821 0.16988 11.885915-Mar-13 0.19821 0.16988 12.0686HSBC Flexi Debt Fund - Institutional Option - Quarterly Dividend14-Sep-12 0.17618 0.15101 11.730914-Dec-12 0.19821 0.16988 11.787015-Mar-13 0.19821 0.16988 11.9737HSBC Flexi Debt Fund - Quarterly Dividend - Direct Plan15-Mar-13 0.19821 0.16988 12.0001HSBC Flexi Debt Fund - Regular Option - Half Yearly Dividend16-Mar-12 0.35236 0.30201 11.267214-Sep-12 0.35236 0.30201 11.431515-Mar-13 0.35236 0.30201 11.6629HSBC Flexi Debt Fund - Institutional Option - Half-yearly Dividend15-Mar-13 0.35236 0.30201 10.9757HSBC Flexi Debt Fund - Half-yearly Dividend - Direct Plan15-Mar-13 0.35236 0.30201 10.9999
Asset AllocationMoney Market Instruments 2.14%Corporate / PSU Debt 53.75%Government Securities 43.85%Cash Equivalents 4.69%Net Current Assets -4.42%
Rating ProfileAAA 50.57%AA 5.32%Sovereign 43.85%Reverse Repos/ CBLOs 4.69%Net Current Assets -4.42%
HSBC Flexi Debt Fund (HFDF) April 2013
45
Upon payment of dividend, the NAV per unit falls to the extent of payout and statutory levy, if any. Face value: `10 per unit.
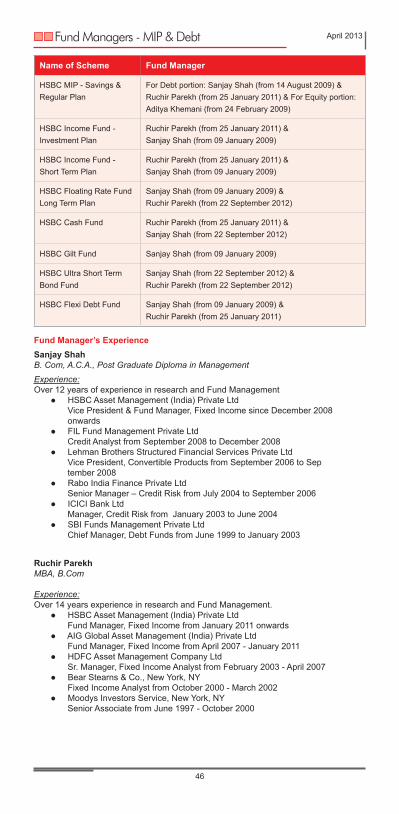
Name of Scheme Fund Manager
HSBC MIP - Savings & Regular Plan
For Debt portion: Sanjay Shah (from 14 August 2009) & Ruchir Parekh (from 25 January 2011) & For Equity portion: Aditya Khemani (from 24 February 2009)
HSBC Income Fund - Investment Plan
Ruchir Parekh (from 25 January 2011) &Sanjay Shah (from 09 January 2009)
HSBC Income Fund - Short Term Plan
Ruchir Parekh (from 25 January 2011) &Sanjay Shah (from 09 January 2009)
HSBC Floating Rate Fund Long Term Plan
Sanjay Shah (from 09 January 2009) & Ruchir Parekh (from 22 September 2012)
HSBC Cash Fund Ruchir Parekh (from 25 January 2011) &Sanjay Shah (from 22 September 2012)
HSBC Gilt Fund Sanjay Shah (from 09 January 2009)
HSBC Ultra Short Term Bond Fund
Sanjay Shah (from 22 September 2012) & Ruchir Parekh (from 22 September 2012)
HSBC Flexi Debt Fund Sanjay Shah (from 09 January 2009) &Ruchir Parekh (from 25 January 2011)
Fund Managers - MIP & Debt April 2013
46
Fund Manager’s ExperienceSanjay Shah B. Com, A.C.A., Post Graduate Diploma in Management
Experience:Over 12 years of experience in research and Fund Management l HSBC Asset Management (India) Private Ltd Vice President & Fund Manager, Fixed Income since December 2008 onwards l FIL Fund Management Private Ltd Credit Analyst from September 2008 to December 2008 l Lehman Brothers Structured Financial Services Private Ltd Vice President, Convertible Products from September 2006 to Sep tember 2008 l Rabo India Finance Private Ltd Senior Manager – Credit Risk from July 2004 to September 2006 l ICICI Bank Ltd Manager, Credit Risk from January 2003 to June 2004 l SBI Funds Management Private Ltd Chief Manager, Debt Funds from June 1999 to January 2003
Ruchir ParekhMBA, B.Com
Experience:Over 14 years experience in research and Fund Management. l HSBC Asset Management (India) Private Ltd Fund Manager, Fixed Income from January 2011 onwards l AIG Global Asset Management (India) Private Ltd Fund Manager, Fixed Income from April 2007 - January 2011 l HDFC Asset Management Company Ltd Sr. Manager, Fixed Income Analyst from February 2003 - April 2007 l Bear Stearns & Co., New York, NY Fixed Income Analyst from October 2000 - March 2002 l Moodys Investors Service, New York, NY Senior Associate from June 1997 - October 2000

Comparative Performance of Debt Schemes April 2013
47
Data for the period April to March has been considered in all cases, except for ‘Since Inception’ returns. ‘Since Inception’ (%) returns are compounded annualised, other % returns are simple annualised. ‘Since inception’ returns are calculated on `10 invested at inception. Standard benchmark is prescribed by SEBI and is used for comparison purposes. Returns on ̀ 10,000 are point-to-point returns for the specific time period, invested at the start of the period. The returns provided above have been rounded off and hence there may be minor differences between point-to-point returns vis-a-vis returns indicated above.
HSBC MIP - Regular Plan Date of Inception : 24 Feb 04Scheme Name & Benchmarks Apr 12 -
Mar 13Apr 11 - Mar 12
Apr 10 - Mar 11
Since Inception
HSBC MIP - Regular Plan - Growth 10.07% 5.20% 3.45% 7.74%Crisil 1 Yr T-Bill Index (Standard Benchmark) 8.37% 6.59% 3.86% 5.41%Crisil 10 Yr Gilt Index (Standard Benchmark) 11.31% 2.41% 4.61% 4.79%Crisil MIP Blended Index (Scheme Benchmark) 9.09% 5.26% 6.04% 7.20%
`10,000, if invested in HSBC MIP - Regular Plan - Growth, would have become `11,007 `10,520 `10,345 `19,728
`10,000, if invested in Crisil 1 Yr T-Bill Index, would have become `10,837 `10,659 `10,386 `16,166
`10,000, if invested in Crisil 10 Yr Gilt Index, would have become `11,131 `10,241 `10,461 `15,322
`10,000, if invested in Crisil MIP Blended Index, would have become `10,909 `10,526 `10,604 `18,842
HSBC MIP - Savings Plan Date of Inception : 24 Feb 04Scheme Name & Benchmarks Apr 12 -
Mar 13Apr 11 - Mar 12
Apr 10 - Mar 11
Since Inception
HSBC MIP - Savings Plan - Growth 10.74% 4.94% 3.53% 9.25%Crisil 1 Yr T-Bill Index (Standard Benchmark) 8.37% 6.59% 3.86% 5.41%Crisil 10 Yr Gilt Index (Standard Benchmark) 11.31% 2.41% 4.61% 4.79%Crisil MIP Blended Index (Scheme Benchmark) 9.09% 5.26% 6.04% 7.20%
`10,000, if invested in HSBC MIP - Savings Plan - Growth, would have become `11,074 `10,494 `10,353 `22,401
`10,000, if invested in Crisil 1 Yr T-Bill Index , would have become `10,837 `10,659 `10,386 `16,166
`10,000, if invested in Crisil 10 Yr Gilt Index , would have become `11,131 `10,241 `10,461 `15,322
`10,000, if invested in Crisil MIP Blended Index , would have become `10,909 `10,526 `10,604 `18,842
Funds Managed by - Sanjay Shah & Ruchir Parekh (for Debt portion) &Aditya Khemani (for Equity portion)
Past performance may or may not be sustained in the future. Refer note below.
Past performance may or may not be sustained in the future. Refer note below.
HSBC Gilt Fund Date of Inception : 05 Dec 03Scheme Name & Benchmarks Apr 12 -
Mar 13Apr 11 - Mar 12
Apr 10 - Mar 11
Since Inception
HSBC Gilt Fund - Growth 12.37% 8.15% 7.86% 4.57%I-Sec Composite Bond Fund Index (Scheme Benchmark) 11.71% 6.77% 6.38% 6.77%
Crisil 10 Year Gilt Index (Standard Benchmark) 11.31% 2.41% 4.61% 4.77%`10,000, if invested in HGF, would have become `11,237 `10,815 `10,786 `15,178
`10,000, if invested in I-Sec Composite Bond Fund Index, would have become `11,171 `10,677 `10,638 `18,415
`10,000, if invested in Crisil 10 Year Gilt Index, would have become `11,131 `10,241 `10,461 `15,449
Fund Managed by - Sanjay Shah.
Past performance may or may not be sustained in the future. Refer note below.

Comparative Performance of Debt Schemes April 2013
48
Data for the period April to March has been considered in all cases, except for ‘Since Inception’ returns. ‘Since Inception’ (%) returns are compounded annualised, other % returns are simple annualised. ‘Since inception’ returns are calculated on `10 invested at inception. Standard benchmark is prescribed by SEBI and is used for comparison purposes. Returns on ̀ 10,000 are point-to-point returns for the specific time period, invested at the start of the period. The returns provided above have been rounded off and hence there may be minor differences between point-to-point returns vis-a-vis returns indicated above.
47
HSBC FRF - LTP - Regular Plan Date of Inception : 16 Nov 04Scheme Name & Benchmarks Apr 12 -
Mar 13Apr 11 - Mar 12
Apr 10 - Mar 11
Since Inception
HSBC FRF - LTP - Growth 9.17% 9.38% 6.50% 7.50%Crisil 1 Yr T-Bill Index (Standard Benchmark) 8.37% 6.59% 3.86% 5.66%Crisil Liquid Fund Index (Scheme Benchmark) 8.22% 8.45% 6.21% 6.67%
`10,000, if invested in HSBC FRF - LTP - Growth, would have become `10,917 `10,938 `10,650 `18,340
`10,000, if invested in Crisil 1 Yr T-Bill Index , would have become `10,837 `10,659 `10,386 `15,869
`10,000, if invested in Crisil Liquid Fund Index , would have become `10,822 `10,845 `10,621 `17,186
Funds Managed by - Sanjay Shah & Ruchir Parekh.
Past performance may or may not be sustained in the future. Refer note below.
HSBC Ultra Short Term Bond Fund$ Date of Inception : 17 Oct 06Scheme Name & Benchmarks Since InceptionHSBC Ultra Short Term Bond Fund - Regular - Growth 8.06%Customised Benchmark Index Fund (Scheme Benchmark)* 7.88%Crisil 1 Year T-Bill Index (Standard Benchmark) 8.11%`10,000, if invested in HUSTBF, would have become `10,385 `10,000, if invested in Customised Benchmark Index, would have become `10,377
`10,000, if invested in Crisil 1 Year T-Bill Index, would have become `10,388
Past performance may or may not be sustained in the future. Refer note below.
HSBC Flexi Debt Fund Date of Inception: 05 Oct 07Scheme Name & Benchmarks Apr 12 -
Mar 13Apr 11 - Mar 12
Apr 10 - Mar 11
Since Inception
HSBC Flexi Debt Fund - Growth 11.26% 9.54% 6.07% 9.28%Crisil 10 Yr Gilt Index (Standard Benchmark) 11.31% 2.41% 4.61% 6.70%Crisil Composite Bond Fund Index (Scheme Benchmark) 9.27% 7.68% 5.06% 6.96%
`10,000, if invested in HSBC Flexi Debt Fund - Growth, would have become `11,126 `10,954 `10,607 `16,286
`10,000, if invested in Crisil 10 Yr Gilt Index , would have become `11,131 `10,241 `10,461 `14,283
`10,000, if invested in Crisil Composite Bond Fund Index , would have become `10,927 `10,768 `10,506 `14,472
Past performance may or may not be sustained in the future. Refer note below.
*Composite index of Crisil Liquid Fund Index(90%) and Crisil Short Term Bond Fund Index(10%).
$ Pursuant to SEBI circular dated Sept 13, 2012, certain Plans/options within the schemes have been discontinued to comply with a single plan structure. Since there was no continuous NAV history available for the surviving Plan prior to 1 October 2012, returns since the said date have been considered for calculating performance. The inception date of HSBC Ultra Short Term Bond Fund however is 17 October 2006.

Comparative Performance of Debt Schemes April 2013
49
Data for the period April to March has been considered in all cases, except for ‘Since Inception’ returns. ‘Since Inception’ (%) returns are compounded annualised, other % returns are simple annualised. ‘Since inception’ returns are calculated on `10 invested at inception. Standard benchmark is prescribed by SEBI and is used for comparison purposes. Returns on ̀ 10,000 are point-to-point returns for the specific time period, invested at the start of the period. The returns provided above have been rounded off and hence there may be minor differences between point-to-point returns vis-a-vis returns indicated above.
HSBC Income Fund - Invtt Plan Date of Inception : 10 Dec 02Scheme Name & Benchmarks Apr 12 -
Mar 13Apr 11 - Mar 12
Apr 10 - Mar 11
Since Inception
HSBC Income Fund - Invtt Plan - Growth 11.19% 8.86% 5.51% 7.15%Crisil 10 Yr Gilt Index (Standard Benchmark) 11.31% 2.41% 4.61% 5.63%Crisil Composite Bond Fund Index (Scheme Benchmark) 9.27% 7.68% 5.06% 5.86%
`10,000, if invested in HSBC Income Fund - Invtt Plan - Growth, would have become `11,119 `10,886 `10,551 `20,404
`10,000, if invested in Crisil 10 Yr Gilt Index , would have become `11,131 `10,241 `10,461 `17,606
`10,000, if invested in Crisil Composite Bond Fund Index , would have become `10,927 `10,768 `10,506 `18,006
HSBC Income Fund - S T P Date of Inception : 10 Dec 02Scheme Name & Benchmarks Apr 12 -
Mar 13Apr 11 - Mar 12
Apr 10 - Mar 11
Since Inception
HSBC Income Fund - S T P - Growth 9.26% 8.41% 5.80% 6.76%Crisil 1 Yr T-Bill Index (Standard Benchmark) 8.37% 6.59% 3.86% 5.41%CRISIL Short-Term Bond Fund Index (Scheme Benchmark) 9.09% 8.28% 5.13% 6.44%
`10,000, if invested in HSBC Income Fund - S T P - Growth, would have become `10,926 `10,841 `10,580 `19,652
`10,000, if invested in Crisil 1 Yr T-Bill Index , would have become `10,837 `10,659 `10,386 `17,221
`10,000, if invested in CRISIL Short-Term Bond Fund Index , would have become `10,909 `10,828 `10,513 `19,048
Funds Managed by - Ruchir Parekh & Sanjay Shah.
Past performance may or may not be sustained in the future. Refer note below.
Past performance may or may not be sustained in the future. Refer note below.
HSBC Cash Fund$ Date of Inception: 04 Dec 02Scheme Name & Benchmarks
Last 7 Days as on 31
December 2012
Last 15 Days as on 31
December 2012
Last 30 Days as on 31
December 2012
Apr 12 - Mar 13
Since Inception
HSBC Cash Fund - Growth 9.23% 9.00% 8.74% 8.91% 8.73%
Crisil Liquid Fund Index (Scheme Benchmark) 8.47% 8.24% 8.33% 8.22% 6.51%
Crisil 91 Day T-Bill Index (Standard Benchmark) 7.25% 8.40% 7.84% 8.49% 8.05%
`10,000, if invested in HCF, would have become
`10,018 `10,037 `10,072 `10,891 `11,687
`10,000, if invested in Crisil Liquid Fund Index, would have become
`10,016 `10,034 `10,068 `10,822 `11,247
`10,000, if invested in Crisil 91 Day T-Bill Index, would have become
`10,014 `10,035 `10,064 `10,849 `11,552
Past performance may or may not be sustained in the future. Refer note below.
$ Pursuant to SEBI circular dated Sept 13, 2012, certain Plans/options within the schemes have been discontinued to comply with a single plan structure. Since there was no continuous NAV history available for the surviving Plan prior to 19 May 2011, returns since the said date have been considered for calculating performance. The inception date of HSBC Cash Fund however is 4 December 2002.

Statutory Details & Disclaimers
All returns have been sourced from MutualFundsIndia Explorer software unless otherwise stated. With regard to equity schemes (including the equity component of MIPs), Fund performance is calculated on a total return basis (i.e. it includes dividends re-invested) while the benchmark is calculated on a price return basis (i.e. it does not consider dividends re-invested). This document has been prepared by HSBC Asset Management (India) Private Ltd (HSBC) for information purposes only and should not be construed as an offer or solicitation of an offer for purchase of any of the funds of HSBC Mutual Fund. All information contained in this document (including that sourced from third parties), is obtained from sources HSBC, the third party believes to be reliable but which it has not independently verified and HSBC, the third party makes no guarantee, representation or warranty and accepts no responsibility or liability as to the accuracy or completeness of such information. The information and opinions contained within the document are based upon publicly available information and rates of taxation applicable at the time of publication, which are subject to change from time to time. Expressions of opinion are those of HSBC only and are subject to change without notice. It does not have regard to specific investment objectives, financial situation and the particular needs of any specific person who may receive this document. Investors should seek financial advice regarding the appropriateness of investing in any securities or investment strategies that may have been discussed or recommended in this report and should understand that the views regarding future prospects may or may not be realized. Neither this document nor the units of HSBC Mutual Fund have been registered in any jurisdiction. The distribution of this document in certain jurisdictions may be restricted or totally prohibited and accordingly, persons who come into possession of this document are required to inform themselves about, and to observe, any such restrictions. Mutual fund investments are subject to market risks. Please read the Scheme Information Document carefully before investing.
No part of this publication may be reproduced, stored in a retrieval system, or transmitted, on any form or by any means, electronic, mechanical, photocopying, recording, or otherwise, without the prior written permission of HSBC Asset Management (India) Private Ltd.
Mutual Fund investments are subject to market risks, read all scheme related documents carefully.
HSBC Asset Management (India) Private Limited, 16, V.N. Road, Fort, Mumbai-400001 Email: [email protected] Website: www.assetmanagement.hsbc.com/in