april 2017 cyber security breaches survey 2017 - gov.uk · pdf filecyber security breaches...
TRANSCRIPT

16-046473-01 | Version 4.5 | Public | This work was carried out in accordance with the requirements of the international quality standard for Market Research, ISO 20252:2012, and with the Ipsos MORI Terms and Conditions which can be found at http://www.ipsos-mori.com/terms. © Department for Culture, Media & Sport 2017
April 2017
Cyber security
breaches survey
2017
Main report
Dr Rebecca Klahr, Jayesh Navin Shah, Paul Sheriffs, Tom Rossington and Gemma Pestell
Ipsos MORI Social Research Institute
Professor Mark Button and Dr Victoria Wang
Institute for Criminal Justice Studies, University of Portsmouth

Cyber Security Breaches Survey 2017 | Main report
16-046473-01 | Version 4.5 | Public | This work was carried out in accordance with the requirements of the international quality standard for Market Research, ISO 20252:2012, and with the Ipsos MORI Terms and Conditions which can be found at http://www.ipsos-mori.com/terms. © Department for Culture, Media & Sport 2017
16-046473-01 | Version 4.5 | Public | This work was carried out in accordance with the requirements of the international quality standard for Market Research, ISO 20252:2012, and with the Ipsos MORI Terms and Conditions which can be found at http://www.ipsos-mori.com/terms. © Department for Culture, Media & Sport 2017

Cyber Security Breaches Survey 2017 | Main report | Contents
16-046473-01 | Version 4.5 | Public | This work was carried out in accordance with the requirements of the international quality standard for Market Research, ISO 20252:2012, and with the Ipsos MORI Terms and Conditions which can be found at http://www.ipsos-mori.com/terms. © Department for Culture, Media & Sport 2017
Contents Summary .......................................................................................................................................... 1
1 Introduction ................................................................................................................................ 4
1.1 Background and objectives .......................................................................................................... 4
1.2 Methodology .................................................................................................................................. 4
1.3 Interpretation of findings ............................................................................................................. 4
2 Profiling UK businesses ............................................................................................................. 6
2.1 Online exposure ............................................................................................................................. 6
2.2 Cloud computing ........................................................................................................................... 7
2.3 Use of personal devices ................................................................................................................. 8
3 Business awareness and attitudes ............................................................................................ 9
3.1 Sources of information ................................................................................................................. 9
3.2 Awareness of Government initiatives and other standards .................................................... 12
3.3 Importance of cyber security ...................................................................................................... 14
4 Approaches to cyber security ................................................................................................. 21
4.1 Investment in cyber security....................................................................................................... 21
4.2 Cyber insurance ............................................................................................................................ 24
4.3 Management and staff approaches ........................................................................................... 27
4.4 Governance and planning ........................................................................................................... 30
4.5 Risk management ........................................................................................................................ 32
4.6 Dealing with third-party suppliers or contractors ................................................................... 34
4.7 Implementing Government initiatives ...................................................................................... 36
5 Incidence and impact of breaches .......................................................................................... 39
5.1 Experience of breaches................................................................................................................ 39
5.2 How are businesses affected? ..................................................................................................... 41
5.3 Financial cost of breaches ........................................................................................................... 46
6 Dealing with breaches.............................................................................................................. 49
6.1 Identifying and understanding breaches .................................................................................. 49
6.2 Responding to breaches .............................................................................................................. 51
6.3 Reporting breaches ...................................................................................................................... 52
7 Conclusions ............................................................................................................................... 57
Guide to statistical reliability ...................................................................................................... 59
List of Figures
Figure 2.1: Businesses’ reliance on online services ................................................................................... 6

Cyber Security Breaches Survey 2017 | Main report | Contents
16-046473-01 | Version 4.5 | Public | This work was carried out in accordance with the requirements of the international quality standard for Market Research, ISO 20252:2012, and with the Ipsos MORI Terms and Conditions which can be found at http://www.ipsos-mori.com/terms. © Department for Culture, Media & Sport 2017
Figure 2.2: Businesses that consider online services as core to their business offer ............................ 7
Figure 2.3: Usage of externally-hosted web services ............................................................................... 8
Figure 2.4: Businesses where bringing your own device (BYOD) occurs ............................................... 8
Figure 3.1: Whether businesses have sought information, advice or guidance .................................... 9
Figure 3.2: Business perceptions of conflicting advice .......................................................................... 11
Figure 3.3: Business awareness of cyber security initiatives and standards ........................................ 13
Figure 3.4: Business awareness of the Cyber Aware campaign ............................................................. 13
Figure 3.5: Whether senior managers consider cyber security a high priority .................................... 15
Figure 3.6: Updates given to senior management on cyber security ................................................... 18
Figure 3.7: Whether core staff take cyber security seriously and whether cyber security is perceived
to disrupt other priorities ......................................................................................................................... 19
Figure 3.8: Whether core staff take cyber security seriously by sector grouping, compared with
prioritisation of cyber security by senior managers............................................................................... 20
Figure 4.1: Average investment in cyber security in last financial year by sector grouping ............. 22
Figure 4.2: Main reasons for investing in cyber security, among businesses who invest .................. 23
Figure 4.3: Ways in which businesses have evaluated cyber security spending ................................. 24
Figure 4.4: How well businesses feel they understand their cyber insurance policy .......................... 26
Figure 4.5: Whether businesses have specialist staff or outsource cyber security ............................. 27
Figure 4.6: Businesses where staff have had cyber security training in the last 12 months .............. 29
Figure 4.7: Which individuals receive training within businesses ......................................................... 29
Figure 4.8: Whether businesses have board members with responsibility for cyber security ........... 30
Figure 4.9: Whether businesses have formal policies or document cyber security risks ................... 31
Figure 4.10: Most common features of cyber security policies ............................................................ 32
Figure 4.11: Ways in which businesses have identified cyber security risks in the last 12 months .. 33
Figure 4.12: Rules or controls that businesses have implemented ....................................................... 34
Figure 4.13: Whether businesses are concerned about suppliers’ cyber security ............................... 35
Figure 4.14: Most commonly required cyber security standards for suppliers ................................... 36
Figure 4.15: Progress in undertaking action on the 10 Steps by size of business .............................. 37
Figure 5.1: Proportion of businesses that have identified breaches in the last 12 months ............... 39
Figure 5.2: Types of breaches suffered among those who have identified breaches ......................... 41
Figure 5.3: Frequency of breaches experienced in the last 12 months ................................................ 42
Figure 5.4: Outcome of breaches among those who identified any breaches in the last 12
months ........................................................................................................................................................ 43
Figure 5.5: Impacts of breaches among those who identified any breaches in the last 12 months . 44
Figure 5.6: Time taken to recover from the most disruptive breach of the last 12 months .............. 45
Figure 6.1: Time taken to identify the most disruptive breach of the last 12 months ....................... 49
Figure 6.2: Businesses’ understanding of the factors and sources behind their most disruptive
breaches of the last 12 months ................................................................................................................ 50
Figure 6.3: Whether businesses have incident management processes and contingency plans ....... 52
Figure 6.4: Reporting of the most disruptive breach of the last 12 months, excluding those who
reported only to their outsourced cyber security provider ................................................................... 53
Figure 6.5: Most common reasons for not reporting the most disruptive breach of the last 12
months ........................................................................................................................................................ 54
Figure 6.6: Most common actions following the most disruptive breach of the last 12 months...... 55
List of Tables
Table 4.1: Average investment in cyber security in last financial year................................................. 21

Cyber Security Breaches Survey 2017 | Main report | Contents
16-046473-01 | Version 4.5 | Public | This work was carried out in accordance with the requirements of the international quality standard for Market Research, ISO 20252:2012, and with the Ipsos MORI Terms and Conditions which can be found at http://www.ipsos-mori.com/terms. © Department for Culture, Media & Sport 2017
Table 4.2: Proportion of businesses undertaking action in each of the 10 Steps areas ..................... 37
Table 5.1: Average number of breaches among those that identified any breaches in last 12
months ........................................................................................................................................................ 42
Table 5.2: Average time dealing with the most disruptive breach of last 12 months ........................ 45
Table 5.3: Average cost of all breaches identified in the last 12 months ............................................ 47
Table 5.4: Average direct cost of the most disruptive breach from the last 12 months .................... 47
Table 5.5: Average recovery cost of the most disruptive breach from the last 12 months ............... 48
Table 5.6: Average estimated long-term cost of the most disruptive breach from the last 12
months ........................................................................................................................................................ 48
Margins of error applicable to percentages at or near these levels ..................................................... 59
Differences required from overall result for significance at or near these percentage levels ........... 59

Cyber Security Breaches Survey 2017 | Main report | Summary 1
16-046473-01 | Version 4.5 | Public | This work was carried out in accordance with the requirements of the international quality standard for Market Research, ISO 20252:2012, and with the Ipsos MORI Terms and Conditions which can be found at http://www.ipsos-mori.com/terms. © Department for Culture, Media & Sport 2017
Summary
This report details the findings from a quantitative and qualitative survey with UK businesses on cyber
security. The Department for Culture, Media and Sport (DCMS) commissioned the survey as part of the
National Cyber Security Programme, following a previous comparable study by the Department
published in 2016.1 It was carried out by Ipsos MORI, in partnership with the Institute for Criminal Justice
Studies at the University of Portsmouth, and comprised:
▪ a telephone survey of 1,523 UK businesses from 24 October 2016 to 11 January 20172
▪ 30 in-depth interviews undertaken in January and February 2017 to follow up businesses that
participated in the survey.
Code of practice for Official Statistics
The Cyber Security Breaches Survey is an Official Statistic and has been produced to the standards set
out in the Code of Practice for Official Statistics.
Acknowledgements
Ipsos MORI and DCMS would like to thank all the businesses and individuals who agreed to participate in
the survey and those that provided an input into the survey’s development. We would also like to thank
the organisations who endorsed the fieldwork and encouraged businesses to participate, including the
Association of British Insurers (ABI), the Confederation of British Industry (CBI), the Federation of Small
Businesses (FSB), ICAEW and techUK.
Main findings
Businesses increasingly see cyber security as an important issue
The 2017 survey again highlights that virtually all UK businesses covered by the survey are exposed to
cyber security risks. Since 2016, the proportion with websites (85%) or social media pages (59%) has risen
(by 8 and 9 percentage points respectively), as has the use of cloud services (from 49% to 59%). This
year’s survey also establishes that three-fifths (61%) hold personal data on their customers electronically.
In this context, three-quarters (74%) of UK businesses say that cyber security is a high priority for their
senior management, with three in ten (31%) saying it is a very high priority. The proportion noting it as a
very low priority is lower than in 2016 (down from 13% to just 7%) – a change mainly seen among the
micro and small business population.3
1 See https://www.gov.uk/government/publications/cyber-security-breaches-survey-2016 for the Cyber Security Breaches Survey 2016.
2 This excludes sole traders, as well as agriculture, forestry and fishing businesses, and mining and quarrying businesses, which were outside the
scope of the survey. The data is weighted to be representative of UK businesses by the remaining sizes and sectors.
3 Micro businesses are those with 2 to 9 employees, small businesses those with 10 to 49 employees, medium businesses those with 50 to 249
employees, and large businesses those with 250 employees or more.

Cyber Security Breaches Survey 2017 | Main report | Summary 2
16-046473-01 | Version 4.5 | Public | This work was carried out in accordance with the requirements of the international quality standard for Market Research, ISO 20252:2012, and with the Ipsos MORI Terms and Conditions which can be found at http://www.ipsos-mori.com/terms. © Department for Culture, Media & Sport 2017
The survey highlights a range of factors that drive home the importance of cyber security for businesses,
including:
▪ the specific threat of ransomware, which has underscored the value of any electronic data that
businesses hold, not just personal or financial data
▪ having a senior individual in charge of cyber security – someone who can have direct contact with
senior managers and can influence decision-making within the business
▪ board members being educated on the topic, enabling them to share knowledge and best practice
across the different businesses they are involved in
▪ people being more exposed to cyber attacks, such as phishing scams, in their personal lives.
More businesses could still seek information or take further action to protect themselves
Three in five (58%) businesses have sought information, advice or guidance on the cyber security threats
facing their organisations over the past year. The top specific sources of information mentioned are
external security or IT consultants (32%) as well as online searches (10%). Only 4 per cent mention
Government or other public sector sources, reflecting that awareness of the information and guidance
offered by Government remains relatively low.
Despite this, three-quarters (75%) of those consulting Government sources say they found this material
useful. The qualitative survey also shows once again that businesses tend to look to the Government as a
trusted source to provide or signpost to information and guidance.
As in 2016, the majority of businesses (67%) have spent money on their cyber security, and this again
tends to be higher among medium firms (87%) and large firms (91%).
Half of all firms (52%) have enacted basic technical controls across the five areas laid out under the
Government-endorsed Cyber Essentials scheme.4 Three-fifths (57%) have also attempted to identify cyber
security risks to their organisation, for example through health checks or risk assessments (up from 51%
in 2016). However, as in 2016, a sizable proportion of businesses still do not have basic protections or
have not formalised their approaches to cyber security:
▪ Under two-fifths have segregated wireless networks, or any rules around encryption of personal
data (37% in each case).
▪ A third have a formal policy that covers cyber security risks (33%), or document these risks in
business continuity plans, internal audits or risk registers (32%).
▪ A third (29%) have made specific board members responsible for cyber security.
▪ A fifth (20%) of businesses have had staff attend any form of cyber security training in the last 12
months, with non-specialist staff being particularly unlikely to have attended.
▪ One-fifth (19%) are worried about their suppliers’ cyber security, but only 13 per cent require
suppliers to adhere to specific cyber security standards or good practice.
4 These five areas include boundary firewalls and internet gateways, secure configurations, user access controls, malware protection, and patch
management. See https://www.cyberaware.gov.uk/cyberessentials/.
Cyber Security Breaches Survey 2017 | Main report | Summary 3
16-046473-01 | Version 4.5 | Public | This work was carried out in accordance with the requirements of the international quality standard for Market Research, ISO 20252:2012, and with the Ipsos MORI Terms and Conditions which can be found at http://www.ipsos-mori.com/terms. © Department for Culture, Media & Sport 2017
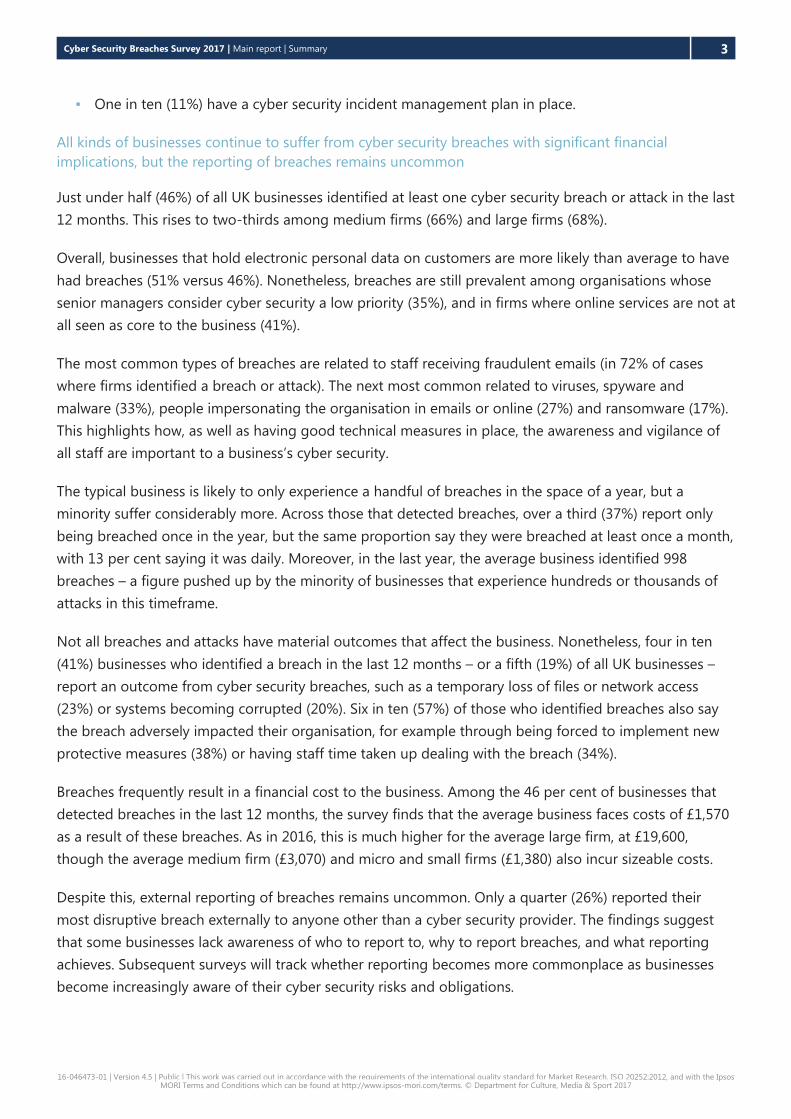
▪ One in ten (11%) have a cyber security incident management plan in place.
All kinds of businesses continue to suffer from cyber security breaches with significant financial
implications, but the reporting of breaches remains uncommon
Just under half (46%) of all UK businesses identified at least one cyber security breach or attack in the last
12 months. This rises to two-thirds among medium firms (66%) and large firms (68%).
Overall, businesses that hold electronic personal data on customers are more likely than average to have
had breaches (51% versus 46%). Nonetheless, breaches are still prevalent among organisations whose
senior managers consider cyber security a low priority (35%), and in firms where online services are not at
all seen as core to the business (41%).
The most common types of breaches are related to staff receiving fraudulent emails (in 72% of cases
where firms identified a breach or attack). The next most common related to viruses, spyware and
malware (33%), people impersonating the organisation in emails or online (27%) and ransomware (17%).
This highlights how, as well as having good technical measures in place, the awareness and vigilance of
all staff are important to a business’s cyber security.
The typical business is likely to only experience a handful of breaches in the space of a year, but a
minority suffer considerably more. Across those that detected breaches, over a third (37%) report only
being breached once in the year, but the same proportion say they were breached at least once a month,
with 13 per cent saying it was daily. Moreover, in the last year, the average business identified 998
breaches – a figure pushed up by the minority of businesses that experience hundreds or thousands of
attacks in this timeframe.
Not all breaches and attacks have material outcomes that affect the business. Nonetheless, four in ten
(41%) businesses who identified a breach in the last 12 months – or a fifth (19%) of all UK businesses –
report an outcome from cyber security breaches, such as a temporary loss of files or network access
(23%) or systems becoming corrupted (20%). Six in ten (57%) of those who identified breaches also say
the breach adversely impacted their organisation, for example through being forced to implement new
protective measures (38%) or having staff time taken up dealing with the breach (34%).
Breaches frequently result in a financial cost to the business. Among the 46 per cent of businesses that
detected breaches in the last 12 months, the survey finds that the average business faces costs of £1,570
as a result of these breaches. As in 2016, this is much higher for the average large firm, at £19,600,
though the average medium firm (£3,070) and micro and small firms (£1,380) also incur sizeable costs.
Despite this, external reporting of breaches remains uncommon. Only a quarter (26%) reported their
most disruptive breach externally to anyone other than a cyber security provider. The findings suggest
that some businesses lack awareness of who to report to, why to report breaches, and what reporting
achieves. Subsequent surveys will track whether reporting becomes more commonplace as businesses
become increasingly aware of their cyber security risks and obligations.

Cyber Security Breaches Survey 2016 | Main report | Introduction 4
16-046473-01 | Version 4.5 | Public | This work was carried out in accordance with the requirements of the international quality standard for Market Research, ISO 20252:2012, and with the Ipsos MORI Terms and Conditions which can be found at http://www.ipsos-mori.com/terms. © Department for Culture, Media & Sport 2017
1 Introduction
1.1 Background and objectives
The National Cyber Security Strategy 2016–20215 outlines the Government’s aim to make the UK secure
and resilient to cyber threats, so it continues to be prosperous and confident in a digital world. As part of
this, UK businesses need to comprehend the nature and significance of the threats they face. This latest
Cyber Security Breaches Survey was run to help businesses understand what other similar businesses are
doing to stay cyber secure, and supports the Government to shape future policy in this area.
The survey builds on the findings first established in the 2016 survey6 and covers:
▪ business awareness and attitudes towards cyber security
▪ approaches to cyber security, including estimates of business spending
▪ the nature and impact (including estimated costs) of cyber security breaches
▪ differences by size, sector and region.
1.2 Methodology
There were two strands to this survey:7
▪ A random probability telephone survey of 1,523 UK businesses was undertaken from 24 October
2016 to 11 January 2017. The survey data has been weighted to be statistically representative of
the UK business population by size and included sectors.
▪ A total of 30 in-depth interviews were undertaken in January and February 2017 to follow up with
businesses that had participated in the survey and gain further qualitative insights.
Sole traders and public sector organisations were outside the scope of the survey, so were excluded. In
addition, businesses with no IT capacity or online presence were deemed ineligible, which meant that a
small number of specific sectors (agriculture, forestry, fishing, mining and quarrying) were excluded.
1.3 Interpretation of findings
How to interpret the survey data
The survey results are subject to margins of error, which vary with the size of the sample and the
percentage figure concerned. For all percentage8 results, subgroup differences by size, sector and region,
5 See https://www.gov.uk/government/publications/national-cyber-security-strategy-2016-to-2021.
6 See https://www.gov.uk/government/publications/cyber-security-breaches-survey-2016 for the Cyber Security Breaches Survey 2016.
7 More technical details and a copy of the questionnaire are available in the separately published Annex, available on the gov.uk website at:
https://www.gov.uk/government/statistics/cyber-security-breaches-survey-2017.
8 Where subgroup mean scores are compared, the large variation in the data often means that these differences are not statistically significant –
this is made clear throughout. However, looking at the pattern of mean scores across subgroups can still generate valuable insights in these
instances.

Cyber Security Breaches Survey 2016 | Main report | Introduction 5
16-046473-01 | Version 4.5 | Public | This work was carried out in accordance with the requirements of the international quality standard for Market Research, ISO 20252:2012, and with the Ipsos MORI Terms and Conditions which can be found at http://www.ipsos-mori.com/terms. © Department for Culture, Media & Sport 2017
as well as changes since the 2016 survey, have been highlighted only where statistically significant (at the
95% level of confidence).9 In charts, arrows () are used to highlight significant changes since 2016
(where comparison is feasible). There is a further guide to statistical reliability at the end of this report.
Analysis by size splits the sample into micro businesses (2 to 9 employees), small businesses (10 to 49
employees), medium businesses (50 to 249 employees) and large businesses (250 employees or more).
Where there are also differences by business turnover, this is commented on separately.
Due to the relatively small sample sizes for certain sectors, these have been grouped with other similar
sectors for more robust analysis. Groupings referred to across this report are as follows:
▪ administration or real estate
▪ construction
▪ education, health or social care
▪ entertainment, service or membership organisations
▪ finance or insurance
▪ food or hospitality
▪ information, communications or utilities
▪ manufacturing
▪ professional, scientific or technical
▪ retail or wholesale
▪ transport or storage.
Where figures in charts do not add to 100% this is due to rounding of percentages or because the
questions allow more than one response.
How to interpret the qualitative data
The qualitative findings offer more nuanced insights and case studies into how and why businesses hold
attitudes or adopt behaviours with regards to cyber security. The findings reported here represent
common themes emerging across multiple interviews. However, they are not intended to be statistically
representative.
9 Subgroup differences highlighted are either those that emerge consistently across multiple questions or evidence a particular hypothesis (i.e.
not every single statistically significant finding has been commented on).

Cyber Security Breaches Survey 2017 | Main report | Profiling UK businesses 6
16-046473-01 | Version 4.5 | Public | This work was carried out in accordance with the requirements of the international quality standard for Market Research, ISO 20252:2012, and with the Ipsos MORI Terms and Conditions which can be found at http://www.ipsos-mori.com/terms. © Department for Culture, Media & Sport 2017
2 Profiling UK businesses
This chapter sets out businesses’ exposure to cyber security risks. These risks can come about via their
reliance on digital services and e-commerce, use of cloud computing, and use of personal devices in the
workplace (bringing your own device, or BYOD). It provides the context for the different attitudes and
approaches to cyber security evidenced in later chapters.
2.1 Online exposure
As can be seen in Figure 2.1, virtually all UK businesses covered by the survey employ online services in
some form (99%). Across all size bands, emails are the most widely used of the services asked about, with
a large majority also having a website, online bank account and a social media page. The number of
businesses having an online presence through websites or social media has also significantly risen since
the 2016 survey, and social media pages remain especially common among medium firms (71%) and
large firms (78%).
As might be expected, industrial control systems are also most prevalent among large firms (11% report
having these in place).
Figure 2.1: Businesses’ reliance on online services
Which businesses consider themselves to be online businesses?
Around three in five businesses consider online services to be a core part of their offering, at least to
some extent. As Figure 2.2 shows, 14 per cent say this is to a large extent, and this is higher among
businesses in the information, communication or utilities sectors and among entertainment, services or
membership firms.
91%
85%
73%
61%
59%
26%
2%
Base: 1,523 UK businesses
*New or amended answer options not present in last year’s survey
Q. Which of the following, if any, does your organisation currently have or use?
Email addresses for organisation or employees
Website or blog
Online bank account*
Social media pages or accounts
Industrial control system
Ability for customers to order, book or pay online
8
9
Personal information about customers held electronically*

Cyber Security Breaches Survey 2017 | Main report | Profiling UK businesses 7
16-046473-01 | Version 4.5 | Public | This work was carried out in accordance with the requirements of the international quality standard for Market Research, ISO 20252:2012, and with the Ipsos MORI Terms and Conditions which can be found at http://www.ipsos-mori.com/terms. © Department for Culture, Media & Sport 2017
Over two in five businesses do not consider online services as core to their business, in line with last year.
Also in line with the 2016 survey, firms in the construction sector are more likely than others to think that
online services are not a core part of their business offer (56%).
Whilst most businesses of all sizes use a variety of online services, the extent to which they consider
themselves as online businesses varies by size band. As Figure 2.2 indicates, micro and small firms are
much less likely to view online services as core to their business than medium and large firms.
Figure 2.2: Businesses that consider online services as core to their business offer
Organisations are more likely to see themselves as online businesses once they accept online payments,
bookings and orders (28% to a large extent, versus 14% overall). It is notable, however, that 15 per cent
of businesses with online payment booking and order facilities still think online services are not at all
core to their business, and therefore may underestimate cyber security as an issue for them.
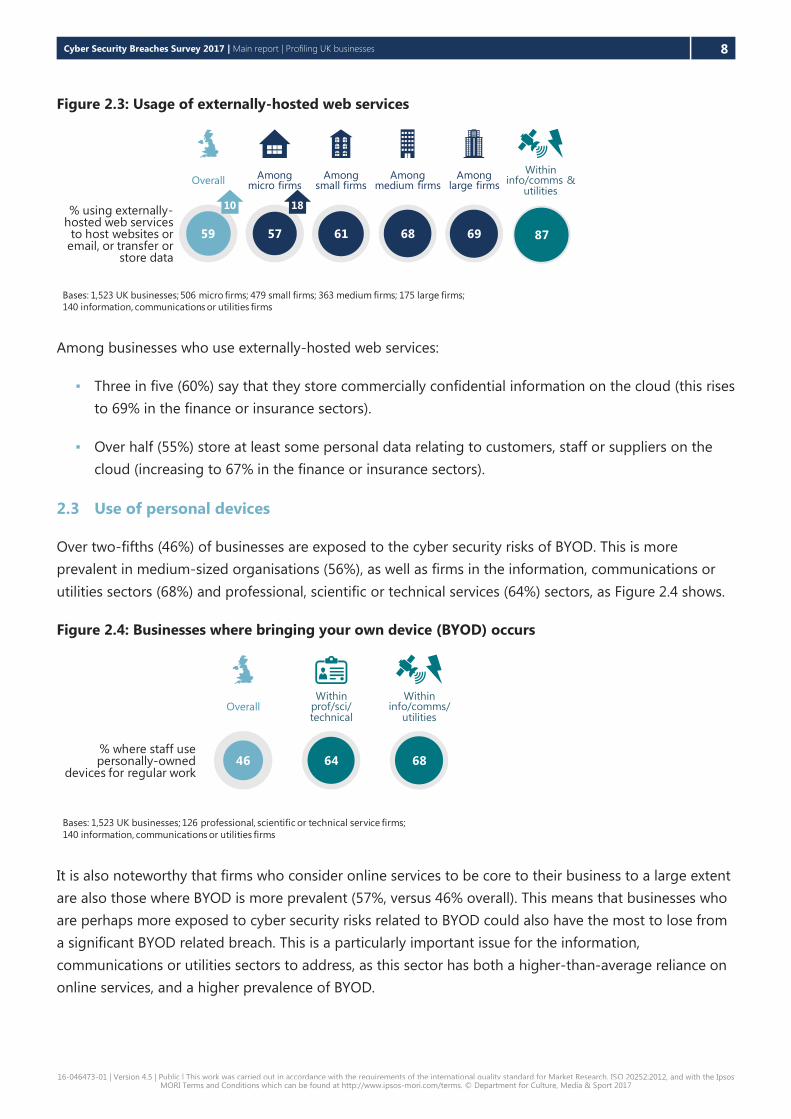
2.2 Cloud computing
The use of cloud computing is increasingly widespread among UK businesses, with 59% of businesses
using some sort of externally-hosted web service (a 10 percentage point increase since 2016). Micro
businesses in particular have seen a significant increase from 39% in 2016 to 57% in this year’s survey.
Among all size bands, a majority of businesses are now using these services, as Figure 2.3 highlights.
Cloud computing is still less commonly used in the construction sector (48%) and the transport or
storage sectors (43%).
Bases: 1,502 UK businesses; 494 micro firms; 476 small firms; 361 medium firms; 171 large firms;
138 information, communications or utilities firms, 86 entertainment, services or membership firms; 82 construction firms
Q. To what extent, if at all, are online services a core part of the goods and services your
organisation provides?% among the following subgroups
42
44
14% to a large
extent
% to some extent
% don’t know(under 1%)
42
56
Overall
Construction% not at all
14
13
13
20
20
32
23
Overall
Info/comms/utilities
Ent/service/mem
Micro
Small
Medium
Large
Cyber Security Breaches Survey 2017 | Main report | Profiling UK businesses 8
16-046473-01 | Version 4.5 | Public | This work was carried out in accordance with the requirements of the international quality standard for Market Research, ISO 20252:2012, and with the Ipsos MORI Terms and Conditions which can be found at http://www.ipsos-mori.com/terms. © Department for Culture, Media & Sport 2017
Figure 2.3: Usage of externally-hosted web services
Among businesses who use externally-hosted web services:
▪ Three in five (60%) say that they store commercially confidential information on the cloud (this rises
to 69% in the finance or insurance sectors).
▪ Over half (55%) store at least some personal data relating to customers, staff or suppliers on the
cloud (increasing to 67% in the finance or insurance sectors).
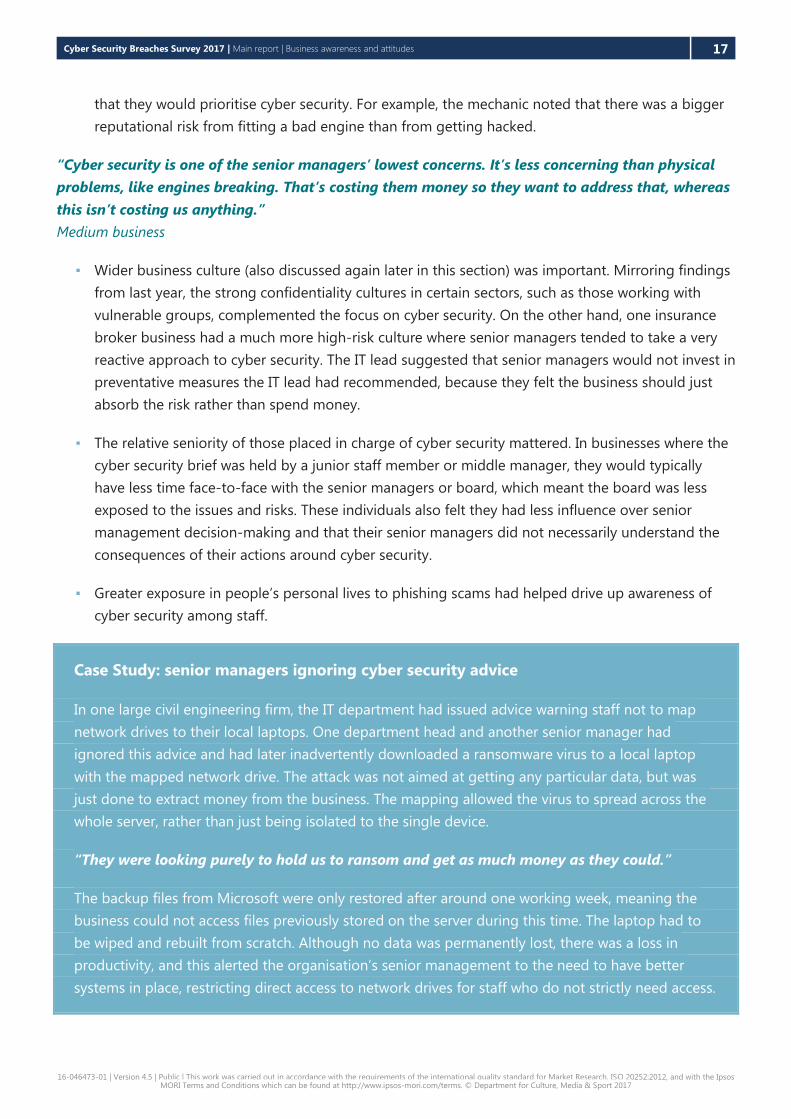
2.3 Use of personal devices
Over two-fifths (46%) of businesses are exposed to the cyber security risks of BYOD. This is more
prevalent in medium-sized organisations (56%), as well as firms in the information, communications or
utilities sectors (68%) and professional, scientific or technical services (64%) sectors, as Figure 2.4 shows.
Figure 2.4: Businesses where bringing your own device (BYOD) occurs
It is also noteworthy that firms who consider online services to be core to their business to a large extent
are also those where BYOD is more prevalent (57%, versus 46% overall). This means that businesses who
are perhaps more exposed to cyber security risks related to BYOD could also have the most to lose from
a significant BYOD related breach. This is a particularly important issue for the information,
communications or utilities sectors to address, as this sector has both a higher-than-average reliance on
online services, and a higher prevalence of BYOD.
Bases: 1,523 UK businesses; 506 micro firms; 479 small firms; 363 medium firms; 175 large firms;
140 information, communications or utilities firms
% using externally-hosted web services to host websites or
email, or transfer or store data
Among large firms
69
Among medium firms
68
Among micro firms
57
Among small firms
6159
OverallWithin
info/comms & utilities
87
10 18
Bases: 1,523 UK businesses; 126 professional, scientific or technical service firms;
140 information, communications or utilities firms
46
Overall
64
Withinprof/sci/technical
68
Withininfo/comms/
utilities
% where staff use personally-owned
devices for regular work

Cyber Security Breaches Survey 2017 | Main report | Business awareness and attitudes 9
16-046473-01 | Version 4.5 | Public | This work was carried out in accordance with the requirements of the international quality standard for Market Research, ISO 20252:2012, and with the Ipsos MORI Terms and Conditions which can be found at http://www.ipsos-mori.com/terms. © Department for Culture, Media & Sport 2017
3 Business awareness and attitudes
The remainder of this report looks in much more detail at how businesses of different sizes and sectors,
and with varying use of online services, deal with cyber security. It includes qualitative case studies to
show how and why certain businesses’ attitudes and approaches have evolved over time.
This chapter first looks at where businesses get information, advice or guidance about cyber security, and
their perceptions of the support available. It also covers attitudes towards cyber security, and the factors
underpinning these attitudes.
3.1 Sources of information
Three in five (58%) businesses have sought information, advice or guidance on the cyber security threats
facing their organisations over the past year. As Figure 3.1 shows, there is still a substantive discrepancy
between micro businesses and others, with the former much less likely to have sought out anything.
Businesses in the food or hospitality and construction sectors are also less likely than average to have
searched for material.
While these findings are in line with 2016 overall, large businesses specifically are less likely to have
sought material this time round. In particular, large businesses are much less likely to have used external
IT or cyber security consultants or providers as an information source (down from 45% to 34% this year)
– despite being just as likely as last year to use outsourced security providers (see section 4.2).
Figure 3.1: Whether businesses have sought information, advice or guidance
Just as in 2016, the top specific (unprompted) sources of information are external security or IT
consultants (32%) as well as Google or general online searching (10%). Seeking information from
Government or other public sector sources such as the police or regulators remains uncommon, with just
four per cent mentioning any such sources. However, it should be noted that this year’s survey was
conducted before the February 2017 launch of the National Cyber Security Centre, and just after the
Centre’s website was published in October 2016. The intention of the new Centre and its website is to
Bases: 1,523 UK businesses; 506 micro firms; 479 small firms; 363 medium firms; 175 large firms;
93 food or hospitality firms, 83 construction firms
% of businesses that have sought information, advice or guidance in the last 12 months on the cyber security threats faced by their organisation
Among large firms
70
Among medium
firms
79
Among micro firms
50
Among small firms
6358
OverallWithin
hospitality/ food
39
14
Withinconstruction
43

Cyber Security Breaches Survey 2017 | Main report | Business awareness and attitudes 10
16-046473-01 | Version 4.5 | Public | This work was carried out in accordance with the requirements of the international quality standard for Market Research, ISO 20252:2012, and with the Ipsos MORI Terms and Conditions which can be found at http://www.ipsos-mori.com/terms. © Department for Culture, Media & Sport 2017
make cyber security guidance more accessible and easy to use for businesses. In future, more businesses
may start to use the range of guidance it provides.10
Large businesses are more likely than others to use Government or other public sector sources (16%), but
even among this subgroup the Government is still an uncommon information source. Medium
businesses are more likely than average to have sought information via external security consultants or
providers (46%, versus 32% overall) as well as from trade associations (8% versus 3%).
Businesses in two specific sectors are also more likely to have sought information from trade
associations. These are finance or insurance businesses (8% from trade associations) and information,
communications or utilities businesses (11%).
Finance or insurance businesses are also more likely than others to have sought material on this topic
from their regulator (8%, versus virtually no mentions across other sectors).
The importance of trade associations and sector-specific regulators also emerged in the qualitative
survey. Some businesses noted that they expected their trade association or regulator to keep them in
the loop if there were any important requirements to adhere to on cyber security, so they did not
necessarily expect to have to actively search for this information and guidance. They also expected these
sources to tailor guidance more to their sector, so anything coming from them would be more relevant.
In another example, one investment business expected information and guidance on cyber security to
come from the Financial Conduct Authority (FCA), because they had seen this kind of guidance being
issued frequently by the Securities and Exchange Commission in the US (the equivalent of the FCA).
“There’s some information that comes through from the FCA, but I think it’s quite limited in terms
of cyber security. As a regulated firm the FCA is always my first port of call … You’d expect it to be
more tailored to the financial industry.”
Small business
Trust in information
In the qualitative interviews, one set of participants – typically those in specialist IT roles – were more
confident in navigating across the range of information and guidance available. Many had looked at a
range of sources to keep themselves up to date, including going on conferences and training, looking at
specialist forums and talking regularly to paid IT consultants or auditors. By contrast, non-specialists had
much more limited exposure to information, and some had based their understanding of cyber security
just on media stories, on cyber security issues they had experienced in their non-business lives, or simply
on the information and guidance they got from their outsourced provider.
The latter group were often less confident in assessing what they saw, and a lack of trust in information
emerged as an important theme in the qualitative survey, particularly when judging the trustworthiness
of security providers trying to sell them products. While the IT specialists interviewed felt they had the
technical knowledge to judge the merits of these products for themselves, businesses where non-IT staff
10 Businesses can find guidance on the National Cyber Security Centre’s website, at: https://www.ncsc.gov.uk/guidance.

Cyber Security Breaches Survey 2017 | Main report | Business awareness and attitudes 11
16-046473-01 | Version 4.5 | Public | This work was carried out in accordance with the requirements of the international quality standard for Market Research, ISO 20252:2012, and with the Ipsos MORI Terms and Conditions which can be found at http://www.ipsos-mori.com/terms. © Department for Culture, Media & Sport 2017
oversaw cyber security specifically wanted more Government signposting to trusted information and
guidance sources online. They also wanted more general guidance on the types of questions they should
be asking security providers to judge their quality. Without this knowhow, some businesses simply took
the advice from their providers for granted, or had to employ IT consultants to help them filter advice.
“People will tell you anything in this industry to get you to buy something … You need to look for
things they don’t tell you rather than the things they do.”
Large business
Among the small proportion of businesses who say they have actively sought information, advice or
guidance from Government sources, it is worth noting that three-quarters (75%) found this material
useful, and a quarter (26%) say it was very useful. As explained in section 3.2, it is most likely lack of
awareness rather than a lack of perceived relevance or usefulness that explains why so few businesses
have used Government information or guidance on this topic to date.
Conflicting advice
Figure 3.2 shows that a third (33%) of businesses think there is conflicting advice on cyber security, but a
similar proportion (36%) disagree. In other words, it is currently a minority of businesses that think
conflicting advice is a problem. This is a common finding across size bands and sectors. Amongst
businesses that have actively sought information, advice or guidance, the proportion that think there is
conflicting advice is closer to two-fifths (37%) but again an equal proportion disagree (37%).
Figure 3.2: Business perceptions of conflicting advice
The qualitative survey found that conflicting advice was not the main problem businesses felt they faced
when navigating cyber security information and advice. Those who were IT specialists noted that there
was inevitably a conflicting view over the technical aspects, but that the basic advice around what the
general user should do was consistent. Those who were non-specialists also did not tend to feel there
was conflicting advice, and noted more the overall lack of advice that they had received on the topic.
Bases: 1,523 UK businesses; 506 micro firms; 479 small firms; 363 medium firms; 175 large firms
Q. How much do you agree or disagree with the following statement?
10
23
24
26
10
7
% tend to disagree
% don’t know
I see conflicting advice on how
businesses should deal with cyber
security
% tendto agree
% neither agree nor disagree
% strongly agree
% stronglydisagree
% agree among these subgroups
33
33
33
37
31
Small
Medium
Overall
Micro
Large
Cyber Security Breaches Survey 2017 | Main report | Business awareness and attitudes 12
16-046473-01 | Version 4.5 | Public | This work was carried out in accordance with the requirements of the international quality standard for Market Research, ISO 20252:2012, and with the Ipsos MORI Terms and Conditions which can be found at http://www.ipsos-mori.com/terms. © Department for Culture, Media & Sport 2017
A more substantive problem that businesses felt their non-specialist staff faced was around a lack of
tailored or specific advice. One finance firm wanted more specific advice to give to their staff on the
latest phishing emails that they might expect to get in their sector, while another firm of solicitors noted
that advice around avoiding scams was sometimes too broad, and should simply tell staff to ignore, for
example, all emails and calls purporting to be from organisations like Microsoft.
Case study: presenting unchecked advice to senior managers
Unchecked advice can cause problems for businesses when presenting options to senior managers.
One small business offering dance classes had received conflicting advice about whether cloud-
based storage would be more or less secure than their current set-up. One of their board members
specialised in data protection, and had challenged the initial advice they had been given around
this. The finance manager was now having to do more of their own research to establish the best
option for the business. This involved talking again to the board member, looking through
Government guidance and searching online generally for more information.
“I’ll ask the board member, look at some governmental guidelines, and I’m likely to just
Google.”
3.2 Awareness of Government initiatives and other standards
Last year’s survey found that accreditation schemes and standards relating to cyber security are not
widely known in the business community. This year’s findings show a similar situation. With regards to
Cyber Essentials, the low awareness of the scheme evidenced here also echoes the findings of the 2016
process evaluation report into the scheme, which suggested that in many cases businesses only became
aware of Cyber Essentials and engaged with it in instances where it was a mandatory requirement (for
example when working as a Government supplier).11
As Figure 3.3 indicates, awareness of such standards continues to be much higher among large firms, and
is also higher than average among finance or insurance businesses, and information, communications or
utilities businesses.
11 See https://www.gov.uk/government/publications/cyber-essentials-scheme-research.

Cyber Security Breaches Survey 2017 | Main report | Business awareness and attitudes 13
16-046473-01 | Version 4.5 | Public | This work was carried out in accordance with the requirements of the international quality standard for Market Research, ISO 20252:2012, and with the Ipsos MORI Terms and Conditions which can be found at http://www.ipsos-mori.com/terms. © Department for Culture, Media & Sport 2017
Figure 3.3: Business awareness of cyber security initiatives and standards
Figure 3.4 shows that there is greater awareness across all sizes of business of the Government’s Cyber
Aware campaign (formerly known as Cyber Streetwise) than there is of the 10 Steps guidance or Cyber
Essentials scheme (the two other major Government cyber security initiatives). Among those aware of this
campaign, a quarter (23%) are also aware of Cyber Essentials and a third (31%) are aware of the 10 Steps.
This suggests that Cyber Aware could be an effective brand or platform to signpost businesses to these
other initiatives.
Figure 3.4: Business awareness of the Cyber Aware campaign
Awareness of the Data Protection Act 1998 and the General Data Protection Regulation
From 25 May 2018, the General Data Protection Regulation (GDPR) will supersede the Data Protection
Act 1998 in the UK. On taking effect, this change will widen the definition of what constitutes personal
data. Businesses will also face new requirements in terms of preventing and reporting data breaches, as
Bases: 1,523 UK businesses; 506 micro firms; 479 small firms; 363 medium firms; 175 large firms;
140 information, communications or utilities firms; 350 financial or insurance firms
Among large firms
57
32
28
Among medium
firms
38
17
18
Among micro firms
17
11
5
Among small firms
24
15
10
Overall
21
13
8% aware of
Cyber Essentials scheme
% aware of ISO 27001
% aware of Government’s
10 Steps guidance
Withininfo/comms/
utilities
36
19
27
Nosignificantdifference
12
20
Withinfinance/
insurance
7
Bases: 1,523 UK businesses; 506 micro firms; 479 small firms; 363 medium firms; 175 large firms; 140 information,
communications or utilities firms; 126 professional, scientific or technical services firms; 350 financial or insurance firms
% of businesses that have seen or heard of the Government’s Cyber Aware campaign
Among large firms
37
Among medium
firms
29
Among micro firms
19
Among small firms
2321
OverallWithin
info/comms/utilities
30
Withinprof/sci/technical
30
Withinfinance/
insurance
29

Cyber Security Breaches Survey 2017 | Main report | Business awareness and attitudes 14
16-046473-01 | Version 4.5 | Public | This work was carried out in accordance with the requirements of the international quality standard for Market Research, ISO 20252:2012, and with the Ipsos MORI Terms and Conditions which can be found at http://www.ipsos-mori.com/terms. © Department for Culture, Media & Sport 2017
well as tougher penalties for breaches. Businesses can find specific guidance on how to prepare for the
GDPR on the Information Commissioner’s Office website.12
The qualitative survey explored awareness and understanding of the GDPR in relation to cyber security.
Across almost all the businesses interviewed, there was strong awareness of the Data Protection Act 1998
and businesses were confident they complied with the current regulations. Awareness of the GDPR was
much less uniform, with smaller businesses often not having heard of it. Some smaller businesses had
heard of it, and felt that they would learn to comply with the new requirements when they came into
force, but were not specially preparing for them before then and did not necessarily understand the
cyber security implications (for instance around reporting of breaches and protection of personal data).
Larger businesses and those that regularly worked with personal data tended to be much more aware. In
several cases, these businesses had started internal discussions to prepare for the new requirements. One
business had specifically set up an internal working group that involved the IT team, as well as their
compliance, human resources and marketing teams, so that all aspects of data protection, including the
cyber security implications, were covered.
3.3 Importance of cyber security
Cyber security remains a high priority for the heads of a large majority of UK businesses. Three-quarters
(74%) say it is either a very high (31%) or fairly high (43%) priority for their senior management.
As Figure 3.5 illustrates, the proportion saying cyber security is a fairly high priority has risen since 2016,
and alongside this, fewer now say it is a very low priority for their senior managers (each rising and falling
by 6 percentage points respectively). This change has mainly come about among micro and small
businesses, whereas the figures for medium and large businesses – who were already considerably more
likely to see cyber security as a high priority – are unchanged from last year. This suggests that some of
the businesses who previously did not recognise cyber security as an issue at all are now becoming more
alert to the risks they face.
12 See https://ico.org.uk/for-organisations/data-protection-reform/.

Cyber Security Breaches Survey 2017 | Main report | Business awareness and attitudes 15
16-046473-01 | Version 4.5 | Public | This work was carried out in accordance with the requirements of the international quality standard for Market Research, ISO 20252:2012, and with the Ipsos MORI Terms and Conditions which can be found at http://www.ipsos-mori.com/terms. © Department for Culture, Media & Sport 2017
Figure 3.5: Whether senior managers consider cyber security a high priority
Another measure of business size, turnover, does not appear to be as big a factor in prioritisation of
cyber security as the number of employees. For example, senior managers in relatively high-turnover
micro and small businesses (with annual sales of £2 million and over) are no more likely than average to
see cyber security as a high priority. There is no clear reason behind this.
Senior managers in a range of sectors are much more likely than average to treat cyber security as a high
priority, including finance or insurance (90%), professional, scientific or technical firms (86%), information,
communications or utilities (85%). Those in the construction (67%), administration or real estate (67%),
transport or storage (67%), and food or hospitality (56%) sectors are all less likely than average to view it
as a high priority. As is documented throughout the rest of this report, these tend to be the sectors that
have taken more or less action respectively around cyber security, in line with the overall attitudes of
their senior management teams.
Reasons for prioritising or deprioritising cyber security
Where businesses say cyber security is a low priority for their senior managers, the main reason given for
this is a sense that it is not relevant to their organisation (37%) – in line with the 2016 survey.
Nonetheless, three in ten (29%) of the businesses giving this reason also say they have had a breach or
attack within the last 12 months, highlighting that their risk perception may be different from the reality.
Other common reasons (all unprompted) centre around businesses thinking they have nothing of value
to attackers. Three in ten of those who say it is a low priority for senior management say this is because
they do not have online services (29%) and two in ten feel they have nothing worth breaching (22%).
Lack of value attached to data was also a common theme in many of the qualitative interviews.
Businesses who did not hold customers’ bank details or other personal data often struggled to
understand why their electronic data would be sought by anyone outside the business, so not
considering themselves at risk.
Bases: 1,523 UK businesses; 363 medium firms; 175 large firms
Q. How high or low a priority is cyber security to your organisation's directors or senior
management?
% very high % fairly high % fairly low % very low
31
45
58
43
41
35
19
10
5
7
3
% don’t know % high priority
Large firms 93
All UK businesses 746
6
86Medium firms
1% 1%

Cyber Security Breaches Survey 2017 | Main report | Business awareness and attitudes 16
16-046473-01 | Version 4.5 | Public | This work was carried out in accordance with the requirements of the international quality standard for Market Research, ISO 20252:2012, and with the Ipsos MORI Terms and Conditions which can be found at http://www.ipsos-mori.com/terms. © Department for Culture, Media & Sport 2017
“We keep electronic records of orders. I keep addresses and contact numbers. I do not keep any
card information on my system … so I don’t think cyber attacks are much of a risk.”
Medium business
“At the moment we’re not in danger. We don’t have anything of value.”
Micro business
However, other businesses challenged this notion, highlighting that the specific threat of ransomware
meant that all electronic data has become valuable. Some businesses felt this threat had helped to raise
the profile of cyber security. One business noted that ransomware had made it easier to show senior
managers the potential scale of the threat if multiple devices could be incapacitated, and to move
business attitudes away from the stereotype of bedroom hackers, to focus more on criminal activity.
Another IT manager at a civil engineering business said that they would use the two ransomware attacks
they had faced to encourage the business to invest in new security software.
“Ransomware is an easy thing to communicate to people, because you can show it working, and
most people can get the scaling factor of it – if this gets on my machine, then gets on 200 more
machines, gets on all the systems – it brings it home for a lot of people.”
Medium business
In the survey, lack of awareness of cyber security as an issue, or simply not having considered it before,
are not big reasons overall for deprioritising the issue – just 14 per cent mention these. However, these
are notably more common reasons given by medium and large organisations (41% of those with over 50
staff mention these). This indicates that, within these larger businesses, lack of attention paid to cyber
security is very often simply the result of senior management boards lacking awareness of the issue.
Moreover, the qualitative survey highlighted the added value of board members being involved in cyber
security. One finance business noted that several of their directors also sat on the boards of other
businesses within the finance industry and shared best practice across these businesses. In their view, this
helped to raise standards across the industry because there was pressure from board members to be as
secure as other similar businesses.
“We have a very supportive board of directors who are also quite educated in regards to what
other fund managers or law firms are doing. One of the directors is a professional director so he
sits on numerous boards … So there’s an open dialogue. Themes and trends are discussed, and
areas in IT are highlighted that we need to improve.”
Small business
The qualitative survey also established several other reasons, in addition to ransomware threats and
board involvement, for prioritising (or deprioritising) cyber security:
▪ Smaller businesses that were largely offline in their day-to-day work, such as commercial
mechanics or in one case a nursery, felt that losing IT functions would not stop them from carrying
out their work and that because of their business area, there was no expectation from customers
Cyber Security Breaches Survey 2017 | Main report | Business awareness and attitudes 17
16-046473-01 | Version 4.5 | Public | This work was carried out in accordance with the requirements of the international quality standard for Market Research, ISO 20252:2012, and with the Ipsos MORI Terms and Conditions which can be found at http://www.ipsos-mori.com/terms. © Department for Culture, Media & Sport 2017
that they would prioritise cyber security. For example, the mechanic noted that there was a bigger
reputational risk from fitting a bad engine than from getting hacked.
“Cyber security is one of the senior managers’ lowest concerns. It’s less concerning than physical
problems, like engines breaking. That’s costing them money so they want to address that, whereas
this isn’t costing us anything.”
Medium business
▪ Wider business culture (also discussed again later in this section) was important. Mirroring findings
from last year, the strong confidentiality cultures in certain sectors, such as those working with
vulnerable groups, complemented the focus on cyber security. On the other hand, one insurance
broker business had a much more high-risk culture where senior managers tended to take a very
reactive approach to cyber security. The IT lead suggested that senior managers would not invest in
preventative measures the IT lead had recommended, because they felt the business should just
absorb the risk rather than spend money.
▪ The relative seniority of those placed in charge of cyber security mattered. In businesses where the
cyber security brief was held by a junior staff member or middle manager, they would typically
have less time face-to-face with the senior managers or board, which meant the board was less
exposed to the issues and risks. These individuals also felt they had less influence over senior
management decision-making and that their senior managers did not necessarily understand the
consequences of their actions around cyber security.
▪ Greater exposure in people’s personal lives to phishing scams had helped drive up awareness of
cyber security among staff.
Case Study: senior managers ignoring cyber security advice
In one large civil engineering firm, the IT department had issued advice warning staff not to map
network drives to their local laptops. One department head and another senior manager had
ignored this advice and had later inadvertently downloaded a ransomware virus to a local laptop
with the mapped network drive. The attack was not aimed at getting any particular data, but was
just done to extract money from the business. The mapping allowed the virus to spread across the
whole server, rather than just being isolated to the single device.
“They were looking purely to hold us to ransom and get as much money as they could.”
The backup files from Microsoft were only restored after around one working week, meaning the
business could not access files previously stored on the server during this time. The laptop had to
be wiped and rebuilt from scratch. Although no data was permanently lost, there was a loss in
productivity, and this alerted the organisation’s senior management to the need to have better
systems in place, restricting direct access to network drives for staff who do not strictly need access.
Cyber Security Breaches Survey 2017 | Main report | Business awareness and attitudes 18
16-046473-01 | Version 4.5 | Public | This work was carried out in accordance with the requirements of the international quality standard for Market Research, ISO 20252:2012, and with the Ipsos MORI Terms and Conditions which can be found at http://www.ipsos-mori.com/terms. © Department for Culture, Media & Sport 2017
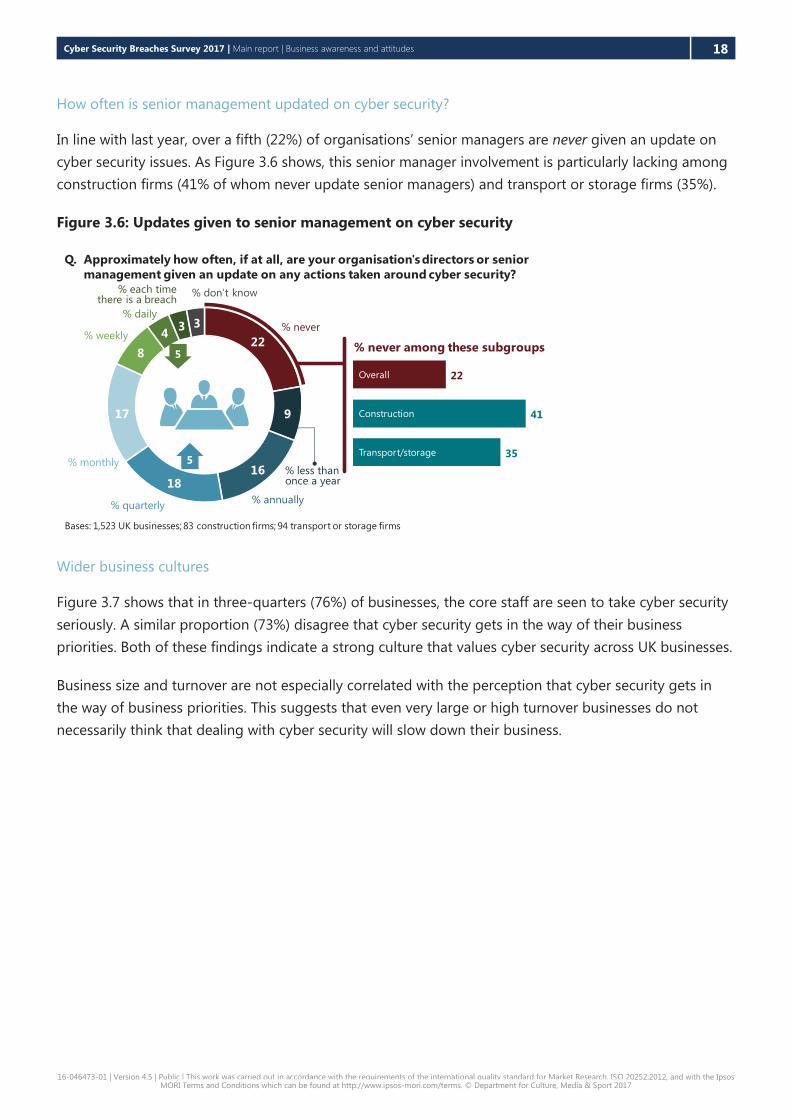
How often is senior management updated on cyber security?
In line with last year, over a fifth (22%) of organisations’ senior managers are never given an update on
cyber security issues. As Figure 3.6 shows, this senior manager involvement is particularly lacking among
construction firms (41% of whom never update senior managers) and transport or storage firms (35%).
Figure 3.6: Updates given to senior management on cyber security
Wider business cultures
Figure 3.7 shows that in three-quarters (76%) of businesses, the core staff are seen to take cyber security
seriously. A similar proportion (73%) disagree that cyber security gets in the way of their business
priorities. Both of these findings indicate a strong culture that values cyber security across UK businesses.
Business size and turnover are not especially correlated with the perception that cyber security gets in
the way of business priorities. This suggests that even very large or high turnover businesses do not
necessarily think that dealing with cyber security will slow down their business.
Bases: 1,523 UK businesses; 83 construction firms; 94 transport or storage firms
Q. Approximately how often, if at all, are your organisation's directors or senior
management given an update on any actions taken around cyber security?
22
9
1618
17
8
43 3 % never
% less than once a year
% annually
% monthly
% quarterly
% don’t know
% never among these subgroups
22
41
35
Construction
Transport/storage
Overall
% weekly
% daily
% each time there is a breach
5
5

Cyber Security Breaches Survey 2017 | Main report | Business awareness and attitudes 19
16-046473-01 | Version 4.5 | Public | This work was carried out in accordance with the requirements of the international quality standard for Market Research, ISO 20252:2012, and with the Ipsos MORI Terms and Conditions which can be found at http://www.ipsos-mori.com/terms. © Department for Culture, Media & Sport 2017
Figure 3.7: Whether core staff take cyber security seriously and whether cyber security is perceived
to disrupt other priorities
Organisations where senior management treat cyber security as a high priority are also more likely than
average to say that their core staff take it seriously (88%, versus 76% overall). This suggests that the
culture set by senior managers permeates throughout the whole organisation when it comes to cyber
security, again highlighting the importance of senior managers’ engagement with the topic.
At the same time, even though large firms are more likely than average to have senior managers who
treat cyber security as a high priority, they are also more likely than others to disagree that their core staff
take cyber security seriously (19%, versus 12% overall) and no more likely to agree. This highlights that,
among the largest firms, activities such as training and awareness raising are especially important to
bridge the perceptions gap between senior managers and the wider workforce.
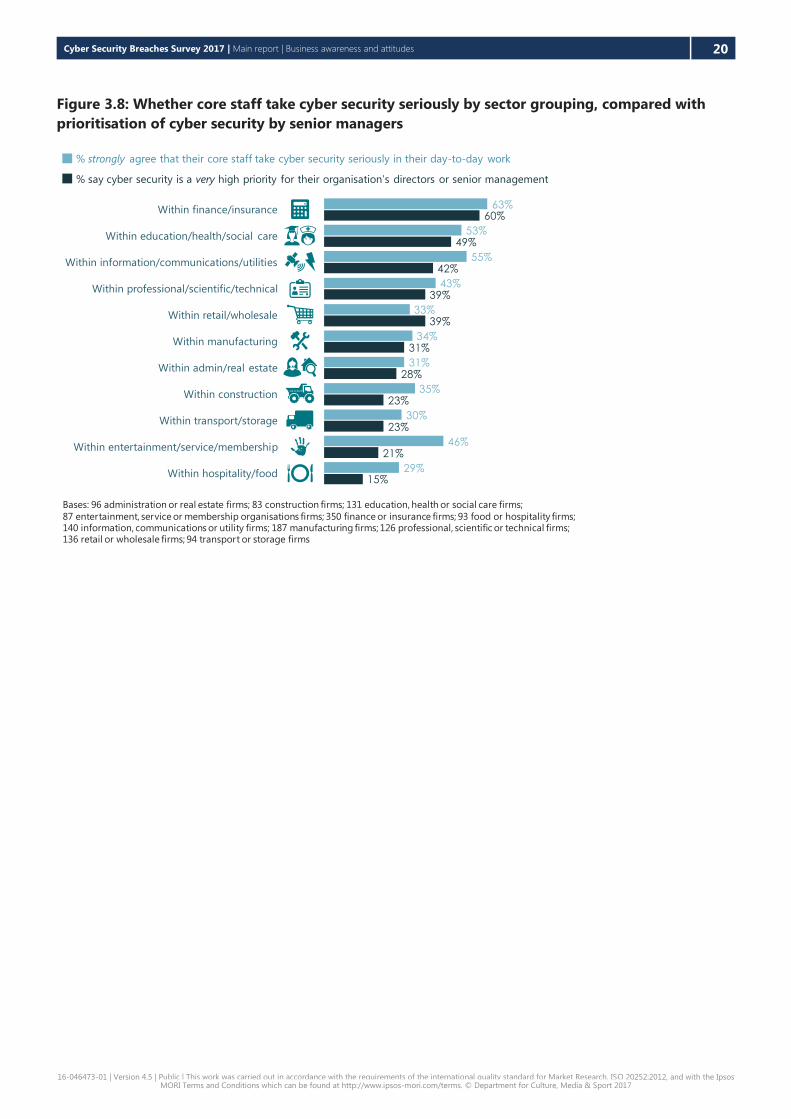
Figure 3.8 shows the relative attitudes of senior management versus core staff in different sectors, as
measured by these two questions. Here it can be seen that, relative to other sectors, the retail or
wholesale sectors are ones where the wider core staff seem to take cyber security less seriously relative
to senior management. By contrast, it is clear that the cross-workforce culture of being cyber secure is
especially strong among finance or insurance businesses.
Base: 1,523 UK businesses
Q. How much do you agree or disagree with the following statements?
Our organisation's core staff take cyber security
seriously in their day-to-day work
The emphasis on cyber security
gets in the way of our organisation's business priorities
38
5
38
10
10
10
7
39
5
35
2
2
76
15
% strongly agree % tend to agree
% tend to disagree % strongly disagree % don’t know % agree
% neither agree nor disagree
Cyber Security Breaches Survey 2017 | Main report | Business awareness and attitudes 20
16-046473-01 | Version 4.5 | Public | This work was carried out in accordance with the requirements of the international quality standard for Market Research, ISO 20252:2012, and with the Ipsos MORI Terms and Conditions which can be found at http://www.ipsos-mori.com/terms. © Department for Culture, Media & Sport 2017
Figure 3.8: Whether core staff take cyber security seriously by sector grouping, compared with
prioritisation of cyber security by senior managers
Bases: 96 administration or real estate firms; 83 construction firms; 131 education, health or social care firms;
87 entertainment, service or membership organisations firms; 350 finance or insurance firms; 93 food or hospitality firms; 140 information, communications or utility firms; 187 manufacturing firms; 126 professional, scientific or technical firms; 136 retail or wholesale firms; 94 transport or storage firms
Within information/communications/utilities
Within finance/insurance
Within professional/scientific/technical
Within hospitality/food
Within construction
Within admin/real estate
Within education/health/social care
Within transport/storage
Within retail/wholesale
Within manufacturing
Within entertainment/service/membership
63%
53%
55%
43%
33%
34%
31%
35%
30%
46%
29%
60%
49%
42%
39%
39%
31%
28%
23%
23%
21%
15%
% strongly agree that their core staff take cyber security seriously in their day-to-day work
% say cyber security is a very high priority for their organisation’s directors or senior management
Cyber Security Breaches Survey 2017 | Main report | Approaches to cyber security 21
16-046473-01 | Version 4.5 | Public | This work was carried out in accordance with the requirements of the international quality standard for Market Research, ISO 20252:2012, and with the Ipsos MORI Terms and Conditions which can be found at http://www.ipsos-mori.com/terms. © Department for Culture, Media & Sport 2017
4 Approaches to cyber security
This chapter looks at how much businesses are investing in cyber security and what drives this level of
investment. It then examines how firms broach the subject of cyber security with their staff, and the
policies and procedures they have in place to identify and reduce risks.
4.1 Investment in cyber security
Levels of investment
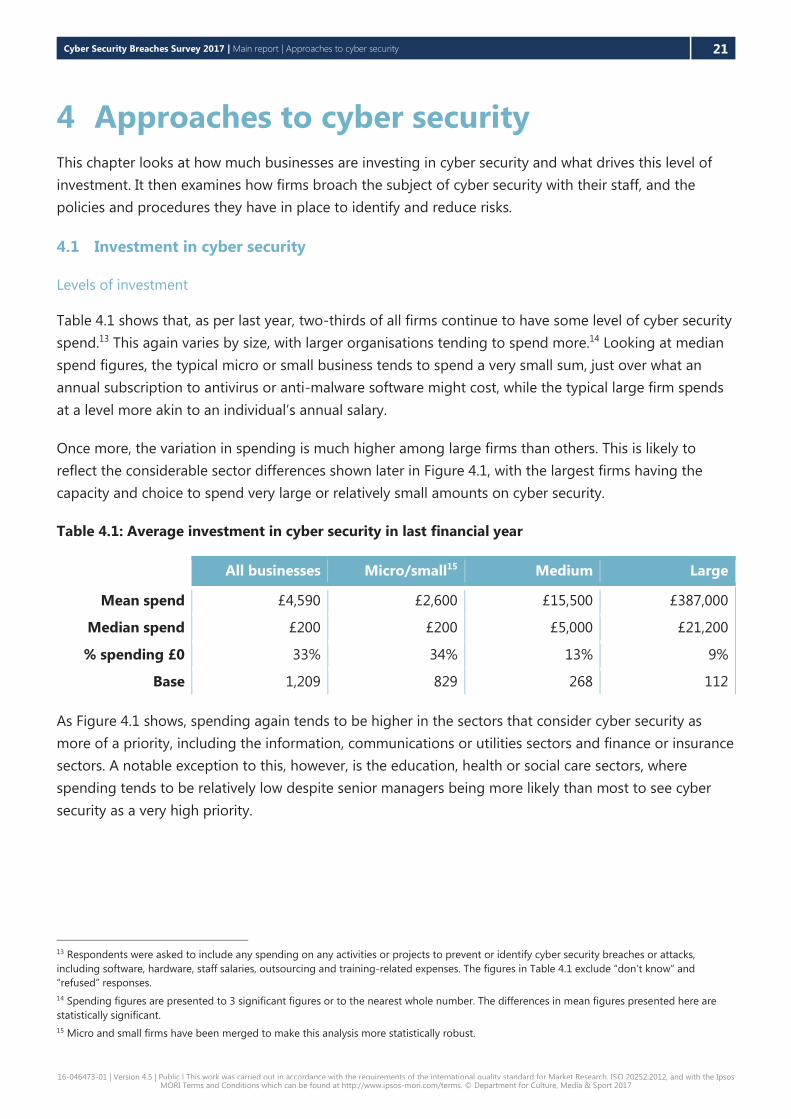
Table 4.1 shows that, as per last year, two-thirds of all firms continue to have some level of cyber security
spend.13 This again varies by size, with larger organisations tending to spend more.14 Looking at median
spend figures, the typical micro or small business tends to spend a very small sum, just over what an
annual subscription to antivirus or anti-malware software might cost, while the typical large firm spends
at a level more akin to an individual’s annual salary.
Once more, the variation in spending is much higher among large firms than others. This is likely to
reflect the considerable sector differences shown later in Figure 4.1, with the largest firms having the
capacity and choice to spend very large or relatively small amounts on cyber security.
Table 4.1: Average investment in cyber security in last financial year
All businesses Micro/small15 Medium Large
Mean spend £4,590 £2,600 £15,500 £387,000
Median spend £200 £200 £5,000 £21,200
% spending £0 33% 34% 13% 9%
Base 1,209 829 268 112
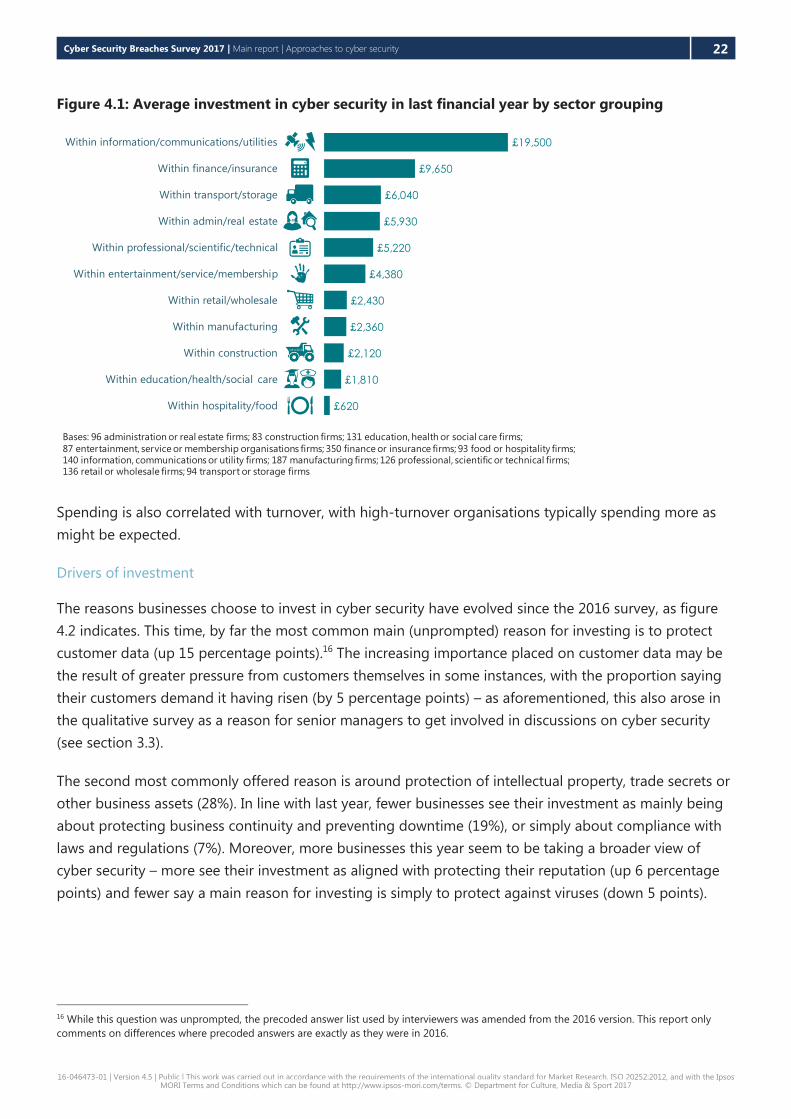
As Figure 4.1 shows, spending again tends to be higher in the sectors that consider cyber security as
more of a priority, including the information, communications or utilities sectors and finance or insurance
sectors. A notable exception to this, however, is the education, health or social care sectors, where
spending tends to be relatively low despite senior managers being more likely than most to see cyber
security as a very high priority.
13 Respondents were asked to include any spending on any activities or projects to prevent or identify cyber security breaches or attacks,
including software, hardware, staff salaries, outsourcing and training-related expenses. The figures in Table 4.1 exclude “don’t know” and
“refused” responses.
14 Spending figures are presented to 3 significant figures or to the nearest whole number. The differences in mean figures presented here are
statistically significant.
15 Micro and small firms have been merged to make this analysis more statistically robust.
Cyber Security Breaches Survey 2017 | Main report | Approaches to cyber security 22
16-046473-01 | Version 4.5 | Public | This work was carried out in accordance with the requirements of the international quality standard for Market Research, ISO 20252:2012, and with the Ipsos MORI Terms and Conditions which can be found at http://www.ipsos-mori.com/terms. © Department for Culture, Media & Sport 2017
Figure 4.1: Average investment in cyber security in last financial year by sector grouping
Spending is also correlated with turnover, with high-turnover organisations typically spending more as
might be expected.
Drivers of investment
The reasons businesses choose to invest in cyber security have evolved since the 2016 survey, as figure
4.2 indicates. This time, by far the most common main (unprompted) reason for investing is to protect
customer data (up 15 percentage points).16 The increasing importance placed on customer data may be
the result of greater pressure from customers themselves in some instances, with the proportion saying
their customers demand it having risen (by 5 percentage points) – as aforementioned, this also arose in
the qualitative survey as a reason for senior managers to get involved in discussions on cyber security
(see section 3.3).
The second most commonly offered reason is around protection of intellectual property, trade secrets or
other business assets (28%). In line with last year, fewer businesses see their investment as mainly being
about protecting business continuity and preventing downtime (19%), or simply about compliance with
laws and regulations (7%). Moreover, more businesses this year seem to be taking a broader view of
cyber security – more see their investment as aligned with protecting their reputation (up 6 percentage
points) and fewer say a main reason for investing is simply to protect against viruses (down 5 points).
16 While this question was unprompted, the precoded answer list used by interviewers was amended from the 2016 version. This report only
comments on differences where precoded answers are exactly as they were in 2016.
Bases: 96 administration or real estate firms; 83 construction firms; 131 education, health or social care firms;
87 entertainment, service or membership organisations firms; 350 finance or insurance firms; 93 food or hospitality firms; 140 information, communications or utility firms; 187 manufacturing firms; 126 professional, scientific or technical firms; 136 retail or wholesale firms; 94 transport or storage firms
Within information/communications/utilities
Within finance/insurance
Within professional/scientific/technical
Within hospitality/food
Within construction
Within admin/real estate
Within education/health/social care
Within transport/storage
Within retail/wholesale
Within manufacturing
Within entertainment/service/membership
£19,500
£9,650
£6,040
£5,930
£5,220
£4,380
£2,430
£2,360
£2,120
£1,810
£620
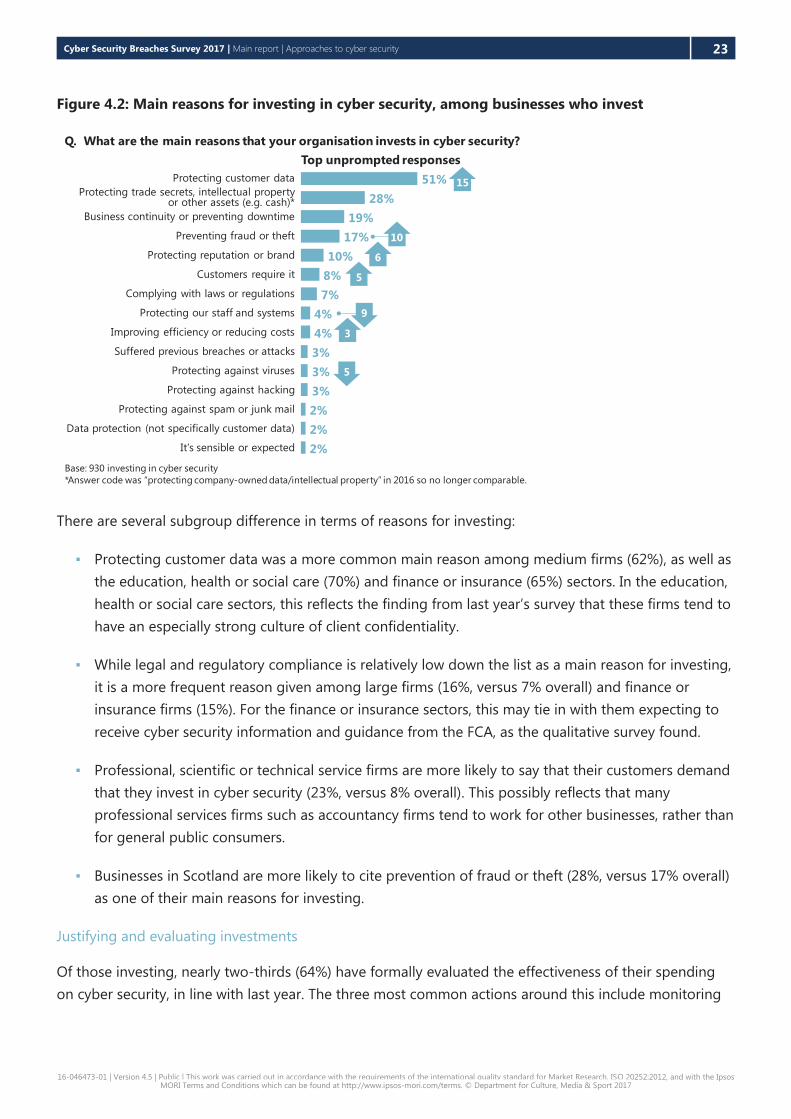
Cyber Security Breaches Survey 2017 | Main report | Approaches to cyber security 23
16-046473-01 | Version 4.5 | Public | This work was carried out in accordance with the requirements of the international quality standard for Market Research, ISO 20252:2012, and with the Ipsos MORI Terms and Conditions which can be found at http://www.ipsos-mori.com/terms. © Department for Culture, Media & Sport 2017
Figure 4.2: Main reasons for investing in cyber security, among businesses who invest
There are several subgroup difference in terms of reasons for investing:
▪ Protecting customer data was a more common main reason among medium firms (62%), as well as
the education, health or social care (70%) and finance or insurance (65%) sectors. In the education,
health or social care sectors, this reflects the finding from last year’s survey that these firms tend to
have an especially strong culture of client confidentiality.
▪ While legal and regulatory compliance is relatively low down the list as a main reason for investing,
it is a more frequent reason given among large firms (16%, versus 7% overall) and finance or
insurance firms (15%). For the finance or insurance sectors, this may tie in with them expecting to
receive cyber security information and guidance from the FCA, as the qualitative survey found.
▪ Professional, scientific or technical service firms are more likely to say that their customers demand
that they invest in cyber security (23%, versus 8% overall). This possibly reflects that many
professional services firms such as accountancy firms tend to work for other businesses, rather than
for general public consumers.
▪ Businesses in Scotland are more likely to cite prevention of fraud or theft (28%, versus 17% overall)
as one of their main reasons for investing.
Justifying and evaluating investments
Of those investing, nearly two-thirds (64%) have formally evaluated the effectiveness of their spending
on cyber security, in line with last year. The three most common actions around this include monitoring
Base: 930 investing in cyber security
*Answer code was “protecting company-owned data/intellectual property” in 2016 so no longer comparable.
Q. What are the main reasons that your organisation invests in cyber security?
51%
28%
19%
17%
10%
8%
7%
4%
4%
3%
3%
3%
2%
2%
2%
Protecting customer data
Preventing fraud or theft
Protecting trade secrets, intellectual property or other assets (e.g. cash)*
Business continuity or preventing downtime
Protecting reputation or brand
Customers require it
Complying with laws or regulations
Protecting our staff and systems
Improving efficiency or reducing costs
Suffered previous breaches or attacks
Protecting against viruses
Protecting against hacking
Protecting against spam or junk mail
Data protection (not specifically customer data)
It’s sensible or expected
Top unprompted responses
15
10
6
5
9
5
3
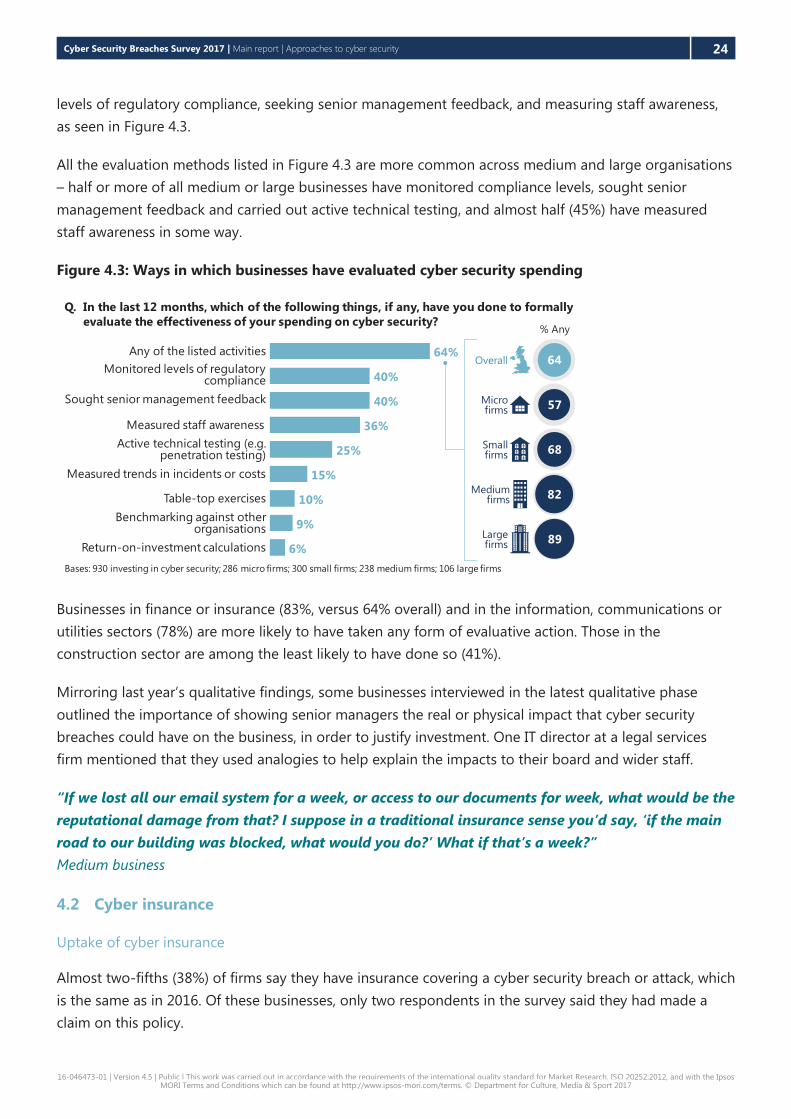
Cyber Security Breaches Survey 2017 | Main report | Approaches to cyber security 24
16-046473-01 | Version 4.5 | Public | This work was carried out in accordance with the requirements of the international quality standard for Market Research, ISO 20252:2012, and with the Ipsos MORI Terms and Conditions which can be found at http://www.ipsos-mori.com/terms. © Department for Culture, Media & Sport 2017
levels of regulatory compliance, seeking senior management feedback, and measuring staff awareness,
as seen in Figure 4.3.
All the evaluation methods listed in Figure 4.3 are more common across medium and large organisations
– half or more of all medium or large businesses have monitored compliance levels, sought senior
management feedback and carried out active technical testing, and almost half (45%) have measured
staff awareness in some way.
Figure 4.3: Ways in which businesses have evaluated cyber security spending
Businesses in finance or insurance (83%, versus 64% overall) and in the information, communications or
utilities sectors (78%) are more likely to have taken any form of evaluative action. Those in the
construction sector are among the least likely to have done so (41%).
Mirroring last year’s qualitative findings, some businesses interviewed in the latest qualitative phase
outlined the importance of showing senior managers the real or physical impact that cyber security
breaches could have on the business, in order to justify investment. One IT director at a legal services
firm mentioned that they used analogies to help explain the impacts to their board and wider staff.
“If we lost all our email system for a week, or access to our documents for week, what would be the
reputational damage from that? I suppose in a traditional insurance sense you’d say, ‘if the main
road to our building was blocked, what would you do?’ What if that’s a week?”
Medium business
4.2 Cyber insurance
Uptake of cyber insurance
Almost two-fifths (38%) of firms say they have insurance covering a cyber security breach or attack, which
is the same as in 2016. Of these businesses, only two respondents in the survey said they had made a
claim on this policy.
Bases: 930 investing in cyber security; 286 micro firms; 300 small firms; 238 medium firms; 106 large firms
Q. In the last 12 months, which of the following things, if any, have you done to formally
evaluate the effectiveness of your spending on cyber security?
Measured staff awareness
Monitored levels of regulatory compliance
Sought senior management feedback
Active technical testing (e.g. penetration testing)
Measured trends in incidents or costs
Table-top exercises
Return-on-investment calculations
Benchmarking against other organisations
Any of the listed activities 64%
40%
40%
36%
25%
15%
10%
9%
6%
Overall
Micro firms
Smallfirms
Mediumfirms
Largefirms
64
57
68
82
89
% Any

Cyber Security Breaches Survey 2017 | Main report | Approaches to cyber security 25
16-046473-01 | Version 4.5 | Public | This work was carried out in accordance with the requirements of the international quality standard for Market Research, ISO 20252:2012, and with the Ipsos MORI Terms and Conditions which can be found at http://www.ipsos-mori.com/terms. © Department for Culture, Media & Sport 2017
Coverage is much more common in the education, health or social care sectors (57%, versus 38% overall),
finance or insurance sectors (53%) and administration or real estate businesses (52%). It is also more
prevalent among large businesses (48%).
Whereas spending on cyber security is positively correlated with business turnover, there is not such a
clear relationship between turnover and cyber insurance. In fact, it is the businesses with mid-level
turnover of £2 million to £10 million that are most likely to have insurance (49%), compared to
businesses with under £2 million in turnover and those with £10 million or more in turnover (both 36%).
Case study: the length of time taken to make a cyber insurance claim
One micro finance advisory business had a case where one of their client’s email accounts was
hacked. They (the business) received a fraudulent email from the client’s hacked account asking
them to change the client’s bank details. This later led to money being fraudulently withdrawn in
the client’s name. The impact was substantive, leading to loss of trust with the client and a new,
much stricter authorisation process for making withdrawals, which has affected other clients. The
business claimed damages through the cyber security element of their professional indemnity
insurance. Making this claim has been longwinded in their view, taking over a year, with a senior
director leading on it and using lawyers on both sides. They expect future insurance premiums to
be higher, and expect the policy to pay out, but are not sure how much they will get back.
“It’s still ongoing and has been going on for over a year … it’s quite stressful, and as expected
the premiums go up. Whether they pay out the full amount is still undecided.”
Impressions of the cyber insurance market
The qualitative survey shows there are very disparate levels of awareness around cyber insurance. Some
businesses – typically smaller ones – were simply not aware of the notion at all, while others had looked
into it in depth and ruled it out, or were still looking for an appropriate policy.
The larger businesses that had looked into it had mixed impressions about the policies available, and felt
that the insurance market still needed to evolve before it became viable for most firms. One investment
firm said they had avoided cyber insurance because the impression they had got from various lawyers
was that the current crop of available policies failed to cover a range of risks, such as regulator fines or
finding alternative office premises. They had also been made aware of other businesses making
unsuccessful claims against these policies.
Another legal firm felt that the policies they had seen had set unnecessarily stringent standards for
businesses to meet before insuring them, and that these varied considerably across policies, meaning
that it was difficult for the business to choose between them. For example, they had seen some policies
that required the business to patch every machine on a daily basis, which they felt was not industry best
practice and was not physically possible for a medium firm like theirs to fulfil.

Cyber Security Breaches Survey 2017 | Main report | Approaches to cyber security 26
16-046473-01 | Version 4.5 | Public | This work was carried out in accordance with the requirements of the international quality standard for Market Research, ISO 20252:2012, and with the Ipsos MORI Terms and Conditions which can be found at http://www.ipsos-mori.com/terms. © Department for Culture, Media & Sport 2017
These larger businesses also noted that the Government or trade associations might play a role in terms
of mandating or lobbying insurers to make cyber insurance policies more consistent. This was both in
terms of minimum coverage offered, and also in terms of what the policies demanded from businesses
(for example, policies could request compliance with a single recognised standard such as ISO 27001).
One medium solicitor’s business noted that some insurance applications had offered a reduced premium
if the business was certified with Cyber Essentials or Cyber Essentials Plus. However, in this case, the
business said they chose not to do this because they felt the cost of certifying outweighed the potential
reduction in premiums.
Understanding of coverage
Among those that do have insurance, there is mixed understanding of what this may or may not cover.
As Figure 4.4 shows, while most businesses do feel they understand well what their policy covers, just two
in ten (18%) feel they understand this very well and almost two-fifths (37%) think they do not understand
it well. This is a similar situation across size bands.
Finance or insurance firms tend to be more confident in their understanding than the average business.
Figure 4.4: How well businesses feel they understand their cyber insurance policy
Repeating the findings from last year’s survey, the qualitative survey in 2017 highlights that businesses
may assume they are covered for breaches through a more general indemnity insurance policy, which in
fact may not cover them. This highlights that the proportion (38%) saying they are insured may in fact be
a slight overestimate of those whose policy would specifically cover cyber security breaches.
Bases: 671 with cyber insurance; 194 micro firms; 222 small firms; 170 medium firms; 85 large firms;
196 finance or insurance firms
Q. How well, if at all, do you feel you understand what is and isn't covered by this
insurance?
18
41
28
94
% not very well
% don’t know
% fairly well
% very well% not at all well
% well among these subgroups
59
63
56
63
61
73
Small
Medium
Overall
Micro
Finance or insurance
Large
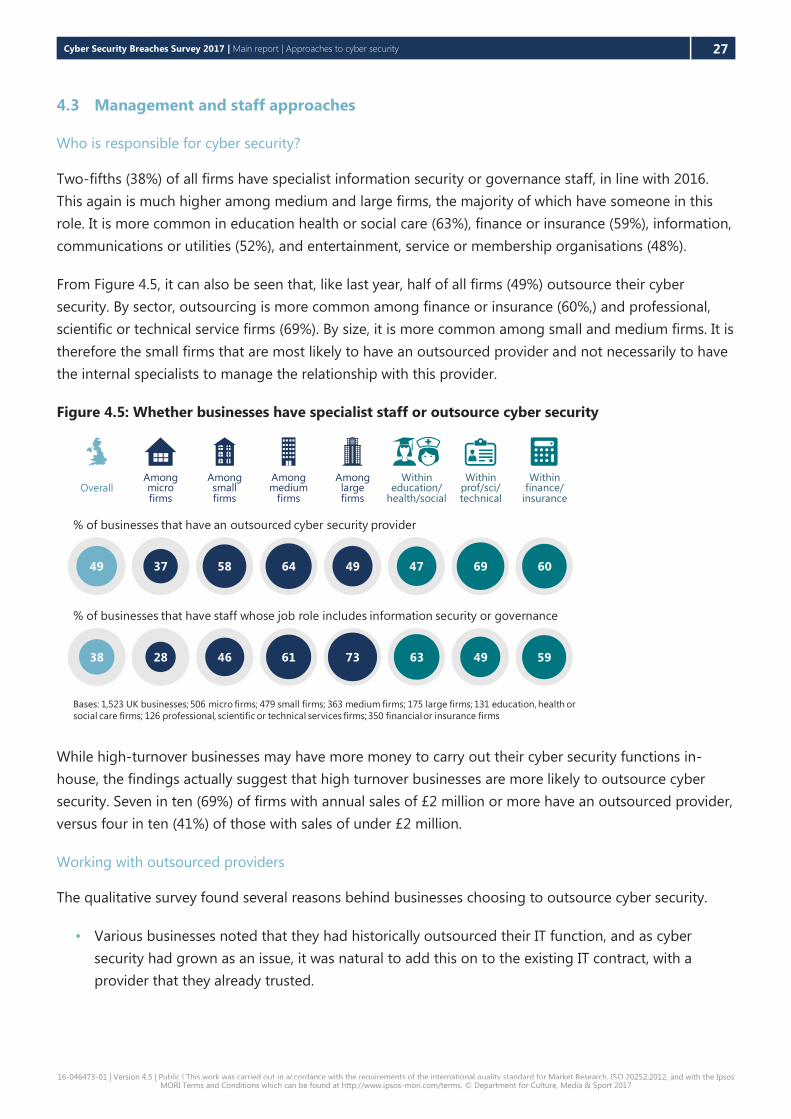
Cyber Security Breaches Survey 2017 | Main report | Approaches to cyber security 27
16-046473-01 | Version 4.5 | Public | This work was carried out in accordance with the requirements of the international quality standard for Market Research, ISO 20252:2012, and with the Ipsos MORI Terms and Conditions which can be found at http://www.ipsos-mori.com/terms. © Department for Culture, Media & Sport 2017
4.3 Management and staff approaches
Who is responsible for cyber security?
Two-fifths (38%) of all firms have specialist information security or governance staff, in line with 2016.
This again is much higher among medium and large firms, the majority of which have someone in this
role. It is more common in education health or social care (63%), finance or insurance (59%), information,
communications or utilities (52%), and entertainment, service or membership organisations (48%).
From Figure 4.5, it can also be seen that, like last year, half of all firms (49%) outsource their cyber
security. By sector, outsourcing is more common among finance or insurance (60%,) and professional,
scientific or technical service firms (69%). By size, it is more common among small and medium firms. It is
therefore the small firms that are most likely to have an outsourced provider and not necessarily to have
the internal specialists to manage the relationship with this provider.
Figure 4.5: Whether businesses have specialist staff or outsource cyber security
While high-turnover businesses may have more money to carry out their cyber security functions in-
house, the findings actually suggest that high turnover businesses are more likely to outsource cyber
security. Seven in ten (69%) of firms with annual sales of £2 million or more have an outsourced provider,
versus four in ten (41%) of those with sales of under £2 million.
Working with outsourced providers
The qualitative survey found several reasons behind businesses choosing to outsource cyber security.
▪ Various businesses noted that they had historically outsourced their IT function, and as cyber
security had grown as an issue, it was natural to add this on to the existing IT contract, with a
provider that they already trusted.
Bases: 1,523 UK businesses; 506 micro firms; 479 small firms; 363 medium firms; 175 large firms; 131 education, health or
social care firms; 126 professional, scientific or technical services firms; 350 financial or insurance firms
% of businesses that have an outsourced cyber security provider
Among large firms
73
Among medium
firms
61
Among micro firms
28
Among small firms
4638
OverallWithin
education/health/social
63
Withinprof/sci/technical
49
Withinfinance/
insurance
59
% of businesses that have staff whose job role includes information security or governance
496437 5849 47 69 60

Cyber Security Breaches Survey 2017 | Main report | Approaches to cyber security 28
16-046473-01 | Version 4.5 | Public | This work was carried out in accordance with the requirements of the international quality standard for Market Research, ISO 20252:2012, and with the Ipsos MORI Terms and Conditions which can be found at http://www.ipsos-mori.com/terms. © Department for Culture, Media & Sport 2017
▪ One investment business felt they had an outsourced business model, where they wanted to
maintain as few core staff as possible, so did not have the budget or office space to carry out cyber
security in-house.
▪ One large legal services business noted that their UK office operated on office hours, but because
they had several international clients, they needed 24-hour cyber security. In this context,
outsourcing was the solution.
▪ Some firms carried out as much of their IT function as they could in-house, but still needed to use
specialist IT consultants for specific issues. For example, one wholesaler contracted specialists to
look specifically at their server security (for instance, to recommend hardware firewalls).
Case study: understanding outsourced provider contracts
The compliance lead at a small investment firm used external IT consultants and lawyers to review
contracts with outsourced providers, so they had a clear understanding of the jargon and legalese.
However, they would have preferred not to use external consultants for this, partly because it had
been challenging to find good IT consultants – they had asked contacts in the compliance sector
and looked at the suppliers that the FCA had approved to carry out software audits. They would
welcome written guidance to help them review these contracts independently to understand what
level of security providers are offering. They also wanted guidance to help them know what
questions to ask providers, how the board should assess contracts, and best practice around
frequency of communication with providers and frequency of penetration testing. This would save
on costs and also give them a better sense of reassurance in their providers.
Staff training
Similar to the 2016 finding, a fifth (20%) of businesses have had staff attend internal or external training
on cyber security in the last 12 months, and this was much more common within medium and large
firms, shown in Figure 4.6. This breaks down as 13 per cent of all businesses providing training internal to
the organisation, six per cent providing external training, and eight per cent where staff attended related
seminars or conferences.
Cyber security training is, as might be expected, more prevalent within the sectors that tend to prioritise
cyber security more than others. It is least likely to be seen in the transport or storage (13%), food or
hospitality (11%), and construction sectors (10%).
Of all businesses, five per cent (22% among large businesses) include this training as part of an induction
process, and 11 per cent (41% among large businesses) offer it as a regular training activity, unchanged
from the 2016 results.17
17 While “training” was self-defined by respondents at this question, it is most likely in the wording of the question to be off-the-job training that
staff attend away from their day-to-day work.
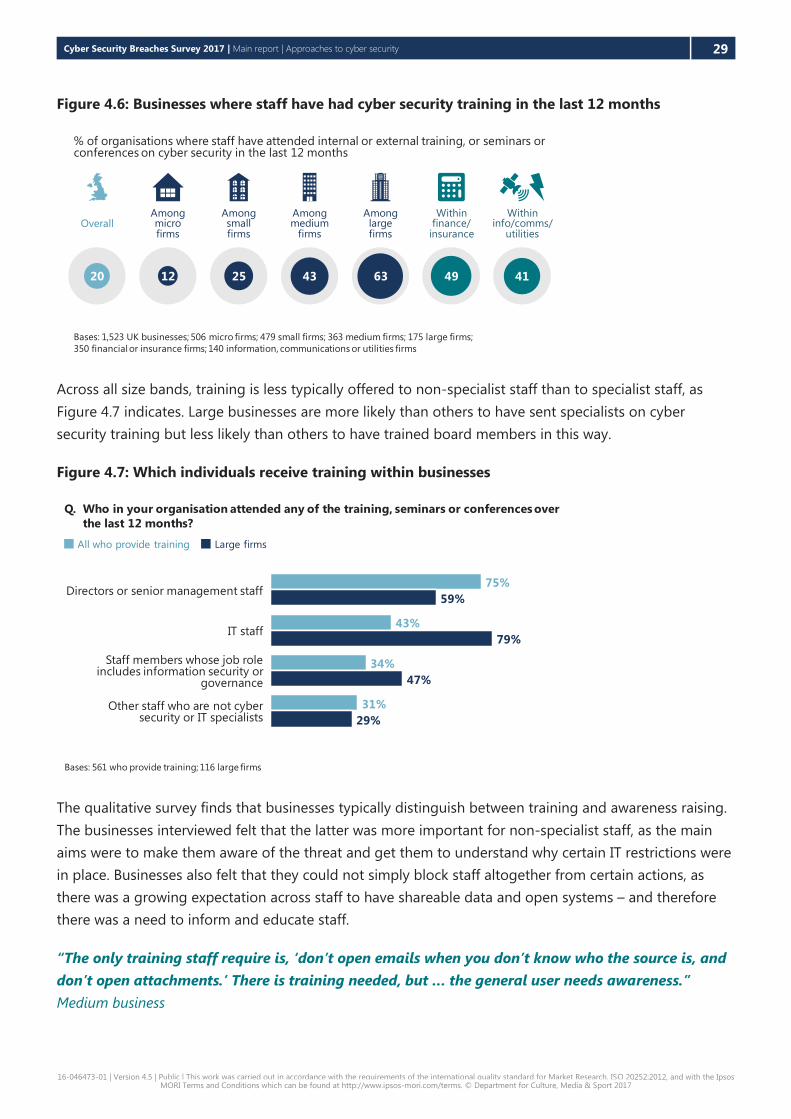
Cyber Security Breaches Survey 2017 | Main report | Approaches to cyber security 29
16-046473-01 | Version 4.5 | Public | This work was carried out in accordance with the requirements of the international quality standard for Market Research, ISO 20252:2012, and with the Ipsos MORI Terms and Conditions which can be found at http://www.ipsos-mori.com/terms. © Department for Culture, Media & Sport 2017
Figure 4.6: Businesses where staff have had cyber security training in the last 12 months
Across all size bands, training is less typically offered to non-specialist staff than to specialist staff, as
Figure 4.7 indicates. Large businesses are more likely than others to have sent specialists on cyber
security training but less likely than others to have trained board members in this way.
Figure 4.7: Which individuals receive training within businesses
The qualitative survey finds that businesses typically distinguish between training and awareness raising.
The businesses interviewed felt that the latter was more important for non-specialist staff, as the main
aims were to make them aware of the threat and get them to understand why certain IT restrictions were
in place. Businesses also felt that they could not simply block staff altogether from certain actions, as
there was a growing expectation across staff to have shareable data and open systems – and therefore
there was a need to inform and educate staff.
“The only training staff require is, ‘don’t open emails when you don’t know who the source is, and
don’t open attachments.’ There is training needed, but … the general user needs awareness.”
Medium business
Bases: 1,523 UK businesses; 506 micro firms; 479 small firms; 363 medium firms; 175 large firms;
350 financial or insurance firms; 140 information, communications or utilities firms
% of organisations where staff have attended internal or external training, or seminars or conferences on cyber security in the last 12 months
Among large firms
6320
Overall
49
Withinfinance/
insurance
Among medium
firms
43
Among micro firms
12
Among small firms
25 41
Withininfo/comms/
utilities
Bases: 561 who provide training; 116 large firms
Q. Who in your organisation attended any of the training, seminars or conferences over
the last 12 months?
75%
43%
34%
31%
59%
79%
47%
29%
All who provide training Large firms
Directors or senior management staff
IT staff
Staff members whose job role includes information security or
governance
Other staff who are not cyber security or IT specialists

Cyber Security Breaches Survey 2017 | Main report | Approaches to cyber security 30
16-046473-01 | Version 4.5 | Public | This work was carried out in accordance with the requirements of the international quality standard for Market Research, ISO 20252:2012, and with the Ipsos MORI Terms and Conditions which can be found at http://www.ipsos-mori.com/terms. © Department for Culture, Media & Sport 2017
This focus on awareness raising above training also reflected the perception that the external training
available was often high-end technical training. One small business felt that there was also a lack of mid-
level training available. This was training that was not too basic, as their staff were already aware of the
issue, but also not aimed at large businesses, involving for example large drills or exercises. They wanted
training that would specifically tell their core staff about the latest phishing scams to be aware of.
Some businesses felt they carried out awareness raising informally, such as by sharing scam emails that
staff came across, and that this was enough to keep staff informed. There was also a sense among some
businesses that appropriate responses to cyber threats were all common sense, in terms of not reading
unrecognised emails, so staff did not need any formal sessions to cover this. On the flipside, the IT
director in one medium law firm had insisted on, and agreed, mandatory “lunch and learn” sessions for
all staff to raise awareness of cyber security, on the basis that it would just take a single employee to
cause a potentially substantive breach.
4.4 Governance and planning
Board responsibilities
Across all size bands, most firms have not made specific board members responsible for cyber security,
as Figure 4.8 shows. This kind of board-level responsibility is more common than average among finance
or insurance, information, communications or utilities, and professional, scientific or technical services
firms – all sectors where the board tends to treat cyber security as a higher priority than average. It may
be that assigning responsibility in this way to board members encourages a stronger senior management
focus on cyber security.
Figure 4.8: Whether businesses have board members with responsibility for cyber security
Formal policies and documentation
In line with last year, only around a third of firms have a formal policy on cyber security (33%) or have
cyber security risks documented in business continuity plans, internal audits or risk registers (32%) – this
is shown in Figure 4.9. Micro businesses are, however, more likely now than in 2016 to have formal cyber
security policies in place (up from 15% to 24%) – this aligns with the increasing importance these smaller
businesses now attach to cyber security, as evidenced in section 3.3.
Bases: 1,523 UK businesses; 506 micro firms; 479 small firms; 363 medium firms; 175 large firms; 140 information,
communications or utilities firms; 126 professional, scientific or technical services firms; 350 financial or insurance firms
% of businesses where there are board members with responsibility for cyber security
Among large firms
40
Among medium
firms
42
Among micro firms
27
Among small firms
3029
OverallWithin
info/comms/utilities
39
Withinprof/sci/technical
38
Withinfinance/
insurance
54
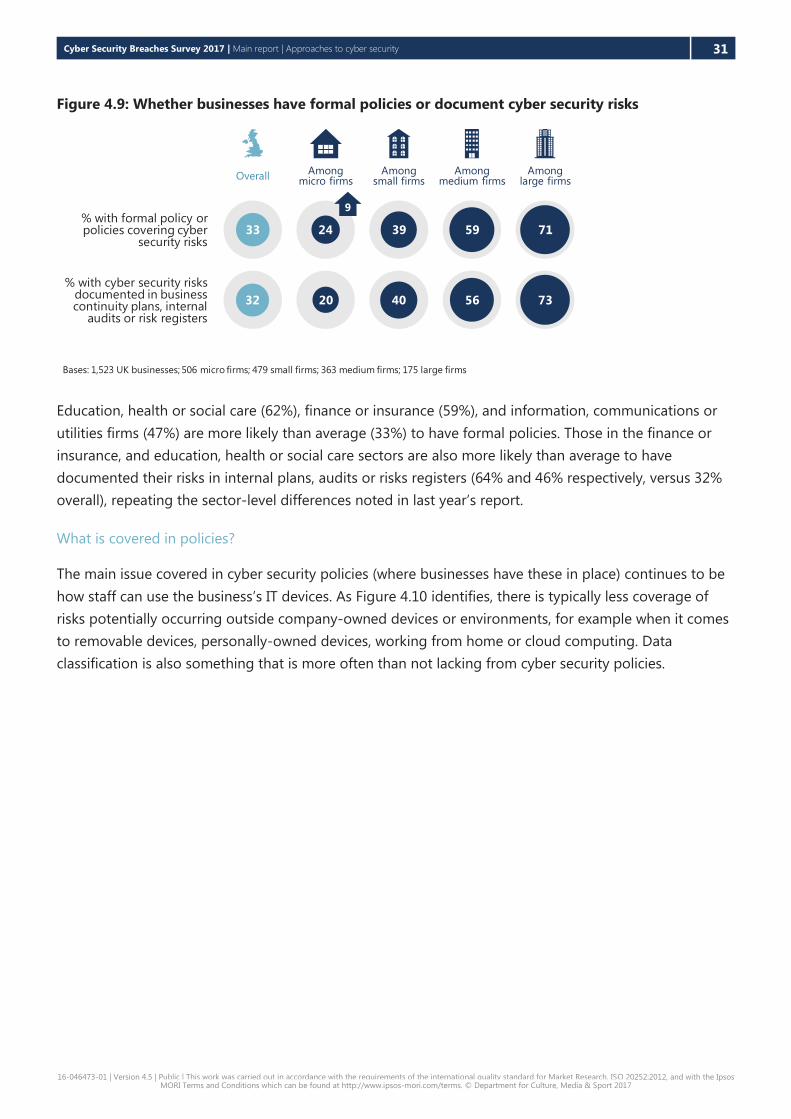
Cyber Security Breaches Survey 2017 | Main report | Approaches to cyber security 31
16-046473-01 | Version 4.5 | Public | This work was carried out in accordance with the requirements of the international quality standard for Market Research, ISO 20252:2012, and with the Ipsos MORI Terms and Conditions which can be found at http://www.ipsos-mori.com/terms. © Department for Culture, Media & Sport 2017
Figure 4.9: Whether businesses have formal policies or document cyber security risks
Education, health or social care (62%), finance or insurance (59%), and information, communications or
utilities firms (47%) are more likely than average (33%) to have formal policies. Those in the finance or
insurance, and education, health or social care sectors are also more likely than average to have
documented their risks in internal plans, audits or risks registers (64% and 46% respectively, versus 32%
overall), repeating the sector-level differences noted in last year’s report.
What is covered in policies?
The main issue covered in cyber security policies (where businesses have these in place) continues to be
how staff can use the business’s IT devices. As Figure 4.10 identifies, there is typically less coverage of
risks potentially occurring outside company-owned devices or environments, for example when it comes
to removable devices, personally-owned devices, working from home or cloud computing. Data
classification is also something that is more often than not lacking from cyber security policies.
Bases: 1,523 UK businesses; 506 micro firms; 479 small firms; 363 medium firms; 175 large firms
% with formal policy or policies covering cyber
security risks
% with cyber security risks documented in business continuity plans, internal
audits or risk registers
73
Among large firms
71
56
Among medium firms
59
Among micro firms
20
24
Among small firms
40
3933
Overall
32
9

Cyber Security Breaches Survey 2017 | Main report | Approaches to cyber security 32
16-046473-01 | Version 4.5 | Public | This work was carried out in accordance with the requirements of the international quality standard for Market Research, ISO 20252:2012, and with the Ipsos MORI Terms and Conditions which can be found at http://www.ipsos-mori.com/terms. © Department for Culture, Media & Sport 2017
Figure 4.10: Most common features of cyber security policies
Reasons for not having governance procedures in place
Businesses in the survey that had none of the governance procedures discussed in this section18 were
asked why they did not have these things in place. Those who have no such governance or planning tend
to be smaller businesses (65% are micro businesses and 34% are small businesses), so unsurprisingly
their main (unprompted) reason across businesses of all sizes is that they perceive themselves to be too
small or insignificant to have such things in place (38%). The next most common reasons are that cyber
security is not their priority (20%) and that they do not consider themselves to be at risk (18%).
Despite this, it is worth noting that 24 per cent of the smaller businesses lacking any of these governance
procedures have had a cyber security breach or attack within the last year. More specifically, 13 per cent
have had a breach or attack that had some sort of disruptive outcome on their businesses. This highlights
for all micro and small businesses that, in reality, no business is too small or insignificant to be at risk
from cyber attacks.
4.5 Risk management
Actions taken to identify risks
Almost three-fifths (57%) of all businesses say they have taken some form of action to identify cyber risks
to their organisation. As Figure 4.11 illustrates, this represents an increase in actions taken since 2016 (up
from 51%). This improvement is mainly among micro and small organisations (up from 50% to 57% when
combined together).
18 These are businesses that have no board-level cyber security responsibilities, no formal cyber security policies, no business continuity plans, no
specialist information security or governance staff, and do not use outsourced cyber security providers.
Bases: 764 with cyber security policies; 131 large firms
Q. Which of the following, if any, are covered within your cyber security-related policies?
83%
70%
68%
67%
62%
56%
41%
92%
89%
65%
64%
67%
67%
58%
What staff are permitted to do on organisation’s IT devices
What can be stored on removable devices (e.g. USB sticks)
Remote or mobile working
Document management system
Use of personally-owned devices for business activities
Use of new digital technologies such as cloud computing
Data classification
Overall Large firms
13

Cyber Security Breaches Survey 2017 | Main report | Approaches to cyber security 33
16-046473-01 | Version 4.5 | Public | This work was carried out in accordance with the requirements of the international quality standard for Market Research, ISO 20252:2012, and with the Ipsos MORI Terms and Conditions which can be found at http://www.ipsos-mori.com/terms. © Department for Culture, Media & Sport 2017
However, it is worth noting that among large businesses there is in fact less being done to identify risks
than last year (down from 94% to 86%). Among medium businesses, fewer are doing business-as-usual
health checks than in 2016 (down from 56% to 47%).
Investing in threat intelligence remains especially uncommon. This proportion rises to 19% among
medium firms and 29% among large firms (versus 7% overall). Even among very high turnover
businesses, the proportion investing in threat intelligence is no different from the average (9% among
businesses with annual sales of £10 million and over).
Figure 4.11: Ways in which businesses have identified cyber security risks in the last 12 months
Taking any action in this regard tends to be more common among finance or insurance (76%),
professional, scientific or technical services (75%), information, communications or utilities (69%) and
education, health or social care firms (68%).
Actions taken to prevent or minimise risks
As Figure 4.12 shows, the overwhelming majority of businesses across all size bands continue to have
certain cyber security rules or controls in place. Nine in ten regularly update their software and malware
protections, have configured firewalls, or securely back up their data. Moreover, more businesses now
say they keep their malware protection updated (90%, vs. 83% in 2016) – an improvement largely driven
by micro and small firms.
Once again, the majority of organisations also have rules restricting IT access or interactions, restricting
access to company-owned devices, and the placing of security controls on devices. Large organisations
remain much further ahead in terms of offering guidance on passwords, and implementing controls
around wireless networks, user monitoring and personal data encryption.
Rules and controls around encryption continue to be far more atypical across all businesses, including
those for whom such rules may be especially important. For example, businesses that hold personal
Bases: 1,523 UK businesses; 506 micro firms; 479 small firms; 363 medium firms; 175 large firms
CHART 7
Q. Which of the following, if any, have you done over the last 12 months to identify
cyber security risks to your organisation?
Business-as-usual health checks that are undertaken regularly
Risk assessment covering cyber security risks
Internal audit
Ad-hoc health checks or reviews beyond regular processes
Invested in threat intelligence
Any of the listed activities 57%
34%
28%
26%
25%
7%
Overall
Micro firms
Smallfirms
Mediumfirms
Largefirms
57
47
65
77
86
% any
6
8

Cyber Security Breaches Survey 2017 | Main report | Approaches to cyber security 34
16-046473-01 | Version 4.5 | Public | This work was carried out in accordance with the requirements of the international quality standard for Market Research, ISO 20252:2012, and with the Ipsos MORI Terms and Conditions which can be found at http://www.ipsos-mori.com/terms. © Department for Culture, Media & Sport 2017
information on customers are more likely than average to have such rules, but over half (55%) do not.
Tightening encryption is therefore still a potential area for improvement for many businesses, and firms
can consult the Information Commissioner’s Office guidance on this topic.19
Rules around BYOD still appear challenging for businesses to enforce. While three-fifths (62%) of
businesses aim to restrict access to company-owned devices, it is again noteworthy that four in ten (39%)
of these businesses still have staff who use personal devices for regular business activities.
Figure 4.12: Rules or controls that businesses have implemented
As per last year, food or hospitality firms tend to lag behind even in terms of the more basic rules and
controls. They are again less likely than average to apply software updates when available (79%, versus
92% overall), have updated malware protection (76% versus 90%) or have firewalls with appropriate
configurations (81% versus 89%). They are more likely to have segregated wireless networks (49% versus
37%), possibly reflecting the particular prevalence of guest WiFi in restaurants and hotels, and the risks
associated with this – although even here, half do not have such controls.
Construction sector firms also fall behind in certain areas, being less likely than average to restrict IT
access to certain individuals (64%, versus 79% overall), or monitor user activity (29% versus 42%).
4.6 Dealing with third-party suppliers or contractors
Figure 4.13 shows that a fifth of businesses are worried about the cyber security risk emanating from
their suppliers, and that this is even more of a concern among medium and large businesses. Among the
latter, more are worried than not worried about this.
19 See https://ico.org.uk/for-organisations/encryption/.
Bases: 1,523 UK businesses; 175 large firms
*New answer options not present in last year’s survey
Q. Which of the following rules or controls, if any, do you have in place?
92%
90%
89%
89%
79%
69%
63%
62%
42%
37%
37%
92%
96%
95%
95%
96%
91%
90%
69%
80%
73%
61%
Applying software updates when they are available
Firewalls with appropriate configuration
Up-to-date malware protection
Restricting IT admin and access rights to specific users
Only allowing access via company-owned devices
Security controls on company-owned devices (e.g. laptops)
Segregated wireless network
Overall Large firms
Monitoring of user activity
Encrypting personal data
Guidance on acceptably strong passwords*
Backing up data securely*
7
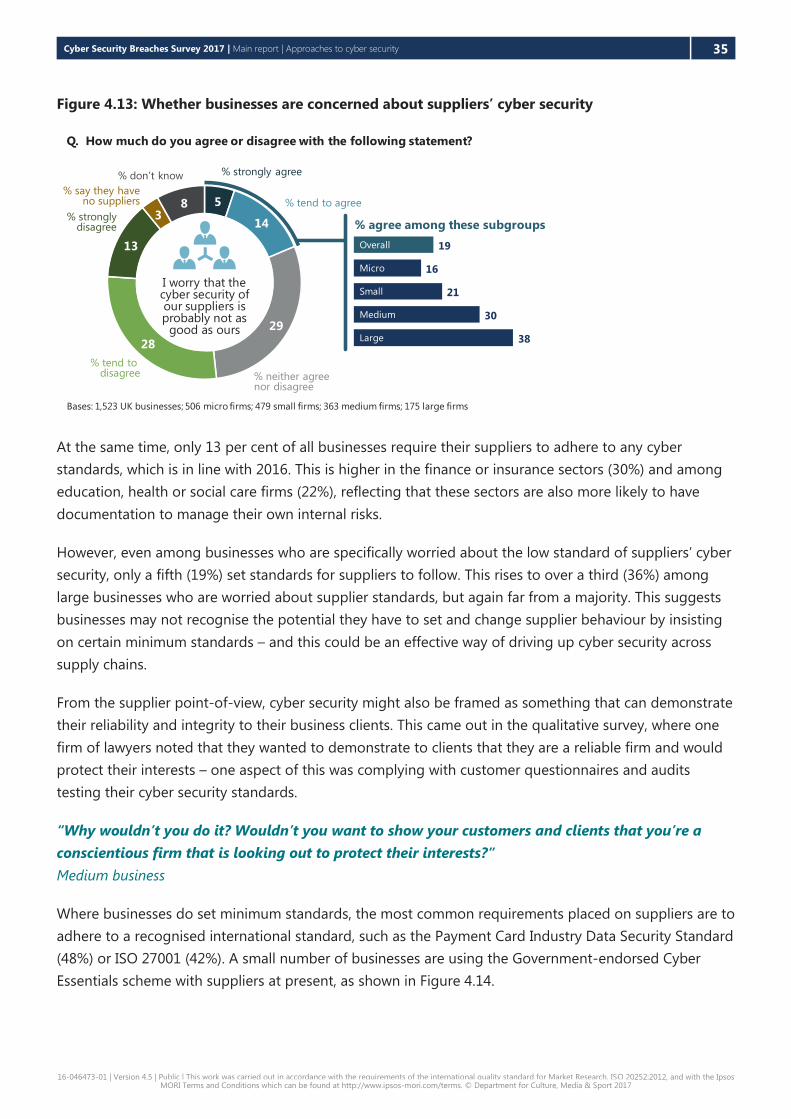
Cyber Security Breaches Survey 2017 | Main report | Approaches to cyber security 35
16-046473-01 | Version 4.5 | Public | This work was carried out in accordance with the requirements of the international quality standard for Market Research, ISO 20252:2012, and with the Ipsos MORI Terms and Conditions which can be found at http://www.ipsos-mori.com/terms. © Department for Culture, Media & Sport 2017
Figure 4.13: Whether businesses are concerned about suppliers’ cyber security
At the same time, only 13 per cent of all businesses require their suppliers to adhere to any cyber
standards, which is in line with 2016. This is higher in the finance or insurance sectors (30%) and among
education, health or social care firms (22%), reflecting that these sectors are also more likely to have
documentation to manage their own internal risks.
However, even among businesses who are specifically worried about the low standard of suppliers’ cyber
security, only a fifth (19%) set standards for suppliers to follow. This rises to over a third (36%) among
large businesses who are worried about supplier standards, but again far from a majority. This suggests
businesses may not recognise the potential they have to set and change supplier behaviour by insisting
on certain minimum standards – and this could be an effective way of driving up cyber security across
supply chains.
From the supplier point-of-view, cyber security might also be framed as something that can demonstrate
their reliability and integrity to their business clients. This came out in the qualitative survey, where one
firm of lawyers noted that they wanted to demonstrate to clients that they are a reliable firm and would
protect their interests – one aspect of this was complying with customer questionnaires and audits
testing their cyber security standards.
“Why wouldn’t you do it? Wouldn’t you want to show your customers and clients that you’re a
conscientious firm that is looking out to protect their interests?”
Medium business
Where businesses do set minimum standards, the most common requirements placed on suppliers are to
adhere to a recognised international standard, such as the Payment Card Industry Data Security Standard
(48%) or ISO 27001 (42%). A small number of businesses are using the Government-endorsed Cyber
Essentials scheme with suppliers at present, as shown in Figure 4.14.
Bases: 1,523 UK businesses; 506 micro firms; 479 small firms; 363 medium firms; 175 large firms
Q. How much do you agree or disagree with the following statement?
5
14
29
28
13
38
% tend to disagree
% don’t know
I worry that the cyber security of our suppliers is probably not as
good as ours
% tend to agree
% neither agree nor disagree
% strongly agree
% stronglydisagree % agree among these subgroups
19
16
21
30
38
Small
Medium
Overall
Micro
Large
% say they haveno suppliers

Cyber Security Breaches Survey 2017 | Main report | Approaches to cyber security 36
16-046473-01 | Version 4.5 | Public | This work was carried out in accordance with the requirements of the international quality standard for Market Research, ISO 20252:2012, and with the Ipsos MORI Terms and Conditions which can be found at http://www.ipsos-mori.com/terms. © Department for Culture, Media & Sport 2017
Figure 4.14: Most commonly required cyber security standards for suppliers
4.7 Implementing Government initiatives
Cyber Essentials
The Government-endorsed Cyber Essentials scheme enables businesses to be independently certified for
having met a good-practice standard in their cyber security. It requires businesses to enact basic
technical controls across five areas: boundary firewalls and internet gateways, secure configurations, user
access controls, malware protection, and patch management. The survey findings show that half of all
firms (52%), including the vast majority of medium (76%) and large firms (80%), already say they have
controls in these areas, unchanged from last year.
As per last year, most – particularly smaller businesses – may not currently realise they can be certified
for this.20 Only three per cent of all businesses recognise having implemented the Cyber Essentials
standard across their business. The proportions who recognise this have risen since 2016 among medium
(up 4% to 9%) and large businesses (up 10% to 19%), although this is still far lower than the proportion
of these businesses who would actually meet the standard anyway. Smaller businesses should note the
scheme is relevant for businesses of all sizes.
Information, communications or utility firms are also somewhat more likely to recognise having adopted
this standard (10%, versus 3% overall), repeating the same sector-level difference from last year.
10 Steps to Cyber Security
The Government’s 10 Steps guidance21 is intended to outline the practical steps that organisations can
take to improve their cyber security. These steps have been mapped to specific questions in the survey,
20 In the survey, the answers taken to indicate these controls are: firewalls with appropriate configuration, security controls on company-owned
devices, restricting IT admin and access rights to specific users, up-to-date malware protection, and applying software updates when they are
available.
21 The 10 Steps areas are fully explained on the National Cyber Security Website, at: https://www.ncsc.gov.uk/guidance/10-steps-cyber-security.
48%
42%
19%
6%
2%
Base: 313 with supplier standards
Q. Which of the following, if any, do you require your suppliers to have or adhere to?
Payment Card Industry Data Security Standard (PCI DSS)
Recognised standard such as ISO 27001
Independent service auditor’s report (e.g. ISAE 3402)
Cyber Essentials
Cyber Essentials Plus

Cyber Security Breaches Survey 2017 | Main report | Approaches to cyber security 37
16-046473-01 | Version 4.5 | Public | This work was carried out in accordance with the requirements of the international quality standard for Market Research, ISO 20252:2012, and with the Ipsos MORI Terms and Conditions which can be found at http://www.ipsos-mori.com/terms. © Department for Culture, Media & Sport 2017
and these are covered individually across this report. Table 4.2 brings them together and again shows a
situation very similar to the 2016 findings. While most businesses have certain technical controls, fewer
have taken a more sophisticated approach in terms of senior-level risk management, user education and
incident management.
Table 4.2: Proportion of businesses undertaking action in each of the 10 Steps areas
Step description – and how derived from the survey in italics %
1 Information risk management regime – formal cyber security policies or other
documentation and the board are kept updated on actions taken 39%
2 Secure configuration – organisation applies software updates when they are available 92%
3 Network security – firewalls with appropriate configuration 89%
4 Managing user privileges – restricting IT admin and access rights to specific users 79%
5 User education and awareness – staff training at induction or on a regular basis, or formal
policy covers what staff are permitted to do on the organisation’s IT devices 30%
6 Incident management – formal incident management plan in place 11%
7 Malware protection – up-to-date malware protection in place 90%
8 Monitoring – monitoring of user activity or regular health checks to identify cyber risks 56%
9 Removable media controls – policy covers what can be stored on removable devices 22%
10 Home and mobile working – policy covers remote or mobile working 23%
As Figure 4.15 highlights, three-fifths (58%) of all businesses have undertaken action on five or more of
the 10 Steps, which represents an improvement since 2016 (when it was 51%). However, very few have
made progress on all the steps.
Figure 4.15: Progress in undertaking action on the 10 Steps by size of business
Bases: 1,523 UK businesses; 506 micro firms; 479 small firms; 363 medium firms; 175 large firms
% that have undertaken action on five or more of
the 10 Steps
% that haveundertaken action on
all of the 10 Steps22
Among large firms
94
16
Among medium firms
83
Among micro firms
4
45
Among small firms
6
6858
Overall
5
77
Cyber Security Breaches Survey 2017 | Main report | Approaches to cyber security 38
16-046473-01 | Version 4.5 | Public | This work was carried out in accordance with the requirements of the international quality standard for Market Research, ISO 20252:2012, and with the Ipsos MORI Terms and Conditions which can be found at http://www.ipsos-mori.com/terms. © Department for Culture, Media & Sport 2017
ISO 27001 accreditation
Implementation of the international standard for Information Security Management, ISO 27001, is also
relatively uncommon. Among the 21 per cent of firms who are aware of this standard, three in ten (31%)
have implemented it and a further fifth (20%) are intending to do so in the future. This is consistent
across size bands. Across all businesses (i.e. not just those who are aware of the standard), this equates to
seven per cent having implemented ISO 27001 and four per cent intending to do so.
Businesses in the education, health or social care sectors (20%) and the finance or insurance sectors
(12%) are more likely than average (7%) to have implemented ISO 27001.

Cyber Security Breaches Survey 2017 | Main report | Incidence and impact of breaches 39
16-046473-01 | Version 4.5 | Public | This work was carried out in accordance with the requirements of the international quality standard for Market Research, ISO 20252:2012, and with the Ipsos MORI Terms and Conditions which can be found at http://www.ipsos-mori.com/terms. © Department for Culture, Media & Sport 2017
5 Incidence and impact of breaches
This chapter provides measures of the nature, level, outcomes and impact of breaches incurred by
businesses, including estimates of the total economic cost from breaches. The survey aims to account for
all types of breaches that a firm might face (although it can only, of course, measure the breaches that
have been identified), and also drills down into the most disruptive breaches, and the cost of these.
5.1 Experience of breaches
As can be seen in Figure 5.1 just under half (46%) of all businesses have identified at least one cyber
security breach or attack in the last 12 months. While direct comparisons with the 2016 survey cannot be
made here22, the pattern is similar in that as firm size increases, so too does the incidence of breaches.
This is the same pattern when looking at turnover as well as number of employees – businesses with a
turnover of £2 million or more are more likely than others to identify breaches (65%).
Breaches are also more commonly identified in certain sectors – namely information, communications or
utilities (62%), administration or real estate (62%) and professional, scientific or technical services (60%).
Figure 5.1: Proportion of businesses that have identified breaches in the last 12 months
Businesses that hold electronic personal data on their customers are more likely to have had breaches
than those that do not (51% compared with 37%).
Nonetheless, breaches are still common even among businesses who do not consider cyber security to
be a priority, or who may not think they are exposed to risk. This highlights that there are firms who may
mistakenly think that cyber security is not relevant to them, but are also susceptible to breaches.
22 This latest survey changed the types of breaches asked about in the survey, adding new answer options such as ransomware, and amending
previous answer codes to be more specific in some cases. This change means that the results around incidence of breaches, and most of the
results covered in this chapter, are no longer directly comparable to the 2016 survey – differences may be due to changes in wording rather than
being real changes over time.
Bases: 1,523 UK businesses; 506 micro firms; 479 small firms; 363 medium firms; 175 large firms;
140 information, communications or utilities firms; 96 administration or real estate firms; 126 professional, scientific or technical service firms
% experiencing a cyber security breach or attack in last 12 months
Among large firms
Among medium
firms
Among micro firms
Among small firms
OverallWithin
info/comms/utilities
Withinadmin/
real estate
Withinprof/sci/technical
686638 5246 62 6062

Cyber Security Breaches Survey 2017 | Main report | Incidence and impact of breaches 40
16-046473-01 | Version 4.5 | Public | This work was carried out in accordance with the requirements of the international quality standard for Market Research, ISO 20252:2012, and with the Ipsos MORI Terms and Conditions which can be found at http://www.ipsos-mori.com/terms. © Department for Culture, Media & Sport 2017
▪ Around a third (35%) of those that say cyber security is a low priority for their senior managers
have suffered a breach in the last year. Even when looking at those who say cyber security is a very
low priority to senior management, two in ten (19%) have identified a breach.
▪ Among those who say online services are not at all core to their businesses, four in ten (41%) have
detected a breach in the last year.
Case study: assuming your industry is immune from cyber attacks
One large materials supplier for the construction industry faced significant and ongoing cyber
attacks, despite not having any e-commerce activities. This included over 3,000 phishing emails a
month and various ransomware attacks. Despite this, no one in the business had been responsible
for cyber security before their Chief Data Officer joined the business three years ago.
Their most disruptive ransomware attack caused their technology team to lose around two weeks of
productivity and output. The construction industry as a whole was felt to be behind in terms of
cyber security due to most trade and day-to-day business being offline. The ransomware attack
opened their eyes to the fact that their business was not immune from cyber attacks. They had
since then set up a data security roundtable (involving their major suppliers), started reviewing their
cyber security policies and made cyber security one of the top 10 business priorities.
There is also a higher incidence of breaches among those taking action to protect themselves. This
includes firms that have provided any cyber security training to staff (62% have had breaches, versus 46%
overall), firms with any form of governance or risk management arrangements in place (54%), and firms
that have invested in cyber security (54%).
This could of course simply indicate that these firms are better at identifying when they have been
breached. It might also suggest firms are putting in place more rules and controls, or spending more in
reaction to breaches. Finally, it may be an indicator that the firms who are at most risk of breaches tend
to recognise this and take precautions.
Types of breaches experienced
By far the most common type of breach experienced is staff receiving fraudulent emails (72%). This is
followed by viruses, spyware and malware (33%), people impersonating the organisation in emails or
online (27%) and ransomware (17%). The same pattern emerges when considering the single most
disruptive breach, most commonly likely to be phishing emails or websites, as shown in Figure 5.2.
The four most common types of breach can be linked to human factors, such as unwittingly clicking on a
malicious link or succumbing to impersonation. This highlights how staff awareness and vigilance are
typically important to a business’s cyber security, alongside any technical and software protections.
Breaches that rely on technical factors beyond the reach of non-specialist staff, such as denial-of-service
attacks (attacks that attempt to take down business websites) are relatively less common.

Cyber Security Breaches Survey 2017 | Main report | Incidence and impact of breaches 41
16-046473-01 | Version 4.5 | Public | This work was carried out in accordance with the requirements of the international quality standard for Market Research, ISO 20252:2012, and with the Ipsos MORI Terms and Conditions which can be found at http://www.ipsos-mori.com/terms. © Department for Culture, Media & Sport 2017
Figure 5.2: Types of breaches suffered among those who have identified breaches
5.2 How are businesses affected?
Frequency and number of breaches
Across all businesses that have experienced breaches or attacks in the last 12 months, for over a third
(37%) this was a one-off occurrence. By contrast, a similar proportion experience them regularly (37% at
least once a month, including 13% at least once a day). Large businesses are more likely to be struck
more often – only two in ten (18%) have had a one-off breach in the last year. However, it is also clear
that regular breaches of once a month or more are also experienced by many smaller businesses.
Base: 781 that identified a breach or attack in the last 12 months
Q. Which of the following have happened to your organisation in the last 12 months?
72%
33%
27%
17%
10%
9%
8%
6%
5%
43%
20%
12%
8%
3%
5%
4%
3%
1%
Fraudulent emails or being directed to fraudulent websites
Viruses, spyware or malware
Others impersonating organisation in emails or online
Ransomware
Unauthorised use of computers, networks or servers by outsiders
Hacking or attempted hacking of online bank accounts
Denial-of-service attacks
Unauthorised use of computers, networks or servers by staff
Any other breaches or attacks
Any breach or attack Single breach or attack that cause most disruption to the business

Cyber Security Breaches Survey 2017 | Main report | Incidence and impact of breaches 42
16-046473-01 | Version 4.5 | Public | This work was carried out in accordance with the requirements of the international quality standard for Market Research, ISO 20252:2012, and with the Ipsos MORI Terms and Conditions which can be found at http://www.ipsos-mori.com/terms. © Department for Culture, Media & Sport 2017
Figure 5.3: Frequency of breaches experienced in the last 12 months
Table 5.1 shows that the mean number23 of breaches or attacks is substantially higher than the median
number. What this indicates is that the typical business is likely to only experience a handful of breaches
in the space of a year, but that a minority experience hundreds of breaches or attacks in this timeframe.
Of course, a very small number of businesses are experiencing considerably more, indicating hundreds or
even thousands of breaches per week. One large wholesale business, interviewed as part of the
qualitative survey, reported receiving approximately 340,000 phishing emails in 2016.
Table 5.1: Average number of breaches among those that identified any breaches in last 12
months
All businesses Micro/small24 Medium Large
Mean number 998 891 2,258 7,997
Median number 2 2 4 8
Base 757 414 230 113
Outcomes of breaches
Four in ten businesses (41%) who experienced at least one breach in the last 12 months report an
outcome. To put this another way, one in five of all UK businesses (19%) say they have experienced a
breach resulting in some sort of material loss, as highlighted in Figure 5.4.
The most common outcomes are a temporary loss of access to files or networks (23%), and software or
systems becoming corrupt or damaged (20%).
23 It should be noted that the mean results here are driven up by a very small number of respondents across all size bands reporting an
extremely high number of breaches in the past year (in the thousands). The median figures are therefore also shown to give a sense of what the
typical business is likely to face.
24 Data from micro and small firms have been combined to align with the similar analysis on spending data in Chapter 4.
Bases: 781 that identified a breach or attack in the last 12 months; 120 large firms
Q. Approximately how often in the last 12 months did you experience cyber security
breaches or attacks?
% only once % less than once a month % once a month % once a week
37
18
25
41
15
22
9
10
6
4
7
3
1
3
% once a day % several times a day % don’t know
All UK businesses
Large firms
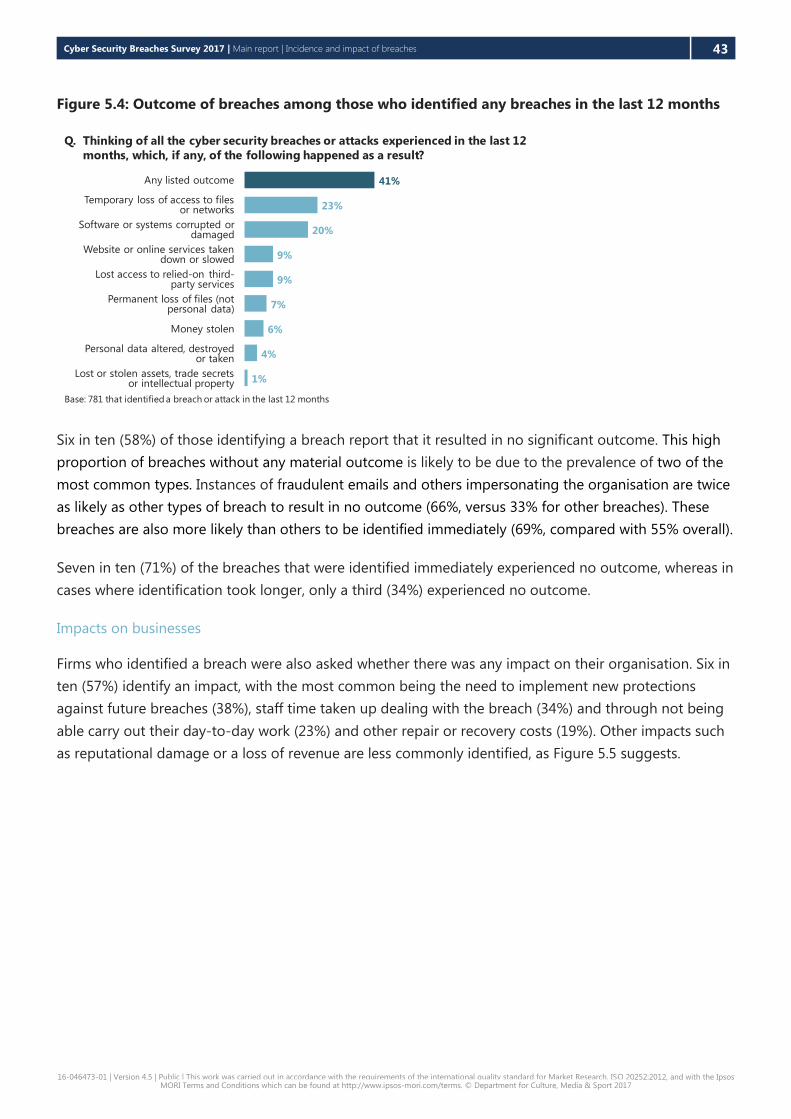
Cyber Security Breaches Survey 2017 | Main report | Incidence and impact of breaches 43
16-046473-01 | Version 4.5 | Public | This work was carried out in accordance with the requirements of the international quality standard for Market Research, ISO 20252:2012, and with the Ipsos MORI Terms and Conditions which can be found at http://www.ipsos-mori.com/terms. © Department for Culture, Media & Sport 2017
Figure 5.4: Outcome of breaches among those who identified any breaches in the last 12 months
Six in ten (58%) of those identifying a breach report that it resulted in no significant outcome. This high
proportion of breaches without any material outcome is likely to be due to the prevalence of two of the
most common types. Instances of fraudulent emails and others impersonating the organisation are twice
as likely as other types of breach to result in no outcome (66%, versus 33% for other breaches). These
breaches are also more likely than others to be identified immediately (69%, compared with 55% overall).
Seven in ten (71%) of the breaches that were identified immediately experienced no outcome, whereas in
cases where identification took longer, only a third (34%) experienced no outcome.
Impacts on businesses
Firms who identified a breach were also asked whether there was any impact on their organisation. Six in
ten (57%) identify an impact, with the most common being the need to implement new protections
against future breaches (38%), staff time taken up dealing with the breach (34%) and through not being
able carry out their day-to-day work (23%) and other repair or recovery costs (19%). Other impacts such
as reputational damage or a loss of revenue are less commonly identified, as Figure 5.5 suggests.
41%
23%
20%
9%
9%
7%
6%
4%
1%
Base: 781 that identified a breach or attack in the last 12 months
Q. Thinking of all the cyber security breaches or attacks experienced in the last 12
months, which, if any, of the following happened as a result?
Any listed outcome
Temporary loss of access to files or networks
Software or systems corrupted or damaged
Website or online services taken down or slowed
Lost access to relied-on third-party services
Permanent loss of files (not personal data)
Money stolen
Personal data altered, destroyed or taken
Lost or stolen assets, trade secrets or intellectual property

Cyber Security Breaches Survey 2017 | Main report | Incidence and impact of breaches 44
16-046473-01 | Version 4.5 | Public | This work was carried out in accordance with the requirements of the international quality standard for Market Research, ISO 20252:2012, and with the Ipsos MORI Terms and Conditions which can be found at http://www.ipsos-mori.com/terms. © Department for Culture, Media & Sport 2017
Figure 5.5: Impacts of breaches among those who identified any breaches in the last 12 months
Among those who say that there was no actual outcome, a third (33%) nonetheless report an impact. In
these cases, the most common impacts are implementing measures against future breaches (20%) and
staff time dealing with the breach (17%).
The impacts experienced by a business vary by size. Medium and large firms are more likely to
experience any impact (71%, versus 57% overall). Furthermore, large firms specifically are more likely to
identify certain types of impacts such as needing to implement preventative measures (58% versus 38%),
staff being prevented from carrying out usual work (37% versus 23%) and reputational damage (9%
versus 4%).
Time taken to recover from breaches
When asked to consider the single most disruptive breach experienced in the past 12 months, many
businesses report that they recover very quickly. Just under six in ten (57%) say that it took no time at all
to restore business operations after identifying the breach. For a further quarter (23%), this took less than
a day meaning that, overall, eight in ten (81%) have been able to get back to normal in less than a day.
This pattern was broadly similar for large firms, as Figure 5.6 shows.
57%
38%
34%
23%
19%
7%
5%
5%
4%
4%
1%
*
Base: 781 that identified a breach or attack in the last 12 months
*Denotes a percentage less than one per cent but greater than zero
Q. Have the breaches or attacks experienced in the last 12 months impacted your
organisation in any of the following ways, or not?
Any listed impact
New measures needed for future attacks
Added staff time to deal with breach or inform others
Stopped staff carrying out daily work
Other repair or recovery costs
Prevented provision of goods and services
Complaints from customers
Discouraged from carrying out intended future
business activity
Reputational damage
Loss of revenue or share value
Goodwill compensation to customers
Fines or legal costs

Cyber Security Breaches Survey 2017 | Main report | Incidence and impact of breaches 45
16-046473-01 | Version 4.5 | Public | This work was carried out in accordance with the requirements of the international quality standard for Market Research, ISO 20252:2012, and with the Ipsos MORI Terms and Conditions which can be found at http://www.ipsos-mori.com/terms. © Department for Culture, Media & Sport 2017
Figure 5.6: Time taken to recover from the most disruptive breach of the last 12 months25
In terms of actual manpower, it is medium firms that take the most time on average when dealing with
breaches, as shown in Table 5.2. This may be due to facing breaches of a similar frequency and type to
large firms, while not having equal resource to deal with them as quickly.
When looking only at those breaches with a material outcome (such as loss of files, money or other
assets), the number of days taken is predictably larger. The pattern by firm size again shows that medium
firms typically use more manpower to deal with the breach.
Table 5.2: Average time dealing with the most disruptive breach of last 12 months
All businesses Micro/small Medium Large
All breaches
Mean days 1.2 1.2 2.1 1.8
Median days 0.5 0.5 0.5 0.5
Base 750 414 226 110
Breaches with an outcome
Mean days 2 1.9 3.8 2.5
Median days 0.8 0.7 1 1.2
Base 336 170 108 58
25 There were 781 businesses that had at least one breach or attack in the last 12 months. However, only 761 of these were able to say which
breach or attack was the most disruptive.
Bases: 761 that identified a breach or attack in the last 12 months; 112 large firms
Q. How long, if any time at all, did it take to restore business operations back to normal
after the (most disruptive) breach or attack was identified?
All UK businesses
Large firms
% no time at all % less than a day % less than a week % less than a month
57
51
23
34
13
13
4
2
21
1
% one month or more % don’t know

Cyber Security Breaches Survey 2017 | Main report | Incidence and impact of breaches 46
16-046473-01 | Version 4.5 | Public | This work was carried out in accordance with the requirements of the international quality standard for Market Research, ISO 20252:2012, and with the Ipsos MORI Terms and Conditions which can be found at http://www.ipsos-mori.com/terms. © Department for Culture, Media & Sport 2017
5.3 Financial cost of breaches
Assessing costs
It is very uncommon for businesses to monitor the financial cost of cyber security breaches. In line with
last year, only six per cent say that they have anything in place to monitor or estimate how much cyber
security breaches or attacks cost their organisation. While this is typically low across firms of all sizes (9%
in large firms), regular monitoring is higher in the finance and insurance sectors, although again still
unusual (11%).
Firms who have undertaken any cyber security training are also more likely than others to monitor costs
(18%, versus 6% overall).
Overall cost of breaches
Table 5.3 shows the costs businesses estimate having incurred from all the cyber security breaches they
have experienced in the past 12 months, taking into account all impacts they mentioned resulting from
these breaches (see Figure 5.6). Findings are in line with the 2016 survey, with the differences not being
statistically significant.26
As Table 5.3 shows, larger firms tend to incur much more substantial costs from all the cyber security
breaches that they experience, possibly reflecting that they may be incurring more complex or
challenging breaches, or have more sophisticated systems that are harder to repair.
The median cost of all breaches is zero, reflecting the fact that the majority of breaches have no actual
outcome. As aforementioned in this report, a single type of breach – staff receiving fraudulent emails –
makes up 43 per cent of the most disruptive breaches, and this type is more likely than others to have no
actual outcome. Considering only breaches with an outcome, again it can be seen that larger firms incur
more substantial costs.
Once again, the mean cost of breaches is substantially higher than the median cost. This highlights that
the majority of businesses do not experience breaches with significant financial consequences, but for
the minority of firms that do experience these serious breaches, the costs can be extremely high.
It is worth noting that the lack of certainty around the likely cost of any breach can make it difficult for
businesses to fully understand the return on their investment in cyber security.
26 While the absolute differences in the results between 2016 and 2017 are large, these were found to be not statistically significant at the 0.05
level (p=0.14), based on a t-test on the financial values (log transformed) by survey year. The 2016 estimates were adjusted by a factor of 1.017
to account for inflation between 2016 and 2017.

Cyber Security Breaches Survey 2017 | Main report | Incidence and impact of breaches 47
16-046473-01 | Version 4.5 | Public | This work was carried out in accordance with the requirements of the international quality standard for Market Research, ISO 20252:2012, and with the Ipsos MORI Terms and Conditions which can be found at http://www.ipsos-mori.com/terms. © Department for Culture, Media & Sport 2017
Table 5.3: Average cost of all breaches identified in the last 12 months
All businesses Micro/small Medium Large
All breaches
Mean cost £1,570 £1,380 £3,070 £19,600
Median cost £0 £0 £0 £1,470
Base 737 413 218 106
Breaches with an outcome
Mean cost £2,330 £2,070 £5,950 £13,200
Median cost £300 £300 £1,000 £8,230
Base 321 167 102 52
Costs associated with the most disruptive breaches
Tables 5.4 to 5.7 show cost estimates for the single most disruptive breach in the last 12 months. Again,
these are presented for all breaches, as well as those with an actual outcome. In this year’s survey
businesses were asked to consider separately the direct cost, the cost of recovery and the long-term cost.
Direct costs include: costs from staff being prevented from carrying out their work; lost, damaged or
stolen outputs, data, or assets; and lost revenue if customers could not access online services. For smaller
and medium businesses, direct costs make up the greater part of the total cost of their most disruptive
breach, as the following tables show.
Table 5.4: Average direct cost of the most disruptive breach from the last 12 months
All businesses Micro/small Medium Large
All breaches
Mean cost £780 £740 £1,400 £2,600
Median cost £0 £0 £0 £0
Base 722 405 216 101
Breaches with an outcome
Mean cost £1,320 £1,220 £2,880 £4,270
Median cost £150 £150 £160 £870
Base 318 166 100 52
Recovery costs include: additional staff time needed to deal with the breach or to inform customers or
stakeholders; costs to repair equipment or infrastructure; and any other associated repair costs. For large
businesses, recovery costs are the most substantive costs they face from their most disruptive breaches.
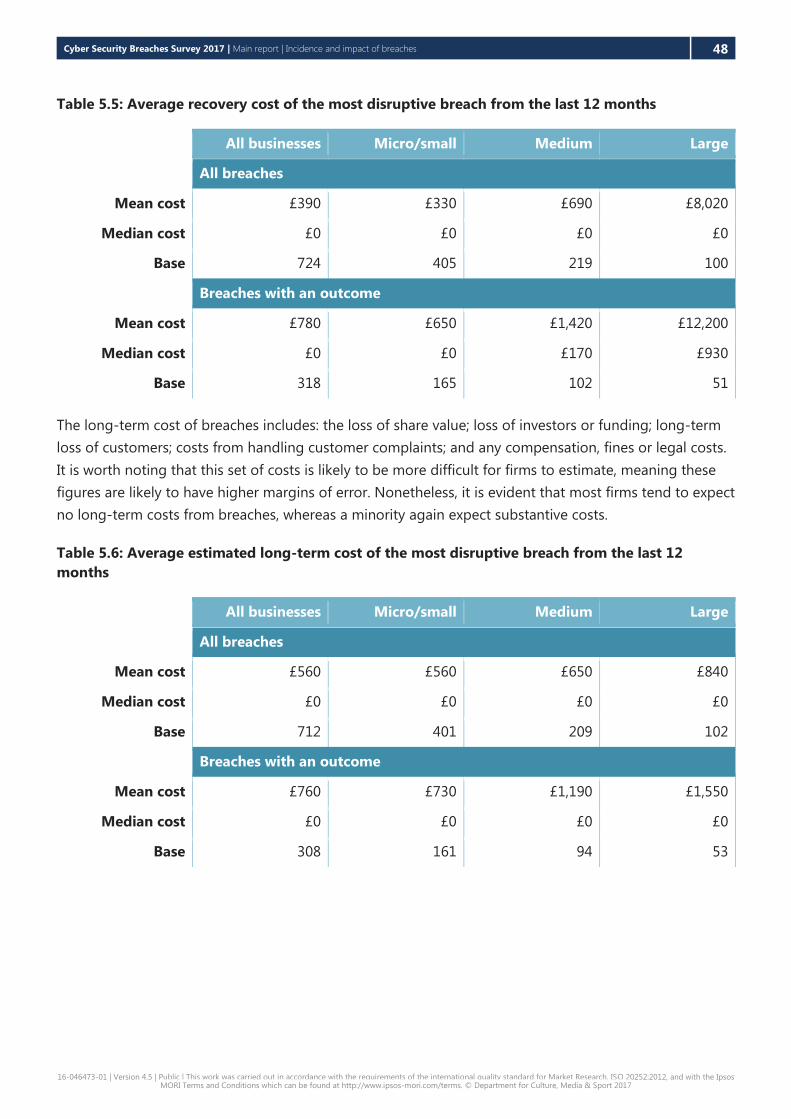
Cyber Security Breaches Survey 2017 | Main report | Incidence and impact of breaches 48
16-046473-01 | Version 4.5 | Public | This work was carried out in accordance with the requirements of the international quality standard for Market Research, ISO 20252:2012, and with the Ipsos MORI Terms and Conditions which can be found at http://www.ipsos-mori.com/terms. © Department for Culture, Media & Sport 2017
Table 5.5: Average recovery cost of the most disruptive breach from the last 12 months
All businesses Micro/small Medium Large
All breaches
Mean cost £390 £330 £690 £8,020
Median cost £0 £0 £0 £0
Base 724 405 219 100
Breaches with an outcome
Mean cost £780 £650 £1,420 £12,200
Median cost £0 £0 £170 £930
Base 318 165 102 51
The long-term cost of breaches includes: the loss of share value; loss of investors or funding; long-term
loss of customers; costs from handling customer complaints; and any compensation, fines or legal costs.
It is worth noting that this set of costs is likely to be more difficult for firms to estimate, meaning these
figures are likely to have higher margins of error. Nonetheless, it is evident that most firms tend to expect
no long-term costs from breaches, whereas a minority again expect substantive costs.
Table 5.6: Average estimated long-term cost of the most disruptive breach from the last 12
months
All businesses Micro/small Medium Large
All breaches
Mean cost £560 £560 £650 £840
Median cost £0 £0 £0 £0
Base 712 401 209 102
Breaches with an outcome
Mean cost £760 £730 £1,190 £1,550
Median cost £0 £0 £0 £0
Base 308 161 94 53
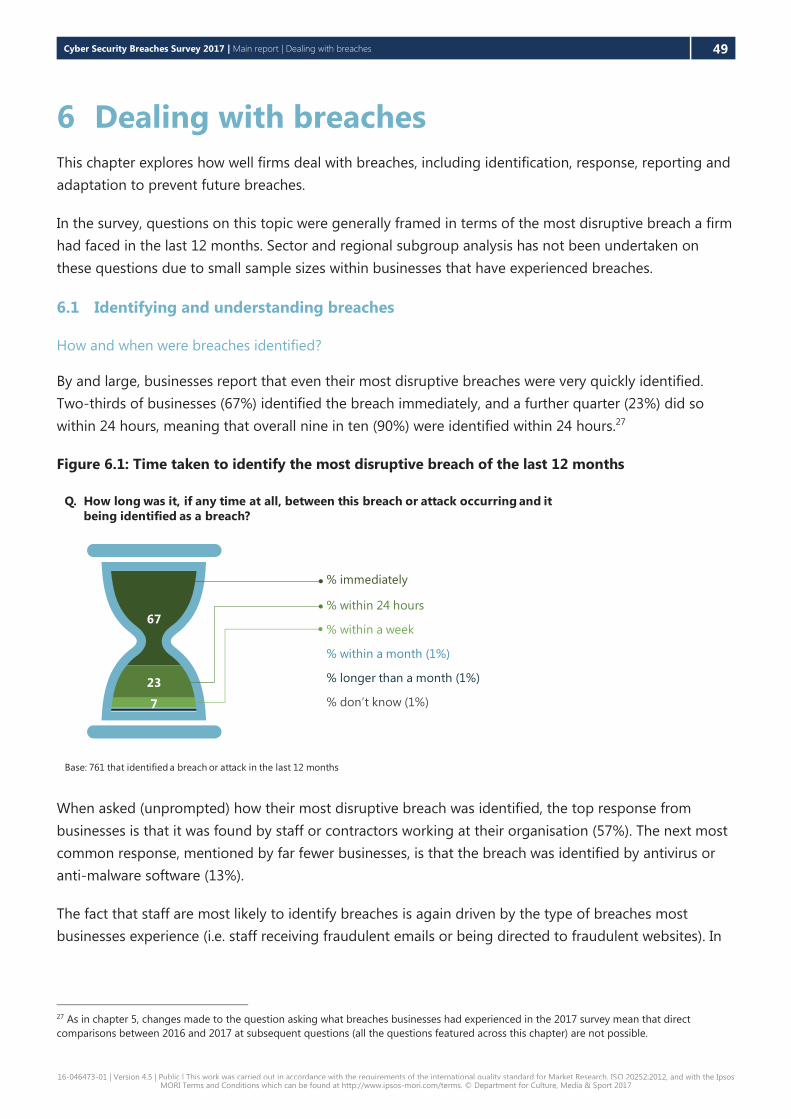
Cyber Security Breaches Survey 2017 | Main report | Dealing with breaches 49
16-046473-01 | Version 4.5 | Public | This work was carried out in accordance with the requirements of the international quality standard for Market Research, ISO 20252:2012, and with the Ipsos MORI Terms and Conditions which can be found at http://www.ipsos-mori.com/terms. © Department for Culture, Media & Sport 2017
6 Dealing with breaches
This chapter explores how well firms deal with breaches, including identification, response, reporting and
adaptation to prevent future breaches.
In the survey, questions on this topic were generally framed in terms of the most disruptive breach a firm
had faced in the last 12 months. Sector and regional subgroup analysis has not been undertaken on
these questions due to small sample sizes within businesses that have experienced breaches.
6.1 Identifying and understanding breaches
How and when were breaches identified?
By and large, businesses report that even their most disruptive breaches were very quickly identified.
Two-thirds of businesses (67%) identified the breach immediately, and a further quarter (23%) did so
within 24 hours, meaning that overall nine in ten (90%) were identified within 24 hours.27
Figure 6.1: Time taken to identify the most disruptive breach of the last 12 months
When asked (unprompted) how their most disruptive breach was identified, the top response from
businesses is that it was found by staff or contractors working at their organisation (57%). The next most
common response, mentioned by far fewer businesses, is that the breach was identified by antivirus or
anti-malware software (13%).
The fact that staff are most likely to identify breaches is again driven by the type of breaches most
businesses experience (i.e. staff receiving fraudulent emails or being directed to fraudulent websites). In
27 As in chapter 5, changes made to the question asking what breaches businesses had experienced in the 2017 survey mean that direct
comparisons between 2016 and 2017 at subsequent questions (all the questions featured across this chapter) are not possible.
7
23
67
Base: 761 that identified a breach or attack in the last 12 months
Q. How long was it, if any time at all, between this breach or attack occurring and it
being identified as a breach?
% immediately
% within 24 hours
% within a week
% within a month (1%)
% longer than a month (1%)
% don’t know (1%)
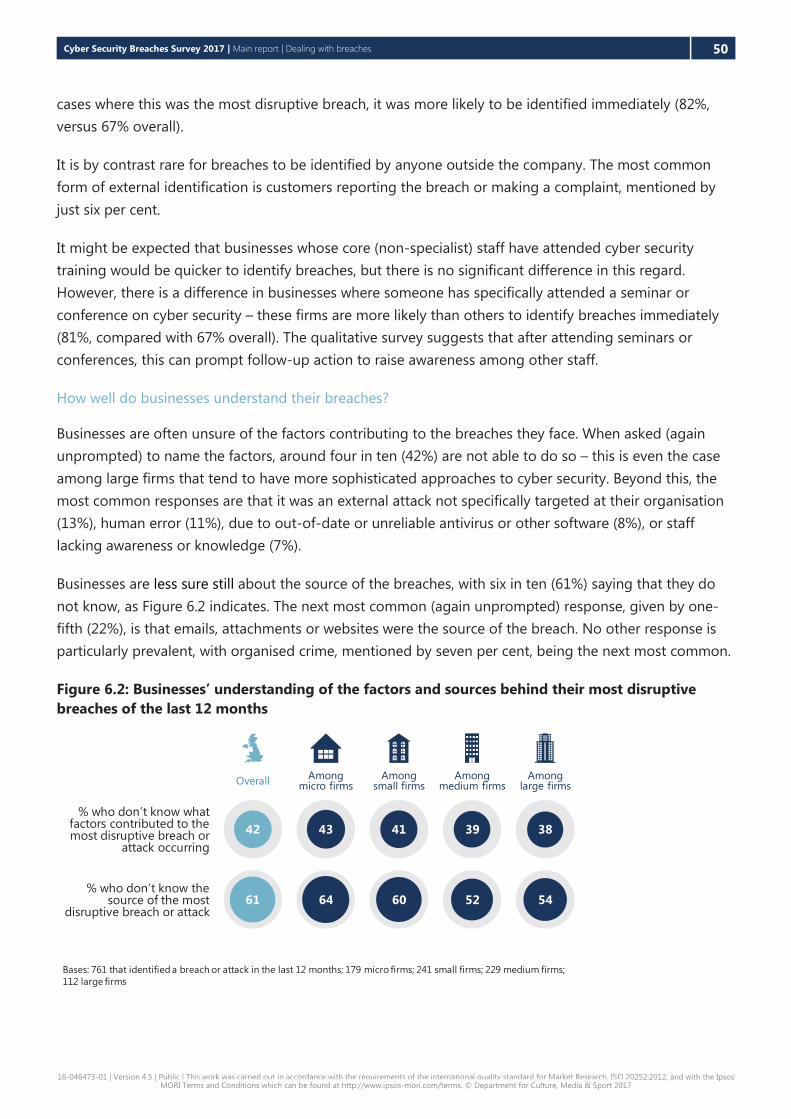
Cyber Security Breaches Survey 2017 | Main report | Dealing with breaches 50
16-046473-01 | Version 4.5 | Public | This work was carried out in accordance with the requirements of the international quality standard for Market Research, ISO 20252:2012, and with the Ipsos MORI Terms and Conditions which can be found at http://www.ipsos-mori.com/terms. © Department for Culture, Media & Sport 2017
cases where this was the most disruptive breach, it was more likely to be identified immediately (82%,
versus 67% overall).
It is by contrast rare for breaches to be identified by anyone outside the company. The most common
form of external identification is customers reporting the breach or making a complaint, mentioned by
just six per cent.
It might be expected that businesses whose core (non-specialist) staff have attended cyber security
training would be quicker to identify breaches, but there is no significant difference in this regard.
However, there is a difference in businesses where someone has specifically attended a seminar or
conference on cyber security – these firms are more likely than others to identify breaches immediately
(81%, compared with 67% overall). The qualitative survey suggests that after attending seminars or
conferences, this can prompt follow-up action to raise awareness among other staff.
How well do businesses understand their breaches?
Businesses are often unsure of the factors contributing to the breaches they face. When asked (again
unprompted) to name the factors, around four in ten (42%) are not able to do so – this is even the case
among large firms that tend to have more sophisticated approaches to cyber security. Beyond this, the
most common responses are that it was an external attack not specifically targeted at their organisation
(13%), human error (11%), due to out-of-date or unreliable antivirus or other software (8%), or staff
lacking awareness or knowledge (7%).
Businesses are less sure still about the source of the breaches, with six in ten (61%) saying that they do
not know, as Figure 6.2 indicates. The next most common (again unprompted) response, given by one-
fifth (22%), is that emails, attachments or websites were the source of the breach. No other response is
particularly prevalent, with organised crime, mentioned by seven per cent, being the next most common.
Figure 6.2: Businesses’ understanding of the factors and sources behind their most disruptive
breaches of the last 12 months
Bases: 761 that identified a breach or attack in the last 12 months; 179 micro firms; 241 small firms; 229 medium firms;
112 large firms
% who don’t know the source of the most
disruptive breach or attack
% who don’t know what factors contributed to the most disruptive breach or
attack occurring
54
Among large firms
38
52
Among medium firms
39
Among micro firms
64
43
Among small firms
4142
Overall
61 60
Cyber Security Breaches Survey 2017 | Main report | Dealing with breaches 51
16-046473-01 | Version 4.5 | Public | This work was carried out in accordance with the requirements of the international quality standard for Market Research, ISO 20252:2012, and with the Ipsos MORI Terms and Conditions which can be found at http://www.ipsos-mori.com/terms. © Department for Culture, Media & Sport 2017
While many businesses are unsure about the contributing factors and sources for their most disruptive
breaches, the role played by staff should again be noted. Among those businesses who are able to give
an answer, two-fifths (43%) identify contributing factors relating to a lack of care or awareness, such as
human error, staff not adhering to policies or processes, staff lacking awareness or knowledge, staff
visiting untrusted or unsafe websites, or interacting with unusual or spam emails.
Along similar lines, 56% of those who can give an answer mention emails, attachments or websites as the
source of the breach. This highlights the importance of staff awareness and understanding around cyber
security, as well as having appropriate technical and software protections in place.
Accidental versus intentional breaches
Two-thirds of businesses (66%) consider their most disruptive breach to have been intentional, whereas
one-fifth (19%) consider it to have been accidental. The survey finds that micro and small businesses are
just as likely as larger businesses to be subject to an intentional breach or attack.
While there are no significant differences by size, those who say that online services are to a large extent
core to their business are more likely than others to consider the breach to have been intentional (83%,
compared with 66% overall).
6.2 Responding to breaches
The likelihood of having formal incident management processes or contingency plans in place varies by
size of business, as can be seen in Figure 6.3. These findings are in line with those from 2016.
Overall, only 11 per cent of firms have incident management processes in place. However, this rises to a
quarter (24%) of medium firms and over two-fifths (45%) of large firms. Large firms are also more likely
than average to say they had effective contingency plans in place for their most disruptive breach (69%,
versus 49% overall). This is in line with the findings across chapter 4, indicating that larger firms tend to
have all-round better documentation when it comes to cyber security.
Virtually all businesses (98%) who have a contingency plan in place for breaches say that the plan was
effective for dealing with their most disruptive breach.

Cyber Security Breaches Survey 2017 | Main report | Dealing with breaches 52
16-046473-01 | Version 4.5 | Public | This work was carried out in accordance with the requirements of the international quality standard for Market Research, ISO 20252:2012, and with the Ipsos MORI Terms and Conditions which can be found at http://www.ipsos-mori.com/terms. © Department for Culture, Media & Sport 2017
Figure 6.3: Whether businesses have incident management processes and contingency plans
The presence of a formal incident management process tends to be higher among finance or insurance
firms (28%, versus 11% overall), education, health or social care firms (21%) and information,
communication or utilities firms (19%).
As may be expected, firms who consider cyber security to be a very high priority are also more likely to
have had an effective contingency plan in place (55%, versus 49% overall).
6.3 Reporting breaches
The overwhelming majority (92%) of businesses that had breaches made their organisation’s directors or
senior management aware of their most disruptive breach.
However, external reporting of breaches is very limited. Just over four in ten (43%) reported their most
disruptive breach outside their organisation, and most commonly this was reported only to an
outsourced cyber security provider (where the reporting might be to enable them to make repairs).
A quarter (26%) of the most disruptive breaches were externally reported to anybody outside of an
outsourced cyber security provider. The most common places to report the breach were to a bank,
building society or credit card company (mentioned, unprompted, by 28%), followed by the police (19%).
This is shown in Figure 6.4.
Bases: 1,523 UK businesses (*761 that identified a breach or attack in the last 12 months); 506 micro firms (*179); 479 small
firms (*241); 363 medium firms (*229); 175 large firms (*112)
% where there was an effective contingency
plan in place to deal with the most disruptive
breach or attack*
% who have formal cyber security incident
management processes
69
Among large firms
45
50
Among medium firms
24
Among micro firms
45
7
Among small firms
52
1411
Overall
49

Cyber Security Breaches Survey 2017 | Main report | Dealing with breaches 53
16-046473-01 | Version 4.5 | Public | This work was carried out in accordance with the requirements of the international quality standard for Market Research, ISO 20252:2012, and with the Ipsos MORI Terms and Conditions which can be found at http://www.ipsos-mori.com/terms. © Department for Culture, Media & Sport 2017
Figure 6.4: Reporting of the most disruptive breach of the last 12 months, excluding those who
reported only to their outsourced cyber security provider
Beyond the police, there is little reporting of breaches to public sector agencies. Action Fraud is the most
common (accounting for 7%), with other public sector agencies mentioned in a handful of cases such as
the Centre for the Protection of National Infrastructure (CPNI), the Cyber Security Information Sharing
Partnership (CISP), and Cifas (the UK fraud prevention service). While not directly comparable, these
findings are very similar to those from the 2016 survey.
No significant differences are seen in reporting behaviours by size of business.
Reasons for not reporting breaches externally
The relatively sporadic mentions of public or policing bodies could reflect the fact that businesses may
not see their breach as criminal. Among those who did not report their breaches, six in ten firms (58%)
say this is because they did not consider the breach or its impact to be significant enough, as illustrated
in Figure 6.5. Even in cases where breaches have had a material outcome for the business in question,
such as loss of files, money or assets (see section 5.2), half (52%) of those who did not report say this is
because the breach was not serious enough.
Bases: 761 that identified a breach or attack in the last 12 months; 192 that reported the breach, excluding those who
reported only to their outsourced cyber security provider
Q. Who was this (most disruptive) breach or attack reported to?
26
% who reported their most disruptive breach
or attack to at least one external body
other than their cyber security provider
Top unprompted responses among those who reported to at least one external body other than their cyber security provider
Bank, building society or credit card company
Police
Suppliers
Internet service provider
Customers
Company that was source of breach
Action Fraud
Antivirus provider
Website administrator
28%
19%
10%
9%
8%
8%
7%
6%
6%
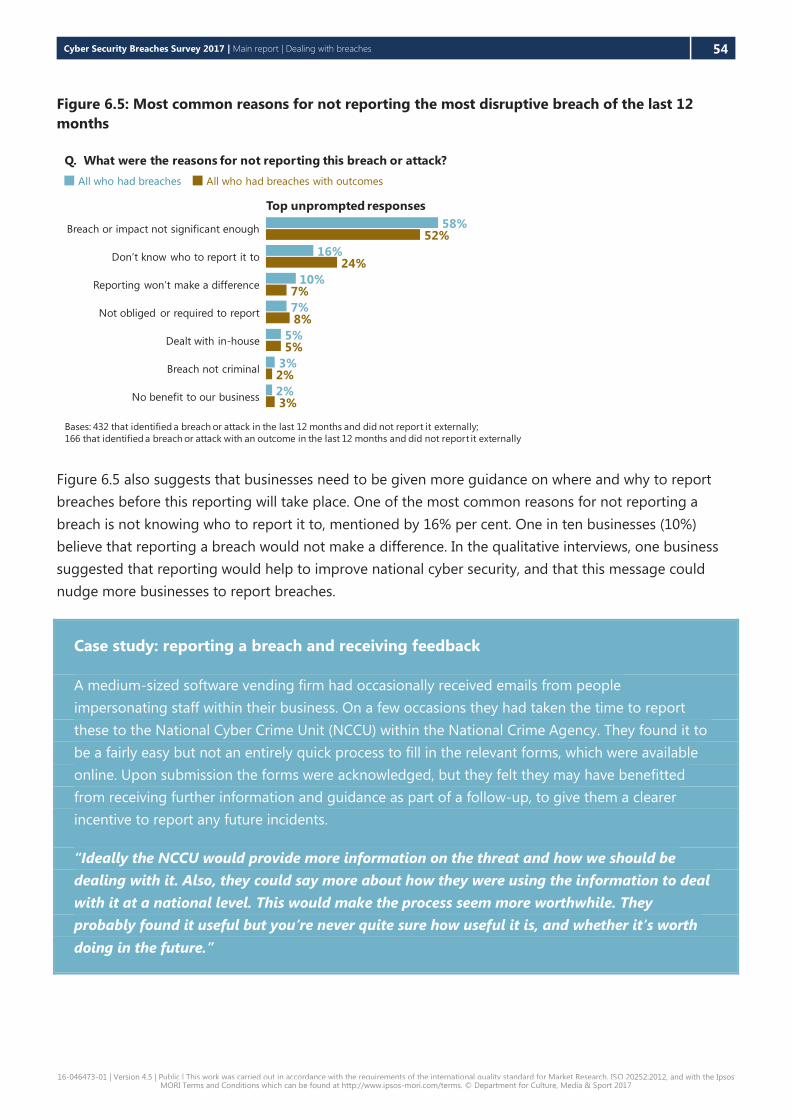
Cyber Security Breaches Survey 2017 | Main report | Dealing with breaches 54
16-046473-01 | Version 4.5 | Public | This work was carried out in accordance with the requirements of the international quality standard for Market Research, ISO 20252:2012, and with the Ipsos MORI Terms and Conditions which can be found at http://www.ipsos-mori.com/terms. © Department for Culture, Media & Sport 2017
Figure 6.5: Most common reasons for not reporting the most disruptive breach of the last 12
months
Figure 6.5 also suggests that businesses need to be given more guidance on where and why to report
breaches before this reporting will take place. One of the most common reasons for not reporting a
breach is not knowing who to report it to, mentioned by 16% per cent. One in ten businesses (10%)
believe that reporting a breach would not make a difference. In the qualitative interviews, one business
suggested that reporting would help to improve national cyber security, and that this message could
nudge more businesses to report breaches.
Case study: reporting a breach and receiving feedback
A medium-sized software vending firm had occasionally received emails from people
impersonating staff within their business. On a few occasions they had taken the time to report
these to the National Cyber Crime Unit (NCCU) within the National Crime Agency. They found it to
be a fairly easy but not an entirely quick process to fill in the relevant forms, which were available
online. Upon submission the forms were acknowledged, but they felt they may have benefitted
from receiving further information and guidance as part of a follow-up, to give them a clearer
incentive to report any future incidents.
“Ideally the NCCU would provide more information on the threat and how we should be
dealing with it. Also, they could say more about how they were using the information to deal
with it at a national level. This would make the process seem more worthwhile. They
probably found it useful but you’re never quite sure how useful it is, and whether it’s worth
doing in the future.”
Bases: 432 that identified a breach or attack in the last 12 months and did not report it externally;
166 that identified a breach or attack with an outcome in the last 12 months and did not report it externally
Q. What were the reasons for not reporting this breach or attack?
Top unprompted responses
All who had breaches All who had breaches with outcomes
58%
16%
10%
7%
5%
3%
2%
52%
24%
7%
8%
5%
2%
3%
Breach or impact not significant enough
Don’t know who to report it to
Reporting won’t make a difference
Not obliged or required to report
Dealt with in-house
Breach not criminal
No benefit to our business

Cyber Security Breaches Survey 2017 | Main report | Dealing with breaches 55
16-046473-01 | Version 4.5 | Public | This work was carried out in accordance with the requirements of the international quality standard for Market Research, ISO 20252:2012, and with the Ipsos MORI Terms and Conditions which can be found at http://www.ipsos-mori.com/terms. © Department for Culture, Media & Sport 2017
Preventing future breaches
The most common action taken after a breach is to raise staff awareness via training or communications
(28%). This once again suggests that staff are seen as being both the first line of defence, and a
potentially weak link when it comes to cyber security breaches.
As seen in Figure 6.6, other common actions are to install or update antivirus or anti-malware software
(20%), or review firewall and system configurations (15%). Relatively few (6%) have created or updated
their policies or procedures in response to their most disruptive breach, while a quarter (26%) have taken
no action at all.
As may be expected, the picture changes slightly when looking only at organisations whose most
disruptive breach resulted in a material outcome (e.g. the loss of files, money or other assets). The most
common responses remain the same, but each is more likely, and just over one in ten (13%) of these
businesses report taking no action.
Figure 6.6: Most common actions following the most disruptive breach of the last 12 months
Efforts to mitigate against future breaches vary by size of business. Large firms are more likely to respond
with training or communications (45%, compared with 28% overall) and are also twice as likely to create
or update policies or procedures (13% versus 6%).
Micro firms may need additional support or guidance in responding to breaches, as they are more likely
than others to have taken no action at all (37%, versus 26% overall).
Bases: 761 that identified a breach or attack in the last 12 months;
339 that identified a breach or attack with an outcome in the last 12 months
Q. What, if anything, have you done since this (most disruptive) breach or attack to
prevent or protect your organisation from further breaches like this?
Top unprompted responses
All who had breaches All who had breaches with outcomes
28%
20%
15%
6%
4%
4%
26%
33%
29%
22%
11%
9%
7%
13%
Additional staff training or communications
Installed, changed or updated antivirus or anti-malware software
Changed or updated firewall or system configurations
Created or changed policies and procedures
Deployed new systems
Hired an outsourced cyber security provider
No action taken

Cyber Security Breaches Survey 2017 | Main report | Dealing with breaches 56
16-046473-01 | Version 4.5 | Public | This work was carried out in accordance with the requirements of the international quality standard for Market Research, ISO 20252:2012, and with the Ipsos MORI Terms and Conditions which can be found at http://www.ipsos-mori.com/terms. © Department for Culture, Media & Sport 2017
Case study: responding to breaches with staff training
A small finance business experienced a ransomware attack that came via an email, and affected a
number of different drives. They had contingency plans that proved effective, but they lost staff
time as it took three days to restore their files. This was very worrying for them and the absence of
any specialist IT staff on site meant that they lacked confidence in this area. As a result, they have
since provided cyber security training to their staff. They have talked to them about how
ransomware is delivered and what it looks like.
Cyber Security Breaches Survey 2017 | Main report | Conclusions 57
16-046473-01 | Version 4.5 | Public | This work was carried out in accordance with the requirements of the international quality standard for Market Research, ISO 20252:2012, and with the Ipsos MORI Terms and Conditions which can be found at http://www.ipsos-mori.com/terms. © Department for Culture, Media & Sport 2017
7 Conclusions
The Cyber Security Breaches Survey series shows that cyber security is an issue that affects UK businesses
of all sizes and sectors. The 2017 survey shows that the number of businesses with an online presence is
growing, as too is the number storing data on the cloud. Alongside this, there is an increasing
prioritisation of cyber security, and more businesses have attempted to identify the risks they face.
Nearly half of all UK businesses have identified a breach or attack in the last 12 months. While breaches
do not always result in a material outcome, such as loss of data or network access, in cases where this
does happen, it has a significant impact on the organisation. The survey finds that these organisations
can also face considerable financial costs from breaches, not just in terms of the direct results of the
breach and recovery or repair costs, but also in terms of the long-term damage to the business’s
reputation, among customers or investors.
The findings suggest that the prevalence of ransomware in particular has heightened awareness and
made cyber security a more urgent issue for a wider range of businesses. The qualitative survey in
particular highlights how businesses in sectors that may not expect to be targeted are falling victim to
costly ransomware attacks. Such attacks also highlight the inherent value of the data that businesses
hold, beyond personal or financial data – with attacks on any kind of data potentially stopping
businesses from carrying out day-to-day work and putting relationships with customers at risk.
The 2017 survey shows some of the major challenges that businesses, and the Government in its effort to
work alongside them, face in further improving their cyber security defences:
▪ Businesses are likely to find the information and guidance provided by the Government useful, but
relatively few have sought out this information. Currently, many businesses rely on their outsourced
providers for advice and guidance, but there is often a lack of trust around advice from private
sources. The Government’s recently-launched National Cyber Security Centre is intended to make
Government guidance easier to find and understand.
▪ Similarly, while most businesses have at least some basic technical controls, such as firewalls,
patched software and anti-malware programmes, few are aware they can be certified for having the
full range of controls in the Government-endorsed Cyber Essentials scheme.
▪ External reporting of breaches remains uncommon. Both the survey and the qualitative interviews
suggest businesses do not always see the benefits of reporting and are unsure who to report to.
Many also think that only breaches they consider to be substantive need reporting.
▪ The prevalence of cyber security training and of cyber insurance has not changed since 2016, and
the 2017 qualitative findings show the structural challenges that businesses face when exploring
both training and insurance. In the qualitative survey, businesses felt they would benefit from being
signposted to training materials or providers. In cases where a non-specialist in the business was
responsible for cyber security, they specifically requested further guidance and training on how to

Cyber Security Breaches Survey 2017 | Main report | Conclusions 58
16-046473-01 | Version 4.5 | Public | This work was carried out in accordance with the requirements of the international quality standard for Market Research, ISO 20252:2012, and with the Ipsos MORI Terms and Conditions which can be found at http://www.ipsos-mori.com/terms. © Department for Culture, Media & Sport 2017
negotiate and manage contracts with external IT consultants or cyber security providers. In terms of
insurance, the survey indicates that some businesses want to see more specific coverage and more
consistency in the insurance policies on the market before they consider investing in insurance.
The findings also highlight certain key audiences for businesses of all sizes and sectors to focus their
efforts on, including the wider workforce, senior managers and suppliers:
▪ In addition to having good technical controls and governance measures in place, awareness raising
and education across all staff – not just specialist IT staff – is important in helping businesses to
avoid the most common breaches. Currently, cyber security training is uncommon, and when it
does take place it is more likely to be offered to IT staff than to the wider workforce. Despite this,
the main types of breaches that organisations face tend to be phishing, viruses and ransomware
attacks – attacks that can exploit human error, as well as technical flaws in cyber security.
▪ Raising the profile of cyber security among senior managers is equally important. The qualitative
survey shows that while senior managers are in charge of decision-making, they may not fully
understand the consequences of cyber security breaches. Only a third of businesses have board
members with responsibility for cyber security, and the qualitative survey also highlights the value
of directors being educated on the issue, and sharing good practice across the various businesses
they are involved with.
▪ The qualitative survey shows that businesses need to consider cyber security risks outside of their
own controlled environments, for example the risks posed by their own customers or suppliers
being breached. A fifth of businesses noted concerns about their suppliers’ cyber security in 2017,
yet fewer than this require suppliers to adhere to specific cyber security standards or codes of
good practice, suggesting not all businesses are attempting to contain this risk.

Cyber Security Breaches Survey 2017 | Main report | Guide to statistical reliability 59
16-046473-01 | Version 4.5 | Public | This work was carried out in accordance with the requirements of the international quality standard for Market Research, ISO 20252:2012, and with the Ipsos MORI Terms and Conditions which can be found at http://www.ipsos-mori.com/terms. © Department for Culture, Media & Sport 2017
Guide to statistical reliability
It should be remembered that final data from the survey are based on a weighted sample, rather than
the entire UK business population. Percentage results are therefore subject to margins of error, which
vary with the size of the sample and the percentage figure concerned.
For example, for a question where 50% of the 1,523 businesses sampled in the survey give a particular
answer, the chances are 95 in 100 that this result would not vary more or less than 3.7 percentage points
from the true figure – the figure that would have been obtained had the entire UK business population
responded to the survey. The margins of error that are assumed to apply in this report are given in the
following table.28
Margins of error applicable to percentages at or near these levels
10% or 90%
± (% points)
30% or 70%
± (% points)
50%
± (% points)
1,523 UK businesses 2.2 3.4 3.7
506 micro firms (2 to 9 employees) 3.4 5.6 5.6
479 small firms (10 to 49 employees) 3.1 4.7 5.2
363 medium firms (50 to 249 employees) 3.7 5.7 6.2
175 large firms (250 employees or more) 5.2 8.0 8.7
There are also margins of error when looking at subgroup differences. A difference must be of at least a
certain size to be statistically significant. The following table is a guide to these margins of error.
Differences required from overall result for significance at or near these percentage levels
10% or 90%
± (% points)
30% or 70%
± (% points)
50%
± (% points)
506 micro firms 2.6 3.9 4.3
479 small firms 2.2 3.4 3.7
363 medium firms 3.0 4.6 5.0
175 large firms 4.8 7.3 7.9
28 In calculating these margins of error, the design effect of the weighting has been taken into account. The overall effective base size of the
survey was 706 (versus 441 in 2016).

Cyber Security Breaches Survey 2017 | Main report | Background note 60
16-046473-01 | Version 4.5 | Public | This work was carried out in accordance with the requirements of the international quality standard for Market Research, ISO 20252:2012, and with the Ipsos MORI Terms and Conditions which can be found at http://www.ipsos-mori.com/terms. © Department for Culture, Media & Sport 2017
Background note
DCMS commissions and manages the Cyber Security Breaches Survey as part of the National Cyber
Security Programme.
Release date: 19 April 2017
Next release: spring 2018
Each year the survey will be reviewed as part of its development. While the majority of the questions will
remain the same to enable comparisons over time, as cyber security is a fast changing area we need to
ensure the survey remains relevant.
The responsible statistician for this release is Olivia Christophersen. For any queries please contact:
020 7211 2377 or [email protected].
We would be interested in any feedback that users have on this release. Please send any feedback to
About Ipsos MORI’s Social Research Institute
The Social Research Institute works closely with national governments, local public services and the not-
for-profit sector. Its c.200 research staff focus on public service and policy issues. Each has expertise in a
particular part of the public sector, ensuring we have a detailed understanding of specific sectors and
policy challenges. This, combined with our methodological and communications expertise, helps ensure
that our research makes a difference for decision makers and communities.
For further information about Ipsos Mori please contact:
3 Thomas More Square
London
E1W 1YW
t: +44 (0)20 3059 5000
www.ipsos-mori.com
http://twitter.com/IpsosMORI

Cyber Security Breaches Survey 2017 | Main report | Background note 61
16-046473-01 | Version 4.5 | Public | This work was carried out in accordance with the requirements of the international quality standard for Market Research, ISO 20252:2012, and with the Ipsos MORI Terms and Conditions which can be found at http://www.ipsos-mori.com/terms. © Department for Culture, Media & Sport 2017
© Crown copyright 2017
You may re-use this information (not including logos) free of charge in any format or medium, under the
terms of the Open Government Licence.
To view this licence, visit www.nationalarchives.gov.uk/doc/open-government-licence/ or write to the
Information Policy Team, The National Archives, Kew, London TW9 4DU, or email:
4th Floor, 100 Parliament Street
London, SW1A 2BQ
www.gov.uk/dcms