april 7, 2021 mr. joe albright, utility director city of
TRANSCRIPT

April 7, 2021
Mr. Joe Albright, Utility Director
City of Gastonia/Two Rivers Utilities
PO Box 1748
Gastonia, NC 28052
Subject: FY 2021 Water and Wastewater System Development Fee Study
Dear Mr. Albright,
WILLDAN FINANCIAL SERVICES (“Willdan”) is pleased to submit to the City of Gastonia/Two
Rivers Utilities, North Carolina (hereinafter the "City") the Water and Wastewater System
Development Fee Study report (the "Report") for your consideration. We have completed the
analyses for the review and development of water and wastewater system development fees and
have summarized the results herein.
GENERAL
System development fees (“SDF” or “SDFs”) and other comparable charges are often referred to
by a number of different terms including impact fees, capacity fees, system expansion fees,
availability fees, connection fees, capacity reservation charges, facility fees, capital connection
charges or other such terminology. In general, an SDF is a one-time charge implemented to
recover (in whole or part) the costs associated with capital investments made by a utility system
to make service available to future users of the system. Such capital costs generally include the
construction of facilities as well as engineering, surveys, land, financing, legal and administrative
costs. It has become common practice for water and wastewater utility systems to implement SDF
(or other similar charges) in order to establish a supplemental source of funding for future capital
projects. This practice helps to mitigate the need for existing customers to pay for system
expansions entirely through increased user rates. It should also be noted that as part of its overall
capital improvement plan (CIP), the City plans extensive water and sewer system improvements
in the Southeast and Southwest growth corridor of its service area. Accordingly, and as further
detailed in the CIP portion of this Report, the evaluation of SDFs herein includes a separate
analysis for the Southeast and Southwest Development Areas specifically related to wastewater.
CRITERIA FOR SYSTEM
DEVELOPMENT FEES
CAPACITY FEES
The purpose of a SDF is to assign, to the extent practical, growth-related capital costs to those
customers responsible for such additional costs. To the extent that new population growth imposes
identifiable additional capital costs to municipal services, equity and prudent financial practice

CITY OF GASTONIA, NC
SYSTEM DEVELOPMENT FEE STUDY PAGE 2
Willdan Financial Services
necessitate the assignment of such costs to those customers or system users responsible for the
additional costs rather than the existing user base. Generally, this practice has been labeled as
“growth paying for growth” without placing the full cost burden on existing users.
It is important to note that an SDF is different than an assessment or tax. A special assessment is
predicated upon an estimated increment in value to the property assessed by virtue of the
improvement being constructed in the vicinity of the property. Further, the assessment must be
directly and reasonably related to the benefit of which the property receives. SDFs are not directly
related to the value of the improvement to the property but rather to the usage of the facilities
required by the property. Until the property is put to use (i.e., developed), there is no burden placed
upon the servicing facilities and the land use may be entirely unrelated to the value of the
assessment basis of the underlying land. With respect to a comparison to taxes, SDFs are
distinguishable primarily in the direct relationship between the amount charged and the measurable
quantity of public facilities required. In the case of taxation, there is no requirement that the
payment be in proportion to the quantity of public services consumed, and funds received by a
municipality from taxes can be expended for any legitimate public purpose.
LEGAL CONSIDERATIONS
Court Proceedings - General
Generally, courts throughout the United States have found that capacity-related fees associated
with new customer connections to utility systems are legal as long as they meet a Rational Nexus
Test. In accordance with common court rulings, the rational nexus test requires that certain
conditions be met in order to have a valid capacity-related fee. Typically, the court decisions have
found that such fees are valid if the following standards are met:
1. The required payment should primarily benefit those who must pay it because they receive
a special benefit or service as a result of improvements made with the proceeds;
2. Proceeds from the required SDF payments are dedicated solely to the capital improvement
projects (i.e. proceeds are not placed in a general fund to be spent on ongoing expenses and
maintenance, which characterizes a tax, but are set aside in a restricted reserve fund);
3. The revenue generated by the required payment should not exceed the cost of capital
improvements to the system; and
4. The required payments are imposed uniformly and equitably on all new customers based
on their anticipated usage (i.e. a relationship between the fees paid and the benefits
received).
In general, most courts have found that it is reasonable for utility systems to take steps to ensure
that there are adequate funds for capital projects, and to set aside collected fees in a special account

CITY OF GASTONIA, NC
SYSTEM DEVELOPMENT FEE STUDY PAGE 3
Willdan Financial Services
for that purpose. Additionally, new customers are treated alike in that all must pay a fee based on
anticipated usage and/or potential demand. Finally, courts have reasoned that it is rational for a
utility system to prepare to pay for future capital projects and, while imposing a capacity-related
fee may not be the only way to raise such funds, it is a reasonable and legitimate method of
accruing funds.
Court Proceedings – Town of Carthage Case
On April 8, 2016, in the case of Quality Built Homes, Inc. v. Town of Carthage, (766 S.E. 2d 897)
the North Carolina Court of Appeals held that the Town of Carthage possessed authority to charge
“impact fees” for water and sewer services. However, On August 16, 2016, the North Carolina
Supreme Court reversed the North Carolina Court of Appeals’ decision and held that the Town did
not possess authority to charge impact fees for water and sewer services. Although there were
many different factors influencing this decision, the result generated a significant amount of
confusion and concern for governmental utility systems within the State.
House Bill 436
In 2017, the General Assembly of North Carolina enacted House Bill 436, which included a
general statute under Section 1, Chapter 162A, Article 8 for the development of “System
Development Fees” (herein referred to as “Chapter 162A”) that impacts all governmental entities
in North Carolina who currently assess fees for the recovery of capital costs associated with new
development and system growth. As defined in Chapter 162A, a system development fee is a charge
or assessment for service imposed with respect to new development to fund costs of capital
improvements necessitated by and attributable to such new development, to recoup costs of existing
facilities which serve such new development, or a combination of those costs. Based on requirements
of Chapter 162A, the calculation of the SDFs, must employ generally accepted accounting,
engineering, and planning methodologies. Defined methodologies include the buy-in method,
incremental or marginal cost method, and combined cost method. A brief description of each of
these methods as defined in American Water Works Association Manual M1 is provided below.
o Buy-in Method. Based on the value of the existing system’s capacity. Under this
method, new development “buys” a proportionate share of capacity at the cost
(value) of the existing facilities.
o Incremental/Marginal Cost Method. Based on the value or cost to expand the
existing system’s capacity. This method assigns to new development the
incremental cost of future system expansion needed to serve new development.
o Combined Cost Method. Based on blended value of both the existing and expanded
system capacity. This method uses a combination of the buy-in and
incremental/marginal cost methods.
Chapter 162A allows a governmental unit to utilize any of the three methods described above
depending on the availability of information from the governmental unit, i.e., a detailed listing of
asset data (buy-in method) or a ten to twenty-year capital improvement plan (incremental method).
The combined method includes both existing assets and future capital projects required to serve
growth.

CITY OF GASTONIA, NC
SYSTEM DEVELOPMENT FEE STUDY PAGE 4
Willdan Financial Services
Chapter 162A states that an SDF shall be calculated based on a written analysis, which may
constitute or be included in a capital plan, that:
1. Is prepared by a financial professional or a licensed professional engineer qualified by
experience and training or education to employ generally accepted accounting, engineering,
and planning methodologies to calculate system development fees for public water and sewer
systems.
2. Documents in reasonable detail the facts and data used in the analysis and their sufficiency and
reliability.
3. Employs generally accepted accounting, engineering, and planning methodologies, including
the buy-in, incremental cost or marginal cost, and combined cost methods for each service,
setting forth appropriate analysis as to the consideration and selection of a method appropriate
to the circumstances and adapted as necessary to satisfy all requirements of this Article.
4. Documents and demonstrates the reliable application of the methodologies to the facts and
data, including all reasoning, analysis, and interim calculations underlying each identifiable
component of the system development fee and the aggregate thereof.
5. Identifies all assumptions and limiting conditions affecting the analysis and demonstrates that
they do not materially undermine the reliability of conclusions reached.
6. Calculates a final system development fee per service unit of new development and includes
an equivalency or conversion table for use in determining the fees applicable for various
categories of demand.
7. Covers a planning horizon of not less than 10 years nor more than 20 years.
8. Is adopted by resolution or ordinance of the local governmental unit in accordance with G.S.
162A-209.
Further, Chapter 162A includes certain other minimum requirements as follows:
1. A system development fee shall not exceed that calculated based on the system development
fee analysis.
2. Credits must be included no matter which methodology is used. A more detailed discussion
on the applicable credits will be included in later sections of this report.
3. A construction or contribution credit shall be given with respect to new development such that
the governmental unit will credit the value of costs in excess of a development’s proportionate
share of connecting facilities required to be oversized for the use of others outside the
development.
As such, this report is intended to address the legal requirements set forth above to develop fees in
accordance with Chapter 162A.
CITY OF GASTONIA, NC
SYSTEM DEVELOPMENT FEE STUDY PAGE 5
Willdan Financial Services
ADOPTION AND PERIODIC
REVIEW OF SDF ANALYSIS
Upon completion of the SDF analysis, Chapter 162A sets forth certain criteria regarding the
adoption and periodic review of SDFs. These include the following:
1. For not less than 45 days prior to consideration for adoption of the SDF analysis, the
governmental unit shall post the analysis on its website and solicit and furnish a means to
submit written comments which shall be considered by the preparer for possible modifications
or revisions to the analysis.
2. Following expiration of the 45 days posting period, the governing body shall conduct a public
hearing prior to considering adopting the analysis with any modifications.
3. The governmental unit shall publish the SDFs in its annual budget, rate plan or ordinance.
Further, the SDF analysis shall be updated at least every five years.
EXISTING SDFs
The City currently imposes System Development Fees to new customers requiring water and/or
wastewater utility service which are based on the System Development Fee study performed for
the City in 2018 (the “2018 SDF Study”) in order to comply with HB 436. The City relied upon
the calculated fees developed in the 2018 SDF Study but implemented SDFs that were 30 percent
lower than those calculated in the 2018 SDF Study, with the exception of the wastewater SDFs
developed for the Southeast Development Area which included no discount.
EXISTING TAP FEES
The City currently imposes tap fees to new customers connecting to the water and wastewater
systems. However, it is important to note that such tap-related fees are different than the SDFs
developed and proposed herein. The distinguishing characteristic is that the tap fees are
established for the purpose of recovering the operating costs associated with performing the
customer service act of physically making a new system tap/connection (i.e., labor and benefits,
equipment, vehicles, materials and supplies, etc.) SDFs, on the other hand, are established for the
purpose of recovering the major capital costs incurred in making water and wastewater utility
service available to the general public. The proposed fees designed herein are intended to be in
addition to the existing tap fees. As such, it is proposed that the existing tap fees continue to be
imposed. It should be noted that, for the purpose of the Report, the existing tap fees are assumed
to recover the costs associated with these items. A review of these fees in relation to actual costs
incurred is beyond the scope of this Report.

CITY OF GASTONIA, NC
SYSTEM DEVELOPMENT FEE STUDY PAGE 6
Willdan Financial Services
EXISTING & PROJECTED
CAPITAL FACILITIES
Existing Facilities – Buy-In Method
In considering the recovery of existing asset costs under the buy-in method, the general concept is
that new customers “buy” a proportionate share of system capacity at the value of the existing
facilities. It is important to note that while this methodology is labeled as buy-in, payment of an
SDF does not transfer any ownership of the assets to the customer. Rather, such payment provides
access to capacity at a status equal to that of existing customers of the system.
While there are different methods that can be used to establish a value to the existing facilities, a
common approach is to value the existing assets at a replacement cost amount. According to the
replacement cost method, the existing system components are valued at the estimated current cost
of replacing the facilities. The analysis developed herein uses an approach referred to as
Replacement Cost New Less Depreciation (RCNLD). Applying the RCNLD method, the original
costs are escalated to current dollars through the use of construction cost indices, and then the
result is adjusted down for the accumulated depreciation, which is also adjusted by the construction
cost indices. This approach results in a replacement cost valuation that reflects the remaining
depreciable life of the facilities.
In performing the RCNLD analysis, the City provided a detailed listing of the current water and
wastewater system facilities (the “Asset Listing”). The Asset Listing contained the original cost,
the date placed in service and the accumulated depreciation for each asset. The replacement cost
of each asset is estimated by using construction cost indices information contained in the Handy-
Whitman Index of Public Utility Construction Costs for the South Atlantic Region. The Handy-
Whitman Index calculates the cost trends for different types of utility construction, including water
systems. The published indices are used by regulatory bodies, operating entities, utility systems,
service companies, valuation experts and insurance companies. The Handy-Whitman Index values
are widely used to trend earlier valuations and original cost records to estimate reproduction cost
at prices prevailing at a certain date or to the present. While many general construction cost
indexes are published, the Handy-Whitman Index is used in this analysis because it is specifically
tailored to the utility industry. After the replacement cost is calculated for each individual asset
item, the adjusted accumulated depreciation is deducted for each asset item. The result is the
RCNLD.
For the purpose of SDF analyses, the existing assets are categorized based on the major
components of Treatment and Transmission. The treatment category includes the treatment
plant facilities (water and wastewater) and accompanying supply and storage facilities (water
only), as well as wastewater effluent disposal facilities. The transmission/collection category
consists of major water mains, water pumping facilities, sewer lift stations and collection lines.
Since the localized distribution and collection facilities are generally contributed by developers or
funded from other sources (i.e., assessments, direct customer payments, etc.), these facilities are
not included for recovery through the SDFs. Additionally, a cost limit or threshold has been set
at $100,000 as a condition of inclusion of the asset items in the SDF calculation. The cost limit is
CITY OF GASTONIA, NC
SYSTEM DEVELOPMENT FEE STUDY PAGE 7
Willdan Financial Services
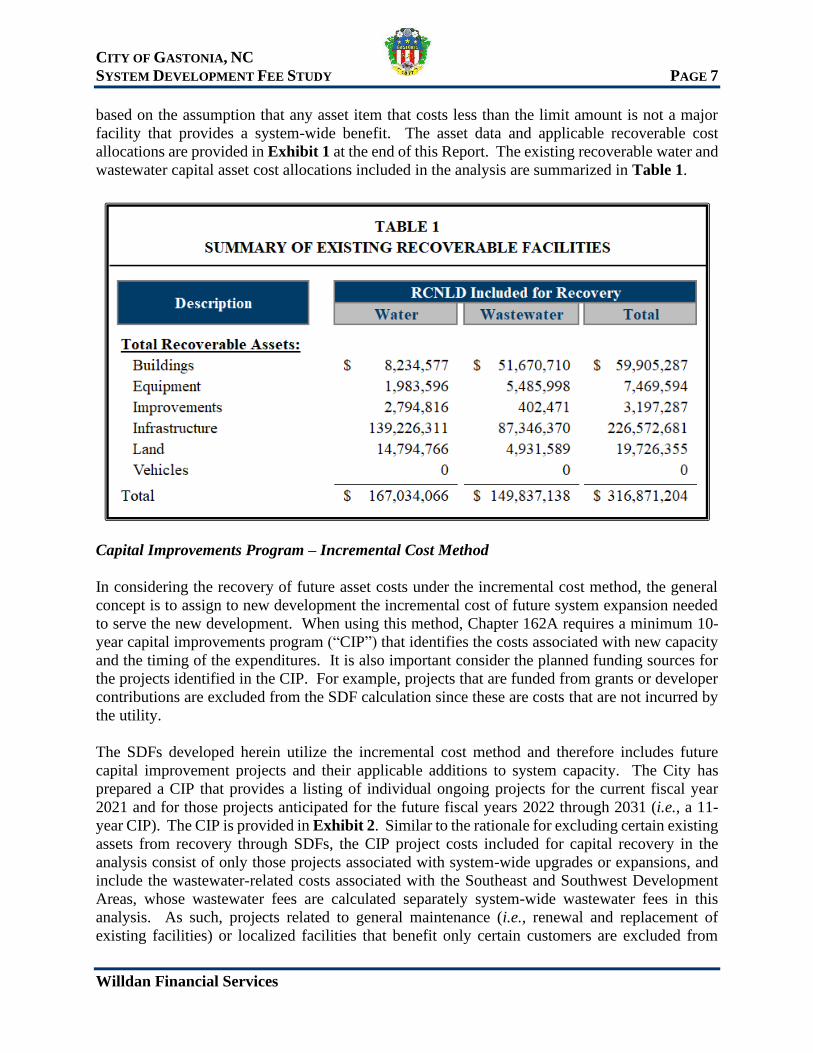
based on the assumption that any asset item that costs less than the limit amount is not a major
facility that provides a system-wide benefit. The asset data and applicable recoverable cost
allocations are provided in Exhibit 1 at the end of this Report. The existing recoverable water and
wastewater capital asset cost allocations included in the analysis are summarized in Table 1.
Capital Improvements Program – Incremental Cost Method
In considering the recovery of future asset costs under the incremental cost method, the general
concept is to assign to new development the incremental cost of future system expansion needed
to serve the new development. When using this method, Chapter 162A requires a minimum 10-
year capital improvements program (“CIP”) that identifies the costs associated with new capacity
and the timing of the expenditures. It is also important consider the planned funding sources for
the projects identified in the CIP. For example, projects that are funded from grants or developer
contributions are excluded from the SDF calculation since these are costs that are not incurred by
the utility.
The SDFs developed herein utilize the incremental cost method and therefore includes future
capital improvement projects and their applicable additions to system capacity. The City has
prepared a CIP that provides a listing of individual ongoing projects for the current fiscal year
2021 and for those projects anticipated for the future fiscal years 2022 through 2031 (i.e., a 11-
year CIP). The CIP is provided in Exhibit 2. Similar to the rationale for excluding certain existing
assets from recovery through SDFs, the CIP project costs included for capital recovery in the
analysis consist of only those projects associated with system-wide upgrades or expansions, and
include the wastewater-related costs associated with the Southeast and Southwest Development
Areas, whose wastewater fees are calculated separately system-wide wastewater fees in this
analysis. As such, projects related to general maintenance (i.e., renewal and replacement of
existing facilities) or localized facilities that benefit only certain customers are excluded from

CITY OF GASTONIA, NC
SYSTEM DEVELOPMENT FEE STUDY PAGE 8
Willdan Financial Services
recovery through the SDFs. Additionally, the City has certain on-going projects defined herein as
Construction-Work-In-Progress, or CWIP, which have also been included in the CIP shown in
Exhibit 2. These are capital projects that have not yet been fully completed and thus are not
projects included in the City’s Asset Listing or part of the City formal CIP, but are assets that all
or a portion of which can be included as recoverable assets in the calculation of the water and
wastewater SDFs. The CIP and resulting identification of assumed growth-related projects (i.e.,
project costs recoverable from SDFs) are provided in Exhibit 3. The Exhibit also provides a
summary allocation of the recoverable costs between the treatment and transmission components.
The projected growth-related projects and associated capital costs included in the analysis are
summarized in Table 2.
System-Wide Recoverable Assets - Water:
Treatment Facilities 65,488,872$
Transmission Facilities 6,652,667
Total 72,141,539$
System-Wide Recoverable Assets - Wastewater:
Treatment Facilities 0$
Transmission Facilities 1,008,423$
Total 1,008,423$
SE Development Area Recoverable Assets - Wastewater:
Treatment Facilities 0$
Transmission Facilities 50,031,249$
Total 50,031,249$
SW Development Area Recoverable Assets - Wastewater:
Treatment Facilities 0$
Transmission Facilities 12,735,000$
Total 12,735,000$
Recoverable Assets - Combined:
Treatment Facilities 65,488,872$
Transmission Facilities 70,427,339
Total 135,916,211$ 50,668,749$ 186,584,960$
Note:
TABLE 2
SUMMARY OF THE CIP
DescriptionRecoverable
Capital
Excluded
Capital (1) Total CIP
(1)Excluded Capital reflects those projects which are not growth-related in nature as indicated by City
staff. See Exhibit 3 for those capital items that have been excluded.

CITY OF GASTONIA, NC
SYSTEM DEVELOPMENT FEE STUDY PAGE 9
Willdan Financial Services
Total System-Wide Facilities Under Combined Method
The analysis developed herein for calculation of the SDFs proposes the combined method. As the
name implies, the combined method includes the cost/value of both the existing facilities currently
providing service, as well as the planned facilities required to perpetuate or expand service. This
method assumes that the utility capacity within the existing system is sufficient to serve near-term
growth, but will require additional capacity to serve future growth needs. Using this method, new
customers pay an SDF that reflects the value of both existing and planned capacity. The combined
system costs included for recovery in the development of system-wide water and wastewater fees
are summarized in Table 3 and exclude the transmission related facilities for the Southeast and
Southwest Development Areas. As discussed previously, the transmission portion of the
wastewater fees for the Southeast and Southwest Development Area are calculated separately
herein since the transmission-related capital costs required to serve those growth areas can be
isolated and are specific to serving new growth in those areas.
DEBT SERVICE CREDIT
It is common practice for utilities to fund major capital improvements and expansion projects with
debt (i.e., bond issues). Generally, debt service payments associated with bond issues are
recovered through the monthly user rates and charges applied to all system customers, as well as
from other available revenue sources (including SDFs). In order to reduce the potential for new
customers to pay twice for capital facilities (i.e., paying an SDF and then paying for debt service

CITY OF GASTONIA, NC
SYSTEM DEVELOPMENT FEE STUDY PAGE 10
Willdan Financial Services
on expansion projects in their monthly user rates), the SDF analysis developed herein includes a
debt service credit. This credit is equal to the outstanding principal remaining on all utility-related
debt. The debt credit amount is allocated between water and wastewater, and further between
transmission and treatment, based on information provided by City staff and is allocated based on
the capital projects that were funded from proceeds of each individual debt issuance. The debt
service credit meets the requirements of Chapter 162A and is utilized in the development of the
proposed SDFs as discussed in the following section. A summary of the combined recoverable
capital facilities, as adjusted for the debt service credit, is provided in Table 4.
SYSTEM CAPACITIES
As previously addressed, the purpose of the SDF is to have new customers pay for their
proportionate share of system capacity. This concept implies that the fee is based on a unit cost of
capacity. In order to apply a fee based on the unit cost of capacity, it is necessary to identify the
capacities of the facilities for which cost recovery is assigned. As such, the methodology applied
herein relies upon identifying the water and wastewater treatment capacities as well as estimating
the capacities of the major transmission facilities. Due to the regulatory and design requirements
for water and wastewater treatment plants, the capacity of treatment facilities is generally well
documented. However, the volumetric capacity of the major transmission facilities is often more
difficult to determine. For this reason, in performing an analysis of this nature, the assumed

CITY OF GASTONIA, NC
SYSTEM DEVELOPMENT FEE STUDY PAGE 11
Willdan Financial Services
capacity of the transmission facilities is commonly based on a factor of the associated treatment
capacities. In developing the estimated amount of capacity for each respective category, the
analysis relies on information provided by the City and included in master planning documents, as
well as assumptions based on common industry standards.
Water Treatment
The City currently owns and operates water treatment facilities with a peak design capacity of 27.3
MGD (million gallons per day). While the permitted flow capacity is provided in terms of the
maximum daily flow amount, the development and application of SDFs are based on average flow
requirements. As such, it is necessary to convert the maximum daily flow (MDF) capacity to an
estimated average daily flow (ADF) capacity. Pursuant to general industry standards and
discussions with staff, it is assumed herein that the rated MDF is approximately 1.5 times the
available capacity on an ADF basis. Applying this factor to the rated capacity for the water
treatment plant and other water supply sources results in an average daily flow capacity of 18.20
MGD. An additional adjustment is made based on the assumed amount of unaccounted-for water
(i.e., system flushing and backwashing, testing, line loss, etc.). The unaccounted-for water reduces
the amount of capacity available to existing and future customers. The analysis performed herein
assumes an average line-loss factor of 18.0% to adjust for the unaccounted-for water flows at the
treatment plant. This final adjustment results in an assumed average daily treatment plant capacity
of 14.92 MGD.
Water Transmission
Unlike the treatment facilities, the capacity information for major transmission facilities is very
difficult to determine and quantify. Such transmission capacity estimates are typically not even
developed in engineering documents such as master plans or Consulting Engineer’s Reports.
Based on discussions with City staff, it is assumed that the water transmission facilities are capable
of providing average water flow at least equal to 2.00 times the adjusted water treatment capacity,
resulting in 29.84 MGD.
Wastewater Treatment
Due to the regulatory and design requirements for wastewater treatment plants, the capacity of
treatment facilities is generally well documented. The wastewater treatment facilities are designed
and permitted in accordance with published hydraulic standards adopted by Section 15A NCAC
02T .0114 of the North Carolina Administrative Code regulations. The City owns and operates
three wastewater treatment facilities, including the Long Creek, Crowders Creek, and Eagle Road
treatment facilities with a combined permitted capacity of 26.00 MGD.
Unlike the application for water, the wastewater treatment capacity is permitted at average daily
flow levels. As such, it is not necessary to convert the capacity. However, as with the line loss in
the water system, the wastewater system is impacted by inflow and infiltration (I&I) into the
wastewater collection facilities. In essence, the impact of I&I reduces the level of capacity that is
available for use by existing and future system customers. Pursuant to discussions with staff, the

CITY OF GASTONIA, NC
SYSTEM DEVELOPMENT FEE STUDY PAGE 12
Willdan Financial Services
ADF for wastewater treatment is adjusted for an assumed I&I impact of 25.00%, resulting in an
adjusted average daily capacity of 19.50 MGD.
Wastewater Transmission
Similar to the discussion provided previously for the determination of water transmission capacity,
it is difficult to identify the capacity of the wastewater transmission facilities. Although an exact
capacity number is difficult to determine, for the purpose of this analysis it is assumed that the
wastewater trunk lines and pumping facilities are designed to provide capacity at least equal to
2.00 times the permitted plant flow (as adjusted for I&I), or 39.00 MGD.
DEVELOPMENT OF
SYSTEM-WIDE SDFs
The methodology utilized herein for developing the system-wide water and wastewater SDFs
relies upon the cost of major system facilities as well as the existing and expanded system
capacities to calculate an estimated cost per unit (gallon) of capacity. Based on this methodology,
it is estimated that the water facility costs are $7.98 per gallon of water capacity (combined
treatment and transmission). Additionally, it is estimated that the combined treatment and
transmission-related wastewater facility costs are $5.25 per gallon of wastewater capacity. These
unit costs would be applicable to new water and wastewater connections system wide. As
discussed previously, the cost for wastewater is exclusive of wastewater capital costs for the
Southeast Development Area.
In developing the SDFs, the unit costs per gallon of capacity are applied to a common Level of
Service (LOS) standard in order to establish the applicable fee per Equivalent Residential Unit
(ERU). For purposes of applying the LOS, an ERU is representative of a single-family residential
dwelling unit receiving water service from a 5/8x3/4-inch metered connection and discharging
normal domestic-strength wastewater through a comparably sized sewer connection. Based on
common industry standards for the development and application of capacity-related charges, a
typical residential water connection is generally assumed to require average service availability in
the range of 350 to 450 gallons of water per day (gpd) of system capacity. In order to establish an
applicable LOS for system capacity, this analysis relies upon flow standards established by the
State of North Carolina (the “State”) for purposes of planning and engineering design. In
accordance with daily water flow capacity design standards defined in the North Carolina
Administrative Codes (15A NCAC 18C .0409), the level of service requirement for a residential
connection is 400 gallons per day (gpd). However, it is assumed that this level of service is a
maximum day usage and was divided by 1.5 to calculate an average day usage number, resulting
in a standard level of service of 267 gpd of water system capacity. Applying this flow standard, it
is assumed that 1 ERU requires a standard level of service of 267 gpd of water system capacity.
Similar to the water system, the SDFs for wastewater are to be applied on an equivalent residential
unit (ERU) basis such that 1 ERU is equal to the estimated capacity requirements for a typical
single family residential connection with a 5/8-inch X 3/4-inch water meter. According to the

CITY OF GASTONIA, NC
SYSTEM DEVELOPMENT FEE STUDY PAGE 13
Willdan Financial Services
wastewater flow design standards adopted by the State and defined the North Carolina
Administrative Codes (15A NCAC 02T .0114), the level of service requirement would be based
on 120 gallons of capacity per day per bedroom for a residential home. Assuming an average of
3.0 bedrooms per new home constructed, applying the State's flow standard to the average number
of bedrooms, 1 ERU would result in a standard level of service of 360 gpd of wastewater system
capacity. However, the City has advised that they have received approval from the State of North
Carolina Department of Environmental Quality (“NCDEQ”) to have their standard LOS for sewer
reduced for sewer permitting from the 120 gallons per bedroom per day to a lower amount. The
City’s engineering consultant provided a report that was submitted to NCDEQ for review and,
subsequently, the NCDEQ approved using 150 gpd for 1 & 2-bedroom dwelling units with an
additional 75 gpd for additional bedrooms. The City has assumed an average of 3.5 bedrooms per
new home construction, resulting in a sewer LOS of 263 gallons per day.
Applying the average day LOS amounts as discussed previously to the estimated unit costs per
gallon of capacity, and adjusting for the applicable debt service credits, results in calculated
system-wide water and wastewater SDFs of $2,120 and $1,380, respectively, for a typical single-
family residential connection (i.e., per ERU). The development of the proposed system-wide water
and wastewater SDFs is detailed in Exhibits 4 and 5, respectively. A summary of the existing
and proposed systemwide SDFs for a typical new residential connection is provided in Exhibit 8.
SOUTHEAST & SOUTHWEST
SDF CALCULATIONS
General
As discussed previously, the wastewater SDFS for the Southeast and Southwest Development
Areas has been calculated independent of the system-wide fees due to the large capital costs
required to provide wastewater transmission services specific to those areas.
Southeast Development Area
City staff has advised that there is a potential to add approximately 9,000 new wastewater ERUs
in the Southeast Development Area. Additionally, the City estimates that the capital costs to
provided wastewater service to this area will be approximately $50.3 million. After applying a
25% debt service credit to this capital cost amount, the resulting recoverable assets are
approximately $37.5 million. Assuming 9,000 potential ERUs, the resulting transmission related
SDF component would be $4,160 per ERU. Combining this transmission component cost to the
system-wide treatment capacity cost per ERU of $820 results in a combined SDF of $4,980 per
ERU for new wastewater connections in the Southeast Development Area as set forth in Exhibit
6. As advised by the City, the water SDF for a new connection in the Southeast Development
Area would be the systemwide fee of $2,120 per ERU.
Southwest Development Area
City staff has advised that there is a potential to add approximately 6,000 new wastewater ERUs
initially in the Southwest Development Area if the City provided certain wastewater infrastructure
needed for new development in that area. The City estimates that the capital costs to provide

CITY OF GASTONIA, NC
SYSTEM DEVELOPMENT FEE STUDY PAGE 14
Willdan Financial Services
wastewater service to serve 6,000 new wastewater ERUs in this area will be approximately $12.7
million. After applying a 25% debt service credit to this capital cost amount, the resulting
recoverable assets are approximately $9.55 million. Assuming 6,000 potential ERUs, the resulting
transmission related SDF component would be $1,590 per ERU. Combining this transmission
component cost to the system-wide treatment capacity cost per ERU of $820 results in a combined
SDF of $2,410 per ERU for new wastewater connections in the Southwest Development Area as
set forth in Exhibit 7. As advised by the City, the water SDF for a new connection in the Southwest
Development Area would be the system-wide fee of $2,120 per ERU.
APPLICATION OF SDFs
For the purpose of developing SDFs, the average daily flow number is established as one
equivalent residential unit (ERU). An ERU provides a standard unit of measure such that fees for
connections with larger than average demand requirements can be calculated on an equivalency
basis. One ERU is equal to the average anticipated flow for a single-family dwelling unit with a
standard 5/8 x 3/4-inch water meter. New connections with larger water meters have the potential
of placing more demand on the system (i.e., require more capacity) and are assessed ERU factors
accordingly. The City’s existing methodology for incrementing the fees for larger connection sizes
is based on standardized demand criteria established by the American Water Works Association
(AWWA) pursuant to the size of the water meter. Utilizing the AWWA demand criteria, the
applicable ERU factors for larger water meters are based on the incremental increase in potential
demand as compared to the standard meter size. As such, the proposed fees developed herein
utilize the meter equivalency methodology currently applied by the City for its existing fees. Since
wastewater flow is generally a direct function of water flow, applying the water and wastewater
SDFs based upon the size of the water meter is equitable, administratively efficient and consistent
with industry standards. The existing and proposed water and wastewater SDFs for system-wide,
Southeast and Southwest Development Area new connections equaling 1 ERU are set forth in
Table 5 that follows. A detailed listing of calculated SDFs for all service areas, by meter size, are
shown in Exhibit 8.

CITY OF GASTONIA, NC
SYSTEM DEVELOPMENT FEE STUDY PAGE 15
Willdan Financial Services
In situations where the application of the meter-based fees will result in the collection of fees
significantly different than the potential demand requirement of a new customer requesting service,
a special calculation methodology may be applied at the discretion of the City’s Utilities Director.
For such situations, it is important for the utility to have the flexibility to utilize an ERU
methodology for individual accounts based on specific capacity requirements. This alternative
methodology is to multiply the calculated unit costs per gallon of capacity, as provided in Exhibit
8, by the capacity requirement for the particular customer. This type of situation will be
uncommon and will typically only involve larger commercial and industrial connections. It is
anticipated that, in such situations, the City may require certified engineering documentation
defining the capacity utilization needs for the new customer.
As another example of utilizing a flexible methodology, the City sometimes has new master-
metered multi-family connections whereby multiple residential dwelling units receive service
through a single, common connection. Such connections generally consist of apartment
complexes, patio homes, condominiums, duplexes, triplexes, townhouses, etc. Since the usage
characteristics for individual dwelling units within multi-family structures are generally consistent
with those of individually metered single-family households, it is common industry practice for
Existing Fees:
Water 1,246$ 1,246$ N/A
Wastewater 868 3,150 N/A
Total 2,114$ 4,396$ N/A
Proposed Fees:
Water 2,120$ 2,120$ 2,120$
Wastewater 1,380 4,980 2,410$
Total 3,500$ 7,100$ 4,530$
Change from Existing Fees:
Water 874$ 874$ 2,120$
Wastewater 512 1,830 2,410$
Total 1,386$ 2,704$ 4,530$
Note:
TABLE 5
COMPARISON OF FEES PER ERU
Description
Fee Per Equivalent Residential Unit
System-Wide
SDFs
Southeast
Development
Area SDFs
Southwest
Development
Area SDFs
(1) The City currently charges fees based on meter size. The existing & proposed SDFs above assume one ERU for
a 3/4-inch customer.

CITY OF GASTONIA, NC
SYSTEM DEVELOPMENT FEE STUDY PAGE 16
Willdan Financial Services
such connections to be represented on a per-unit basis regardless of the size of the master-metered
connection. As such, the SDFs for new multi-family connections can be applied based on the
number of permitted dwelling units (or a lesser equivalency factor thereof). For example, if it is
determined that a new master-metered multi-family development requires less capacity per
dwelling unit than a typical residential home, the utility can apply a factor of less than 1 ERU per
unit (e.g. 0.80 ERUs per dwelling unit). The resulting number of equivalent units is then multiplied
times the SDF per ERU to calculate the total fees to be collected.
COMPARISON WITH
NEIGHBORING UTILITIES
In order to provide the City with additional insight regarding the development and application of
the SDFs, a comparison of fees imposed by other utility systems in North Carolina has been
developed and is shown in Exhibit 9. The comparison shows the SDFs of other utilities for a new
residential water and wastewater connection that receives service (from the subject utility or other
local providers) through a standard residential-sized water meter (representative of 1 ERU) as
compared to the City’s existing and proposed system-wide fees.
GENERAL ASSUMPTIONS
AND CONSIDERATIONS
In the preparation of this Report, certain information has been used and relied upon that was
provided to Willdan by other entities. Such information includes, but is not limited to, audited
financial statements, annual operating budgets, capital information, asset listings, cost data, system
capacities, fee schedules for other utilities, and other information provided during the study. While
the sources and applicable information are believed to be reliable, no independent verification of
the information has been made and no assurances are offered with respect to the accuracy of the
applicable information. To the extent that information used to develop the assumptions applied in
the Report differs from actual results, the analyses developed herein could be impacted
accordingly.
CONCLUSIONS
This study has found a need for the City to adopt a mechanism for recovering the capital costs
associated with system growth and expansion. Based on the reviews, analyses and assumptions
provided herein, it is concluded that:
1. The application of SDFs for new system connections is becoming more common for
public utility systems in North Carolina. As growth continues to impact the region,
and as state and federal funding programs are reduced or eliminated, it is prudent

CITY OF GASTONIA, NC
SYSTEM DEVELOPMENT FEE STUDY PAGE 17
Willdan Financial Services
management practice to adopt mechanisms to recover capital costs incurred by the
utility for making service available to future customers.
2. Through Chapter 162A, the North Carolina legislature has found that it is prudent to
require new customers to bear a portion of the costs of current capacity and future
expansions their presence will demand. It should be noted that Willdan is not
attempting to issue a legal opinion regarding Chapter 162A or any court proceedings
leading to the enactment of Chapter 162A. The summary discussion of the bill and any
prior court rulings is intended for informational purposes only. Any questions
regarding the legal consideration provided herein should be directed to the City’s legal
counsel.
3. The SDFs developed herein are equitable and provide for reasonable recovery of the
capital costs associated with providing service to new customers.
4. The SDFs proposed herein are developed in accordance with the requirements of
Chapter 162A and utilize methodologies that are consistent with industry standards.
5. The proposed SDFs are based on a listing of existing system assets as provided by the
City, construction work in progress capital projects, as well as the 10-year capital
improvement plan prepared by the City.
6. The water and wastewater LOS standards proposed herein for establishing an ERU
basis are based on flow standards utilized by the State as defined in the North Carolina
Administrative Code, as adjusted, and the State of North Carolina Department of
Environmental Quality and are consistent with common industry standards.
7. The City currently imposes tap fees and other related charges operational charges for
new customer connections. Since these other charges are intended to recover operating
costs for providing incident-specific services, the SDFs developed herein will have no
effect on the level or application methodology for these other connection-related fees.
8. The City’s monthly user rates and charges for water and wastewater utility service
include a surcharge for customers located outside the incorporated limits of the City.
However, no such surcharge is proposed for purposes of applying the SDFs. The
rationale for this proposal is that, while operating costs may increase for providing
service outside of the City limits, the capital costs per gallon of capacity for
constructing major system facilities do not typically differ based on the location of the
customer.

CITY OF GASTONIA, NC
SYSTEM DEVELOPMENT FEE STUDY PAGE 18
Willdan Financial Services
RECOMMENDATIONS
Based on the reviews, analyses and assumptions discussed herein, as well as the resulting
conclusions provided above, it is respectfully recommended that the City:
1. Adopt the proposed SDFs and application methodology as developed in this Report;
2. Enact the proposed SDFs to become effective on July 1, 2021 or other such date as
determined appropriate by the City Council; and
3. Readdress the SDF study within the next 5 years, or at such times as future capital
improvement plans indicate that increased capital expenditures are required that may
result in material adjustments to the SDFs currently in effect.
We appreciate the opportunity to be of service to the City in this matter. In addition, we would
like to thank you and the other members of the City staff for the valuable assistance and
cooperation provided during the preparation of the Report. We look forward to working with you
on future projects and continuing a successful professional relationship.
Respectfully Yours,
WILLDAN FINANCIAL SERVICES.
Richard K. McClung, Jr. Daryll B. Parker
Principal Principal
\

EXHIBITS 1 - 9 SUPPORTING OUTPUT FOR THE
FY 2021 WATER & WASTEWATER SDF STUDY
FY 2021 WATER & WASTEWATER SDF STUDY FOR THE
CITY OF GASTONIA, NORTH CAROLINA
Prepared by Willdan Financial Services

Exhibit 1
System Development Fee Analysis
Existing Capital Costs Recoverable From SDFs
Water & Wastewater Systems
UTILITY ASSETS
Total Assets by Category:
1 Buildings 69,659,204$ 247,356,980$ (185,768,006)$ 61,588,974$
2 Equipment 14,544,839 67,608,787 (58,661,485) 8,947,302
3 Improvements 4,689,487 11,227,915 (7,998,110) 3,229,805
4 Infrastructure 200,224,502 841,007,142 (540,062,667) 300,944,475
5 Land 12,273,703 22,595,670 (18,046) 22,577,624
6 Vehicles 317,077 317,076 (158,608) 158,468
7 Work in Progress 0 0 0 0
8 Total 301,708,812$ 1,190,113,570$ (792,666,922)$ 397,446,648$
Adjusted For Assumed Cost Limit ($):
9 Buildings 66,005,411$ 220,472,188$ (160,566,901)$ 59,905,287$
10 Equipment 8,208,534 22,940,583 (15,470,989) 7,469,594
11 Improvements 4,216,637 9,576,998 (6,379,711) 3,197,287
12 Infrastructure 146,196,749 653,293,464 (426,720,783) 226,572,681
13 Land 10,854,472 19,726,355 0 19,726,355
14 Vehicles 152,451 152,451 (27,865) 124,586
15 Work in Progress 0 0 0 0
16 Total 235,634,254$ 926,162,039$ (609,166,249)$ 316,995,790$
Recoverable Allocation - Water (%):
17 Buildings 14%
18 Equipment 27%
19 Improvements 87%
20 Infrastructure 61%
21 Land 75%
22 Vehicles 0%
23 Work in Progress 0%
Recoverable Allocation - Wastewater (%):
24 Buildings 86%
25 Equipment 73%
26 Improvements 13%
27 Infrastructure 39%
28 Land 25%
29 Vehicles 0%
30 Work in Progress 22%
Line Description Original CostReplacement Cost
NewRCNLD
Accumulated
Depreciation
Willdan Financial Services Page 1 of 25 4/7/2021

Exhibit 1
System Development Fee Analysis
Existing Capital Costs Recoverable From SDFs
Water & Wastewater Systems
Line Description Original CostReplacement Cost
NewRCNLD
Accumulated
Depreciation
System Allocation - Water ($):
31 Buildings 8,234,577$
32 Equipment 1,983,596
33 Improvements 2,794,816
34 Infrastructure 139,226,311
35 Land 14,794,766
36 Vehicles 0
37 Work in Progress 0
38 Total 167,034,066$
System Allocation - Wastewater ($):
39 Buildings 51,670,710$
40 Equipment 5,485,998
41 Improvements 402,471
42 Infrastructure 87,346,370
43 Land 4,931,589
44 Vehicles 0
45 Work in Progress 0
46 Total 149,837,138$
47 Grand Total Recoverable Assets 316,871,204$
COMPONENT ALLOCATION
Total Recoverable Water Facilities:
48 Treatment Facilities 27,807,755$
49 Transmission Facilities 139,226,311
50 Total 167,034,066$
Total Recoverable Wastewater Facilities:
51 Treatment Facilities 62,490,768$
52 Transmission Facilities 87,346,370
53 Total 149,837,138$
Combined Recoverable Facilities:
54 Treatment Facilities 90,298,523$
55 Transmission Facilities 226,572,681
56 Total 316,871,204$
COMPARISON TO TOTAL
57 Total Utility Assets 397,446,648$
58 Combined Recoverable Assets 316,871,204$
Difference (Assets Excluded From Recovery):
59 Excluded From Recovery ($) 80,575,444$
60 Excluded From Recovery (%) 20.27%
Willdan Financial Services Page 2 of 25 4/7/2021

Exhibit 1
System Development Fee Analysis
Existing Capital Costs Recoverable From SDFs
Water & Wastewater Systems
Line Description Original CostReplacement Cost
NewRCNLD
Accumulated
Depreciation
DEBT SERVICE CREDIT
61 Outstanding Debt Principal 55,369,477$
Allocation Percentage:
62 Water 87.49%
63 Wastewater 12.51%
Allocated Debt Service Credit:
64 Water 48,440,156$
65 Wastewater 6,929,321
66 Total 55,369,477$
Component Allocation - Water:
67 Treatment Facilities 46,065,000$
68 Transmission Facilities 2,375,156
69 Total 48,440,156$
Component Allocation - Wastewater:
70 Treatment Facilities 1,597,655$
71 Transmission Facilities 5,331,665
72 Total 6,929,321$
Willdan Financial Services Page 3 of 25 4/7/2021

Exhibit 2
System Development Fee Analysis
Current Capital Improvement Program for FY 2021 - FY 2031
Water & Wastewater Systems
Line Description Total 2021 2022 2023 2024 2025 2026 2027 2028 2029 2030 2031
1 MUNICIPAL OPERATIONS CENTER . G 0$ 0$ 0$ 0$ 0$ 0$ 0$ 0$ 0$ 0$ 0$ 0$
ECONOMIC DEVELOPMENT .
2 Initial Studies for Technology Park . G 333,333$ 0$ 0$ 0$ 0$ 66,667$ 66,667$ 66,667$ 66,667$ 66,667$ 0$ 0$
3 Southwest Sewer Modelling (Casino) G 0 0 0 0 0 0 0 0 0 0 0 0
4 Main Ave Sewer Lining from Trenton to Chester G 0 0 0 0 0 0 0 0 0 0 0 0
5 Subtotal 333,333$ 0$ 0$ 0$ 0$ 66,667$ 66,667$ 66,667$ 66,667$ 66,667$ 0$ 0$
REGIONALIZATION .
6 Dallas Sewer Connection ($495,000 CWIP Gastonia Portion) . RR 0$ 0$ 0$ 0$ 0$ 0$ 0$ 0$ 0$ 0$ 0$ 0$
7 Cramerton System . G 0 0 0 0 0 0 0 0 0 0 0 0
8 Subtotal 0$ 0$ 0$ 0$ 0$ 0$ 0$ 0$ 0$ 0$ 0$ 0$
WWTP IMPROVEMENTS (CROWDERS CREEK) .
9 HMI Replacement Crowders Creek . RR 0$ 0$ 0$ 0$ 0$ 0$ 0$ 0$ 0$ 0$ 0$ 0$
10 Process Automation Improvements Crowders Creek . RR 373,900 0 373,900 0 0 0 0 0 0 0 0 0
11 Crowders Creek WWTP Digester Repairs/Maintenance . RR 2,500,000 0 0 0 0 0 0 500,000 500,000 500,000 500,000 500,000
12 Replacement Bar Screens RR 710,000 0 0 0 0 0 0 710,000 0 0 0 0
13 Crowders Creek WWTP Influent Sewer Replacement . RR 450,000 0 450,000 0 0 0 0 0 0 0 0 0
14 Subtotal 4,033,900$ 0$ 823,900$ 0$ 0$ 0$ 0$ 1,210,000$ 500,000$ 500,000$ 500,000$ 500,000$
SOUTHEAST SEWER EXPANSION .
PHASE I .
15 Armstrong Ford PS & FM & Armstrong Ford Gravity Sewer
AND Baltimore Part II Gravity Sewer . 5,800,000$ 0$ 5,800,000$ 0$ 0$ 0$ 0$ 0$ 0$ 0$ 0$ 0$
16 Armstrong Ford Regional Pump Station (Contract #6) . G 6,100,000 0 6,100,000 0 0 0 0 0 0 0 0 0
17 Construction Observation & Administration . G 940,000 0 940,000 0 0 0 0 0 0 0 0 0
PHASE II .
18 SE PS & FM (Line 4) & Union New Hope Road Waterline 8,700,000 0 8,700,000 0 0 0 0 0 0 0 0 0
19 Catawba Creek Outfall Part I (Line 5 thru #526, Line 6) G 4,500,000 0 4,500,000 0 0 0 0 0 0 0 0 0
20 Catawba Creek Outfall Part II (Line 5 from #526, Line 5a) G 6,900,000 0 6,900,000 0 0 0 0 0 0 0 0 0
21 Southeast Regional Pump Station (Contract #7) G 5,200,000 0 5,200,000 0 0 0 0 0 0 0 0 0
22 Construction Observation & Administration . G 1,300,000 0 1,300,000 0 0 0 0 0 0 0 0 0
23 Subtotal 39,440,000$ 0$ 39,440,000$ 0$ 0$ 0$ 0$ 0$ 0$ 0$ 0$ 0$
CWIP Projects (SE Sewer Expansion Related-Collection)
24 Right of Way Easements (SE Sewer) (CWIP) . G 1,500,000$
25 Permitting (CWIP) . G 400,000
26 Southeast Sewer Expansion G 4,470,443
27 South Fork River Crossing G 2,205,182
28 Baltimore Sewer Ferc Crossing G 2,015,624
29 Subtotal 10,591,248$
30 Total Southeasst Sewer Expansion Costs 50,031,248$
SEWER IMPROVEMENTS (NCDOT CONFLICTS) .
31 South New Hope Road Sewer Improvements . RR 260,000$ 0$ 0$ 0$ 0$ 0$ 260,000$ 0$ 0$ 0$ 0$ 0$
32 I-85/321 Interchange (I-5000) - Utility Conflicts (Sewer) . RR 500,000 0 0 500,000 0 0 0 0 0 0 0 0
33 Subtotal 760,000$ 0$ 0$ 500,000$ 0$ 0$ 260,000$ 0$ 0$ 0$ 0$ 0$
SOUTHEAST WATER EXPANSION
PHASE II
34 Developer Refunds G 0 0 0 0 0 0 0 0 0 0 0 0
35 Right of Way Easements (SE Sewer) G 0 0 0 0 0 0 0 0 0 0 0 0
36 Permitting G 0 0 0 0 0 0 0 0 0 0 0 0
37 Construct Future Support Lines when SE Area is close to buildout 0 0 0 0 0 0 0 0 0 0 0 0
38 Subtotal 0$ 0$ 0$ 0$ 0$ 0$ 0$ 0$ 0$ 0$ 0$ 0$
Project
Type
For Fiscal Years Ending June 30,
Page 4 of 25 4/7/2021Willdan Financial Services

Exhibit 2
System Development Fee Analysis
Current Capital Improvement Program for FY 2021 - FY 2031
Water & Wastewater Systems
Line Description Total 2021 2022 2023 2024 2025 2026 2027 2028 2029 2030 2031
Project
Type
For Fiscal Years Ending June 30,
COLLECTION SYSTEM IMPROVEMENTS (OUTFALL LINES)
39 Berkley Forest Mobile Home Park Extension RR 30,000$ 0$ 0$ 0$ 0$ 0$ 0$ 30,000$ 0$ 0$ 0$ 0$
40 Sewer Pier Failures RR 2,000,000 0 200,000 200,000 200,000 200,000 200,000 200,000 200,000 200,000 200,000 200,000
41 Bradley RR 169,950 0 0 169,950 0 0 0 0 0 0 0 0
42 Bridgewood Lane RR 170,000 0 0 170,000 0 0 0 0 0 0 0 0
43 Modena Outfall Exposed Pipes RR 170,000 0 0 0 170,000 0 0 0 0 0 0 0
44 Siegle Street RR 138,000 0 0 0 138,000 0 0 0 0 0 0 0
45 Dixie Street (#2) RR 138,000 0 0 0 0 138,000 0 0 0 0 0 0
46 Firestone Avenue Waterline Crossing RR 60,000 0 0 0 0 60,000 0 0 0 0 0 0
47 Oakland Street Crossing and Line Repair RR 228,000 0 0 0 0 0 228,000 0 0 0 0 0
48 Bessemer City Road RR 96,000 0 0 0 0 96,000 0 0 0 0 0 0
49 Remount Road (Resurfacing) RR 0 0 0 0 0 0 0 0 0 0 0 0
50 Firestone Outfall I&I RR 0 0 0 0 0 0 0 0 0 0 0 0
51 Firestone Outfall Study RR 150,000 0 150,000 0 0 0 0 0 0 0 0 0
52 Firestone Lower Basin I & I RR 445,000 0 0 0 0 0 445,000 0 0 0 0 0
53 Trenton Street Service Reversals RR 12,500 0 0 12,500 0 0 0 0 0 0 0 0
54 Parallel Line-LARGE (Firestone Interceptor) RR 1,500,000 0 0 0 0 0 0 750,000 750,000 0 0 0
55 Firestone Upper Basin I&I (Manholes) RR 300,000 0 0 300,000 0 0 0 0 0 0 0 0
56 1619 Ridgewood Drive (X675086) RR 75,500 0 0 0 75,500 0 0 0 0 0 0 0
57 338 Rosemary (X675088) RR 59,000 0 0 0 59,000 0 0 0 0 0 0 0
58 Sewer Line Exten. to serve 5900 to 6100 Block of Wilkinson Blvd G 700,000 0 0 0 0 0 0 700,000 0 0 0 0
59 Sewer Lining Projects RR 2,000,000 0 200,000 200,000 200,000 200,000 200,000 200,000 200,000 200,000 200,000 200,000
60 Highland Branch O/F Rehab RR 0 0 0 0 0 0 0 0 0 0 0 0
61 Highland Branch O/F Full Rehab - Phase II RR 2,500,000 0 0 436,200 315,425 300,000 600,000 400,000 448,375 0 0 0
62 Union Road - Sewer Collapsing RR 500,000 0 0 0 250,000 250,000 0 0 0 0 0 0
63 Baltimore Basin Find & Fix RR 1,250,000 0 0 0 0 0 0 0 0 750,000 500,000 0
64 Long Creek Outfall Rehab/Lining RR 1,250,000 0 0 0 0 0 0 750,000 500,000 0 0 0
65 Flow Study (will know when needed by March 2018) RR 100,000 0 0 0 100,000 0 0 0 0 0 0 0
66 Heatherloch O/F Manhole RR 400,000 0 0 0 200,000 0 0 0 200,000 0 0 0
67 Cramerton Town Center Area RR 0 0 0 0 0 0 0 0 0 0 0 0
68 Riverside Community RR 0 0 0 0 0 0 0 0 0 0 0 0
69 Clyde, Wood and Gilmer Sanitary Sewer Relocation RR 0 0 0 0 0 0 0 0 0 0 0 0
70 Old Town Area (Collapsing pipes under houses) RR 0 0 0 0 0 0 0 0 0 0 0 0
71 Woodlawn Area (Collapsing pipes under houses) RR 0 0 0 0 0 0 0 0 0 0 0 0
72 Subtotal 14,441,950$ 0$ 550,000$ 1,488,650$ 1,707,925$ 1,244,000$ 1,673,000$ 3,030,000$ 2,298,375$ 1,150,000$ 900,000$ 400,000$
SPECIAL ASSESSMENTS - SEWER
73 Eaglebrook and Kendrick (CWIP - $141,756 City Portion) G 141,756$
74 SCADA REPLACEMENT RR 0$ 0$ 0$ 0$ 0$ 0$ 0$ 0$ 0$ 0$ 0$ 0$
Page 5 of 25 4/7/2021Willdan Financial Services

Exhibit 2
System Development Fee Analysis
Current Capital Improvement Program for FY 2021 - FY 2031
Water & Wastewater Systems
Line Description Total 2021 2022 2023 2024 2025 2026 2027 2028 2029 2030 2031
Project
Type
For Fiscal Years Ending June 30,
PUMP STATION/FORCE MAIN IMPROVEMENTS RR
75 Duhart Force Main RR 0$ 0$ 0$ 0$ 0$ 0$ 0$ 0$ 0$ 0$ 0$ 0$
76 Eagle Road Sanitary Sewer Improvements RR 200,000 0 200,000 0 0 0 0 0 0 0 0 0
77 Integrated Wastewater Collection Pump Station Controller Pilot RR 57,500 0 57,500 0 0 0 0 0 0 0 0 0
78 Integrate Verbatim Polling Checks into SCADA OU 16,600 0 16,600 0 0 0 0 0 0 0 0 0
79 Soft Dig Utility Relocates RR 0 0 0 0 0 0 0 0 0 0 0 0
80 Grove Street Pump Station RR 110,000 0 0 0 0 0 0 0 110,000 0 0 0
81 Beaty Road Pump Station Upgrade RR 2,000,000 0 2,000,000 0 0 0 0 0 0 0 0 0
82 Beaty Road Pump Station Relocation ($8,500,000) RR 0 0 0 0 0 0 0 0 0 0 0 0
83 WAN Communication Reliability to Pump Stations RR 485,200 0 0 485,200 0 0 0 0 0 0 0 0
84 Catawba & Duhart HMI Improvements RR 268,000 0 268,000 0 0 0 0 0 0 0 0 0
85 Eagle Road WWTP Flood Protection RR 2,000,000 0 0 0 500,000 500,000 500,000 500,000 0 0 0 0
86 Baltimore Basin FM & PS Upgrade (Don’t include) 0 0 0 0 0 0 0 0 0 0 0 0
87 Cramerton Town Hall Pump Station Improvements RR 0 0 0 0 0 0 0 0 0 0 0 0
88 Lakewood Pump Station Relocation RR 0 0 0 0 0 0 0 0 0 0 0 0
89 Lakewood Road Forcemain RR 0 0 0 0 0 0 0 0 0 0 0 0
90 Subtotal 5,137,300$ 0$ 2,542,100$ 485,200$ 500,000$ 500,000$ 500,000$ 500,000$ 110,000$ 0$ 0$ 0$
LONG CREEK WWTP IMPROVEMENTS RR
91 Long Creek WWTP Phase II - Plant Sewer RR 311,200$ 0$ 0$ 0$ 0$ 0$ 0$ 0$ 311,200$ 0$ 0$ 0$
92 Long Creek WWTP Phase III - Plant Sewer RR 107,600 0 0 0 0 0 0 0 107,600 0 0 0
93 Long Creek Outfall Rehab RR 0 0 0 0 0 0 0 0 0 0 0 0
94 Long Creek HMI Replacement RR 0 0 0 0 0 0 0 0 0 0 0 0
95 Long Creek Control Network- Design RR 0 0 0 0 0 0 0 0 0 0 0 0
96 Long Creek Control Network- Construction RR 451,000 0 0 451,000 0 0 0 0 0 0 0 0
97 Long Creek WWTP Digester Repairs/Maintenance -past 10 yrs RR 0 0 0 0 0 0 0 0 0 0 0 0
98 Long Creek Electrical System/Upgrade Transformer- past 10 yrs RR 0 0 0 0 0 0 0 0 0 0 0 0
99 Long Creek Clarifier Rehab RR 335,000 0 335,000 0 0 0 0 0 0 0 0 0
100 Subtotal 1,204,800$ 0$ 335,000$ 451,000$ 0$ 0$ 0$ 0$ 418,800$ 0$ 0$ 0$
WATER IMPROVEMENTS (NCDOT CONFLICTS)
101 I-85/321 Interchange (I-5000) - Utility Conflicts (Water) RR 125,000$ 0$ 0$ 125,000$ 0$ 0$ 0$ 0$ 0$ 0$ 0$ 0$
102 Dallas-Cherryville Hwy 279 widening utility conflicts RR 0$ 0 0 0 0 0 0 0 0 0 0 0
103 Subtotal 125,000$ 0$ 0$ 125,000$ 0$ 0$ 0$ 0$ 0$ 0$ 0$ 0$
WATER DISTRIBUTION IMPROVEMENTS
104 Washington Street (Collapsing pipes under houses) RR 600,000$ 0$ 0$ 0$ 0$ 0$ 0$ 0$ 0$ 0$ 0$ 600,000$
105 10" Waterline behind 212 W. Main Avenue RR 150,000 0 0 0 0 0 0 0 0 0 0 150,000
106 1619 Ridgewood Drive RR 75,500 0 0 0 0 0 0 0 0 0 0 75,500
107 338 Rosemary RR 59,000 0 0 0 0 0 0 0 0 0 0 59,000
108 WL Improvements (Highland to Cramerton) RR 208,000 0 0 0 0 0 0 0 0 0 0 208,000
109 Potable Water Line to Long Creek RR 600,000 0 0 0 0 0 600,000 0 0 0 0 0
110 Water Distribution RTU Pilot Project RR 95,700 0 95,700 0 0 0 0 0 0 0 0 0
Bessemer City Booster Station (CWIP) RR
111 City Match (CWIP) RR 0 0 0 0 0 0 0 0 0 0 0 0
112 Gaston County RR 0 0 0 0 0 0 0 0 0 0 0 0
113 Bessemer City RR 0 0 0 0 0 0 0 0 0 0 0 0
Page 6 of 25 4/7/2021Willdan Financial Services

Exhibit 2
System Development Fee Analysis
Current Capital Improvement Program for FY 2021 - FY 2031
Water & Wastewater Systems
Line Description Total 2021 2022 2023 2024 2025 2026 2027 2028 2029 2030 2031
Project
Type
For Fiscal Years Ending June 30,
114 Line Stop (Isolation) 0 0 0 0 0 0 0 0 0 0 0 0
115 Rhyne Carter at Brookside School ($270K) RR 270,000 0 0 0 0 0 0 0 270,000 0 0 0
116 Water Line Loop–West Hudson Blvd from US321 to Clyde Street 155,000 0 0 0 0 0 155,000 0 0 0 0 0
117 Water Line Loop–East Hudson Blvd from Efird St to Neal Hawkins Rd 153,600 0 0 0 0 153,600 0 0 0 0 0 0
118 Water Line Loop – Clyde St from end of line to Hudson Blvd RR 153,600 0 0 0 0 153,600 0 0 0 0 0 0
119 Stowe Rd (New Hope to Winder Trail) RR 150,000 0 0 0 0 150,000 0 0 0 0 0 0
120 Water line extension for back feed to Town of Ranlo RR 633,600 0 0 0 0 0 0 0 0 0 633,600 0
121 Back Feed to Clover (Past 10 years) G 0 0 0 0 0 0 0 0 0 0 0 0
122 Little Mountain Rd to Robinson Rd (page 10 years) RR 0 0 0 0 0 0 0 0 0 0 0 0
123 Amber Crest Drive RR 75,000 0 0 0 0 75,000 0 0 0 0 0 0
124 Valve Evaluation and Replacement-Franklin Blvd RR 600,000 0 600,000 0 0 0 0 0 0 0 0 0
125 Upgrade 16" AC to 24" Franklin (Outside 10 years) 0 0 0 0 0 0 0 0 0 0 0 0
126 Upgrade 16" AC to 24" - Redbud to Cramer. (Outside 10 years) 0 0 0 0 0 0 0 0 0 0 0 0
127 Upgrade 16" AC to 24" (Westover to Market St) RR 0 0 0 0 0 0 0 0 0 0 0 0
128 Goodwill Village WL RR 400,000 0 0 0 0 0 0 0 0 0 0 400,000
129 12" on Ozark (I-85 to New Hope) RR 400,000 0 0 0 0 0 0 0 0 0 0 400,000
130 Gaston Day School Rd (Union to Hearthstone) RR 500,000 0 0 0 0 0 0 0 0 0 0 500,000
131 Town Center Water Connection RR 276,800 0 0 0 0 276,800 0 0 0 0 0 0
132 Cramer Mountain Rd Waterline Installation G 76,000 0 0 0 0 76,000 0 0 0 0 0 0
133 Park Street Waterline Replacement RR 1,290,000 0 0 0 0 0 0 0 0 0 645,000 645,000
134 Lakewood Drive Water Connection G 10,000 0 0 0 0 10,000 0 0 0 0 0 0
135 Beaty Rd WL Loop (Pine to Kendrick) RR 270,000 0 0 0 0 0 0 0 0 270,000 0 0
136 Old Dallas to Rankin Lake RR 0 0 0 0 0 0 0 0 0 0 0 0
137 Shannon Bradley Road RR 0 0 0 0 0 0 0 0 0 0 0 0
138 Washington St WL Rehabilitation RR 0 0 0 0 0 0 0 0 0 0 0 0
139 Hydraulic Loop-S. New Hope Rd RR 0 0 0 0 0 0 0 0 0 0 0 0
140 Water Service for Hamrick Rd RR 0 0 0 0 0 0 0 0 0 0 0 0
141 Cramerton Village Water System Conversion G 0 0 0 0 0 0 0 0 0 0 0 0
142 NE Loop Robinson Clemmer RR 0 0 0 0 0 0 0 0 0 0 0 0
143 Bridge on South Fork RR 1,000,000 0 0 1,000,000 0 0 0 0 0 0 0 0
144 Subtotal 8,201,800$ 0$ 695,700$ 1,000,000$ 0$ 895,000$ 755,000$ 0$ 270,000$ 270,000$ 1,278,600$ 3,037,500$
WATER SUPPLY/TREATMENT IMPROVEMENTS 0
145 Crowders Mountain Pump Station Improvements RR/OU 60,000$ 0$ 0$ 0$ 0$ 60,000$ 0$ 0$ 0$ 0$ 0$ 0$
146 Raw Water System Monitoring Improvements RR 0 0 0 0 0 0 0 0 0 0 0 0
147 Raw Water Pumping Improvements RR 0 0 0 0 0 0 0 0 0 0 0 0
148 Replace Raw Water Line from Long Creek to Rankin Lake 15,000,000 0 0 0 0 0 0 0 0 0 15,000,000 0
149 ARV-Mtn Island to Long Creek Interconnect RR 250,000 0 0 0 0 250,000 0 0 0 0 0 0
150 By Pass Valves at Rankin Lake RR 100,000 0 0 0 0 100,000 0 0 0 0 0 0
151 ARV-Rankin Lake to WTP RR 250,000 0 0 0 0 250,000 0 0 0 0 0 0
152 Rankin Lake Raw Water Main Bypass RR 750,000 0 0 0 750,000 0 0 0 0 0 0 0
153 Water Loss Audit RR 125,000 0 0 0 0 125,000 0 0 0 0 0 0
154 Water Model Update RR 250,000 0 0 0 250,000 0 0 0 0 0 0 0
155 Rankin Lake 36" Valve Refurbishment RR 350,000 0 0 0 350,000 0 0 0 0 0 0 0
156 Relocation of Chlorine Feed Points RR 185,000 0 0 0 185,000 0 0 0 0 0 0 0
157 SPECIAL ASSESSMENTS - WATER RR 230,000 0 0 0 0 20,000 20,000 20,000 20,000 50,000 50,000 50,000
158 Subtotal 17,550,000$ 0$ 0$ 0$ 1,535,000$ 805,000$ 20,000$ 20,000$ 20,000$ 50,000$ 15,050,000$ 50,000$
CWIP Project (Water Treatment)
159 Water Treatment Plant Renovation Project 65,488,872$
Page 7 of 25 4/7/2021Willdan Financial Services
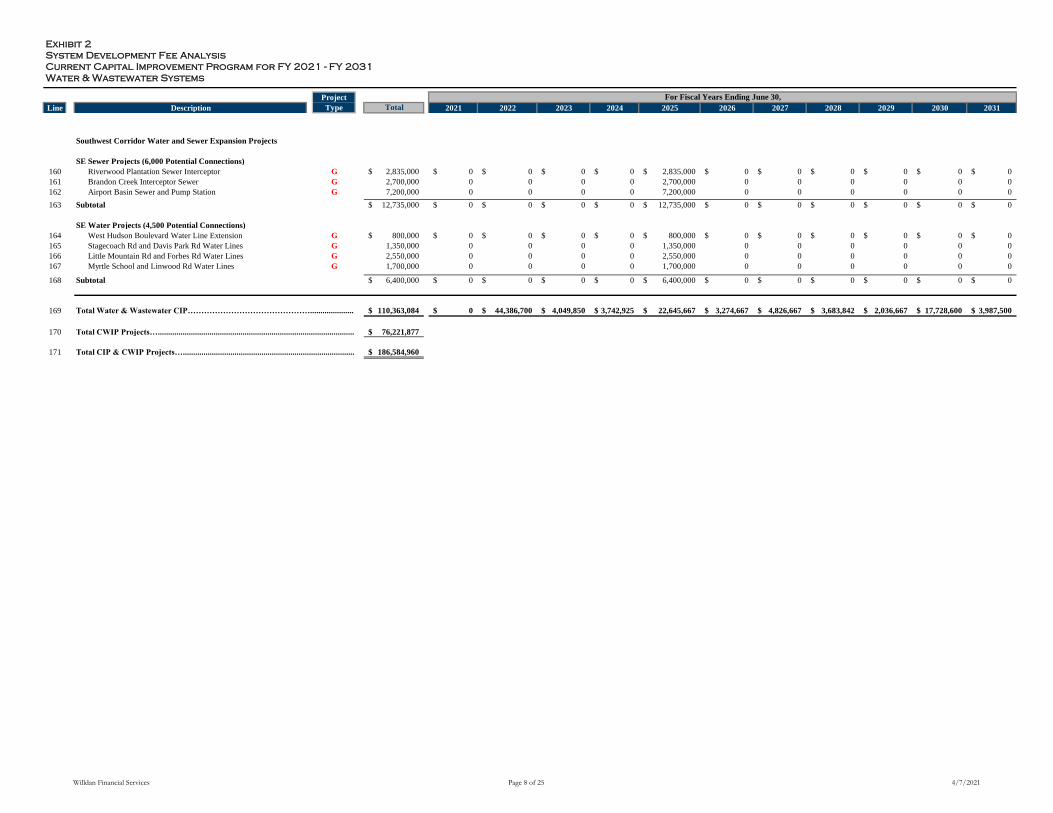
Exhibit 2
System Development Fee Analysis
Current Capital Improvement Program for FY 2021 - FY 2031
Water & Wastewater Systems
Line Description Total 2021 2022 2023 2024 2025 2026 2027 2028 2029 2030 2031
Project
Type
For Fiscal Years Ending June 30,
Southwest Corridor Water and Sewer Expansion Projects
SE Sewer Projects (6,000 Potential Connections)
160 Riverwood Plantation Sewer Interceptor G 2,835,000$ 0$ 0$ 0$ 0$ 2,835,000$ 0$ 0$ 0$ 0$ 0$ 0$
161 Brandon Creek Interceptor Sewer G 2,700,000 0 0 0 0 2,700,000 0 0 0 0 0 0
162 Airport Basin Sewer and Pump Station G 7,200,000 0 0 0 0 7,200,000 0 0 0 0 0 0
163 Subtotal 12,735,000$ 0$ 0$ 0$ 0$ 12,735,000$ 0$ 0$ 0$ 0$ 0$ 0$
SE Water Projects (4,500 Potential Connections)
164 West Hudson Boulevard Water Line Extension G 800,000$ 0$ 0$ 0$ 0$ 800,000$ 0$ 0$ 0$ 0$ 0$ 0$
165 Stagecoach Rd and Davis Park Rd Water Lines G 1,350,000 0 0 0 0 1,350,000 0 0 0 0 0 0
166 Little Mountain Rd and Forbes Rd Water Lines G 2,550,000 0 0 0 0 2,550,000 0 0 0 0 0 0
167 Myrtle School and Linwood Rd Water Lines G 1,700,000 0 0 0 0 1,700,000 0 0 0 0 0 0
168 Subtotal 6,400,000$ 0$ 0$ 0$ 0$ 6,400,000$ 0$ 0$ 0$ 0$ 0$ 0$
169 Total Water & Wastewater CIP………………………………………............................................110,363,084$ 0$ 44,386,700$ 4,049,850$ 3,742,925$ 22,645,667$ 3,274,667$ 4,826,667$ 3,683,842$ 2,036,667$ 17,728,600$ 3,987,500$
170 Total CWIP Projects…............................................................................................................76,221,877$
171 Total CIP & CWIP Projects…..............................................................................................................186,584,960$
Page 8 of 25 4/7/2021Willdan Financial Services

Exhibit 3
System Development Fee Analysis
Allocation of Capital Improvements Program
Water and Wastewater Systems
Growth
Line Description Total Related [1] Water Wastewater Water Wastewater Transmission Treatment Transmission Treatment
1 MUNICIPAL OPERATIONS CENTER . 0$ 100% 50% 50% 0$ 0$ 0$ 0$ 0$ 0$
ECONOMIC DEVELOPMENT .
2 Initial Studies for Technology Park . 333,333$ 100% 50% 50% 166,667$ 166,667$ 166,667$ 0$ 166,667$ 0$
3 Southwest Sewer Modelling (Casino) . 0 100% 50% 50% 0 0 0 0 0 0
4 Main Ave Sewer Lining from Trenton to Chester . 0 100% 50% 50% 0 0 0 0 0 0
5 Subtotal . 333,333$ 166,667$ 166,667$ 166,667$ 0$ 166,667$ 0$
REGIONALIZATION .
6 Dallas Sewer Connection ($495,000 CWIP Gastonia Portion) . 0$ 0% 0% 100% 0 0 0 0 0 0
7 Cramerton System . 0 100% 0% 100% 0 0 0 0 0 0
8 Subtotal . 0$ 0$ 0$ 0$ 0$ 0$ 0$
WWTP IMPROVEMENTS (CROWDERS CREEK) .
9 HMI Replacement Crowders Creek . 0$ 0% 0% 100% 0$ 0$ 0$ 0$ 0$ 0$
10 Process Automation Improvements Crowders Creek . 373,900 0% 0% 100% 0 0 0 0 0 0
11 Crowders Creek WWTP Digester Repairs/Maintenance . 2,500,000 0% 0% 100% 0 0 0 0 0 0
12 Replacement Bar Screens 710,000 0% 0% 100% 0 0 0 0 0 0
13 Crowders Creek WWTP Influent Sewer Replacement . 450,000 0% 0% 100% 0 0 0 0 0 0
14 Subtotal . 4,033,900$ 0$ 0$ 0$ 0$ 0$ 0$
SOUTHEAST SEWER EXPANSION(2)
PHASE I .
15 Armstrong Ford PS & FM & Armstrong Ford Gravity Sewer AND Baltimore Part II Gravity Sewer. 5,800,000$ 0% 0% 100% 0$ 0$ 0$ 0$ 0$ 0$
16 Armstrong Ford Regional Pump Station (Contract #6) . 6,100,000 100% 0% 100% 0 6,100,000 0 0 6,100,000 0
17 Construction Observation & Administration . 940,000 100% 0% 100% 0 940,000 0 0 940,000 0
PHASE II .
18 SE PS & FM (Line 4) & Union New Hope Road Waterline . 8,700,000 0% 0% 100% 0 0 0 0 0 0
19 Catawba Creek Outfall Part I (Line 5 thru #526, Line 6) . 4,500,000 100% 0% 100% 0 4,500,000 0 0 4,500,000 0
20 Catawba Creek Outfall Part II (Line 5 from #526, Line 5a) . 6,900,000 100% 0% 100% 0 6,900,000 0 0 6,900,000 0
21 Southeast Regional Pump Station (Contract #7) . 5,200,000 100% 0% 100% 0 5,200,000 0 0 5,200,000 0
22 Construction Observation & Administration . 1,300,000 100% 0% 100% 0 1,300,000 0 0 1,300,000 0
23 Subtotal . 39,440,000$ 0$ 24,940,000$ 0$ 0$ 24,940,000$ 0$
CWIP Projects (SE Sewer Expansion Related-Collection)
24 Right of Way Easements (SE Sewer) (CWIP) 1,500,000$ 100% 0% 100% 0$ 1,500,000$ 0$ 0$ 1,500,000$ 0$
25 Permitting (CWIP) 400,000$ 100% 0% 100% 0$ 400,000$ 0$ 0$ 400,000$ 0$
26 Southeast Sewer Expansion 4,470,443$ 100% 0% 100% 0$ 4,470,443$ 0$ 0$ 4,470,443$ 0$
27 South Fork River Crossing 2,205,182$ 100% 0% 100% 0$ 2,205,182$ 0$ 0$ 2,205,182$ 0$
28 Baltimore Sewer Ferc Crossing 2,015,624$ 100% 0% 100% 0$ 2,015,624$ 0$ 0$ 2,015,624$ 0$
29 Subtotal 10,591,248$ 0$ 10,591,249$ 0$ 0$ 10,591,249$ 0$
30 Total Southeasst Sewer Expansion Costs 50,031,248$ 0$ 35,531,249$ 0$ 0$ 35,531,249$ 0$
SEWER IMPROVEMENTS (NCDOT CONFLICTS) .
31 South New Hope Road Sewer Improvements . 260,000$ 0% 0% 100% 0$ 0$ 0$ 0$ 0$ 0$
32 I-85/321 Interchange (I-5000) - Utility Conflicts (Sewer) . 500,000 0% 0% 100% 0 0 0 0 0 0
33 Subtotal . 760,000$ 0$ 0$ 0$ 0$ 0$ 0$
% Allocation $ Allocation Water Wastewater
Willdan Financial Services Page 9 of 25 4/7/2021

Exhibit 3
System Development Fee Analysis
Allocation of Capital Improvements Program
Water and Wastewater Systems
Growth
Line Description Total Related [1] Water Wastewater Water Wastewater Transmission Treatment Transmission Treatment
% Allocation $ Allocation Water Wastewater
SOUTHEAST WATER EXPANSION .
PHASE II .
34 Developer Refunds . 0$ 100% 100% 0% 0$ 0$ 0$ 0$ 0$ 0$
35 Right of Way Easements (SE Sewer) . 0 100% 0% 100% 0 0 0 0 0 0
36 Permitting . 0 100% 100% 0% 0 0 0 0 0 0
37 Construct Future Support Lines when SE Area is close to buildout. 0 0% 100% 0% 0 0 0 0 0 0
38 Subtotal . 0$ 0$ 0$ 0$ 0$ 0$ 0$
COLLEC. SYSTEM IMPROVEMENTS (OUTFALL LINES)
39 Berkley Forest Mobile Home Park Extension . 30,000$ 0% 0% 100% 0$ 0$ 0$ 0$ 0$ 0$
40 Sewer Pier Failures . 2,000,000 0% 0% 100% 0 0 0 0 0 0
41 Bradley . 169,950 0% 0% 100% 0 0 0 0 0 0
42 Bridgewood Lane . 170,000 0% 0% 100% 0 0 0 0 0 0
43 Modena Outfall Exposed Pipes . 170,000 0% 0% 100% 0 0 0 0 0 0
44 Siegle Street . 138,000 0% 0% 100% 0 0 0 0 0 0
45 Dixie Street (#2) . 138,000 0% 0% 100% 0 0 0 0 0 0
46 Firestone Avenue Waterline Crossing . 60,000 0% 0% 100% 0 0 0 0 0 0
47 Oakland Street Crossing and Line Repair . 228,000 0% 0% 100% 0 0 0 0 0 0
48 Bessemer City Road . 96,000 0% 0% 100% 0 0 0 0 0 0
49 Remount Road (Resurfacing) . 0 0% 0% 100% 0 0 0 0 0 0
50 Firestone Outfall I&I . 0 0% 0% 100% 0 0 0 0 0 0
51 Firestone Outfall Study . 150,000 0% 0% 100% 0 0 0 0 0 0
52 Firestone Lower Basin I & I . 445,000 0% 0% 100% 0 0 0 0 0 0
53 Trenton Street Service Reversals . 12,500 0% 0% 100% 0 0 0 0 0 0
54 Parallel Line-LARGE (Firestone Interceptor) . 1,500,000 0% 0% 100% 0 0 0 0 0 0
55 Firestone Upper Basin I&I (Manholes) . 300,000 0% 0% 100% 0 0 0 0 0 0
56 1619 Ridgewood Drive (X675086) . 75,500 0% 0% 100% 0 0 0 0 0 0
57 338 Rosemary (X675088) . 59,000 0% 0% 100% 0 0 0 0 0 0
58 Sewer Line Exten. to serve 5900 to 6100 Block of Wilkinson Blvd. 700,000 100% 0% 100% 0 700,000 0 0 700,000 0
59 Sewer Lining Projects . 2,000,000 0% 0% 100% 0 0 0 0 0 0
60 Highland Branch O/F Rehab . 0 0% 0% 100% 0 0 0 0 0 0
61 Highland Branch O/F Full Rehab - Phase II . 2,500,000 0% 0% 100% 0 0 0 0 0 0
62 Union Road - Sewer Collapsing . 500,000 0% 0% 100% 0 0 0 0 0 0
63 Baltimore Basin Find & Fix . 1,250,000 0% 0% 100% 0 0 0 0 0 0
64 Long Creek Outfall Rehab/Lining . 1,250,000 0% 0% 100% 0 0 0 0 0 0
65 Flow Study (will know when needed by March 2018) . 100,000 0% 0% 100% 0 0 0 0 0 0
66 Heatherloch O/F Manhole . 400,000 0% 0% 100% 0 0 0 0 0 0
67 Cramerton Town Center Area . 0 0% 0% 100% 0 0 0 0 0 0
68 Riverside Community . 0 0% 0% 100% 0 0 0 0 0 0
69 Clyde, Wood and Gilmer Sanitary Sewer Relocation . 0 0% 0% 100% 0 0 0 0 0 0
70 Old Town Area (Collapsing pipes under houses) . 0 0% 0% 100% 0 0 0 0 0 0
71 Woodlawn Area (Collapsing pipes under houses) . 0 0% 0% 100% 0 0 0 0 0 0
72 Subtotal . 14,441,950$ 0$ 700,000$ 0$ 0$ 700,000$ 0$
Willdan Financial Services Page 10 of 25 4/7/2021

Exhibit 3
System Development Fee Analysis
Allocation of Capital Improvements Program
Water and Wastewater Systems
Growth
Line Description Total Related [1] Water Wastewater Water Wastewater Transmission Treatment Transmission Treatment
% Allocation $ Allocation Water Wastewater
73 SPECIAL ASSESSMENTS - SEWER . . . . . . . . . . . . . . .
74 Eaglebrook and Kendrick (CWIP - $141,756 City Portion) . 141,756 100% 0% 100% 0 141,756 0 0 141,756 0
75 SCADA REPLACEMENT . 0 0% 0% 100% 0 0 0 0 0 0
PUMP STATION/FORCE MAIN IMPROVEMENTS .
76 Duhart Force Main . 0$ 0% 0% 100% 0$ 0$ 0$ 0$ 0$ 0$
77 Eagle Road Sanitary Sewer Improvements . 200,000 0% 0% 100% 0 0 0 0 0 0
78 Integrated Wastewater Collection Pump Station Controller Pilot . 57,500 0% 0% 100% 0 0 0 0 0 0
79 Integrate Verbatim Polling Checks into SCADA . 16,600 0% 0% 100% 0 0 0 0 0 0
80 Soft Dig Utility Relocates . 0 0% 0% 100% 0 0 0 0 0 0
81 Grove Street Pump Station . 110,000 0% 0% 100% 0 0 0 0 0 0
82 Beaty Road Pump Station Upgrade . 2,000,000 0% 0% 100% 0 0 0 0 0 0
83 Beaty Road Pump Station Relocation ($8,500,000) . 0 0% 0% 100% 0 0 0 0 0 0
84 WAN Communication Reliability to Pump Stations . 485,200 0% 0% 100% 0 0 0 0 0 0
85 Catawba & Duhart HMI Improvements . 268,000 0% 0% 100% 0 0 0 0 0 0
86 Eagle Road WWTP Flood Protection . 2,000,000 0% 0% 100% 0 0 0 0 0 0
87 Baltimore Basin FM & PS Upgrade (Don’t include) . 0 0% 0% 100% 0 0 0 0 0 0
88 Cramerton Town Hall Pump Station Improvements . 0 0% 0% 100% 0 0 0 0 0 0
89 Lakewood Pump Station Relocation . 0 0% 0% 100% 0 0 0 0 0 0
90 Lakewood Road Forcemain . 0 0% 0% 100% 0 0 0 0 0 0
91 Subtotal . 5,137,300$ 0$ 0$ 0$ 0$ 0$ 0$
LONG CREEK WWTP IMPROVEMENTS .
92 Long Creek WWTP Phase II - Plant Sewer . 311,200$ 0% 0% 100% 0$ 0$ 0$ 0$ 0$ 0$
93 Long Creek WWTP Phase III - Plant Sewer . 107,600 0% 0% 100% 0 0 0 0 0 0
94 Long Creek Outfall Rehab . 0 0% 0% 100% 0 0 0 0 0 0
95 Long Creek HMI Replacement . 0 0% 0% 100% 0 0 0 0 0 0
96 Long Creek Control Network- Design . 0 0% 0% 100% 0 0 0 0 0 0
97 Long Creek Control Network- Construction . 451,000 0% 0% 100% 0 0 0 0 0 0
98 Long Creek WWTP Digester Repairs/Maintenance -past 10 yrs . 0 0% 0% 100% 0 0 0 0 0 0
99 Long Creek Electrical System/Upgrade Transformer- past 10 yrs . 0 0% 0% 100% 0 0 0 0 0 0
100 Long Creek Clarifier Rehab . 335,000 0% 0% 100% 0 0 0 0 0 0
101 Subtotal . 1,204,800$ 0$ 0$ 0$ 0$ 0$ 0$
WATER IMPROVEMENTS (NCDOT CONFLICTS) .
102 I-85/321 Interchange (I-5000) - Utility Conflicts (Water) . 125,000$ 0% 100% 0% 0$ 0$ 0$ 0$ 0$ 0$
103 Dallas-Cherryville Hwy 279 widening utility conflicts . 0 0% 100% 0% 0 0 0 0 0 0
104 Subtotal . 125,000$ 0$ 0$ 0$ 0$ 0$ 0$
Willdan Financial Services Page 11 of 25 4/7/2021

Exhibit 3
System Development Fee Analysis
Allocation of Capital Improvements Program
Water and Wastewater Systems
Growth
Line Description Total Related [1] Water Wastewater Water Wastewater Transmission Treatment Transmission Treatment
% Allocation $ Allocation Water Wastewater
WATER DISTRIBUTION IMPROVEMENTS .
105 Washington Street (Collapsing pipes under houses) . 600,000$ 0% 100% 0% 0$ 0$ 0$ 0$ 0$ 0$
106 10" Waterline behind 212 W. Main Avenue . 150,000 0% 100% 0% 0 0 0 0 0 0
107 1619 Ridgewood Drive . 75,500 0% 100% 0% 0 0 0 0 0 0
108 338 Rosemary . 59,000 0% 100% 0% 0 0 0 0 0 0
109 WL Improvements (Highland to Cramerton) . 208,000 0% 100% 0% 0 0 0 0 0 0
110 Potable Water Line to Long Creek . 600,000 0% 100% 0% 0 0 0 0 0 0
111 Water Distribution RTU Pilot Project . 95,700 0% 100% 0% 0 0 0 0 0 0
112 Bessemer City Booster Station (CWIP) . 0 0% 100% 0% 0 0 0 0 0 0
113 City Match (CWIP) . 0 0% 100% 0% 0 0 0 0 0 0
114 Gaston County . 0 0% 100% 0% 0 0 0 0 0 0
115 Bessemer City . 0 0% 100% 0% 0 0 0 0 0 0
116 Line Stop (Isolation) . 0 0% 100% 0% 0 0 0 0 0 0
117 Rhyne Carter at Brookside School ($270K) . 270,000 0% 100% 0% 0 0 0 0 0 0
118 Water Line Loop–West Hudson Blvd from US321 to Clyde Street. 155,000 0% 100% 0% 0 0 0 0 0 0
119 Water Line Loop–East Hudson Blvd from Efird St to Neal Hawkins Rd. 153,600 0% 100% 0% 0 0 0 0 0 0
120 Water Line Loop – Clyde St from end of line to Hudson Blvd . 153,600 0% 100% 0% 0 0 0 0 0 0
121 Stowe Rd (New Hope to Winder Trail) . 150,000 0% 100% 0% 0 0 0 0 0 0
122 Water line extension for back feed to Town of Ranlo . 633,600 0% 100% 0% 0 0 0 0 0 0
123 Back Feed to Clover (Past 10 years) . 0 100% 100% 0% 0 0 0 0 0 0
124 Little Mountain Rd to Robinson Rd (page 10 years) . 0 0% 100% 0% 0 0 0 0 0 0
125 Amber Crest Drive . 75,000 0% 100% 0% 0 0 0 0 0 0
126 Valve Evaluation and Replacement-Franklin Blvd . 600,000 0% 100% 0% 0 0 0 0 0 0
127 Upgrade 16" AC to 24" Franklin (Outside 10 years) . 0 0% 100% 0% 0 0 0 0 0 0
128 Upgrade 16" AC to 24" - Redbud to Cramer. (Outside 10 years) . 0 0% 100% 0% 0 0 0 0 0 0
129 Upgrade 16" AC to 24" (Westover to Market St) . 0 0% 100% 0% 0 0 0 0 0 0
130 Goodwill Village WL . 400,000 0% 100% 0% 0 0 0 0 0 0
131 12" on Ozark (I-85 to New Hope) . 400,000 0% 100% 0% 0 0 0 0 0 0
132 Gaston Day School Rd (Union to Hearthstone) . 500,000 0% 100% 0% 0 0 0 0 0 0
133 Town Center Water Connection . 276,800 0% 100% 0% 0 0 0 0 0 0
134 Cramer Mountain Rd Waterline Installation . 76,000 100% 100% 0% 76,000 0 76,000 0 0 0
135 Park Street Waterline Replacement . 1,290,000 0% 100% 0% 0 0 0 0 0 0
136 Lakewood Drive Water Connection . 10,000 100% 100% 0% 10,000 0 10,000 0 0 0
137 Beaty Rd WL Loop (Pine to Kendrick) . 270,000 0% 100% 0% 0 0 0 0 0 0
138 Old Dallas to Rankin Lake . 0 0% 100% 0% 0 0 0 0 0 0
139 Shannon Bradley Road . 0 0% 100% 0% 0 0 0 0 0 0
140 Washington St WL Rehabilitation . 0 0% 100% 0% 0 0 0 0 0 0
141 Hydraulic Loop-S. New Hope Rd . 0 0% 100% 0% 0 0 0 0 0 0
142 Water Service for Hamrick Rd . 0 0% 100% 0% 0 0 0 0 0 0
143 Cramerton Village Water System Conversion . 0 100% 100% 0% 0 0 0 0 0 0
144 NE Loop Robinson Clemmer . 0 0% 100% 0% 0 0 0 0 0 0
145 Bridge on South Fork . 1,000,000 0% 100% 0% 0 0 0 0 0 0
146 Subtotal . 8,201,800$ 86,000$ 0$ 86,000$ 0$ 0$ 0$
Willdan Financial Services Page 12 of 25 4/7/2021

Exhibit 3
System Development Fee Analysis
Allocation of Capital Improvements Program
Water and Wastewater Systems
Growth
Line Description Total Related [1] Water Wastewater Water Wastewater Transmission Treatment Transmission Treatment
% Allocation $ Allocation Water Wastewater
WATER SUPPLY/TREATMENT IMPROVEMENTS .
147 Crowders Mountain Pump Station Improvements . 60,000$ 0% 100% 0% 0$ 0$ 0$ 0$ 0$ 0$
148 Raw Water System Monitoring Improvements . 0 0% 100% 0% 0 0 0 0 0 0
149 Raw Water Pumping Improvements . 0 0% 100% 0% 0 0 0 0 0 0
150 Replace Raw Water Line from Long Creek to Rankin Lake . 15,000,000 0% 100% 0% 0 0 0 0 0 0
151 ARV-Mtn Island to Long Creek Interconnect . 250,000 0% 100% 0% 0 0 0 0 0 0
152 By Pass Valves at Rankin Lake . 100,000 0% 100% 0% 0 0 0 0 0 0
153 ARV-Rankin Lake to WTP . 250,000 0% 100% 0% 0 0 0 0 0 0
154 Rankin Lake Raw Water Main Bypass . 750,000 0% 100% 0% 0 0 0 0 0 0
155 Water Loss Audit . 125,000 0% 100% 0% 0 0 0 0 0 0
156 Water Model Update . 250,000 0% 100% 0% 0 0 0 0 0 0
157 Rankin Lake 36" Valve Refurbishment . 350,000 0% 100% 0% 0 0 0 0 0 0
158 Relocation of Chlorine Feed Points . 185,000 0% 100% 0% 0 0 0 0 0 0
159 SPECIAL ASSESSMENTS - WATER . 230,000 0% 100% 0% 0 0 0 0 0 0
160 Subtotal . 17,550,000$ 0$ 0$ 0$ 0$ 0$ 0$
CWIP Project (Water Treatment)
161 Water Treatment Plant Renovation Project 65,488,872$ 100% 100% 0% 65,488,872$ 0$ 0$ 65,488,872$ 0$ 0$
SW Water Projects
162 West Hudson Boulevard Water Line Extension 800,000$ 100% 100% 0% 800,000$ 0$ 800,000$ 0$ 0$ 0$
163 Stagecoach Rd and Davis Park Rd Water Lines 1,350,000 100% 100% 0% 1,350,000 0 1,350,000 0 0 0
164 Little Mountain Rd and Forbes Rd Water Lines 2,550,000 100% 100% 0% 2,550,000 0 2,550,000 0 0 0
165 Myrtle School and Linwood Rd Water Lines 1,700,000 100% 100% 0% 1,700,000 0 1,700,000 0 0 0
166 Subtotal 6,400,000$ 6,400,000$ 0$ 6,400,000$ 0$ 0$ 0$
Southwest Corridor Sewer Expansion Projects (6,000 Potential Connections)
167 Riverwood Plantation Sewer Interceptor 2,835,000$ 100% 0% 100% 0$ 2,835,000$ 0$ 0$ 2,835,000$ 0$
168 Brandon Creek Interceptor Sewer 2,700,000 100% 0% 100% 0 2,700,000 0 0 2,700,000 0
169 Airport Basin Sewer and Pump Station 7,200,000 100% 0% 100% 0 7,200,000 0 0 7,200,000 0
170 Total 12,735,000$ 0$ 12,735,000$ 0$ 0$ 12,735,000$ 0$
Willdan Financial Services Page 13 of 25 4/7/2021

Exhibit 3
System Development Fee Analysis
Allocation of Capital Improvements Program
Water and Wastewater Systems
Growth
Line Description Total Related [1] Water Wastewater Water Wastewater Transmission Treatment Transmission Treatment
% Allocation $ Allocation Water Wastewater
Combined Projects
171 Total Water & Wastewater CIP………………………………………….110,363,084$ 6,652,667$ 38,541,667$ 6,652,667$ 0$ 38,541,667$ 0$
172 Total CWIP Projects…............................................................................................................76,221,877$ 65,488,872$ 10,733,005$ 0$ 65,488,872$ 10,733,005$ 0$
173 Total CIP & CWIP Projects…..............................................................................................................186,584,960$ 72,141,539$ 49,274,672$ 6,652,667$ 65,488,872$ 49,274,672$ 0$
Total Costs Allocated for SDF Recovery (System-Wide):
174 Water Treatment 65,488,872$
175 Water Transmission 6,652,667
176 Subtotal 72,141,539$
177 Wastewater Treatment 0$
178 Wastewater Transmission 1,008,423
179 Subtotal 1,008,423$
180 Total Allocated Costs (System-Wide) 73,149,962$
Total Costs Allocated for SDF Recovery (Southeast Corridor Expansion):
181 Water Treatment 0$
182 Water Transmission 0
183 Subtotal 0$
184 Wastewater Treatment 0$
185 Wastewater Transmission 35,531,249
186 Subtotal 35,531,249$
187 Total Allocated Costs (Southeast Corridor Expansion) 35,531,249$
Total Costs Allocated for SDF Recovery (Southwest Corridor Expansion):
188 Water Treatment 0$
189 Water Transmission 0
190 Subtotal 0$
191 Wastewater Treatment 0$
192 Wastewater Transmission 12,735,000
193 Subtotal 12,735,000$
194 Total Allocated Costs (Southwest Corridor Expansion) 12,735,000$
195 Total System-Wide, SE & SW Corridor for SDF Recovery 121,416,211$
196 Total Capital Project Costs Excluded from SDF Recovery 65,168,749$
Notes:
(1)
(2) The City has advised that it will apply a separate System Development Fee for new sewer connections specific to the Southeast & Southwest Development Areas. As such, the capital costs associated with these projects are excluded from
the CIP and are calculated separately in Exhibit 6 and 7 for the Southeast and Southwest Development Area, respectively.
Represents the assumed percentage of applicable project costs that are related to expansion of major system facilities to accommodate new customer growth, and therefore recoverable from SDFs.
Willdan Financial Services Page 14 of 25 4/7/2021

Exhibit 4
System Development Fee Analysis
Calculation of System Development Fee Per ERU
Water System
Line Description Total
Existing Facilities:
1 Treatment Facilities 27,807,755$
2 Transmission Facilities 139,226,311
3 Subtotal 167,034,066$ (1)
Capital Improvement Program:
4 Treatment Facilities 65,488,872$
5 Transmission Facilities 6,652,667
6 Subtotal 72,141,539$
Combined:
7 Treatment Facilities 93,296,627$
8 Transmission Facilities 145,878,978
9 Total 239,175,605$
Less Debt Service Principal:
10 Treatment Facilities (46,065,000)$
11 Transmission Facilities (2,375,156)
12 Total (48,440,156)$ (2)
Net Capital Costs:
13 Treatment Facilities 47,231,627$
14 Transmission Facilities 143,503,822
15 Net Recoverable Costs 190,735,449$
Maximum Daily Treatment Capacity:(3)
16 Gastonia Water Treatment Plant (MGD) 27.30
17 Additional Capacity From CIP 0.00
18 Combined Capacity of Water Treatment Facilities (MGD) 27.30
Average Day Capacity Adjustment:
19 Treatment Capacity Based on Max/Avg Day Factor 1.50 18.20
20 Unaccounted-For Water, Non-Revenue Capacity Adjustment 18.0%
21 Estimated Treatment Capacity 14.92 (4)
Estimated Transmission System Capacity:
22 Transmission-to-Treatment Capacity Factor 2.00
23 Estimated Transmission Capacity 29.84 (5)
Available System Capacity (MGD)
Recoverable Capital Facilities (System-Wide)
Willdan Financial Services Page 15 of 25 4/7/2021

Exhibit 4
System Development Fee Analysis
Calculation of System Development Fee Per ERU
Water System
Line Description Total
Estimated Cost Per Gallon of Capacity:
24 Treatment ($/Gallon) 3.17$
25 Transmission ($/Gallon) 4.81
26 Total Cost Per Gallon of Capacity 7.98$
27 Assumed Standard Level of Service Per ERU (GPD of Capacity) 267 (6)
Calculation of SDF Per ERU:
28 Treatment Facilities 845$
29 Transmission Facilities 1,282
30 Combined Cost 2,127$
Rounding Adjusted Fee - Treatment:
31 Calculated Fee Per ERU 845$
32 Less Rounding Adjustment (5)
33 Adjusted Fee 840$
Rounding Adjusted Fee - Transmission:
34 Calculated Fee Per ERU 1,282$
35 Less Rounding Adjustment (2)
36 Adjusted Fee 1,280$
Proposed SDF Per ERU (Rounded):
37 Treatment Facilities 840$
38 Transmission Facilities 1,280
39 Combined Cost 2,120$
Calculation of Proposed Fee Per ERU
Estimated Cost Per Gallon of Capacity
Willdan Financial Services Page 16 of 25 4/7/2021

Exhibit 4
System Development Fee Analysis
Calculation of System Development Fee Per ERU
Water System
Line Description Total
Notes:
(1)
(2)
(3)
(4)
(5)
(6)
Based on rated maximum daily plant capacity information as provided by City staff.
The system development charges are to be applied on an equivalent residential unit (ERU) basis
such that 1 ERU is equal to the estimated capacity requirements for a typical single family
residential connection with a 5/8-inch X 3/4-inch water meter. In accordance with daily water
flow capacity design standards adopted by the State of North Carolina and defined the North
Carolina Administrative Codes (15A NCAC 18C .0409), the level of service requirement for a
residential connection is 400 gallons per day (gpd). However, it is assumed that this level of
service is a maximum day usage and was divided by 1.5 to calculate an average day usage
number, resulting in a standard level of service of 267 gpd of water system capacity.
Per the SDF calculation methodology set forth in HB 436, a debt service credit is applied in the
water SDF calculation. The credit is equal to outstanding principal amount on existing utility-
related debt as reported in the most recent audited financial report. The principal balance is
allocated between water and wastewater as provided in Exhibit 1 .
See Exhibit 1 for the development of existing asset costs identified for capital recovery.
It is assumed that the transmission facilities are capable of providing average water flow at least
equal to twice the treatment capacity as adjusted for average day flow and losses an unaccounted
for water, or 29.84 MGD .
The estimated average daily flow capacity assumes an MDF-to-ADF ratio of 1.50 times. An
additional adjustment is made for assumed unaccounted-for water flows (e.g. line losses) in the
system. For the purpose of this analysis, the line-loss factor is assumed to be 18%.
Willdan Financial Services Page 17 of 25 4/7/2021

Exhibit 5
System Development Fee Analysis
Calculation of System Development Fee Per ERU
Wastewater System
Line Description Total
Existing Facilities:
1 Treatment Facilities 62,490,768$
2 Transmission Facilities 87,346,370
3 Subtotal 149,837,138$ (1)
Capital Improvement Program:
4 Treatment Facilities 0$
5 Transmission Facilities 1,008,423
6 Subtotal 1,008,423$
Combined:
7 Treatment Facilities 62,490,768$
8 Transmission Facilities 88,354,793
9 Total 150,845,561$
Less Debt Service Principal:
10 Treatment Facilities (1,597,655)$
11 Transmission Facilities (5,331,665)
12 Total (6,929,321)$ (2)
Net Capital Costs:
13 Treatment Facilities 60,893,113$
14 Transmission Facilities 83,023,128
15 Net Recoverable Costs 143,916,240$
Daily Treatment Capacity (MGD):
16 Crowders WWTP 6.00
17 Long Creek WWTP 16.00
18 Eagle Road WWTP 4.00
19 Combined Capacity of WWTP Facilities (MGD) 26.00
20 I&I Capacity Adjustment 25.0% 19.50 (3)
Estimated Transmission System Capacity:
21 Transmission-to-Treatment Capacity Factor 2.00
22 Estimated Transmission Capacity 39.00 (4)
Recoverable Capital Facilities (System-Wide)
Available System Capacity (MGD)
Willdan Financial Services Page 18 of 25 4/7/2021

Exhibit 5
System Development Fee Analysis
Calculation of System Development Fee Per ERU
Wastewater System
Line Description Total
Estimated Cost Per Gallon of Capacity:
23 Treatment ($/Gallon) 3.12$
24 Transmission ($/Gallon) 2.13
25 Total Cost Per Gallon of Capacity 5.25$
26 Assumed Standard Level of Service Per ERU (GPD of Capacity) 263 (5)
Calculation of SDF Per ERU:
27 Treatment Facilities 821$
28 Transmission Facilities 560
29 Combined Cost 1,381$
Rounding Adjusted Fee - Treatment:
30 Calculated Fee Per ERU 821$
31 Less Rounding Adjustment (1)
32 Adjusted Fee 820$
Rounding Adjusted Fee - Transmission:
33 Calculated Fee Per ERU 560$
34 Less Rounding Adjustment 0
35 Adjusted Fee 560$
Proposed SDF Per ERU (Rounded):
36 Treatment Facilities 820$
37 Transmission Facilities 560
38 Combined Cost 1,380$
Estimated Cost Per Gallon of Capacity
Calculation of Proposed Fee Per ERU
Willdan Financial Services Page 19 of 25 4/7/2021

Exhibit 5
System Development Fee Analysis
Calculation of System Development Fee Per ERU
Wastewater System
Line Description Total
Notes:
(1)
(2)
(3)
(4)
(5)
It is assumed that the wastewater trunk lines and pumping facilities are designed to provide
capacity at least equal to twice the permitted plant flow capacity, less the I&I capacity
adjustment.
Similar to the water system, the system development charges for wastewater are to be applied on
an equivalent residential unit (ERU) basis such that 1 ERU is equal to the estimated capacity
requirements for a typical single family residential connection with a 5/8-inch X 3/4-inch water
meter. In accordance with wastewater flow design standards adopted by the State of North
Carolina and defined the North Carolina Administrative Codes (15A NCAC 02T .0114), the level
of service requirement would be based on 120 gallons of capacity per day per bedroom for a
residential home. Assuming an average of 3.0 bedrooms per new home constructed and
applying the State's flow standard to the average number of bedrooms, 1 ERU would result in a
standard level of service of 360 gpd of wastewater system capacity. However, the City has
advised that they have received approval from the State of North Carolina Department of
Environmental Quality (“NCDEQ”) to have their standard LOS for sewer reduced for sewer
permitting from the 120 gallons per bedroom per day to a lower amount. The City’s engineering
consultant provided a report that was submitted to NCDEQ for review and, subsequently, the
NCDEQ approved using 150 gpd for 1 & 2 bedroom dwelling units with an additional 75 gpd for
additional bedrooms. The City has assumed an average of 3.5 bedrooms per new home
construction, resulting in a wastewater LOS of 263 gallons per day.
Similar to the line loss adjustment for water, the wastewater system capacity is reduced by the
impacts of system inflow and infiltration (I&I). The assumed I&I adjustment is based on
discussions with staff.
Per the SDF calculation methodology set forth in HB 436, a debt service credit is applied in the
wastewater SDF calculation. The credit is equal to outstanding principal amount on existing
utility-related debt as reported in the most recent audited financial report. The principal
balance is allocated between water and wastewater as provided in Exhibit 1.
See Exhibit 1 for the development of existing asset costs identified for capital recovery.
Willdan Financial Services Page 20 of 25 4/7/2021

Exhibit 6
System Development Fee Analysis
Calculation of SDF - Southeast Development Area
Wastewater Collection System
Line Description Total
Projected Capital Costs
1 Southeast Area Collection Lines (1)
(1) 35,531,249$
2 Less Debt Service Credit of 25.0% (8,882,812)
3 Recoverable Collection Facilities 26,648,437$
4 Estimated Number of ERUs at Build-Out (1)
(1) 9,000
5 Collection-Related Fee Per ERU 2,961$
Rounding Adjusted Fee - Collection:
6 Calculated Fee Per ERU 2,961$
7 Less Rounding Adjustment (1)
8 Adjusted Fee 2,960$
9 Percent of Fee Paid by Developer/Homeowner 100%
10 Fee Paid by Developer/Homeowner 2,960$
11 Remainder of Fee Paid by TRU 0$
Estimated Southeast Development Area Wastewater SDF
12 System-Wide Treatment Component Fee Per ERU (from Exhibit 5) 820$
13 SE Development Area Collection-Related Fee Per ERU 2,960
14 Total SE Development Area SDF 3,780$
Note:
(1) Provided by City staff.
Determination of Southeast Area Wastewater SDF
Willdan Financial Services Page 21 of 25 4/7/2021

Exhibit 7
System Development Fee Analysis
Calculation of SDF - Southwest Development Area
Wastewater Collection System
Line Description Total
Projected Capital Costs
1 Southwest Area Collection Lines (1)
(1) 12,735,000$
2 Less Debt Service Credit of 25.0% (3,183,750)
3 Recoverable Collection Facilities Cost 9,551,250$
4 Estimated ERUs Supported by Facilities Included for Recovery (1)
(1) 6,000
5 Southwest Area Collection-Related Fee Per ERU 1,592$
Rounding Adjusted Fee - Collection:
6 Calculated Fee Per ERU 1,592$
7 Less Rounding Adjustment (2)
8 Adjusted Fee 1,590$
9 Percent of Fee Paid by Developer/Homeowner 100%
10 Fee Paid by Developer/Homeowner 1,590$
11 Remainder of Fee Paid by TRU 0$
Estimated Southwest Development Area Fee
12 System-Wide Treatment Component Fee Per ERU (from Exhibit 5) 820$
13 Southwest Development Area Collection-Related Fee Per EDU 1,590
14 Total Southwest Development Area SDF 2,410$
Note:
(1) Provided by City staff.
Determination of Southwest Area Wastewater SDF
Willdan Financial Services Page 22 of 25 4/7/2021

Exhibit 8
System Development Fee Analysis
Summary of Existing & Proposed System Development Fees
Water & Wastewater Systems
Water Sewer
System-Wide Fee (1)
Meter Size:
1 3/4 Inch 1.00 1,246$ 868$ 2,114$
2 1.0 Inch 2.50 3,115$ 2,170$ 5,285$
3 1.5 Inch 5.00 6,230$ 4,340$ 10,570$
4 2.0 Inch 8.00 9,968$ 6,944$ 16,912$
5 3.0 Inch 16.00 19,936$ 13,888$ 33,824$
6 4.0 Inch 25.00 31,150$ 21,700$ 52,850$
7 6.0 Inch 50.00 62,300$ 43,400$ 105,700$
8 8.0 Inch 80.00 99,680$ 69,440$ 169,120$
9 10.0 Inch 115.00 143,290$ 99,820$ 243,110$
10 12.0 Inch 215.00 267,890$ 186,620$ 454,510$
Southeast Development Area Fee (1)
Meter Size:
11 3/4 Inch 1.00 1,246$ 3,150$ 4,396$
12 1.0 Inch 2.50 3,115$ 7,875$ 10,990$
13 1.5 Inch 5.00 6,230$ 15,750$ 21,980$
14 2.0 Inch 8.00 9,968$ 25,200$ 35,168$
15 3.0 Inch 16.00 19,936$ 50,400$ 70,336$
16 4.0 Inch 25.00 31,150$ 78,750$ 109,900$
17 6.0 Inch 50.00 62,300$ 157,500$ 219,800$
18 8.0 Inch 80.00 99,680$ 252,000$ 351,680$
19 10.0 Inch 115.00 143,290$ 362,250$ 505,540$
20 12.0 Inch 215.00 267,890$ 677,250$ 945,140$
System-Wide Fee (2)
Meter Size:
21 3/4 Inch 1.00 2,120$ 1,380$ 3,500$
22 1.0 Inch 2.50 5,300$ 3,450$ 8,750$
23 1.5 Inch 5.00 10,600$ 6,900$ 17,500$
24 2.0 Inch 8.00 16,960$ 11,040$ 28,000$
25 3.0 Inch 16.00 33,920$ 22,080$ 56,000$
26 4.0 Inch 25.00 53,000$ 34,500$ 87,500$
27 6.0 Inch 50.00 106,000$ 69,000$ 175,000$
28 8.0 Inch 80.00 169,600$ 110,400$ 280,000$
29 10.0 Inch 115.00 243,800$ 158,700$ 402,500$
30 12.0 Inch 215.00 455,800$ 296,700$ 752,500$
OPTIONAL ACTUAL FLOW BASIS(3)
Charge Per Gallon of Capacity (GPD):31 Treatment Facilities 3.17$ 3.12$ 3.17$ 32 Transmission Facilities 4.81 2.13 6.94
33 Cost Per GPD 7.98$ 5.25$ 10.11$
Line DescriptionMeter-Based
ERU Factor
Combined
Fee
Fees by System
EXISTING FEES
PROPOSED FEES
Willdan Financial Services Page 23 of 25 4/7/2021

Exhibit 8
System Development Fee Analysis
Summary of Existing & Proposed System Development Fees
Water & Wastewater Systems
Water SewerLine Description
Meter-Based
ERU Factor
Combined
Fee
Fees by System
Southeast Development Area Fee (4)
Meter Size:
34 3/4 Inch 1.00 2,120$ 3,780$ 5,900$
35 1.0 Inch 2.50 5,300$ 9,450$ 14,750$
36 1.5 Inch 5.00 10,600$ 18,900$ 29,500$
37 2.0 Inch 8.00 16,960$ 30,240$ 47,200$
38 3.0 Inch 16.00 33,920$ 60,480$ 94,400$
39 4.0 Inch 25.00 53,000$ 94,500$ 147,500$
40 6.0 Inch 50.00 106,000$ 189,000$ 295,000$
41 8.0 Inch 80.00 169,600$ 302,400$ 472,000$
42 10.0 Inch 115.00 243,800$ 434,700$ 678,500$
43 12.0 Inch 215.00 455,800$ 812,700$ 1,268,500$
Southwest Development Area Fee (4)
Meter Size:
44 3/4 Inch 1.00 2,120$ 2,410$ 4,530$
45 1.0 Inch 2.50 5,300$ 6,025$ 11,325$
46 1.5 Inch 5.00 10,600$ 12,050$ 22,650$
47 2.0 Inch 8.00 16,960$ 19,280$ 36,240$
48 3.0 Inch 16.00 33,920$ 38,560$ 72,480$
49 4.0 Inch 25.00 53,000$ 60,250$ 113,250$
50 6.0 Inch 50.00 106,000$ 120,500$ 226,500$
51 8.0 Inch 80.00 169,600$ 192,800$ 362,400$
52 10.0 Inch 115.00 243,800$ 277,150$ 520,950$
53 12.0 Inch 215.00 455,800$ 518,150$ 973,950$
Notes:
(1)
(2)
(3)
(4)
In situations where the application of the meter-based fees will result in the collection of fees significantly
different than the potential demand requirement, a special fee calculation methodology may be applied based on
the unit cost of capacity and the estimated daily capacity needs of the new service connection. The estimated
capacity needs will be based on the amount determined by the utility's engineering staff to be appropriate. These
unit costs reflect those specific to system-wide development.
Reflects the existing water and sewer SDF fees for new System-Wide customers and wastewater customers
located in the Southeast Development Area
The proposed system-wide SDFs fees are based on the calculated fee per ERU as applied to the respective ERU
factor. The proposed ERU factors for the SDFs are based on meter equivalency factors established by the
AWWA. The calculated sewer fees exclude sewer capital costs associated with the Southeast and Southwest
Development Areas.
As advised by the City, the SDFs for water would be the same under both the system-wide and Southeast &
Southwest Development Areas. The sewer transmission/collection component of the SDFs for the Southeast &
Southwest Development Areas were calculated based on the potential number of new connections within the
each development area and the capital costs related to sewer transmission required to serve those customers. The
system-wide treatment component fee per ERU was utilized in the development of the Southeast & Southwest
Development areas sewer SDFs. (See Exhibit 6 & 7 for detailed Southeast and Southwest Development Area
sewer fee calculations)
Willdan Financial Services Page 24 of 25 4/7/2021

Exhibit 9
System Development Fee Analysis
Comparison With Other Utility Systems
Water & Wastewater Systems
Gastonia (System-Wide Fees):
1 Existing Fee Per ERU 1,246$ 868$ 2,114$
2 Proposed Fee Per ERU 2,120$ 1,380$ 3,500$
Other Utilities:(1)
3 Charlotte, NC (CMU) 846$ 2,618$ 3,464$
4 Concord, NC(2)
1,262$ 3,175$ 4,437$
5 Kannapolis, NC(2)
1,450$ 3,550$ 5,000$
6 City of Asheville, NC(3)
1,372$ 2,836$ 4,208$
7 Brunswick Regional Water & Sewer, NC 3,200$ 4,500$ 7,700$
8 Union County, NC 1,200$ 3,090$ 4,290$
9 Town of Cary, NC(4)
1,946$ 2,640$ 4,586$
10 Mount Holly, NC 1,230$ 4,665$ 5,895$
11 ONWASA (NC) 2,032$ 3,700$ 5,732$
12 Brunswick County, NC(5)
1,152$ 3,999$ 5,151$
13 Orange Water & Sewer Authority, NC(4)
1,767$ 2,652$ 4,419$
14 Town of Mooresville, NC 2,660$ 3,150$ 5,810$
15 Average of Other Utilities 1,676$ 3,381$ 5,058$
(1)
(2)
(3)
(4)
(5)
Water service is provided by the City and wastewater service is provided by the Metropolitan Sewerage
District of Buncombe County.
Assumes a single-family home 2,401 to 3,100 sq. ft. in size.
Assumes a 3 bedroom residential home.
Notes:
Developed from fee information made available by the other utilities included. This study has attempted
to ensure that fees included for comparison are applicable capital recovery fees consistent with the intent
of the proposed fees developed herein. However, due to differences in terminology, fee structure and
method of applying fees, such a direct comparison is often difficult to establish.
The City is a member of WSACC. New connections to the wastewater system pay a Capital Recovery
Fee to WSACC for treatment facilities. The current fee is $2,040 per ERU and is included with the
City's fee provided herein.
CombinedLine Description Water Wastewater
Willdan Financial Services Page 25 of 25 4/7/2021