april 9, 2009 - ncdot
TRANSCRIPT

900 Chapel Street, Suite 1400 New Haven, Connecticut 06510 203.865.2191 f 203.624.0484 www.WilburSmith.com
April 9, 2009 Mr. David Joyner Executive Director North Carolina Turnpike Authority 5400 Glenwood Avenue, Suite 400 Raleigh, NC 27612 Re: Monroe Connector/Bypass 2009 Update to Preliminary Study Dear Mr. Joyner: Wilbur Smith Associates (WSA) is pleased to provide herewith our updated traffic and revenue findings for the Monroe Connector/Bypass. WSA prepared a preliminary traffic and revenue study1 for the proposed facility in 2006. The 2006 study was conducted at a preliminary feasibility level, commonly referred to as a “Level 2” traffic and revenue analysis. The Level 2 analysis is intended to provide preliminary estimates of traffic, revenue and toll rate sensitivity. This level of study is not intended for use in direct sup-port of project financing. The NCTA needs to have preliminary financial information for planning purposes and has asked for an update to the preliminary study in advance of the completion of any investment grade studies. The purpose of this update is to provide new information sufficient to allow the NCTA to prepare new preliminary financing plans for the project. However, the forecasts are still con-sidered to be at Level 2 and are not suitable for financial implementation. A comprehensive, in-vestment-grade study of the Monroe Connector/Bypass is underway now, and the results will be available later this year. Several key changes to the project have occurred since the completion of the preliminary study. These changes are significant enough to warrant updates to the traffic and revenue forecasts to be compatible with corresponding updates to capital, operating, and financing costs that have also be made over the past three years. 1Proposed Monroe Connector Preliminary Traffic and Revenue Study, Wilbur Smith Associates for North Carolina Turnpike Authority, October 11, 2006.

2009 Update for Monroe Connector/Bypass
Preliminary Traffic and Revenue Study
April 9, 2009 Page 2
Open Road Tolling – The NCTA has decided to implement open road tolling (ORT) on the Triangle Expressway and will likely use the same collection method for other toll pro-jects, including the Monroe Connector/Bypass. The preliminary study for the Monroe Connector/Bypass was based on an assumed barrier system for cash and electronic toll collection. Under the new plan, the system would operate at highway speeds and would use both video and ETC methods of collection without a cash option on the road. The toll rate plan has also changed with ETC rates assumed to be discounted from base video toll rates. The change in these assumptions effects expected toll revenues and toll operat-ing and maintenance costs.
Alignment and Interchanges - Environmental and engineering studies are underway for
the Monroe project, and cost estimates have been updated accordingly. Potential align-ments and interchanges are being considered which differ from the assumptions in the 2006 study. The two sections of the project, Monroe Bypass and Monroe Connector are now projected to begin operations at the same time in January 2014 instead in a phased opening.
UPDATE PROCEDURES
This update is based primarily upon the 2006 preliminary study including using the same re-gional transportation planning model available for the earlier study. Key revisions and updates to the analytical procedure include:
Metrolina Regional Transportation Demand Model – The MPO regional model was the basis for the update. Various project-level calibration adjustments made for the pre-liminary study were carried through to the update.
Tolling Plan – The tolling assumption for the preliminary study was for two toll collec-
tion methods, cash and electronic toll collection (ETC). The tolls were assumed to be collected via a barrier system for cash and high-speed collection for ETC customers. Fol-lowing studies conducted for the Triangle Expressway in the Triangle Region, the NCTA decided to operate without cash and instead collect tolls either via ETC or video identifi-cation. Under the video collection procedure, images of vehicle license plates would be captured. NCTA account holders would be identified and accounts charged for each transaction. In the case of vehicles not preregistered with the NCTA, vehicle owners would be identified by DMV records and sent an invoice if the vehicle operator did not pay within specified time limits. This change in toll collection procedures was reflected by preparing a new toll zone location plan.

2009 Update for Monroe Connector/Bypass
Preliminary Traffic and Revenue Study
April 9, 2009 Page 3
Alignment and Interchange Configuration – Since completion of the preliminary study, alternative alignments and interchange configurations have been analyzed as part of the environmental review process. Alternative 1 described later is similar in location to one of the scenarios analyzed for the 2006 preliminary study except for the location of tolling zones. Alternative 2, described later, was not analyzed in the preliminary study, but is the same configuration as Alternative 1 except for the western terminus.
Historic Traffic Volumes – The volumes along US 74, the key competitive route to the
project, were reviewed and compared against the growth rates forecast in the regional transportation demand model. Adjustments were made to the traffic forecasts as a result of this review since the traffic, according to NCDOT traffic data, has decreased in the 2005-2007 period.
Value of Time and Vehicle Operating Cost – The value of time and vehicle operating
cost, two key model parameters, were reviewed. Adjustments to the base year model rates were made based on historical changes in inflation and in the price of fuel since the preliminary study.
Toll Rate Sensitivity – The price sensitivity to the new plan for toll rates was analyzed
for 2015 and 2030.
Toll Rates – New toll rates were also developed as a result of the change in the tolling plan and the revised toll sensitivity. Under the new plan, the base rate is the video Class 1 (passenger vehicle rate). Class 1 ETC rates are discounted by 35 percent in accordance with legislation passed in 2008. Rates for medium, single-unit (Class 2) and heavy, multi-unit (Class 3) trucks are multiples of the Class 1 video and ETC rates. In addition, the toll rates were set so that the average toll per mile for all customers of the same vehi-cle class and collection method is uniform. Finally toll rates were assumed be increased annually rather than every five years as was assumed for the preliminary study. This as-sumption is similar to the plan adopted for the Triangle Expressway.
Fiscal Year Basis – The traffic and revenue forecasts for this 2009 Update were prepared
on a fiscal year basis (July-June) to be in conformity with the capital, maintenance, and operating costs used in the preliminary plan of finance. The forecasts in the 2006 study were on a calendar year basis. All yearly references in this report are to fiscal years ex-cept for historical references and the comparison to the traffic and revenue forecasts in the 2006 preliminary study.
Revenue Leakage – Finally estimates were made for revenue losses from equipment/
system failures or inability to identify or collect from video customers and to a lesser ex-

2009 Update for Monroe Connector/Bypass
Preliminary Traffic and Revenue Study
April 9, 2009 Page 4
tent, ETC customers. The procedure was developed for the Triangle Expressway com-prehensive traffic and revenue study and is base on assumed percentages for equipment failure and collection rates. The preliminary study for the Monroe project did not address potential revenue leakage.
PROJECT DESCRIPTION
Figure 1 depicts the project location and its relationship to the surrounding transportation system. Two alternative alignments at the western end are under consideration. Alternative 1 provides a direct connection to I-485. Alternative 2 follows the same alignment for most of its length but does not connect directly to I-485. Instead it connects with US 74 and then to I-485 via a seg-ment on US 74 that would be improved as part of Alternative 2. The Monroe Connector/Bypass would follow a generally northwest-southeast orientation, essen-tially paralleling US 74. US 74 is a major facility that connects southeastern North Carolina to the Charlotte metropolitan area. It provides access between the Port of Wilmington and the New Hanover and Brunswick County beaches and Charlotte and points west. With the Monroe Con-nector/Bypass, drivers would have a high-speed, controlled access facility between Monroe and Charlotte, which would reduce congestion on the heavily-utilized US 74. The proposed Monroe Connector/Bypass would provide significant time savings for travelers moving between I-485 south of Charlotte and Monroe or points south and east. US 74 would be the primary competing route to the Monroe Connector. US 74, a signalized arterial route, currently carries very high traffic volumes, particularly be-tween I-485 and Monroe as indicated on Figure 2. Near Monroe, over 50,000 vehicles per day (vpd) use US 74. East of Monroe the volumes drop to less than 25,000 vpd. However, as indi-cated in the figure, average annual daily traffic has reduced somewhat between 2005 and 2007, the last year for which traffic information was available from the NC Department of Transporta-tion. The 2007 volumes are generally 2,000 vehicles per day less than the 2005 volumes. ALTERNATIVE 1 CONFIGURATION The proposed Monroe Connector/Bypass, as shown in Figure 3, would extend for approximately 19.5 miles from the interchange of US 74/I-485 near Matthews, at the northern end of the project to US 74 east of Wingate. Alternative 1 would have eight full interchanges and two half inter-changes including an interchange where US 74 currently connects with I-485, the Charlotte Outer Loop. Figure 3 also shows the conceptual location of the five mainline and two ramp toll zones, which have been sited to allow for toll collection for all movements on the Monroe By-pass/Connector. Since the NCTA has adopted a cashless system, all toll zones would allow for

Proposed Monroe Connector/Bypass Preliminary Traffic and Revenue Study - 2009 Update
FIGURE 1REGIONAL LOCATION MAP
NC 103171 / 1-27-09 / Regional Location Map. mxd
485
MonroeAirport
601
74
207
74
84
75 200
Monroe
Charlotte
Union
Wingate
Marshville
Waxhaw
Matthews
485
Cabarrus
Anson
Mecklenburg
Lancaster
Stanly
200
205
205
742
218
74
601
521
521
51
51
16
16
200
742
138
218
Alternative 2
Alternative 1
York
Union
LEGENDInterchangeMonroe Connector/Bypass
0 2 4
Miles

485
MonroeAirport
601
74
200
74
84
75200
Monroe
Wingate
Matthews
3736
-2.7%
4847
-2.1%
5452
-3.7%
5147
-7.8%
2927
-6.9%2725
-7.4%
2824
-14.3%
2119
-9.5%
Alternative 1
Alternative 2
Union
Mecklenburg
Proposed Monroe Connector/Bypass Preliminary Traffic and Revenue Study - 2009 Update
FIGURE 2
ANNUAL AVERAGE DAILY TRAFFIC COUNTSAT SELECTED STUDY AREA LOCATIONS
NC 103171 / 1-27-09 / Annual Average Daily Traffic.mxd
0 1 2
Miles
LEGEND
Volumes are in thousands.
0000
00.0%
20052007Percent Change2005 - 2007
Count Location
Source: North Carolina Department of Transportation.
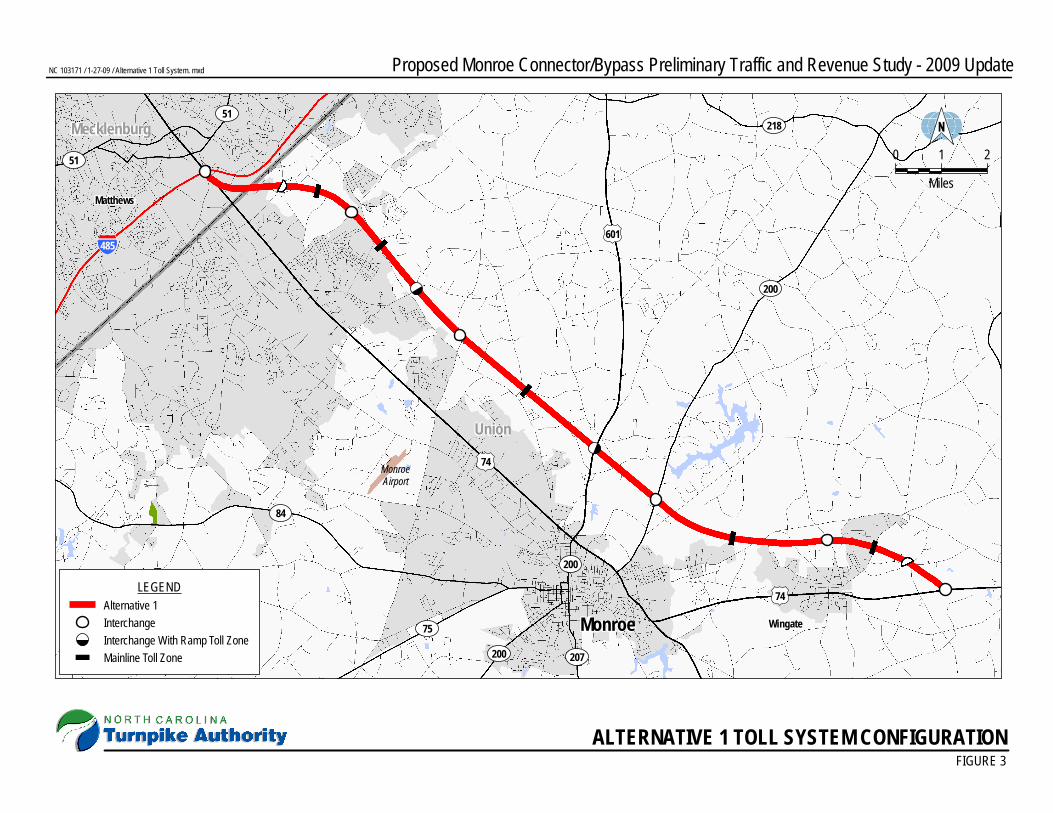
FIGURE 3ALTERNATIVE 1 TOLL SYSTEM CONFIGURATION
NC 103171 / 1-27-09 / Alternative 1 Toll System. mxd Proposed Monroe Connector/Bypass Preliminary Traffic and Revenue Study - 2009 Update
485
MonroeAirport
601
74
74
75 Monroe Wingate
Matthews
84
200
200
21851
51
200
207
Union
Mecklenburg
LEGENDAlternative 1InterchangeInterchange With Ramp Toll ZoneMainline Toll Zone
0 1 2
Miles

2009 Update for Monroe Connector/Bypass
Preliminary Traffic and Revenue Study
April 9, 2009 Page 5
either electronic or video toll collection as discussed earlier. Traffic would not slow down at any toll zone. ALTERNATIVE 2 CONFIGURATION Figure 4 depicts a 19.8-mile second alternative in which the western end would connect to I-485 via an improved US 74 that would allow toll road traffic to access I-485 along a mixed traffic segment of US 74. This improved segment would be grade-separated and high-speed and would allow for tolled and non-tolled through movements and local access via service roads. Effec-tively this short segment could be perceived as part of the toll road by toll road customers; there-fore the tolls at the tolling zone between US 74 and Indian Trail-Fairview Road reflect this per-ception. Through traffic on US 74 would also be tolled. A non-toll alternative for US 74 through traffic would be available using the parallel service roads. Figure 5 illustrates the toll and non-toll traffic flow on US 74 under Alternative 2. The Stallings Road half interchange would be eliminated in Alternative 2. Access for potential toll road customers that would use this interchange in Alternative 1 would be via either US 74 or Indian Trail-Fairview Road, both of which involve longer travel times.
VEHICLE CLASSIFICATION AND TOLL RATES
Toll rates for the Monroe Connector/Bypass were reanalyzed for 2015 and 2030 and new toll rates developed to conform to current NCTA vehicle classification and toll policy. The vehicle classifications, toll premiums and discounts, and toll setting frequency developed for the Trian-gle Expressway were also assumed for the Monroe Connector/Bypass. VEHICLE CLASSIFICATION POLICY
Class 1, Light Vehicles – Included in this class are automobiles, pick-up trucks, passen-ger and service vans, sports utility vehicles, and motor cycles.
Class 2, Medium Vehicles – Included in this class are single unit trucks larger than pickup trucks including 2-axle, 6-tire vehicles; passenger buses; recreational vehicles and any Class 1 vehicle that is towing a trailer.
Class 3, Heavy Trucks – Included in this class are all multi-unit vehicles with four or more axles and all oversize vehicles.
TOLL RATE POLICY AND TOLL EQUITY The toll rate for Class 1 vehicles is the rate on which the rates for other vehicle classes are based. The following premiums were selected for the Class 2 and Class 3 vehicles:
Class 2, Medium (Single-unit) Vehicles – Two times the Class 1 rate. Class 3, Heavy (Multi-unit) Trucks – Four times the Class 1 rate.

FIGURE 4ALTERNATIVE 2 TOLL SYSTEM CONFIGURATION
NC 103171 / 1-27-09 / Option 3-Alternative 2 Toll System. mxd Proposed Monroe Connector/Bypass Preliminary Traffic and Revenue Study - 2009 Update
485
MonroeAirport
601
74
74
75 Monroe Wingate
Matthews
84
200
200
21851
51
200
207
U.S. 74 Toll
MonroeConnector /
Bypass
Stallings R
d.
Junction Toll Concept SchematicNot to Scale
U.S. 74 Free Route
McKee Rd.
Bus.
U.S. 74 Free Route
74
74
U.S. 74 Toll
Union
Mecklenburg
LEGENDAlternative 2InterchangeInterchange With Ramp Toll ZoneMainline Toll Zone
0 0.75 1.5
Miles

Proposed Monroe Connector/Bypass Preliminary Traffic and Revenue Study - 2009 UpdateNC 103171 / 1-27-09 / Landscape.ppt
FIGURE 5
SchematicNot To Scale
MONROE CONNECTOR / BYPASS AND US 74 JUNCTIONALTERNATIVE 2 TOLL CONCEPT SCHEMATIC
Stallings Rd.McKee Rd.
Frontage Road
Frontage Road
Monroe
Con
necto
r / By
pass
MonroeCharlotte
Business
Monroe Connector / Bypass - TollUS 74 - TollUS 74 - Free AlternativeOther RoadsToll ZoneTraffic Signal
LEGEND

2009 Update for Monroe Connector/Bypass
Preliminary Traffic and Revenue Study
April 9, 2009 Page 6
Video toll customers would include users with registered video accounts and non-registered us-ers of the toll road. Users that do not register for ETC or video toll accounts would be consid-ered potential customers and provided an opportunity to pay before their transactions are classi-fied as violations. The following rate differentials were assumed for video toll collection and ETC:
Video Toll Collection Rates – The toll rates established for Class 1, Class 2 and Class 3 video toll customers; and
Electronic Toll Collection Rates – The toll rates for Class 1, Class 2 and Class 3 toll customers discounted by no more than 35 percent from the corresponding video rates.
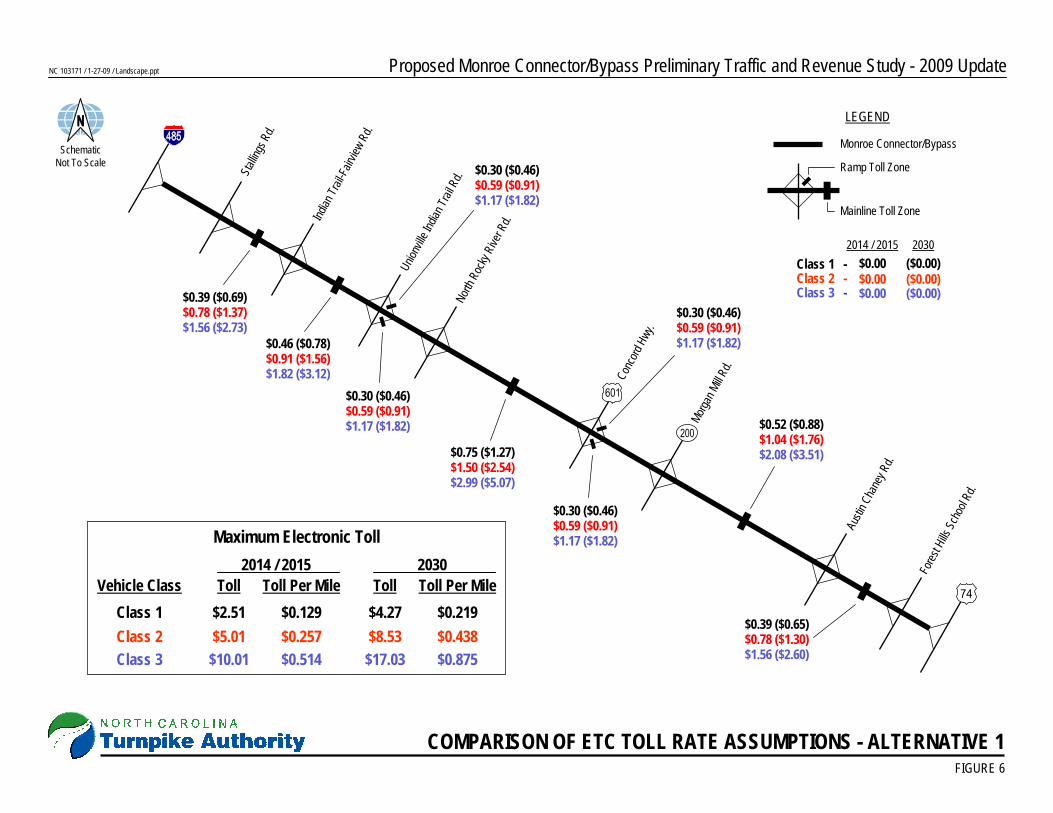
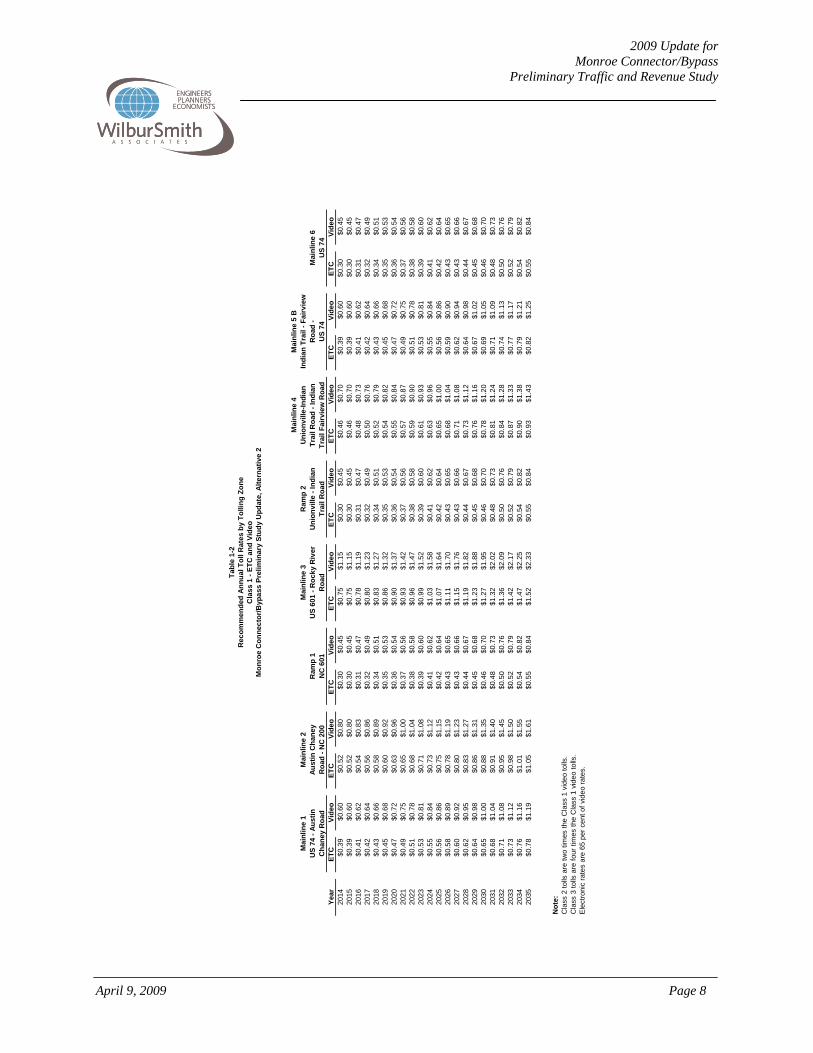
By having a cashless system, the NCTA can place the tolling zones between each interchange and have the rates on a per mile basis set equally. In certain cases, toll zones were located on ramps for operational reasons, but the same uniform toll rate per mile was adopted. TOLL RATES Figures 6 and 7 illustrate the assumed toll rates for the two alternatives for the three vehicle classes in 2014/2015 and 2030. Tables 1-1 and 1-2 contain ETC and video tolls for each tolling zone from the opening year through 2035. The maximum Class 1 ETC toll (five toll zones) would be $2.51, or $0.129 per mile in the opening year under Alternative 1 and $0.127 per mile for the slightly longer Alternative 2. The highest single zone Class 1 ETC toll would be $0.75 for movements between US 601 and North Rocky River Road. Minimum tolls of $0.30 would be set at the two ramp tolling zones and the US 74 tolling zones. Finally, toll rates would be in-creased annually based on growth rates between the 2015 and 2030 rates that were established by toll sensitivity tests. In contrast, the 2006 study assumed toll increases every five years. The an-nual toll increase procedure is made relatively easy since all tolls are paid electronically. Tables 2-1 and 2-2 compare the maximum Class 1 ETC and video toll rates established for the 2006 study and this 2009 update study. ETC rates are similar especially in the earlier years but are somewhat higher in later years following a new toll sensitivity analysis. Video rates are also shown for the current study and are higher than the ETC rates which are discounted from the video rates.
Proposed Monroe Connector/Bypass Preliminary Traffic and Revenue Study - 2009 UpdateNC 103171 / 1-27-09 / Landscape.ppt
FIGURE 6
Indian
Trail
-Fairv
iew R
d.
Union
ville I
ndian
Trail
Rd.
Austi
n Cha
ney R
d.
COMPARISON OF ETC TOLL RATE ASSUMPTIONS - ALTERNATIVE 1
Stallin
gs R
d.
Fores
t Hills
Scho
ol Rd
.
North
Roc
ky R
iver R
d.
Conc
ord H
wy.
Morga
n Mill R
d.
LEGEND
Monroe Connector/Bypass
Mainline Toll Zone
Ramp Toll Zone
2014 / 2015$0.00$0.00$0.00
2030($0.00)($0.00)($0.00)
Class 1 -Class 2 -Class 3 -
SchematicNot To Scale
$0.39 ($0.69)$0.78 ($1.37)$1.56 ($2.73)
$0.46 ($0.78)$0.91 ($1.56)$1.82 ($3.12)
$0.30 ($0.46)$0.59 ($0.91)$1.17 ($1.82)
$0.30 ($0.46)$0.59 ($0.91)$1.17 ($1.82)
$0.75 ($1.27)$1.50 ($2.54)$2.99 ($5.07)
$0.30 ($0.46)$0.59 ($0.91)$1.17 ($1.82)
$0.30 ($0.46)$0.59 ($0.91)$1.17 ($1.82)
$0.52 ($0.88)$1.04 ($1.76)$2.08 ($3.51)
$0.39 ($0.65)$0.78 ($1.30)$1.56 ($2.60)
Vehicle ClassClass 1Class 2Class 3
Toll$2.51$5.01$10.01
Toll Per Mile$0.129$0.257$0.514
2014 / 2015Toll
$4.27$8.53
$17.03
Toll Per Mile$0.219$0.438$0.875
2030Maximum Electronic Toll

Proposed Monroe Connector/Bypass Preliminary Traffic and Revenue Study - 2009 UpdateNC 103171 / 1-27-09 / Landscape.ppt
FIGURE 7
Indian
Trail
-Fairv
iew R
d.
Union
ville I
ndian
Trail
Rd.
Austi
n Cha
ney R
d.
COMPARISON OF ETC TOLL RATE ASSUMPTIONS - ALTERNATIVE 2
Fores
t Hills
Scho
ol Rd
.
North
Roc
ky R
iver R
d.
Conc
ord H
wy.
Morga
n Mill R
d.
LEGEND
Monroe Connector/Bypass
Mainline Toll Zone
Ramp Toll Zone
2014 / 2015$0.00$0.00$0.00
2030($0.00)($0.00)($0.00)
Class 1 -Class 2 -Class 3 -
SchematicNot To Scale
$0.46 ($0.78)$0.91 ($1.56)$1.82 ($3.12)
$0.30 ($0.46)$0.59 ($0.91)$1.17 ($1.82)
$0.30 ($0.46)$0.59 ($0.91)$1.17 ($1.82)
$0.75 ($1.27)$1.50 ($2.54)$2.99 ($5.07)
$0.30 ($0.46)$0.59 ($0.91)$1.17 ($1.82)
$0.30 ($0.46)$0.59 ($0.91)$1.17 ($1.82)
$0.52 ($0.88)$1.04 ($1.76)$2.08 ($3.51)
$0.39 ($0.65)$0.78 ($1.30)$1.56 ($2.60)
$0.39 ($0.69)$0.78 ($1.37)$1.56 ($2.73)
Vehicle ClassClass 1Class 2Class 3
Toll$2.51$5.01
$10.01
Toll Per Mile *$0.127$0.253$0.505
2014 / 2015Toll
$4.27$8.53
$17.03
Toll Per Mile *$0.215$0.430$0.858
2030
Maximum Electronic Toll
* Includes upgraded segment on US 74 to I-485
Bus
$0.30 ($0.46)$0.59 ($0.91)$1.17 ($1.82)
McKe
e Rd.
Stallin
gs R
d.
$0.30 ($0.46)$0.59 ($0.91)$1.17 ($1.82)

2009 Update for Monroe Connector/Bypass
Preliminary Traffic and Revenue Study
April 9, 2009 Page 7
Tabl
e 1-
1R
ecom
men
ded
Annu
al T
oll R
ates
by
Tolli
ng Z
one
Cla
ss 1
- ET
C a
nd V
ideo
Mon
roe
Con
nect
or/B
ypas
s Pr
elim
inar
y St
udy
Upd
ate,
Alte
rnat
ive
1
Mai
nlin
e 1
US
74 -
Aust
in
Cha
ney
Roa
d
Mai
nlin
e 2
Aust
in C
hane
yR
oad
- NC
200
Ram
p 1
NC
601
Mai
nlin
e 3
US
601
- Roc
ky R
iver
R
oad
Ram
p 2
Uni
onvi
lle -
Indi
an
Trai
l Roa
d
Mai
nlin
e 4
Uni
onvi
lle-In
dian
Tr
ail R
oad
- Ind
ian
Trai
l Fai
rvie
w R
oad
Mai
nlin
e 5
AIn
dian
Tra
il - F
airv
iew
R
oad
- Sta
lling
s R
oad
Year
ETC
Vide
oET
CVi
deo
ETC
Vide
oET
CVi
deo
ETC
Vide
oET
CVi
deo
ETC
Vide
o20
14$0
.39
$0.6
0$0
.52
$0.8
0$0
.30
$0.4
5$0
.75
$1.1
5$0
.30
$0.4
5$0
.46
$0.7
0$0
.39
$0.6
020
15$0
.39
$0.6
0$0
.52
$0.8
0$0
.30
$0.4
5$0
.75
$1.1
5$0
.30
$0.4
5$0
.46
$0.7
0$0
.39
$0.6
020
16$0
.41
$0.6
2$0
.54
$0.8
3$0
.31
$0.4
7$0
.78
$1.1
9$0
.31
$0.4
7$0
.48
$0.7
3$0
.41
$0.6
220
17$0
.42
$0.6
4$0
.56
$0.8
6$0
.32
$0.4
9$0
.80
$1.2
3$0
.32
$0.4
9$0
.50
$0.7
6$0
.42
$0.6
420
18$0
.43
$0.6
6$0
.58
$0.8
9$0
.34
$0.5
1$0
.83
$1.2
7$0
.34
$0.5
1$0
.52
$0.7
9$0
.43
$0.6
620
19$0
.45
$0.6
8$0
.60
$0.9
2$0
.35
$0.5
3$0
.86
$1.3
2$0
.35
$0.5
3$0
.54
$0.8
2$0
.45
$0.6
820
20$0
.47
$0.7
2$0
.63
$0.9
6$0
.36
$0.5
4$0
.90
$1.3
7$0
.36
$0.5
4$0
.55
$0.8
4$0
.47
$0.7
220
21$0
.49
$0.7
5$0
.65
$1.0
0$0
.37
$0.5
6$0
.93
$1.4
2$0
.37
$0.5
6$0
.57
$0.8
7$0
.49
$0.7
520
22$0
.51
$0.7
8$0
.68
$1.0
4$0
.38
$0.5
8$0
.96
$1.4
7$0
.38
$0.5
8$0
.59
$0.9
0$0
.51
$0.7
820
23$0
.53
$0.8
1$0
.71
$1.0
8$0
.39
$0.6
0$0
.99
$1.5
2$0
.39
$0.6
0$0
.61
$0.9
3$0
.53
$0.8
120
24$0
.55
$0.8
4$0
.73
$1.1
2$0
.41
$0.6
2$1
.03
$1.5
8$0
.41
$0.6
2$0
.63
$0.9
6$0
.55
$0.8
420
25$0
.56
$0.8
6$0
.75
$1.1
5$0
.42
$0.6
4$1
.07
$1.6
4$0
.42
$0.6
4$0
.65
$1.0
0$0
.56
$0.8
620
26$0
.58
$0.8
9$0
.78
$1.1
9$0
.43
$0.6
5$1
.11
$1.7
0$0
.43
$0.6
5$0
.68
$1.0
4$0
.59
$0.9
020
27$0
.60
$0.9
2$0
.80
$1.2
3$0
.43
$0.6
6$1
.15
$1.7
6$0
.43
$0.6
6$0
.71
$1.0
8$0
.62
$0.9
420
28$0
.62
$0.9
5$0
.83
$1.2
7$0
.44
$0.6
7$1
.19
$1.8
2$0
.44
$0.6
7$0
.73
$1.1
2$0
.64
$0.9
820
29$0
.64
$0.9
8$0
.86
$1.3
1$0
.45
$0.6
8$1
.23
$1.8
8$0
.45
$0.6
8$0
.76
$1.1
6$0
.67
$1.0
220
30$0
.65
$1.0
0$0
.88
$1.3
5$0
.46
$0.7
0$1
.27
$1.9
5$0
.46
$0.7
0$0
.78
$1.2
0$0
.69
$1.0
520
31$0
.68
$1.0
4$0
.91
$1.4
0$0
.48
$0.7
3$1
.32
$2.0
2$0
.48
$0.7
3$0
.81
$1.2
4$0
.71
$1.0
920
32$0
.71
$1.0
8$0
.95
$1.4
5$0
.50
$0.7
6$1
.36
$2.0
9$0
.50
$0.7
6$0
.84
$1.2
8$0
.74
$1.1
320
33$0
.73
$1.1
2$0
.98
$1.5
0$0
.52
$0.7
9$1
.42
$2.1
7$0
.52
$0.7
9$0
.87
$1.3
3$0
.77
$1.1
720
34$0
.76
$1.1
6$1
.01
$1.5
5$0
.54
$0.8
2$1
.47
$2.2
5$0
.54
$0.8
2$0
.90
$1.3
8$0
.79
$1.2
120
35$0
.78
$1.1
9$1
.05
$1.6
1$0
.55
$0.8
4$1
.52
$2.3
3$0
.55
$0.8
4$0
.93
$1.4
3$0
.82
$1.2
5
Not
e:C
lass
2 to
lls a
re tw
o tim
es th
e C
lass
1 v
ideo
tolls
.C
lass
3 to
lls a
re fo
ur ti
mes
the
Cla
ss 1
vid
eo to
lls.
Elec
troni
c ra
tes
are
65 p
er c
ent o
f vid
eo ra
tes.
2009 Update for Monroe Connector/Bypass
Preliminary Traffic and Revenue Study
April 9, 2009 Page 8
Tabl
e 1-
2R
ecom
men
ded
Annu
al T
oll R
ates
by
Tolli
ng Z
one
Cla
ss 1
- ET
C a
nd V
ideo
Mon
roe
Con
nect
or/B
ypas
s Pr
elim
inar
y St
udy
Upd
ate,
Alte
rnat
ive
2
Mai
nlin
e 1
US
74 -
Aust
in
Cha
ney
Roa
d
Mai
nlin
e 2
Aust
in C
hane
yR
oad
- NC
200
Ram
p 1
NC
601
Mai
nlin
e 3
US
601
- Roc
ky R
iver
R
oad
Ram
p 2
Uni
onvi
lle -
Indi
an
Trai
l Roa
d
Mai
nlin
e 4
Uni
onvi
lle-In
dian
Tr
ail R
oad
- Ind
ian
Trai
l Fai
rvie
w R
oad
Mai
nlin
e 5
BIn
dian
Tra
il - F
airv
iew
R
oad
-U
S 74
Mai
nlin
e 6
US
74Ye
arET
CVi
deo
ETC
Vide
oET
CVi
deo
ETC
Vide
oET
CVi
deo
ETC
Vide
oET
CVi
deo
ETC
Vide
o20
14$0
.39
$0.6
0$0
.52
$0.8
0$0
.30
$0.4
5$0
.75
$1.1
5$0
.30
$0.4
5$0
.46
$0.7
0$0
.39
$0.6
0$0
.30
$0.4
520
15$0
.39
$0.6
0$0
.52
$0.8
0$0
.30
$0.4
5$0
.75
$1.1
5$0
.30
$0.4
5$0
.46
$0.7
0$0
.39
$0.6
0$0
.30
$0.4
520
16$0
.41
$0.6
2$0
.54
$0.8
3$0
.31
$0.4
7$0
.78
$1.1
9$0
.31
$0.4
7$0
.48
$0.7
3$0
.41
$0.6
2$0
.31
$0.4
720
17$0
.42
$0.6
4$0
.56
$0.8
6$0
.32
$0.4
9$0
.80
$1.2
3$0
.32
$0.4
9$0
.50
$0.7
6$0
.42
$0.6
4$0
.32
$0.4
920
18$0
.43
$0.6
6$0
.58
$0.8
9$0
.34
$0.5
1$0
.83
$1.2
7$0
.34
$0.5
1$0
.52
$0.7
9$0
.43
$0.6
6$0
.34
$0.5
120
19$0
.45
$0.6
8$0
.60
$0.9
2$0
.35
$0.5
3$0
.86
$1.3
2$0
.35
$0.5
3$0
.54
$0.8
2$0
.45
$0.6
8$0
.35
$0.5
320
20$0
.47
$0.7
2$0
.63
$0.9
6$0
.36
$0.5
4$0
.90
$1.3
7$0
.36
$0.5
4$0
.55
$0.8
4$0
.47
$0.7
2$0
.36
$0.5
420
21$0
.49
$0.7
5$0
.65
$1.0
0$0
.37
$0.5
6$0
.93
$1.4
2$0
.37
$0.5
6$0
.57
$0.8
7$0
.49
$0.7
5$0
.37
$0.5
620
22$0
.51
$0.7
8$0
.68
$1.0
4$0
.38
$0.5
8$0
.96
$1.4
7$0
.38
$0.5
8$0
.59
$0.9
0$0
.51
$0.7
8$0
.38
$0.5
820
23$0
.53
$0.8
1$0
.71
$1.0
8$0
.39
$0.6
0$0
.99
$1.5
2$0
.39
$0.6
0$0
.61
$0.9
3$0
.53
$0.8
1$0
.39
$0.6
020
24$0
.55
$0.8
4$0
.73
$1.1
2$0
.41
$0.6
2$1
.03
$1.5
8$0
.41
$0.6
2$0
.63
$0.9
6$0
.55
$0.8
4$0
.41
$0.6
220
25$0
.56
$0.8
6$0
.75
$1.1
5$0
.42
$0.6
4$1
.07
$1.6
4$0
.42
$0.6
4$0
.65
$1.0
0$0
.56
$0.8
6$0
.42
$0.6
420
26$0
.58
$0.8
9$0
.78
$1.1
9$0
.43
$0.6
5$1
.11
$1.7
0$0
.43
$0.6
5$0
.68
$1.0
4$0
.59
$0.9
0$0
.43
$0.6
520
27$0
.60
$0.9
2$0
.80
$1.2
3$0
.43
$0.6
6$1
.15
$1.7
6$0
.43
$0.6
6$0
.71
$1.0
8$0
.62
$0.9
4$0
.43
$0.6
620
28$0
.62
$0.9
5$0
.83
$1.2
7$0
.44
$0.6
7$1
.19
$1.8
2$0
.44
$0.6
7$0
.73
$1.1
2$0
.64
$0.9
8$0
.44
$0.6
720
29$0
.64
$0.9
8$0
.86
$1.3
1$0
.45
$0.6
8$1
.23
$1.8
8$0
.45
$0.6
8$0
.76
$1.1
6$0
.67
$1.0
2$0
.45
$0.6
820
30$0
.65
$1.0
0$0
.88
$1.3
5$0
.46
$0.7
0$1
.27
$1.9
5$0
.46
$0.7
0$0
.78
$1.2
0$0
.69
$1.0
5$0
.46
$0.7
020
31$0
.68
$1.0
4$0
.91
$1.4
0$0
.48
$0.7
3$1
.32
$2.0
2$0
.48
$0.7
3$0
.81
$1.2
4$0
.71
$1.0
9$0
.48
$0.7
320
32$0
.71
$1.0
8$0
.95
$1.4
5$0
.50
$0.7
6$1
.36
$2.0
9$0
.50
$0.7
6$0
.84
$1.2
8$0
.74
$1.1
3$0
.50
$0.7
620
33$0
.73
$1.1
2$0
.98
$1.5
0$0
.52
$0.7
9$1
.42
$2.1
7$0
.52
$0.7
9$0
.87
$1.3
3$0
.77
$1.1
7$0
.52
$0.7
920
34$0
.76
$1.1
6$1
.01
$1.5
5$0
.54
$0.8
2$1
.47
$2.2
5$0
.54
$0.8
2$0
.90
$1.3
8$0
.79
$1.2
1$0
.54
$0.8
220
35$0
.78
$1.1
9$1
.05
$1.6
1$0
.55
$0.8
4$1
.52
$2.3
3$0
.55
$0.8
4$0
.93
$1.4
3$0
.82
$1.2
5$0
.55
$0.8
4
Not
e:C
lass
2 to
lls a
re tw
o tim
es th
e C
lass
1 v
ideo
tolls
.C
lass
3 to
lls a
re fo
ur ti
mes
the
Cla
ss 1
vid
eo to
lls.
Elec
troni
c ra
tes
are
65 p
er c
ent o
f vid
eo ra
tes.

2009 Update for Monroe Connector/Bypass
Preliminary Traffic and Revenue Study
April 9, 2009 Page 9
Table 2-1Maximum Class 1 Vehicle Toll Rates
Monroe Connector/Bypass Preliminary Study UpdateAlternative 1
2009 Update to Preliminary Study 2006 Preliminary StudyETC Video Cash/ETC
Year TollToll per
Mile TollToll per
Mile TollToll per
Mile
2015 $2.51 $0.129 $3.85 $0.198 $2.50 $0.1282020 $3.02 $0.155 $4.61 $0.237 $3.00 $0.1542025 $3.59 $0.184 $5.51 $0.283 $3.50 $0.1802030 $4.27 $0.219 $6.55 $0.336 $4.00 $0.205
Table 2-2Maximum Class 1 Vehicle Toll Rates
Monroe Connector/Bypass Preliminary Study UpdateAlternative 2
2009 Update to Preliminary Study 2006 Preliminary StudyETC Video Cash/ETC
Year TollToll per
Mile TollToll per
Mile TollToll per
Mile
2015 $2.51 $0.127 $3.85 $0.1942020 $3.02 $0.152 $4.61 $0.2322025 $3.59 $0.181 $5.51 $0.2782030 $4.27 $0.215 $6.55 $0.330
Not Analyzed
ESTIMATED WEEKDAY TRAFFIC VOLUMES
Estimates of weekday traffic volumes in 2015 and 2030 are shown in Figures 8 and 9 for Alter-natives 1 and 2 respectively. The highest volume would occur between Indian Trail-Fairview Road and Stalling Road for Alternative 1 where approximately 35,600 vehicles would use the facility in 2015. The expected volume west of Stallings Road would drop to approximately

Proposed Monroe Connector/Bypass Preliminary Traffic and Revenue Study - 2009 UpdateNC 103171 / 1-27-09 / Landscape.ppt
FIGURE 8
Indian
Trail
-Fairv
iew R
d.
Union
ville I
ndian
Trail
Rd.
Austi
n Cha
ney R
d.
ESTIMATED 2015 AND 2030 WEEKDAY TRAFFIC VOLUMESALTERNATIVE 1
Stallin
gs R
d.
Fores
t Hills
Scho
ol Rd
.
North
Roc
ky R
iver R
d.
Conc
ord H
wy.
Morga
n Mill R
d.
SchematicNot To Scale
LEGEND
Monroe Connector/Bypass
Mainline Toll Zone
Ramp Toll Zone
0.00.0
20152030
Note: All traffic volumes shown represent thousands of vehicles.
14.423.9
14.423.9
2.44.4
2.44.4
3.75.9
3.75.9
1.12.6
1.12.6
2.63.0
2.63.0 0.6
1.9
0.61.9 2.4
5.4
2.45.4
0.51.5
0.51.5
3.66.0
3.66.0
1.12.4
1.12.4 3.4
5.5
3.45.5
0.50.7
0.50.7
1.33.3
1.33.3
0.60.7
0.60.7
0.20.6
0.20.6
5.07.8
5.07.8
10.015.6
10.416.8
11.822.0
17.631.6
22.640.0
26.447.8
30.450.0
35.656.6
28.847.8

Proposed Monroe Connector/Bypass Preliminary Traffic and Revenue Study - 2009 UpdateNC 103171 / 1-27-09 / Landscape.ppt
FIGURE 9
Indian
Trail
-Fairv
iew R
d.
Union
ville I
ndian
Trail
Rd.
Austi
n Cha
ney R
d.
Fores
t Hills
Scho
ol Rd
.
North
Roc
ky R
iver R
d.
Conc
ord H
wy.
Morga
n Mill R
d.
LEGEND
Monroe Connector/Bypass
Mainline Toll Zone
Ramp Toll Zone
0.00.0
20152030
Note: All traffic volumes shown represent thousands of vehicles.
ESTIMATED 2015 AND 2030 WEEKDAY TRAFFIC VOLUMESALTERNATIVE 2
2.55.0
2.55.0
1.54.3
1.54.3
2.52.7
2.52.7 0.5
1.8
0.51.8 1.9
5.1
1.95.1
0.50.9
0.50.9
22.639.6
25.448.0
29.449.8
3.56.3
3.56.3
1.12.4
1.12.4
3.35.6
3.35.6
0.40.7
0.40.7
1.33.3
1.33.3
0.60.8
0.60.8
0.20.7
0.20.7
5.17.8
5.17.8
10.215.6
10.617.0
12.022.0
17.831.8
Bus
McKe
e Rd.
Stallin
gs R
d.
SchematicNot To Scale
McKe
e Rd.
Stallin
gs R
d. Bus
See Inset
Inset
31.443.6
19.116.5
19.214.7
28.421.5
31.443.6
0.51.39.7
8.1
19.116.5
28.421.5
88.097.8
49.864.8
9.78.1
19.214.7
0.51.3

2009 Update for Monroe Connector/Bypass
Preliminary Traffic and Revenue Study
April 9, 2009 Page 10
29,000 vpd, which indicates that the Stallings Road interchange provides significant traffic to the toll road. Volumes east of US 601 in 2015 would be less than 18,000 vpd. By 2030 the maxi-mum volume would be nearly 57,000 vpd. Under Alternative 2, the maximum load point on the Monroe Connector/Bypass would be between Indian Trail-Fairview Road and US 74 with a vol-ume of 31,400 vpd. However, the tolled section of US 74 has a significantly higher volume at 49,800 vpd in 2015 because it includes not only the tolled traffic from the Monroe Connec-tor/Bypass but also the toll traffic from US 74. Tables 3-1 and 3-2 summarize the average trip length and number of transactions per trip by ve-hicle class and toll collection method for Alternatives 1 and 2 respectively. The average trip is expected to be approximately 9.3 miles long for Alternative 1 and 10.0 miles for the slightly longer Alternative 2. The average trip would use 2.6 toll zones for Alternative 1 and 2.7 toll zones for Alternative 2. Similar patterns with slightly different averages are expected by vehicle class and collection method.
ESTIMATED ANNUAL TOLL TRANSACTIONS AND REVENUE
Weekday traffic by vehicle class was calculated for each tolling zone and multiplied by the ETC or video toll rate to develop estimates of weekday revenue. The weekday revenue estimates were then annualized based on 319 equivalent weekdays per year which assumes lower weekend and holiday traffic. For annualization purposes, it was assumed that average weekend-day traffic would be 60 percent of average weekday traffic. The annualized transactions and revenues in the early years of operation were further adjusted to reflect “ramp-up.” Ramp-up is the phenomenon experienced on most start-up toll facilities in which high levels of growth may be experienced over the first three years or so of operation as the motoring public gradually becomes aware of and begins using the new facility. ANNUAL TRANSACTIONS Estimated annual toll transactions by vehicle class and year are shown in Table 4-1 and 4-2 for the two alternatives. Figure 10 depicts the transactions stream graphically. For Alternative 1, annual transactions are expected to increase from about 4.4 million in the second half of FY 2014 to 61.2 million by FY 2030. Traffic estimates for FY 2014 through 2017 were adjusted downward to reflect the impact of successive ramp-up periods. In contrast, the opening six-month transactions for Alternative 2 are 5.1 million and rising to 64.8 million for FY 2030. The main reason for the higher toll traffic in Alternative 2 is the inclusion of a tolling zone on US 74.

2009 Update for Monroe Connector/Bypass
Preliminary Traffic and Revenue Study
April 9, 2009 Page 11
Tabl
e 3-
1Av
erag
e D
aily
Tra
nsac
tions
and
Trip
Len
gth
Mon
roe
Con
nect
or/B
ypas
s Pr
elim
inar
y St
udy
Upd
ate,
Alte
rnat
ive
1
Cla
ss 1
Veh
icle
s - E
TCC
lass
1 V
ehic
les
- Vid
eoC
lass
1 V
ehic
les
- Tot
al
Year
Aver
age
Trip
Le
ngth
(M
iles)
Aver
age
Tran
sact
ions
pe
r Trip
Aver
age
Trip
Le
ngth
(M
iles)
Aver
age
Tran
sact
ions
pe
r Trip
Aver
age
Trip
Le
ngth
(M
iles)
Aver
age
Tran
sact
ions
pe
r Trip
2015
9.34
2.64
9.12
2.60
9.28
2.63
2020
9.51
2.68
9.27
2.64
9.46
2.67
2025
9.43
2.62
9.22
2.59
9.41
2.62
2030
8.98
2.52
8.77
2.48
8.96
2.51
Cla
ss 1
and
3 V
ehic
les
- ETC
Cla
ss 2
and
3 V
ehic
les
- Vid
eoC
lass
2 a
nd 3
Veh
icle
s - T
otal
Year
Aver
age
Trip
Le
ngth
(M
iles)
Aver
age
Tran
sact
ions
pe
r Trip
Aver
age
Trip
Le
ngth
(M
iles)
Aver
age
Tran
sact
ions
pe
r Trip
Aver
age
Trip
Le
ngth
(M
iles)
Aver
age
Tran
sact
ions
pe
r Trip
2015
9.52
2.66
9.20
2.61
9.54
2.60
2020
9.65
2.69
9.25
2.62
9.61
2.77
2025
9.50
2.63
9.13
2.57
9.46
2.61
2030
8.89
2.50
8.52
2.43
8.85
2.51
Tota
l ETC
Tota
l Vid
eoTo
tal V
ehic
les
Year
Aver
age
Trip
Le
ngth
(M
iles)
Aver
age
Tran
sact
ions
pe
r Trip
Aver
age
Trip
Le
ngth
(M
iles)
Aver
age
Tran
sact
ions
pe
r Trip
Aver
age
Trip
Le
ngth
(M
iles)
Aver
age
Tran
sact
ions
pe
r Trip
2015
9.35
2.64
9.12
2.61
9.29
2.63
2020
9.51
2.68
9.27
2.63
9.47
2.67
2025
9.44
2.62
9.22
2.59
9.41
2.62
2030
8.98
2.52
8.76
2.49
8.95
2.51

2009 Update for Monroe Connector/Bypass
Preliminary Traffic and Revenue Study
April 9, 2009 Page 12
Tabl
e 3-
2Av
erag
e D
aily
Tra
nsac
tions
and
Trip
Len
gth
Mon
roe
Con
nect
or/B
ypas
s Pr
elim
inar
y St
udy
Upd
ate,
Alte
rnat
ive
2
Cla
ss 1
Veh
icle
s - E
TCC
lass
1 V
ehic
les
- Vid
eoC
lass
1 V
ehic
les
- Tot
al
Year
Aver
age
Trip
Le
ngth
(M
iles)
Aver
age
Tran
sact
ions
pe
r Trip
Aver
age
Trip
Le
ngth
(M
iles)
Aver
age
Tran
sact
ions
pe
r Trip
Aver
age
Trip
Le
ngth
(M
iles)
Aver
age
Tran
sact
ions
pe
r Trip
2015
9.99
2.67
9.80
2.63
9.94
2.66
2020
9.86
2.61
9.65
2.57
9.82
2.61
2025
9.86
2.61
9.67
2.57
9.84
2.60
2030
9.45
2.53
9.26
2.50
9.43
2.52
Cla
ss 2
and
3 V
ehic
les
- ETC
Cla
ss 2
and
3 V
ehic
les
- Vid
eoC
lass
2 a
nd 3
Veh
icle
s - T
otal
Year
Aver
age
Trip
Le
ngth
(M
iles)
Aver
age
Tran
sact
ions
pe
r Trip
Aver
age
Trip
Le
ngth
(M
iles)
Aver
age
Tran
sact
ions
pe
r Trip
Aver
age
Trip
Le
ngth
(M
iles)
Aver
age
Tran
sact
ions
pe
r Trip
2015
10.0
32.
669.
722.
6110
.05
2.74
2020
9.92
2.62
9.55
2.55
9.96
2.68
2025
9.84
2.60
9.59
2.55
9.92
2.60
2030
9.28
2.50
8.90
2.43
9.13
2.48
Tota
l ETC
Tota
l Vid
eoTo
tal V
ehic
les
Year
Aver
age
Trip
Le
ngth
(M
iles)
Aver
age
Tran
sact
ions
pe
r Trip
Aver
age
Trip
Le
ngth
(M
iles)
Aver
age
Tran
sact
ions
pe
r Trip
Aver
age
Trip
Le
ngth
(M
iles)
Aver
age
Tran
sact
ions
pe
r Trip
2015
9.99
2.67
9.80
2.63
10.0
02.
6620
209.
862.
619.
642.
579.
822.
6120
259.
862.
619.
682.
589.
842.
6020
309.
452.
539.
262.
509.
432.
52

2009 Update for Monroe Connector/Bypass
Preliminary Traffic and Revenue Study
April 9, 2009 Page 13
Tabl
e 4-
1An
nual
Tol
l Tra
nsac
tions
(Fis
cal Y
ear)
Mon
roe
Con
nect
or/B
ypas
s Pr
elim
inar
y St
udy
Upd
ate,
Alte
rnat
ive
1(T
hous
ands
)
Cla
ss 1
Cla
ss 2
Cla
ss 3
Fisc
al
Year
ETC
Vide
oTo
tal C
lass
1ET
CVi
deo
Tota
l Cla
ss 2
ETC
Vide
oTo
tal C
lass
3To
tal
Tran
sact
ions
Perc
ent
ETC
2014
(1)
3,12
41,
181
4,30
544
448
737
804,
433
73.1
%20
1518
,997
6,52
325
,520
258
2428
243
340
473
26,2
7574
.9%
2016
25,0
357,
815
32,8
5032
928
357
553
4760
033
,807
76.7
%20
1730
,032
8,52
138
,553
382
3041
264
350
693
39,6
5878
.3%
2018
31,5
458,
529
40,0
7439
530
425
664
5071
441
,213
79.1
%20
1933
,898
8,33
142
,229
411
2843
969
148
739
43,4
0780
.6%
2020
36,4
268,
138
44,5
6442
827
455
719
4676
545
,784
82.1
%20
2138
,624
7,95
546
,579
441
2746
874
146
787
47,8
3483
.2%
2022
40,4
417,
783
48,2
2445
028
478
756
4780
349
,505
84.1
%20
2342
,344
7,61
449
,958
459
2948
877
248
820
51,2
6685
.0%
2024
44,3
387,
449
51,7
8746
829
497
787
4983
653
,120
85.8
%20
2546
,427
7,28
853
,715
478
3050
880
451
855
55,0
7886
.6%
2026
48,1
137,
110
55,2
2348
531
516
816
5186
756
,606
87.3
%20
2749
,370
6,91
956
,289
490
3152
182
451
875
57,6
8587
.9%
2028
50,6
736,
734
57,4
0749
531
526
833
5188
458
,817
88.4
%20
2952
,023
6,55
758
,580
501
3153
284
251
893
60,0
0588
.9%
2030
53,4
246,
386
59,8
1050
631
537
851
5290
361
,250
89.4
%20
3154
,679
6,36
561
,044
514
3154
586
452
916
62,5
0589
.7%
2032
55,7
726,
493
62,2
6552
432
556
881
5393
463
,755
89.7
%20
3356
,888
6,62
363
,511
535
3256
789
954
953
65,0
3189
.7%
2034
58,0
256,
755
64,7
8054
533
578
917
5597
266
,330
89.7
%20
3559
,186
6,89
066
,076
556
3459
093
556
991
67,6
5789
.7%
2036
60,3
707,
028
67,3
9856
734
601
954
581,
012
69,0
1189
.7%
2037
61,5
777,
169
68,7
4657
935
614
973
591,
032
70,3
9289
.7%
2038
62,8
097,
312
70,1
2159
036
626
992
601,
052
71,7
9989
.7%
2039
64,0
657,
458
71,5
2360
236
638
1,01
261
1,07
373
,234
89.7
%20
4065
,346
7,60
772
,953
614
3765
11,
032
621,
094
74,6
9889
.7%
2041
66,4
887,
740
74,2
2862
538
663
1,05
063
1,11
376
,004
89.7
%20
4267
,485
7,85
675
,341
634
3867
21,
066
641,
130
77,1
4389
.7%
2043
68,4
987,
974
76,4
7264
439
683
1,08
265
1,14
778
,302
89.7
%20
4469
,525
8,09
477
,619
653
3969
21,
098
661,
164
79,4
7589
.7%
2045
70,5
688,
215
78,7
8366
340
703
1,11
567
1,18
280
,668
89.7
%20
4671
,626
8,33
879
,964
673
4171
41,
132
681,
200
81,8
7889
.7%
2047
72,7
018,
464
81,1
6568
341
724
1,14
969
1,21
883
,107
89.7
%20
4873
,791
8,59
082
,381
694
4273
61,
166
701,
236
84,3
5389
.7%
2049
74,8
988,
719
83,6
1770
442
746
1,18
371
1,25
485
,617
89.7
%20
5076
,022
8,85
084
,872
714
4375
71,
201
721,
273
86,9
0289
.7%
2051
77,1
628,
983
86,1
4572
544
769
1,21
974
1,29
388
,207
89.7
%20
5278
,319
9,11
887
,437
736
4478
01,
237
751,
312
89,5
2989
.7%
2053
79,4
949,
254
88,7
4874
745
792
1,25
676
1,33
290
,872
89.7
%20
5480
,687
9,39
390
,080
758
4680
41,
275
771,
352
92,2
3689
.7%
(1) F
Y 20
14, J
anua
ry -
June
onl
y.
Not
e: F
orec
asts
for F
Y 20
14 -
2017
refle
ct a
n as
sum
ed ra
mp-
up to
full
traffi
c vo
lum
es b
egin
ning
in th
e se
cond
hal
f of F
Y 20
17.

2009 Update for Monroe Connector/Bypass
Preliminary Traffic and Revenue Study
April 9, 2009 Page 14
Tabl
e 4-
2An
nual
Tol
l Tra
nsac
tions
(Fis
cal Y
ear)
Mon
roe
Con
nect
or/B
ypas
s Pr
elim
inar
y St
udy
Upd
ate,
Alte
rnat
ive
2(T
hous
ands
)
Cla
ss 1
Cla
ss 2
Cla
ss 3
Fisc
al
Year
ETC
Vide
oTo
tal C
lass
1ET
CVi
deo
Tota
l Cla
ss 2
ETC
Vide
oTo
tal C
lass
3To
tal
Tran
sact
ions
Perc
ent
ETC
2014
(1)
3,56
11,
392
4,95
349
554
829
915,
098
72.4
%20
1521
,260
7,49
628
,756
283
2731
047
645
521
29,5
8774
.4%
2016
27,8
038,
886
36,6
8935
831
389
603
5365
637
,734
76.2
%20
1733
,113
9,59
442
,707
413
3344
669
456
750
43,9
0377
.9%
2018
34,6
629,
560
44,2
2242
533
458
714
5576
945
,449
78.8
%20
1937
,006
9,25
746
,263
439
3147
073
852
790
47,5
2380
.3%
2020
39,5
288,
969
48,4
9745
330
483
762
5081
249
,792
81.8
%20
2141
,923
8,76
350
,686
468
3049
878
750
837
52,0
2183
.0%
2022
44,1
618,
632
52,7
9348
331
514
812
5286
454
,171
83.9
%20
2346
,520
8,50
355
,023
498
3253
083
854
892
56,4
4584
.8%
2024
49,0
098,
377
57,3
8651
434
548
864
5792
158
,855
85.6
%20
2551
,634
8,25
459
,888
531
3556
689
259
951
61,4
0586
.4%
2026
53,3
398,
024
61,3
6353
836
574
904
6096
462
,901
87.1
%20
2754
,071
7,69
761
,768
537
3557
290
259
961
63,3
0187
.7%
2028
54,8
427,
386
62,2
2853
534
569
900
5795
763
,754
88.3
%20
2955
,653
7,09
362
,746
534
3456
889
856
954
64,2
6888
.8%
2030
56,5
066,
815
63,3
2153
333
566
897
5595
264
,839
89.4
%20
3157
,513
6,74
764
,260
538
3357
190
555
960
65,7
9189
.6%
2032
58,6
636,
882
65,5
4554
934
583
923
5798
067
,108
89.6
%20
3359
,836
7,01
966
,855
560
3459
494
258
1,00
068
,449
89.6
%20
3461
,033
7,16
068
,193
571
3560
696
059
1,01
969
,818
89.6
%20
3562
,254
7,30
369
,557
583
3661
998
060
1,04
071
,216
89.6
%20
3663
,499
7,44
970
,948
594
3663
099
961
1,06
072
,638
89.6
%20
3764
,769
7,59
872
,367
606
3764
31,
019
621,
081
74,0
9189
.6%
2038
66,0
647,
750
73,8
1461
838
656
1,04
064
1,10
475
,574
89.6
%20
3967
,385
7,90
575
,290
631
3967
01,
060
651,
125
77,0
8589
.6%
2040
68,7
338,
063
76,7
9664
339
682
1,08
266
1,14
878
,626
89.6
%20
4169
,934
8,20
478
,138
655
4069
51,
101
671,
168
80,0
0189
.6%
2042
70,9
838,
327
79,3
1066
541
706
1,11
768
1,18
581
,201
89.6
%20
4372
,048
8,45
280
,500
675
4171
61,
134
691,
203
82,4
1989
.6%
2044
73,1
298,
578
81,7
0768
542
727
1,15
170
1,22
183
,655
89.6
%20
4574
,226
8,70
782
,933
695
4373
81,
168
721,
240
84,9
1189
.6%
2046
75,3
398,
838
84,1
7770
543
748
1,18
673
1,25
986
,184
89.6
%20
4776
,469
8,97
085
,439
716
4476
01,
203
741,
277
87,4
7689
.6%
2048
77,6
169,
105
86,7
2172
744
771
1,22
175
1,29
688
,788
89.6
%20
4978
,780
9,24
188
,021
738
4578
31,
240
761,
316
90,1
2089
.6%
2050
79,9
629,
380
89,3
4274
946
795
1,25
877
1,33
591
,472
89.6
%20
5181
,161
9,52
190
,682
760
4780
71,
277
781,
355
92,8
4489
.6%
2052
82,3
799,
664
92,0
4377
147
818
1,29
679
1,37
594
,236
89.6
%20
5383
,615
9,80
993
,424
783
4883
11,
316
811,
397
95,6
5289
.6%
2054
84,8
699,
956
94,8
2579
549
844
1,33
682
1,41
897
,087
89.6
%
(1) F
Y 20
14, J
anua
ry -
June
onl
y.
Not
e: F
orec
asts
for F
Y 20
14 -
2017
refle
ct a
n as
sum
ed ra
mp-
up to
full
traffi
c vo
lum
es b
egin
ning
in th
e se
cond
hal
f of F
Y 20
17.

Proposed Monroe Connector/BypassPreliminary Traffic and Revenue Study - 2009 UpdateNC 130171 / 1-27-09 / Portrait.ppt
ANNUAL TRANSACTION FORECASTFIGURE 10
0
20
40
60
80
100
120
2010 2015 2020 2025 2030 2035 2040 2045 2050 2055 2060Fiscal Year
Total
Tran
sacti
ons (
Millio
ns)
$0
$20
$40
$60
$80
$100
$120
$140
$160
2010 2015 2020 2025 2030 2035 2040 2045 2050 2055 2060Fiscal Year
Toll R
even
ue (M
illion
s)
ANNUAL REVENUE FORECASTFIGURE 11
Alternative 1Alternative 2
LEGEND
Alternative 1 - GrossAlternative 1 – Net of Leakage
LEGEND
Alternative 2 - GrossAlternative 2 – Net of Leakage
2009 Update for Monroe Connector/Bypass
Preliminary Traffic and Revenue Study
April 9, 2009 Page 15
Electronic toll transactions are expected to be the largest proportion of users and are estimated to increase from 72 to 74 percent in the early period to nearly 90 percent by about FY 2031. Note that transaction estimates through 2030 are based on a detailed modeling analysis. Transactions between 2030 and 2055 were assumed to grow at the same rates assumed for the 2006 study. ANNUAL GROSS REVENUE Annual gross revenue estimates for the two alternatives are provided in Tables 5-1 and 5-2 illus-trated in Figure 11. Revenue estimates are presented for each vehicles class by toll rate. For Al-ternative 1, the total annual gross revenue is expected to increase from about $2.6 million in the last half of FY 2015 and rising to $56.4 million by FY 2030. Revenues are higher for Alterna-tive 2 because of the tolling of US 74, as discussed earlier. For Alternative 2, the opening year gross revenue is estimated at $2.8 million, and the FY 2030 revenue is estimated at $57.7 mil-lion. These forecasts reflect the impact of both traffic growth and annual toll adjustments. Reve-nue estimates during FY 2014 through FY 2017 were adjusted to reflect a progressive ramp-up pattern. Electronic tolls are expected to account for between 65 and 86 percent of total revenue for the two alternatives. These are lower percentages than the proportion of transactions, but reflect the fact that video users are assessed a significant premium toll charge. COMPARISON TO 2006 PRELIMINARY STUDY Table 6 compares the current gross toll revenue forecasts with the forecasts contained in the 2006 preliminary study. The comparison is on a calendar year basis since the 2006 study was conducted on a calendar basis. The differences are attributable to the changes in the toll collec-tion system and the higher rates for video customers. The ETC rates on a per mile basis are nearly the same as in the 2006 study, but these rates represent a 35 percent discount from video rates, which were not included in 2006. If the revenue stream is discounted by a standard rate and then totaled for a net present value in 2014 dollars, then the Alternative 1 gross revenue is higher than the preliminary study gross revenue for both alternatives. For Alternative 2, the pre-sent value of the revenue stream is estimated to be somewhat higher than for Alternative 1. REVENUE COLLECTION AND LEAKAGE The NCTA is planning to minimize revenue losses due to leakage by developing a system that is an adaptation of two toll collection systems: Open Road Tolling (ORT) using ETC supple-mented by automated video imaging that will serve both as the primary collection system and as the violation enforcement system. The system assumed for the Monroe Connector/Bypass is the same as the system being planned for the Triangle Expressway. The same capture rate and col-lection assumptions were carried to the current project. Tables 7-1 and 7-2 contain the transac-tion estimates for each alternative so that estimates of revenue net of leakage can be developed.

2009 Update for Monroe Connector/Bypass
Preliminary Traffic and Revenue Study
April 9, 2009 Page 16
Tabl
e 5-
1An
nual
Gro
ss T
oll R
even
ue (F
isca
l Yea
r)M
onro
e C
onne
ctor
/Byp
ass
Prel
imin
ary
Stud
y U
pdat
e, A
ltern
ativ
e 1
(Tho
usan
ds)
Cla
ss 1
Cla
ss 2
Cla
ss 3
Fisc
al
Year
ETC
Vide
oTo
tal C
lass
1ET
CVi
deo
Tota
l Cla
ss 2
ETC
Vide
oTo
tal C
lass
3To
tal G
ross
R
even
ue (2
)Pe
rcen
tET
C
2014
(1)
$1,5
29$8
78$2
,407
$43
$7$5
0$1
45$2
2$1
67$2
,624
65.4
%20
159,
336
4,87
214
,208
256
3629
285
912
097
915
,479
67.5
%20
1612
,858
6,05
718
,915
339
4438
31,
140
147
1,28
720
,585
69.6
%20
1715
,910
6,84
522
,755
409
4845
71,
371
163
1,53
424
,746
71.5
%20
1817
,015
6,97
023
,985
430
4947
91,
442
164
1,60
626
,070
72.4
%20
1918
,977
7,05
126
,028
463
4951
21,
555
163
1,71
828
,258
74.3
%20
2021
,212
7,15
928
,371
501
4854
91,
682
163
1,84
530
,765
76.0
%20
2123
,348
7,28
330
,631
537
5058
71,
801
168
1,96
933
,187
77.4
%20
2225
,357
7,39
832
,755
568
5362
11,
905
179
2,08
435
,460
78.5
%20
2327
,526
7,50
635
,032
600
5765
72,
014
190
2,20
437
,893
79.5
%20
2429
,872
7,61
237
,484
635
6069
52,
129
202
2,33
140
,510
80.6
%20
2532
,310
7,71
040
,020
670
6473
42,
248
215
2,46
343
,217
81.5
%20
2634
,697
7,79
442
,491
703
6777
02,
361
225
2,58
645
,847
82.4
%20
2737
,063
7,87
144
,934
736
7080
62,
472
234
2,70
648
,446
83.1
%20
2839
,387
7,94
047
,327
770
7284
22,
585
242
2,82
750
,996
83.8
%20
2941
,851
7,99
949
,850
804
7587
92,
699
251
2,95
053
,679
84.5
%20
3044
,363
8,04
652
,409
838
7791
52,
812
259
3,07
156
,395
85.1
%20
3146
,572
8,24
654
,818
874
8095
42,
931
269
3,20
058
,972
85.4
%20
3248
,668
8,61
757
,285
913
8499
73,
063
281
3,34
461
,626
85.4
%20
3350
,858
9,00
559
,863
954
871,
041
3,20
129
33,
494
64,3
9885
.4%
2034
53,1
479,
410
62,5
5799
791
1,08
83,
345
307
3,65
267
,297
85.4
%20
3555
,538
9,83
465
,372
1,04
295
1,13
73,
496
321
3,81
770
,326
85.4
%20
3658
,037
10,2
7668
,313
1,08
910
01,
189
3,65
333
53,
988
73,4
9085
.4%
2037
60,6
4910
,739
71,3
881,
138
104
1,24
23,
818
350
4,16
876
,798
85.4
%20
3863
,378
11,2
2274
,600
1,18
910
91,
298
3,98
936
64,
355
80,2
5385
.4%
2039
66,2
3011
,727
77,9
571,
242
114
1,35
64,
169
382
4,55
183
,864
85.4
%20
4069
,211
12,2
5481
,465
1,29
811
91,
417
4,35
639
94,
755
87,6
3785
.4%
2041
72,1
4812
,775
84,9
231,
353
124
1,47
74,
541
416
4,95
791
,357
85.4
%20
4275
,034
13,2
8688
,320
1,40
712
91,
536
4,72
343
35,
156
95,0
1285
.4%
2043
78,0
3613
,817
91,8
531,
464
134
1,59
84,
912
450
5,36
298
,813
85.4
%20
4481
,157
14,3
7095
,527
1,52
213
91,
661
5,10
846
85,
576
102,
764
85.4
%20
4584
,403
14,9
4499
,347
1,58
314
51,
728
5,31
348
75,
800
106,
875
85.4
%20
4687
,779
15,5
4210
3,32
11,
646
151
1,79
75,
525
507
6,03
211
1,15
085
.4%
2047
91,2
9116
,164
107,
455
1,71
215
71,
869
5,74
652
76,
273
115,
597
85.4
%20
4894
,942
16,8
1011
1,75
21,
781
163
1,94
45,
976
548
6,52
412
0,22
085
.4%
2049
98,7
4017
,483
116,
223
1,85
216
92,
021
6,21
557
06,
785
125,
029
85.4
%20
5010
2,68
918
,182
120,
871
1,92
617
62,
102
6,46
459
37,
057
130,
030
85.4
%20
5110
6,79
718
,909
125,
706
2,00
318
32,
186
6,72
261
67,
338
135,
230
85.4
%20
5211
1,06
919
,666
130,
735
2,08
319
12,
274
6,99
164
17,
632
140,
641
85.4
%20
5311
5,51
220
,452
135,
964
2,16
719
82,
365
7,27
166
77,
938
146,
267
85.4
%20
5412
0,13
221
,271
141,
403
2,25
320
62,
459
7,56
269
38,
255
152,
117
85.4
%
(1) F
Y 20
14, J
anua
ry -
June
onl
y.(2
) EXC
LUD
ES A
NY
ALLO
WAN
CE
FOR
UN
CO
LLEC
TIB
LE R
EVEN
UE.
Not
e: F
orec
asts
for F
Y 20
14 -
2017
refle
ct a
n as
sum
ed ra
mp-
up to
full
traffi
c vo
lum
es b
egin
ning
in th
e se
cond
hal
f of F
Y 20
17.

2009 Update for Monroe Connector/Bypass
Preliminary Traffic and Revenue Study
April 9, 2009 Page 17
Tabl
e 5-
2An
nual
Gro
ss T
oll R
even
ue (F
isca
l Yea
r)M
onro
e C
onne
ctor
/Byp
ass
Prel
imin
ary
Stud
y U
pdat
e, A
ltern
ativ
e 2
(Tho
usan
ds)
Cla
ss 1
Cla
ss 2
Cla
ss 3
Fisc
al
Year
ETC
Vide
oTo
tal C
lass
1ET
CVi
deo
Tota
l Cla
ss 2
ETC
Vide
oTo
tal C
lass
3To
tal G
ross
R
even
ue (2
)Pe
rcen
tET
C
2014
(1)
1,64
296
22,
604
467
5315
324
177
2,83
465
.0%
2015
9,93
85,
265
15,2
0326
838
306
898
128
1,02
616
,535
67.2
%20
1613
,601
6,50
420
,105
353
4639
91,
185
156
1,34
121
,845
69.3
%20
1716
,753
7,30
624
,059
422
5147
31,
416
171
1,58
726
,119
71.2
%20
1817
,895
7,42
025
,315
442
5149
31,
485
172
1,65
727
,465
72.2
%20
1919
,884
7,46
627
,350
474
5152
51,
591
170
1,76
129
,636
74.1
%20
2022
,116
7,53
329
,649
509
5055
91,
709
169
1,87
832
,086
75.8
%20
2124
,369
7,66
632
,035
547
5259
91,
834
175
2,00
934
,643
77.2
%20
2226
,635
7,84
934
,484
585
5664
11,
961
189
2,15
037
,275
78.3
%20
2329
,099
8,02
537
,124
625
6168
62,
096
205
2,30
140
,111
79.3
%20
2431
,811
8,20
440
,015
668
6673
42,
241
221
2,46
243
,211
80.3
%20
2534
,667
8,37
743
,044
713
7178
42,
392
239
2,63
146
,459
81.3
%20
2637
,131
8,44
345
,574
747
7482
12,
508
250
2,75
849
,153
82.2
%20
2739
,188
8,40
847
,596
772
7584
72,
593
254
2,84
751
,290
83.0
%20
2841
,175
8,36
749
,542
798
7787
52,
678
257
2,93
553
,352
83.7
%20
2943
,293
8,31
851
,611
823
7890
12,
763
261
3,02
455
,536
84.4
%20
3045
,427
8,26
353
,690
848
7992
72,
845
264
3,10
957
,726
85.1
%20
3147
,460
8,41
955
,879
879
8196
02,
951
272
3,22
360
,062
85.4
%20
3249
,596
8,79
858
,394
919
841,
003
3,08
428
43,
368
62,7
6585
.4%
2033
51,8
289,
194
61,0
2296
088
1,04
83,
222
297
3,51
965
,589
85.4
%20
3454
,160
9,60
863
,768
1,00
392
1,09
53,
367
310
3,67
768
,540
85.4
%20
3556
,597
10,0
4066
,637
1,04
896
1,14
43,
519
324
3,84
371
,624
85.4
%20
3659
,144
10,4
9269
,636
1,09
610
11,
197
3,67
733
84,
015
74,8
4885
.4%
2037
61,8
0610
,964
72,7
701,
145
105
1,25
03,
843
354
4,19
778
,217
85.4
%20
3864
,587
11,4
5776
,044
1,19
611
01,
306
4,01
637
04,
386
81,7
3685
.4%
2039
67,4
9411
,973
79,4
671,
250
115
1,36
54,
196
386
4,58
285
,414
85.4
%20
4070
,531
12,5
1283
,043
1,30
712
01,
427
4,38
540
44,
789
89,2
5985
.4%
2041
73,5
2413
,043
86,5
671,
362
125
1,48
74,
571
421
4,99
293
,046
85.4
%20
4276
,465
13,5
6490
,029
1,41
613
01,
546
4,75
443
85,
192
96,7
6785
.4%
2043
79,5
2414
,107
93,6
311,
473
135
1,60
84,
944
455
5,39
910
0,63
885
.4%
2044
82,7
0514
,671
97,3
761,
532
141
1,67
35,
142
473
5,61
510
4,66
485
.4%
2045
86,0
1315
,258
101,
271
1,59
314
61,
739
5,34
849
25,
840
108,
850
85.4
%20
4689
,454
15,8
6810
5,32
21,
657
152
1,80
95,
562
512
6,07
411
3,20
585
.4%
2047
93,0
3216
,503
109,
535
1,72
315
81,
881
5,78
453
26,
316
117,
732
85.4
%20
4896
,753
17,1
6311
3,91
61,
792
165
1,95
76,
016
554
6,57
012
2,44
385
.4%
2049
100,
623
17,8
5011
8,47
31,
864
171
2,03
56,
256
576
6,83
212
7,34
085
.4%
2050
104,
648
18,5
6412
3,21
21,
939
178
2,11
76,
506
599
7,10
513
2,43
485
.4%
2051
108,
834
19,3
0612
8,14
02,
016
185
2,20
16,
767
623
7,39
013
7,73
185
.4%
2052
113,
187
20,0
7913
3,26
62,
097
193
2,29
07,
037
648
7,68
514
3,24
185
.4%
2053
117,
715
20,8
8213
8,59
72,
181
200
2,38
17,
319
674
7,99
314
8,97
185
.4%
2054
122,
424
21,7
1714
4,14
12,
268
208
2,47
67,
612
700
8,31
215
4,92
985
.4%
(1) F
Y 20
14, J
anua
ry -
June
onl
y.(2
) EX
CLU
DES
AN
Y AL
LOW
AN
CE
FO
R U
NC
OLL
ECTI
BLE
RE
VEN
UE
.N
ote:
For
ecas
ts fo
r FY
2014
- 20
17 re
flect
an
assu
med
ram
p-up
to fu
ll tra
ffic
volu
mes
beg
inni
ng in
the
seco
nd h
alf o
f FY
2017
.
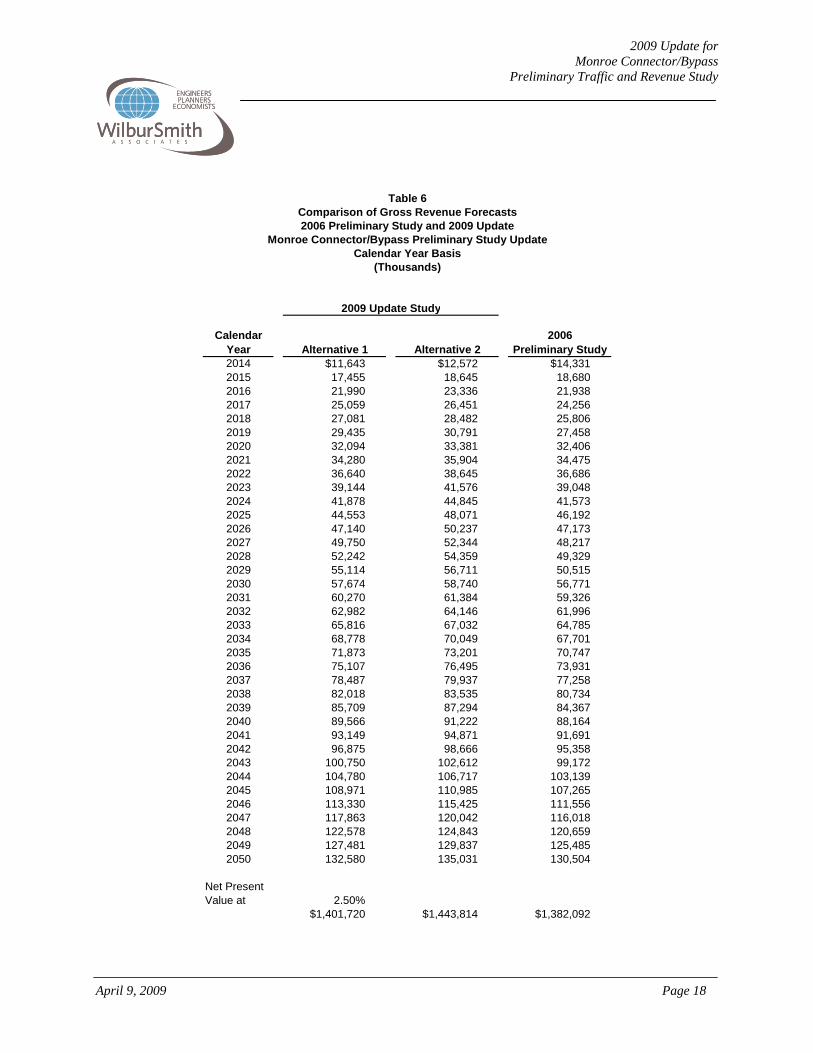
2009 Update for Monroe Connector/Bypass
Preliminary Traffic and Revenue Study
April 9, 2009 Page 18
Table 6Comparison of Gross Revenue Forecasts2006 Preliminary Study and 2009 Update
Monroe Connector/Bypass Preliminary Study UpdateCalendar Year Basis
(Thousands)
2009 Update Study
Calendar Year Alternative 1 Alternative 2
2006Preliminary Study
2014 $11,643 $12,572 $14,3312015 17,455 18,645 18,6802016 21,990 23,336 21,9382017 25,059 26,451 24,2562018 27,081 28,482 25,8062019 29,435 30,791 27,4582020 32,094 33,381 32,4062021 34,280 35,904 34,4752022 36,640 38,645 36,6862023 39,144 41,576 39,0482024 41,878 44,845 41,5732025 44,553 48,071 46,1922026 47,140 50,237 47,1732027 49,750 52,344 48,2172028 52,242 54,359 49,3292029 55,114 56,711 50,5152030 57,674 58,740 56,7712031 60,270 61,384 59,3262032 62,982 64,146 61,9962033 65,816 67,032 64,7852034 68,778 70,049 67,7012035 71,873 73,201 70,7472036 75,107 76,495 73,9312037 78,487 79,937 77,2582038 82,018 83,535 80,7342039 85,709 87,294 84,3672040 89,566 91,222 88,1642041 93,149 94,871 91,6912042 96,875 98,666 95,3582043 100,750 102,612 99,1722044 104,780 106,717 103,1392045 108,971 110,985 107,2652046 113,330 115,425 111,5562047 117,863 120,042 116,0182048 122,578 124,843 120,6592049 127,481 129,837 125,4852050 132,580 135,031 130,504
Net PresentValue at 2.50%
$1,401,720 $1,443,814 $1,382,092

2009 Update for Monroe Connector/Bypass
Preliminary Traffic and Revenue Study
April 9, 2009 Page 19
Tabl
e 7-
1An
nual
Tol
l Tra
nsac
tions
by
Col
lect
ion
Met
hod
(Fis
cal Y
ear)
Mon
roe
Con
nect
or/B
ypas
s Pr
elim
inar
y St
udy
Upd
ate,
Alte
rnat
ive
1(T
hous
ands
)
Vide
oET
CC
olle
cted
Unc
olle
cted
Fisc
al
Year
Col
lect
edU
ncol
lect
ible
Tota
l ETC
Prer
egis
tere
dW
ithin
15
Day
sAf
ter 3
0 D
ays
Tota
l Vid
eo
Col
lect
edU
nrea
dabl
e Pl
ate
Unb
illab
le
Afte
r 15
Day
sPe
ndin
g Af
ter
30 D
ays
Tota
l Vid
eo
Unc
olle
cted
an
d Pe
ndin
gTo
tal V
ideo
Tota
l Tr
ansa
ctio
ns
2014
(1)
3,22
417
3,24
129
620
030
780
395
8920
538
91,
192
4,43
320
1519
,589
9919
,688
1,63
61,
106
1,69
24,
434
527
502
1,12
42,
153
6,58
726
,275
2016
25,7
8713
025
,917
1,75
01,
148
2,44
15,
339
536
523
1,49
22,
551
7,89
033
,807
2017
30,9
0015
731
,057
1,87
21,
192
2,78
65,
850
545
544
1,66
22,
751
8,60
139
,658
2018
32,4
4216
232
,604
2,00
31,
238
2,62
95,
870
555
565
1,61
92,
739
8,60
941
,213
2019
34,8
2517
535
,000
2,14
31,
285
2,33
55,
763
565
585
1,49
42,
644
8,40
743
,407
2020
37,3
8618
737
,573
2,29
21,
335
2,03
15,
658
575
606
1,37
22,
553
8,21
145
,784
2021
39,6
0719
939
,806
2,31
81,
290
1,95
75,
565
546
586
1,33
12,
463
8,02
847
,834
2022
41,4
3920
841
,647
2,34
41,
246
1,89
55,
485
518
566
1,28
92,
373
7,85
849
,505
2023
43,3
5721
843
,575
2,37
01,
204
1,83
25,
406
491
547
1,24
72,
285
7,69
151
,266
2024
45,3
6622
745
,593
2,39
71,
163
1,76
95,
329
466
529
1,20
32,
198
7,52
753
,120
2025
47,4
7123
847
,709
2,42
51,
126
1,70
25,
253
442
512
1,16
22,
116
7,36
955
,078
2026
49,1
6824
649
,414
2,43
21,
082
1,65
05,
164
415
491
1,12
22,
028
7,19
256
,606
2027
50,4
3225
250
,684
2,43
91,
040
1,58
15,
060
390
472
1,07
91,
941
7,00
157
,685
2028
51,7
4126
052
,001
2,44
699
91,
515
4,96
036
745
41,
035
1,85
66,
816
58,8
1720
2953
,098
268
53,3
662,
453
960
1,45
24,
865
345
436
993
1,77
46,
639
60,0
0520
3054
,506
275
54,7
812,
459
921
1,39
44,
774
324
420
951
1,69
56,
469
61,2
5020
3155
,775
282
56,0
572,
508
939
1,32
84,
776
330
427
914
1,67
26,
448
62,5
0520
3256
,892
285
57,1
772,
558
958
1,35
34,
870
345
436
927
1,70
86,
578
63,7
5520
3358
,029
293
58,3
222,
610
977
1,38
14,
968
344
445
952
1,74
16,
709
65,0
3120
3459
,190
297
59,4
872,
662
997
1,40
85,
067
351
453
972
1,77
66,
843
66,3
3020
3560
,373
304
60,6
772,
715
1,01
71,
437
5,16
935
846
299
11,
811
6,98
067
,657
2036
61,5
8230
961
,891
2,76
91,
037
1,46
65,
272
365
472
1,01
11,
848
7,12
069
,011
2037
62,8
1331
663
,129
2,82
51,
058
1,49
45,
377
372
482
1,03
11,
886
7,26
370
,392
2038
64,0
6832
364
,391
2,88
11,
079
1,52
55,
485
380
492
1,05
21,
923
7,40
871
,799
2039
65,3
5032
965
,679
2,93
91,
101
1,55
65,
595
387
501
1,07
21,
960
7,55
573
,234
2040
66,6
5733
566
,992
2,99
81,
123
1,58
65,
706
395
511
1,09
42,
000
7,70
674
,698
2041
67,8
2234
168
,163
3,04
21,
140
1,62
55,
807
401
518
1,11
52,
034
7,84
176
,004
2042
68,8
4034
569
,185
3,08
81,
157
1,64
95,
894
407
526
1,13
12,
064
7,95
877
,143
2043
69,8
7335
170
,224
3,13
41,
174
1,67
45,
982
413
535
1,14
82,
096
8,07
878
,302
2044
70,9
2035
671
,276
3,18
11,
192
1,69
96,
072
419
542
1,16
62,
127
8,19
979
,475
2045
71,9
8436
272
,346
3,22
91,
209
1,72
56,
164
425
550
1,18
22,
158
8,32
280
,668
2046
73,0
6436
773
,431
3,27
81,
228
1,75
16,
256
432
558
1,20
12,
191
8,44
781
,878
2047
74,1
6037
374
,533
3,32
71,
246
1,77
66,
349
438
567
1,21
92,
225
8,57
483
,107
2048
75,2
7237
975
,651
3,37
71,
265
1,80
36,
444
445
576
1,23
82,
258
8,70
284
,353
2049
76,4
0138
476
,785
3,42
71,
284
1,83
06,
541
452
584
1,25
62,
291
8,83
285
,617
2050
77,5
4838
977
,937
3,47
91,
303
1,85
86,
640
458
592
1,27
42,
325
8,96
586
,902
2051
77,5
4838
977
,937
3,47
91,
303
1,85
86,
640
458
592
1,27
42,
325
8,96
586
,902
2052
78,7
1139
579
,106
3,53
11,
322
1,88
56,
738
465
603
1,29
52,
363
9,10
188
,207
2053
79,8
9140
180
,292
3,58
41,
342
1,91
46,
840
472
612
1,31
32,
397
9,23
789
,529
2054
81,0
9040
781
,497
3,63
81,
362
1,94
26,
942
479
621
1,33
32,
433
9,37
590
,872
82,3
0641
482
,720
3,69
21,
383
1,97
27,
047
486
630
1,35
32,
469
9,51
692
,236
(1) F
Y 20
14, J
anua
ry -
June
onl
y.
Not
e: F
orec
asts
for F
Y 20
14 -
2017
refle
ct a
n as
sum
ed ra
mp-
up to
full
traffi
c vo
lum
es b
egin
ning
in th
e se
cond
hal
f of F
Y 20
17.

2009 Update for Monroe Connector/Bypass
Preliminary Traffic and Revenue Study
April 9, 2009 Page 21
ANNUAL NET REVENUE Tables 8-1 and 8-2 summarize for the two alternatives the total revenue collected annually, the revenue collected under 30 days, the revenue collected over 30 days as estimated by the NCTA, and the administrative fee and civil penalty revenue as estimated by the NCTA. The percent of uncollected toll revenue ranges from approximately 9 percent in the opening year to approxi-mately 3 percent in the later years. When the fee and penalty revenue is included, the total reve-nue collected is only slightly lower that the gross toll revenue. Figure 11 presented earlier also illustrates the toll revenue collected in comparison to the gross toll revenue for the two alterna-tives.
DISCLAIMER
Current accepted professional practices and procedures were used in the development of these traffic and revenue forecasts. However, as with any forecast of the future, it should be under-stood that there may be differences between forecasted and actual results caused by events and circumstances beyond the control of the forecasters. In formulating its forecasts, WSA has rea-sonably relied upon the accuracy and completeness of information provided (both written and oral) by North Carolina Turnpike Authority and other local and state agencies. WSA also has relied upon the reasonable assurances of some independent parties and are not aware of any facts that would make such information misleading. WSA has made qualitative judgments related to several key variables in the development and analysis of the traffic and revenue forecasts that must be considered as a whole; therefore select-ing portions of any individual result without consideration of the intent of the whole may create a misleading or incomplete view of the results and the underling methodologies used to obtain the results. WSA gives no opinion as to the value or merit to partial information extracted from this report. All estimates and projections reported herein are based on WSA’ experience and judgment and on a review of information obtained from multiple state and local agencies, including North Carolina Turnpike Authority. These estimates and projections may not be indicative of actual or future values, and are therefore subject to substantial uncertainty. Future developments cannot be predicted with certainty, and may affect the estimates or projections expressed in this report, such that WSA does not specifically guarantee or warrant any estimate or projections contained within this report.

2009 Update for Monroe Connector/Bypass
Preliminary Traffic and Revenue Study
April 9, 2009 Page 22
Table 8-1Annual Toll Transactions and Net Revenue Forecasts (Fiscal Year)Monroe Connector/Bypass Preliminary Study Update, Alternative 1
(Thousands)
Fiscal Year
Total Gross Transactions
Gross Toll Revenue
Collected Toll Revenue
Under30 Days
Collected Toll Revenue Over
30 Days (2)
Total Collected Toll
Revenue
Administrative Fees and Civil
Penalty Revenue (2)
Total Net Revenue
Percent Uncollected
Toll Revenue
Percent Uncollected Revenue of
Total Revenue
2014 (1) 4,433 $2,624 $2,318 $66 $2,384 $44 $2,428 9.2% 7.5%2015 26,275 15,479 13,782 360 14,142 243 14,385 8.6% 7.1%2016 33,807 20,584 18,492 494 18,986 322 19,308 7.8% 6.2%2017 39,658 24,746 22,400 567 22,967 361 23,328 7.2% 5.7%2018 41,213 26,070 23,691 563 24,254 354 24,608 7.0% 5.6%2019 43,408 28,258 25,868 543 26,411 331 26,742 6.5% 5.4%2020 45,785 30,765 28,356 524 28,880 310 29,190 6.1% 5.1%2021 47,834 33,187 30,757 530 31,287 304 31,591 5.7% 4.8%2022 49,504 35,460 33,017 536 33,553 297 33,850 5.4% 4.5%2023 51,265 37,892 35,440 541 35,981 291 36,272 5.0% 4.3%2024 53,122 40,511 38,049 545 38,594 284 38,878 4.7% 4.0%2025 55,077 43,216 40,747 549 41,296 278 41,574 4.4% 3.8%2026 56,607 45,847 43,376 554 43,930 272 44,202 4.2% 3.6%2027 57,686 48,445 45,979 559 46,538 264 46,802 3.9% 3.4%2028 58,817 50,996 48,535 561 49,096 257 49,353 3.7% 3.2%2029 60,004 53,678 51,229 564 51,793 250 52,043 3.5% 3.0%2030 61,249 56,394 53,959 564 54,523 243 54,766 3.3% 2.9%2031 62,505 58,972 56,489 564 57,053 238 57,291 3.3% 2.9%2032 63,755 61,626 59,032 585 59,617 241 59,858 3.3% 2.9%2033 65,030 64,399 61,688 616 62,304 247 62,551 3.3% 2.9%2034 66,331 67,297 64,465 643 65,108 252 65,360 3.3% 2.9%2035 67,657 70,325 67,364 673 68,037 257 68,294 3.3% 2.9%2036 69,010 73,490 70,397 702 71,099 262 71,361 3.3% 2.9%2037 70,391 76,797 73,564 735 74,299 268 74,567 3.3% 2.9%2038 71,798 80,253 76,875 768 77,643 273 77,916 3.3% 2.9%2039 73,234 83,864 80,334 802 81,136 278 81,414 3.3% 2.9%2040 74,699 87,638 83,951 838 84,789 284 85,073 3.3% 2.9%2041 76,004 91,358 87,512 874 88,386 289 88,675 3.3% 2.9%2042 77,145 95,012 91,012 909 91,921 293 92,214 3.3% 2.9%2043 78,302 98,812 94,652 946 95,598 298 95,896 3.3% 3.0%2044 79,476 102,765 98,440 983 99,423 302 99,725 3.3% 3.0%2045 80,668 106,875 102,377 1,023 103,400 307 103,707 3.3% 3.0%2046 81,878 111,150 106,472 1,064 107,536 311 107,847 3.3% 3.0%2047 83,107 115,596 110,732 1,107 111,839 316 112,155 3.3% 3.0%2048 84,353 120,220 115,161 1,151 116,312 321 116,633 3.3% 3.0%2049 85,618 125,029 119,768 1,197 120,965 326 121,291 3.3% 3.0%2050 86,903 130,030 124,557 1,244 125,801 330 126,131 3.3% 3.0%2051 88,206 135,232 129,540 1,295 130,835 336 131,171 3.3% 3.0%2052 89,529 140,641 134,722 1,346 136,068 340 136,408 3.3% 3.0%2053 90,872 146,266 140,111 1,400 141,511 346 141,857 3.3% 3.0%2054 92,235 152,117 145,714 1,456 147,170 351 147,521 3.3% 3.0%
(1) FY 2014, January - June only.(2) Applies to transactions for which a second bill is sent. Estimated by NCTA based on business rules.Note: Forecasts for FY 2014 - 2017 reflect an assumed ramp-up to full traffic volumes beginning in the second half of FY 2017.

2009 Update for Monroe Connector/Bypass
Preliminary Traffic and Revenue Study
April 9, 2009 Page 23
Table 8-2Annual Toll Transactions and Net Revenue Forecasts (Fiscal Year)Monroe Connector/Bypass Preliminary Study Update, Alternative 2
(Thousands)
Fiscal Year
Total Gross Transactions
Gross Toll Revenue
Collected Toll Revenue
Under30 Days
Collected Toll Revenue Over
30 Days (2)
Total Collected Toll
Revenue
Administrative Fees and Civil
Penalty Revenue (2)
Total Net Revenue
Percent Uncollected
Toll Revenue
Percent Uncollected Revenue of
Total Revenue
2014 (1) 5,098 $2,834 $2,500 $72 $2,572 $51 $2,623 9.2% 7.4%2015 29,588 16,534 14,703 391 15,094 278 15,372 8.7% 7.0%2016 37,734 21,844 19,600 531 20,131 365 20,496 7.8% 6.2%2017 43,904 26,120 23,620 605 24,225 404 24,629 7.3% 5.7%2018 45,449 27,466 24,937 602 25,539 396 25,935 7.0% 5.6%2019 47,523 29,637 27,110 577 27,687 368 28,055 6.6% 5.3%2020 49,792 32,086 29,554 554 30,108 341 30,449 6.2% 5.1%2021 52,020 34,643 32,087 558 32,645 333 32,978 5.8% 4.8%2022 54,170 37,275 34,684 568 35,252 328 35,580 5.4% 4.5%2023 56,446 40,111 37,489 578 38,067 323 38,390 5.1% 4.3%2024 58,855 43,211 40,558 589 41,147 319 41,466 4.8% 4.0%2025 61,405 46,458 43,776 599 44,375 315 44,690 4.5% 3.8%2026 62,901 49,154 46,478 606 47,084 308 47,392 4.2% 3.6%2027 63,300 51,290 48,656 601 49,257 295 49,552 4.0% 3.4%2028 63,755 53,351 50,761 594 51,355 282 51,637 3.7% 3.2%2029 64,268 55,535 52,989 588 53,577 270 53,847 3.5% 3.0%2030 64,839 57,726 55,225 582 55,807 260 56,067 3.3% 2.9%2031 65,791 60,062 57,530 575 58,105 250 58,355 3.3% 2.8%2032 67,107 62,765 60,118 593 60,711 252 60,963 3.3% 2.9%2033 68,449 65,589 62,823 628 63,451 260 63,711 3.3% 2.9%2034 69,818 68,541 65,650 655 66,305 265 66,570 3.3% 2.9%2035 71,215 71,625 68,604 687 69,291 271 69,562 3.3% 2.9%2036 72,639 74,848 71,693 716 72,409 276 72,685 3.3% 2.9%2037 74,092 78,216 74,919 749 75,668 282 75,950 3.3% 2.9%2038 75,573 81,736 78,289 783 79,072 288 79,360 3.3% 2.9%2039 77,085 85,414 81,812 817 82,629 293 82,922 3.3% 2.9%2040 78,627 89,258 85,494 855 86,349 299 86,648 3.3% 2.9%2041 80,001 93,046 89,123 893 90,016 305 90,321 3.3% 2.9%2042 81,201 96,768 92,687 929 93,616 310 93,926 3.3% 2.9%2043 82,419 100,639 96,396 965 97,361 314 97,675 3.3% 2.9%2044 83,655 104,664 100,249 1,004 101,253 319 101,572 3.3% 3.0%2045 84,910 108,851 104,260 1,044 105,304 324 105,628 3.3% 3.0%2046 86,183 113,205 108,432 1,085 109,517 328 109,845 3.3% 3.0%2047 87,476 117,733 112,769 1,129 113,898 333 114,231 3.3% 3.0%2048 88,788 122,443 117,280 1,174 118,454 338 118,792 3.3% 3.0%2049 90,120 127,340 121,971 1,221 123,192 343 123,535 3.3% 3.0%2050 91,472 132,434 126,850 1,270 128,120 349 128,469 3.3% 3.0%2051 92,844 137,731 131,924 1,321 133,245 354 133,599 3.3% 3.0%2052 94,237 143,241 137,202 1,373 138,575 359 138,934 3.3% 3.0%2053 95,650 148,970 142,689 1,431 144,120 365 144,485 3.3% 3.0%2054 97,085 154,929 148,396 1,487 149,883 370 150,253 3.3% 3.0%
(1) FY 2014, January - June only.(2) Applies to transactions for which a second bill is sent. Estimated by NCTA based on business rules.
Note: Forecasts for FY 2014 - 2017 reflect an assumed ramp-up to full traffic volumes beginning in the second half of FY 2017.

2009 Update for Monroe Connector/Bypass
Preliminary Traffic and Revenue Study
April 9, 2009 Page 24
While WSA believes that some of the projections or other forward-looking statements contained within the report are based on reasonable assumptions as of the date in the report, such forward looking statements involve risks and uncertainties that may cause actual results to differ materi-ally from the results predicted. Therefore, following the date of this report, WSA will take no responsibility or assume any obligation to advise of changes that may affect its assumptions con-tained within the report, as they pertain to: socioeconomic and demographic forecasts, proposed residential or commercial land use development projects and/or potential improvements to the regional transportation network. It is also emphasized that this study is considered preliminary and findings are subject to consid-erable refinement. It was not performed at a sufficient level of detail to be used in project fi-nancing and is not intended for that purpose. Instead it is intended to provide additional informa-tion and analysis that was not available at the time of the 2006 preliminary study. Very truly yours, WILBUR SMITH ASSOCIATES David R. Danforth Vice President/Project Manager

2009 Update for Monroe Connector/Bypass
Preliminary Traffic and Revenue Study
April 9, 2009 Page 20
Tabl
e 7-
2An
nual
Tol
l Tra
nsac
tions
by
Col
lect
ion
Met
hod
(Fis
cal Y
ear)
Mon
roe
Con
nect
or/B
ypas
s Pr
elim
inar
y St
udy
Upd
ate,
Alte
rnat
ive
2(T
hous
ands
)
Vide
oET
CC
olle
cted
Unc
olle
cted
Fisc
al
Year
Col
lect
edU
ncol
lect
ible
Tota
l ETC
Prer
egis
tere
dW
ithin
15
Day
sAf
ter 3
0 D
ays
Tota
l Vid
eo
Col
lect
edU
nrea
dabl
e Pl
ate
Unb
illab
le
Afte
r 15
Day
sPe
ndin
g Af
ter
30 D
ays
Tota
l Vid
eo
Unc
olle
cted
an
d Pe
ndin
gTo
tal V
ideo
Tota
l Tr
ansa
ctio
ns
2014
(1)
3,67
517
3,69
234
923
636
194
611
210
624
246
01,
406
5,09
820
1521
,910
109
22,0
191,
880
1,27
21,
943
5,09
560
657
51,
292
2,47
37,
568
29,5
8720
1628
,621
143
28,7
641,
994
1,31
02,
766
6,07
061
159
51,
694
2,90
08,
970
37,7
3420
1734
,049
171
34,2
202,
115
1,34
93,
123
6,58
761
761
41,
865
3,09
69,
683
43,9
0320
1835
,623
178
35,8
012,
244
1,38
92,
946
6,57
962
363
11,
815
3,06
99,
648
45,4
4920
1937
,992
191
38,1
832,
380
1,43
02,
592
6,40
262
964
91,
660
2,93
89,
340
47,5
2320
2040
,539
204
40,7
432,
524
1,47
32,
236
6,23
363
366
81,
515
2,81
69,
049
49,7
9220
2142
,963
215
43,1
782,
567
1,43
12,
130
6,12
860
464
91,
462
2,71
58,
843
52,0
2120
2245
,228
228
45,4
562,
611
1,39
02,
083
6,08
457
663
01,
425
2,63
18,
715
54,1
7120
2347
,617
239
47,8
562,
656
1,35
02,
033
6,03
954
961
21,
389
2,55
08,
589
56,4
4520
2450
,136
251
50,3
872,
701
1,31
11,
983
5,99
552
459
61,
353
2,47
38,
468
58,8
5520
2552
,791
266
53,0
572,
746
1,27
51,
930
5,95
150
157
81,
318
2,39
78,
348
61,4
0520
2654
,507
274
54,7
812,
721
1,21
11,
897
5,82
946
554
91,
277
2,29
18,
120
62,9
0120
2755
,232
278
55,5
102,
696
1,15
01,
784
5,63
043
252
21,
207
2,16
17,
791
63,3
0120
2855
,996
281
56,2
772,
671
1,09
21,
680
5,44
340
149
41,
139
2,03
47,
477
63,7
5420
2956
,800
285
57,0
852,
646
1,03
71,
581
5,26
437
346
91,
077
1,91
97,
183
64,2
6820
3057
,646
290
57,9
362,
624
984
1,48
65,
094
346
446
1,01
71,
809
6,90
364
,839
2031
58,6
6229
458
,956
2,67
61,
004
1,38
15,
061
353
455
966
1,77
46,
835
65,7
9120
3259
,835
300
60,1
352,
730
1,02
41,
409
5,16
337
346
996
81,
810
6,97
367
,108
2033
61,0
3130
761
,338
2,78
51,
044
1,43
75,
266
367
473
1,00
41,
845
7,11
168
,449
2034
62,2
5331
162
,564
2,84
01,
065
1,46
75,
372
375
483
1,02
51,
882
7,25
469
,818
2035
63,4
9732
063
,817
2,89
71,
086
1,49
45,
478
382
493
1,04
61,
921
7,39
971
,216
2036
64,7
6732
565
,092
2,95
51,
108
1,52
55,
588
390
503
1,06
61,
958
7,54
672
,638
2037
66,0
6233
266
,394
3,01
41,
130
1,55
55,
699
397
512
1,08
81,
998
7,69
774
,091
2038
67,3
8333
967
,722
3,07
41,
153
1,58
75,
814
405
523
1,10
92,
038
7,85
275
,574
2039
68,7
3134
569
,076
3,13
61,
176
1,61
95,
931
414
533
1,13
12,
078
8,00
977
,085
2040
70,1
0535
370
,458
3,19
91,
199
1,65
16,
049
422
544
1,15
42,
119
8,16
878
,626
2041
71,3
3036
071
,690
3,24
71,
217
1,69
16,
155
428
552
1,17
62,
156
8,31
180
,001
2042
72,4
0036
572
,765
3,29
51,
236
1,71
66,
247
435
560
1,19
52,
189
8,43
681
,201
2043
73,4
8737
073
,857
3,34
51,
254
1,74
26,
341
441
569
1,21
12,
221
8,56
282
,419
2044
74,5
8937
674
,965
3,39
51,
273
1,76
86,
436
448
577
1,22
92,
254
8,69
083
,655
2045
75,7
0738
276
,089
3,44
61,
292
1,79
56,
533
454
586
1,24
82,
289
8,82
284
,911
2046
76,8
4438
677
,230
3,49
81,
312
1,82
26,
631
461
595
1,26
72,
323
8,95
486
,184
2047
77,9
9639
278
,388
3,55
01,
331
1,84
96,
730
468
603
1,28
62,
358
9,08
887
,476
2048
79,1
6639
879
,564
3,60
31,
351
1,87
66,
830
475
613
1,30
62,
394
9,22
488
,788
2049
80,3
5440
480
,758
3,65
71,
371
1,90
46,
933
482
622
1,32
52,
429
9,36
290
,120
2050
81,5
5941
081
,969
3,71
21,
392
1,93
37,
037
489
631
1,34
52,
466
9,50
391
,472
2051
82,7
8341
583
,198
3,76
81,
413
1,96
17,
142
497
640
1,36
72,
504
9,64
692
,844
2052
84,0
2442
284
,446
3,82
41,
434
1,99
27,
250
504
650
1,38
62,
540
9,79
094
,236
2053
85,2
8443
085
,714
3,88
21,
456
2,02
17,
358
512
660
1,40
82,
580
9,93
895
,652
2054
86,5
6443
687
,000
3,94
01,
477
2,05
27,
469
520
670
1,42
92,
618
10,0
8797
,087
(1)
FY 2
014,
Jan
uary
- Ju
ne o
nly.
Not
e: F
orec
asts
for F
Y 20
14 -
2017
refle
ct a
n as
sum
ed ra
mp-
up to
full
traffi
c vo
lum
es b
egin
ning
in th
e se
cond
hal
f of F
Y 20
17.