april 9, 2019 - usda world supply and demand estimates
TRANSCRIPT
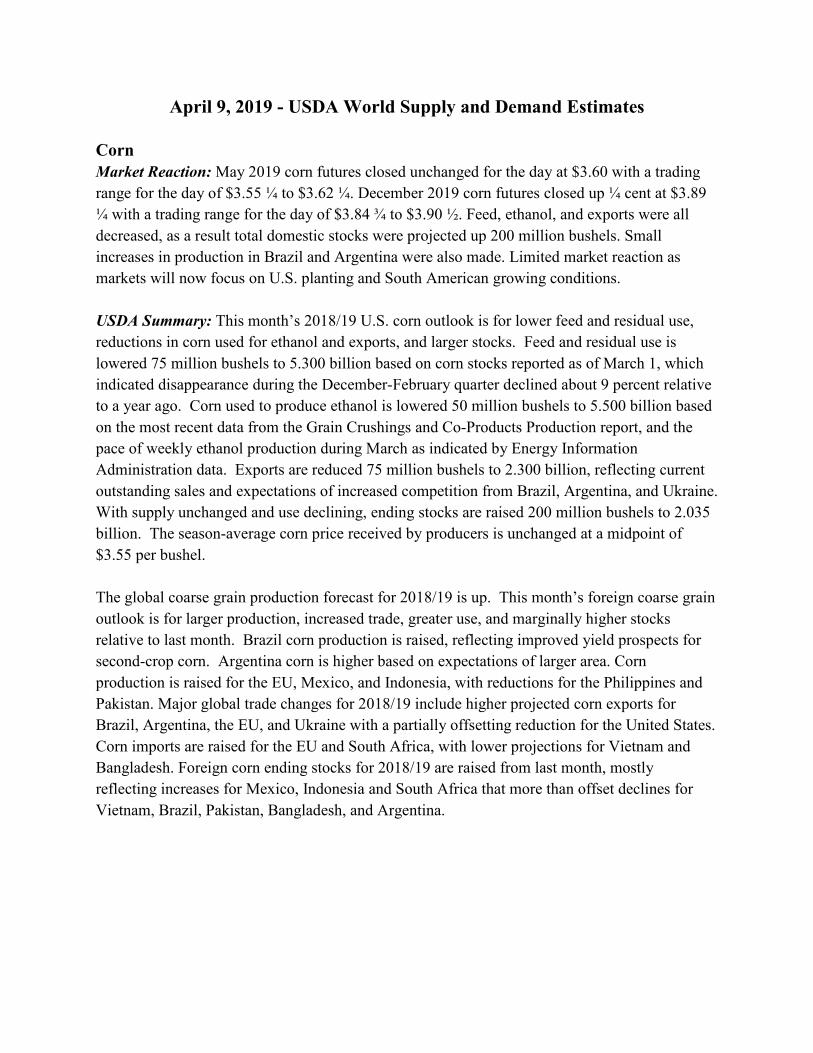
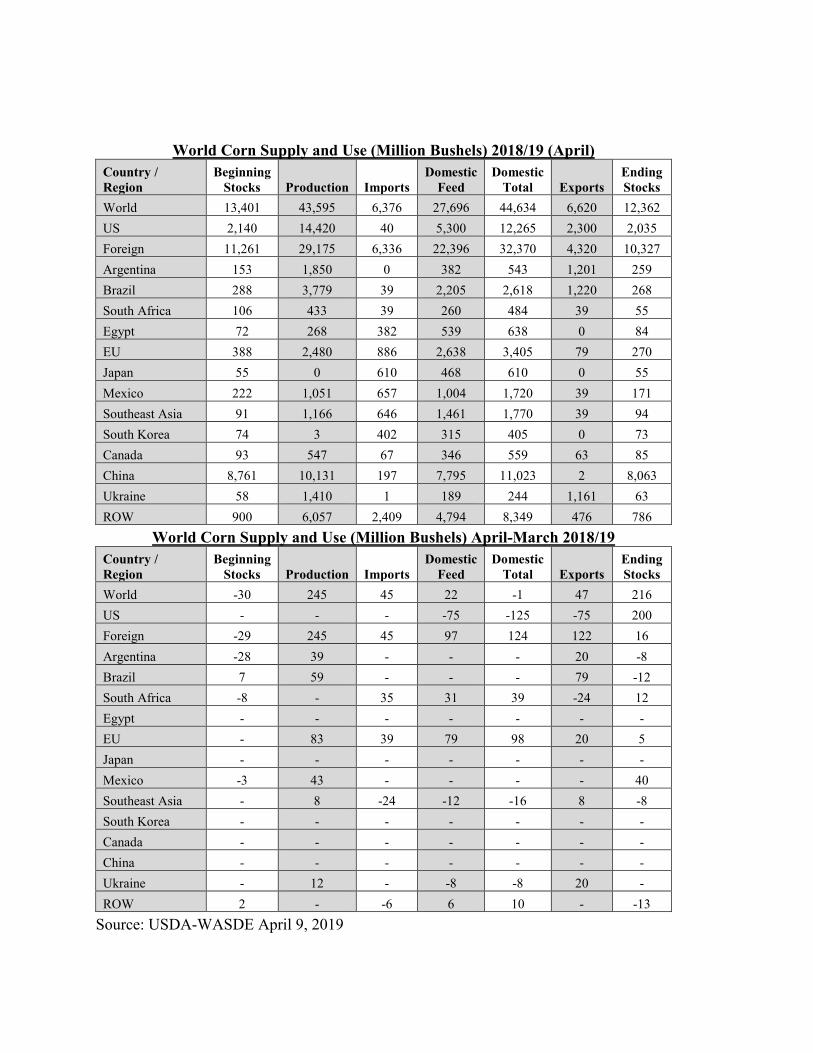
April 9, 2019 - USDA World Supply and Demand Estimates Corn Market Reaction: May 2019 corn futures closed unchanged for the day at $3.60 with a trading range for the day of $3.55 ¼ to $3.62 ¼. December 2019 corn futures closed up ¼ cent at $3.89 ¼ with a trading range for the day of $3.84 ¾ to $3.90 ½. Feed, ethanol, and exports were all decreased, as a result total domestic stocks were projected up 200 million bushels. Small increases in production in Brazil and Argentina were also made. Limited market reaction as markets will now focus on U.S. planting and South American growing conditions. USDA Summary: This month’s 2018/19 U.S. corn outlook is for lower feed and residual use, reductions in corn used for ethanol and exports, and larger stocks. Feed and residual use is lowered 75 million bushels to 5.300 billion based on corn stocks reported as of March 1, which indicated disappearance during the December-February quarter declined about 9 percent relative to a year ago. Corn used to produce ethanol is lowered 50 million bushels to 5.500 billion based on the most recent data from the Grain Crushings and Co-Products Production report, and the pace of weekly ethanol production during March as indicated by Energy Information Administration data. Exports are reduced 75 million bushels to 2.300 billion, reflecting current outstanding sales and expectations of increased competition from Brazil, Argentina, and Ukraine. With supply unchanged and use declining, ending stocks are raised 200 million bushels to 2.035 billion. The season-average corn price received by producers is unchanged at a midpoint of $3.55 per bushel. The global coarse grain production forecast for 2018/19 is up. This month’s foreign coarse grain outlook is for larger production, increased trade, greater use, and marginally higher stocks relative to last month. Brazil corn production is raised, reflecting improved yield prospects for second-crop corn. Argentina corn is higher based on expectations of larger area. Corn production is raised for the EU, Mexico, and Indonesia, with reductions for the Philippines and Pakistan. Major global trade changes for 2018/19 include higher projected corn exports for Brazil, Argentina, the EU, and Ukraine with a partially offsetting reduction for the United States. Corn imports are raised for the EU and South Africa, with lower projections for Vietnam and Bangladesh. Foreign corn ending stocks for 2018/19 are raised from last month, mostly reflecting increases for Mexico, Indonesia and South Africa that more than offset declines for Vietnam, Brazil, Pakistan, Bangladesh, and Argentina.

2014/15 2015/16 2016/17 2017/18
Est.
2018/19 Projected
March
2018/19 Projected
April
2018/19 Change From
Previous Month
Change 2017/18
to 2018/19
Planted and Harvested Acres & Yield
Acres Planted (Million Acres) 90.6 88 94 90.2 89.1 89.1 0.0 -1.1
Acres Harvested (Million Acres) 83.1 80.8 86.7 82.7 81.7 81.7 0.0 -1.0
U.S. Average Yield (Bu/Acre) 171.0 168.4 174.6 176.6 176.4 176.4 0.0 -0.2
Supply (Million Bushels)
Beg. Stocks 1,232 1,731 1,737 2,293 2,140 2,140 0 -153 Production 14,216 13,602 15,148 14,609 14,420 14,420 0 -189 Imports 32 68 57 36 40 40 0 4 Total Supply 15,479 15,401 16,942 16,939 16,600 16,600 0 -339
Use & Ending Stocks (Million Bushels)
Feed and Residual 5,280 5,114 5,470 5,304 5,375 5,300 -75 -4 Ethanol 5,200 5,224 5,432 5,605 5,550 5,500 -50 -105 Food, Seed & Industrial 1,401 1,424 1,453 1,451 1,465 1,465 0 14
Exports 1,867 1,901 2,294 2,438 2,375 2,300 -75 -138 Total Use 13,748 13,664 14,649 14,799 14,765 14,565 -200 -234 U.S. Ending Stocks 1,731 1,737 2,293 2,140 1,835 2,035 200 -105 Foreign Stocks 9,260 10,523 11,515 11,261 10,311 10,327 16 -934
Price and Stocks to Use Ratio
U.S. Avg. Season Price ($/Bu) $3.70 $3.61 $3.36 $3.36 $3.35-
$3.75 $3.40-$3.70 $0.00 $0.19
U.S. Stocks/Use 12.59% 12.71% 15.65% 14.46% 12.43% 13.97% 1.5% -0.49%
Source: USDA-WASDE April 9, 2019
World Corn Supply and Use (Million Bushels) 2018/19 (April) Country / Region
Beginning Stocks Production Imports
Domestic Feed
Domestic Total Exports
Ending Stocks
World 13,401 43,595 6,376 27,696 44,634 6,620 12,362 US 2,140 14,420 40 5,300 12,265 2,300 2,035 Foreign 11,261 29,175 6,336 22,396 32,370 4,320 10,327 Argentina 153 1,850 0 382 543 1,201 259 Brazil 288 3,779 39 2,205 2,618 1,220 268 South Africa 106 433 39 260 484 39 55 Egypt 72 268 382 539 638 0 84 EU 388 2,480 886 2,638 3,405 79 270 Japan 55 0 610 468 610 0 55 Mexico 222 1,051 657 1,004 1,720 39 171 Southeast Asia 91 1,166 646 1,461 1,770 39 94 South Korea 74 3 402 315 405 0 73 Canada 93 547 67 346 559 63 85 China 8,761 10,131 197 7,795 11,023 2 8,063 Ukraine 58 1,410 1 189 244 1,161 63 ROW 900 6,057 2,409 4,794 8,349 476 786
World Corn Supply and Use (Million Bushels) April-March 2018/19 Country / Region
Beginning Stocks Production Imports
Domestic Feed
Domestic Total Exports
Ending Stocks
World -30 245 45 22 -1 47 216 US - - - -75 -125 -75 200 Foreign -29 245 45 97 124 122 16 Argentina -28 39 - - - 20 -8 Brazil 7 59 - - - 79 -12 South Africa -8 - 35 31 39 -24 12 Egypt - - - - - - - EU - 83 39 79 98 20 5 Japan - - - - - - - Mexico -3 43 - - - - 40 Southeast Asia - 8 -24 -12 -16 8 -8 South Korea - - - - - - - Canada - - - - - - - China - - - - - - - Ukraine - 12 - -8 -8 20 - ROW 2 - -6 6 10 - -13
Source: USDA-WASDE April 9, 2019
Cotton Market Reaction: May 2019 cotton futures closed down 0.83 cents at 78.09 with a trading range for the day of 77.57 to 79.31 cents. December 2019 cotton futures closed down 0.27 cents at 76.89 with a trading range for the day of 76.25 to 77.43 cents. Cotton was down for the day but the short term trend remains up. Lower projected domestic acreage for the 2019 crop, as indicated in the Prospective Plantings report, has helped fuel the recent rally. WASDE projections for the 2019 crop will be released starting with the May report.
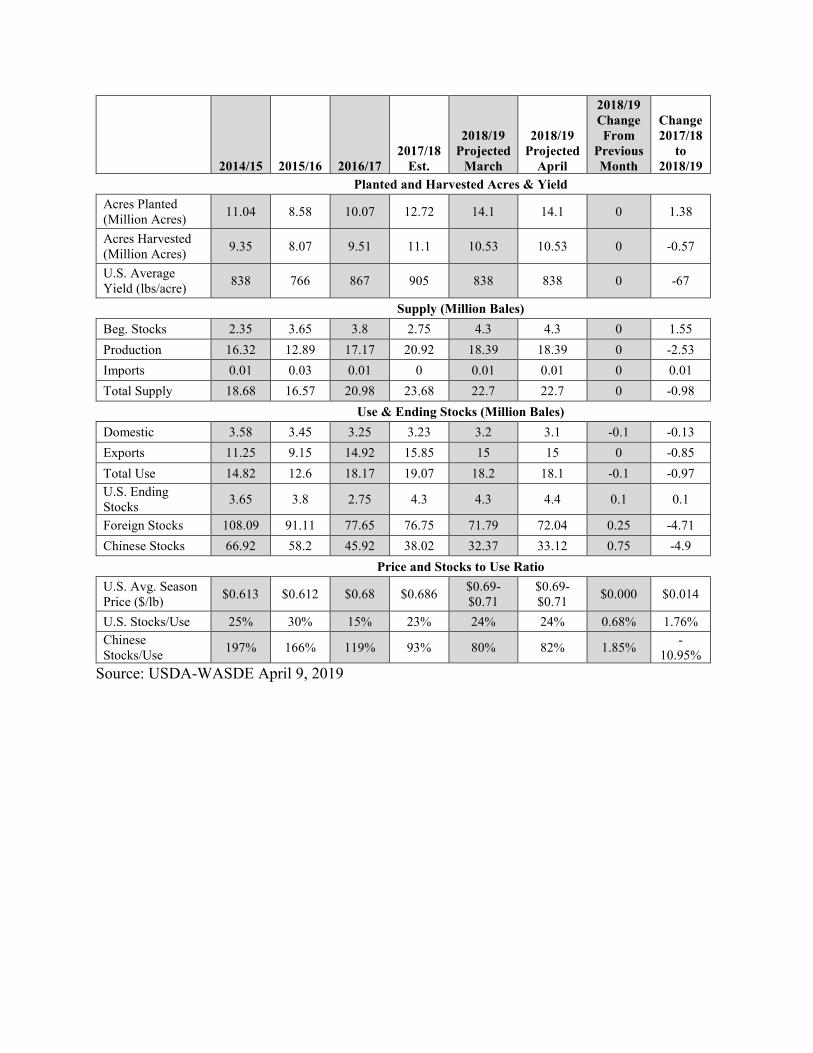
USDA Summary: The 2018/19 U.S. cotton supply and demand forecasts show lower consumption and higher ending stocks relative to last month. At 3.1 million bales, U.S. cotton consumption is now forecast to reach its lowest level since the 1890s. Ending stocks are now forecast at 4.4 million bales, a 100,000-bale increase from both the previous 2018/19 estimate and from the current estimate for 2017/18. The season-average farm price is unchanged with a mid-point of 70 cents per pound.
Lower world consumption this month results in higher projected 2018/19 ending stocks, with little net change in the other components of the global balance sheet. World mill use is forecast about 400,000 bales lower this month. A 300,000-bale decline in Turkey—and smaller declines in the United States and Vietnam—more than offset smaller increases elsewhere. Lower imports for India, Turkey, and Vietnam are largely offset by an upward revision for China. Lower exports for India and Burkina Faso are largely offset by Australia and Turkey. Higher production for China is largely offset by a decline for Burkina Faso. World ending stocks in 2018/19 are forecast about 360,000 bales higher this month, with an increase in China’s stocks more than offsetting a decline in stocks outside of China.
2014/15 2015/16 2016/17 2017/18
Est.
2018/19 Projected
March
2018/19 Projected
April
2018/19 Change From
Previous Month
Change 2017/18
to 2018/19
Planted and Harvested Acres & Yield
Acres Planted (Million Acres) 11.04 8.58 10.07 12.72 14.1 14.1 0 1.38
Acres Harvested (Million Acres) 9.35 8.07 9.51 11.1 10.53 10.53 0 -0.57
U.S. Average Yield (lbs/acre) 838 766 867 905 838 838 0 -67
Supply (Million Bales)
Beg. Stocks 2.35 3.65 3.8 2.75 4.3 4.3 0 1.55 Production 16.32 12.89 17.17 20.92 18.39 18.39 0 -2.53 Imports 0.01 0.03 0.01 0 0.01 0.01 0 0.01 Total Supply 18.68 16.57 20.98 23.68 22.7 22.7 0 -0.98
Use & Ending Stocks (Million Bales)
Domestic 3.58 3.45 3.25 3.23 3.2 3.1 -0.1 -0.13 Exports 11.25 9.15 14.92 15.85 15 15 0 -0.85 Total Use 14.82 12.6 18.17 19.07 18.2 18.1 -0.1 -0.97 U.S. Ending Stocks 3.65 3.8 2.75 4.3 4.3 4.4 0.1 0.1
Foreign Stocks 108.09 91.11 77.65 76.75 71.79 72.04 0.25 -4.71 Chinese Stocks 66.92 58.2 45.92 38.02 32.37 33.12 0.75 -4.9
Price and Stocks to Use Ratio
U.S. Avg. Season Price ($/lb) $0.613 $0.612 $0.68 $0.686 $0.69-
$0.71 $0.69-$0.71 $0.000 $0.014
U.S. Stocks/Use 25% 30% 15% 23% 24% 24% 0.68% 1.76% Chinese Stocks/Use 197% 166% 119% 93% 80% 82% 1.85% -
10.95% Source: USDA-WASDE April 9, 2019

World Cotton Supply and Use (Million 480 lb Bales) 2018/19 (April)
Country / Region Beginning
Stocks Production Imports Domestic
Use Exports Loss Ending Stocks
World 81.05 118.93 42.09 123.18 42.09 0.36 76.44
US 4.3 18.39 0.01 3.1 15 0.2 4.4
Foreign 76.75 100.54 42.09 120.08 27.09 0.16 72.04
Central Asia 2.71 5.48 0 3.66 2.26 0 2.26
Afr. Fr. Zone 1.83 5.38 0 0.14 5.32 0 1.75
Australia 3.04 2.5 0 0.04 3.8 0 1.7
Brazil 8.66 11.8 0.05 3.5 6 0 11.01
India 9.23 27 1.4 24.8 4.2 0 8.63
Mexico 0.66 1.73 0.85 1.95 0.6 0.03 0.66
China 38.02 27.75 8 40.5 0.15 0 33.12
EU 0.25 1.72 0.69 0.74 1.58 0.05 0.3
Turkey 1.78 3.7 3 6.5 0.45 0 1.53
Pakistan 2.83 7.7 3 10.6 0.13 0.03 2.78
Indonesia 0.62 0 3.5 3.5 0.01 0 0.61
Thailand 0.2 0 1.18 1.15 0 0.03 0.2
Bangladesh 1.86 0.14 8 8 0 0.01 1.98
Vietnam 1.19 0 7.3 7.2 0 0 1.29
ROW 3.87 5.64 5.11 7.8 2.59 0.01 4.22 World Cotton Supply and Use (Million 480 lb Bales) April-March 2018/19
Country / Region Beginning
Stocks Production Imports Domestic
Use Exports Loss Ending Stocks
World -0.09 0.04 -0.09 -0.41 -0.09 0.00 0.35 US - - - -0.1 - - 0.1 Foreign -0.09 0.04 -0.08 -0.31 -0.09 - 0.25 Central Asia - -0.07 - 0.05 - - -0.13 Afr. Fr. Zone - -0.2 - - -0.15 - -0.05 Australia - - - - 0.2 - -0.2 Brazil - 0.05 -0.05 - - - - India - - -0.2 - -0.3 - 0.1 Mexico - - - - - - - China - 0.25 0.5 - - - 0.75 EU -0.02 0.03 -0.01 - 0.03 - -0.01 Turkey -0.1 - -0.2 -0.3 0.1 - -0.1 Pakistan - - - - - - - Indonesia - - -0.05 -0.05 - - - Thailand 0.02 - - 0 - - 0.02 Bangladesh - - - - - - - Vietnam - - -0.1 -0.1 - - - ROW 0.01 -0.02 0.02 0.09 0.03 - -0.13
Source: USDA-WASDE April 9, 2019

Soybeans Futures Market Reaction: May 2019 soybean futures were unchanged for the day closing at $8.98 ¾ with a trading range for the day of $8.94 ¾ to $9.02 ¼. November 2019 soybean futures closed down ½ cent at $9.31 ¾ with a trading range for the day of $9.28 to $9.34 ¾. Only minor revisions were made to domestic and international supply and demand estimates. Global trade and U.S. planted acres will continue to drive prices.
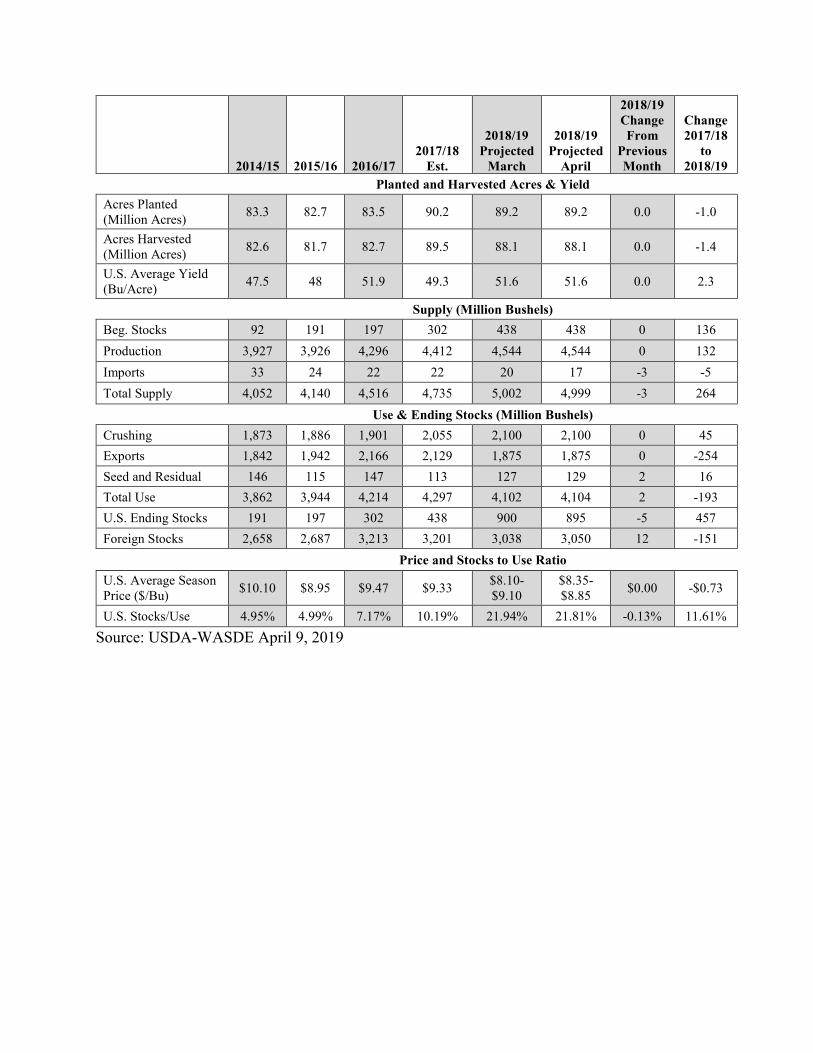
USDA Summary: U.S. soybean supply and use changes for 2018/19 include lower imports, higher seed use, and lower ending stocks. Soybean imports are reduced in line with reported trade through January while lower seed use reflects plantings indicated in the March 29 Prospective Plantings report. With soybean crush and exports unchanged, ending stocks are projected at 895 million bushels, down 5 million. Soybean oil changes include increased imports and domestic disappearance for biodiesel and for food use, and lower ending stocks. The season-average soybean price is forecast at $8.35 to $8.85, unchanged at the midpoint. Soybean oil price is projected at 28.0 to 30.0 cents per pound, down 1 cent at the midpoint. Soybean meal prices are projected at $305 to $325 per short ton, unchanged at the midpoint.
The 2018/19 global oilseed supply and demand forecasts include increased production, lower exports, and increased stocks compared to last month. Global oilseed production is raised mainly on higher soybean production for Brazil and rapeseed production for India. Production for Brazil is increased 18 million bushels to 4.299 billion, reflecting favorable weather in Rio Grande do Sul where the crop is in pod-filling and maturation stages. Brazil’s 2017/18 soybean crop is also revised higher, supported by recent industry estimates. Global oilseed exports are reduced mainly on lower rapeseed trade between Canada and China. With lower rapeseed crush for China, imports are increased for other products, including sunflowerseed meal, rapeseed meal, palm oil, and soybean oil. Global oilseed ending stocks are raised largely due to higher soybean stocks for Brazil and rapeseed stocks for Canada.
2014/15 2015/16 2016/17 2017/18
Est.
2018/19 Projected
March
2018/19 Projected
April
2018/19 Change From
Previous Month
Change 2017/18
to 2018/19
Planted and Harvested Acres & Yield
Acres Planted (Million Acres) 83.3 82.7 83.5 90.2 89.2 89.2 0.0 -1.0
Acres Harvested (Million Acres) 82.6 81.7 82.7 89.5 88.1 88.1 0.0 -1.4
U.S. Average Yield (Bu/Acre) 47.5 48 51.9 49.3 51.6 51.6 0.0 2.3
Supply (Million Bushels)
Beg. Stocks 92 191 197 302 438 438 0 136 Production 3,927 3,926 4,296 4,412 4,544 4,544 0 132 Imports 33 24 22 22 20 17 -3 -5 Total Supply 4,052 4,140 4,516 4,735 5,002 4,999 -3 264
Use & Ending Stocks (Million Bushels)
Crushing 1,873 1,886 1,901 2,055 2,100 2,100 0 45 Exports 1,842 1,942 2,166 2,129 1,875 1,875 0 -254 Seed and Residual 146 115 147 113 127 129 2 16 Total Use 3,862 3,944 4,214 4,297 4,102 4,104 2 -193 U.S. Ending Stocks 191 197 302 438 900 895 -5 457 Foreign Stocks 2,658 2,687 3,213 3,201 3,038 3,050 12 -151
Price and Stocks to Use Ratio
U.S. Average Season Price ($/Bu) $10.10 $8.95 $9.47 $9.33 $8.10-
$9.10 $8.35-$8.85 $0.00 -$0.73
U.S. Stocks/Use 4.95% 4.99% 7.17% 10.19% 21.94% 21.81% -0.13% 11.61% Source: USDA-WASDE April 9, 2019

World Soybean Supply and Use (Million Bushels) 2018/19 (April) Country / Region
Beginning Stocks Production Imports
Domestic Crush
Domestic Total Exports
Ending Stocks
World 3,639 13,249 5,555 11,162 12,828 5,671 3,945 US 438 4,544 17 2,100 2,229 1,875 895 Foreign 3,201 8,705 5,538 9,062 10,599 3,796 3,050 Argentina 886 2,021 197 1,580 1,834 231 1,038 Brazil 1,203 4,299 9 1,569 1,655 2,921 934 Paraguay 28 331 0 143 146 206 7 China 864 584 3,233 3,233 3,862 5 816 EU 54 99 581 610 672 5 57 Japan 7 8 121 88 130 0 7 Mexico 7 12 192 202 204 0 8 ROW 152 1,351 1,204 1,637 2,096 428 183
World Soybean Supply and Use (Million Bushels) April-March 2018/19 Country / Region
Beginning Stocks Production Imports
Domestic Crush
Domestic Total Exports
Ending Stocks
World 18 18 -1 -2 23 5 7 US - - -3 - 2 - -4 Foreign 18 19 2 -3 21 5 12 Argentina -29 - - - 26 - -55 Brazil 44 18 - - - - 62 Paraguay - - - - - - - China - - - - - 1 -1 EU - - - - - - - Japan -1 -2 - 2 - - -4 Mexico - - - - - - - ROW 5 2 1 -4 -5 4 8
Source: USDA-WASDE April 9, 2019

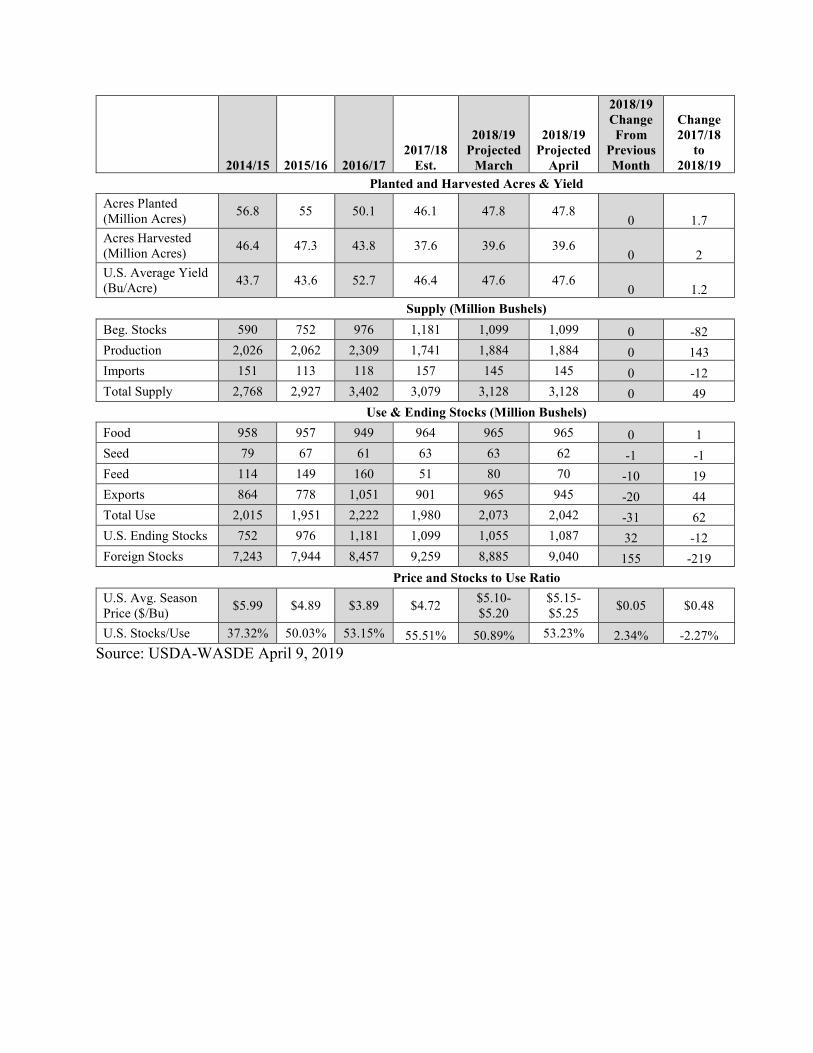
Wheat Futures Market Reaction: May 2019 wheat futures closed down 5 ¾ cents at $4.59 ½ with a trading range for the day of $4.56 ¼ to $4.62 ½. July 2019 wheat futures closed down 4 ¾ cents at $4.64 with a trading range for the day of $4.61 to $4.67 ¼. Increased stocks and lower use compared to last month. Global over supply continues to keep wheat prices depressed. USDA Summary: The outlook for 2018/19 U.S. wheat this month is for unchanged supplies but reduced exports and domestic use. The NASS Grain Stocks report, issued March 29, implied less feed and residual use for both the second and third quarters. Total 2018/19 feed and residual use is lowered 10 million bushels to 70 million. Wheat exports are lowered 20 million bushels to 945 million on a continued sluggish export pace. By class, Hard Red Winter exports are raised 10 million bushels, which is offset by reductions of 15 million for Hard Red Spring, 10 million for White, and 5 million for Durum. These demand changes, as well as a small reduction in seed use, led to a 31.5-million-bushel-increase in ending stocks, which are now projected at 1,087 million bushels. The season-average farm price is raised $0.05 per bushel at the midpoint to $5.20 based on updated NASS price and marketing data.
World 2018/19 wheat supplies are raised 77 million bushels due mainly to increased beginning stocks that largely reflect multi-year revisions for Iran. Global production and exports are each reduced fractionally, but domestic consumption is lowered 107 million bushels. The consumption change stems primarily from lower Iran and EU feed and residual use; Iran is lowered on the series revision and the EU reduction is based on more competitive corn prices and increased coarse grain disappearance. With supplies increasing and total use declining, global ending stocks are raised 187 million bushels to 10.127 billion.
2014/15 2015/16 2016/17 2017/18
Est.
2018/19 Projected
March
2018/19 Projected
April
2018/19 Change From
Previous Month
Change 2017/18
to 2018/19
Planted and Harvested Acres & Yield Acres Planted (Million Acres) 56.8 55 50.1 46.1 47.8 47.8
0 1.7 Acres Harvested (Million Acres) 46.4 47.3 43.8 37.6 39.6 39.6
0 2 U.S. Average Yield (Bu/Acre) 43.7 43.6 52.7 46.4 47.6 47.6
0 1.2
Supply (Million Bushels)
Beg. Stocks 590 752 976 1,181 1,099 1,099 0 -82 Production 2,026 2,062 2,309 1,741 1,884 1,884 0 143 Imports 151 113 118 157 145 145 0 -12 Total Supply 2,768 2,927 3,402 3,079 3,128 3,128 0 49
Use & Ending Stocks (Million Bushels)
Food 958 957 949 964 965 965 0 1 Seed 79 67 61 63 63 62 -1 -1 Feed 114 149 160 51 80 70 -10 19 Exports 864 778 1,051 901 965 945 -20 44 Total Use 2,015 1,951 2,222 1,980 2,073 2,042 -31 62 U.S. Ending Stocks 752 976 1,181 1,099 1,055 1,087 32 -12 Foreign Stocks 7,243 7,944 8,457 9,259 8,885 9,040 155 -219
Price and Stocks to Use Ratio
U.S. Avg. Season Price ($/Bu) $5.99 $4.89 $3.89 $4.72 $5.10-
$5.20 $5.15-$5.25 $0.05 $0.48
U.S. Stocks/Use 37.32% 50.03% 53.15% 55.51% 50.89% 53.23% 2.34% -2.27% Source: USDA-WASDE April 9, 2019

World Wheat Supply and Use (Million Bushels) 2018/19 (April)
Country / Region Beginning
Stocks Production Imports Domestic
Feed Domestic
Total Exports Ending Stocks
World 10,358 26,928 6,452 5,127 27,159 6,557 10,127 US 1,099 1,885 145 70 1,096 945 1,087 Foreign 9,259 25,044 6,307 5,057 26,063 5,612 9,040 Argentina 35 717 0 4 209 503 39 Australia 216 636 6 209 338 367 151 Canada 218 1,168 17 158 342 882 179 EU 519 5,056 220 1,874 4,519 882 394 Brazil 48 200 276 18 445 29 49 China 4,823 4,829 129 735 4,593 44 5,144 Sel. Mideast 537 657 645 134 1,390 20 429 N. Africa 543 772 992 83 1,697 26 585 Pakistan 177 937 0 44 930 55 130 Southeast Asia 185 0 963 306 942 39 166 India 485 3,663 4 184 3,491 18 643 Russia 442 2,634 18 661 1,488 1,360 247 Kazakhstan 87 513 2 66 243 312 47 Ukraine 46 921 2 88 320 606 43 ROW 898 2,342 3,034 491 5,117 468 795
World Wheat Supply and Use (Million Bushels) April-March 2018/19
Country / Region Beginning
Stocks Production Imports Domestic
Feed Domestic
Total Exports Ending Stocks
World 84 -5 -34 -93 -108 -17 187 US - - - -10 -12 -20 32 Foreign 83 -5 -34 -83 -97 3 155 Argentina - - - 2 2 -18 17 Australia - - - - - - - Canada - - - - - - - EU - - -7 -55 -55 37 11 Brazil - - - - - - - China - - - - - - - Sel. Mideast 73 -1 -33 -39 -44 -4 86 N. Africa 10 - 11 - 4 - 18 Pakistan - - - - - -7 7 Southeast Asia - - 26 11 11 - 15 India - - - - - - - Russia 6 - - - - - 7 Kazakhstan - - - - - - - Ukraine - 2 - - - - 2 ROW -5 -6 -30 -3 -14 -4 -7
Source: USDA-WASDE April 9, 2019

2019 Estimated Returns - Non-Irrigated
The profitability outlook has been updated after the release of the April 9, 2019 USDA WASDE reports. Producers have already started to plant their crop in Tennessee with most farmers having a firm grasp on their final crop mix for 2019. Yields used for non- irrigated estimates are a 5 year Tennessee state average year of 164 bushels per acre for corn, 47 bushels per acre for full-season soybeans, 1023 pounds per acre cotton, and 68 bushels per acre wheat. Prices used for grain sales are based on 2019 harvest cash bids as reported by the USDA Tennessee Cash Grain report dated April 9, 2019. The price of $0.70 per lb. of cotton is based on a cotton loan price of $0.52 and an $0.18 cotton equity. Based on these yields and prices, soybeans and corn are projected to have positive net returns over variable, land, and fixed costs. Cotton and wheat/soybeans are projected to have positive returns over variable and land costs but not able to cover the estimated fixed costs. Costs are based on the 2019 UT Extension Row Crop budgets with adjustments made where warranted. It depends on a producer's situation on what is showing to be the most profitable crop. Producers with cash rent or owned ground will want to look at Returns Over Variable Expenses as their land cost will be fixed and if their machinery cost are truly fixed and no equipment changes will be made. Producers with share rent will want to plug in their appropriate share rent if their equipment cost are fixed. Producers who may be making some equipment changes may want to look at Net Returns. Visit with your supplier on input cost expectations. Please contact your local County Extension office or Area Specialist - Farm Management for assistance in developing your own budget or farm financial plan. This table below should be used as a guide as yields, prices, and expenses will vary among producers and locations. Expenses will vary among producers and production systems. The cotton price of 70 cents that is being used in the profitability outlook. The price of 70 cents is made up of a cash price of 70 cents while assuming no gin rebates (seed & hauling) in 2019. Gin rebates for seed and hauling are an estimate as those are generally not known until harvest time and could be in the range of 0 to 5 cents. Producers should look at these returns as what could be if no adjustments are made in their operation and consider it a warning sign that adjustments will need to be made in 2019 to be sustainable. These estimates do not consider any USDA or crop insurance payments from the new farm bill. Please contact your local County Extension office or Area Specialist - Farm Management for assistance in developing your own budget or farm financial plan. This table below should be used as a guide as yields, prices, and expenses will vary among producers and locations. Expenses will vary among producers and production systems. Cotton prices include revenue for cottonseed and hauling. For reference, in variable expenses below, fertilizer expense per acre is estimated as follows: Cotton - $ 110, Soybeans - $47, Corn - $161 (includes 180 units of N), and Wheat/Soybeans - $106. These cost reflect a slight increase from 2018 to 2019 along with micronutrients where warranted. Operating expenses will continue to be adjusted as information becomes available. Weed control costs with resistant weeds have also been difficult to estimate. These costs will vary greatly among producers and individual fields with resistant weeds. Production costs are estimates based on the 2019 University of Tennessee Crop Budgets with adjustments made where needed. Please visit with your farm supplier on estimated costs for your operation. Producers with owned land and or cash rent can use Returns Over Variable as a guide in decision making. Producers with share rent ground should use Returns Over Variable and Land Costs as a guide with their appropriate share
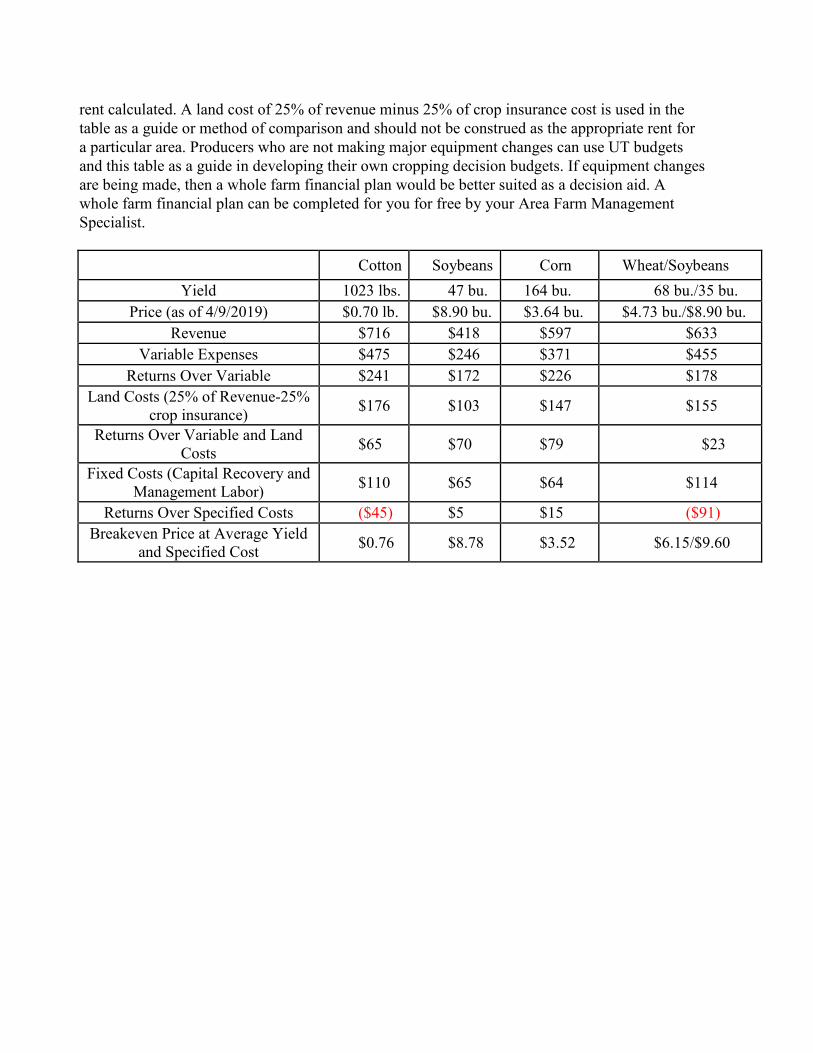
rent calculated. A land cost of 25% of revenue minus 25% of crop insurance cost is used in the table as a guide or method of comparison and should not be construed as the appropriate rent for a particular area. Producers who are not making major equipment changes can use UT budgets and this table as a guide in developing their own cropping decision budgets. If equipment changes are being made, then a whole farm financial plan would be better suited as a decision aid. A whole farm financial plan can be completed for you for free by your Area Farm Management Specialist. Cotton Soybeans Corn Wheat/Soybeans
Yield 1023 lbs. 47 bu. 164 bu. 68 bu./35 bu. Price (as of 4/9/2019) $0.70 lb. $8.90 bu. $3.64 bu. $4.73 bu./$8.90 bu.
Revenue $716 $418 $597 $633 Variable Expenses $475 $246 $371 $455
Returns Over Variable $241 $172 $226 $178 Land Costs (25% of Revenue-25%
crop insurance) $176 $103 $147 $155
Returns Over Variable and Land Costs $65 $70 $79 $23
Fixed Costs (Capital Recovery and Management Labor) $110 $65 $64 $114
Returns Over Specified Costs ($45) $5 $15 ($91) Breakeven Price at Average Yield
and Specified Cost $0.76 $8.78 $3.52 $6.15/$9.60
2019 Estimated Returns - Irrigated
Considering irrigation, Returns Over Variable, Land, and Fixed cost are negative for all principal row crops. An individual producer's machinery and equipment costs will have a strong influence on profitability. Producers should look at these returns as what could be if no adjustments are made in their operation and consider that adjustments may need to be made in 2019 to be sustainable. The table below is an estimate of returns for crops under irrigation. Since irrigated yields are not as of yet kept separate in Tennessee, yields below are an estimate of irrigated yields. Note that due to an increase in dryland cotton and corn 5-year state average yields, irrigated yields have been increased in this projection over the previous year. Irrigation fixed costs and energy costs will vary greatly among producers and systems. These projections include in variable expenses energy costs for irrigation of $32 per acre for corn, $27 per acre for cotton, and $20 per acre for soybeans. Irrigation repairs and maintenance are estimated at $16 per acre for corn, $13 per acre for cotton, and $10 per acre for soybeans. Fixed costs of $86 per acre for irrigation equipment are used. Please contact your local County Extension office or Area Specialist - Farm Management for assistance in developing your own budget or farm financial plan. This table below should be used as a guide as yields, prices, and expenses will vary among producers and locations. Expenses will vary among producers and production systems. For reference, in variable expenses below, fertilizer expense per acre is estimated as follows: Cotton - $115, Soybeans - $57, Corn - $198 (includes 240 units of N), and Wheat/Soybeans - $106. Cost of production will continue to be adjusted as information becomes available. Weed control costs with resistant weeds have also been difficult to estimate. These costs will vary greatly among producers and individual fields. Production costs are estimates based on the 2018 University of Tennessee Crop Budgets with adjustments made where needed. Please visit with your farm supplier on estimated cost in your area. Producers with owned land and or cash rent can use Returns Over Variable and Fixed IR Costs as a guide in decision making. Producers with share rent ground should use Returns Over Variable, Fixed IR Costs and Land Costs as a guide with their appropriate share rent calculated. A land cost of 25% of revenue minus 25% of crop insurance cost minus 25% of the irrigation equipment fixed cost is used in the table as a guide or method of comparison and should not be construed as the appropriate rent for a particular area. A management cost of $30 per acre is included in Fixed Costs – Capital Recovery and Management Labor. This is an additional $15 above the dryland crop management labor. Producers who are not making major equipment changes can use UT budgets and this table as a guide in developing their own cropping decision budgets. If equipment changes are being made, then a whole farm financial plan would be better suited as a decision aid. A whole farm financial plan can be completed for you for free by your Area Farm Management Specialist.

Cotton Soybeans Corn Wheat/Soybeans Yield 1200 lbs. 60 bu. 210 bu. 68 bu./45 bu.
Price (as of 4/9/2019) $0.70 lb. $8.90 bu. $3.64 bu. $4.73 bu./$8.90 bu. Revenue $840 $534 $764 $722
Variable Expenses(includes energy cost) $475 $289 $489 $455
Fixed Irrigation Costs per Acre $86 $86 $86 $86 Returns Over Variable & Fixed IR
Costs $279 $159 $189 $181
Land Costs (25% of Revenue-25% crop insurance-25% fixed
irrigation costs) $207 $132 $189 $177
Returns Over Variable, IR Fixed Cost and Land Costs $72 $27 $0 $4
Fixed Costs (Capital Recovery and Management Labor) $125 $81 $84 $114
Returns Over Specified Costs ($53) ($54) ($84) ($110) Breakeven Price at Average Yield
and Specified Cost $0.75 $9.80 $4.04 $5.82/$9.70