april investor presentation - jpmorgan chase000 middle market clients $2.9 billion in middle market...
TRANSCRIPT
A P R I L 1 9, 2 0 0 6
F I N A N C I A L R E S U L T S
First Quarter 2006
2
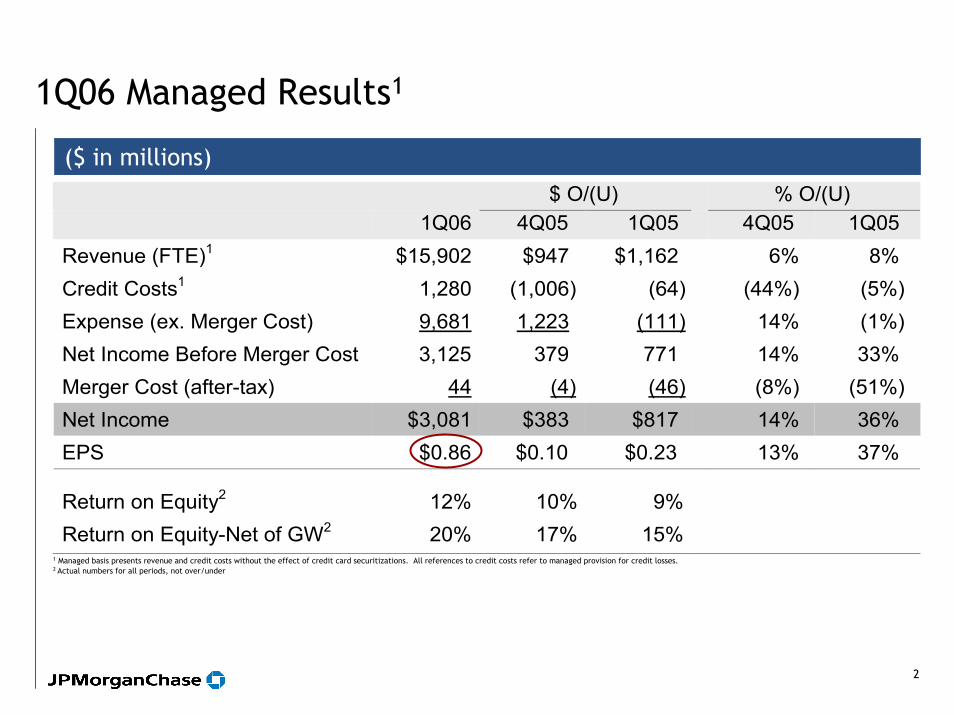
1Q06 Managed Results1
($ in millions) $ O/(U) % O/(U) 1Q06 4Q05 1Q05 4Q05 1Q05 Revenue (FTE)1 $15,902 $947 $1,162 6% 8% Credit Costs1 1,280 (1,006) (64) (44%) (5%) Expense (ex. Merger Cost) 9,681 1,223 (111) 14% (1%) Net Income Before Merger Cost 3,125 379 771 14% 33% Merger Cost (after-tax) 44 (4) (46) (8%) (51%) Net Income $3,081 $383 $817 14% 36% EPS $0.86 $0.10 $0.23 13% 37%
Return on Equity2 12% 10% 9%Return on Equity-Net of GW2 20% 17% 15%
1 Managed basis presents revenue and credit costs without the effect of credit card securitizations. All references to credit costs refer to managed provision for credit losses.2 Actual numbers for all periods, not over/under
3
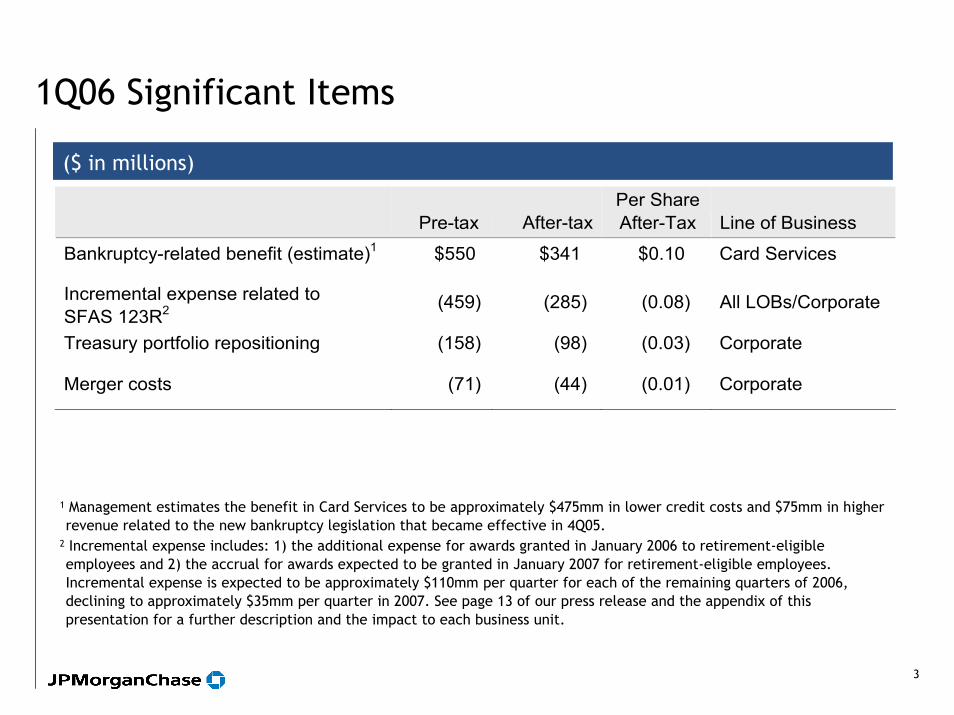
1Q06 Significant Items
($ in millions)
Pre-tax After-tax
Per Share After-Tax Line of Business
Bankruptcy-related benefit (estimate)1 $550 $341 $0.10 Card Services
Incremental expense related to SFAS 123R2
(459) (285) (0.08) All LOBs/Corporate
Treasury portfolio repositioning (158) (98) (0.03) Corporate
Merger costs (71) (44) (0.01) Corporate
1 Management estimates the benefit in Card Services to be approximately $475mm in lower credit costs and $75mm in higher revenue related to the new bankruptcy legislation that became effective in 4Q05.
2 Incremental expense includes: 1) the additional expense for awards granted in January 2006 to retirement-eligible employees and 2) the accrual for awards expected to be granted in January 2007 for retirement-eligible employees. Incremental expense is expected to be approximately $110mm per quarter for each of the remaining quarters of 2006, declining to approximately $35mm per quarter in 2007. See page 13 of our press release and the appendix of this presentation for a further description and the impact to each business unit.
4
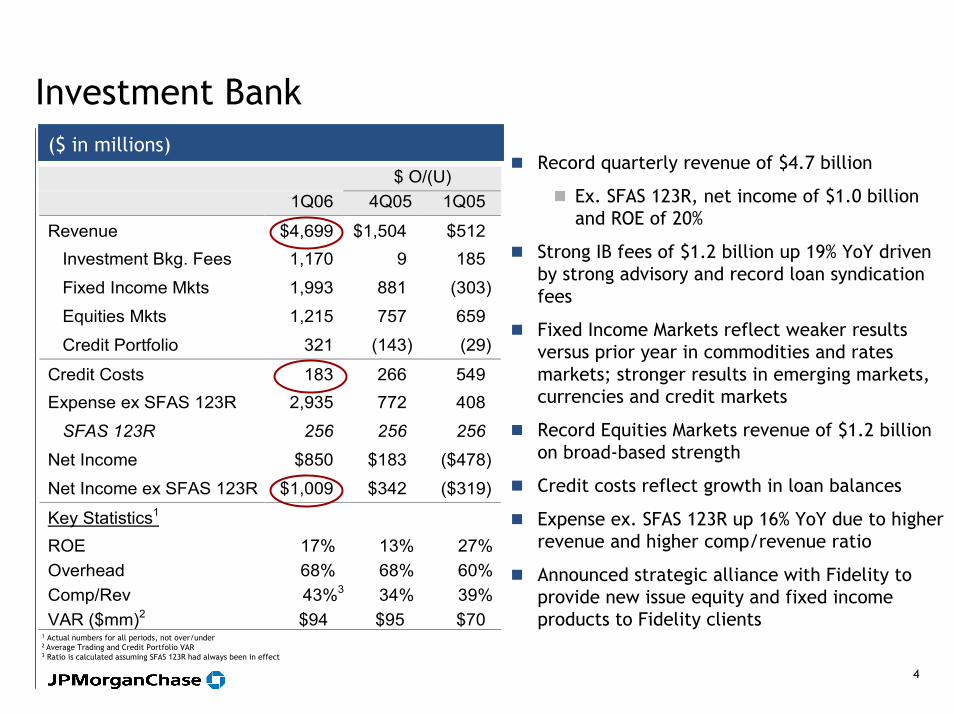
Investment Bank($ in millions)
$ O/(U) 1Q06 4Q05 1Q05
Revenue $4,699 $1,504 $512 Investment Bkg. Fees 1,170 9 185
Fixed Income Mkts 1,993 881 (303)
Equities Mkts 1,215 757 659
Credit Portfolio 321 (143) (29)
Credit Costs 183 266 549 Expense ex SFAS 123R 2,935 772 408
SFAS 123R 256 256 256
Net Income $850 $183 ($478)
Net Income ex SFAS 123R $1,009 $342 ($319)
Key Statistics1 ROE 17% 13% 27%Overhead 68% 68% 60%Comp/Rev 43%3 34% 39%VAR ($mm)2 $94 $95 $70
1 Actual numbers for all periods, not over/under2 Average Trading and Credit Portfolio VAR3 Ratio is calculated assuming SFAS 123R had always been in effect
Record quarterly revenue of $4.7 billion
Ex. SFAS 123R, net income of $1.0 billion and ROE of 20%
Strong IB fees of $1.2 billion up 19% YoY driven by strong advisory and record loan syndication fees
Fixed Income Markets reflect weaker results versus prior year in commodities and rates markets; stronger results in emerging markets, currencies and credit markets
Record Equities Markets revenue of $1.2 billion on broad-based strength
Credit costs reflect growth in loan balances
Expense ex. SFAS 123R up 16% YoY due to higher revenue and higher comp/revenue ratio
Announced strategic alliance with Fidelity to provide new issue equity and fixed income products to Fidelity clients
5
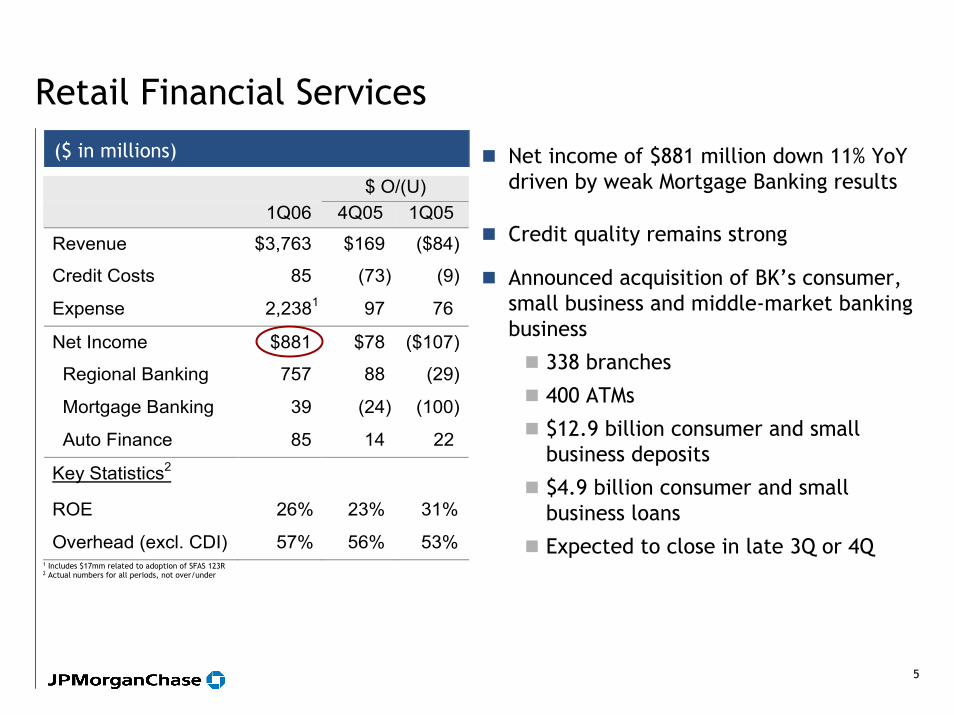
Retail Financial Services
$ O/(U) 1Q06 4Q05 1Q05
Revenue $3,763 $169 ($84)
Credit Costs 85 (73) (9)
Expense 2,2381 97 76
Net Income $881 $78 ($107)
Regional Banking 757 88 (29)
Mortgage Banking 39 (24) (100)
Auto Finance 85 14 22
Key Statistics2
ROE 26% 23% 31%
Overhead (excl. CDI) 57% 56% 53% 1 Includes $17mm related to adoption of SFAS 123R2 Actual numbers for all periods, not over/under
Net income of $881 million down 11% YoY driven by weak Mortgage Banking results
Credit quality remains strong
Announced acquisition of BK’s consumer, small business and middle-market banking business
338 branches
400 ATMs
$12.9 billion consumer and small business deposits
$4.9 billion consumer and small business loans
Expected to close in late 3Q or 4Q
($ in millions)

6
Regional Banking
$ O/(U) 1Q06 4Q05 1Q05 Revenue $3,040 $238 $3Credit Costs 66 (21) 1Expense 1,738 102 33Net Income $757 $88 ($29)
Less: Portfolio - - 74 - - Less: JV cancellation - - - - 25Adjusted Net Income $757 $14 ($54) Key Statistics ($B)2 ROE 31% 28% 36% Overhead (excl. CDI) 54% 54% 52% Checking Accts (MM) 8.9 8.8 8.3 # of Branches 2,638 2,641 2,517 # of ATMs 7,400 7,312 6,687 Total avg deposits $184.7 $177.6 $174.1 Home equity originations $11.7 $12.1 $11.9 Avg home equity loans $74.1 $72.7 $66.2 Avg mortgage loans $44.6 $45.6 $43.4 Avg education loans $5.4 $2.6 $4.6
1 Includes Hybrid ARM mark-to-market of ($120)mm pre-tax in 4Q052 Actual numbers for all periods, not over/under
Net income of $757mm down 4% YoY
Branch production statistics YoYDeposits up 6%Checking accounts up 8%Branch sales of credit cards up 61% and mortgage loans up 52%
Revenue flat YoY due to higher deposit and loan balances offset by narrower spreads on deposits and home equity portfolios
Revenue up 8% QoQ due to absence of 4Q mark-to-market of Hybrid ARMs, seasonal tax-refund anticipation business and deposit growth
Expense reflects net investments
Completed acquisition of Collegiate Funding Services
$6bn of education loans added
($ in millions)
7
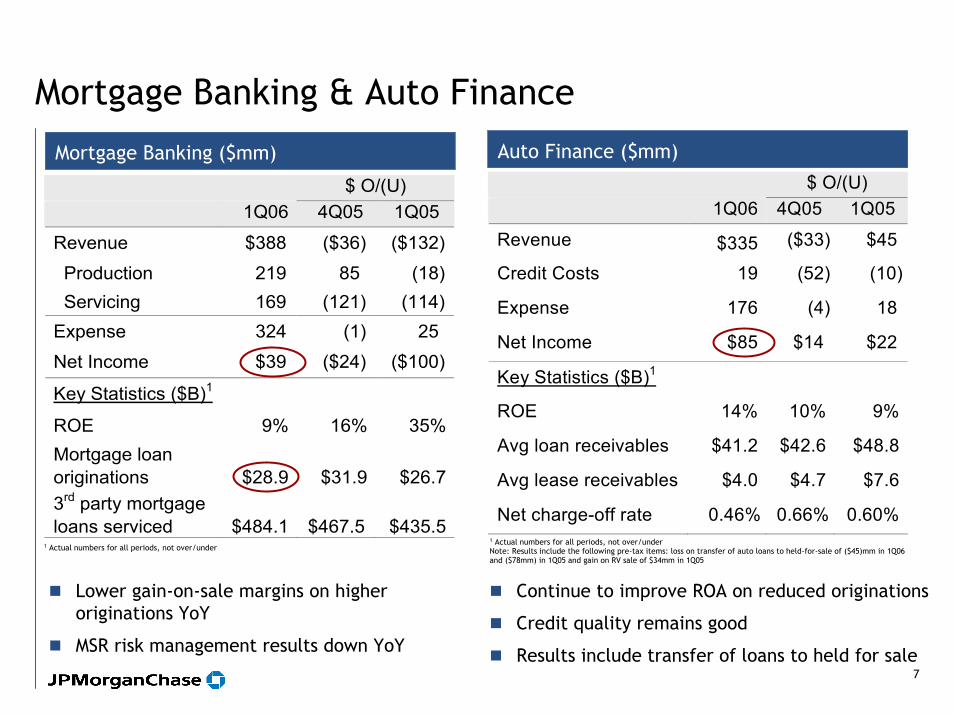
Mortgage Banking & Auto FinanceAuto Finance ($mm)Mortgage Banking ($mm)
$ O/(U) 1Q06 4Q05 1Q05
Revenue $388 ($36) ($132)
Production 219 85 (18) Servicing 169 (121) (114)Expense 324 (1) 25
Net Income $39 ($24) ($100)
Key Statistics ($B)1
ROE 9% 16% 35%Mortgage loan originations
$28.9
$31.9
$26.7
3rd party mortgage loans serviced
$484.1
$467.5
$435.5
$ O/(U) 1Q06 4Q05 1Q05
Revenue $335 ($33) $45
Credit Costs 19 (52) (10)
Expense 176 (4) 18
Net Income $85 $14 $22
Key Statistics ($B)1
ROE 14% 10% 9%
Avg loan receivables $41.2 $42.6 $48.8
Avg lease receivables $4.0 $4.7 $7.6
Net charge-off rate 0.46% 0.66% 0.60%
Continue to improve ROA on reduced originations
Credit quality remains good
Results include transfer of loans to held for sale
1 Actual numbers for all periods, not over/underNote: Results include the following pre-tax items: loss on transfer of auto loans to held-for-sale of ($45)mm in 1Q06 and ($78mm) in 1Q05 and gain on RV sale of $34mm in 1Q05
Lower gain-on-sale margins on higher originations YoY
MSR risk management results down YoY
1 Actual numbers for all periods, not over/under

8
Card Services (Managed)
$ O/(U) 1Q06 4Q05 1Q05
Revenue $3,685 ($36) ($94)
Rev. adj. for Paymentech 3,685 (36) 44
Credit Costs 1,016 (1,220) (620)
Expense 1,2432 226 (70)
Exp. adj. for Paymentech 1,243 226 54
Net Income $901 $599 $379
Key Statistics ($B)1
ROE 26% 10% 18%ROO (pre-tax) 4.19% 1.34% 2.52%Managed Margin 8.85% 8.14% 9.13%Net Charge-Off Rate 2.99% 6.39% 4.83%30 Day Delinquency Rate 3.10% 2.79% 3.54%Avg Outstandings $138.0 $138.9 $133.6EOP Outstandings $134.3 $142.3 $133.4Charge Volume $74.3 $79.6 $70.3Net Accts Opened (MM) 2.7 12.5 2.7
1 Actual numbers for all periods, not over/under2 Includes $4mm related to adoption of SFAS 123R
Net income of $901mm up 73% YoYROO of 4.2%; management estimate of ROO ex. bankruptcy benefit of approximately 2.6%
Bankruptcy legislation change positively impacted pre-tax earnings by an estimated $550mm, primarily through lower credit costs
Decline in end of period outstandings QoQ greater than typical seasonal decline driven by higher payments, possibly due to impact of min pay rule changes
Revenue slightly up YoY driven by higher loan balances including the impact of Sears Canada acquisition, the benefit from fewer bankruptcy-related revenue reversals and increased charge volume, offset by lower spread
Expense up YoY and QoQ due to higher marketing expense and impact of Sears Canada acquisition, partially offset by merger savings
Announced acquisition of Kohl’s private label portfolio with approximately $1.5 billion in loan balances
Expected to close in 2Q
($ in millions)
9
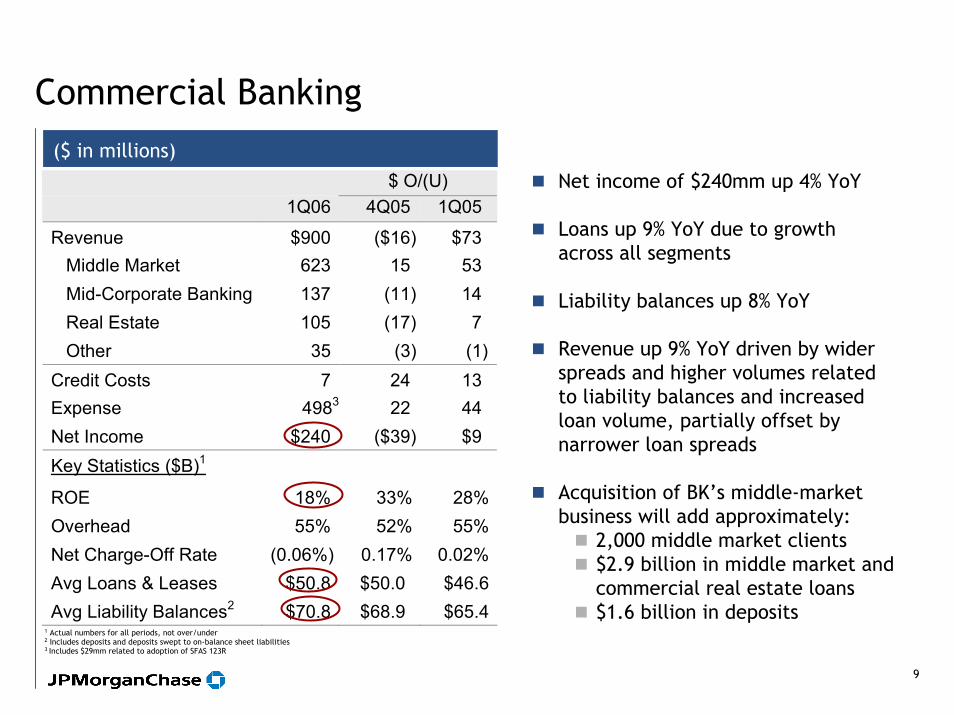
Commercial Banking($ in millions) $ O/(U) 1Q06 4Q05 1Q05
Revenue $900 ($16) $73 Middle Market 623 15 53 Mid-Corporate Banking 137 (11) 14 Real Estate 105 (17) 7 Other 35 (3) (1)Credit Costs 7 24 13 Expense 4983 22 44 Net Income $240 ($39) $9 Key Statistics ($B)1
ROE 18% 33% 28%Overhead 55% 52% 55%Net Charge-Off Rate (0.06%) 0.17% 0.02%Avg Loans & Leases $50.8 $50.0 $46.6Avg Liability Balances2 $70.8 $68.9 $65.4
1 Actual numbers for all periods, not over/under2 Includes deposits and deposits swept to on-balance sheet liabilities3 Includes $29mm related to adoption of SFAS 123R
Net income of $240mm up 4% YoY
Loans up 9% YoY due to growth across all segments
Liability balances up 8% YoY
Revenue up 9% YoY driven by wider spreads and higher volumes related to liability balances and increased loan volume, partially offset by narrower loan spreads
Acquisition of BK’s middle-market business will add approximately:
2,000 middle market clients $2.9 billion in middle market and commercial real estate loans $1.6 billion in deposits

10
Treasury & Securities Services
$ O/(U) 1Q06 4Q05 1Q05
Revenue $1,677 $49 $179 Treasury Services 693 6 59
Worldwide Securities Svcs 984 43 120
Expense 1,1584 53 91 Net Income $312 $5 $58 Key Statistics1 ROE 44% 64% 54%
Pre-tax Margin 29% 30% 26%
TSS Firmwide Revenue $2,275 $2,221 $2,038
TSS Firmwide OH Ratio 62% 61% 64%
TS Firmwide Revenue $1,291 $1,280 $1,174
Avg Liability Balances ($B)2 $196.3 $179.3 $160.9
Assets under Custody ($T)3 $11.7 $11.2 $10.2
Record net income of $312mm up 23% YoY and 2% QoQ
Pre-tax margin of 29%
Liability balances up 22% YoY; Assets under custody up 14% YoY5
Revenue up 12% YoY driven by wider spreads on higher liability balances, increased product volume, market appreciation and the impact of Vastera
Expenses up 9% YoY primarily due to new business growth, adoption of SFAS 123R and the impact of Vastera
Completed acquisition of middle and back office operations of Paloma
Announced sale of Corporate Trust business to BK6
1 Actual numbers for all periods, not over/under2 Includes deposits and deposits swept to on-balance sheet liabilities3 1Q06 and 4Q05 include approximately $130 billion of trust assets under custody that had not been reported previously4 Includes $25mm related to adoption of SFAS 123R5 Excludes impact of $130 billion of trust assets under custody that were not reported in 1Q056 Excludes ADR, Escrow and Commercial Paper businesses
($ in millions)

11
Asset & Wealth Management
$ O/(U) 1Q06 4Q05 1Q05
Revenue $1,584 $73 $223
Credit Costs (7) 3 - -
Expense ex. SFAS 123R 1,027 (6) 93
SFAS 123R 71 71 71
Net Income $313 ($29) $37
Key Statistics ($B)1
ROE 36% 57% 47%
Pre-tax Margin 31% 32% 32%
Assets under Supervision $1,197 $1,149 $1,092
Assets under Mgmt $873 $847 $790
Average Loans $24.52 $26.7 $26.4
Average Deposits $48.12 $44.2 $42.0 1 Actual numbers for all periods, not over/under2 1Q06 does not include the loans and deposits of BrownCo, which were both $3bn at the time of sale on November 30, 2005
Net income of $313mm up 13% YoY Pre-tax margin of 31%; pre-tax margin ex. SFAS 123R of 36%
Assets under management up 11% YoY; net asset inflows primarily driven by retail equity-related flows through third party distribution and institutional liquidity inflows
Highbridge AUM of $9 billion up 14% YoY
Revenue up 16% YoY due to net asset inflows, market appreciation and higher placement and performance fees, partially offset by the sale of BrownCo in 4Q05 and narrower deposit spreads
Expense ex. SFAS 123R up 10% YoY due to higher performance based compensation, partially offset by the sale of BrownCo in 4Q05
($ in millions)

12
CorporateTotal Corporate ($mm) Treasury ($mm)
$ O/(U) 1Q06 4Q05 1Q05
Net Income1 ($416) ($414) $919
Private Equity 103 (18) (334)
Treasury (270) 304 558 Other (205) (704) 649 Merger Costs (44) 4 46
$ O/(U) 1Q06 4Q05 1Q05
Net Income $103 ($18) ($334)
Private equity gains 237 (52) (552)
EOP Private equity portfolio ($B)2
$6.3 $6.2 $7.2
2 Actual numbers for all periods, not over/under
Private Equity ($mm)
$ O/(U) 1Q06 4Q05 1Q05
Net Income ($270) $304 $558
Net Interest Income (278) 111 131
Securities gains/(losses) (158) 389 744
Avg Treasury Investment Portfolio($B)2
$40.0
$37.8
$65.6
$ O/(U) 1Q06 4Q05 1Q05
Net Income ex. merger costs ($205) ($704) $6493
Gain on sale of BrownCo (after-tax) - - (752) - -
Other Corp. ex. adjustments ($205) $48 $649
Other Corporate ($mm)
3 1Q05 included WorldCom settlement of $558mm after-tax
1 Includes $57mm in pre-tax expense related to adoption of SFAS 123R
13
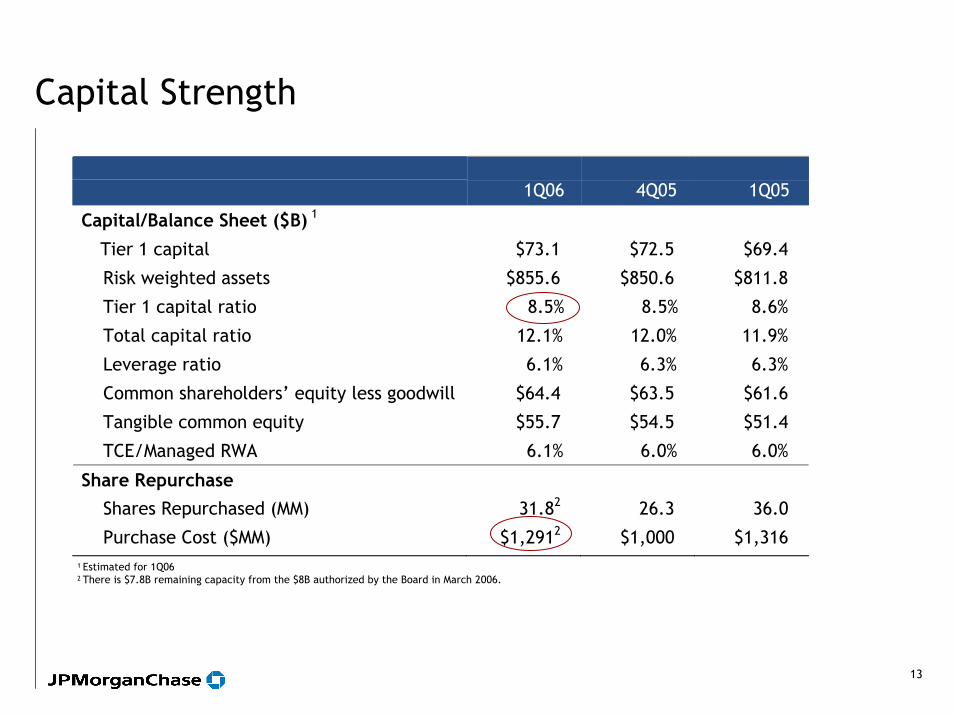
Capital Strength
1Q06
4Q05
1Q05
Capital/Balance Sheet ($B) 1
Tier 1 capital $73.1 $72.5 $69.4
Risk weighted assets $855.6 $850.6 $811.8
Tier 1 capital ratio 8.5% 8.5% 8.6%
Total capital ratio 12.1% 12.0% 11.9%
Leverage ratio 6.1% 6.3% 6.3%
Common shareholders’ equity less goodwill $64.4 $63.5 $61.6
Tangible common equity $55.7 $54.5 $51.4
TCE/Managed RWA 6.1% 6.0% 6.0%
Share Repurchase
Shares Repurchased (MM) 31.82 26.3 36.0
Purchase Cost ($MM) $1,2912 $1,000 $1,316 1 Estimated for 1Q06
2 There is $7.8B remaining capacity from the $8B authorized by the Board in March 2006.

14
1Q06 Summary Assessment
IB net income of $1 billion1 on record revenue
Regional Banking – Good deposit and account growth
Card managed net interest margin up QoQ and spend volumes up YoY
Treasury & Securities Services, Asset & Wealth Management and Commercial Banking produced good returns on higher revenue and underlying growth in loan balances, liability balances and AUM
Weaker results in Mortgage Banking and Private Equity
Corporate results showed improvement
1 Adjusted for incremental impact of SFAS 123R
15
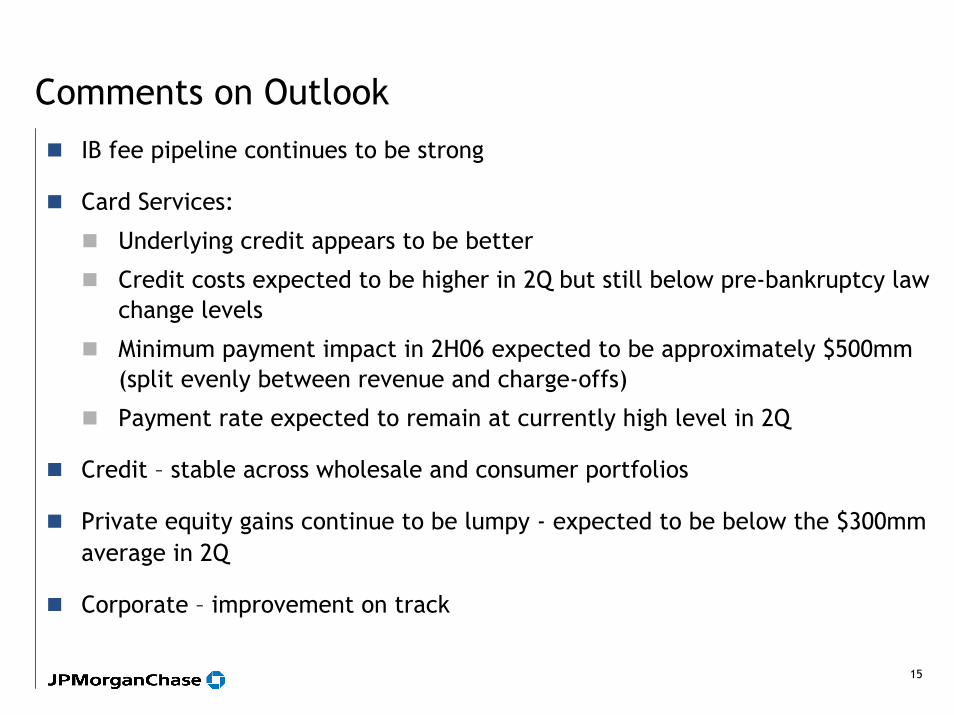
Comments on OutlookIB fee pipeline continues to be strong
Card Services:
Underlying credit appears to be better
Credit costs expected to be higher in 2Q but still below pre-bankruptcy law change levels
Minimum payment impact in 2H06 expected to be approximately $500mm (split evenly between revenue and charge-offs)
Payment rate expected to remain at currently high level in 2Q
Credit – stable across wholesale and consumer portfolios
Private equity gains continue to be lumpy - expected to be below the $300mm average in 2Q
Corporate – improvement on track
A P P E N D I X
17
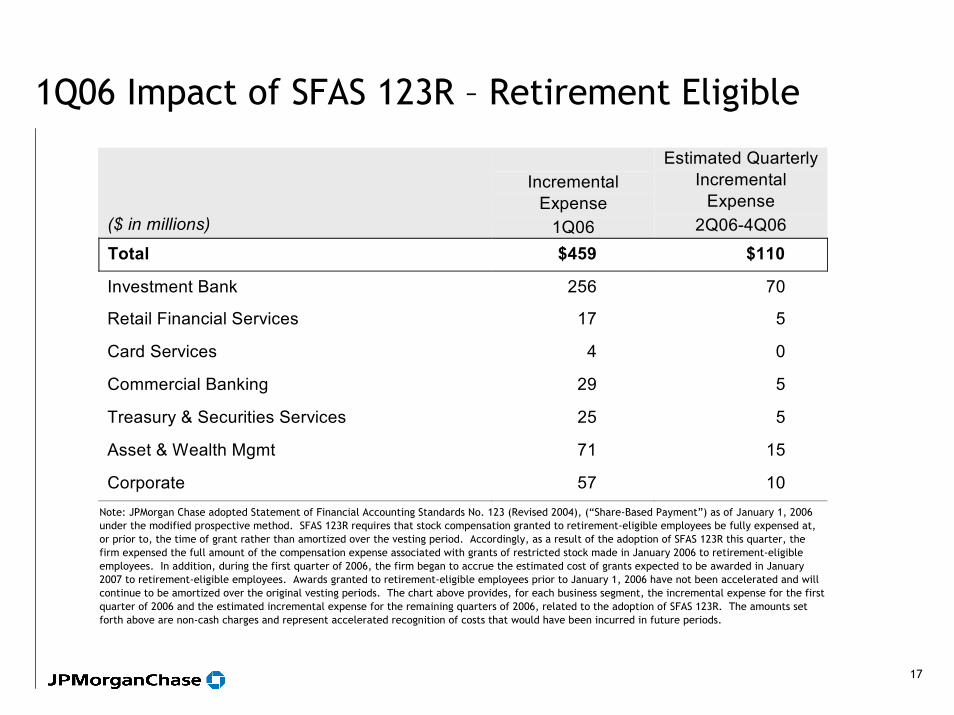
1Q06 Impact of SFAS 123R – Retirement Eligible
($ in millions)
Incremental
Expense 1Q06
Estimated Quarterly Incremental
Expense 2Q06-4Q06
Total $459 $110
Investment Bank 256 70
Retail Financial Services 17 5
Card Services 4 0
Commercial Banking 29 5
Treasury & Securities Services 25 5
Asset & Wealth Mgmt 71 15
Corporate 57 10 Note: JPMorgan Chase adopted Statement of Financial Accounting Standards No. 123 (Revised 2004), (“Share-Based Payment”) as of January 1, 2006 under the modified prospective method. SFAS 123R requires that stock compensation granted to retirement-eligible employees be fully expensed at, or prior to, the time of grant rather than amortized over the vesting period. Accordingly, as a result of the adoption of SFAS 123R this quarter, the firm expensed the full amount of the compensation expense associated with grants of restricted stock made in January 2006 to retirement-eligible employees. In addition, during the first quarter of 2006, the firm began to accrue the estimated cost of grants expected to be awarded in January 2007 to retirement-eligible employees. Awards granted to retirement-eligible employees prior to January 1, 2006 have not been accelerated and will continue to be amortized over the original vesting periods. The chart above provides, for each business segment, the incremental expense for the first quarter of 2006 and the estimated incremental expense for the remaining quarters of 2006, related to the adoption of SFAS 123R. The amounts set forth above are non-cash charges and represent accelerated recognition of costs that would have been incurred in future periods.

18
Disclaimer
This presentation contains forward-looking statements within the meaning of the Private Securities Litigation Reform Act of 1995. Such statements are based upon the current beliefs and expectations of JPMorgan Chase’s management and are subject to significant risks and uncertainties. Actual results may differ from those set forth in the forward-looking statements. Factors that could cause JPMorgan Chase’s results to differ materially from those described in the forward-looking statements can be found in the firm’s Annual Report on Form 10-K for the year ended December 31, 2005, filed with the Securities and Exchange Commission and available at the Securities and Exchange Commission’s Internet site (http://www.sec.gov).