aps-footprint tool general methodology
TRANSCRIPT
v
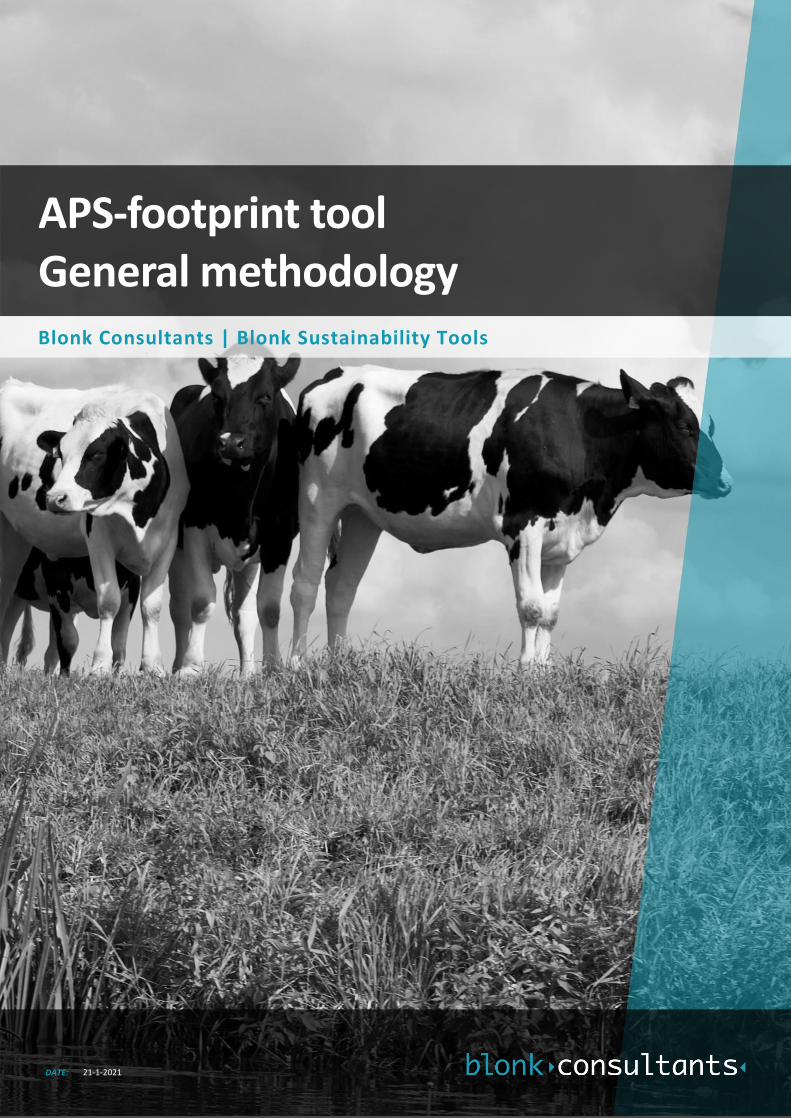
APS-footprint tool General methodology Blonk Consultants | Blonk Sustainability Tools
DATE: 21-1-2021

Blonk Consultants helps companies, governments and civil society organisations put sustainability into practice. Our team of dedicated consultants works closely with our clients to deliver clear and practical advice based on sound, independent research. To ensure optimal outcomes we take an integrated approach that encompasses the whole production chain.
Title APS-footprint tool general methodology Date 21-1-2021 Place Gouda, NL Authors Nicoló Braconi
Roline Broekema Hans Blonk
Blonk Consultants Blonk Consultants Blonk Consultants
Blonk Consultants | Blonk Sustainability Tools (+31) 0182 579970
Groen van Prinsterersingel 45 www.blonkconsultants.nl
2805 TD Gouda [email protected]
APS-footprint tool general methodology
Blonk Consultants | Blonk Sustainability Tools
1 BLONK CONSULTANTS | BLONK SUSTAINABILITY TOOLS - 2021
Table of contents 1. Introduction.................................................................................................................................................... 1
1.1 Background and document outline ....................................................................................................... 1
1.2 Intended use and user groups ............................................................................................................... 1
1.3 APS methods .......................................................................................................................................... 1
1.4 APS-footprint reference systems ........................................................................................................... 1
1.5 Review and review process ................................................................................................................... 2
1.6 Versioning and Change log .................................................................................................................... 2
2. Life cycle stages and available modules ......................................................................................................... 2
3. Methodological framework ............................................................................................................................ 2
3.1 Standards, guidelines and LCA methodology ........................................................................................ 3
3.1.1 Reference unit ................................................................................................................................... 3
3.1.2 System boundaries ............................................................................................................................ 3
3.1.3 Allocation .......................................................................................................................................... 2
3.1.4 Emission modelling and TIER levels ................................................................................................... 2
3.1.5 Impact categories .............................................................................................................................. 2
3.1.6 Use of primary data ........................................................................................................................... 2
3.1.7 Background databases ...................................................................................................................... 2
3.2 Data Quality Rating Methodology ......................................................................................................... 1
3.3 Limitations ............................................................................................................................................. 1
4. References ...................................................................................................................................................... 1
1 BLONK CONSULTANTS | BLONK SUSTAINABILITY TOOLS - 2021
1. Introduction
1.1 Background and document outline Making animal production more sustainable is critical for transforming to a more sustainable food production
system. Meat and animal-derived products have a significant contribution to the environmental impact of diets
(FABLE Consortium, 2019)(Broekema et al., 2020). The animal production sector is therefore a key sector for
action. APS-footprint is a web application that aims to support the animal production sector with a practical and
insightful tool to evaluate environmental performance of animal products like milk, beef, pork, and chicken meat.
This document describes the generic principles and setup of the APS Footprint tool. This chapter introduces the
goals of the tool, its intended use, and change log. Chapter 2 introduces the lifecycles stages and the types of
animal production systems (modules) currently available in the tool. The third chapter explains the
methodological framework of the APS-footprint tool. In addition to this general documentation, the
methodology for each module of the APS-footprint tool is documented in a separate report.
1.2 Intended use and user groups APS-footprint is a tool for computing lifecycle environmental impacts of animal production systems, as well as
the effects of changing system parameters, such as feed composition or the number of animals.
It is meant to evaluate changes in animal production for decision support on level A, C1 and C2 according to the
classification of the ILCD guidelines (JRC-IES & European Commision, 2010). Type A refers to “Micro level decision
support”, C to “Accounting” applications, including interactions with other systems (C1) as well as isolated
systems (C2). These decision support levels are also classified as attributional LCA, which is supported by the
main methodologies of FAO and the connected EC databases (European Commission, 2018c, 2018a; FAO, 2014;
FAO LEAP, 2016a, 2016b). The APS-footprint tool does not support type B decisions (“Meso/macro-level decision
support”) since this would require adaptation of underlying data and consequential dynamic modelling.
The APS-footprint tool can be used to compare different production systems, and evaluate innovative
technologies and other types of management interventions in an animal production system. In case an LCA
should be used to make public and/ or comparative claims, it is the responsibility of the practitioner to ensure
ISO 14040:2006/14044:2006 compliance through an ISO review of the study.
Intended users of the tool include all persons with technical knowledge of animal production systems and with
a conceptual understanding of LCA principles.
1.3 APS methods The APS-footprint tool calculates impacts according to well-defined LCA-standards and guidelines regarding
methodology and data. APS-footprint consists of several so-called APS methods. An APS method is a combination
of an LCA-standard, an emission model, a background database and an LCIA method. All of these are based on
specific guidelines, which will be further explained in this document. The APS methods are defined per animal
production system (per module). The number of APS methods will be expanded in the future, and available
methods will be updated if needed.
1.4 APS-footprint reference systems The APS-footprint tool contains data for several typical animal production systems, called reference systems, that
can be used as a starting point for an assessment. These reference systems are realistic for a certain time period
and represent a common form of production system in a given country or region. With these reference systems
(cf. Table 2.), a user can easily start exploring potential improvements by changing parameters of the animal
2 BLONK CONSULTANTS | BLONK SUSTAINABILITY TOOLS - 2021
production system. Data sources for the reference systems are documented in the reports of the specific animal
module (Blonk Consultants, 2020a, 2020c, 2020b).
1.5 Review and review process The implementation of APS-footprint methods and the available reference animal production systems are
reviewed on a regular basis.
The review involves the following elements:
1. The correct implementation of the calculation rules prescribed in the APS-footprint methods.
2. Review of the reference systems regarding representativeness of farm infrastructure, technical
parameters, and feed rations for the specific country/ region.
The review is a continuous process and is related to the implementation and updating of new modules, methods,
and reference systems. In the Tables 1 and 2 the reviews are listed.
Only reviewed databases are used, such as Agri-footprint 5.0 and the GFLI database which is reviewed against its
methodology report (Blonk, van Passen, & Broekema, 2020; Van Paassen, Braconi, Kuling, Durlinger, & Gual,
2019).
1.6 Versioning and Change log Significant updates and changes of the APS methods and the reference systems are shown in Table 1 and Table
2, respectively.
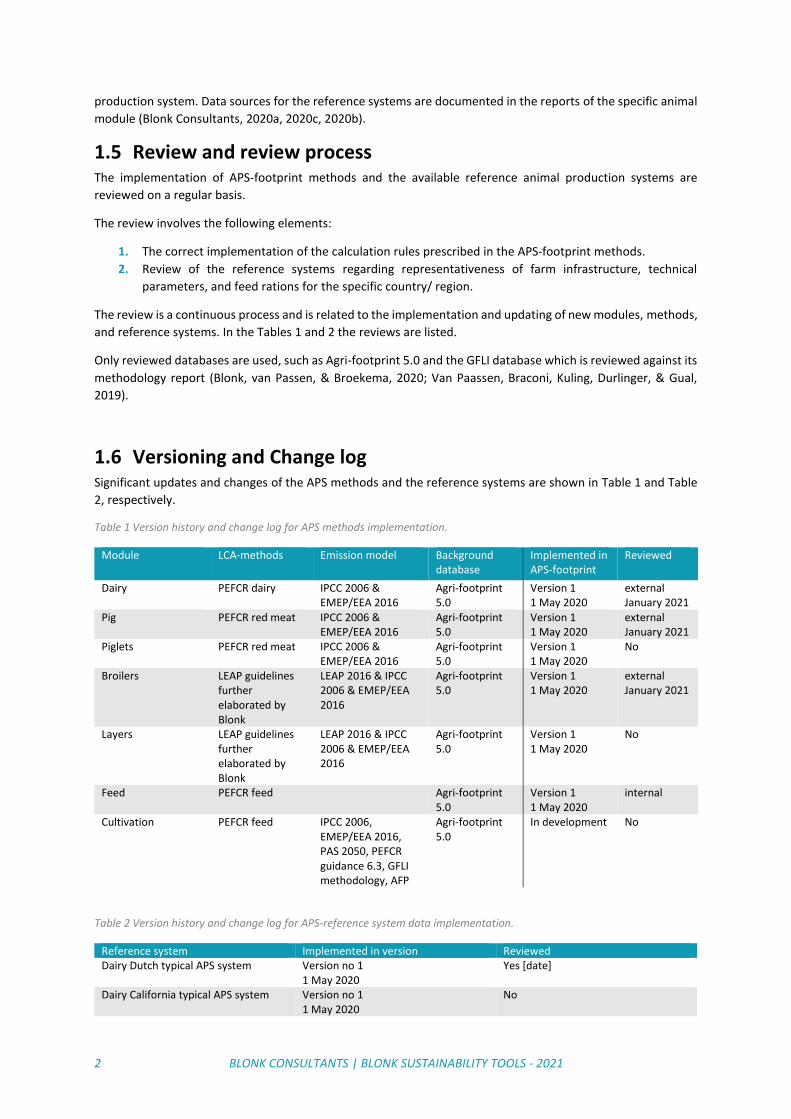
Table 1 Version history and change log for APS methods implementation.
Module LCA-methods Emission model Background database
Implemented in APS-footprint
Reviewed
Dairy PEFCR dairy IPCC 2006 & EMEP/EEA 2016
Agri-footprint 5.0
Version 1 1 May 2020
external January 2021
Pig PEFCR red meat IPCC 2006 & EMEP/EEA 2016
Agri-footprint 5.0
Version 1 1 May 2020
external January 2021
Piglets PEFCR red meat IPCC 2006 & EMEP/EEA 2016
Agri-footprint 5.0
Version 1 1 May 2020
No
Broilers LEAP guidelines further elaborated by Blonk
LEAP 2016 & IPCC 2006 & EMEP/EEA 2016
Agri-footprint 5.0
Version 1 1 May 2020
external January 2021
Layers LEAP guidelines further elaborated by Blonk
LEAP 2016 & IPCC 2006 & EMEP/EEA 2016
Agri-footprint 5.0
Version 1 1 May 2020
No
Feed PEFCR feed Agri-footprint 5.0
Version 1 1 May 2020
internal
Cultivation PEFCR feed IPCC 2006, EMEP/EEA 2016, PAS 2050, PEFCR guidance 6.3, GFLI methodology, AFP
Agri-footprint 5.0
In development No
Table 2 Version history and change log for APS-reference system data implementation.
Reference system Implemented in version Reviewed Dairy Dutch typical APS system Version no 1
1 May 2020 Yes [date]
Dairy California typical APS system Version no 1 1 May 2020
No
2 BLONK CONSULTANTS | BLONK SUSTAINABILITY TOOLS - 2021
Pigs Dutch typical APS system Version no 1 1 May 2020
No
Piglets Dutch typical APS system Version no 1 1 May 2020
No
Broilers Dutch typical APS system Version no 1 1 May 2020
No
Layers Dutch typical APS system Version no 1 1 May 2020
No
Dairy Italian typical APS system To be implemented Yes [date] Dairy French typical APS system To be implemented Yes [date]
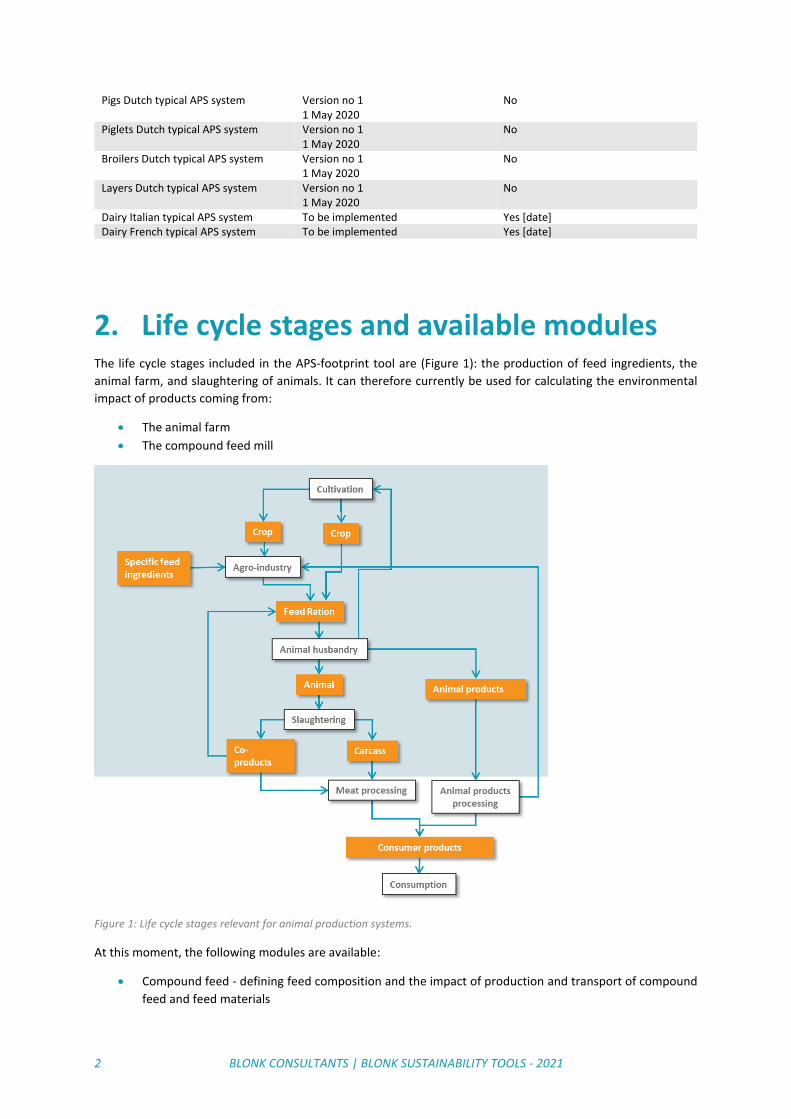
2. Life cycle stages and available modules The life cycle stages included in the APS-footprint tool are (Figure 1): the production of feed ingredients, the
animal farm, and slaughtering of animals. It can therefore currently be used for calculating the environmental
impact of products coming from:
• The animal farm
• The compound feed mill
Figure 1: Life cycle stages relevant for animal production systems.
At this moment, the following modules are available:
• Compound feed - defining feed composition and the impact of production and transport of compound
feed and feed materials
2 BLONK CONSULTANTS | BLONK SUSTAINABILITY TOOLS - 2021
• Dairy - defining animal herd composition, housing system, manure management, yields, ration and
inputs
• Fattening pigs - defining housing systems, yields, ration and inputs
• Piglets - defining housing systems, yields, ration and inputs
• Broiler fattening - defining housing systems, yields, ration and inputs
• Layers - defining housing systems, yields, ration and inputs
To be included soon:
• Cultivation
• Manure management
3. Methodological framework APS-footprint is a complete Life Cycle Assessment (LCA) tool for evaluating animal production systems.
LCA is the method for assessing the environmental impact related to the life cycle of a product or service. LCA is
a holistic approach that considers all relevant inputs and outputs; therefore, it shows where and to which extent
environmental impacts occur.
There are several standards and guidelines for LCA for animal products. Some of these standards and guidelines
are relatively generic and mainly provide process related guidance, while others include specific guidance in
terms of emission models, data requirements and data quality measurement. Important LCA standards and
guidelines that are used as a basis for the APS-footprint tool methodological framework are:
• The ISO 14040/44 series (ISO, 2006a, 2006b) describes the basic requirements for performing an LCA
study. This includes directions on how to define the functional unit of a product, how to determine
which processes need to be included or excluded, and how to deal with co-production situations where
elementary flows need to be allocated to the different products. However, the ISO standard can still
lead to different methodological decisions, depending on the LCA practitioner’s interpretation. This
means that applying the ISO standards properly may still result in different approaches and different
quantitative results.
• The ILCD handbook (JRC-IES & European Commision, 2010) provides more detailed guidelines compared
to ISO 14040/44 series. One of the most valuable methodological additions in the ILCD handbook is the
division between consequential and attributional LCA, which is not made in the ISO standard. The APS-
footprint tool follows mostly an attributional approach. There is a possibility to add consequential
modelling in case of manure processing and application.
• The Product Environmental Footprint (PEF) framework defines general requirements and principles to
calculate the environmental impact of products and services (European Commission, 2017). It was
developed by the European Commission with the aim of defining Category Rules (PEFCRs) for specific
product groups. For the APS-footprint tool, the relevant PEFCRs are the PEFCR for feed for food
producing animals (European Commission, 2018a), the PEFCR for dairy products (European Commission,
2018b) and PEFCR for red meat. The PEFCRs provide detailed guidance in terms of emission models and
methodological choices like functional unit, system boundaries and selection of background databases.
• The LEAP Guidelines are handbooks developed by FAO, with the aim to guide livestock industries in the
measurement of their life-cycle impact. These guidelines cover different animal production systems
and/or on various impact categories. The guidelines of main interest for the APS-footprint tool are:
o Greenhouse gas emissions and fossil energy use from poultry supply chains (FAO, 2016),
o Environmental performance of large ruminant supply chains (FAO LEAP, 2016a),
o Environmental performance of pig supply chains (FAO LEAP, 2016b),
o Nutrient flows and associated environmental impacts in livestock supply chains (FAO, 2018),
o Environmental performance of feed additives in livestock supply chains (FAO, 2019),
o PEFCR Feed for food producing animals (European Commission, 2018a).
2 BLONK CONSULTANTS | BLONK SUSTAINABILITY TOOLS - 2021
• IPCC Guidelines for National Greenhouse Gas Inventories, Volume 4, Agriculture, Forestry and Other
Land Use (IPCC, 2006). The Intergovernmental Panel on Climate Change (IPCC) developed calculation
methods and guidelines to estimate the climate change impact for various industry sectors. Of special
interest is chapter 10 that focuses on enteric methane production of animal farms and methane and
dinitrogen monoxide emissions from manure management and manure/ fertilizer application. Also, of
particular interest is chapter 11, focusing on dinitrogen monoxide emissions from managed soils and
carbon dioxide emission from lime and urea application.
• The EMEP/EEA air pollutant emission inventory guidebook (European Environment Agency, 2016) was
published by the European Environment Agency in order to help government bodies to measure air
pollution. It proposes calculation methods for nitrogen volatilization, Non-Methane Volatile Organic
Compounds (NMVOC) emissions and Particulate Matter (PM) emissions from many industry sectors,
including livestock.
• The National Inventory Submissions of different countries by the United Nations Framework Convention
on Climate Change (UNFCCC) report the yearly evolution of climate change emissions for a specific
country. Some countries developed advanced methodologies and country-specific emission factors. The
Dutch National Emission Model for Agriculture (NEMA) (Lagerwerf et al., 2019) is particularly relevant
for APS-footprint.
The APS-footprint tool is designed to allow switching from one methodological framework to another. This is an
innovative and useful feature that gives the user flexibility, since often a specific methodological framework is
required for a certain type of compliance. It also allows for sensitivity analyses resulting from specific
methodological choices.
The guidelines previously listed are regularly updated and revised. APS-footprint is therefore continuously
updated to account for such methodological changes. Please note that in order to maintain compliancy with e.g.
PEFCR, updates of IPCC and EEA/EMEP methodology will be performed only when indicated by the most recent
PEFCR document.
Another important aspect is that it is not always possible to apply a methodological framework in a fully
consistent way. Since the methodologies do not always cover all emissions and impact categories, it is sometimes
necessary to compute LCIA results based on a mix of different guidelines. Blonk Sustainability Tools has in-depth
knowledge in LCA and agricultural systems. Methodological choices in APS-footprint are implemented only after
thoughtful consideration, and are subject to the review of the APS-footprint tool. More detailed information for
the specific modules is available in the accompanying reports (Blonk Consultants, 2020b, 2020a, 2020c).
Depending on the LCIA method, different environmental indicators can be calculated. For the EF2.0 method
these are:
• Climate change – kg CO2 eq
• Ozone depletion – kg CFC11 eq
• Ionising radiation – kBq U-235 eq
• Photochemical ozone formation – kg NMVOC eq
• Respiratory inorganics – disease inc.
• Non-cancer human health effects – CTUh
• Cancer human health effects – CTUh
• Acidification terrestrial and freshwater – mol H+ eq
• Eutrophication freshwater – kg P eq
• Eutrophication marine – kg N eq
• Eutrophication terrestrial – mol N eq
• Ecotoxicity freshwater – CTUe
• Land use – Pt
• Water scarcity – m3 depriv.
• Resource use, energy carriers – MJ
• Resource use, mineral and metals – kg Sb eq

3 BLONK CONSULTANTS | BLONK SUSTAINABILITY TOOLS - 2021
3.1 Standards, guidelines and LCA methodology The APS-footprint tool enables the user to conduct an environmental assessment of an animal production
system, compliant to a certain standard or guideline. The selection of a standard/guideline prescribes specific
methodological choices for the LCA with respect to:
1. Functional unit
2. System boundaries
3. Allocation
4. Emission modelling rules and Tier levels
5. Impact categories
6. Use of primary data
7. Use of background data
3.1.1 Reference unit The functional unit of a product depends on the context in which the product is used. The purpose of the
functional unit is that products are compared based on equal functions. The functional unit can vary based on
the purpose and goal of the analysis. In APS-footprint, the output flows of the animal systems are not functional
units but reference units expressed in units of mass or volume. The environmental impact results are always
expressed per unit of the main product (Table 3).
Table 3 Reference flows of the different APS-footprint tool modules.
System Reference unit Cultivation (on farm) 1 kg of cultivated crop Compound feed 1 ton of compound feed Dairy 1 kg of Fat-Protein Corrected Milk Broiler 1 kg of broiler live weight Layers 1 kg of eggs Pig 1 kg of pig live weight Piglet breeding 1 kg of piglet live weight Beef 1 kg of beef live weight Fish 1 kg of fish live weight
3.1.2 System boundaries In the APS-footprint tool, the system boundaries of the animal farm modules are from cradle to farm gate (Figure
2). Some inputs can be parameterized and modelled by the user, while others are derived from background
databases. For example, cultivation at farms (e.g. roughages) can be modelled in the “Cultivation – on farm”
module, while the cultivation of ingredients outside of the farm are based on default background data. Table 4
summarizes the processes and activities that are included in the APS-footprint LCA.
Figure 2 System boundaries of the animal farm modules in the APS-footprint tool.
Inputs
- replacement animals
feed production
- bedding materials
- energy production
animal farm system
- feeding
- enteric fermentation
- housing
- manure management
Outputs
- animal products
- manure
-energy from manure
2 BLONK CONSULTANTS | BLONK SUSTAINABILITY TOOLS - 2021
The production of agricultural inputs (e.g. fertilizers, seed, pesticide), crop cultivation, other feed ingredient
processing, transportation, water and energy production are based on background LCI-databases that use the
system boundaries as shown in Table 4 All used background data is compliant to PEF methodology(European
Commission, 2018c).
The choice for inclusion or exclusion of the processes is based on the recommendations in PEFCR’s or LEAP
guidelines. The process of determining inclusion or exclusion in PEFCR’s was based on impact contribution
(significance) and data availability.
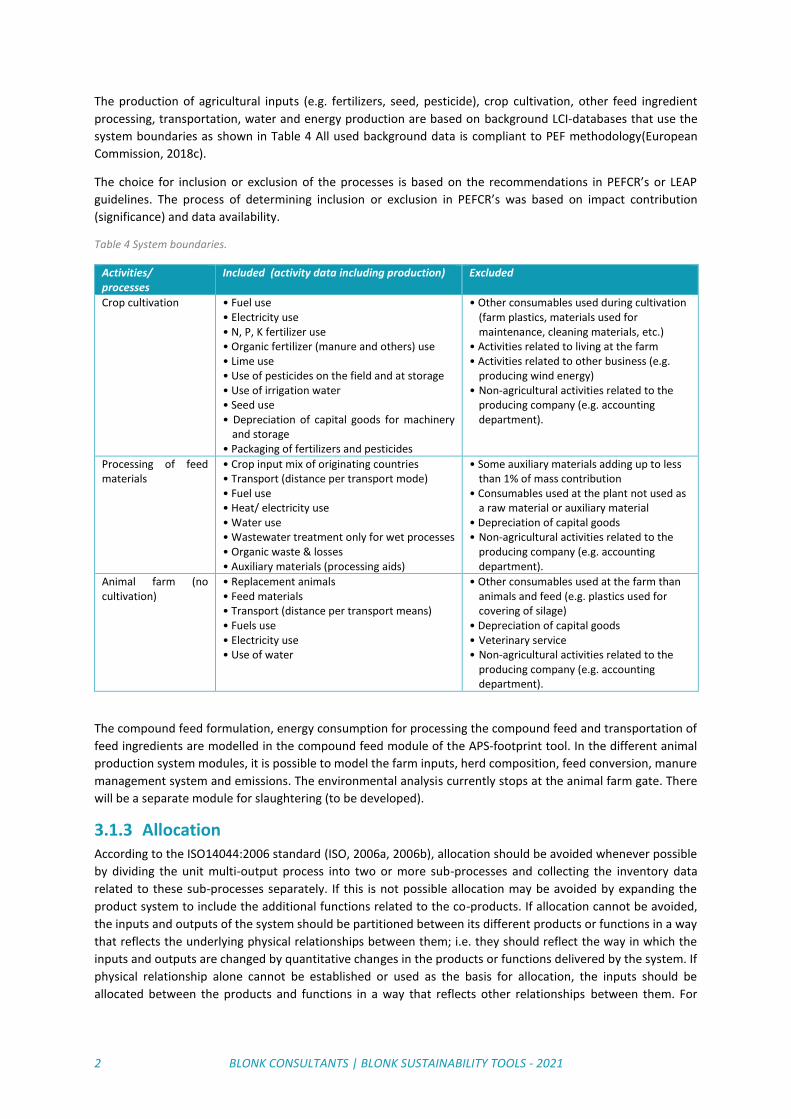
Table 4 System boundaries.
Activities/ processes
Included (activity data including production) Excluded
Crop cultivation • Fuel use • Electricity use • N, P, K fertilizer use • Organic fertilizer (manure and others) use • Lime use • Use of pesticides on the field and at storage • Use of irrigation water • Seed use • Depreciation of capital goods for machinery
and storage • Packaging of fertilizers and pesticides
• Other consumables used during cultivation (farm plastics, materials used for maintenance, cleaning materials, etc.)
• Activities related to living at the farm • Activities related to other business (e.g.
producing wind energy) • Non-agricultural activities related to the
producing company (e.g. accounting department).
Processing of feed materials
• Crop input mix of originating countries • Transport (distance per transport mode) • Fuel use • Heat/ electricity use • Water use • Wastewater treatment only for wet processes • Organic waste & losses • Auxiliary materials (processing aids)
• Some auxiliary materials adding up to less than 1% of mass contribution
• Consumables used at the plant not used as a raw material or auxiliary material
• Depreciation of capital goods • Non-agricultural activities related to the
producing company (e.g. accounting department).
Animal farm (no cultivation)
• Replacement animals • Feed materials • Transport (distance per transport means) • Fuels use • Electricity use • Use of water
• Other consumables used at the farm than animals and feed (e.g. plastics used for covering of silage)
• Depreciation of capital goods • Veterinary service • Non-agricultural activities related to the
producing company (e.g. accounting department).
The compound feed formulation, energy consumption for processing the compound feed and transportation of
feed ingredients are modelled in the compound feed module of the APS-footprint tool. In the different animal
production system modules, it is possible to model the farm inputs, herd composition, feed conversion, manure
management system and emissions. The environmental analysis currently stops at the animal farm gate. There
will be a separate module for slaughtering (to be developed).
3.1.3 Allocation According to the ISO14044:2006 standard (ISO, 2006a, 2006b), allocation should be avoided whenever possible
by dividing the unit multi-output process into two or more sub-processes and collecting the inventory data
related to these sub-processes separately. If this is not possible allocation may be avoided by expanding the
product system to include the additional functions related to the co-products. If allocation cannot be avoided,
the inputs and outputs of the system should be partitioned between its different products or functions in a way
that reflects the underlying physical relationships between them; i.e. they should reflect the way in which the
inputs and outputs are changed by quantitative changes in the products or functions delivered by the system. If
physical relationship alone cannot be established or used as the basis for allocation, the inputs should be
allocated between the products and functions in a way that reflects other relationships between them. For
2 BLONK CONSULTANTS | BLONK SUSTAINABILITY TOOLS - 2021
example, input and output data might be allocated between co-products in proportion to the economic value of
the products or another property (e.g. (dry) mass or energy content).
Allocation is also a topic that is covered by many LCA-standard and guidelines. In the APS-footprint tool,
economic allocation is used as default allocation method for feed, following the PEFCR for feed for food
producing animals (European Commission, 2018a). In the LEAP feed guidelines, economic allocation is also set as
the default option, since allocation on physical characteristics would not capture easily the variable functionality
connected to the co-products produced by processing facilities (FAO, 2014). This is therefore applied in the
background database (Agri-footprint) and the on-development “on-farm cultivation” module. “Animal
production system” modules use allocations dependent on the guidance defined in the reference standard or
guideline used for the development of the APS method. Currently, all animal systems default APS methodologies
use economic allocation, with one exception (dairy APS), The price of the different co-products is multiplied by
their mass to establish the revenue of the output streams. These are used to determine the economic allocation
factors.
There is 1 exception to the use of economic allocation. The dairy module uses biophysical allocation, based on
the energy required for the co-products production. This allocation was developed by the International Dairy
Association (IDF, 2010) and was suggested by the dairy PEFCR (European Commission, 2018b), and is therefore
extensively used in the dairy sector.
Please note that both the poultry and pig modules default APS methods need to be updated to follow the
recommended biophysical allocation as defined by FAO (2016) and Technical Secretariat for the Red Meat Pilot
(2019).
3.1.4 Emission modelling and TIER levels The emission models are integrated into the APS-footprint tool. This means that emissions from enteric
fermentation, from manure handling in the stable, during on-farm manure storage and during pasture are
directly calculated by the tool. Emission of manure applied during cultivation are currently included in
background data used for feed production either for dry feed materials or roughage.
The basic emission models used in the APS-footprint tool are the IPCC guidelines (IPCC, 2006, 2019), the LEAP
guidelines (FAO, 2016) and the EMEP/EEA air pollutant emission inventory guidebook (European Environment
Agency, 2016). These guidelines provide calculation rules for calculating emissions using various TIER levels.
Depending on the LCA standard or guideline applied in APS-footprint, the TIER level implemented will vary. In
the documentation per animal module, the APS methods are explained, including a more detailed explanation
of the implemented emission models and TIER levels.
3.1.5 Impact categories With the APS-footprint tool, it will be possible to apply different impact assessment methods. Currently, only the
“EF 2.0 method (adapted)” method is used (Table 5). It identifies 16 different impact and differentiates impact
on climate change due to fossil emissions, biogenic emissions and land use and transformation.
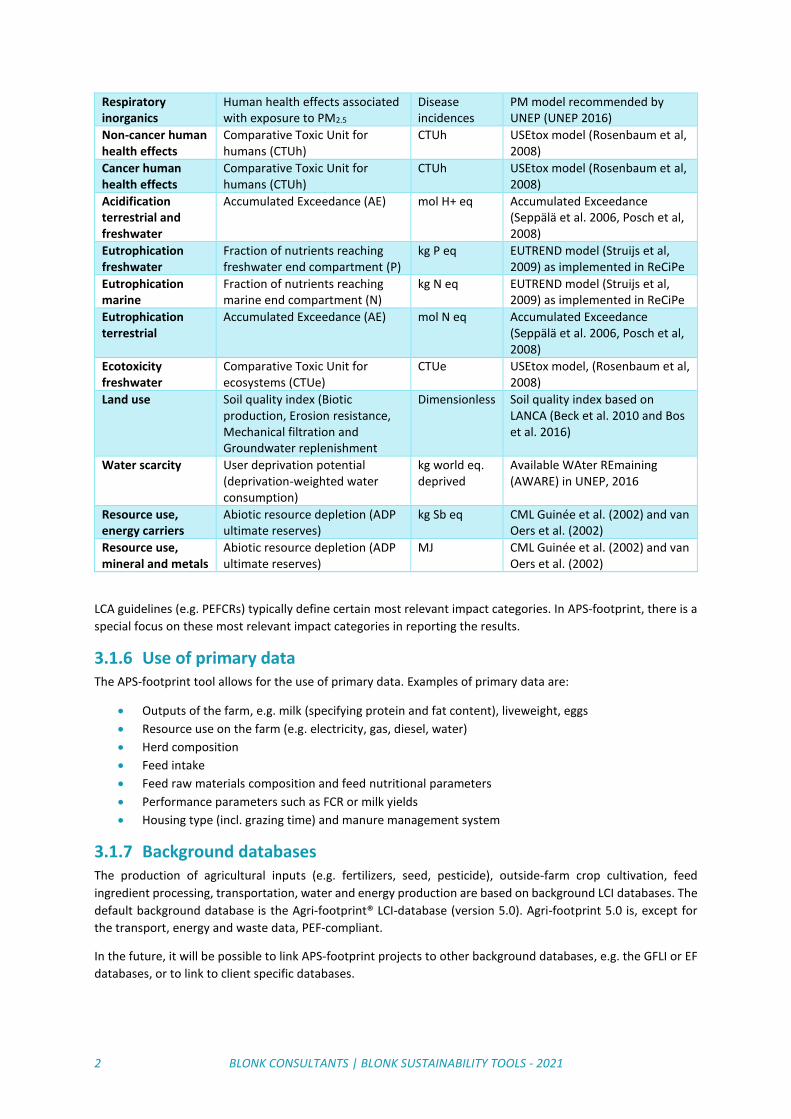
Table 5 Impact categories covered by the EF 2.0 LCIA method (Fazio et al., 2018).
Impact category Indicator Unit LCIA method
Climate change Radiative forcing as Global Warming Potential (GWP100)
kg CO2 eq Baseline model of 100 years of the IPCC (based on IPCC 2013)
Ozone depletion Ozone Depletion Potential (ODP) kg CFC-11eq Steady-state ODPs as in (WMO 1999)
Ionising radiation, Human Health
Human exposure efficiency relative to U235
kBq U235 Human health effect model as developed by Dreicer et al. 1995 (Frischknecht et al, 2000)
Photochemical ozone formation, Human Health
Tropospheric ozone concentration increase
kg NMVOC eq LOTOS-EUROS (Van Zelm et al, 2008) as applied in ReCiPe 2008
2 BLONK CONSULTANTS | BLONK SUSTAINABILITY TOOLS - 2021
Respiratory inorganics
Human health effects associated with exposure to PM2.5
Disease incidences
PM model recommended by UNEP (UNEP 2016)
Non-cancer human health effects
Comparative Toxic Unit for humans (CTUh)
CTUh USEtox model (Rosenbaum et al, 2008)
Cancer human health effects
Comparative Toxic Unit for humans (CTUh)
CTUh USEtox model (Rosenbaum et al, 2008)
Acidification terrestrial and freshwater
Accumulated Exceedance (AE) mol H+ eq Accumulated Exceedance (Seppälä et al. 2006, Posch et al, 2008)
Eutrophication freshwater
Fraction of nutrients reaching freshwater end compartment (P)
kg P eq EUTREND model (Struijs et al, 2009) as implemented in ReCiPe
Eutrophication marine
Fraction of nutrients reaching marine end compartment (N)
kg N eq EUTREND model (Struijs et al, 2009) as implemented in ReCiPe
Eutrophication terrestrial
Accumulated Exceedance (AE) mol N eq Accumulated Exceedance (Seppälä et al. 2006, Posch et al, 2008)
Ecotoxicity freshwater
Comparative Toxic Unit for ecosystems (CTUe)
CTUe USEtox model, (Rosenbaum et al, 2008)
Land use Soil quality index (Biotic production, Erosion resistance, Mechanical filtration and Groundwater replenishment
Dimensionless Soil quality index based on LANCA (Beck et al. 2010 and Bos et al. 2016)
Water scarcity User deprivation potential (deprivation-weighted water consumption)
kg world eq. deprived
Available WAter REmaining (AWARE) in UNEP, 2016
Resource use, energy carriers
Abiotic resource depletion (ADP ultimate reserves)
kg Sb eq CML Guinée et al. (2002) and van Oers et al. (2002)
Resource use, mineral and metals
Abiotic resource depletion (ADP ultimate reserves)
MJ CML Guinée et al. (2002) and van Oers et al. (2002)
LCA guidelines (e.g. PEFCRs) typically define certain most relevant impact categories. In APS-footprint, there is a
special focus on these most relevant impact categories in reporting the results.
3.1.6 Use of primary data The APS-footprint tool allows for the use of primary data. Examples of primary data are:
• Outputs of the farm, e.g. milk (specifying protein and fat content), liveweight, eggs
• Resource use on the farm (e.g. electricity, gas, diesel, water)
• Herd composition
• Feed intake
• Feed raw materials composition and feed nutritional parameters
• Performance parameters such as FCR or milk yields
• Housing type (incl. grazing time) and manure management system
3.1.7 Background databases The production of agricultural inputs (e.g. fertilizers, seed, pesticide), outside-farm crop cultivation, feed
ingredient processing, transportation, water and energy production are based on background LCI databases. The
default background database is the Agri-footprint® LCI-database (version 5.0). Agri-footprint 5.0 is, except for
the transport, energy and waste data, PEF-compliant.
In the future, it will be possible to link APS-footprint projects to other background databases, e.g. the GFLI or EF
databases, or to link to client specific databases.
1 BLONK CONSULTANTS | BLONK SUSTAINABILITY TOOLS - 2021
3.2 Data Quality Rating Methodology Currently, there is no DQR system or uncertainty analyses in place for the APS. Methodology is in development
for a system to qualify the data quality of sources used. In the future we want to update the tool functionality to
explore variability and uncertainty.
3.3 Limitations The LCA calculations in APS-footprint are based on an attributional modelling approach. This provides an
estimation of the effects of a farm-level intervention on environmental impacts. In case large scale interventions
are studied, other changes induced by the intervention should also be considered. Therefore, the APS tool does
not simulate the impact mitigation/changes that the chosen sector has on other sectors (not included in the
boundaries). This is especially relevant for changes that affect the use of co-products in feed, which are limited
on the market and for which supply is not driven by demand for feed. Other examples are: changes in co-product
amount, that could possibility influence other systems not included in the boundaries; changes in manure
amount or manure nutrient composition, possibly affecting cultivation outside the farm.
The APS-footprint is an attributional method with some extensions to explore the impact of changes of
interventions more completely. It is based on a mass balance approach, which makes it possible to identify the
consequences of changes in feed composition for emissions and manure composition. However, the tool does
not contain any predictive modelling of changes in herd composition or growth or animal product composition.
Therefore, to properly model an animal system and to predict complex interventions primary measured data
from trials would be needed, or alternatively a complex herd and animal metabolism model.
The prescribed land use change method for climate impact is retrospective rather than prospective. This means
that these carbon emissions should be considered carefully. Therefore, they are reported separately (consistent
with current guidelines and best practice). An important indicator of future land use change and related impacts
is the quantity (and location) of land occupation, which is now not visible in the tool.
No carbon storage and delayed emissions are included in the methodology, since the methodology on this topic
is still in development.
Lack of a Data Quality Rating (DQR) system, and lack of an uncertainty module are also limitations that will be
coped in future updates.

1 BLONK CONSULTANTS | BLONK SUSTAINABILITY TOOLS - 2021
4. References Blonk Consultants. (2020a). APS footprint methodology broiler and laying hens. Gouda, the Netherlands.
Blonk Consultants. (2020b). APS footprint methodology dairy. Gouda, the Netherlands.
Blonk Consultants. (2020c). APS footprint methodology for pig. Gouda, the Netherlands.
Blonk, H., van Passen, M., & Broekema, R. (2020). GFLI methodolgy v1 2020 draft 25 sep 2020.
Broekema, R., Tyszler, M., Veer, P. van ’t, Kok, F. J., Martin, A., Lluch, A., & T.J. Blonk. (2020). Future-proof and sustainable healthy diets based on current eating patterns in the Netherlands (under submission).
European Commission. (2017). PEFCR Guidance document, Guidance for the development of Product Environmental Footprint Category Rules (PEFCR’s), version 6.3. Brussels: European Commision.
European Commission. (2018a). PEFCR Feed for food producing animals. Brussels, Belgium. Retrieved from http://ec.europa.eu/environment/eussd/smgp/pdf/PEFCR_feed.pdf
European Commission. (2018b). Product Environmental Footprint Category Rules for Dairy Products, 168. Retrieved from http://ec.europa.eu/environment/eussd/smgp/pdf/PEFCR-DairyProducts_2018-04-25_V1.pdf
European Commission. (2018c). Product Environmental Footprint Category Rules Guidance. PEFCR Guidance document, - Guidance for the development of Product Environmental Footprint Category Rules (PEFCRs), version 6.3, December 2017. Retrieved from https://ec.europa.eu/environment/eussd/smgp/pdf/PEFCR_guidance_v6.3.pdf
European Environment Agency. (2016). EMEP/EEA Air Pollutant Emission Inventory Guidebook 2016 Technical guidance to prepare national emission inventories.
FABLE Consortium. (2019). Pathways to Sustainable Land-Use and Food Systems, 330. Retrieved from file:///W:/Projecten lopend/Danone Optimeal/2. werkdocumenten/Phase 2/2019+FABLE+Report_Full_Low+Resolution.pdf
FAO. (2014). Environmental performance of animal feeds supply chains - draft.
FAO. (2016). Greenhouse gas emissions and fossil energy use from poultry supply chains: Guidelines for assessment. (L. E. A. and P. Partnership., Ed.) (Version 1). Rome, Italy.
FAO. (2018). Nutrient ows and associated environmental impacts in livestock supply chains. Retrieved from http://www.fao.org/partnerships/leap/publications/en/
FAO. (2019). Environmental performance of feed additives in livestock supply chains – Guidelines for assessment (Draft for public review). Rome, Italy.
FAO LEAP. (2016a). Environmental Performance of Large Ruminant Supply Chains : Guidelines for quantification.
FAO LEAP. (2016b). Environmental performance of pig supply chains - Draft for public review. Retrieved from http://www.fao.org/3/a-bl094e.pdf
Fazio, S., Biganzioli, F., De Laurentiis, V., Zampori, L., Sala, S., & Diaconu, E. (2018). Supporting information to the characterisation factors of recommended EF Life Cycle Impact Assessment methods. Ispra, Italy. https://doi.org/10.2760/002447
IDF. (2010). The IDF guide to standard LCA methodology for the dairy sector. Bulletin of the International Dairy Federation, 445, 1–40.
IPCC. (2006). IPCC Guidelines for National Greenhouse Gas Inventories. Retrieved from http://www.ipcc-nggip.iges.or.jp/public/2006gl/index.html
IPCC. (2019). Refinement to the 2006 IPCC Guidelines for National Greenhouse Gas Inventories. Introduction (Vol. 4 Chp. 1). https://doi.org/10.1016/S0166-526X(00)80011-2
2 BLONK CONSULTANTS | BLONK SUSTAINABILITY TOOLS - 2021
ISO. (2006a). ISO 14040 Environmental management — Life cycle assessment — Principles and framework.
ISO. (2006b). ISO 14044 - Environmental management — Life cycle assessment — Requirements and guidelines. ISO.
JRC-IES, & European Commision. (2010). ILCD handbook - Specific guide for Life Cycle Inventory data sets. https://doi.org/10.2788/39726
Lagerwerf, L. A., Bannink, A., Bruggen van, C., Groenestein, C. M., Huijsmans, J. F. M., Kolk van der, J. W. H., … Vonk, J. (2019). Methodology for estimating emissions from agriculture in the Netherlands.
Technical Secretariat for the Red Meat Pilot. (2019). Footprint Category Rules Red Meat, version 1.0. Retrieved from http://www.uecbv.eu/UECBV/documents/FootprintCategoryRulesRedMeat16661.pdf
Van Paassen, M., Braconi, N., Kuling, L., Durlinger, B., & Gual, P. (2019). Agri-footprint 5.0 - Part 1: Methodology and Basic Principles. Gouda, the Netherlands. Retrieved from https://www.agri-footprint.com/wp-content/uploads/2019/11/Agri-Footprint-5.0-Part-1-Methodology-and-basic-principles-17-7-2019.pdf
4-1 BLONK CONSULTANTS | BLONK SUSTAINABILITY TOOLS - 2021
Blonk Consultants | Blonk Sustainability Tools (+31) 0182 579970
Groen van Prinsterersingel 45 www.blonkconsultants.nl
2805 TD Gouda [email protected]
Blonk Consultants helps companies, governments and civil society organisations put sustainability into practice. Our team of dedicated consultants works closely with our clients to deliver clear and practical advice based on sound, independent research. To ensure optimal outcomes we take an integrated approach that encompasses the whole production chain.