aps statistical bulletin 2015-16 web viewthe bulletin is a valuable resource for agencies to assist...
TRANSCRIPT

1

© Commonwealth of Australia 2016All material produced by the Australian Public Service Commission (the Commission) constitutes Commonwealth copyright administered by the Commission. The Commission reserves the right to set out the terms and conditions for the use of such material.
Apart from any use as permitted under the Copyright Act 1968 and those explicitly granted below, all other rights are reserved.
Unless otherwise noted, all material in this publication, except the Commission logo or badge, the Commonwealth Coat of Arms, and any material protected by a trade mark, is licensed under a Creative Commons BY Attribution 3.0 Australia licence.
Details of the licence are available at http://creativecommons.org/licenses/by/3.0/au/
Attributing Commission worksUse of Commission material licensed under a Creative Commons BY Attribution 3.0 Australia licence requires you to attribute the work in the manner specified by the Commission (but not in any way that suggests that the Commission endorses you or your use of the work). Almost any form of words is fine provided that you:
• provide a reference to the publication and, where practical, the relevant pages
• make clear whether or not you have changed Commission content
• make clear what permission you are relying on, by including a reference to this page or to a human-readable summary of the Creative Commons BY Attribution 3.0 Australia licence
• do not suggest that the Commission endorses you or your use of our content.
For example, if you have not changed Commission content in any way, you might state: ‘Sourced from the Australian Public Service Commission publication Statistical Bulletin 2015–16. This material is licensed for reuse under a Creative Commons BY Attribution 3.0 Australia licence.’
If you have made changes to Commission content, it would be more accurate to describe it as ‘based on Australian Public Service Commission content’ instead of ‘sourced from the Australian Public Service Commission’.
EnquiriesFor enquiries concerning reproduction and rights in Commission products and services, please contact [email protected].
ISBN 978-0-9953806-0-8

Foreword
The Australian Public Service Statistical Bulletin 2015–16 presents a summary of employment under the Public Service Act 1999 at 30 June 2016 and for the preceding financial year. The Bulletin also includes summary data for the past 15 years. The Bulletin is a valuable resource for agencies to assist them with workforce planning, in benchmarking their workforces against other agencies and against APS averages.
The data source for the Bulletin is the APS Employment Database. Employee data is provided by APS agencies and sourced from their HR information systems.
The Bulletin serves as a public record for the annual snapshot of APS employment.
John Lloyd PSMAustralian Public Service Commissioner
September 2016
i

Contents
Foreword..................................................................................i
Introduction............................................................................1
Source of data..................................................................................1
About the data.................................................................................1
The APSED Internet Interface (APSEDii)............................................2APSED Services................................................................................2
Main features..........................................................................3
APS at a glance................................................................................3
Coverage changes............................................................................3
Size of agencies................................................................................4
Section 1: All employees.........................................................5
Classification structures...................................................................5
Employment of men and women.....................................................6
APS workforce age profile.................................................................7
Location............................................................................................9
Table 1: All employees: sex by employment category, 30 June 2002 to 30 June 2016 10Table 2: Ongoing employees: agency by employment status, sex and employment category, 30 June 2016 11Table 2: Non-ongoing employees: agency by employment status, sex and employment category, 30 June 2016 13Table 2: All employees: agency by employment status, sex and employment category, 30 June 2016 15Table 3: Ongoing employees: agency by base classification and employment category, 30 June 2016 17Table 3: Non-ongoing employees: agency by base classification and employment category, 30 June 2016 19Table 3: All employees: agency by base classification and employment category,
30 June 2016.......................................................................21ii

Table 4: All employees: age group by base classification and employment category, 30 June 2016 23Table 5: All employees: location by base classification and employment category,
30 June 2016.......................................................................24Table 6: Agency metrics, 30 June 2016 and 2015-16.....................25Section 2: Non-ongoing employees......................................27
Non-ongoing employment type......................................................27
Non-ongoing age profile.................................................................28
Non-ongoing classification profile...................................................28
Table 7: Non-ongoing employees: employment status by base classification and sex, 30 June 2016 30Table 8: Non-ongoing employees: agency by non-ongoing category and sex,
30 June 2016.......................................................................31Table 9: Non-ongoing employees: age group by base classification and sex,
30 June 2016.......................................................................34Section 3: Ongoing employees.............................................35
Classification profile.......................................................................35
Temporary assignment...................................................................35
Educational qualifications...............................................................35
Length of service............................................................................36
Length at level...............................................................................36
Table 10: Ongoing employees: base classification by sex, 30 June 2002 to 30 June 2016.......................................................................37
Table 11: Ongoing employees: paid classification by sex, 30 June 2007 to 30 June 2016.......................................................................38
Table 12: Ongoing employees: length of service by sex, 30 June 2002 to 30 June 2016.......................................................................39
iii

Table 13: Ongoing employees: age group by sex, 30 June 2002 to 30 June 2016 40Table 14: Ongoing employees: agency by base classification group,
30 June 2015 and 2016.......................................................41Table 15: Ongoing employees: agency retention, 30 June 2015 to 30 June 2016 43Table 16: Ongoing employees: agency by age group, 30 June 201645Table 17: Ongoing employees: agency by location, 30 June 2016. 47Table 18: Ongoing employees: agency by paid classification, 30 June 2016 49Table 19: Ongoing employees: agency by temporary assignment classification,
30 June 2016.......................................................................51Table 20: Ongoing employees: agency by operative status (including maternity related leave) and sex, 30 June 2016 53Table 21: Ongoing employees: agency by highest educational qualification,
30 June 2016.......................................................................55Table 22: Ongoing employees: agency by number of agencies worked in and base classification group, 30 June 2016 57Table 23: Ongoing employees: agency by median length of service (years) and base classification, 30 June 2016 59Table 24: Ongoing employees: age group by base classification and sex,
30 June 2016.......................................................................61Table 25: Ongoing employees: highest educational qualification by base classification and sex, 30 June 2016 62Table 26: Ongoing employees: base classification by paid classification and sex,
30 June 2016.......................................................................63Table 27: Ongoing employees: location by base classification and sex, 30 June 2016 64Table 28: Ongoing employees: mean age (years) by location, base classification and sex, 30 June 2016 65Table 29: Ongoing employees: median length of service (years) by location, base classification and sex, 30 June 2016 66Section 4: Movements of ongoing employees......................67
Engagements.................................................................................67
Separations....................................................................................68iv

Mobility within the APS...................................................................69
Table 30: Engagements of ongoing employees: age group by sex, 2001-02 to 2015-16..............................................................................70
Table 31: Engagements of ongoing employees: classification by sex, 2001-02 to 2015-16 71Table 32: Engagements of ongoing employees: agency by major classification group, 2014-15 and 2015-1672Table 33: Engagements of ongoing employees: age group by classification and sex, 2015-16 74Table 34: Engagements of ongoing employees: prior service in APS by classification and sex, 2015-16 75Table 35: Engagements of ongoing employees: highest educational qualification by classification and sex, 2015-16 76Table 36: Engagements of ongoing employees: previous employment by classification and sex, 2015-16 77Table 37: Engagements of ongoing employees: location by classification and sex, 2015-16 78Table 38: Engagements of ongoing employees: mean age (years) by location, classification and sex, 2015-16 79Table 39: Promotions of ongoing employees: classification promoted from and to by sex, 2015-16 80Table 40: Promotions of ongoing employees: mean age (years) by location, classification and sex, 2015-16 81Table 41: Promotions of ongoing employees: agency by classification, 2015-16 82Table 42: Promotions of ongoing employees: within, from and to other agencies, 2015-16 84Table 43: Transfers of ongoing employees: from and to other agencies, 2015-16 86Table 44: Movement of ongoing employees: location from and to by sex,
2015-16..............................................................................88Table 45: Separations of ongoing employees: type of separation by sex, 2001-02 to 2015-16 89Table 46: Separations of ongoing employees: base classification by sex, 2001-02 to 2015-16 90Table 47: Separations of ongoing employees: age group by sex, 2001-02 to 2015-16 91Table 48: Separations of ongoing employees: resignations by age group and sex, 2001-02 and 2015-16 92Table 49: Separations of ongoing employees: age retirements by age group and sex, 2001-02 and 2015-16 93Table 50: Separations of ongoing employees: retrenchments by age group and sex, 2001-02 to 2015-16 94
v

Table 51: Separations of ongoing employees: separation type by base classification and sex, 2015-16 95Table 52: Separations of ongoing employees: agency by type of separation, 2014-15 and 2015-16 96Table 53: Separations of ongoing employees: agency by type of termination, 2015-16 98Table 54: Separations of ongoing employees: agency by base classification, 2015-16 100Table 55: Separations of ongoing employees: length of service by base classification and sex, 2015-16 102Table 56: Separations of ongoing employees: length of service by type of separation and sex, 2015-16 103Section 5: Diversity.............................................................104
Table 57: Ongoing employees: diversity group, 30 June 2002 to 30 June 2016 105Table 58: Ongoing employees: agency by diversity group, 30 June 2016 106Table 58: Non-ongoing employees: agency by diversity group, 30 June 2016 108Table 58: All employees: agency by diversity group, 30 June 2016110Table 59: Ongoing employees: base classification by diversity group and sex,
30 June 2016.....................................................................112Table 60: Ongoing employees: diversity group by highest educational qualification and sex, 30 June 2016 113Table 61: Engagements of ongoing employees: classification by diversity group and sex, 2015-16 114Table 62: Separations of ongoing employees: base classification by diversity group and sex, 2015-16 115Appendix 1: Explanatory notes...........................................116
Appendix 2: Agency abbreviations......................................119
Appendix 3: Public Service Act coverage changes.............120
Appendix 4: Machinery of Government changes................121
Appendix 5: Organisations not separately identified in tables122
vi

vii

Introduction
The Australian Public Service Statistical Bulletin is a statistical overview of Australian Public Service (APS) employment produced on a financial year basis. It is part of the State of the Service series. It provides details of those employed under the authority of the Public Service Act 1999 (the PS Act). Employees in Commonwealth-owned companies, statutory authorities, the Australian Defence Force and government business enterprises who are not employed under the PS Act are not included. State and local government employees are also not included.
Source of dataThe data source for the Bulletin is the APS Employment Database (APSED).
APSED records information for both ongoing and non-ongoing employees, including employees on leave without pay. Agencies provide data from their human resources information systems to the Commission about employee movements such as engagements, promotions and separations, as well as a ‘snapshot’ for all employees at 30 June and 31 December each year. This information is used to verify and, where necessary, update APSED data. Although the Commission has tried to ensure data integrity and has undertaken an extensive audit of data provided by agencies, it is not responsible for inaccuracies in the data supplied.
About the dataA headcount approach underpins the Bulletin—that is, people working part-time are aggregated with people working full-time without weighting.
Time series data reflects the APS as it was at a particular point in time. When comparing trends over time, the data may vary due to coverage changes within the PS Act. See Appendix 3 and 4 for further details on PS Act coverage changes and machinery of government changes.
Due to differences in data definitions and reporting requirements, there may be variations between data in this publication and that published by individual agencies.
Where proportions are presented, results have been rounded to the first decimal place. Due to this rounding, the percentage results for some tables may not add exactly to the total shown.
Data includes inoperative employees, unless indicated.
This Bulletin includes data about base or substantive classification, as well as temporary assignment and paid classification. Tables are clearly marked to show which classification is used.
1

Each year, extensive audits and error checking of APSED are undertaken, and errors in the historical data are corrected. The following points should be taken into consideration when making comparisons between data in this publication and data previously published.
Previously published data for both ongoing and non-ongoing employees may have been revised and therefore may not necessarily be comparable with that in previous years’ publications.
Diversity data published by the Commission may differ from that published by some agencies. In 2001, an independent review was undertaken of the Commission’s then current practice of retrospectively changing a person’s diversity status if it changed during their employment. The review supported the continuation of the practice for reporting for non-English speaking background (NESB) and Indigenous status as these characteristics are likely to be constant throughout an employee’s career. Disability, however, may change over time and APSED has been modified to record the status change for an individual and the date that change was loaded into APSED.
The provision of some diversity data by APS employees to their agency is voluntary. Therefore, as with any large voluntary data collection, APSED tends to under-represent the number of Indigenous Australians, people with a disability and NESB employees.
This report is based on data as at 30 June 2016. Since that date, there have been Machinery of Government movements; these are not reflected in this Bulletin because they occurred after 30 June 2016. They will be reported in the 2016–17 Bulletin.
The APSED Internet Interface (APSEDii)APSEDii is a series of dashboards that allow public access to data collected by APSED. Additional data collected by the APSC will also be made available in APSEDii. The dashboards provide the ability to manipulate and drill down into the data. There are two types of access—a limited version that allows general public access and a restricted version that requires a login. The restricted version is more extensive and provides additional features to assist with workforce planning and the ability to make comparisons between agencies. The limited access version is generally available only to APS employees for HR and workforce planning purposes.
Links to the dashboards and information about APSEDii can be found at http://www.apsc.gov.au/about-the-apsc/commission-services/apsed/apsedii
APSED ServicesEnquiries or suggestions about this Bulletin, or the analyses and other services we provide, are welcome and should be directed to: [email protected]
HTML and PDF versions of the Bulletin are available from the Commission website at http://www.apsc.gov.au/about-the-apsc/parliamentary/aps-statistical-bulletin
Production teamWorkforce Information and Planning Director: Pete Mitchell
APSED Manager: David Judge
APSED Maintenance: Ray Maher, Damien Woods, Sarah McNamara, Christopher Giuliano, Gareth Thomas, Andrew Burns.
2

Bulletin Production: Sarah McNamara, Damien Woods, David Judge, Mark Henry.
3

Main features
APS at a glance At 30 June 2016 there were 155,771 employees in the APS. This represented an increase of 3,518 or 2.3% from the June 2015 number of 152,253. The total at 30 June 2016 comprised:
137,848 ongoing employees—up by 1.0% from 136,524 at June 2015
17,923 non-ongoing employees—up by 13.9% from 15,729 at June 2015.
During 2015–16:
11,005 ongoing employees were engaged—up by 362.4% from 2,380 in 2014–15, including 727 employees who moved into coverage of the PS Act
9,759 ongoing employees separated—down by 8.5% from 10,662 in 2014–15, including 299 employees who moved out of coverage of the PS Act.
Coverage changesIt is necessary to adjust for changes in coverage when comparing data with previous years’ data and calculating changes for the APS. Refer to Appendix 3 for the number of employees who moved into or out of coverage of the PS Act over the past 15 years.
During 2015–16:
Agencies established:
The Digital Transformation Office in July 2015.
Agencies merged:
PHIO into the Commonwealth Ombudsman in July 2015
4

MRT–RRT into the Administrative Appeals Tribunal in July 2015 TUSMA into the Department of Communications and the Arts in
July 2015 Customs into the Department of Immigration and Border
Protection in July 2015 Australian Institute of Criminology into the Australian Crime
Commission in October 2015
PS Act coverage changes include:
647 ongoing employees from Australian Government Solicitor moved into the Attorney General’s Department
80 ongoing employees from the NSW and QLD State Government moved into the National Disability Insurance Agency
299 ongoing employees moved out of coverage, from ComSuper into the Commonwealth Superannuation Corporation.
5

Size of agenciesThe number of ongoing employees increased from 136,524 at June 2015 to 137,848 at June 2016, an increase of 1,324 or 1.0%.
The largest increases in ongoing employee numbers were in:
Immigration and Border Protection—5,776 or 74.7% Health—1,379 or 42.1% Human Services—537 or 1.7%
The largest decreases in ongoing employee numbers were in:
Defence—1,408 or 7.1% Social Services—1,402 or 38.6% Australian Taxation Office—682 or 3.7%
The number of non-ongoing employees increased by 13.9%, from 15,729 at June 2015 to 17,923 at June 2016. Non-ongoing employees accounted for 11.5% of all employees at June 2016.
The largest increases in non-ongoing employee numbers were in:
Human Services—1,176 or 31.2% Australian Electoral Commission—590 or 73.8% Australian Bureau of Statistics—528 or 156.2%
The largest decreases in the number of non-ongoing employees were in:
Australian Taxation Office—181 or 6.1% Attorney-General’s —122 or 25.2%
Defence Housing Australia—114 or 58.5%
The 10 agencies listed in Table A accounted for almost three-quarters of all APS employees at June 2016. Human Services, the Australian Taxation Office and Defence account for almost half, or 48.5%, of all APS employees.Table A: All employees: 10 largest agencies, June 2016 Source: Table 3
Agency No. of employees at June 2016 % of total APS
Human Services 36,571 23.5
Australian Taxation Office 20,384 13.1
Defence 18,567 11.9
Immigration and Border Protection 14,271 9.2
Health 5,075 3.3
Agriculture and Water Resources 5,034 3.2
Industry, Innovation and Science 4,716 3.0
Foreign Affairs and Trade 3,813 2.4
Australian Bureau of Statistics 3,571 2.3
Environment 2,452 1.6
Total 114,454 73.5
6

Section 1: All employees
This section provides data about ongoing and non-ongoing employees. It shows the population of the APS over the past 15 years, and a profile of the June 2016 population. Definitions for both ‘ongoing’ and ‘non-ongoing’ employees are provided in Appendix 1.
Classification structures To allow comparisons over time, this analysis has used substantive or base classification, excluding employees on temporary assignment at a classification different to their base classification. Temporary assignment is discussed in detail in Section 3: Ongoing employees.
Table B compares all employee numbers by base classification at June 2002, 2015 and 2016. The classifications with a decrease from 2015 to 2016 were: APS 1, with a decrease of 416 employees, or 9.6%, EL 1 with a decrease of 366 employees, or 1.4%, and EL 2 with a decrease of 38 employees, or 0.3%. The classification with the greatest percentage increase from 2015 to 2016 was Trainee, with an increase of 140.4%, representing 299 employees. The agencies with the largest increase in Trainee employees were Immigration and Border Protection and Human Services.
Table B: All employees: Base classification, June 2002, 2015 and 2016 Source: APSED
Classification2002 2015 2016 % change
2002 to 2016
% change 2015 to
2016N % N % N %
Trainee 494 0.4 213 0.1 512 0.3 3.6 140.4
Graduate 788 0.6 1,197 0.8 1,267 0.8 60.8 5.8
APS 1 4,156 3.4 4,346 2.9 3,930 2.5 -5.4 -9.6
APS 2 10,096 8.2 4,686 3.1 5,122 3.3 -49.3 9.3
APS 3 16,807 13.6 19,411 12.7 21,037 13.5 25.2 8.4
APS 4 30,372 24.6 30,634 20.1 30,679 19.7 1.0 0.1
APS 5 13,894 11.3 20,677 13.6 20,936 13.4 50.7 1.3
APS 6 22,775 18.5 31,211 20.5 32,648 21 43.4 4.6
EL 1 14,028 11.4 25,884 17 25,518 16.4 81.9 -1.4
EL 2 8,178 6.6 11,518 7.6 11,480 7.4 40.4 -0.3
SES 1 1,241 1 1,828 1.2 1,972 1.3 58.9 7.9
SES 2 365 0.3 528 0.3 541 0.3 48.2 2.5
SES 3 94 0.1 120 0.1 129 0.1 37.2 7.5
Total 123,288 100 152,253 100 155,771 100 26.3 2.3
7

Over the past 15 years, the classification profile of the APS has seen a consistent and strong shift. There has been a decline in the proportion of employees at the APS 1–2 and the APS 3–4 classifications, by 5.8 and 5.1 percentage points respectively. There were increases in the proportion of employees at the APS 5–6 classifications, up by 4.7 percentage points, and the EL classifications, up by 5.8 percentage points. As a proportion of all employees, the SES increased from 1.4% at June 2002 to 1.7% at June 2016. These shifts in proportions are shown in Figure 2 below.
This trend towards a higher classification profile at least partly reflects the changing nature of APS employment, with a more skilled workforce undertaking increasingly more complex and difficult roles.
Employment of men and women Women accounted for the majority of APS employees, with a representation of 58.4% of ongoing employees and 59.0% of all employees. This is an increase from the ongoing representation of 57.9%, and a total representation of 58.4% last year. The number of women in the APS increased by 3.3%, from 88,979 at June 2015 to 91,947 at June 2016, and the number of men increased by 0.9%, from 63,274 at June 2015 to 63,824 at June 2016.
8

The representation of men and women varies considerably amongst agencies. Of agencies with at least 1,000 employees, the agencies with the highest proportion of women were the National Disability Insurance Agency with 74.6%, followed by Human Services, with women representing 71.6% of ongoing employees. Large agencies with the highest proportion of men were the Bureau of Meteorology with 69.6%, and Defence, with men representing 58.9% of ongoing employees.
9

Over the past 15 years, the representation of women in the APS has increased from 52.8% to 59.0% of all employees. In general, more women are still employed at lower classifications than men. Figure 4 shows the highest concentration of women is at the APS 4 and the APS 6 classifications, with 23.1% and 20.0% of women at these classifications respectively. For men, the highest concentration is at the APS 6 and EL 1 classifications, with 22.4% and 19.7% of men at these classifications respectively. The proportion of women at the EL 2 classification is 5.5%, which is around half that of men with 10.1% at the EL 2 classification; this trend continues throughout the SES classifications.
APS workforce age profile At June 2016 the largest age group was employees aged 50 to 54 years, representing 14.2% of all employees. This is a decrease from 14.7% at June 2015. The largest increase from June 2015 to June 2016 was the 20 to 24 age group, increasing from 3.4% to 3.8% of all employees. This was followed by an increase in the 55 to 59 and 60 years and over age groups—both groups increased by 0.3%. At June 2016, the mean age of all employees in the APS was 43.0 years. For men the mean age was 44.0 years and for women it was 42.4 years.
Figure 5 shows the mean age of all employees for selected classifications, by sex, at June 2016. In general, mean age increases with classification. The mean age for men is higher than that for women for most classifications, except at the APS 1 classification where the mean age of women is higher, and the APS 3 and APS 4 classifications where the mean age is equal.
10

Agency age profiles vary substantially. Of the agencies with at least 1,000 employees at June 2016, the Australian Electoral Commission and Veterans’ Affairs had the oldest age profiles, with 68.5% and 58.7% aged 45 years and over, respectively. In contrast, the Attorney-General’s Department and Treasury had the lowest proportion of employees 45 years of age and over, with 28.4% and 30.9%, respectively.
Representation of employees less than 25 years of age has increased this year after a consistent and steady downward trend. At June 2016, 4.2% of all employees were in this age group, up from 3.7% last year. This is the first increase that has occurred in this cohort since June 2007, where this age group accounted for 6.2% of all employees.
The proportion of employees 50 years of age and over has grown significantly over time, increasing from 20.8% of all employees at June 2002 to 31.8% at June 2016. This growth reflects the impact of government policies that encourage older employees to remain in the workforce or to return after taking early retirement. It also reflects the removal from the PS Act of compulsory age-65 retirement in 1999. These initiatives have facilitated increased recruitment of older employees and reduced their separation rates.
Figure 6 shows the shifting age profile of the APS, with an increased representation of older employees coinciding with a decrease in younger employees. This figure shows that the 55-59 years age group has increased by 4.7 percentage points, and the 60 years and over age group has increased by 5.2 percentage points since June 2002. In this same period the 25 to 29 years age group decreased by 2.8 percentage points.
11

Figure 7 shows the APS has a more middle-aged age profile than the Australian labour force.
Location At June 2016 the location with the highest proportion of APS employees was the Australian Capital Territory (ACT), with 37.2% of all employees. Generally, the proportion of employees located in the ACT increases at higher classifications. For example, at June 2016, 59.9% of all EL employees and 72.9% of all SES employees were in the ACT, compared with 16.7% of APS 1–2 employees and 15.7% of APS 3–4 employees. The majority of the APS is located outside the ACT.
There is considerable variation amongst agencies in the proportion of employment inside and outside of the ACT. At June 2016, 21 out of 97 agencies had all of their employees located in the ACT, 14 agencies had no ACT employees and 27 agencies had less than one-third of their employees located in the ACT.
The large agencies with less than one-third of their employees in the ACT were:
Veterans’ Affairs–32.2% Australian Electoral Commission–16.5% Human Services–13.2% Australian Taxation Office–12.1% National Disability Insurance Agency–10.0% Bureau of Meteorology–5.5% Australian Securities and Investments Commission–0.7%.
12

Table C: All employees: Proportion by base classification and location, June 2016 Source: Table 5
Classification ACT NSW Vic Qld SA WA Tas NT O/S
% % % % % % % % %
Trainee & Graduate 64.0 7.5 10.7 7.2 3.8 3.4 0.8 2.4 0.1
APS 1-2 16.7 33.9 17.4 12.8 6.7 5.9 3.6 3.1 .
APS 3-4 15.7 26.6 21.6 16.1 7.2 7.1 4.0 1.7 0.1
APS 5-6 43.0 16.1 16.0 10.1 6.3 4.2 2.0 1.4 0.9
EL 59.9 11.1 12.3 6.0 4.5 2.3 1.1 0.7 2.1
SES 72.9 7.6 7.9 2.6 1.3 1.4 0.3 0.5 5.4
Total 37.2 19.2 16.9 11.1 6.1 4.7 2.5 1.4 0.9
13

Table 1: All employees: sex by employment category, 30 June 2002 to 30 June 2016
June
Sex 2002 2003 2004 2005 2006 2007 2008 2009 2010 2011 2012 2013 2014 2015 2016
Ongoing
Men 54008 56801 57305 56495 59457 62250 63060 63633 63963 64922 65422 64220 61242 57537 57329Women 58224 63475 65045 66874 75248 81284 84304 86185 86465 87798 88044 87173 83653 78987 80519Total ongoing 112232 120276 122350 123369 134705 143534 147364 149818 150428 152720 153466 151393 144895 136524 137848
Non-ongoing
Men 4166 4080 3385 3690 4185 4397 4432 4279 5123 5116 5386 5661 5003 5737 6495Women 6890 7275 5557 6325 7066 7156 7497 7173 8233 7633 8478 9085 8024 9992 11428Total non-ongoing 11056 11355 8942 10015 11251 11553 11929 11452 13356 12749 13864 14746 13027 15729 17923
Total
Men 58174 60881 60690 60185 63642 66647 67492 67912 69086 70038 70808 69881 66245 63274 63824Women 65114 70750 70602 73199 82314 88440 91801 93358 94698 95431 96522 96258 91677 88979 91947Total 123288 131631 131292 133384 145956 155087 159293 161270 163784 165469 167330 166139 157922 152253 155771Source: APSED
14

Table 2: Ongoing employees: agency by employment status, sex and employment category, 30 June 2016
Men Women Total
Agency Full-time Part-time Total Full-time Part-time Total Full-time Part-time TotalAgriculture and Water Resources 2015 204 2219 1598 607 2205 3613 811 4424- Australian Fisheries Management Authority 92 1 93 49 19 68 141 20 161- APVMA 64 3 67 95 14 109 159 17 176- Murray Darling Basin Authority 131 5 136 127 29 156 258 34 292Attorney-General's 519 22 541 825 274 1099 1344 296 1640- Administrative Appeals Tribunal 147 9 156 214 63 277 361 72 433- ACLEI 22 . 22 14 . 14 36 . 36- AUSTRAC 143 5 148 155 39 194 298 44 342- Australian Crime Commission 276 5 281 213 62 275 489 67 556- Australian Financial Security Authority 179 9 188 217 54 271 396 63 459- Australian Human Rights Commission 25 1 26 51 22 73 76 23 99- Australian Law Reform Commission . . . 7 3 10 7 3 10- Commonwealth DPP 113 6 119 212 61 273 325 67 392- CrimTrac Agency 102 5 107 96 21 117 198 26 224- Family Court and Federal Circuit Court 142 14 156 333 108 441 475 122 597- Federal Court of Australia 73 4 77 171 45 216 244 49 293- National Archives of Australia 127 14 141 158 57 215 285 71 356- OAIC 20 1 21 34 16 50 54 17 71- Office of Parliamentary Counsel 34 4 38 41 18 59 75 22 97Communications and the Arts 192 9 201 284 57 341 476 66 542- ACMA 199 1 200 165 63 228 364 64 428- Australian National Maritime Museum 39 4 43 41 10 51 80 14 94- National Film and Sound Archive 62 3 65 66 20 86 128 23 151- National Library of Australia 106 11 117 225 61 286 331 72 403- National Museum of Australia 49 15 64 93 50 143 142 65 207- National Portrait Gallery 11 . 11 24 8 32 35 8 43- Old Parliament House 15 7 22 32 7 39 47 14 61- Screen Australia 4 . 4 6 2 8 10 2 12Defence 10633 214 10847 6550 1059 7609 17183 1273 18456- Defence Housing Australia 186 4 190 313 41 354 499 45 544Education and Training 700 29 729 1012 296 1308 1712 325 2037- AIATSIS 53 3 56 59 6 65 112 9 121- Australian Research Council 33 . 33 67 15 82 100 15 115- Australian Skills Quality Authority 51 1 52 94 18 112 145 19 164- TEQSA 16 . 16 27 6 33 43 6 49Employment 803 39 842 813 234 1047 1616 273 1889- Asbestos Safety and Eradication Agency 6 . 6 1 . 1 7 . 7- Comcare 221 9 230 311 81 392 532 90 622- Fair Work Commission 82 4 86 138 28 166 220 32 252- OFWBII 68 1 69 48 14 62 116 15 131- Office of the Fair Work Ombudsman 251 19 270 327 163 490 578 182 760- Safe Work Australia 22 3 25 60 15 75 82 18 100- Workplace Gender Equality Agency 4 . 4 13 8 21 17 8 25Environment 790 65 855 833 294 1127 1623 359 1982- Bureau of Meteorology 975 37 1012 342 86 428 1317 123 1440- Clean Energy Regulator 152 10 162 139 29 168 291 39 330- Climate Change Authority 6 1 7 9 2 11 15 3 18- GBRMPA 66 2 68 103 18 121 169 20 189Finance 631 18 649 668 135 803 1299 153 1452- Australian Electoral Commission 257 5 262 537 39 576 794 44 838- Future Fund Management Agency 63 3 66 47 11 58 110 14 124Foreign Affairs and Trade 1510 59 1569 1823 303 2126 3333 362 3695- ACIAR 6 . 6 17 10 27 23 10 33- AUSTRADE 235 10 245 234 48 282 469 58 527Health 1349 85 1434 2419 799 3218 3768 884 4652
15

Men Women Total
Agency Full-time Part-time Total Full-time Part-time Total Full-time Part-time Total- Australian Aged Care Quality Agency 37 1 38 137 31 168 174 32 206- ACSQHC 20 . 20 49 13 62 69 13 82- Australian Institute of Health and Welfare 88 8 96 150 71 221 238 79 317- ARPANSA 72 . 72 45 9 54 117 9 126- Australian Sports Anti-Doping Authority 21 . 21 18 3 21 39 3 42- Cancer Australia 5 1 6 40 9 49 45 10 55- FSANZ 30 2 32 47 15 62 77 17 94- Independent Hospital Pricing Authority 16 . 16 20 4 24 36 4 40- National Blood Authority 17 . 17 28 6 34 45 6 51- NHMRC 52 6 58 106 27 133 158 33 191- National Health Funding Body 4 . 4 8 1 9 12 1 13- National Health Performance Authority 1 . 1 5 . 5 6 . 6- National Mental Health Commission 2 . 2 9 3 12 11 3 14- Organ and Tissue Authority 8 1 9 13 1 14 21 2 23- Professional Services Review 8 . 8 3 5 8 11 5 16Human Services 8362 624 8986 15187 7453 22640 23549 8077 31626Immigration and Border Protection 6044 195 6239 5761 1513 7274 11805 1708 13513Industry, Innovation and Science 2156 83 2239 1682 398 2080 3838 481 4319- NOPSEMA 66 . 66 35 8 43 101 8 109Infrastructure and Regional Development 554 20 574 476 95 571 1030 115 1145- Australian Transport Safety Bureau 66 1 67 24 3 27 90 4 94- National Capital Authority 18 1 19 21 7 28 39 8 47Prime Minister and Cabinet 650 37 687 1125 218 1343 1775 255 2030- Aboriginal Hostels Ltd. 58 16 74 108 29 137 166 45 211- ANAO 131 4 135 163 29 192 294 33 327- Australian Public Service Commission 49 2 51 116 30 146 165 32 197- Commonwealth Ombudsman 38 7 45 68 33 101 106 40 146- Digital Transformation Office 18 2 20 14 2 16 32 4 36- OIGIS 5 1 6 5 2 7 10 3 13- Office of National Assessments 73 5 78 43 10 53 116 15 131- Torres Strait Regional Authority 13 . 13 29 1 30 42 1 43Social Services 725 47 772 1097 360 1457 1822 407 2229- Australian Institute of Family Studies 9 . 9 18 16 34 27 16 43- National Disability Insurance Agency 276 10 286 661 166 827 937 176 1113Treasury 550 29 579 440 115 555 990 144 1134- Australian Bureau of Statistics 1181 89 1270 1093 342 1435 2274 431 2705- ACCC 353 23 376 323 111 434 676 134 810- ASIC 633 21 654 627 279 906 1260 300 1560- Australian Taxation Office 7490 227 7717 7928 1933 9861 15418 2160 17578- Productivity Commission 81 2 83 55 28 83 136 30 166Veterans' Affairs 694 22 716 943 192 1135 1637 214 1851- Australian War Memorial 109 6 115 114 16 130 223 22 245Total ongoing 54853 2476 57329 61384 19135 80519 116237 21611 137848Source: APSED
16

Table 2: Non-ongoing employees: agency by employment status, sex and employment category, 30 June 2016
Men Women Total
Agency Full-time Part-time Total Full-time Part-time Total Full-time Part-time TotalAgriculture and Water Resources 91 247 338 109 163 272 200 410 610- Australian Fisheries Management Authority 19 . 19 4 . 4 23 . 23- APVMA 7 . 7 6 1 7 13 1 14- Murray Darling Basin Authority 12 4 16 11 2 13 23 6 29Attorney-General's 98 18 116 212 35 247 310 53 363- Administrative Appeals Tribunal 30 11 41 42 25 67 72 36 108- ACLEI 4 5 9 2 1 3 6 6 12- AUSTRAC . . . 3 . 3 3 . 3- Australian Crime Commission 14 2 16 15 3 18 29 5 34- Australian Financial Security Authority 9 2 11 22 8 30 31 10 41- Australian Human Rights Commission 3 2 5 8 5 13 11 7 18- Australian Law Reform Commission . . . . . . . . .- Commonwealth DPP 7 1 8 24 . 24 31 1 32- CrimTrac Agency 3 . 3 3 . 3 6 . 6- Family Court and Federal Circuit Court 28 22 50 96 49 145 124 71 195- Federal Court of Australia 42 32 74 62 55 117 104 87 191- National Archives of Australia 16 11 27 34 24 58 50 35 85- OAIC 2 . 2 . 1 1 2 1 3- Office of Parliamentary Counsel . . . 3 1 4 3 1 4Communications and the Arts 6 8 14 23 7 30 29 15 44- ACMA 6 1 7 5 5 10 11 6 17- Australian National Maritime Museum 9 . 9 9 3 12 18 3 21- National Film and Sound Archive 9 8 17 10 21 31 19 29 48- National Library of Australia 6 15 21 6 26 32 12 41 53- National Museum of Australia 8 6 14 14 21 35 22 27 49- National Portrait Gallery 3 5 8 3 7 10 6 12 18- Old Parliament House 4 6 10 2 24 26 6 30 36- Screen Australia . . . . . . . . .Defence 68 14 82 26 3 29 94 17 111- Defence Housing Australia 24 3 27 52 2 54 76 5 81Education and Training 18 4 22 23 4 27 41 8 49- AIATSIS 18 2 20 18 11 29 36 13 49- Australian Research Council 2 . 2 7 . 7 9 . 9- Australian Skills Quality Authority 11 . 11 29 3 32 40 3 43- TEQSA 1 . 1 2 . 2 3 . 3Employment 38 11 49 45 18 63 83 29 112- Asbestos Safety and Eradication Agency 1 . 1 2 . 2 3 . 3- Comcare 20 1 21 41 5 46 61 6 67- Fair Work Commission 16 . 16 35 1 36 51 1 52- OFWBII 1 2 3 7 4 11 8 6 14- Office of the Fair Work Ombudsman 20 1 21 20 7 27 40 8 48- Safe Work Australia 1 . 1 3 2 5 4 2 6- Workplace Gender Equality Agency 1 . 1 3 2 5 4 2 6Environment 132 84 216 128 126 254 260 210 470- Bureau of Meteorology 125 24 149 57 21 78 182 45 227- Clean Energy Regulator 8 7 15 15 9 24 23 16 39- Climate Change Authority 1 . 1 3 2 5 4 2 6- GBRMPA 5 12 17 14 20 34 19 32 51Finance 7 277 284 6 64 70 13 341 354- Australian Electoral Commission 97 277 374 73 942 1015 170 1219 1389- Future Fund Management Agency 3 . 3 2 1 3 5 1 6Foreign Affairs and Trade 37 9 46 66 6 72 103 15 118- ACIAR 18 . 18 3 1 4 21 1 22- AUSTRADE 14 1 15 18 5 23 32 6 38Health 98 36 134 220 69 289 318 105 423
17

Men Women Total
Agency Full-time Part-time Total Full-time Part-time Total Full-time Part-time Total- Australian Aged Care Quality Agency 9 . 9 9 2 11 18 2 20- ACSQHC 1 4 5 7 9 16 8 13 21- Australian Institute of Health and Welfare 5 3 8 12 8 20 17 11 28- ARPANSA 3 2 5 6 6 12 9 8 17- Australian Sports Anti-Doping Authority 3 144 147 1 100 101 4 244 248- Cancer Australia 3 1 4 8 3 11 11 4 15- FSANZ 3 . 3 4 1 5 7 1 8- Independent Hospital Pricing Authority 5 1 6 9 1 10 14 2 16- National Blood Authority 1 1 2 2 1 3 3 2 5- NHMRC 5 4 9 16 2 18 21 6 27- National Health Funding Body 1 1 2 2 . 2 3 1 4- National Health Performance Authority . . . 1 . 1 1 . 1- National Mental Health Commission . . . . . . . . .- Organ and Tissue Authority 1 1 2 2 1 3 3 2 5- Professional Services Review 1 . 1 1 1 2 2 1 3Human Services 521 891 1412 1061 2472 3533 1582 3363 4945Immigration and Border Protection 148 154 302 262 194 456 410 348 758Industry, Innovation and Science 108 89 197 88 112 200 196 201 397- NOPSEMA 5 . 5 1 . 1 6 . 6Infrastructure and Regional Development 7 1 8 5 2 7 12 3 15- Australian Transport Safety Bureau 3 . 3 3 . 3 6 . 6- National Capital Authority 3 1 4 2 9 11 5 10 15Prime Minister and Cabinet 36 21 57 59 18 77 95 39 134- Aboriginal Hostels Ltd. 52 63 115 56 129 185 108 192 300- ANAO 1 5 6 5 4 9 6 9 15- Australian Public Service Commission 5 11 16 3 21 24 8 32 40- Commonwealth Ombudsman 8 3 11 9 3 12 17 6 23- Digital Transformation Office 18 . 18 14 2 16 32 2 34- OIGIS . . . . . . . . .- Office of National Assessments . 3 3 . 3 3 . 6 6- Torres Strait Regional Authority 63 2 65 36 4 40 99 6 105Social Services 43 4 47 69 17 86 112 21 133- Australian Institute of Family Studies 9 5 14 8 17 25 17 22 39- National Disability Insurance Agency 86 11 97 258 38 296 344 49 393Treasury 34 14 48 46 38 84 80 52 132- Australian Bureau of Statistics 302 128 430 274 162 436 576 290 866- ACCC 19 9 28 21 8 29 40 17 57- ASIC 78 3 81 98 30 128 176 33 209- Australian Taxation Office 257 606 863 342 1601 1943 599 2207 2806- Productivity Commission 2 1 3 3 . 3 5 1 6Veterans' Affairs 47 . 47 100 8 108 147 8 155- Australian War Memorial 18 2 20 33 4 37 51 6 57Total non-ongoing 3135 3360 6495 4582 6846 11428 7717 10206 17923Source: APSED
18

Table 2: All employees: agency by employment status, sex and employment category, 30 June 2016
Men Women Total
Agency Full-time Part-time Total Full-time Part-time Total Full-time Part-time TotalAgriculture and Water Resources 2106 451 2557 1707 770 2477 3813 1221 5034- Australian Fisheries Management Authority 111 1 112 53 19 72 164 20 184- APVMA 71 3 74 101 15 116 172 18 190- Murray Darling Basin Authority 143 9 152 138 31 169 281 40 321Attorney-General's 617 40 657 1037 309 1346 1654 349 2003- Administrative Appeals Tribunal 177 20 197 256 88 344 433 108 541- ACLEI 26 5 31 16 1 17 42 6 48- AUSTRAC 143 5 148 158 39 197 301 44 345- Australian Crime Commission 290 7 297 228 65 293 518 72 590- Australian Financial Security Authority 188 11 199 239 62 301 427 73 500- Australian Human Rights Commission 28 3 31 59 27 86 87 30 117- Australian Law Reform Commission . . . 7 3 10 7 3 10- Commonwealth DPP 120 7 127 236 61 297 356 68 424- CrimTrac Agency 105 5 110 99 21 120 204 26 230- Family Court and Federal Circuit Court 170 36 206 429 157 586 599 193 792- Federal Court of Australia 115 36 151 233 100 333 348 136 484- National Archives of Australia 143 25 168 192 81 273 335 106 441- OAIC 22 1 23 34 17 51 56 18 74- Office of Parliamentary Counsel 34 4 38 44 19 63 78 23 101Communications and the Arts 198 17 215 307 64 371 505 81 586- ACMA 205 2 207 170 68 238 375 70 445- Australian National Maritime Museum 48 4 52 50 13 63 98 17 115- National Film and Sound Archive 71 11 82 76 41 117 147 52 199- National Library of Australia 112 26 138 231 87 318 343 113 456- National Museum of Australia 57 21 78 107 71 178 164 92 256- National Portrait Gallery 14 5 19 27 15 42 41 20 61- Old Parliament House 19 13 32 34 31 65 53 44 97- Screen Australia 4 . 4 6 2 8 10 2 12Defence 10701 228 10929 6576 1062 7638 17277 1290 18567- Defence Housing Australia 210 7 217 365 43 408 575 50 625Education and Training 718 33 751 1035 300 1335 1753 333 2086- AIATSIS 71 5 76 77 17 94 148 22 170- Australian Research Council 35 . 35 74 15 89 109 15 124- Australian Skills Quality Authority 62 1 63 123 21 144 185 22 207- TEQSA 17 . 17 29 6 35 46 6 52Employment 841 50 891 858 252 1110 1699 302 2001- Asbestos Safety and Eradication Agency 7 . 7 3 . 3 10 . 10- Comcare 241 10 251 352 86 438 593 96 689- Fair Work Commission 98 4 102 173 29 202 271 33 304- OFWBII 69 3 72 55 18 73 124 21 145- Office of the Fair Work Ombudsman 271 20 291 347 170 517 618 190 808- Safe Work Australia 23 3 26 63 17 80 86 20 106- Workplace Gender Equality Agency 5 . 5 16 10 26 21 10 31Environment 922 149 1071 961 420 1381 1883 569 2452- Bureau of Meteorology 1100 61 1161 399 107 506 1499 168 1667- Clean Energy Regulator 160 17 177 154 38 192 314 55 369- Climate Change Authority 7 1 8 12 4 16 19 5 24- GBRMPA 71 14 85 117 38 155 188 52 240Finance 638 295 933 674 199 873 1312 494 1806- Australian Electoral Commission 354 282 636 610 981 1591 964 1263 2227- Future Fund Management Agency 66 3 69 49 12 61 115 15 130Foreign Affairs and Trade 1547 68 1615 1889 309 2198 3436 377 3813- ACIAR 24 . 24 20 11 31 44 11 55- AUSTRADE 249 11 260 252 53 305 501 64 565Health 1447 121 1568 2639 868 3507 4086 989 5075
19

Men Women Total
Agency Full-time Part-time Total Full-time Part-time Total Full-time Part-time Total- Australian Aged Care Quality Agency 46 1 47 146 33 179 192 34 226- ACSQHC 21 4 25 56 22 78 77 26 103- Australian Institute of Health and Welfare 93 11 104 162 79 241 255 90 345- ARPANSA 75 2 77 51 15 66 126 17 143- Australian Sports Anti-Doping Authority 24 144 168 19 103 122 43 247 290- Cancer Australia 8 2 10 48 12 60 56 14 70- FSANZ 33 2 35 51 16 67 84 18 102- Independent Hospital Pricing Authority 21 1 22 29 5 34 50 6 56- National Blood Authority 18 1 19 30 7 37 48 8 56- NHMRC 57 10 67 122 29 151 179 39 218- National Health Funding Body 5 1 6 10 1 11 15 2 17- National Health Performance Authority 1 . 1 6 . 6 7 . 7- National Mental Health Commission 2 . 2 9 3 12 11 3 14- Organ and Tissue Authority 9 2 11 15 2 17 24 4 28- Professional Services Review 9 . 9 4 6 10 13 6 19Human Services 8883 1515 10398 16248 9925 26173 25131 11440 36571Immigration and Border Protection 6192 349 6541 6023 1707 7730 12215 2056 14271Industry, Innovation and Science 2264 172 2436 1770 510 2280 4034 682 4716- NOPSEMA 71 . 71 36 8 44 107 8 115Infrastructure and Regional Development 561 21 582 481 97 578 1042 118 1160- Australian Transport Safety Bureau 69 1 70 27 3 30 96 4 100- National Capital Authority 21 2 23 23 16 39 44 18 62Prime Minister and Cabinet 686 58 744 1184 236 1420 1870 294 2164- Aboriginal Hostels Ltd. 110 79 189 164 158 322 274 237 511- ANAO 132 9 141 168 33 201 300 42 342- Australian Public Service Commission 54 13 67 119 51 170 173 64 237- Commonwealth Ombudsman 46 10 56 77 36 113 123 46 169- Digital Transformation Office 36 2 38 28 4 32 64 6 70- OIGIS 5 1 6 5 2 7 10 3 13- Office of National Assessments 73 8 81 43 13 56 116 21 137- Torres Strait Regional Authority 76 2 78 65 5 70 141 7 148Social Services 768 51 819 1166 377 1543 1934 428 2362- Australian Institute of Family Studies 18 5 23 26 33 59 44 38 82- National Disability Insurance Agency 362 21 383 919 204 1123 1281 225 1506Treasury 584 43 627 486 153 639 1070 196 1266- Australian Bureau of Statistics 1483 217 1700 1367 504 1871 2850 721 3571- ACCC 372 32 404 344 119 463 716 151 867- ASIC 711 24 735 725 309 1034 1436 333 1769- Australian Taxation Office 7747 833 8580 8270 3534 11804 16017 4367 20384- Productivity Commission 83 3 86 58 28 86 141 31 172Veterans' Affairs 741 22 763 1043 200 1243 1784 222 2006- Australian War Memorial 127 8 135 147 20 167 274 28 302Total 57988 5836 63824 65966 25981 91947 123954 31817 155771Source: APSED
20

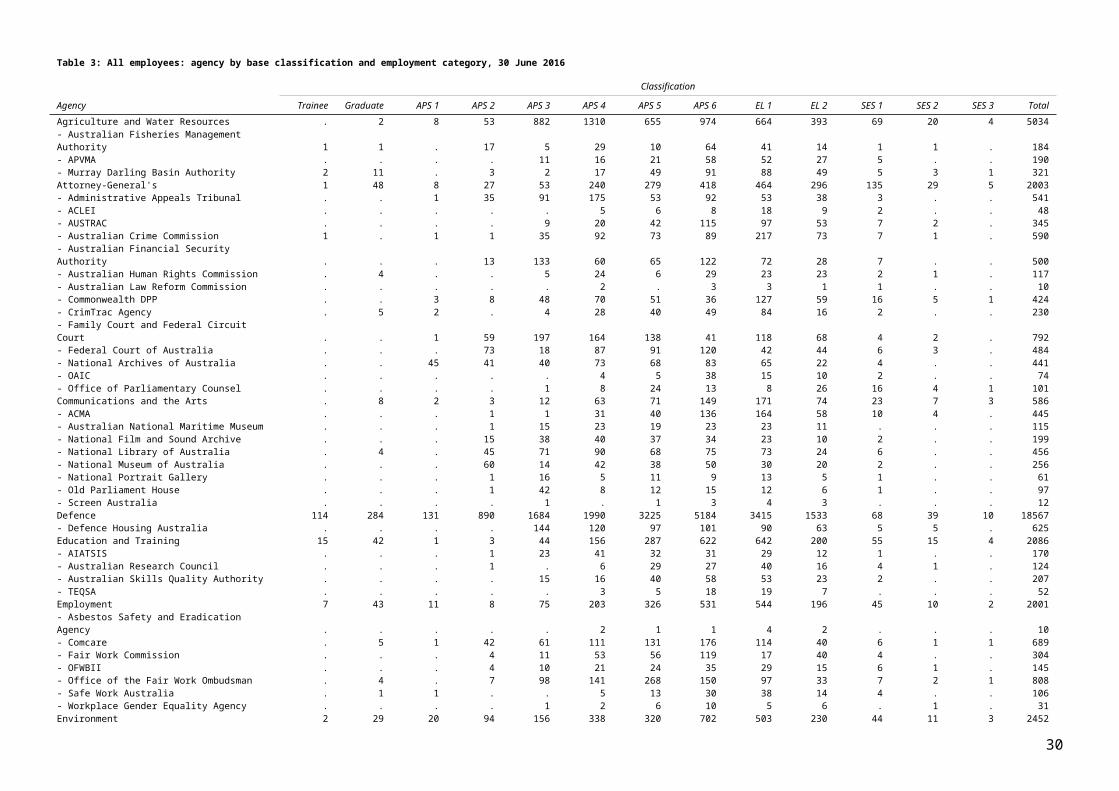
Table 3: Ongoing employees: agency by base classification and employment category, 30 June 2016
Classification
Agency Trainee Graduate APS 1 APS 2 APS 3 APS 4 APS 5 APS 6 EL 1 EL 2 SES 1 SES 2 SES 3 Total
Agriculture and Water Resources . 2 4 16 705 1106 623 861 635 379 69 20 4 4424- Australian Fisheries Management Authority 1 1 . 3 1 28 10 63 38 14 1 1 . 161- APVMA . . . . 8 12 20 56 49 27 4 . . 176- Murray Darling Basin Authority 2 11 . 2 1 14 44 83 82 44 5 3 1 292Attorney-General's 1 48 5 9 33 177 226 358 374 241 135 28 5 1640- Administrative Appeals Tribunal . . 1 15 50 142 49 89 51 33 3 . . 433- ACLEI . . . . . 1 5 8 13 7 2 . . 36- AUSTRAC . . . . 9 20 41 114 96 53 7 2 . 342- Australian Crime Commission . . . 1 30 82 71 85 209 70 7 1 . 556- Australian Financial Security Authority . . . 13 112 55 62 112 71 27 7 . . 459- Australian Human Rights Commission . 4 . . 2 20 5 28 18 19 2 1 . 99- Australian Law Reform Commission . . . . . 2 . 3 3 1 1 . . 10- Commonwealth DPP . . 2 6 28 68 49 35 125 58 15 5 1 392- CrimTrac Agency . 5 2 . 4 26 39 49 82 15 2 . . 224- Family Court and Federal Circuit Court . . 1 40 142 92 117 39 105 56 3 2 . 597- Federal Court of Australia . . . 6 13 63 29 107 35 33 5 2 . 293- National Archives of Australia . . 19 21 31 60 62 75 62 22 4 . . 356- OAIC . . . . . 4 5 38 14 8 2 . . 71- Office of Parliamentary Counsel . . . . 1 7 22 12 8 26 16 4 1 97Communications and the Arts . 8 . 1 8 50 66 144 163 71 22 7 2 542- ACMA . . . . 1 30 34 128 163 58 10 4 . 428- Australian National Maritime Museum . . . 1 8 23 14 21 19 8 . . . 94- National Film and Sound Archive . . . 5 19 34 31 31 19 10 2 . . 151- National Library of Australia . 4 . 25 61 81 65 74 66 22 5 . . 403- National Museum of Australia . . . 37 10 34 33 44 29 18 2 . . 207- National Portrait Gallery . . . 1 8 4 7 8 12 3 . . . 43- Old Parliament House . . . . 13 7 11 12 11 6 1 . . 61- Screen Australia . . . . 1 . 1 3 4 3 . . . 12Defence 108 284 83 867 1680 1987 3222 5180 3408 1524 68 37 8 18456- Defence Housing Australia . . . . 111 106 87 89 84 59 5 3 . 544Education and Training 15 42 1 2 40 142 277 612 636 196 55 15 4 2037- AIATSIS . . . 1 13 29 26 22 21 8 1 . . 121- Australian Research Council . . . 1 . 3 28 26 39 16 1 1 . 115- Australian Skills Quality Authority . . . . 7 8 27 51 48 21 2 . . 164- TEQSA . . . . . 2 5 17 18 7 . . . 49Employment 7 43 . 3 53 178 309 522 529 189 44 10 2 1889- Asbestos Safety and Eradication Agency . . . . . . . 1 4 2 . . . 7- Comcare . 5 1 25 44 104 127 158 111 39 6 1 1 622- Fair Work Commission . . . 4 4 40 28 117 16 39 4 . . 252- OFWBII . . . . 8 19 24 33 27 13 6 1 . 131- Office of the Fair Work Ombudsman . 4 . 4 67 138 260 149 95 33 7 2 1 760- Safe Work Australia . 1 . . . 5 13 27 36 14 4 . . 100- Workplace Gender Equality Agency . . . . 1 1 5 8 4 5 . 1 . 25Environment 1 29 6 28 73 201 284 615 477 211 43 11 3 1982- Bureau of Meteorology 4 16 4 9 136 59 179 398 422 195 13 5 . 1440- Clean Energy Regulator . 5 3 . 7 26 62 91 84 41 8 3 . 330- Climate Change Authority . . 1 . . . 3 5 4 4 . 1 . 18- GBRMPA . . 2 15 16 26 25 54 36 12 3 . . 189Finance . 22 22 24 56 119 224 286 419 206 56 14 4 1452- Australian Electoral Commission . 5 . 132 137 75 115 197 132 35 8 2 . 838- Future Fund Management Agency . . . 2 4 25 26 23 4 36 . 3 1 124Foreign Affairs and Trade 5 71 . 5 54 120 775 666 1178 564 189 57 11 3695- ACIAR . . . . . 13 7 5 6 1 1 . . 33- AUSTRADE . . . . 3 35 18 103 173 141 39 12 3 527Health . 14 12 22 120 482 705 1421 1226 509 104 30 7 4652
21

Classification
Agency Trainee Graduate APS 1 APS 2 APS 3 APS 4 APS 5 APS 6 EL 1 EL 2 SES 1 SES 2 SES 3 Total
- Australian Aged Care Quality Agency . . . . 27 19 26 113 12 6 3 . . 206- ACSQHC . . . . 1 2 10 15 38 15 . 1 . 82- Australian Institute of Health and Welfare . 9 . 2 3 24 51 85 103 34 6 . . 317- ARPANSA . . . 8 11 4 17 25 40 17 4 . . 126- Australian Sports Anti-Doping Authority . . . . 1 7 8 9 10 4 2 1 . 42- Cancer Australia . . . . . . 9 26 11 6 2 1 . 55- FSANZ . . . . 1 4 9 23 33 23 1 . . 94- Independent Hospital Pricing Authority . . . . . 3 1 11 17 8 . . . 40- National Blood Authority . . . . 1 5 11 8 20 5 1 . . 51- NHMRC . . . 1 11 14 33 43 59 24 5 1 . 191- National Health Funding Body . . . . . 1 3 3 3 3 . . . 13- National Health Performance Authority . . . . . . . 1 2 3 . . . 6- National Mental Health Commission . . . . . 2 2 2 4 3 1 . . 14- Organ and Tissue Authority . . . . . . 3 6 8 4 1 1 . 23- Professional Services Review . . . . 1 3 3 3 1 4 1 . . 16Human Services 187 96 150 199 4099 14798 3310 5189 2549 887 123 31 8 31626Immigration and Border Protection 126 40 20 44 3062 1948 2792 2712 2000 621 109 31 8 13513Industry, Innovation and Science 22 58 3 18 88 407 509 1480 1112 523 72 22 5 4319- NOPSEMA . . . . 2 12 7 12 46 27 3 . . 109Infrastructure and Regional Development . 34 . 1 19 69 196 288 338 149 39 9 3 1145- Australian Transport Safety Bureau . . . . . 2 12 10 18 49 3 . . 94- National Capital Authority . . . 3 5 5 5 8 14 5 2 . . 47Prime Minister and Cabinet . 30 3 15 41 204 263 477 645 255 71 18 8 2030- Aboriginal Hostels Ltd. 2 . 82 14 47 12 12 21 14 4 3 . . 211- ANAO . 18 . 4 13 34 37 66 52 75 21 5 2 327- Australian Public Service Commission . . . 4 3 23 15 47 68 27 9 . 1 197- Commonwealth Ombudsman . . . . 14 21 26 31 37 13 4 . . 146- Digital Transformation Office . . . . . 1 2 7 16 8 1 1 . 36- OIGIS . . . . . . 1 3 5 3 1 . . 13- Office of National Assessments . . . . . 7 10 27 39 37 8 3 . 131- Torres Strait Regional Authority . . . 6 1 5 11 7 7 6 . . . 43Social Services 9 54 8 21 28 167 302 711 605 260 47 13 4 2229- Australian Institute of Family Studies . . . 1 . 4 1 11 14 12 . . . 43- National Disability Insurance Agency . . . 6 45 154 291 336 160 85 22 11 3 1113Treasury . 61 . 36 25 79 124 269 252 199 58 23 8 1134- Australian Bureau of Statistics . 131 3 6 60 399 590 801 508 164 30 9 4 2705- ACCC . 32 . . 21 42 149 177 193 154 31 10 1 810- ASIC . 22 20 104 92 107 69 325 373 445 2 1 . 1560- Australian Taxation Office 14 28 68 753 3199 3124 1850 3989 3066 1270 192 23 2 17578- Productivity Commission . 7 . . 2 11 15 31 51 34 12 3 . 166Veterans' Affairs . 18 16 51 215 252 460 449 265 96 19 8 2 1851- Australian War Memorial . . . 29 29 24 60 48 36 16 3 . . 245Total ongoing 504 1262 542 2672 15100 28184 19907 31461 24637 11035 1911 515 118 137848Source: APSED
22

Table 3: Non-ongoing employees: agency by base classification and employment category, 30 June 2016
Classification
Agency Trainee Graduate APS 1 APS 2 APS 3 APS 4 APS 5 APS 6 EL 1 EL 2 SES 1 SES 2 SES 3 Total
Agriculture and Water Resources . . 4 37 177 204 32 113 29 14 . . . 610- Australian Fisheries Management Authority . . . 14 4 1 . 1 3 . . . . 23- APVMA . . . . 3 4 1 2 3 . 1 . . 14- Murray Darling Basin Authority . . . 1 1 3 5 8 6 5 . . . 29Attorney-General's . . 3 18 20 63 53 60 90 55 . 1 . 363- Administrative Appeals Tribunal . . . 20 41 33 4 3 2 5 . . . 108- ACLEI . . . . . 4 1 . 5 2 . . . 12- AUSTRAC . . . . . . 1 1 1 . . . . 3- Australian Crime Commission 1 . 1 . 5 10 2 4 8 3 . . . 34- Australian Financial Security Authority . . . . 21 5 3 10 1 1 . . . 41- Australian Human Rights Commission . . . . 3 4 1 1 5 4 . . . 18- Australian Law Reform Commission . . . . . . . . . . . . . .- Commonwealth DPP . . 1 2 20 2 2 1 2 1 1 . . 32- CrimTrac Agency . . . . . 2 1 . 2 1 . . . 6- Family Court and Federal Circuit Court . . . 19 55 72 21 2 13 12 1 . . 195- Federal Court of Australia . . . 67 5 24 62 13 7 11 1 1 . 191- National Archives of Australia . . 26 20 9 13 6 8 3 . . . . 85- OAIC . . . . . . . . 1 2 . . . 3- Office of Parliamentary Counsel . . . . . 1 2 1 . . . . . 4Communications and the Arts . . 2 2 4 13 5 5 8 3 1 . 1 44- ACMA . . . 1 . 1 6 8 1 . . . . 17- Australian National Maritime Museum . . . . 7 . 5 2 4 3 . . . 21- National Film and Sound Archive . . . 10 19 6 6 3 4 . . . . 48- National Library of Australia . . . 20 10 9 3 1 7 2 1 . . 53- National Museum of Australia . . . 23 4 8 5 6 1 2 . . . 49- National Portrait Gallery . . . . 8 1 4 1 1 2 1 . . 18- Old Parliament House . . . 1 29 1 1 3 1 . . . . 36- Screen Australia . . . . . . . . . . . . . .Defence 6 . 48 23 4 3 3 4 7 9 . 2 2 111- Defence Housing Australia . . . . 33 14 10 12 6 4 . 2 . 81Education and Training . . . 1 4 14 10 10 6 4 . . . 49- AIATSIS . . . . 10 12 6 9 8 4 . . . 49- Australian Research Council . . . . . 3 1 1 1 . 3 . . 9- Australian Skills Quality Authority . . . . 8 8 13 7 5 2 . . . 43- TEQSA . . . . . 1 . 1 1 . . . . 3Employment . . 11 5 22 25 17 9 15 7 1 . . 112- Asbestos Safety and Eradication Agency . . . . . 2 1 . . . . . . 3- Comcare . . . 17 17 7 4 18 3 1 . . . 67- Fair Work Commission . . . . 7 13 28 2 1 1 . . . 52- OFWBII . . . 4 2 2 . 2 2 2 . . . 14- Office of the Fair Work Ombudsman . . . 3 31 3 8 1 2 . . . . 48- Safe Work Australia . . 1 . . . . 3 2 . . . . 6- Workplace Gender Equality Agency . . . . . 1 1 2 1 1 . . . 6Environment 1 . 14 66 83 137 36 87 26 19 1 . . 470- Bureau of Meteorology . . 2 . 6 6 14 81 82 34 2 . . 227- Clean Energy Regulator . . 1 . 12 6 7 10 3 . . . . 39- Climate Change Authority . . . . . . 2 . 2 2 . . . 6- GBRMPA . . 35 3 2 4 1 3 3 . . . . 51Finance . . . 321 6 18 4 2 2 1 . . . 354- Australian Electoral Commission . . 1117 42 136 30 9 39 12 2 2 . . 1389- Future Fund Management Agency . . . 1 . 1 1 . . 3 . . . 6Foreign Affairs and Trade . 1 . . 2 24 37 6 23 11 7 4 3 118- ACIAR . 3 . . . 1 1 1 1 13 2 . . 22- AUSTRADE . . . . 1 4 7 8 6 7 5 . . 38Health . . 1 44 38 90 56 117 55 16 3 1 2 423
23

Classification
Agency Trainee Graduate APS 1 APS 2 APS 3 APS 4 APS 5 APS 6 EL 1 EL 2 SES 1 SES 2 SES 3 Total
- Australian Aged Care Quality Agency . . . . 6 1 5 2 4 2 . . . 20- ACSQHC . . . . . . . 5 10 2 . 4 . 21- Australian Institute of Health and Welfare . . . 1 5 9 3 3 5 2 . . . 28- ARPANSA . . . 2 5 1 1 5 2 1 . . . 17- Australian Sports Anti-Doping Authority . . 212 . 33 1 1 . 1 . . . . 248- Cancer Australia . . . . . 2 4 6 1 2 . . . 15- FSANZ . . . . . 2 4 1 . 1 . . . 8- Independent Hospital Pricing Authority . . . . . . . 7 8 . 1 . . 16- National Blood Authority . . . 1 . 3 . . 1 . . . . 5- NHMRC . . . . 5 7 8 4 1 2 . . . 27- National Health Funding Body . . . . . . . 1 2 . . . 1 4- National Health Performance Authority . . . . . . . . 1 . . . . 1- National Mental Health Commission . . . . . . . . . . . . . .- Organ and Tissue Authority . . . . . . 1 1 1 2 . . . 5- Professional Services Review . . . . . 1 . 2 . . . . . 3Human Services . . 43 46 3998 776 40 18 11 6 2 4 1 4945Immigration and Border Protection . . . 296 222 91 39 85 21 4 . . . 758Industry, Innovation and Science . . 104 36 25 77 33 50 51 20 1 . . 397- NOPSEMA . . . . . . . 1 5 . . . . 6Infrastructure and Regional Development . . . . . . 2 5 2 6 . . . 15- Australian Transport Safety Bureau . . . . . 1 1 . 3 1 . . . 6- National Capital Authority . . . 7 4 1 2 . 1 . . . . 15Prime Minister and Cabinet . . . 9 5 27 13 16 51 8 4 1 . 134- Aboriginal Hostels Ltd. . . 220 11 29 16 5 11 6 2 . . . 300- ANAO . . 8 1 2 1 1 1 1 . . . . 15- Australian Public Service Commission . . 2 . 1 1 . 2 28 5 . 1 . 40- Commonwealth Ombudsman . . . . 3 6 3 2 6 3 . . . 23- Digital Transformation Office . . . . . 2 1 6 6 15 2 2 . 34- OIGIS . . . . . . . . . . . . . .- Office of National Assessments . . . . . 2 1 1 1 1 . . . 6- Torres Strait Regional Authority . . 29 6 23 4 13 18 11 . 1 . . 105Social Services . . . 3 23 33 21 29 17 7 . . . 133- Australian Institute of Family Studies . . . 1 6 4 9 7 10 2 . . . 39- National Disability Insurance Agency . . 4 11 88 125 95 27 23 13 6 . 1 393Treasury . . 10 29 20 23 7 13 13 12 4 1 . 132- Australian Bureau of Statistics . . 33 166 157 235 124 100 34 13 3 1 . 866- ACCC . . 6 . 13 7 13 6 6 6 . . . 57- ASIC . . 18 40 . 46 4 33 41 27 . . . 209- Australian Taxation Office . 1 1432 986 298 50 16 12 3 4 3 1 . 2806- Productivity Commission . . . 1 . 2 . 2 1 . . . . 6Veterans' Affairs . . . 10 66 20 44 9 3 2 1 . . 155- Australian War Memorial . . . 2 31 5 6 4 6 3 . . . 57Total non-ongoing 8 5 3388 2450 5937 2495 1029 1187 881 445 61 26 11 17923Source: APSED
24

Table 3: All employees: agency by base classification and employment category, 30 June 2016
Classification
Agency Trainee Graduate APS 1 APS 2 APS 3 APS 4 APS 5 APS 6 EL 1 EL 2 SES 1 SES 2 SES 3 Total
Agriculture and Water Resources . 2 8 53 882 1310 655 974 664 393 69 20 4 5034- Australian Fisheries Management Authority 1 1 . 17 5 29 10 64 41 14 1 1 . 184- APVMA . . . . 11 16 21 58 52 27 5 . . 190- Murray Darling Basin Authority 2 11 . 3 2 17 49 91 88 49 5 3 1 321Attorney-General's 1 48 8 27 53 240 279 418 464 296 135 29 5 2003- Administrative Appeals Tribunal . . 1 35 91 175 53 92 53 38 3 . . 541- ACLEI . . . . . 5 6 8 18 9 2 . . 48- AUSTRAC . . . . 9 20 42 115 97 53 7 2 . 345- Australian Crime Commission 1 . 1 1 35 92 73 89 217 73 7 1 . 590- Australian Financial Security Authority . . . 13 133 60 65 122 72 28 7 . . 500- Australian Human Rights Commission . 4 . . 5 24 6 29 23 23 2 1 . 117- Australian Law Reform Commission . . . . . 2 . 3 3 1 1 . . 10- Commonwealth DPP . . 3 8 48 70 51 36 127 59 16 5 1 424- CrimTrac Agency . 5 2 . 4 28 40 49 84 16 2 . . 230- Family Court and Federal Circuit Court . . 1 59 197 164 138 41 118 68 4 2 . 792- Federal Court of Australia . . . 73 18 87 91 120 42 44 6 3 . 484- National Archives of Australia . . 45 41 40 73 68 83 65 22 4 . . 441- OAIC . . . . . 4 5 38 15 10 2 . . 74- Office of Parliamentary Counsel . . . . 1 8 24 13 8 26 16 4 1 101Communications and the Arts . 8 2 3 12 63 71 149 171 74 23 7 3 586- ACMA . . . 1 1 31 40 136 164 58 10 4 . 445- Australian National Maritime Museum . . . 1 15 23 19 23 23 11 . . . 115- National Film and Sound Archive . . . 15 38 40 37 34 23 10 2 . . 199- National Library of Australia . 4 . 45 71 90 68 75 73 24 6 . . 456- National Museum of Australia . . . 60 14 42 38 50 30 20 2 . . 256- National Portrait Gallery . . . 1 16 5 11 9 13 5 1 . . 61- Old Parliament House . . . 1 42 8 12 15 12 6 1 . . 97- Screen Australia . . . . 1 . 1 3 4 3 . . . 12Defence 114 284 131 890 1684 1990 3225 5184 3415 1533 68 39 10 18567- Defence Housing Australia . . . . 144 120 97 101 90 63 5 5 . 625Education and Training 15 42 1 3 44 156 287 622 642 200 55 15 4 2086- AIATSIS . . . 1 23 41 32 31 29 12 1 . . 170- Australian Research Council . . . 1 . 6 29 27 40 16 4 1 . 124- Australian Skills Quality Authority . . . . 15 16 40 58 53 23 2 . . 207- TEQSA . . . . . 3 5 18 19 7 . . . 52Employment 7 43 11 8 75 203 326 531 544 196 45 10 2 2001- Asbestos Safety and Eradication Agency . . . . . 2 1 1 4 2 . . . 10- Comcare . 5 1 42 61 111 131 176 114 40 6 1 1 689- Fair Work Commission . . . 4 11 53 56 119 17 40 4 . . 304- OFWBII . . . 4 10 21 24 35 29 15 6 1 . 145- Office of the Fair Work Ombudsman . 4 . 7 98 141 268 150 97 33 7 2 1 808- Safe Work Australia . 1 1 . . 5 13 30 38 14 4 . . 106- Workplace Gender Equality Agency . . . . 1 2 6 10 5 6 . 1 . 31Environment 2 29 20 94 156 338 320 702 503 230 44 11 3 2452- Bureau of Meteorology 4 16 6 9 142 65 193 479 504 229 15 5 . 1667- Clean Energy Regulator . 5 4 . 19 32 69 101 87 41 8 3 . 369- Climate Change Authority . . 1 . . . 5 5 6 6 . 1 . 24- GBRMPA . . 37 18 18 30 26 57 39 12 3 . . 240Finance . 22 22 345 62 137 228 288 421 207 56 14 4 1806- Australian Electoral Commission . 5 1117 174 273 105 124 236 144 37 10 2 . 2227- Future Fund Management Agency . . . 3 4 26 27 23 4 39 . 3 1 130Foreign Affairs and Trade 5 72 . 5 56 144 812 672 1201 575 196 61 14 3813- ACIAR . 3 . . . 14 8 6 7 14 3 . . 55- AUSTRADE . . . . 4 39 25 111 179 148 44 12 3 565Health . 14 13 66 158 572 761 1538 1281 525 107 31 9 5075
25

Classification
Agency Trainee Graduate APS 1 APS 2 APS 3 APS 4 APS 5 APS 6 EL 1 EL 2 SES 1 SES 2 SES 3 Total
- Australian Aged Care Quality Agency . . . . 33 20 31 115 16 8 3 . . 226- ACSQHC . . . . 1 2 10 20 48 17 . 5 . 103- Australian Institute of Health and Welfare . 9 . 3 8 33 54 88 108 36 6 . . 345- ARPANSA . . . 10 16 5 18 30 42 18 4 . . 143- Australian Sports Anti-Doping Authority . . 212 . 34 8 9 9 11 4 2 1 . 290- Cancer Australia . . . . . 2 13 32 12 8 2 1 . 70- FSANZ . . . . 1 6 13 24 33 24 1 . . 102- Independent Hospital Pricing Authority . . . . . 3 1 18 25 8 1 . . 56- National Blood Authority . . . 1 1 8 11 8 21 5 1 . . 56- NHMRC . . . 1 16 21 41 47 60 26 5 1 . 218- National Health Funding Body . . . . . 1 3 4 5 3 . . 1 17- National Health Performance Authority . . . . . . . 1 3 3 . . . 7- National Mental Health Commission . . . . . 2 2 2 4 3 1 . . 14- Organ and Tissue Authority . . . . . . 4 7 9 6 1 1 . 28- Professional Services Review . . . . 1 4 3 5 1 4 1 . . 19Human Services 187 96 193 245 8097 15574 3350 5207 2560 893 125 35 9 36571Immigration and Border Protection 126 40 20 340 3284 2039 2831 2797 2021 625 109 31 8 14271Industry, Innovation and Science 22 58 107 54 113 484 542 1530 1163 543 73 22 5 4716- NOPSEMA . . . . 2 12 7 13 51 27 3 . . 115Infrastructure and Regional Development . 34 . 1 19 69 198 293 340 155 39 9 3 1160- Australian Transport Safety Bureau . . . . . 3 13 10 21 50 3 . . 100- National Capital Authority . . . 10 9 6 7 8 15 5 2 . . 62Prime Minister and Cabinet . 30 3 24 46 231 276 493 696 263 75 19 8 2164- Aboriginal Hostels Ltd. 2 . 302 25 76 28 17 32 20 6 3 . . 511- ANAO . 18 8 5 15 35 38 67 53 75 21 5 2 342- Australian Public Service Commission . . 2 4 4 24 15 49 96 32 9 1 1 237- Commonwealth Ombudsman . . . . 17 27 29 33 43 16 4 . . 169- Digital Transformation Office . . . . . 3 3 13 22 23 3 3 . 70- OIGIS . . . . . . 1 3 5 3 1 . . 13- Office of National Assessments . . . . . 9 11 28 40 38 8 3 . 137- Torres Strait Regional Authority . . 29 12 24 9 24 25 18 6 1 . . 148Social Services 9 54 8 24 51 200 323 740 622 267 47 13 4 2362- Australian Institute of Family Studies . . . 2 6 8 10 18 24 14 . . . 82- National Disability Insurance Agency . . 4 17 133 279 386 363 183 98 28 11 4 1506Treasury . 61 10 65 45 102 131 282 265 211 62 24 8 1266- Australian Bureau of Statistics . 131 36 172 217 634 714 901 542 177 33 10 4 3571- ACCC . 32 6 . 34 49 162 183 199 160 31 10 1 867- ASIC . 22 38 144 92 153 73 358 414 472 2 1 . 1769- Australian Taxation Office 14 29 1500 1739 3497 3174 1866 4001 3069 1274 195 24 2 20384- Productivity Commission . 7 . 1 2 13 15 33 52 34 12 3 . 172Veterans' Affairs . 18 16 61 281 272 504 458 268 98 20 8 2 2006- Australian War Memorial . . . 31 60 29 66 52 42 19 3 . . 302Total 512 1267 3930 5122 21037 30679 20936 32648 25518 11480 1972 541 129 155771Source: APSED
26

Table 4: All employees: age group by base classification and employment category, 30 June 2016
Classification
Age group Trainee Graduate APS 1 APS 2 APS 3 APS 4 APS 5 APS 6 EL 1 EL 2 SES 1 SES 2 SES 3 Total
Ongoing
Under 20 36 2 25 28 29 14 . . . . . . . 13420-24 186 524 34 223 756 833 374 107 4 1 . . . 304225-29 103 524 51 283 1583 3023 2785 2748 525 30 1 . . 1165630-34 71 131 50 201 1862 3831 2978 5379 3246 543 29 . . 1832135-39 42 43 37 169 1956 3767 2597 4850 4464 1546 136 12 1 1962040-44 29 19 51 252 1914 4136 2538 4522 4420 2040 337 62 4 2032445-49 24 13 70 346 1989 3900 2558 4277 4169 2236 467 111 13 2017350-54 11 3 75 451 2101 3880 2748 4423 3972 2369 467 147 43 2069055-59 2 2 73 384 1635 2867 2007 3164 2512 1528 349 121 38 1468260 and over . 1 76 335 1275 1933 1322 1991 1325 742 125 62 19 9206Total ongoing 504 1262 542 2672 15100 28184 19907 31461 24637 11035 1911 515 118 137848
Non-Ongoing
Under 20 1 . 79 94 255 26 1 . . . . . . 45620-24 6 3 451 549 1393 391 66 14 . 1 . . . 287425-29 1 2 339 359 955 565 295 140 37 2 . . . 269530-34 . . 243 191 701 326 173 178 118 18 . . . 194835-39 . . 255 154 590 238 110 171 128 53 2 . . 170140-44 . . 324 157 552 207 87 138 131 60 13 3 . 167245-49 . . 326 168 451 190 88 129 106 73 8 1 . 154050-54 . . 362 174 393 177 69 117 109 58 12 12 2 148555-59 . . 329 221 351 167 73 136 119 84 13 3 4 150060 and over . . 680 383 296 208 67 164 133 96 13 7 5 2052Total non-ongoing 8 5 3388 2450 5937 2495 1029 1187 881 445 61 26 11 17923
Total
Under 20 37 2 104 122 284 40 1 . . . . . . 59020-24 192 527 485 772 2149 1224 440 121 4 2 . . . 591625-29 104 526 390 642 2538 3588 3080 2888 562 32 1 . . 1435130-34 71 131 293 392 2563 4157 3151 5557 3364 561 29 . . 2026935-39 42 43 292 323 2546 4005 2707 5021 4592 1599 138 12 1 2132140-44 29 19 375 409 2466 4343 2625 4660 4551 2100 350 65 4 2199645-49 24 13 396 514 2440 4090 2646 4406 4275 2309 475 112 13 2171350-54 11 3 437 625 2494 4057 2817 4540 4081 2427 479 159 45 2217555-59 2 2 402 605 1986 3034 2080 3300 2631 1612 362 124 42 1618260 and over . 1 756 718 1571 2141 1389 2155 1458 838 138 69 24 11258Total 512 1267 3930 5122 21037 30679 20936 32648 25518 11480 1972 541 129 155771Source: APSED
27

Table 5: All employees: location by base classification and employment category, 30 June 2016
Classification
Location Trainee Graduate APS 1 APS 2 APS 3 APS 4 APS 5 APS 6 EL 1 EL 2 SES 1 SES 2 SES 3 Total
Ongoing
Australian Capital Territory 143 990 154 443 1673 4905 7667 14356 15012 6515 1378 391 106 53733New South Wales 70 64 126 788 4356 7557 3530 4773 2530 1256 139 40 2 25231Victoria 65 125 80 498 3405 5779 3169 5059 2875 1453 153 43 4 22708Queensland 90 37 76 425 2504 4474 2260 2957 1597 571 61 6 1 15059South Australia 40 22 30 220 1198 2004 1324 2008 1080 547 28 5 . 8506Western Australia 48 13 33 105 1112 1764 989 1125 608 231 36 . . 6064Tasmania 6 9 11 132 505 1282 437 581 263 112 8 1 . 3347Northern Territory 42 . 32 61 335 388 333 340 209 52 9 . . 1801Overseas . 2 . . 12 31 198 262 463 298 99 29 5 1399Total ongoing 504 1262 542 2672 15100 28184 19907 31461 24637 11035 1911 515 118 137848
Non-ongoing
Australian Capital Territory 1 4 409 504 616 947 451 574 433 197 33 13 6 4188New South Wales . . 1468 683 1481 352 151 159 193 117 11 9 1 4625Victoria . . 527 473 1557 418 166 199 154 82 8 . 1 3585Queensland . 1 385 275 1024 316 110 95 47 11 1 . . 2265South Australia 6 . 171 182 396 124 28 31 11 11 1 1 . 962Western Australia . . 257 136 596 176 62 54 17 5 1 . . 1304Tasmania . . 57 126 198 89 30 48 14 13 . . . 575Northern Territory 1 . 114 71 69 71 24 27 12 1 3 . . 393Overseas . . . . . 2 7 . . 8 3 3 3 26Total non-ongoing 8 5 3388 2450 5937 2495 1029 1187 881 445 61 26 11 17923
Total
Australian Capital Territory 144 994 563 947 2289 5852 8118 14930 15445 6712 1411 404 112 57921New South Wales 70 64 1594 1471 5837 7909 3681 4932 2723 1373 150 49 3 29856Victoria 65 125 607 971 4962 6197 3335 5258 3029 1535 161 43 5 26293Queensland 90 38 461 700 3528 4790 2370 3052 1644 582 62 6 1 17324South Australia 46 22 201 402 1594 2128 1352 2039 1091 558 29 6 . 9468Western Australia 48 13 290 241 1708 1940 1051 1179 625 236 37 . . 7368Tasmania 6 9 68 258 703 1371 467 629 277 125 8 1 . 3922Northern Territory 43 . 146 132 404 459 357 367 221 53 12 . . 2194Overseas . 2 . . 12 33 205 262 463 306 102 32 8 1425Total 512 1267 3930 5122 21037 30679 20936 32648 25518 11480 1972 541 129 155771Source: APSED
28

Table 6: Agency metrics, 30 June 2016 and 2015-16
June 2016 Year ending June 2016
Agency % non-ongoing % part-time (ongoing employees)
% aged 45 years and over (ongoing employees)
% who have worked in only one agency (ongoing
employees)Exit rate
(ongoing employees)
Agriculture and Water Resources 12.1 18.3 47.7 78.1 7.0- Australian Fisheries Management Authority 12.5 12.4 39.8 62.1 18.0- APVMA 7.4 9.7 45.5 61.4 21.7- Murray Darling Basin Authority 9.0 11.6 40.1 61.0 14.9Attorney-General's 18.1 18.0 29.0 60.2 22.1- Administrative Appeals Tribunal 20.0 16.6 51.7 54.0 19.0- ACLEI 25.0 . 27.8 25.0 13.6- AUSTRAC 0.9 12.9 38.9 52.9 14.9- Australian Crime Commission 5.8 12.1 42.4 67.1 12.5- Australian Financial Security Authority 8.2 13.7 35.9 69.1 12.6- Australian Human Rights Commission 15.4 23.2 31.3 75.8 16.4- Australian Law Reform Commission . 30.0 50.0 70.0 9.1- Commonwealth DPP 7.5 17.1 35.5 79.8 18.9- CrimTrac Agency 2.6 11.6 32.6 47.3 14.2- Family Court and Federal Circuit Court 24.6 20.4 56.4 75.7 12.0- Federal Court of Australia 39.5 16.7 56.3 67.9 12.4- National Archives of Australia 19.3 19.9 61.2 55.9 10.0- OAIC 4.1 23.9 16.9 49.3 20.0- Office of Parliamentary Counsel 4.0 22.7 43.3 53.6 9.4Communications and the Arts 7.5 12.2 32.5 44.5 21.9- ACMA 3.8 15.0 51.6 61.2 12.5- Australian National Maritime Museum 18.3 14.9 60.6 84.0 12.2- National Film and Sound Archive 24.1 15.2 51.7 74.8 20.4- National Library of Australia 11.6 17.9 55.1 71.5 11.4- National Museum of Australia 19.1 31.4 58.0 73.9 7.2- National Portrait Gallery 29.5 18.6 44.2 69.8 11.6- Old Parliament House 37.1 23.0 50.8 54.1 17.2- Screen Australia . 16.7 66.7 75.0 28.6Defence 0.6 6.9 57.7 89.5 11.0- Defence Housing Australia 13.0 8.3 35.7 87.5 9.3Education and Training 2.3 16.0 44.0 54.3 10.7- AIATSIS 28.8 7.4 50.4 65.3 12.2- Australian Research Council 7.3 13.0 30.4 56.5 12.4- Australian Skills Quality Authority 20.8 11.6 51.8 74.4 17.4- TEQSA 5.8 12.2 32.7 53.1 32.4Employment 5.6 14.5 38.0 57.3 11.3- Asbestos Safety and Eradication Agency 30.0 . 42.9 14.3 .- Comcare 9.7 14.5 37.8 65.8 14.5- Fair Work Commission 17.1 12.7 45.2 69.0 15.7- OFWBII 9.7 11.5 40.5 51.1 17.4
29

June 2016 Year ending June 2016
Agency % non-ongoing % part-time (ongoing employees)
% aged 45 years and over (ongoing employees)
% who have worked in only one agency (ongoing
employees)Exit rate
(ongoing employees)
- Office of the Fair Work Ombudsman 5.9 23.9 27.6 71.2 7.9- Safe Work Australia 5.7 18.0 33.0 34.0 25.5- Workplace Gender Equality Agency 19.4 32.0 52.0 64.0 34.0Environment 19.2 18.1 38.4 62.3 11.7- Bureau of Meteorology 13.6 8.5 54.0 84.7 6.7- Clean Energy Regulator 10.6 11.8 33.3 38.2 19.0- Climate Change Authority 25.0 16.7 11.1 5.6 22.2- GBRMPA 21.3 10.6 48.1 79.4 5.0Finance 19.6 10.5 37.5 52.1 14.0- Australian Electoral Commission 62.4 5.3 60.4 58.6 15.2- Future Fund Management Agency 4.6 11.3 27.4 94.4 8.3Foreign Affairs and Trade 3.1 9.8 39.9 54.4 5.7- ACIAR 40.0 30.3 48.5 54.5 21.9- AUSTRADE 6.7 11.0 49.9 55.8 11.9Health 8.3 19.0 45.2 61.0 12.0- Australian Aged Care Quality Agency 8.8 15.5 72.8 84.5 23.2- ACSQHC 20.4 15.9 40.2 53.7 9.7- Australian Institute of Health and Welfare 8.1 24.9 42.3 52.4 13.9- ARPANSA 11.9 7.1 61.1 77.0 8.9- Australian Sports Anti-Doping Authority 85.5 7.1 45.2 57.1 20.7- Cancer Australia 21.4 18.2 34.5 58.2 17.5- FSANZ 7.8 18.1 57.4 58.5 4.2- Independent Hospital Pricing Authority 28.6 10.0 17.5 55.0 38.1- National Blood Authority 8.9 11.8 39.2 52.9 12.9- NHMRC 12.4 17.3 35.6 62.3 14.5- National Health Funding Body 23.5 7.7 23.1 30.8 34.8- National Health Performance Authority 14.3 . 66.7 . 200.0- National Mental Health Commission . 21.4 28.6 35.7 27.3- Organ and Tissue Authority 17.9 8.7 43.5 21.7 26.1- Professional Services Review 15.8 31.3 37.5 50.0 36.4Human Services 13.5 25.5 48.7 87.3 6.1Immigration and Border Protection 5.3 12.6 41.9 79.6 8.9Industry, Innovation and Science 8.4 11.1 40.4 68.9 9.6- NOPSEMA 5.2 7.3 56.0 93.6 1.9Infrastructure and Regional Development 1.3 10.0 41.0 48.4 17.1- Australian Transport Safety Bureau 6.0 4.3 57.4 73.4 13.8- National Capital Authority 24.2 17.0 42.6 72.3 15.6Prime Minister and Cabinet 6.2 12.6 41.9 46.3 19.5- Aboriginal Hostels Ltd. 58.7 21.3 64.0 79.6 18.1- ANAO 4.4 10.1 36.7 61.2 20.0- Australian Public Service Commission 16.9 16.2 48.2 32.5 18.9
30

June 2016 Year ending June 2016
Agency % non-ongoing % part-time (ongoing employees)
% aged 45 years and over (ongoing employees)
% who have worked in only one agency (ongoing
employees)Exit rate
(ongoing employees)
- Commonwealth Ombudsman 13.6 27.4 34.2 46.6 20.7- Digital Transformation Office 48.6 11.1 36.1 25.0 .- OIGIS . 23.1 38.5 23.1 21.4- Office of National Assessments 4.4 11.5 47.3 25.2 16.0- Torres Strait Regional Authority 70.9 2.3 39.5 46.5 9.2Social Services 5.6 18.3 44.7 50.9 11.0- Australian Institute of Family Studies 47.6 37.2 46.5 76.7 9.5- National Disability Insurance Agency 26.1 15.8 43.5 56.1 8.1Treasury 10.4 12.7 29.8 60.0 12.5- Australian Bureau of Statistics 24.3 15.9 35.5 76.8 8.0- ACCC 6.6 16.5 24.2 69.3 6.6- ASIC 11.8 19.2 38.6 84.2 8.4- Australian Taxation Office 13.8 12.3 50.9 88.3 7.8- Productivity Commission 3.5 18.1 36.7 51.8 14.7Veterans' Affairs 7.7 11.6 60.7 65.5 10.8- Australian War Memorial 18.9 9.0 41.6 77.6 9.8Total 11.5 15.7 47.0 77.2 9.6Source: APSED
31
Section 2: Non-ongoing employees
This section provides data and information about non-ongoing APS employees. Non-ongoing employees are those engaged under s22(2)(b) and (c) of the PS Act.
The number of non-ongoing employees increased this year from 15,729 at June 2015 to 17,923 at June 2016. This is an increase of 2,194 or 13.9%, after increasing by 20.7% from 2014 to 2015. Figure 1 (page 3) shows the non-ongoing numbers from June 2002 to June 2016. At June 2016, non-ongoing employees accounted for 11.5% of total employees.
Non-ongoing employment type There are three types of non-ongoing employment: specified term, specified task and irregular/intermittent. Figure 8 shows that the proportion of specified term employees increased from 42.1% of all non-ongoing employees at June 2015 to 45.1% at June 2016. Irregular/intermittent employees decreased from 53.8% at June 2015 to 52.2% at June 2016. These changes are not consistent with the trend from June 2002 to June 2014 of specified term employees decreasing and irregular/intermittent employees increasing. In this timeframe specified term employees decreased from 85.5% to 33.4%, and irregular/intermittent employees increased from 12.4% to 61.2%.
32

Non-ongoing age profileAt June 2016, 18.6% of non-ongoing employees were less than 25 years of age, compared with only 2.3% of ongoing employees. Non-ongoing employees also had a higher representation in the 55 years and over age group, with 19.8% of non-ongoing employees compared to 17.3% of ongoing employees.
Non-ongoing classification profile Figure 9 shows that the classification profile of non-ongoing employees is generally concentrated at lower classification levels. At June 2016, 32.6% of non-ongoing employees were at the APS 1–2 classifications, compared with 2.3% of ongoing employees. The proportion of non-ongoing employees at the EL classifications was 7.4%, compared with 25.9% of ongoing employees.
33

34

Table 7: Non-ongoing employees: employment status by base classification and sex, 30 June 2016
Classification
Employment status Trainee Graduate APS 1 APS 2 APS 3 APS 4 APS 5 APS 6 EL 1 EL 2 SES 1 SES 2 SES 3 Total
Men
Full-time 7 3 100 247 760 734 306 426 318 174 37 14 9 3135Part-time . . 863 863 1095 197 40 108 108 71 6 7 2 3360Total men 7 3 963 1110 1855 931 346 534 426 245 43 21 11 6495
Women
Full-time 1 2 86 328 1273 1365 571 502 299 135 16 4 . 4582Part-time . . 2339 1012 2809 199 112 151 156 65 2 1 . 6846Total women 1 2 2425 1340 4082 1564 683 653 455 200 18 5 . 11428
Total
Full-time 8 5 186 575 2033 2099 877 928 617 309 53 18 9 7717Part-time . . 3202 1875 3904 396 152 259 264 136 8 8 2 10206Total 8 5 3388 2450 5937 2495 1029 1187 881 445 61 26 11 17923Source: APSED
35

Table 8: Non-ongoing employees: agency by non-ongoing category and sex, 30 June 2016
Men Women Total
Agency Specified term
Specified task
Irregular/ Intermitte
ntTotal Specified
termSpecified
taskIrregular/
Intermittent
Total Specified term
Specified task
Irregular/ Intermitte
ntTotal
Agriculture and Water Resources 105 2 231 338 124 . 148 272 229 2 379 610- Australian Fisheries Management Authority 3 . 16 19 4 . . 4 7 . 16 23- APVMA 7 . . 7 7 . . 7 14 . . 14- Murray Darling Basin Authority 12 2 2 16 12 1 . 13 24 3 2 29Attorney-General's 74 17 25 116 175 40 32 247 249 57 57 363- Administrative Appeals Tribunal 32 . 9 41 50 . 17 67 82 . 26 108- ACLEI 4 . 5 9 2 . 1 3 6 . 6 12- AUSTRAC . . . . 3 . . 3 3 . . 3- Australian Crime Commission 16 . . 16 16 . 2 18 32 . 2 34- Australian Financial Security Authority 11 . . 11 30 . . 30 41 . . 41- Australian Human Rights Commission 4 . 1 5 13 . . 13 17 . 1 18- Australian Law Reform Commission . . . . . . . . . . . .- Commonwealth DPP 8 . . 8 24 . . 24 32 . . 32- CrimTrac Agency 3 . . 3 3 . . 3 6 . . 6- Family Court and Federal Circuit Court 33 . 17 50 119 . 26 145 152 . 43 195- Federal Court of Australia 44 2 28 74 72 1 44 117 116 3 72 191- National Archives of Australia 19 1 7 27 45 1 12 58 64 2 19 85- OAIC 2 . . 2 . . 1 1 2 . 1 3- Office of Parliamentary Counsel . . . . 4 . . 4 4 . . 4Communications and the Arts 7 . 7 14 29 1 . 30 36 1 7 44- ACMA 6 . 1 7 9 . 1 10 15 . 2 17- Australian National Maritime Museum 7 2 . 9 10 2 . 12 17 4 . 21- National Film and Sound Archive 9 2 6 17 17 2 12 31 26 4 18 48- National Library of Australia 9 . 12 21 11 . 21 32 20 . 33 53- National Museum of Australia 10 . 4 14 29 . 6 35 39 . 10 49- National Portrait Gallery 7 . 1 8 7 . 3 10 14 . 4 18- Old Parliament House 4 . 6 10 5 . 21 26 9 . 27 36- Screen Australia . . . . . . . . . . . .Defence 47 2 33 82 7 . 22 29 54 2 55 111- Defence Housing Australia 27 . . 27 54 . . 54 81 . . 81Education and Training 21 1 . 22 27 . . 27 48 1 . 49- AIATSIS 20 . . 20 24 . 5 29 44 . 5 49- Australian Research Council 2 . . 2 7 . . 7 9 . . 9- Australian Skills Quality Authority 11 . . 11 32 . . 32 43 . . 43- TEQSA 1 . . 1 2 . . 2 3 . . 3Employment 48 1 . 49 61 1 1 63 109 2 1 112- Asbestos Safety and Eradication Agency 1 . . 1 2 . . 2 3 . . 3- Comcare 21 . . 21 46 . . 46 67 . . 67- Fair Work Commission 16 . . 16 36 . . 36 52 . . 52- OFWBII 1 . 2 3 8 . 3 11 9 . 5 14- Office of the Fair Work Ombudsman 21 . . 21 27 . . 27 48 . . 48- Safe Work Australia 1 . . 1 5 . . 5 6 . . 6- Workplace Gender Equality Agency 1 . . 1 4 . 1 5 5 . 1 6Environment 83 70 63 216 165 22 67 254 248 92 130 470- Bureau of Meteorology 33 107 9 149 20 57 1 78 53 164 10 227- Clean Energy Regulator 15 . . 15 24 . . 24 39 . . 39- Climate Change Authority 1 . . 1 4 . 1 5 5 . 1 6- GBRMPA 4 . 13 17 13 . 21 34 17 . 34 51Finance 6 . 278 284 8 . 62 70 14 . 340 354- Australian Electoral Commission 100 . 274 374 85 . 930 1015 185 . 1204 1389
36

Men Women Total
Agency Specified term
Specified task
Irregular/ Intermitte
ntTotal Specified
termSpecified
taskIrregular/
Intermittent
Total Specified term
Specified task
Irregular/ Intermitte
ntTotal
- Future Fund Management Agency 3 . . 3 3 . . 3 6 . . 6Foreign Affairs and Trade 40 5 1 46 69 3 . 72 109 8 1 118- ACIAR 6 12 . 18 3 1 . 4 9 13 . 22- AUSTRADE 14 . 1 15 22 . 1 23 36 . 2 38Health 107 . 27 134 275 . 14 289 382 . 41 423- Australian Aged Care Quality Agency 9 . . 9 11 . . 11 20 . . 20- ACSQHC 4 . 1 5 13 . 3 16 17 . 4 21- Australian Institute of Health and Welfare 7 . 1 8 16 . 4 20 23 . 5 28- ARPANSA 2 . 3 5 7 . 5 12 9 . 8 17- Australian Sports Anti-Doping Authority 3 . 144 147 1 . 100 101 4 . 244 248- Cancer Australia 4 . . 4 11 . . 11 15 . . 15- FSANZ 3 . . 3 4 . 1 5 7 . 1 8- Independent Hospital Pricing Authority 6 . . 6 10 . . 10 16 . . 16- National Blood Authority 1 . 1 2 2 . 1 3 3 . 2 5- NHMRC 7 1 1 9 18 . . 18 25 1 1 27- National Health Funding Body 2 . . 2 2 . . 2 4 . . 4- National Health Performance Authority . . . . 1 . . 1 1 . . 1- National Mental Health Commission . . . . . . . . . . . .- Organ and Tissue Authority 2 . . 2 2 . 1 3 4 . 1 5- Professional Services Review 1 . . 1 2 . . 2 3 . . 3Human Services 529 . 883 1412 1085 . 2448 3533 1614 . 3331 4945Immigration and Border Protection 159 . 143 302 296 . 160 456 455 . 303 758Industry, Innovation and Science 85 35 77 197 90 17 93 200 175 52 170 397- NOPSEMA 5 . . 5 1 . . 1 6 . . 6Infrastructure and Regional Development 8 . . 8 7 . . 7 15 . . 15- Australian Transport Safety Bureau 3 . . 3 3 . . 3 6 . . 6- National Capital Authority 3 . 1 4 3 . 8 11 6 . 9 15Prime Minister and Cabinet 33 1 23 57 68 . 9 77 101 1 32 134- Aboriginal Hostels Ltd. 59 . 56 115 77 . 108 185 136 . 164 300- ANAO 1 . 5 6 6 . 3 9 7 . 8 15- Australian Public Service Commission 6 . 10 16 5 1 18 24 11 1 28 40- Commonwealth Ombudsman 8 . 3 11 12 . . 12 20 . 3 23- Digital Transformation Office 17 1 . 18 16 . . 16 33 1 . 34- OIGIS . . . . . . . . . . . .- Office of National Assessments 1 . 2 3 . . 3 3 1 . 5 6- Torres Strait Regional Authority 26 38 1 65 25 14 1 40 51 52 2 105Social Services 44 2 1 47 80 5 1 86 124 7 2 133- Australian Institute of Family Studies 13 . 1 14 20 . 5 25 33 . 6 39- National Disability Insurance Agency 94 . 3 97 286 4 6 296 380 4 9 393Treasury 38 1 9 48 65 . 19 84 103 1 28 132- Australian Bureau of Statistics 343 3 84 430 320 2 114 436 663 5 198 866- ACCC 23 . 5 28 27 . 2 29 50 . 7 57- ASIC 80 1 . 81 124 3 1 128 204 4 1 209- Australian Taxation Office 261 . 602 863 349 . 1594 1943 610 . 2196 2806- Productivity Commission 3 . . 3 3 . . 3 6 . . 6Veterans' Affairs 47 . . 47 107 1 . 108 154 1 . 155- Australian War Memorial 8 . 12 20 21 . 16 37 29 . 28 57Total 3035 309 3151 6495 5049 179 6200 11428 8084 488 9351 17923Source: APSED
37
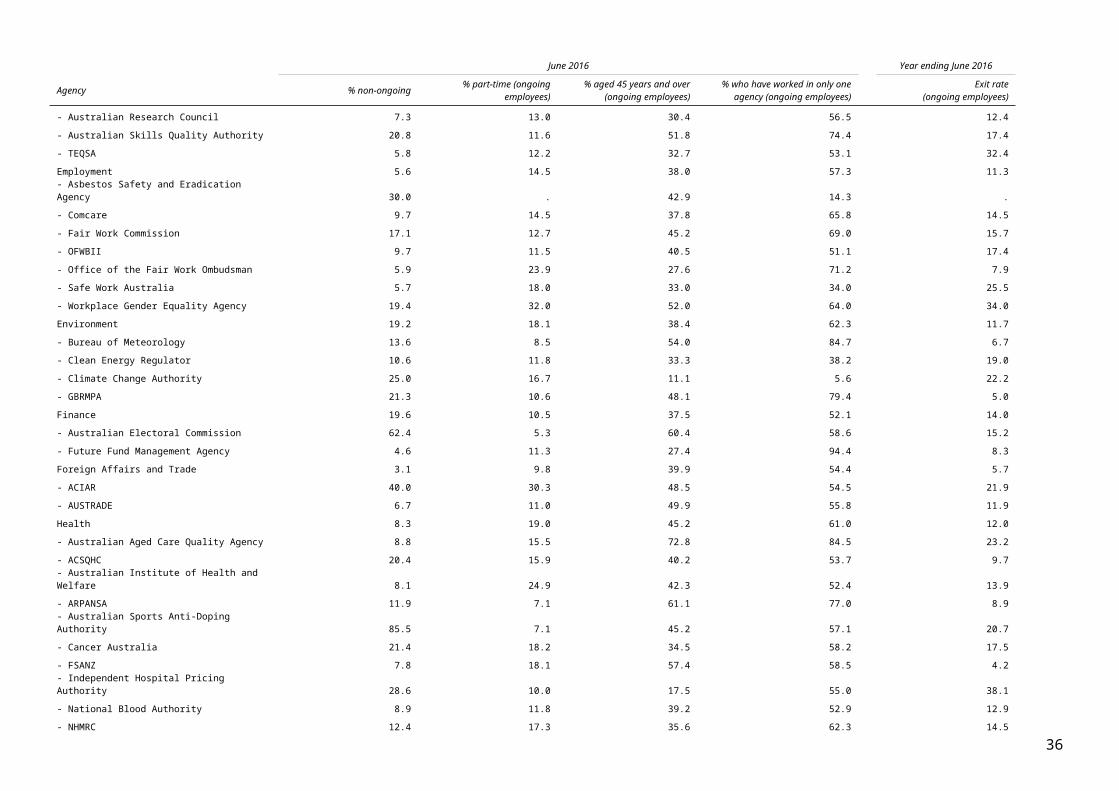
Table 9: Non-ongoing employees: age group by base classification and sex, 30 June 2016
Classification
Age group Trainee Graduate APS 1 APS 2 APS 3 APS 4 APS 5 APS 6 EL 1 EL 2 SES 1 SES 2 SES 3 Total
Men
Under 20 1 . 29 40 95 9 . . . . . . . 17420-24 5 2 168 242 480 113 18 4 . 1 . . . 103325-29 1 1 126 169 337 203 102 41 14 1 . . . 99530-34 . . 76 84 218 141 62 79 47 5 . . . 71235-39 . . 66 54 142 87 45 75 51 19 2 . . 54140-44 . . 71 47 120 71 19 53 63 30 6 3 . 48345-49 . . 63 34 104 55 24 47 49 27 6 1 . 41050-54 . . 54 61 87 51 19 57 47 35 9 7 2 42955-59 . . 62 105 118 80 21 69 70 56 10 3 4 59860 and over . . 248 274 154 121 36 109 85 71 10 7 5 1120Total men 7 3 963 1110 1855 931 346 534 426 245 43 21 11 6495
Women
Under 20 . . 50 54 160 17 1 . . . . . . 28220-24 1 1 283 307 913 278 48 10 . . . . . 184125-29 . 1 213 190 618 362 193 99 23 1 . . . 170030-34 . . 167 107 483 185 111 99 71 13 . . . 123635-39 . . 189 100 448 151 65 96 77 34 . . . 116040-44 . . 253 110 432 136 68 85 68 30 7 . . 118945-49 . . 263 134 347 135 64 82 57 46 2 . . 113050-54 . . 308 113 306 126 50 60 62 23 3 5 . 105655-59 . . 267 116 233 87 52 67 49 28 3 . . 90260 and over . . 432 109 142 87 31 55 48 25 3 . . 932Total women 1 2 2425 1340 4082 1564 683 653 455 200 18 5 . 11428
Total
Under 20 1 . 79 94 255 26 1 . . . . . . 45620-24 6 3 451 549 1393 391 66 14 . 1 . . . 287425-29 1 2 339 359 955 565 295 140 37 2 . . . 269530-34 . . 243 191 701 326 173 178 118 18 . . . 194835-39 . . 255 154 590 238 110 171 128 53 2 . . 170140-44 . . 324 157 552 207 87 138 131 60 13 3 . 167245-49 . . 326 168 451 190 88 129 106 73 8 1 . 154050-54 . . 362 174 393 177 69 117 109 58 12 12 2 148555-59 . . 329 221 351 167 73 136 119 84 13 3 4 150060 and over . . 680 383 296 208 67 164 133 96 13 7 5 2052Total 8 5 3388 2450 5937 2495 1029 1187 881 445 61 26 11 17923Source: APSED
38

Section 3: Ongoing employees
This section provides data and information about ongoing APS employees. Ongoing employees are those engaged under s22(2)(a) of the PS Act. Diversity information for ongoing employees is provided in Section 5: Diversity. At June 2016, there were 137,848 ongoing employees in the APS, an increase of 1,324 or 1.0% from the previous year.
Classification profileFigure 10 shows that the classification profile of ongoing employees is shifting towards higher classification levels. At June 2002, 21.8% of ongoing employees were at the APS 1-3 classifications, compared to 13.3% at June 2016. The proportion of employees at the EL classifications increased from 19.1% at June 2002 to 25.9% at June 2016.
One measure of a shifting classification profile is change over time in the ratio of EL 2 employees to employees at lower classifications. Over the past 15 years, the ratio decreased from 13:1 employees at lower classifications for each EL 2 to 11:1 employees.
Temporary assignment At June 2016, 13.0% of all ongoing employees were on temporary assignment, usually at a higher classification level. Of this group, APS 6 represented the highest proportion with 26.9% of employees on temporary assignment at this classification, followed by EL 1 with 24.1% and APS 5 with 23.8%.
Most employees on temporary assignment are performing duties at a higher classification. Including temporary assignment in any analysis of classification would skew the profile slightly away from lower classifications and towards higher classifications. For example, using base classification, 43,284 employees were at the APS 3–4 classifications, representing 31.4% of all ongoing employees, but this declined to 37,897, or 27.5% of all ongoing employees when temporary assignment was included. Similarly, the size of the SES increased from 2,544, representing 1.8% of all ongoing employees, to 3,021, or 2.2% of all ongoing employees when temporary assignment was included.
Educational qualifications As of 1 July 2013, a new clause in the Australian Public Service Commissioner’s Directions 2013 requires agency heads to ensure measures are put in place to collect certain personal information from each employee and provide this information to the
39

Commissioner. This requirement includes educational qualifications and diversity information for employees. As at June 2016, educational qualification data has been completed for 54.0% of ongoing employees, down from 56.3% at June 2015.
The following data is expressed as a proportion of employees whose qualifications are known. Over time, the proportion of APS
employees with graduate qualifications has steadily increased. At June 2016, 61.3% of ongoing employees had graduate qualifications, up from 61.0% last year. At June 2007, the proportion of ongoing employees with graduate qualifications was 54.8%.
Length of service At June 2016, the median length of service for ongoing employees was 10.4 years, up from 9.8 years at June 2015.
Figure 11 shows that the proportion of ongoing employees with fewer than five years of service at June 2016 was 18.2%, the same as June 2015. This follows a steady decline from June 2009. The proportion with 30 or more years of service was 5.1% at June 2016, an increase from 4.4% at June 2002.
40

Length at level At June 2016, the median length at level for all ongoing employees was 6.3 years, the same as June 2015. At June 2012, the median was 4.4 years for all ongoing employees.
Figure 12 shows that, with the exception of SES, the median length at level has been steadily increasing for the past few years. For the APS 3–4 classifications, the median length at level was 7.4 years at June 2016, up from 7.1 years in 2015. SES employees showed the only decrease, with the median length at level of 5.4 years at June 2016, down from 5.8 years in 2015.
41

Table 10: Ongoing employees: base classification by sex, 30 June 2002 to 30 June 2016
June
Classification 2002 2003 2004 2005 2006 2007 2008 2009 2010 2011 2012 2013 2014 2015 2016
Men
Trainee 211 224 168 226 252 239 217 148 118 124 178 136 148 103 236Graduate 330 451 345 462 541 592 577 599 616 793 778 657 677 627 623APS 1 1060 987 904 575 627 580 466 406 380 407 382 338 363 320 262APS 2 3121 3161 3039 2038 1995 2083 1873 1734 1357 1245 1164 1084 1078 969 929APS 3 5999 7040 7043 6944 7715 7804 7512 7389 7124 6743 6183 5892 5376 4997 5287APS 4 10003 9768 9719 9325 9199 9648 9674 9565 9457 9217 9258 9412 9157 8919 8519APS 5 6879 7299 7630 7564 7996 8299 8380 8501 8592 8752 8852 8713 8432 8025 7994APS 6 11501 11979 12074 12071 12753 13148 13493 13532 13884 14272 14678 14530 14034 13323 13747EL 1 8275 9059 9388 10038 10677 11535 12289 12834 13318 14058 14507 14235 13486 12509 12118EL 2 5477 5620 5784 6032 6358 6847 7038 7321 7496 7669 7784 7599 6992 6337 6171SES 1 819 856 866 866 967 1071 1136 1173 1176 1196 1214 1182 1094 1026 1053SES 2 261 278 270 280 296 327 322 347 357 359 354 360 333 320 319SES 3 72 79 75 74 81 77 83 84 88 87 90 82 72 62 71Total men 54008 56801 57305 56495 59457 62250 63060 63633 63963 64922 65422 64220 61242 57537 57329
Women
Trainee 239 226 132 181 230 181 185 129 128 153 164 202 187 99 268Graduate 447 504 397 575 711 867 827 716 674 801 748 756 640 564 639APS 1 1055 987 786 664 1139 1131 724 557 463 533 464 404 422 366 280APS 2 4127 3937 3782 3623 3799 4083 3698 3331 2692 2595 2344 2140 2128 1850 1743APS 3 9025 11177 10897 10985 14299 14744 14233 14304 13615 12927 12013 11350 10396 9480 9813APS 4 18514 18965 19314 19236 19452 20735 21602 21848 21764 21476 21256 21126 20600 19923 19665APS 5 6420 7325 8035 8266 9638 10509 11176 11557 11886 12250 12628 12565 12276 11756 11913APS 6 10246 11191 11644 12247 13241 14506 15600 16287 16830 17488 17905 17986 17483 16761 17714EL 1 5313 6050 6688 7451 8616 9879 11132 11979 12612 13396 14076 14135 13375 12495 12519EL 2 2381 2600 2815 3031 3409 3827 4231 4537 4840 5154 5363 5427 5125 4710 4864SES 1 372 407 446 497 569 648 691 726 736 783 826 828 789 753 858SES 2 70 88 90 99 120 148 175 184 191 203 217 215 193 187 196SES 3 15 18 19 19 25 26 30 30 34 39 40 39 39 43 47Total women 58224 63475 65045 66874 75248 81284 84304 86185 86465 87798 88044 87173 83653 78987 80519
Total
Trainee 450 450 300 407 482 420 402 277 246 277 342 338 335 202 504Graduate 777 955 742 1037 1252 1459 1404 1315 1290 1594 1526 1413 1317 1191 1262APS 1 2115 1974 1690 1239 1766 1711 1190 963 843 940 846 742 785 686 542APS 2 7248 7098 6821 5661 5794 6166 5571 5065 4049 3840 3508 3224 3206 2819 2672APS 3 15024 18217 17940 17929 22014 22548 21745 21693 20739 19670 18196 17242 15772 14477 15100APS 4 28517 28733 29033 28561 28651 30383 31276 31413 31221 30693 30514 30538 29757 28842 28184APS 5 13299 14624 15665 15830 17634 18808 19556 20058 20478 21002 21480 21278 20708 19781 19907APS 6 21747 23170 23718 24318 25994 27654 29093 29819 30714 31760 32583 32516 31517 30084 31461EL 1 13588 15109 16076 17489 19293 21414 23421 24813 25930 27454 28583 28370 26861 25004 24637EL 2 7858 8220 8599 9063 9767 10674 11269 11858 12336 12823 13147 13026 12117 11047 11035SES 1 1191 1263 1312 1363 1536 1719 1827 1899 1912 1979 2040 2010 1883 1779 1911SES 2 331 366 360 379 416 475 497 531 548 562 571 575 526 507 515SES 3 87 97 94 93 106 103 113 114 122 126 130 121 111 105 118Total 112232 120276 122350 123369 134705 143534 147364 149818 150428 152720 153466 151393 144895 136524 137848Source: APSED
42

Table 11: Ongoing employees: paid classification by sex, 30 June 2007 to 30 June 2016
June
Classification 2007 2008 2009 2010 2011 2012 2013 2014 2015 2016
Men
Trainee 233 214 145 117 117 177 131 142 100 221Graduate 566 554 589 613 786 775 656 647 624 613APS 1 509 395 359 339 371 350 313 325 276 215APS 2 1844 1657 1553 1184 1120 1071 971 957 841 815APS 3 7324 7067 6998 6484 6183 5693 5319 4923 4302 4567APS 4 8801 8905 8668 8565 8312 8399 8666 8318 7753 7326APS 5 8463 8553 8749 8718 8769 8840 8669 8410 8035 8069APS 6 13464 13660 13717 14044 14400 14812 14647 14070 13551 13870EL 1 12054 12788 13274 13887 14689 15040 14801 14076 13247 12932EL 2 7365 7562 7792 8147 8292 8423 8215 7660 7155 7003SES 1 1196 1261 1316 1364 1377 1340 1331 1242 1202 1244SES 2 345 347 372 400 397 398 407 386 371 369SES 3 82 93 98 98 102 98 89 80 74 77Total men 62246 63056 63630 63960 64915 65416 64215 61236 57531 57321
Women
Trainee 176 181 127 125 150 160 197 184 98 261Graduate 818 793 695 660 794 745 754 624 557 627APS 1 1002 627 492 399 477 412 369 377 315 233APS 2 3654 3285 2999 2307 2229 2075 1881 1887 1537 1457APS 3 13818 13365 13611 12520 12008 11220 10392 9529 8429 8811APS 4 19328 20157 19866 19888 19649 19472 19441 18891 17680 17193APS 5 11322 11896 12443 12671 12761 13054 12902 12689 12294 12628APS 6 15210 16220 16889 17417 18036 18567 18668 18217 17639 18358EL 1 10647 11995 12811 13708 14567 15034 15146 14252 13618 13814EL 2 4387 4786 5191 5607 5913 6049 6136 5779 5601 5798SES 1 728 778 823 899 930 971 999 938 943 1054SES 2 164 185 201 224 232 236 239 234 223 226SES 3 29 33 34 38 46 43 43 46 48 51Total women 81283 84301 86182 86463 87792 88038 87167 83647 78982 80511
Total
Trainee 409 395 272 242 267 337 328 326 198 482Graduate 1384 1347 1284 1273 1580 1520 1410 1271 1181 1240APS 1 1511 1022 851 738 848 762 682 702 591 448APS 2 5498 4942 4552 3491 3349 3146 2852 2844 2378 2272APS 3 21142 20432 20609 19004 18191 16913 15711 14452 12731 13378APS 4 28129 29062 28534 28453 27961 27871 28107 27209 25433 24519APS 5 19785 20449 21192 21389 21530 21894 21571 21099 20329 20697APS 6 28674 29880 30606 31461 32436 33379 33315 32287 31190 32228EL 1 22701 24783 26085 27595 29256 30074 29947 28328 26865 26746EL 2 11752 12348 12983 13754 14205 14472 14351 13439 12756 12801SES 1 1924 2039 2139 2263 2307 2311 2330 2180 2145 2298SES 2 509 532 573 624 629 634 646 620 594 595SES 3 111 126 132 136 148 141 132 126 122 128Total 143529 147357 149812 150423 152707 153454 151382 144883 136513 137832Source: APSEDNote: Employees on temporary assignment as an agency head are excluded from this table.
43

Table 12: Ongoing employees: length of service by sex, 30 June 2002 to 30 June 2016
June
Length of service (years) 2002 2003 2004 2005 2006 2007 2008 2009 2010 2011 2012 2013 2014 2015 2016
Men
Under 1 3612 4177 2441 3254 5190 5263 4169 3496 3013 3847 3565 2166 1388 932 26561 and < 2 4087 4014 4396 2616 3681 5536 5502 4457 3677 3438 4073 3777 2213 1374 13812 and < 3 4321 4083 3960 4085 2573 3519 5247 5337 4347 3651 3447 3995 3664 2052 15483 and < 5 4271 6821 8022 7197 7228 6111 5580 8166 9889 9037 7464 6648 6984 7016 54125 and < 10 8070 7964 8694 10507 11892 13298 14742 14293 13827 15096 16651 16962 17532 17110 1605510 and < 15 8838 8489 8311 7303 6953 6632 6431 6895 8579 9546 10708 12021 11567 10981 1197915 and < 20 7847 7668 7384 7323 7406 7019 6646 6424 5854 5518 5222 5052 5252 6479 722120 and < 30 8935 9309 9661 9690 10232 10504 10373 10258 10511 10675 10249 9507 8780 7986 756430 and over 4027 4276 4436 4520 4302 4368 4370 4307 4266 4114 4043 4092 3862 3607 3513Total men 54008 56801 57305 56495 59457 62250 63060 63633 63963 64922 65422 64220 61242 57537 57329
Women
Under 1 3849 5873 3014 4348 10047 7789 6135 4966 3480 4246 3799 2595 1594 955 36651 and < 2 6322 4937 6437 3668 5250 10889 8577 6902 5482 4555 4968 4325 2709 1581 18572 and < 3 6154 6361 4956 6267 3698 5311 10350 8298 6872 5487 4540 5013 4241 2545 19673 and < 5 6426 9861 11789 10485 10557 9316 8389 14661 17346 14239 11546 9424 8906 8447 66205 and < 10 9876 10147 11686 14801 17911 19674 22262 21436 20860 24553 27375 27880 28711 27429 2361810 and < 15 10668 10299 9991 8791 8118 8143 8309 9388 12001 14378 15609 17862 17214 16626 1956315 and < 20 8749 8578 8706 9242 9253 8594 8202 7832 6915 6348 6295 6403 7104 9011 1092520 and < 30 5319 6389 7237 7884 8951 9903 10226 10644 11279 11558 11292 10528 9861 9129 874030 and over 861 1030 1229 1388 1463 1665 1854 2058 2230 2434 2620 3143 3313 3264 3564Total women 58224 63475 65045 66874 75248 81284 84304 86185 86465 87798 88044 87173 83653 78987 80519
Total
Under 1 7461 10050 5455 7602 15237 13052 10304 8462 6493 8093 7364 4761 2982 1887 63211 and < 2 10409 8951 10833 6284 8931 16425 14079 11359 9159 7993 9041 8102 4922 2955 32382 and < 3 10475 10444 8916 10352 6271 8830 15597 13635 11219 9138 7987 9008 7905 4597 35153 and < 5 10697 16682 19811 17682 17785 15427 13969 22827 27235 23276 19010 16072 15890 15463 120325 and < 10 17946 18111 20380 25308 29803 32972 37004 35729 34687 39649 44026 44842 46243 44539 3967310 and < 15 19506 18788 18302 16094 15071 14775 14740 16283 20580 23924 26317 29883 28781 27607 3154215 and < 20 16596 16246 16090 16565 16659 15613 14848 14256 12769 11866 11517 11455 12356 15490 1814620 and < 30 14254 15698 16898 17574 19183 20407 20599 20902 21790 22233 21541 20035 18641 17115 1630430 and over 4888 5306 5665 5908 5765 6033 6224 6365 6496 6548 6663 7235 7175 6871 7077Total 112232 120276 122350 123369 134705 143534 147364 149818 150428 152720 153466 151393 144895 136524 137848Source: APSED
44

Table 13: Ongoing employees: age group by sex, 30 June 2002 to 30 June 2016
June
Age group (years) 2002 2003 2004 2005 2006 2007 2008 2009 2010 2011 2012 2013 2014 2015 2016
Men
Under 20 70 86 69 62 89 107 108 76 47 51 90 70 56 40 5220-24 1773 2067 1906 1816 2169 2469 2443 2353 2077 2088 1972 1680 1333 1019 121925-29 4799 5033 4908 4685 5162 5716 5904 6076 6302 6473 6432 6068 5389 4564 447330-34 6506 6924 6894 6665 6893 7076 7016 6988 6946 7302 7588 7749 7535 7040 703335-39 7518 7557 7481 7376 7849 8248 8368 8485 8425 8257 8199 7972 7712 7329 750940-44 9582 9884 9613 9109 9159 8996 8853 8739 8781 8929 9120 8984 8689 8314 813645-49 9943 10165 10358 10235 10466 10708 10710 10427 10137 9931 9563 9206 8820 8439 846950-54 8926 9421 9665 9645 10088 10401 10494 10647 10637 10714 10732 10581 10020 9408 902555-59 3592 4119 4590 4916 5308 5715 5963 6185 6526 6850 7026 7107 6972 6748 673960 and over 1299 1545 1821 1986 2274 2814 3201 3657 4085 4327 4700 4803 4716 4636 4674Total men 54008 56801 57305 56495 59457 62250 63060 63633 63963 64922 65422 64220 61242 57537 57329
Women
Under 20 106 102 83 82 167 234 177 168 130 140 137 117 76 54 8220-24 3256 3736 3230 3037 3609 4337 4505 4338 3856 3740 3360 2850 2129 1497 182325-29 8251 8946 8796 8740 9846 10785 10982 10989 10791 10817 10518 9924 8632 7297 718330-34 9395 10409 10648 10903 11571 12134 12272 12459 12422 12746 12887 12713 12122 11262 1128835-39 9597 9965 10049 10118 11404 12297 12852 13094 13220 12935 12814 12610 12370 11800 1211140-44 9589 10367 10622 10965 11934 12230 12311 12254 12110 12517 12730 12893 12593 12323 1218845-49 8095 8734 9276 9741 11128 12098 12701 13040 13049 12957 12685 12364 11922 11324 1170450-54 6334 6929 7397 7765 8846 9562 10149 10705 11096 11557 11989 12246 12084 11741 1166555-59 2777 3265 3709 4093 4991 5397 5818 6214 6531 6794 7055 7342 7498 7488 794360 and over 824 1022 1235 1430 1752 2210 2537 2924 3260 3595 3869 4114 4227 4201 4532Total women 58224 63475 65045 66874 75248 81284 84304 86185 86465 87798 88044 87173 83653 78987 80519
Total
Under 20 176 188 152 144 256 341 285 244 177 191 227 187 132 94 13420-24 5029 5803 5136 4853 5778 6806 6948 6691 5933 5828 5332 4530 3462 2516 304225-29 13050 13979 13704 13425 15008 16501 16886 17065 17093 17290 16950 15992 14021 11861 1165630-34 15901 17333 17542 17568 18464 19210 19288 19447 19368 20048 20475 20462 19657 18302 1832135-39 17115 17522 17530 17494 19253 20545 21220 21579 21645 21192 21013 20582 20082 19129 1962040-44 19171 20251 20235 20074 21093 21226 21164 20993 20891 21446 21850 21877 21282 20637 2032445-49 18038 18899 19634 19976 21594 22806 23411 23467 23186 22888 22248 21570 20742 19763 2017350-54 15260 16350 17062 17410 18934 19963 20643 21352 21733 22271 22721 22827 22104 21149 2069055-59 6369 7384 8299 9009 10299 11112 11781 12399 13057 13644 14081 14449 14470 14236 1468260 and over 2123 2567 3056 3416 4026 5024 5738 6581 7345 7922 8569 8917 8943 8837 9206Total 112232 120276 122350 123369 134705 143534 147364 149818 150428 152720 153466 151393 144895 136524 137848Source: APSED
45

Table 14: Ongoing employees: agency by base classification group, 30 June 2015 and 2016 *
ClassificationTrainee & Graduate APS 1-2 APS 3-4 APS 5-6 EL SES Total
Agency 2015 2016 2015 2016 2015 2016 2015 2016 2015 2016 2015 2016 2015 2016Agriculture and Water Resources 28 2 26 20 1845 1811 1274 1484 880 1014 77 93 4130 4424- Australian Fisheries Management Authority 2 2 4 3 38 29 76 73 51 52 2 2 173 161- APVMA . . . . 22 20 50 76 69 76 5 4 146 176- Murray Darling Basin Authority 8 13 2 2 26 15 99 127 124 126 12 9 271 292Attorney-General's 36 49 13 14 151 210 549 584 511 615 65 168 1325 1640- Administrative Appeals Tribunal . . 1 16 45 192 25 138 32 84 1 3 104 433- ACLEI . . . . 1 1 8 13 12 20 2 2 23 36- AUSTRAC . . . . 27 29 128 155 113 149 7 9 275 342- Australian Crime Commission . . 2 1 100 112 150 156 271 279 11 8 534 556- Australian Financial Security Authority . . 4 13 166 167 145 174 90 98 6 7 411 459- Australian Human Rights Commission . 4 . . 22 22 30 33 41 37 3 3 96 99- Australian Law Reform Commission . . . . 2 2 4 3 5 4 1 1 12 10- Commonwealth DPP . . 13 8 117 96 78 84 164 183 21 21 393 392- CrimTrac Agency 1 5 1 2 32 30 75 88 87 97 2 2 198 224- Family Court and Federal Circuit Court . . 38 41 235 234 152 156 167 161 7 5 599 597- Federal Court of Australia . . 10 6 78 76 116 136 61 68 8 7 273 293- National Archives of Australia . . 40 40 94 91 150 137 77 84 4 4 365 356- OAIC . . . . 5 4 32 43 20 22 2 2 59 71- Office of Parliamentary Counsel . . . . 13 8 29 34 34 34 19 21 95 97Communications and the Arts 6 8 3 1 41 58 135 210 175 234 28 31 388 542- ACMA . . . . 29 31 174 162 237 221 15 14 455 428- Australian National Maritime Museum . . 1 1 31 31 38 35 17 27 . . 87 94- National Film and Sound Archive . . 7 5 59 53 68 62 28 29 1 2 163 151- National Library of Australia 4 4 29 25 154 142 131 139 95 88 6 5 419 403- National Museum of Australia . . 39 37 44 44 80 77 44 47 3 2 210 207- National Portrait Gallery . . 1 1 7 12 18 15 17 15 . . 43 43- Old Parliament House . . . . 18 20 20 23 16 17 1 1 55 61- Screen Australia . . . . 1 1 7 4 8 7 . . 16 12Defence 276 392 1036 950 3978 3667 8713 8402 5731 4932 130 113 19864 18456- Defence Housing Australia . . . . 182 217 135 176 98 143 7 8 422 544Education and Training 26 57 2 3 155 182 649 889 744 832 55 74 1631 2037- AIATSIS . . 3 1 11 42 25 48 19 29 1 1 59 121- Australian Research Council . . . 1 3 3 57 54 50 55 1 2 111 115- Australian Skills Quality Authority . . . . 20 15 82 78 68 69 . 2 170 164- TEQSA . . . . 2 2 25 22 29 25 . . 56 49Employment 32 50 3 3 252 231 750 831 705 718 57 56 1799 1889- Asbestos Safety and Eradication Agency . . . . . . 1 1 5 6 . . 6 7- Comcare 4 5 27 26 144 148 270 285 143 150 7 8 595 622- Fair Work Commission . . 4 4 56 44 138 145 57 55 4 4 259 252- OFWBII 1 . . . 23 27 58 57 34 40 6 7 122 131- Office of the Fair Work Ombudsman 11 4 3 4 201 205 394 409 132 128 12 10 753 760- Safe Work Australia 1 1 . . 8 5 39 40 54 50 2 4 104 100- Workplace Gender Equality Agency . . . . 1 2 14 13 7 9 . 1 22 25Environment 18 30 43 34 291 274 856 899 806 688 60 57 2074 1982- Bureau of Meteorology 24 20 12 13 201 195 579 577 600 617 19 18 1435 1440- Clean Energy Regulator 4 5 . 3 30 33 140 153 114 125 12 11 300 330- Climate Change Authority . . . 1 . . 7 8 9 8 2 1 18 18- GBRMPA . . 19 17 38 42 67 79 47 48 2 3 173 189Finance 25 22 45 46 197 175 493 510 604 625 74 74 1438 1452- Australian Electoral Commission . 5 133 132 187 212 303 312 140 167 9 10 772 838- Future Fund Management Agency . . . 2 18 29 35 49 35 40 4 4 92 124Foreign Affairs and Trade 89 76 8 5 167 174 1436 1441 1688 1742 254 257 3642 3695- ACIAR . . . . 11 13 12 12 7 7 1 1 31 33
46
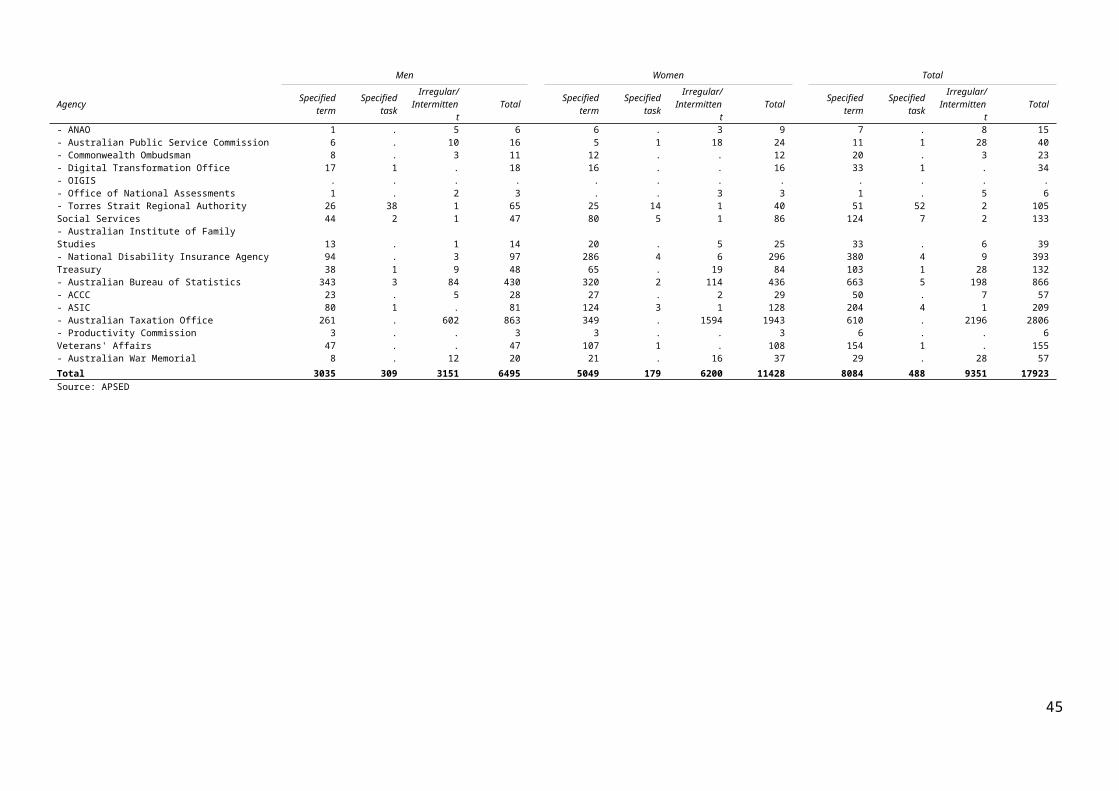
ClassificationTrainee & Graduate APS 1-2 APS 3-4 APS 5-6 EL SES Total
Agency 2015 2016 2015 2016 2015 2016 2015 2016 2015 2016 2015 2016 2015 2016- AUSTRADE . . . . 35 38 109 121 303 314 55 54 502 527Health 40 14 31 34 445 602 1240 2126 1394 1735 123 141 3273 4652- Australian Aged Care Quality Agency . . . . 55 46 172 139 24 18 . 3 251 206- ACSQHC . . . . 4 3 22 25 36 53 1 1 63 82- Australian Institute of Health and Welfare 4 9 1 2 28 27 123 136 137 137 8 6 301 317- ARPANSA . . 9 8 17 15 39 42 52 57 3 4 120 126- Australian Sports Anti-Doping Authority . . . . 11 8 18 17 14 14 2 3 45 42- Cancer Australia . . . . 4 . 27 35 15 17 2 3 48 55- FSANZ . . . . 7 5 30 32 57 56 2 1 96 94- Independent Hospital Pricing Authority . . . . 3 3 11 12 30 25 . . 44 40- National Blood Authority . . . . 2 6 15 19 24 25 1 1 42 51- NHMRC . . 1 1 32 25 69 76 72 83 7 6 181 191- National Health Funding Body . . . . 1 1 3 6 6 6 . . 10 13- National Health Performance Authority . . . . . . 10 1 25 5 2 . 37 6- National Mental Health Commission . . . . 1 2 2 4 5 7 . 1 8 14- Organ and Tissue Authority . . . . 2 . 10 9 9 12 2 2 23 23- Professional Services Review . . . . 2 4 7 6 7 5 1 1 17 16Human Services 150 283 428 349 18302 18897 8639 8499 3405 3436 165 162 31089 31626Immigration and Border Protection 52 166 37 64 2640 5010 3033 5504 1866 2621 109 148 7737 13513Industry, Innovation and Science 52 80 28 21 467 495 1856 1989 1598 1635 89 99 4090 4319- NOPSEMA . . . . 10 14 15 19 74 73 3 3 102 109Infrastructure and Regional Development 29 34 1 1 94 88 476 484 521 487 52 51 1173 1145- Australian Transport Safety Bureau . . . . 2 2 20 22 70 67 2 3 94 94- National Capital Authority . . 4 3 8 10 14 13 15 19 2 2 43 47Prime Minister and Cabinet 18 30 17 18 278 245 804 740 936 900 103 97 2156 2030- Aboriginal Hostels Ltd. 1 2 119 96 62 59 29 33 17 18 2 3 230 211- ANAO 13 18 3 4 47 47 111 103 132 127 26 28 332 327- Australian Public Service Commission . . 4 4 34 26 64 62 96 95 8 10 206 197- Commonwealth Ombudsman . . . . 33 35 47 57 49 50 5 4 134 146- Digital Transformation Office . . . . . 1 . 9 . 24 . 2 . 36- OIGIS . . . . . . 5 4 9 8 1 1 15 13- Office of National Assessments . . . . 15 7 38 37 64 76 14 11 131 131- Torres Strait Regional Authority . . 8 6 5 6 15 18 16 13 . . 44 43Social Services 54 63 63 29 482 195 1702 1013 1225 865 105 64 3631 2229- Australian Institute of Family Studies . . 1 1 3 4 12 12 25 26 . . 41 43- National Disability Insurance Agency . . 4 6 117 199 434 627 168 245 19 36 742 1113Treasury 51 61 44 36 108 104 419 393 401 451 89 89 1112 1134- Australian Bureau of Statistics 44 131 11 9 646 459 1214 1391 599 672 36 43 2550 2705- ACCC 9 32 1 . 62 63 312 326 309 347 40 42 733 810- ASIC 31 22 85 124 206 199 353 394 774 818 3 3 1452 1560- Australian Taxation Office 190 42 902 821 6379 6323 5739 5839 4845 4336 205 217 18260 17578- National Competition Council . . . . . . . . . . 1 . 1 .- Productivity Commission 5 7 . . 15 13 41 46 85 85 14 15 160 166Veterans' Affairs 17 18 82 67 490 467 915 909 387 361 31 29 1922 1851- Australian War Memorial . . 21 29 60 53 113 108 50 52 3 3 247 245ComSuper (NC) . . 5 . 94 . 128 . 75 . 3 . 305 .Customs & Border Protection (NC) 36 . 18 . 2281 . 2176 . 599 . 21 . 5131 .MRT - RRT (NC) 1 . 5 . 146 . 98 . 37 . 3 . 290 .Private Health Insurance Ombudsman (NC) . . . . 1 . 6 . 5 . . . 12 .Australian Institute of Criminology (NC) . . . . 4 . 8 . 9 . . . 21 .TUSMA (NC) . . . . . . 3 . 8 . . . 11 .Total 1393 1766 3505 3214 43319 43284 49865 51368 36051 35672 2391 2544 136524 137848Source: APSED* A number of agencies were affected by machinery-of-government changes during 2015-16. Appendixes 3 and 4 should be noted when making comparisons between the two years' data.
47

Table 15: Ongoing employees: agency retention, 30 June 2015 to 30 June 2016 *
Agency Ongoing employeesat 30 June 2015
Ongoing employeesretained at 30 June 2016 % retained % not retained
ACCC 733 683 93.2 6.8ACIAR 31 24 77.4 22.6ACLEI 23 21 91.3 8.7ACMA 455 407 89.5 10.5ACSQHC 63 55 87.3 12.7AIATSIS 59 42 71.2 28.8ANAO 332 265 79.8 20.2APVMA 146 115 78.8 21.2ARPANSA 120 109 90.8 9.2ASIC 1452 1328 91.5 8.5AUSTRAC 275 240 87.3 12.7AUSTRADE 502 448 89.2 10.8Aboriginal Hostels Ltd. 230 189 82.2 17.8Administrative Appeals Tribunal 104 90 86.5 13.5Agriculture and Water Resources 4130 3873 93.8 6.2Asbestos Safety and Eradication Agency 6 6 100.0 0.0Attorney-General's 1151 913 79.3 20.7Australian Aged Care Quality Agency 251 197 78.5 21.5Australian Bureau of Statistics 2550 2365 92.7 7.3Australian Crime Commission 534 471 88.2 11.8Australian Electoral Commission 772 663 85.9 14.1Australian Financial Security Authority 411 364 88.6 11.4Australian Fisheries Management Authority 173 146 84.4 15.6Australian Human Rights Commission 96 82 85.4 14.6Australian Institute of Family Studies 41 38 92.7 7.3Australian Institute of Health and Welfare 301 262 87.0 13.0Australian Law Reform Commission 12 10 83.3 16.7Australian National Maritime Museum 87 76 87.4 12.6Australian Public Service Commission 206 168 81.6 18.4Australian Research Council 111 95 85.6 14.4Australian Skills Quality Authority 170 143 84.1 15.9Australian Sports Anti-Doping Authority 45 36 80.0 20.0Australian Taxation Office 18260 16867 92.4 7.6Australian Transport Safety Bureau 94 85 90.4 9.6Australian War Memorial 247 213 86.2 13.8Bureau of Meteorology 1435 1340 93.4 6.6Cancer Australia 48 41 85.4 14.6Clean Energy Regulator 300 241 80.3 19.7Climate Change Authority 18 14 77.8 22.2Comcare 595 504 84.7 15.3Commonwealth DPP 393 331 84.2 15.8Commonwealth Ombudsman 134 108 80.6 19.4Communications and the Arts 354 266 75.1 24.9CrimTrac Agency 198 172 86.9 13.1Defence 19864 17771 89.5 10.5Defence Housing Australia 422 388 91.9 8.1Education and Training 1631 1465 89.8 10.2Employment 1799 1622 90.2 9.8Environment 1924 1685 87.6 12.4FSANZ 96 87 90.6 9.4Fair Work Commission 259 222 85.7 14.3Family Court and Federal Circuit Court 599 533 89.0 11.0Federal Court of Australia 273 246 90.1 9.9Finance 1421 1235 86.9 13.1
48

Agency Ongoing employeesat 30 June 2015
Ongoing employeesretained at 30 June 2016 % retained % not retained
Foreign Affairs and Trade 3642 3457 94.9 5.1Future Fund Management Agency 92 85 92.4 7.6GBRMPA 173 164 94.8 5.2Health 3273 2894 88.4 11.6Human Services 30738 28973 94.3 5.7Immigration and Border Protection 7737 7091 91.7 8.3Independent Hospital Pricing Authority 44 31 70.5 29.5Industry, Innovation and Science 4045 3678 90.9 9.1Infrastructure and Regional Development 1165 978 83.9 16.1Murray Darling Basin Authority 271 226 83.4 16.6NHMRC 181 159 87.8 12.2NOPSEMA 102 98 96.1 3.9National Archives of Australia 365 326 89.3 10.7National Blood Authority 42 37 88.1 11.9National Capital Authority 43 37 86.0 14.0National Disability Insurance Agency 742 679 91.5 8.5National Film and Sound Archive 163 132 81.0 19.0National Health Funding Body 10 7 70.0 30.0National Health Performance Authority 35 6 17.1 82.9National Library of Australia 419 372 88.8 11.2National Mental Health Commission 8 5 62.5 37.5National Museum of Australia 210 189 90.0 10.0National Portrait Gallery 43 37 86.0 14.0OAIC 59 46 78.0 22.0OFWBII 122 104 85.2 14.8OIGIS 15 10 66.7 33.3Office of National Assessments 131 106 80.9 19.1Office of Parliamentary Counsel 95 88 92.6 7.4Office of the Fair Work Ombudsman 753 691 91.8 8.2Old Parliament House 55 45 81.8 18.2Organ and Tissue Authority 23 17 73.9 26.1Prime Minister and Cabinet 2156 1745 80.9 19.1Productivity Commission 160 138 86.3 13.8Professional Services Review 17 11 64.7 35.3Safe Work Australia 104 76 73.1 26.9Screen Australia 16 12 75.0 25.0Social Services 2293 1940 84.6 15.4TEQSA 56 43 76.8 23.2Torres Strait Regional Authority 44 35 79.5 20.5Treasury 1112 968 87.1 12.9Veterans' Affairs 1922 1718 89.4 10.6Workplace Gender Equality Agency 22 16 72.7 27.3Source: APSED* Employees affected by machinery-of-government changes during 2015-16 are not included in this table. Appendixes 3 and 4 should be noted when making comparisons between the two years' data.
49

Table 16: Ongoing employees: agency by age group, 30 June 2016
Age group
Agency Under 20 20-24 25-29 30-34 35-39 40-44 45-49 50-54 55-59 60 and over Total
Agriculture and Water Resources 1 83 338 564 663 666 615 632 503 359 4424- Australian Fisheries Management Authority . 2 17 26 23 29 22 21 10 11 161- APVMA . 6 15 25 24 26 26 26 14 14 176- Murray Darling Basin Authority . 9 30 41 47 48 39 36 26 16 292Attorney-General's 1 60 297 331 284 191 176 136 94 70 1640- Administrative Appeals Tribunal . 1 32 55 61 60 72 59 58 35 433- ACLEI . 1 2 3 11 9 5 4 1 . 36- AUSTRAC . 1 21 65 75 47 52 45 24 12 342- Australian Crime Commission . 11 36 100 84 89 83 66 48 39 556- Australian Financial Security Authority . 6 54 90 70 74 61 51 33 20 459- Australian Human Rights Commission . . 13 16 20 19 8 14 5 4 99- Australian Law Reform Commission . . . 1 1 3 3 1 . 1 10- Commonwealth DPP 1 4 53 66 72 57 44 48 30 17 392- CrimTrac Agency . 6 27 51 37 30 30 20 10 13 224- Family Court and Federal Circuit Court . 6 52 59 74 69 93 84 72 88 597- Federal Court of Australia . 3 15 37 38 35 47 43 44 31 293- National Archives of Australia 1 . 11 33 37 56 57 81 45 35 356- OAIC . 1 13 21 16 8 6 3 3 . 71- Office of Parliamentary Counsel . 2 5 16 14 18 15 10 11 6 97Communications and the Arts . 19 71 100 79 97 64 58 37 17 542- ACMA . . 13 54 71 69 74 68 49 30 428- Australian National Maritime Museum . . 2 11 5 19 14 13 18 12 94- National Film and Sound Archive . 2 12 15 20 24 26 21 18 13 151- National Library of Australia . 3 25 51 40 62 66 63 54 39 403- National Museum of Australia . 1 7 21 25 33 38 31 24 27 207- National Portrait Gallery . 1 7 5 7 4 7 7 3 2 43- Old Parliament House . . 6 10 6 8 8 11 8 4 61- Screen Australia . . . 1 2 1 3 . 4 1 12Defence 17 347 1243 1935 2013 2251 2878 3331 2638 1803 18456- Defence Housing Australia . 4 69 98 94 85 67 69 32 26 544Education and Training 3 65 156 317 308 291 325 267 197 108 2037- AIATSIS . 4 17 19 9 11 20 19 11 11 121- Australian Research Council . 4 16 17 23 20 15 9 9 2 115- Australian Skills Quality Authority . 1 13 17 24 24 21 18 28 18 164- TEQSA . 1 2 10 12 8 1 8 5 2 49Employment . 47 227 323 275 300 234 209 170 104 1889- Asbestos Safety and Eradication Agency . . 2 2 . . 1 . 1 1 7- Comcare . 11 95 116 85 80 76 73 64 22 622- Fair Work Commission . . 36 51 31 20 33 27 27 27 252- OFWBII . . 12 26 24 16 15 15 13 10 131- Office of the Fair Work Ombudsman . 12 87 185 155 111 68 62 49 31 760- Safe Work Australia . 2 14 22 19 10 11 12 5 5 100- Workplace Gender Equality Agency . . 4 2 4 2 4 8 1 . 25Environment 1 52 193 324 315 336 301 240 139 81 1982- Bureau of Meteorology 1 23 78 163 195 203 210 268 182 117 1440- Clean Energy Regulator 2 8 57 59 52 42 28 44 25 13 330- Climate Change Authority . . 3 6 5 2 . 2 . . 18- GBRMPA . . 10 22 27 39 45 24 15 7 189Finance 25 70 201 222 208 181 199 177 111 58 1452- Australian Electoral Commission 1 14 53 69 94 101 141 148 122 95 838- Future Fund Management Agency . 3 13 30 24 20 21 6 7 . 124Foreign Affairs and Trade 1 20 307 614 703 575 541 449 304 181 3695- ACIAR . . 3 6 2 6 6 5 2 3 33- AUSTRADE . 5 34 77 75 73 97 81 56 29 527Health 4 117 460 647 669 650 651 651 488 315 4652
50

Age group
Agency Under 20 20-24 25-29 30-34 35-39 40-44 45-49 50-54 55-59 60 and over Total
- Australian Aged Care Quality Agency . . 3 17 18 18 19 39 41 51 206- ACSQHC . 1 6 14 15 13 7 7 14 5 82- Australian Institute of Health and Welfare . 7 39 45 50 42 41 41 37 15 317- ARPANSA . . 2 14 15 18 20 17 21 19 126- Australian Sports Anti-Doping Authority . . 4 6 5 8 10 7 2 . 42- Cancer Australia . . 9 17 4 6 4 7 5 3 55- FSANZ . . 4 13 11 12 8 19 13 14 94- Independent Hospital Pricing Authority . . 8 17 6 2 3 1 3 . 40- National Blood Authority . 3 4 6 7 11 7 5 7 1 51- NHMRC . 4 25 39 32 23 24 19 16 9 191- National Health Funding Body . 1 1 4 2 2 . 1 . 2 13- National Health Performance Authority . . . 1 1 . . 1 3 . 6- National Mental Health Commission . . 1 4 2 3 . 2 2 . 14- Organ and Tissue Authority . . 2 6 2 3 3 4 2 1 23- Professional Services Review . 1 . 4 2 3 2 1 . 3 16Human Services 32 718 1894 3735 4440 5417 4899 4815 3570 2106 31626Immigration and Border Protection 11 262 1186 1979 2295 2118 1968 1892 1116 686 13513Industry, Innovation and Science 3 99 458 704 691 619 525 602 368 250 4319- NOPSEMA . 1 6 16 12 13 17 16 15 13 109Infrastructure and Regional Development 1 31 135 192 168 149 173 137 108 51 1145- Australian Transport Safety Bureau . . 5 9 12 14 15 16 13 10 94- National Capital Authority . 2 4 13 5 3 6 6 5 3 47Prime Minister and Cabinet 2 51 236 350 293 248 287 246 195 122 2030- Aboriginal Hostels Ltd. 3 4 7 16 15 31 26 39 32 38 211- ANAO . 13 57 50 42 45 40 39 23 18 327- Australian Public Service Commission . 6 12 26 39 19 26 39 21 9 197- Commonwealth Ombudsman . 2 21 24 26 23 15 12 10 13 146- Digital Transformation Office . . 4 10 5 4 3 5 2 3 36- OIGIS . . 1 3 2 2 2 1 1 1 13- Office of National Assessments . . 10 24 17 18 18 22 10 12 131- Torres Strait Regional Authority . . 3 5 10 8 3 7 1 6 43Social Services 8 91 235 316 269 314 337 334 206 119 2229- Australian Institute of Family Studies . . 1 2 11 9 5 8 2 5 43- National Disability Insurance Agency . 21 98 172 156 182 167 165 109 43 1113Treasury . 41 199 221 197 138 133 88 65 52 1134- Australian Bureau of Statistics 1 105 407 421 394 417 343 325 205 87 2705- ACCC . 26 148 170 153 117 71 58 39 28 810- ASIC . 49 171 253 262 223 204 186 137 75 1560- Australian Taxation Office 14 426 1516 1914 2346 2418 2657 3189 2010 1088 17578- Productivity Commission . 5 23 28 30 19 19 25 11 6 166Veterans' Affairs . 29 116 169 171 243 270 339 276 238 1851- Australian War Memorial . 5 16 45 36 41 33 34 19 16 245Total 134 3042 11656 18321 19620 20324 20173 20690 14682 9206 137848Source: APSED
51

Table 17: Ongoing employees: agency by location, 30 June 2016
Location
Agency ACT NSW Vic Qld SA WA Tas NT O'seas TotalAgriculture and Water Resources 2090 730 530 591 186 236 8 53 . 4424- Australian Fisheries Management Authority 133 . . 2 . . . 26 . 161- APVMA 175 . . . . 1 . . . 176- Murray Darling Basin Authority 291 . . 1 . . . . . 292Attorney-General's 1294 128 100 52 24 31 3 5 3 1640- Administrative Appeals Tribunal 6 224 132 39 16 12 4 . . 433- ACLEI 35 1 . . . . . . . 36- AUSTRAC 50 184 90 15 2 1 . . . 342- Australian Crime Commission 190 125 105 78 27 28 1 1 1 556- Australian Financial Security Authority 103 80 78 84 106 1 7 . . 459- Australian Human Rights Commission . 99 . . . . . . . 99- Australian Law Reform Commission . 10 . . . . . . . 10- Commonwealth DPP 49 135 83 62 21 30 8 4 . 392- CrimTrac Agency 224 . . . . . . . . 224- Family Court and Federal Circuit Court 87 204 126 108 46 2 17 7 . 597- Federal Court of Australia 3 89 59 46 18 69 5 4 . 293- National Archives of Australia 143 158 27 9 4 10 3 2 . 356- OAIC . 71 . . . . . . . 71- Office of Parliamentary Counsel 97 . . . . . . . . 97Communications and the Arts 465 53 14 2 3 1 . 4 . 542- ACMA 140 115 162 10 . . 1 . . 428- Australian National Maritime Museum . 94 . . . . . . . 94- National Film and Sound Archive 129 16 6 . . . . . . 151- National Library of Australia 403 . . . . . . . . 403- National Museum of Australia 207 . . . . . . . . 207- National Portrait Gallery 43 . . . . . . . . 43- Old Parliament House 61 . . . . . . . . 61- Screen Australia . 12 . . . . . . . 12Defence 7441 3013 3652 1336 2057 489 75 268 125 18456- Defence Housing Australia 215 117 25 110 38 16 . 23 . 544Education and Training 1787 62 56 40 33 33 11 15 . 2037- AIATSIS 121 . . . . . . . . 121- Australian Research Council 115 . . . . . . . . 115- Australian Skills Quality Authority 15 36 44 46 13 5 3 2 . 164- TEQSA . . 49 . . . . . . 49Employment 1521 151 51 68 43 29 15 11 . 1889- Asbestos Safety and Eradication Agency . 7 . . . . . . . 7- Comcare 416 23 137 18 13 15 . . . 622- Fair Work Commission 2 45 167 14 10 9 3 2 . 252- OFWBII 4 23 52 19 8 19 1 5 . 131- Office of the Fair Work Ombudsman 56 231 242 90 76 35 26 4 . 760- Safe Work Australia 100 . . . . . . . . 100- Workplace Gender Equality Agency . 25 . . . . . . . 25Environment 1536 28 3 8 2 21 261 123 . 1982- Bureau of Meteorology 82 140 787 122 67 112 66 64 . 1440- Clean Energy Regulator 330 . . . . . . . . 330- Climate Change Authority . . 18 . . . . . . 18- GBRMPA 4 . . 185 . . . . . 189Finance 1411 12 11 8 4 4 1 1 . 1452- Australian Electoral Commission 302 162 132 104 38 63 23 14 . 838- Future Fund Management Agency 1 . 123 . . . . . . 124Foreign Affairs and Trade 2515 71 7 55 21 42 13 11 960 3695- ACIAR 33 . . . . . . . . 33- AUSTRADE 234 154 43 15 6 5 1 1 68 527Health 3660 320 254 165 94 76 54 29 . 4652
52

Location
Agency ACT NSW Vic Qld SA WA Tas NT O'seas Total- Australian Aged Care Quality Agency . 91 48 29 23 13 2 . . 206- ACSQHC 1 81 . . . . . . . 82- Australian Institute of Health and Welfare 308 8 . 1 . . . . . 317- ARPANSA . 29 97 . . . . . . 126- Australian Sports Anti-Doping Authority 42 . . . . . . . . 42- Cancer Australia 6 44 5 . . . . . . 55- FSANZ 91 1 . . . . 2 . . 94- Independent Hospital Pricing Authority . 40 . . . . . . . 40- National Blood Authority 51 . . . . . . . . 51- NHMRC 177 . 14 . . . . . . 191- National Health Funding Body 13 . . . . . . . . 13- National Health Performance Authority . 6 . . . . . . . 6- National Mental Health Commission . 14 . . . . . . . 14- Organ and Tissue Authority 23 . . . . . . . . 23- Professional Services Review 16 . . . . . . . . 16Human Services 4496 8321 5912 6026 2613 1950 1775 533 . 31626Immigration and Border Protection 5454 2662 2001 1218 592 995 153 208 230 13513Industry, Innovation and Science 3426 377 301 63 37 89 16 8 2 4319- NOPSEMA 4 . 2 . . 103 . . . 109Infrastructure and Regional Development 965 57 27 31 18 33 2 4 8 1145- Australian Transport Safety Bureau 76 1 . 10 4 3 . . . 94- National Capital Authority 47 . . . . . . . . 47Prime Minister and Cabinet 1459 89 27 95 41 86 6 227 . 2030- Aboriginal Hostels Ltd. 48 30 6 43 11 21 . 52 . 211- ANAO 327 . . . . . . . . 327- Australian Public Service Commission 179 10 2 5 . 1 . . . 197- Commonwealth Ombudsman 81 16 15 12 19 3 . . . 146- Digital Transformation Office 34 2 . . . . . . . 36- OIGIS 13 . . . . . . . . 13- Office of National Assessments 131 . . . . . . . . 131- Torres Strait Regional Authority . . . 43 . . . . . 43Social Services 1816 100 91 76 47 47 31 21 . 2229- Australian Institute of Family Studies . . 43 . . . . . . 43- National Disability Insurance Agency 81 259 537 5 145 49 29 8 . 1113Treasury 1081 37 14 . . . . . 2 1134- Australian Bureau of Statistics 1371 222 435 195 203 132 112 35 . 2705- ACCC 246 101 336 52 41 22 6 6 . 810- ASIC 10 622 639 135 53 87 14 . . 1560- Australian Taxation Office 2399 4584 4428 3150 1545 939 527 6 . 17578- Productivity Commission 67 . 99 . . . . . . 166Veterans' Affairs 630 279 264 368 138 96 62 14 . 1851- Australian War Memorial 245 . . . . . . . . 245Total 53733 25231 22708 15059 8506 6064 3347 1801 1399 137848Source: APSED
53

Table 18: Ongoing employees: agency by paid classification, 30 June 2016
Classification
Agency Trainee Graduate APS 1 APS 2 APS 3 APS 4 APS 5 APS 6 EL 1 EL 2 SES 1 SES 2 SES 3 Total
Agriculture and Water Resources . 2 4 15 560 1083 693 851 670 443 78 21 4 4424- Australian Fisheries Management Authority 1 1 . 3 1 24 9 62 44 13 2 1 . 161- APVMA . . . . 8 11 19 55 49 30 4 . . 176- Murray Darling Basin Authority 2 11 . 1 1 11 38 78 87 51 7 4 . 291Attorney-General's 1 48 5 7 28 158 233 338 391 253 141 31 6 1640- Administrative Appeals Tribunal . . 1 9 45 127 56 88 58 43 6 . . 433- ACLEI . . . . . 2 3 9 14 6 2 . . 36- AUSTRAC . . . . 8 13 46 112 96 57 7 3 . 342- Australian Crime Commission . . . . 22 61 77 84 217 78 14 3 . 556- Australian Financial Security Authority . . . 10 89 49 73 116 84 29 9 . . 459- Australian Human Rights Commission . 2 . . 1 16 10 26 17 24 2 1 . 99- Australian Law Reform Commission . . . . . 2 . 3 3 1 1 . . 10- Commonwealth DPP . . 1 2 27 72 49 36 111 66 20 7 1 392- CrimTrac Agency . 5 2 . 3 23 40 50 84 15 2 . . 224- Family Court and Federal Circuit Court . . 1 34 127 94 130 43 106 56 4 2 . 597- Federal Court of Australia . . . 1 10 54 32 113 40 34 5 4 . 293- National Archives of Australia . . 9 16 30 56 65 77 70 28 4 . . 355- OAIC . . . . . 4 5 38 14 8 2 . . 71- Office of Parliamentary Counsel . . . . . 8 22 11 9 24 18 4 1 97Communications and the Arts . 8 . 1 7 43 56 144 175 75 24 7 2 542- ACMA . . . . 1 24 32 122 166 67 11 5 . 428- Australian National Maritime Museum . . . 1 7 22 11 22 23 8 . . . 94- National Film and Sound Archive . . . 3 17 30 34 33 21 11 2 . . 151- National Library of Australia . 4 . 17 50 80 69 81 68 29 5 . . 403- National Museum of Australia . . . 31 10 30 35 44 34 20 3 . . 207- National Portrait Gallery . . . . 8 3 6 11 12 3 . . . 43- Old Parliament House . . . . 11 7 13 12 11 6 1 . . 61- Screen Australia . . . . 1 . 1 3 3 4 . . . 12Defence 91 283 71 743 1507 1804 3068 5098 3807 1825 108 43 8 18456- Defence Housing Australia . . . . 96 98 101 84 91 66 5 3 . 544Education and Training 15 42 . 2 30 104 282 561 649 260 68 19 5 2037- AIATSIS . . . 1 8 30 24 25 23 8 2 . . 121- Australian Research Council . . . 1 . 1 25 27 39 19 2 1 . 115- Australian Skills Quality Authority . . . . 2 9 23 46 58 24 2 . . 164- TEQSA . . . . . 2 4 18 18 7 . . . 49Employment 7 43 . 3 36 164 308 473 558 225 55 14 3 1889- Asbestos Safety and Eradication Agency . . . . . . . . 5 2 . . . 7- Comcare . 5 1 8 35 97 125 166 124 53 6 1 . 621- Fair Work Commission . . . 4 3 31 35 112 22 41 4 . . 252- OFWBII . . . . 6 18 26 34 26 14 6 1 . 131- Office of the Fair Work Ombudsman . 4 . 3 58 118 240 174 110 40 10 2 1 760- Safe Work Australia . 1 . . . 4 13 26 37 15 3 . . 99- Workplace Gender Equality Agency . . . . . 2 3 9 5 5 . 1 . 25Environment 1 28 6 17 60 167 286 560 539 259 45 11 3 1982- Bureau of Meteorology 4 15 2 4 92 47 152 364 465 268 19 7 . 1439- Clean Energy Regulator . 5 3 . 5 23 56 91 88 46 9 4 . 330- Climate Change Authority . . 1 . . . 1 5 6 3 1 . . 17- GBRMPA . . 1 11 12 23 29 53 43 14 3 . . 189Finance . 22 18 17 55 106 205 282 429 226 71 16 5 1452- Australian Electoral Commission . 5 . 108 134 77 69 253 133 46 10 3 . 838- Future Fund Management Agency . . . 2 4 25 26 23 4 36 . 3 1 124Foreign Affairs and Trade 5 71 . 5 46 120 756 652 1171 563 232 62 12 3695- ACIAR . . . . . 11 8 6 6 1 . . . 32- AUSTRADE . . . . 3 31 19 95 171 147 42 16 2 526Health . 14 12 14 82 407 681 1331 1318 626 120 37 10 4652
54

Classification
Agency Trainee Graduate APS 1 APS 2 APS 3 APS 4 APS 5 APS 6 EL 1 EL 2 SES 1 SES 2 SES 3 Total
- Australian Aged Care Quality Agency . . . . 26 19 25 114 13 6 3 . . 206- ACSQHC . . . . . 2 4 16 42 17 . 1 . 82- Australian Institute of Health and Welfare . 9 . 1 2 22 49 80 104 42 8 . . 317- ARPANSA . . . 5 13 4 14 24 40 22 3 . . 125- Australian Sports Anti-Doping Authority . . . . . 7 8 7 13 4 2 1 . 42- Cancer Australia . . . . . . 8 25 12 7 2 1 . 55- FSANZ . . . . 1 3 9 22 34 22 3 . . 94- Independent Hospital Pricing Authority . . . . . . 2 9 20 8 1 . . 40- National Blood Authority . . . . . 4 8 10 22 6 . . . 50- NHMRC . . . 1 8 12 32 38 66 28 5 1 . 191- National Health Funding Body . . . . . 1 3 3 3 3 . . . 13- National Health Performance Authority . . . . . . . 1 2 3 . . . 6- National Mental Health Commission . . . . . 1 2 3 3 4 1 . . 14- Organ and Tissue Authority . . . . . . 2 6 7 6 . . . 21- Professional Services Review . . . . . 2 3 5 1 4 1 . . 16Human Services 186 96 126 162 3861 12419 4286 6153 3014 1123 154 37 8 31625Immigration and Border Protection 124 40 16 41 2537 1781 2846 2878 2289 771 139 42 8 13512Industry, Innovation and Science 22 58 3 16 71 327 483 1420 1195 609 85 23 7 4319- NOPSEMA . . . . 2 12 7 12 46 27 3 . . 109Infrastructure and Regional Development . 34 . 1 15 60 180 267 341 179 55 10 3 1145- Australian Transport Safety Bureau . . . . . 2 9 12 19 47 5 . . 94- National Capital Authority . . . 3 4 5 2 10 15 5 3 . . 47Prime Minister and Cabinet . 30 3 12 33 158 243 450 671 309 85 27 9 2030- Aboriginal Hostels Ltd. 2 . 70 15 58 9 13 19 17 5 3 . . 211- ANAO . 18 . 3 12 34 35 64 58 72 24 5 2 327- Australian Public Service Commission . . . 4 2 14 18 45 72 32 9 . 1 197- Commonwealth Ombudsman . . . . 11 17 25 29 44 15 5 . . 146- Digital Transformation Office . . . . . . 3 5 17 9 1 1 . 36- OIGIS . . . . . . 1 3 5 3 1 . . 13- Office of National Assessments . . . . . 3 12 27 38 37 11 2 . 130- Torres Strait Regional Authority . . . 3 3 3 10 9 8 6 . . . 42Social Services 9 54 6 13 24 130 274 682 650 306 62 15 4 2229- Australian Institute of Family Studies . . . 1 . 4 1 10 13 12 2 . . 43- National Disability Insurance Agency . . . 2 27 130 298 317 191 101 32 12 3 1113Treasury . 61 . 24 33 58 126 267 264 208 61 24 8 1134- Australian Bureau of Statistics . 118 3 3 51 308 566 837 577 197 32 9 4 2705- ACCC . 32 . . 10 48 128 170 211 163 36 11 1 810- ASIC . 19 14 89 75 115 49 321 380 474 23 1 . 1560- Australian Taxation Office 12 27 59 714 2973 2946 1951 4047 3214 1410 198 24 3 17578- Productivity Commission . 7 . . 2 9 16 30 48 37 14 2 1 166Veterans' Affairs . 18 10 38 149 201 466 502 306 125 25 9 2 1851- Australian War Memorial . . . 27 29 23 58 49 39 16 4 . . 245Total 482 1240 448 2272 13378 24519 20697 32228 26746 12801 2298 595 128 137832Source: APSEDNote: Employees on temporary assignment as an agency head have been excluded from this table.
55

Table 19: Ongoing employees: agency by temporary assignment classification, 30 June 2016
Classification
Agency APS 1 APS 2 APS 3 APS 4 APS 5 APS 6 EL 1 EL 2 SES 1 SES 2 SES 3 TotalAgriculture and Water Resources . . . 129 153 96 98 75 10 1 . 562- Australian Fisheries Management Authority . . . . . 5 6 . 1 . . 12- APVMA . . . . 1 2 2 3 . . . 8- Murray Darling Basin Authority . . . 1 1 9 15 10 3 1 . 40Attorney-General's . . 1 6 20 14 38 24 11 4 1 119- Administrative Appeals Tribunal . . . 7 15 16 16 14 3 . . 71- ACLEI . . . 1 . 1 1 . . . . 3- AUSTRAC . . . 1 7 3 5 5 1 1 . 23- Australian Crime Commission . . 1 4 21 20 26 18 9 2 . 101- Australian Financial Security Authority . . 3 11 25 20 17 4 2 . . 82- Australian Human Rights Commission . . . . 6 2 4 5 . . . 17- Australian Law Reform Commission . . . . . . . . . . . .- Commonwealth DPP . . 3 6 2 2 2 14 7 2 . 38- CrimTrac Agency . . . 1 4 3 2 . . . . 10- Family Court and Federal Circuit Court . . 6 18 20 6 1 1 1 . . 53- Federal Court of Australia . . 1 6 6 11 9 3 1 2 . 39- National Archives of Australia . 4 8 11 16 17 16 7 1 . . 80- OAIC . . . . . . . . . . . .- Office of Parliamentary Counsel . . . 1 . . 1 . 2 . . 4Communications and the Arts . . . . 7 18 18 6 2 . . 51- ACMA . . . . 6 7 13 11 2 1 . 40- Australian National Maritime Museum . . . . 1 3 4 . . . . 8- National Film and Sound Archive . . . 3 6 5 3 1 . . . 18- National Library of Australia . . 6 14 14 14 9 7 . . . 64- National Museum of Australia . . 2 4 6 7 8 3 1 . . 31- National Portrait Gallery . . 1 . 1 3 . . . . . 5- Old Parliament House . . . . 2 . . . . . . 2- Screen Australia . . . . . . . 1 . . . 1Defence . 21 92 207 367 619 738 348 41 6 . 2439- Defence Housing Australia . . . 6 19 5 12 7 . . . 49Education and Training . 1 . 10 46 44 95 82 18 5 1 302- AIATSIS . . . 3 2 4 2 1 1 . . 13- Australian Research Council . . . . 2 5 4 4 1 . . 16- Australian Skills Quality Authority . . . 2 3 7 13 3 . . . 28- TEQSA . . . . . 1 . . . . . 1Employment . . . 15 29 31 80 52 16 5 1 229- Asbestos Safety and Eradication Agency . . . . . . 1 . . . . 1- Comcare . . 8 24 25 34 26 14 . . . 131- Fair Work Commission . . . . 8 3 8 2 . . . 21- OFWBII . . . 2 3 1 . 1 . . . 7- Office of the Fair Work Ombudsman . . . 6 29 49 25 10 3 . . 122- Safe Work Australia . . . . 1 1 2 1 . . . 5- Workplace Gender Equality Agency . . . 1 . 2 1 . . . . 4Environment . . 6 17 50 52 108 50 2 . . 285- Bureau of Meteorology . . 4 3 31 68 115 83 9 3 . 316- Clean Energy Regulator . . . 2 3 11 11 7 2 1 . 37- Climate Change Authority . . . . . 2 2 . 1 . . 5- GBRMPA . 1 1 5 5 8 9 2 . . . 31Finance . 3 6 10 24 41 48 38 18 3 1 192- Australian Electoral Commission . . 20 17 13 68 15 14 3 1 . 151- Future Fund Management Agency . . . . . . . . . . . .Foreign Affairs and Trade . . . 8 8 27 42 47 48 5 1 186- ACIAR . . . . 2 1 . . . . . 3- AUSTRADE . . . . 3 2 11 13 7 4 . 40Health . . 3 30 103 142 237 143 26 9 3 696
56

Classification
Agency APS 1 APS 2 APS 3 APS 4 APS 5 APS 6 EL 1 EL 2 SES 1 SES 2 SES 3 Total- Australian Aged Care Quality Agency . . . 1 . 2 1 . . . . 4- ACSQHC . . . . . 4 6 2 . . . 12- Australian Institute of Health and Welfare . . . 2 4 6 11 10 2 . . 35- ARPANSA . . 3 . 1 4 4 5 . . . 17- Australian Sports Anti-Doping Authority . . . . 1 1 3 . . . . 5- Cancer Australia . . . . . 1 2 1 . . . 4- FSANZ . . . . 1 1 2 1 2 . . 7- Independent Hospital Pricing Authority . . . . 1 1 4 1 1 . . 8- National Blood Authority . . . . 2 4 3 1 . . . 10- NHMRC . . . 1 5 5 11 4 . . . 26- National Health Funding Body . . . . . . . . . . . .- National Health Performance Authority . . . . . . . . . . . .- National Mental Health Commission . . . . . 1 . 1 . . . 2- Organ and Tissue Authority . . . . . 1 1 2 . . . 4- Professional Services Review . . . . 1 2 . . . . . 3Human Services 3 5 54 148 1721 1596 735 276 38 7 1 4584Immigration and Border Protection . 1 8 229 634 629 490 193 41 13 2 2240Industry, Innovation and Science . . . 10 82 124 186 103 17 3 2 527- NOPSEMA . . . . . . . . . . . .Infrastructure and Regional Development . . . 3 11 23 50 47 17 2 . 153- Australian Transport Safety Bureau . . . . . 3 1 . 2 . . 6- National Capital Authority . . . 1 . 3 2 1 1 . . 8Prime Minister and Cabinet . . 2 6 49 77 106 79 23 10 1 353- Aboriginal Hostels Ltd. . 3 11 . 2 2 4 1 . . . 23- ANAO . . 1 2 1 4 6 . 3 . . 17- Australian Public Service Commission . . . . 7 7 9 5 . . . 28- Commonwealth Ombudsman . . . 2 7 7 10 3 1 . . 30- Digital Transformation Office . . . . 1 . 2 1 . . . 4- OIGIS . . . . . . . . . . . .- Office of National Assessments . . . . 4 2 2 3 3 . . 14- Torres Strait Regional Authority . . 2 1 3 4 2 1 . . . 13Social Services . 1 3 11 45 75 107 64 17 2 . 325- Australian Institute of Family Studies . . . . . . 1 2 2 . . 5- National Disability Insurance Agency . . 2 16 42 37 59 27 11 1 . 195Treasury . . 11 4 23 24 27 13 4 1 . 107- Australian Bureau of Statistics . . 2 20 111 140 104 35 2 . . 414- ACCC . . . 8 5 25 33 15 6 1 . 93- ASIC . 6 . 28 2 46 57 51 21 . . 211- Australian Taxation Office . 1 17 200 278 329 291 148 8 2 1 1275- Productivity Commission . . . . 2 . 1 5 2 . 1 11Veterans' Affairs . 3 10 30 110 122 75 37 7 1 . 395- Australian War Memorial . . 1 1 1 5 4 1 1 . . 14Total 3 50 299 1316 4273 4829 4331 2273 485 99 16 17974Source: APSEDNote: Employees on temporary assignment as an agency head have been excluded from this table.
57

Table 20: Ongoing employees: agency by operative status (including maternity related leave) and sex, 30 June 2016 *
Men Women
Agency Operative Inoperative Total men Operative Inoperative Maternity Total womenAgriculture and Water Resources 2186 33 2219 2081 107 17 2205- Australian Fisheries Management Authority 92 1 93 64 2 2 68- APVMA 67 . 67 109 . . 109- Murray Darling Basin Authority 136 . 136 151 3 2 156Attorney-General's 530 11 541 1003 21 75 1099- Administrative Appeals Tribunal 151 5 156 264 5 8 277- ACLEI 21 1 22 13 . 1 14- AUSTRAC 148 . 148 186 1 7 194- Australian Crime Commission 278 3 281 259 3 13 275- Australian Financial Security Authority 186 2 188 255 4 12 271- Australian Human Rights Commission 25 1 26 68 2 3 73- Australian Law Reform Commission . . . 10 . . 10- Commonwealth DPP 119 . 119 252 3 18 273- CrimTrac Agency 106 1 107 105 2 10 117- Family Court and Federal Circuit Court 155 1 156 413 6 22 441- Federal Court of Australia 76 1 77 202 2 12 216- National Archives of Australia 137 4 141 212 2 1 215- OAIC 21 . 21 47 . 3 50- Office of Parliamentary Counsel 37 1 38 53 3 3 59Communications and the Arts 196 5 201 317 4 20 341- ACMA 199 1 200 213 1 14 228- Australian National Maritime Museum 43 . 43 50 . 1 51- National Film and Sound Archive 65 . 65 78 2 6 86- National Library of Australia 114 3 117 267 9 10 286- National Museum of Australia 63 1 64 138 3 2 143- National Portrait Gallery 10 1 11 31 . 1 32- Old Parliament House 22 . 22 36 1 2 39- Screen Australia 4 . 4 8 . . 8Defence 10735 112 10847 7237 118 254 7609- Defence Housing Australia 190 . 190 326 4 24 354Education and Training 715 14 729 1217 65 26 1308- AIATSIS 56 . 56 61 2 2 65- Australian Research Council 33 . 33 74 . 8 82- Australian Skills Quality Authority 50 2 52 106 5 1 112- TEQSA 16 . 16 27 1 5 33Employment 836 6 842 1011 31 5 1047- Asbestos Safety and Eradication Agency 6 . 6 1 . . 1- Comcare 222 8 230 363 8 21 392- Fair Work Commission 84 2 86 147 5 14 166- OFWBII 68 1 69 57 1 4 62- Office of the Fair Work Ombudsman 269 1 270 453 4 33 490- Safe Work Australia 25 . 25 70 5 . 75- Workplace Gender Equality Agency 4 . 4 21 . . 21Environment 842 13 855 1036 26 65 1127- Bureau of Meteorology 1007 5 1012 404 8 16 428- Clean Energy Regulator 158 4 162 154 5 9 168- Climate Change Authority 7 . 7 10 1 . 11- GBRMPA 68 . 68 114 . 7 121Finance 640 9 649 759 10 34 803- Australian Electoral Commission 260 2 262 557 8 11 576- Future Fund Management Agency 66 . 66 56 . 2 58Foreign Affairs and Trade 1516 53 1569 1916 88 122 2126- ACIAR 6 . 6 26 1 . 27
58

Men Women
Agency Operative Inoperative Total men Operative Inoperative Maternity Total women- AUSTRADE 243 2 245 263 4 15 282Health 1388 46 1434 2948 114 156 3218- Australian Aged Care Quality Agency 37 1 38 167 . 1 168- ACSQHC 19 1 20 58 2 2 62- Australian Institute of Health and Welfare 94 2 96 206 8 7 221- ARPANSA 71 1 72 51 . 3 54- Australian Sports Anti-Doping Authority 21 . 21 18 . 3 21- Cancer Australia 6 . 6 45 3 1 49- FSANZ 31 1 32 61 1 . 62- Independent Hospital Pricing Authority 15 1 16 22 . 2 24- National Blood Authority 17 . 17 31 . 3 34- NHMRC 54 4 58 125 1 7 133- National Health Funding Body 4 . 4 7 . 2 9- National Health Performance Authority 1 . 1 4 . 1 5- National Mental Health Commission 2 . 2 11 1 . 12- Organ and Tissue Authority 9 . 9 14 . . 14- Professional Services Review 8 . 8 8 . . 8Human Services 8937 49 8986 21413 152 1075 22640Immigration and Border Protection 6140 99 6239 6725 169 380 7274Industry, Innovation and Science 2199 40 2239 1969 60 51 2080- NOPSEMA 65 1 66 39 . 4 43Infrastructure and Regional Development 557 17 574 531 10 30 571- Australian Transport Safety Bureau 67 . 67 24 1 2 27- National Capital Authority 19 . 19 28 . . 28Prime Minister and Cabinet 659 28 687 1232 45 66 1343- Aboriginal Hostels Ltd. 74 . 74 130 6 1 137- ANAO 134 1 135 179 1 12 192- Australian Public Service Commission 49 2 51 142 4 . 146- Commonwealth Ombudsman 45 . 45 96 1 4 101- Digital Transformation Office 20 . 20 16 . . 16- OIGIS 4 2 6 5 . 2 7- Office of National Assessments 76 2 78 48 3 2 53- Torres Strait Regional Authority 13 . 13 30 . . 30Social Services 762 10 772 1366 35 56 1457- Australian Institute of Family Studies 9 . 9 32 1 1 34- National Disability Insurance Agency 282 4 286 789 17 21 827Treasury 542 37 579 493 31 31 555- Australian Bureau of Statistics 1255 15 1270 1334 25 76 1435- ACCC 370 6 376 382 18 34 434- ASIC 651 3 654 832 4 70 906- Australian Taxation Office 7625 92 7717 9108 114 639 9861- Productivity Commission 80 3 83 77 . 6 83Veterans' Affairs 714 2 716 1089 5 41 1135- Australian War Memorial 115 . 115 125 1 4 130Total 56549 780 57329 75361 1419 3739 80519Source: APSED* For definitions of operative status and maternity-related leave, see Appendix 1
59

Table 21: Ongoing employees: agency by highest educational qualification, 30 June 2016
Highest educational qualification
Agency Doctorate Masters Postgrad
diplomaBachelor
degreeUndergr
ad diploma
Associate
diploma
Skilled vocational qualificati
on
Basic vocational qualificati
onYear 12 Year 11 Year 10
Less than
year 10No data Total
Agriculture and Water Resources 143 201 155 688 72 94 68 23 78 7 32 1 2862 4424- Australian Fisheries Management Authority 3 10 3 54 1 9 1 . 19 5 7 . 49 161- APVMA 42 17 16 46 4 15 4 3 16 2 5 . 6 176- Murray Darling Basin Authority 46 54 22 111 2 13 3 1 18 1 2 . 19 292Attorney-General's 20 57 74 258 8 13 12 5 28 2 6 . 1157 1640- Administrative Appeals Tribunal 4 41 47 122 15 18 12 2 33 8 7 . 124 433- ACLEI . 6 4 17 . 4 . . 4 . . . 1 36- AUSTRAC 12 55 53 121 15 33 6 4 29 3 5 1 5 342- Australian Crime Commission 11 36 36 104 21 37 5 3 30 5 7 1 260 556- Australian Financial Security Authority 6 21 22 64 3 10 7 1 15 2 7 . 301 459- Australian Human Rights Commission 4 19 9 25 . 1 . . . . . . 41 99- Australian Law Reform Commission . . . 3 . . . . . . . . 7 10- Commonwealth DPP 1 18 31 196 1 8 5 7 18 2 1 . 104 392- CrimTrac Agency . 5 4 25 1 2 1 1 10 1 . . 174 224- Family Court and Federal Circuit Court 2 18 16 72 10 8 4 2 40 4 14 2 405 597- Federal Court of Australia 2 11 14 32 2 10 2 2 14 2 1 . 201 293- National Archives of Australia 1 10 11 32 1 3 . 2 21 5 11 1 258 356- OAIC 1 13 14 26 . 3 . 1 2 . . . 11 71- Office of Parliamentary Counsel 4 1 2 27 . 2 . 1 2 . . . 58 97Communications and the Arts 9 58 36 149 5 12 8 4 25 1 3 . 232 542- ACMA 11 36 20 86 6 17 3 5 22 2 2 1 217 428- Australian National Maritime Museum 3 7 7 13 1 6 2 . 2 . 1 . 52 94- National Film and Sound Archive 2 1 3 10 1 4 1 1 1 . . . 127 151- National Library of Australia 3 5 26 26 5 5 2 . 16 1 4 3 307 403- National Museum of Australia 6 6 6 22 2 2 4 1 17 1 3 . 137 207- National Portrait Gallery . 3 1 9 . . . . . . . . 30 43- Old Parliament House . 1 2 5 . . 1 . . . . . 52 61- Screen Australia . . . . . . . . 1 . . . 11 12Defence 569 1047 570 3100 71 514 437 165 1094 155 577 33 10124 18456- Defence Housing Australia . 2 4 15 4 4 4 2 28 6 16 1 458 544Education and Training 44 156 146 440 27 78 31 28 105 6 26 . 950 2037- AIATSIS 7 5 12 24 3 18 4 . 3 1 1 . 43 121- Australian Research Council 3 2 6 6 . . . . 4 . . . 94 115- Australian Skills Quality Authority 1 12 5 22 2 8 10 2 4 . 1 . 97 164- TEQSA 3 6 17 13 . . . . 1 . . . 9 49Employment 19 161 124 409 36 70 43 9 90 7 19 4 898 1889- Asbestos Safety and Eradication Agency 1 1 . 3 . . . . . . . . 2 7- Comcare 3 18 29 95 5 20 25 14 38 3 10 . 362 622- Fair Work Commission 2 . 4 11 . 2 1 1 7 3 . 1 220 252- OFWBII . 5 9 24 5 11 1 . 1 1 . . 74 131- Office of the Fair Work Ombudsman 3 35 76 151 12 40 17 5 24 . 4 . 393 760- Safe Work Australia 9 9 10 37 1 6 . . 5 . . . 23 100- Workplace Gender Equality Agency . 1 3 2 . . 1 . . . . . 18 25Environment 56 161 87 272 13 23 17 7 50 3 10 1 1282 1982- Bureau of Meteorology 188 179 228 489 50 144 16 6 69 15 12 1 43 1440- Clean Energy Regulator 3 14 11 35 2 6 3 4 8 . 1 . 243 330- Climate Change Authority . 1 1 2 . . . . . . . . 14 18- GBRMPA 8 7 4 44 2 9 1 1 7 . 2 . 104 189Finance 12 101 60 287 27 45 18 4 63 . 7 . 828 1452- Australian Electoral Commission 2 38 60 177 24 60 28 27 133 31 43 3 212 838- Future Fund Management Agency . . . 1 . . . . . . . . 123 124
60

Highest educational qualification
Agency Doctorate Masters Postgrad
diplomaBachelor
degreeUndergr
ad diploma
Associate
diploma
Skilled vocational qualificati
on
Basic vocational qualificati
onYear 12 Year 11 Year 10
Less than
year 10No data Total
Foreign Affairs and Trade 81 549 253 828 25 85 50 17 171 23 38 1 1574 3695- ACIAR . 2 2 7 1 1 2 . 2 . 1 . 15 33- AUSTRADE 9 81 45 99 9 9 2 . 8 . . . 265 527Health 212 400 394 1365 82 289 80 53 512 45 113 12 1095 4652- Australian Aged Care Quality Agency 1 28 29 38 11 19 4 2 13 2 5 . 54 206- ACSQHC 8 25 8 20 1 1 2 . 4 . 1 . 12 82- Australian Institute of Health and Welfare 9 13 14 58 2 3 1 3 5 . 3 . 206 317- ARPANSA 6 3 2 9 1 3 . . 1 . . . 101 126- Australian Sports Anti-Doping Authority 1 3 5 3 . 2 . . 1 . . . 27 42- Cancer Australia 2 6 2 9 . . . . . . . . 36 55- FSANZ 13 5 2 18 1 1 . . 1 . . . 53 94- Independent Hospital Pricing Authority 3 14 . 16 . 2 1 . . . . . 4 40- National Blood Authority . 2 3 2 . . . . 3 . . . 41 51- NHMRC 8 16 8 38 3 8 . 1 6 1 1 . 101 191- National Health Funding Body . 3 1 3 . 2 . . . . . . 4 13- National Health Performance Authority . 1 . 2 . . . 1 1 . . . 1 6- National Mental Health Commission 1 1 1 . 2 . 1 . 1 . . . 7 14- Organ and Tissue Authority . 3 1 5 . . . . 3 . . . 11 23- Professional Services Review . 1 3 4 . 1 . . . . . . 7 16Human Services 70 867 1048 4563 383 4131 959 297 2550 505 1023 74 15156 31626Immigration and Border Protection 60 653 533 2858 309 723 216 89 1488 158 307 26 6093 13513Industry, Innovation and Science 229 275 171 697 31 110 21 10 160 7 27 2 2579 4319- NOPSEMA 7 27 19 37 3 7 2 . 3 . 3 . 1 109Infrastructure and Regional Development 14 125 61 397 10 65 33 13 153 14 22 . 238 1145- Australian Transport Safety Bureau . 3 1 9 . 5 . . 8 . 3 1 64 94- National Capital Authority . . 3 4 . 1 1 . 1 . 1 . 36 47Prime Minister and Cabinet 27 137 87 371 31 53 28 14 88 9 27 3 1155 2030- Aboriginal Hostels Ltd. . 6 4 18 2 15 5 4 29 15 34 20 59 211- ANAO 12 38 10 131 . 3 . 2 10 . 1 1 119 327- Australian Public Service Commission 3 22 23 49 2 13 5 5 15 . 2 . 58 197- Commonwealth Ombudsman . 11 8 42 1 3 1 2 6 . . . 72 146- Digital Transformation Office 1 1 2 7 . 1 . . 2 . . . 22 36- OIGIS 2 . . 2 . . . . . . 1 . 8 13- Office of National Assessments 9 11 7 31 . . . . 4 . . . 69 131- Torres Strait Regional Authority 1 3 1 2 . . 1 . . . . . 35 43Social Services 13 119 91 419 29 82 33 20 168 14 49 2 1190 2229- Australian Institute of Family Studies 9 3 5 13 2 2 . . . . 1 . 8 43- National Disability Insurance Agency 5 24 38 139 8 36 15 8 28 3 4 . 805 1113Treasury 46 179 58 456 4 35 14 2 49 3 15 3 270 1134- Australian Bureau of Statistics 77 233 298 924 12 63 35 15 128 8 35 2 875 2705- ACCC 18 105 99 375 12 30 2 6 33 . 6 . 124 810- ASIC 2 100 115 233 22 12 7 3 53 18 6 3 986 1560- Australian Taxation Office 91 1774 1224 5112 340 892 608 218 1555 230 515 40 4979 17578- Productivity Commission 12 45 17 62 2 3 2 . 4 1 3 . 15 166Veterans' Affairs 8 66 88 275 32 84 45 19 326 49 108 8 743 1851- Australian War Memorial . 1 6 20 3 1 4 1 17 . . . 192 245
Total 2339 8655 6890 27772 1836 8183 2988 1149 9805 1390 3202 252 6338713784
8Source: APSED
61

Table 22: Ongoing employees: agency by number of agencies worked in and base classification group, 30 June 2016
Classification
APS EL SES Total
Agency One agency
2-3 agencies
4 or more
agenciesOne
agency2-3
agencies4 or
more agencies
One agency
2-3 agencies
4 or more
agenciesOne
agency2-3
agencies4 or
more agencies
Agriculture and Water Resources 2835 430 50 583 341 90 34 36 23 3452 807 163- Australian Fisheries Management Authority 70 33 2 28 19 5 . 2 . 98 54 7- APVMA 70 23 3 36 33 7 2 1 1 108 57 11- Murray Darling Basin Authority 94 43 7 67 42 17 4 1 4 165 86 28Attorney-General's 575 210 23 302 264 49 61 91 16 938 565 88- Administrative Appeals Tribunal 201 129 16 32 41 11 1 2 . 234 172 27- ACLEI 2 11 1 7 11 2 . 2 . 9 24 3- AUSTRAC 106 73 5 73 64 12 2 5 2 181 142 19- Australian Crime Commission 180 79 10 186 76 17 7 1 . 373 156 27- Australian Financial Security Authority 276 71 7 41 48 9 . 5 2 317 124 18- Australian Human Rights Commission 43 12 . 26 8 3 2 1 . 71 21 3- Australian Law Reform Commission 4 1 . 2 2 . 1 . . 7 3 .- Commonwealth DPP 162 25 1 137 42 4 14 6 1 313 73 6- CrimTrac Agency 66 49 5 34 47 16 1 1 . 101 97 21- Family Court and Federal Circuit Court 337 85 9 112 39 10 3 2 . 452 126 19- Federal Court of Australia 159 52 7 39 23 6 1 5 1 199 80 14- National Archives of Australia 166 91 11 33 38 13 . 3 1 199 132 25- OAIC 23 23 1 11 9 2 1 1 . 35 33 3- Office of Parliamentary Counsel 28 10 4 14 16 4 10 10 1 52 36 9Communications and the Arts 141 111 17 86 110 38 6 15 10 233 236 65- ACMA 141 45 7 115 86 20 6 5 3 262 136 30- Australian National Maritime Museum 59 8 . 20 6 1 . . . 79 14 1- National Film and Sound Archive 96 21 3 16 11 2 1 1 . 113 33 5- National Library of Australia 235 62 9 46 35 7 3 2 . 284 99 16- National Museum of Australia 128 27 3 25 19 3 . 1 1 153 47 7- National Portrait Gallery 19 8 1 11 3 1 . . . 30 11 2- Old Parliament House 24 18 1 9 6 2 . 1 . 33 25 3- Screen Australia 3 2 . 6 . 1 . . . 9 2 1Defence 11875 1086 58 4207 658 67 70 30 13 16152 1774 138- Defence Housing Australia 354 32 7 116 23 4 6 2 . 476 57 11Education and Training 684 343 47 349 368 115 20 32 22 1053 743 184- AIATSIS 67 20 4 12 12 5 . . 1 79 32 10- Australian Research Council 43 15 . 22 27 6 . 1 1 65 43 7- Australian Skills Quality Authority 67 24 2 53 16 . 2 . . 122 40 2- TEQSA 15 6 3 11 11 3 . . . 26 17 6Employment 694 317 54 328 305 85 13 29 14 1035 651 153- Asbestos Safety and Eradication Agency 1 . . . 4 2 . . . 1 4 2- Comcare 332 119 8 69 59 22 3 3 2 404 181 32- Fair Work Commission 138 54 1 34 17 4 2 2 . 174 73 5- OFWBII 48 35 1 16 22 2 3 2 2 67 59 5- Office of the Fair Work Ombudsman 454 157 7 77 44 7 7 2 1 538 203 15- Safe Work Australia 20 23 2 13 24 13 . 3 1 33 50 16- Workplace Gender Equality Agency 11 4 . 4 3 2 1 . . 16 7 2Environment 842 323 42 348 287 53 16 22 19 1206 632 114- Bureau of Meteorology 669 108 8 519 81 17 11 4 3 1199 193 28- Clean Energy Regulator 86 84 19 34 66 25 1 5 5 121 155 49- Climate Change Authority 1 8 . . 6 2 . 1 . 1 15 2- GBRMPA 114 22 2 36 10 2 . 3 . 150 35 4Finance 495 211 25 228 301 96 12 38 24 735 550 145- Australian Electoral Commission 435 187 34 49 75 43 2 5 3 486 267 80- Future Fund Management Agency 77 3 . 36 4 . 4 . . 117 7 .Foreign Affairs and Trade 1024 547 49 819 799 124 102 123 32 1945 1469 205
62

Classification
APS EL SES Total
Agency One agency
2-3 agencies
4 or more
agenciesOne
agency2-3
agencies4 or
more agencies
One agency
2-3 agencies
4 or more
agenciesOne
agency2-3
agencies4 or
more agencies
- ACIAR 15 8 2 2 4 1 1 . . 18 12 3- AUSTRADE 88 65 6 173 115 26 33 15 6 294 195 38Health 1855 796 111 926 638 171 45 64 32 2826 1498 314- Australian Aged Care Quality Agency 160 23 2 13 4 1 1 2 . 174 29 3- ACSQHC 8 19 1 35 15 3 1 . . 44 34 4- Australian Institute of Health and Welfare 99 56 10 56 60 21 2 3 1 157 119 32- ARPANSA 53 11 1 41 11 5 3 1 . 97 23 6- Australian Sports Anti-Doping Authority 18 7 . 6 6 2 . 2 1 24 15 3- Cancer Australia 18 17 . 12 3 2 2 1 . 32 21 2- FSANZ 24 10 3 30 22 4 1 . . 55 32 7- Independent Hospital Pricing Authority 6 9 . 16 9 . . . . 22 18 .- National Blood Authority 17 8 . 10 9 6 . . 1 27 17 7- NHMRC 78 20 4 41 34 8 . 2 4 119 56 16- National Health Funding Body 3 4 . 1 5 . . . . 4 9 .- National Health Performance Authority . 1 . . 3 2 . . . . 4 2- National Mental Health Commission 3 2 1 2 4 1 . 1 . 5 7 2- Organ and Tissue Authority 3 5 1 2 9 1 . 1 1 5 15 3- Professional Services Review 7 3 . 1 1 3 . 1 . 8 5 3Human Services 24862 2804 79 2408 896 132 59 57 46 27329 3757 257Immigration and Border Protection 8983 1497 98 1571 918 132 51 67 30 10605 2482 260Industry, Innovation and Science 1883 558 64 986 520 129 29 48 22 2898 1126 215- NOPSEMA 31 2 . 69 3 1 2 . 1 102 5 2Infrastructure and Regional Development 350 202 21 163 251 73 7 25 19 520 478 113- Australian Transport Safety Bureau 17 7 . 51 12 4 1 1 1 69 20 5- National Capital Authority 22 4 . 10 4 5 2 . . 34 8 5Prime Minister and Cabinet 595 362 46 303 479 118 13 50 34 911 891 198- Aboriginal Hostels Ltd. 160 24 4 5 6 7 1 1 1 166 31 12- ANAO 114 33 7 59 49 19 10 11 7 183 93 33- Australian Public Service Commission 44 38 10 19 56 20 1 6 3 64 100 33- Commonwealth Ombudsman 53 33 6 14 26 10 1 1 2 68 60 18- Digital Transformation Office 4 5 1 4 16 4 1 1 . 9 22 5- OIGIS 2 2 . 1 6 1 . . 1 3 8 2- Office of National Assessments 18 24 2 15 51 10 . 9 2 33 84 14- Torres Strait Regional Authority 15 15 . 5 6 2 . . . 20 21 2Social Services 740 420 77 317 411 137 16 27 21 1073 858 235- Australian Institute of Family Studies 13 4 . 20 4 2 . . . 33 8 2- National Disability Insurance Agency 495 323 14 116 104 25 13 15 8 624 442 47Treasury 385 135 13 207 193 51 29 48 12 621 376 76- Australian Bureau of Statistics 1465 350 44 459 184 29 25 13 5 1949 547 78- ACCC 303 79 7 211 122 14 16 23 3 530 224 24- ASIC 616 92 9 676 134 8 1 2 . 1293 228 17- Australian Taxation Office 11792 1151 40 3525 750 61 161 50 6 15478 1951 107- Productivity Commission 39 16 4 37 38 10 3 7 5 79 61 19Veterans' Affairs 998 400 45 190 134 37 7 15 7 1195 549 89- Australian War Memorial 151 35 4 36 14 2 3 . . 190 49 6Total 81394 15159 1313 22321 11000 2351 976 1077 491 104691 27236 4155Source: APSEDNote: Trainees and graduate APS employees are not included in this table as almost all have worked in only one agency.
63

Table 23: Ongoing employees: agency by median length of service (years) and base classification, 30 June 2016
Classification
Agency APS 1 APS 2 APS 3 APS 4 APS 5 APS 6 EL 1 EL 2 SES 1 SES 2 SES 3 TotalAgriculture and Water Resources 8 5 9 11 10 9 11 15 18 23 22 10- Australian Fisheries Management Authority . 5 8 7 8 8 8 9 18 8 . 8- APVMA . . 2 5 7 7 9 11 9 . . 8- Murray Darling Basin Authority . 9 1 5 4 7 8 8 8 24 36 8Attorney-General's 7 1 6 2 1 6 9 10 7 14 19 6- Administrative Appeals Tribunal 9 8 10 11 10 12 12 17 17 . . 11- ACLEI . . . 3 8 8 8 11 10 . . 9- AUSTRAC . . 5 9 7 9 9 9 17 16 . 9- Australian Crime Commission . 13 14 8 9 9 9 11 7 3 . 9- Australian Financial Security Authority . 1 5 5 5 6 10 12 10 . . 6- Australian Human Rights Commission . . 2 5 13 6 9 10 23 6 . 7- Australian Law Reform Commission . . . 5 . 5 5 12 5 . . 5- Commonwealth DPP 11 9 12 1 4 8 9 17 26 29 29 9- CrimTrac Agency 4 . 4 6 6 8 10 8 10 . . 8- Family Court and Federal Circuit Court 13 12 10 10 10 12 9 15 16 29 . 11- Federal Court of Australia . 8 9 9 10 10 12 14 25 16 . 10- National Archives of Australia 13 28 10 11 12 14 15 17 23 . . 13- OAIC . . . 6 9 4 8 10 14 . . 7- Office of Parliamentary Counsel . . 0 3 9 8 15 12 17 28 18 12Communications and the Arts . 4 7 5 7 9 11 14 17 19 15 10- ACMA . . 15 10 12 9 11 16 20 20 . 11- Australian National Maritime Museum . 8 13 11 6 10 7 4 . . . 8- National Film and Sound Archive . 6 10 7 11 10 15 12 19 . . 10- National Library of Australia . 7 9 10 12 14 15 24 17 . . 12- National Museum of Australia . 9 9 8 9 11 13 11 17 . . 10- National Portrait Gallery . 8 5 6 8 9 12 8 . . . 8- Old Parliament House . . 6 10 6 9 12 12 16 . . 8- Screen Australia . . 32 . 7 9 9 11 . . . 10Defence 19 11 9 9 9 10 13 17 17 23 20 10- Defence Housing Australia . . 4 8 7 9 8 9 7 14 . 7Education and Training 4 11 5 6 9 10 13 17 21 22 10 11- AIATSIS . 3 3 3 6 10 10 19 9 . . 6- Australian Research Council . 1 . 5 5 8 10 10 25 29 . 8- Australian Skills Quality Authority . . 4 4 4 4 5 5 4 . . 4- TEQSA . . . 3 3 8 6 7 . . . 5Employment . 12 5 6 9 9 12 15 20 27 11 10- Asbestos Safety and Eradication Agency . . . . . 3 7 20 . . . 7- Comcare 9 6 5 6 6 9 10 10 8 9 9 7- Fair Work Commission . 21 7 9 3 9 9 7 14 . . 8- OFWBII . . 8 5 5 8 10 10 9 39 . 8- Office of the Fair Work Ombudsman . 2 6 8 9 10 11 10 14 11 20 9- Safe Work Australia . . . 4 4 6 12 14 15 . . 9- Workplace Gender Equality Agency . . 3 3 4 8 13 5 . 1 . 5Environment 3 6 8 5 7 8 11 14 17 18 27 9- Bureau of Meteorology 23 29 10 4 10 10 13 16 26 18 . 12- Clean Energy Regulator 0 . 1 5 6 7 10 13 19 8 . 7- Climate Change Authority 1 . . . 3 5 7 15 . 22 . 7- GBRMPA 9 7 10 9 5 8 9 14 10 . . 9Finance 0 1 5 8 6 8 10 16 18 22 24 10- Australian Electoral Commission . 7 11 8 8 14 14 17 27 20 . 11- Future Fund Management Agency . 1 1 3 3 5 5 7 . 9 9 4Foreign Affairs and Trade . 5 13 3 8 8 12 17 24 28 35 11- ACIAR . . . 6 9 10 8 10 10 . . 8- AUSTRADE . . 5 8 5 9 10 10 10 10 31 10Health 6 5 6 6 9 9 12 15 17 18 27 10
64

Classification
Agency APS 1 APS 2 APS 3 APS 4 APS 5 APS 6 EL 1 EL 2 SES 1 SES 2 SES 3 Total- Australian Aged Care Quality Agency . . 2 2 9 2 2 10 4 . . 2- ACSQHC . . 9 4 5 7 5 6 . 9 . 5- Australian Institute of Health and Welfare . 11 10 3 6 8 12 17 15 . . 10- ARPANSA . 13 8 17 7 10 11 13 11 . . 11- Australian Sports Anti-Doping Authority . . 4 7 9 8 7 12 22 32 . 8- Cancer Australia . . . . 4 5 5 6 21 5 . 5- FSANZ . . 9 13 10 9 11 17 5 . . 11- Independent Hospital Pricing Authority . . . 2 3 3 4 4 . . . 4- National Blood Authority . . 5 1 5 6 8 11 24 . . 7- NHMRC . 9 1 5 6 7 9 14 15 48 . 8- National Health Funding Body . . . 1 8 6 9 4 . . . 6- National Health Performance Authority . . . . . 6 10 9 . . . 8- National Mental Health Commission . . . 10 6 3 6 5 25 . . 6- Organ and Tissue Authority . . . . 4 6 10 12 12 19 . 9- Professional Services Review . . 4 4 14 9 1 27 6 . . 9Human Services 10 14 7 11 12 13 14 15 21 16 23 11Immigration and Border Protection 6 1 9 7 11 11 12 15 17 19 22 10Industry, Innovation and Science 5 9 8 6 6 7 11 14 18 19 33 9- NOPSEMA . . 4 3 4 5 4 9 11 . . 5Infrastructure and Regional Development . 9 7 8 5 9 11 15 21 18 31 10- Australian Transport Safety Bureau . . . 2 10 4 8 12 17 . . 10- National Capital Authority . 12 2 5 4 6 9 12 19 . . 7Prime Minister and Cabinet 4 7 3 5 7 9 10 14 19 23 29 10- Aboriginal Hostels Ltd. 8 6 12 6 11 7 10 14 9 . . 9- ANAO . 5 9 2 3 6 9 16 21 17 37 9- Australian Public Service Commission . 8 1 6 8 10 11 16 20 . 29 10- Commonwealth Ombudsman . . 2 6 8 10 13 16 20 . . 9- Digital Transformation Office . . . 2 12 5 10 12 1 36 . 10- OIGIS . . . . 41 1 10 17 16 . . 10- Office of National Assessments . . . 11 3 11 9 14 26 26 . 11- Torres Strait Regional Authority . 14 15 10 10 10 11 12 . . . 11Social Services 7 4 4 6 9 10 13 15 21 21 24 11- Australian Institute of Family Studies . 17 . 15 13 10 9 14 . . . 10- National Disability Insurance Agency . 5 6 3 2 3 4 7 8 7 5 3Treasury . 9 10 8 5 6 10 16 20 22 29 10- Australian Bureau of Statistics 25 20 10 6 7 10 15 19 21 19 34 10- ACCC . . 3 3 5 7 9 12 18 19 6 8- ASIC 9 3 23 4 11 7 8 10 25 34 . 8- Australian Taxation Office 5 5 9 9 13 14 16 16 21 31 7 13- Productivity Commission . . 10 16 1 7 10 17 20 23 . 11Veterans' Affairs 3 17 11 9 16 13 18 17 26 22 3 14- Australian War Memorial . 4 6 6 10 10 11 12 13 . . 10Total 9 9 9 10 10 10 12 15 18 21 27 10Source: APSED
65

Table 24: Ongoing employees: age group by base classification and sex, 30 June 2016
Classification
Age group Trainee Graduate APS 1 APS 2 APS 3 APS 4 APS 5 APS 6 EL 1 EL 2 SES 1 SES 2 SES 3 Total
Men
Under 20 18 2 11 11 8 2 . . . . . . . 5220-24 94 227 23 95 296 278 156 48 2 . . . . 121925-29 47 266 27 108 555 1040 1073 1114 227 16 . . . 447330-34 30 79 23 76 690 1146 1138 2176 1424 235 16 . . 703335-39 14 29 19 50 729 1068 965 1954 1896 707 68 10 . 750940-44 18 13 22 61 691 1180 943 1877 2095 1031 171 32 2 813645-49 10 5 34 105 690 1118 1027 1841 2068 1260 240 64 7 846950-54 5 1 26 145 659 1108 1155 2062 2096 1398 260 89 21 902555-59 . 1 40 138 499 883 868 1581 1430 979 211 82 27 673960 and over . . 37 140 470 696 669 1094 880 545 87 42 14 4674Total men 236 623 262 929 5287 8519 7994 13747 12118 6171 1053 319 71 57329
Women
Under 20 18 . 14 17 21 12 . . . . . . . 8220-24 92 297 11 128 460 555 218 59 2 1 . . . 182325-29 56 258 24 175 1028 1983 1712 1634 298 14 1 . . 718330-34 41 52 27 125 1172 2685 1840 3203 1822 308 13 . . 1128835-39 28 14 18 119 1227 2699 1632 2896 2568 839 68 2 1 1211140-44 11 6 29 191 1223 2956 1595 2645 2325 1009 166 30 2 1218845-49 14 8 36 241 1299 2782 1531 2436 2101 976 227 47 6 1170450-54 6 2 49 306 1442 2772 1593 2361 1876 971 207 58 22 1166555-59 2 1 33 246 1136 1984 1139 1583 1082 549 138 39 11 794360 and over . 1 39 195 805 1237 653 897 445 197 38 20 5 4532Total women 268 639 280 1743 9813 19665 11913 17714 12519 4864 858 196 47 80519
Total
Under 20 36 2 25 28 29 14 . . . . . . . 13420-24 186 524 34 223 756 833 374 107 4 1 . . . 304225-29 103 524 51 283 1583 3023 2785 2748 525 30 1 . . 1165630-34 71 131 50 201 1862 3831 2978 5379 3246 543 29 . . 1832135-39 42 43 37 169 1956 3767 2597 4850 4464 1546 136 12 1 1962040-44 29 19 51 252 1914 4136 2538 4522 4420 2040 337 62 4 2032445-49 24 13 70 346 1989 3900 2558 4277 4169 2236 467 111 13 2017350-54 11 3 75 451 2101 3880 2748 4423 3972 2369 467 147 43 2069055-59 2 2 73 384 1635 2867 2007 3164 2512 1528 349 121 38 1468260 and over . 1 76 335 1275 1933 1322 1991 1325 742 125 62 19 9206Total 504 1262 542 2672 15100 28184 19907 31461 24637 11035 1911 515 118 137848Source: APSED
66

Table 25: Ongoing employees: highest educational qualification by base classification and sex, 30 June 2016
Classification
Highest educational qualification Trainee Graduate APS 1 APS 2 APS 3 APS 4 APS 5 APS 6 EL 1 EL 2 SES 1 SES 2 SES 3 Total
Men
Doctorate . 4 . 4 13 23 55 324 478 534 47 24 4 1510Masters 1 33 3 9 124 290 366 1019 1343 978 184 56 17 4423Postgraduate diploma 3 8 1 6 114 218 269 755 911 524 136 26 5 2976Bachelor degree 5 151 18 67 627 1374 1513 3306 3251 1645 330 114 23 12424Undergraduate diploma 3 1 2 12 97 145 119 214 157 72 8 . . 830Associate diploma 5 2 3 23 332 635 532 823 524 168 16 2 . 3065Skilled vocational qualification 4 . 5 32 147 236 201 295 185 52 8 1 . 1166Basic vocational qualification 2 . 1 4 44 65 46 88 43 16 2 2 . 313Year 12 11 3 26 82 466 739 661 969 729 280 44 13 4 4027Year 11 . . 4 27 60 99 99 105 51 15 1 . . 461Year 10 2 . 29 68 119 193 167 156 96 25 5 . . 860Less than year 10 . . 6 8 9 10 14 10 6 5 . . . 68No data 200 421 164 587 3135 4492 3952 5683 4344 1857 272 81 18 25206Total men 236 623 262 929 5287 8519 7994 13747 12118 6171 1053 319 71 57329
Women
Doctorate . 6 . 1 7 23 49 228 264 206 30 12 3 829Masters . 44 3 5 138 342 406 1149 1220 700 170 49 6 4232Postgraduate diploma 1 18 1 14 144 375 420 1137 1143 544 91 23 3 3914Bachelor degree 6 161 13 81 857 2199 2109 4667 3580 1347 256 55 17 15348Undergraduate diploma 3 4 4 7 99 199 169 272 181 64 4 . . 1006Associate diploma 9 2 13 64 430 2067 851 1018 521 132 10 1 . 5118Skilled vocational qualification 4 . 10 47 307 689 277 300 150 32 6 . . 1822Basic vocational qualification 3 . 5 39 167 262 143 147 62 7 1 . . 836Year 12 16 6 22 155 730 1674 983 1200 711 233 36 8 4 5778Year 11 3 . 7 44 194 330 147 123 61 17 3 . . 929Year 10 1 . 23 142 396 789 378 385 180 43 5 . . 2342Less than year 10 . . 7 12 33 68 25 24 11 4 . . . 184No data 222 398 172 1132 6311 10648 5956 7064 4435 1535 246 48 14 38181Total women 268 639 280 1743 9813 19665 11913 17714 12519 4864 858 196 47 80519
Total
Doctorate . 10 . 5 20 46 104 552 742 740 77 36 7 2339Masters 1 77 6 14 262 632 772 2168 2563 1678 354 105 23 8655Postgraduate diploma 4 26 2 20 258 593 689 1892 2054 1068 227 49 8 6890Bachelor degree 11 312 31 148 1484 3573 3622 7973 6831 2992 586 169 40 27772Undergraduate diploma 6 5 6 19 196 344 288 486 338 136 12 . . 1836Associate diploma 14 4 16 87 762 2702 1383 1841 1045 300 26 3 . 8183Skilled vocational qualification 8 . 15 79 454 925 478 595 335 84 14 1 . 2988Basic vocational qualification 5 . 6 43 211 327 189 235 105 23 3 2 . 1149Year 12 27 9 48 237 1196 2413 1644 2169 1440 513 80 21 8 9805Year 11 3 . 11 71 254 429 246 228 112 32 4 . . 1390Year 10 3 . 52 210 515 982 545 541 276 68 10 . . 3202Less than year 10 . . 13 20 42 78 39 34 17 9 . . . 252No data 422 819 336 1719 9446 15140 9908 12747 8779 3392 518 129 32 63387Total 504 1262 542 2672 15100 28184 19907 31461 24637 11035 1911 515 118 137848Source: APSED
67

Table 26: Ongoing employees: base classification by paid classification and sex, 30 June 2016
Paid Classification
Base classification Trainee Graduate APS 1 APS 2 APS 3 APS 4 APS 5 APS 6 EL 1 EL 2 SES 1 SES 2 SES 3 Total
Men
Trainee 221 . . 10 3 1 1 . . . . . . 236Graduate . 613 . . . 7 2 1 . . . . . 623APS 1 . . 214 18 13 11 4 2 . . . . . 262APS 2 . . . 787 68 52 16 6 . . . . . 929APS 3 . . . . 4480 398 342 63 4 . . . . 5287APS 4 . . 1 . 3 6854 1107 515 39 . . . . 8519APS 5 . . . . . 2 6596 1297 99 . . . . 7994APS 6 . . . . . 1 1 11979 1731 35 . . . 13747EL 1 . . . . . . . 7 11051 1058 1 1 . 12118EL 2 . . . . . . . . 8 5910 245 7 . 6170SES 1 . . . . . . . . . . 998 51 1 1050SES 2 . . . . . . . . . . . 309 9 318SES 3 . . . . . . . . . . . 1 67 68Total men 221 613 215 815 4567 7326 8069 13870 12932 7003 1244 369 77 57321
Women
Trainee 261 . . 4 1 2 . . . . . . . 268Graduate . 627 . . 1 3 5 1 2 . . . . 639APS 1 . . 231 18 20 7 4 . . . . . . 280APS 2 . . . 1435 184 98 19 7 . . . . . 1743APS 3 . . 1 . 8599 718 420 72 3 . . . . 9813APS 4 . . 1 . 4 16352 2348 902 58 . . . . 19665APS 5 . . . . 2 10 9831 1933 133 4 . . . 11913APS 6 . . . . . 3 1 15425 2242 43 . . . 17714EL 1 . . . . . . . 18 11369 1130 2 . . 12519EL 2 . . . . . . . . 7 4619 237 1 . 4864SES 1 . . . . . . . . . 2 815 37 1 855SES 2 . . . . . . . . . . . 188 5 193SES 3 . . . . . . . . . . . . 45 45Total women 261 627 233 1457 8811 17193 12628 18358 13814 5798 1054 226 51 80511
Total
Trainee 482 . . 14 4 3 1 . . . . . . 504Graduate . 1240 . . 1 10 7 2 2 . . . . 1262APS 1 . . 445 36 33 18 8 2 . . . . . 542APS 2 . . . 2222 252 150 35 13 . . . . . 2672APS 3 . . 1 . 13079 1116 762 135 7 . . . . 15100APS 4 . . 2 . 7 23206 3455 1417 97 . . . . 28184APS 5 . . . . 2 12 16427 3230 232 4 . . . 19907APS 6 . . . . . 4 2 27404 3973 78 . . . 31461EL 1 . . . . . . . 25 22420 2188 3 1 . 24637EL 2 . . . . . . . . 15 10529 482 8 . 11034SES 1 . . . . . . . . . 2 1813 88 2 1905SES 2 . . . . . . . . . . . 497 14 511SES 3 . . . . . . . . . . . 1 112 113Total 482 1240 448 2272 13378 24519 20697 32228 26746 12801 2298 595 128 137832Source: APSEDNote: Employees on temporary assignment as an agency head have been excluded from this table.
68

Table 27: Ongoing employees: location by base classification and sex, 30 June 2016
Classification
Location Trainee Graduate APS 1 APS 2 APS 3 APS 4 APS 5 APS 6 EL 1 EL 2 SES 1 SES 2 SES 3 Total
Men
Australian Capital Territory 73 475 90 199 785 1553 2812 5988 7081 3429 730 239 64 23518New South Wales 23 32 62 268 1426 2139 1471 1979 1189 665 74 25 1 9354Victoria 39 70 33 143 1201 1937 1410 2474 1587 914 93 23 2 9926Queensland 31 22 29 132 837 1246 950 1248 769 335 33 3 1 5636South Australia 30 14 12 77 414 645 586 1035 680 414 18 4 . 3929Western Australia 24 6 12 28 372 527 410 504 328 139 28 . . 2378Tasmania . 3 9 54 149 366 163 261 126 74 4 1 . 1210Northern Territory 16 . 15 28 100 94 116 142 103 26 5 . . 645Overseas . 1 . . 3 12 76 116 255 175 68 24 3 733Total men 236 623 262 929 5287 8519 7994 13747 12118 6171 1053 319 71 57329
Women
Australian Capital Territory 70 515 64 244 888 3352 4855 8368 7931 3086 648 152 42 30215New South Wales 47 32 64 520 2930 5418 2059 2794 1341 591 65 15 1 15877Victoria 26 55 47 355 2204 3842 1759 2585 1288 539 60 20 2 12782Queensland 59 15 47 293 1667 3228 1310 1709 828 236 28 3 . 9423South Australia 10 8 18 143 784 1359 738 973 400 133 10 1 . 4577Western Australia 24 7 21 77 740 1237 579 621 280 92 8 . . 3686Tasmania 6 6 2 78 356 916 274 320 137 38 4 . . 2137Northern Territory 26 . 17 33 235 294 217 198 106 26 4 . . 1156Overseas . 1 . . 9 19 122 146 208 123 31 5 2 666Total women 268 639 280 1743 9813 19665 11913 17714 12519 4864 858 196 47 80519
Total
Australian Capital Territory 143 990 154 443 1673 4905 7667 14356 15012 6515 1378 391 106 53733New South Wales 70 64 126 788 4356 7557 3530 4773 2530 1256 139 40 2 25231Victoria 65 125 80 498 3405 5779 3169 5059 2875 1453 153 43 4 22708Queensland 90 37 76 425 2504 4474 2260 2957 1597 571 61 6 1 15059South Australia 40 22 30 220 1198 2004 1324 2008 1080 547 28 5 . 8506Western Australia 48 13 33 105 1112 1764 989 1125 608 231 36 . . 6064Tasmania 6 9 11 132 505 1282 437 581 263 112 8 1 . 3347Northern Territory 42 . 32 61 335 388 333 340 209 52 9 . . 1801Overseas . 2 . . 12 31 198 262 463 298 99 29 5 1399Total 504 1262 542 2672 15100 28184 19907 31461 24637 11035 1911 515 118 137848Source: APSED
69
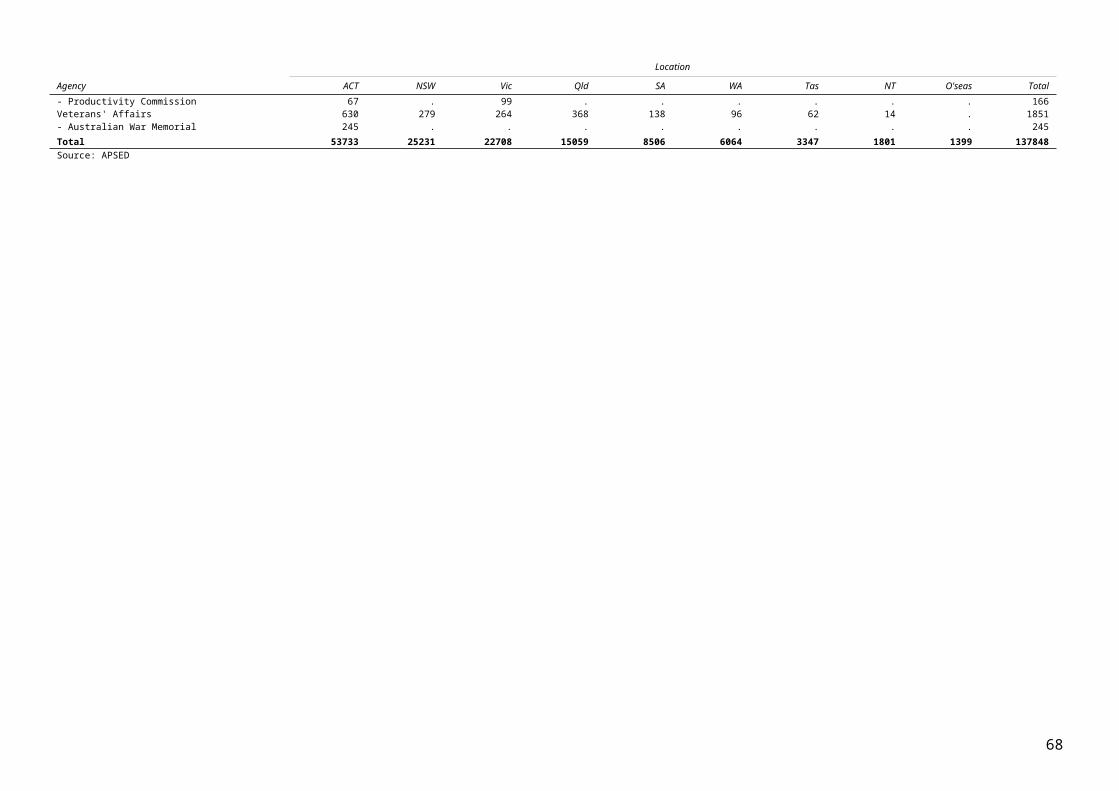
Table 28: Ongoing employees: mean age (years) by location, base classification and sex, 30 June 2016
Classification
Location Trainee Graduate APS 1 APS 2 APS 3 APS 4 APS 5 APS 6 EL 1 EL 2 SES 1 SES 2 SES 3 Total
Men
Australian Capital Territory 25.8 26.6 33.9 36.4 36.9 36.2 37.6 41.0 44.8 47.9 49.3 51.8 54.9 42.3New South Wales 34.4 27.1 47.1 48.4 44.3 44.7 47.2 47.4 47.0 49.6 50.5 56.1 60.0 46.4Victoria 29.8 26.7 49.0 48.4 44.0 44.2 45.4 46.1 46.6 49.0 51.4 51.3 48.5 45.6Queensland 26.6 28.2 49.0 47.8 42.4 44.1 45.5 46.5 47.1 48.8 48.7 57.0 51.0 45.3South Australia 24.4 27.9 54.9 43.6 43.0 43.9 44.6 44.6 47.4 51.1 49.4 53.0 . 45.3Western Australia 31.4 28.7 48.3 44.5 43.7 44.2 48.3 48.2 49.2 50.5 54.3 . . 46.7Tasmania . 30.7 55.6 39.5 41.6 45.0 47.0 46.8 47.1 48.7 47.8 57.0 . 45.5Northern Territory 29.2 . 45.7 44.8 42.2 43.8 47.2 47.5 49.7 49.4 52.8 . . 45.9Overseas . 26.0 . . 47.7 37.1 34.4 37.9 42.6 46.5 52.1 55.7 59.3 43.2Total men 28.0 26.8 43.6 44.6 42.6 42.8 43.0 44.1 45.7 48.6 49.8 52.4 54.9 44.3
Women
Australian Capital Territory 27.0 26.1 33.6 40.6 38.8 38.2 38.8 40.4 42.9 45.7 48.2 50.4 53.1 41.0New South Wales 27.5 26.6 45.5 46.5 44.0 44.0 44.5 44.1 44.2 46.7 50.5 52.9 53.0 44.2Victoria 33.7 25.8 46.8 45.8 44.1 44.0 42.8 43.6 43.7 46.1 49.0 53.3 49.5 43.8Queensland 29.4 25.9 49.9 44.8 43.1 43.8 44.5 45.0 45.3 46.6 48.0 55.0 . 44.1South Australia 24.2 28.9 53.2 44.3 44.4 43.6 43.5 44.4 46.3 48.9 49.3 61.0 . 44.3Western Australia 30.7 25.6 49.8 47.5 43.6 43.7 45.2 45.5 46.0 47.8 49.6 . . 44.5Tasmania 34.7 27.2 46.5 38.7 42.6 43.0 44.8 45.2 45.5 49.1 51.3 . . 43.6Northern Territory 28.8 . 47.8 43.2 37.7 41.2 43.2 43.5 46.6 48.0 45.0 . . 41.8Overseas . 31.0 . . 51.2 34.8 38.0 37.9 41.6 45.6 49.8 52.8 56.0 41.3Total women 28.8 26.1 44.7 44.7 43.2 42.8 41.8 42.4 43.5 46.0 48.5 51.1 53.1 42.9
Total
Australian Capital Territory 26.4 26.3 33.8 38.7 38.0 37.6 38.4 40.7 43.8 46.9 48.7 51.2 54.2 41.6New South Wales 29.7 26.9 46.3 47.2 44.1 44.2 45.6 45.5 45.6 48.3 50.5 54.9 56.5 45.0Victoria 31.4 26.3 47.7 46.5 44.1 44.0 43.9 44.8 45.3 47.9 50.5 52.3 49.0 44.6Queensland 28.4 27.2 49.6 45.7 42.9 43.9 44.9 45.6 46.2 47.9 48.4 56.0 51.0 44.6South Australia 24.4 28.3 53.9 44.1 43.9 43.7 44.0 44.5 47.0 50.5 49.4 54.6 . 44.8Western Australia 31.0 27.0 49.2 46.7 43.6 43.9 46.5 46.7 47.7 49.5 53.3 . . 45.4Tasmania 34.7 28.3 53.9 39.0 42.3 43.6 45.6 46.0 46.3 48.8 49.5 57.0 . 44.3Northern Territory 29.0 . 46.8 44.0 39.0 41.9 44.6 45.2 48.1 48.7 49.3 . . 43.3Overseas . 28.5 . . 50.3 35.7 36.6 37.9 42.2 46.1 51.4 55.2 58.0 42.3Total 28.5 26.4 44.2 44.7 43.0 42.8 42.3 43.1 44.6 47.5 49.2 51.9 54.2 43.5Source: APSED
70

Table 29: Ongoing employees: median length of service (years) by location, base classification and sex, 30 June 2016
Classification
Location APS 1 APS 2 APS 3 APS 4 APS 5 APS 6 EL 1 EL 2 SES 1 SES 2 SES 3 Total
Men
Australian Capital Territory 4 5 4 5 6 8 11 15 19 22 27 10New South Wales 12 12 9 11 12 13 12 13 14 16 6 11Victoria 10 16 9 10 11 11 13 16 17 22 5 11Queensland 11 11 8 10 11 12 14 15 16 11 0 11South Australia 11 8 9 9 10 10 15 20 23 28 . 11Western Australia 10 7 9 10 12 14 14 14 18 . . 11Tasmania 16 4 8 10 14 14 16 15 23 15 . 11Northern Territory 7 11 6 7 9 9 11 15 23 . . 9Overseas . . 18 4 5 8 12 17 25 31 40 12Total men 9 9 9 9 9 10 12 15 19 22 27 11
Women
Australian Capital Territory 4 6 5 6 7 9 11 15 18 21 27 10New South Wales 8 11 9 11 12 12 13 13 16 10 31 11Victoria 10 10 9 11 10 11 13 14 11 18 13 11Queensland 9 10 9 11 13 12 15 16 13 27 . 11South Australia 11 8 9 10 11 11 15 16 23 26 . 11Western Australia 10 9 8 11 12 13 14 14 14 . . 11Tasmania 13 4 9 10 12 14 14 15 16 . . 11Northern Territory 6 8 5 9 10 10 12 12 11 . . 9Overseas . . 16 5 6 8 12 15 22 17 31 11Total women 8 9 9 10 10 10 12 14 17 21 26 10
Total
Australian Capital Territory 4 5 5 5 7 9 11 15 18 21 27 10New South Wales 10 11 9 11 12 12 13 13 16 13 19 11Victoria 10 12 9 11 11 11 13 15 16 18 7 11Queensland 10 10 9 11 12 12 14 15 16 15 0 11South Australia 11 8 9 10 11 11 15 20 23 27 . 11Western Australia 10 9 8 11 12 14 14 14 17 . . 11Tasmania 15 4 9 10 13 14 15 15 18 15 . 11Northern Territory 7 8 5 8 10 10 11 12 16 . . 9Overseas . . 16 5 6 8 12 16 23 30 36 12Total 9 9 9 10 10 10 12 15 18 21 27 10Source: APSED
71

Section 4: Movements of ongoing employees
During 2015–16, there were 11,005 engagements and 9,759 separations of ongoing employees. The number of engagements included 727 ongoing employees who moved into coverage of the PS Act. The number of separations included 299 ongoing employees who moved out of coverage of the PS Act. Engagements increased by 362.4% from the previous year and separations decreased by 8.5%. Figure 13 shows the number of engagements and separations of ongoing employees for the past 15 years. It shows that the number of engagements increased after a decline over the previous four years.
Engagements During 2015–16, the number of ongoing engagements increased by 362.4%, after decreasing by 48.7% in 2014–15. This year saw increases in the number of engagements across all classifications. Compared to 2014–15, the classification with the largest percentage increase of engagements occurred at the APS 3–4 classification, increasing by 1,136.1% or 4,408 engagements, followed by the APS 5–6 classification increasing by 559.8% or 2,228.
Figure 14 shows that the greatest decline in engagements from 2014–15 to 2015–16, as a proportion of all ongoing engagements, was the Trainee and Graduate classification group, with a decrease of 33.9%. This is due to Trainees and Graduates having a high proportion of ongoing engagements over the last few years when engagements at all other classifications were restricted. During 2015–16, 1,649 Trainees and Graduates were engaged, an increase of 485 or 41.7% from 1,164 in 2014–15.
72

Figure 15 shows that the representation of ongoing engagements sharply decreased in the under 25 years age group. This can be attributed to the decrease in the proportion of graduates engaged-—10.3% of engagements in 2015-16 were at the graduate classification, compared to 43.6% in the previous year. Engagements of employees aged 35–44 increased from 14.0% of all ongoing engagements in 2014–15 to 21.4% in 2015–16.
73

Women accounted for 60.3% of all ongoing engagements during 2015–16, higher than their representation of 58.4% of all ongoing employees at June 2016.
The mean age of those engaged in 2015–16 was 34.3 years. For men the mean age was 34.4 years and for women it was 34.3 years.
Separations There were 9,759 separations of ongoing employees during 2015–16, a decrease of 8.5% from the 10,662 separations in the previous year.
Women accounted for 53.0% of all ongoing separations from the APS during 2015–16, lower than their ongoing representation of 58.4% at June 2016.
The number of resignations during 2015–16 was greater than the number of retrenchments for the first time since 2013. Resignations increased from 34.8% of all separations in 2014–15 to 42.0% in 2015–16. Retrenchments decreased from 42.7% to 29.1% of all separations. In 2015-16 age retirements accounted for 20.5% of all separations, an increase from 17.4% last year. The number of terminations in 2015–16 was 163, or 1.7%, compared to 141, or 1.3% last year.
This financial year was the second year data was collected to identify voluntary and involuntary redundancies. During 2015–16, 91.7% of retrenchments were voluntary and 4.1% were involuntary. The remaining 4.2% were SES Retirements. Compared to 2014–15, involuntary retrenchments decreased by 1.3%, and voluntary retrenchments increased by 0.4%.
74

75

Figure 17 shows the natural attrition rate for the APS in 2015–16 was 4.4%, up from 4.0% in 2014–15. Natural attrition includes resignations and age retirements only. The rate of other separations has decreased from 3.6% to 2.7% due to the decrease in the number of retrenchments. The overall separation rate from the APS was 7.1%, down from 7.6% during 2014–15.
Mobility within the APS Figure 18 shows how mobility between agencies has varied over the past 15 years. During 2015–16 the overall mobility rate of 2.4% was an increase from 1.6% in 2014-15. The transfer rate increased from 1.3% to 1.6% and the promotion rate increased from 0.4% to 0.8%.
Mobility has consistently been higher for women than for men. During 2015–16, the mobility rate for women was 2.6%, up from 1.8% in 2014–15. The mobility rate for men was 2.2%, up from
1.3% in 2014–15.
In general, mobility between agencies is higher at higher classifications. The mobility rate for the SES was 7.7%, up from 5.3% in the previous year. Mobility for EL employees was 3.5%, up from 1.8%, and mobility for APS 1–6 employees was 1.9%, up from 1.5%.
As expected, the number of agencies an employee has worked in increases at higher classification levels, similar to mobility between agencies. Of the current ongoing SES employees, 38.4% worked in only one agency compared with 62.6% of EL employees and 83.2% of APS 1–6 employees. At June 2016, 19.3% of SES employees worked in four or more agencies, compared with 6.6% of EL and 1.3% of APS 1–6 employees.
76

Table D: Ongoing employees: Number of agencies worked in, 2002 and 2016 Source: Table 22
Classification
One agency 2-3 agencies 4 or more agencies
% 2002 % 2016 % 2002 % 2016 % 2002 % 2016
APS 76.7 83.2 20.5 15.5 2.7 1.3
EL 55.9 62.6 33.1 30.8 10.9 6.6
SES 33.6 38.4 42.3 42.3 24.1 19.3
Total 72.1 76.9 23.3 20.0 4.6 3.1
Table 30: Engagements of ongoing employees: age group by sex, 2001-02 to 2015-16
Year ending June
Age group 2002 2003 2004 2005 2006 2007 2008 2009 2010 2011 2012 2013 2014 2015 2016
Men
Under 20 70 114 71 51 91 126 126 92 52 63 94 54 51 32 5620-24 866 1039 738 891 1307 1430 1213 996 853 1091 962 660 460 326 76625-29 983 1150 716 871 1303 1418 1134 1063 982 1171 1055 708 486 301 98630-34 887 985 604 773 1129 1136 975 756 669 906 753 525 310 155 73735-39 850 820 475 630 961 988 835 669 518 605 606 417 224 85 55640-44 792 820 509 592 855 825 629 527 429 550 542 317 168 81 41045-49 561 583 376 437 732 717 552 449 366 533 439 221 135 61 33850-54 323 403 253 319 494 493 397 321 259 391 324 194 95 52 25755-59 174 188 174 202 305 349 297 274 239 260 219 130 83 27 18860 and over 48 55 41 84 111 107 106 107 75 130 115 63 40 15 76Total men 5554 6157 3957 4850 7288 7589 6264 5254 4442 5700 5109 3289 2052 1135 4370
Women
Under 20 117 144 77 94 212 257 225 230 135 168 138 98 57 42 10220-24 1450 2070 1169 1480 2332 2674 2235 1866 1374 1689 1406 1028 635 376 124125-29 1528 2035 1176 1468 2448 2536 2055 1674 1416 1720 1426 1010 543 330 153330-34 1098 1484 853 1082 2000 1706 1347 1115 822 968 871 623 362 160 104635-39 813 1073 659 826 1709 1421 1217 899 645 773 670 420 246 81 73840-44 692 978 616 747 1659 1170 985 740 517 655 592 415 211 87 64645-49 483 689 482 540 1443 1051 884 647 428 536 458 329 202 69 55450-54 285 389 287 317 1062 633 502 389 307 359 336 225 159 56 43155-59 98 159 103 149 631 309 307 225 179 198 192 148 105 32 24060 and over 20 23 28 37 164 83 68 68 58 63 75 60 68 12 104Total women 6584 9044 5450 6740 13660 11840 9825 7853 5881 7129 6164 4356 2588 1245 6635
Total
Under 20 187 258 148 145 303 383 351 322 187 231 232 152 108 74 15820-24 2316 3109 1907 2371 3639 4104 3448 2862 2227 2780 2368 1688 1095 702 200725-29 2511 3185 1892 2339 3751 3954 3189 2737 2398 2891 2481 1718 1029 631 251930-34 1985 2469 1457 1855 3129 2842 2322 1871 1491 1874 1624 1148 672 315 178335-39 1663 1893 1134 1456 2670 2409 2052 1568 1163 1378 1276 837 470 166 129440-44 1484 1798 1125 1339 2514 1995 1614 1267 946 1205 1134 732 379 168 105645-49 1044 1272 858 977 2175 1768 1436 1096 794 1069 897 550 337 130 89250-54 608 792 540 636 1556 1126 899 710 566 750 660 419 254 108 68855-59 272 347 277 351 936 658 604 499 418 458 411 278 188 59 42860 and over 68 78 69 121 275 190 174 175 133 193 190 123 108 27 180Total 12138 15201 9407 11590 20948 19429 16089 13107 10323 12829 11273 7645 4640 2380 11005Source: APSED
77

78

Table 31: Engagements of ongoing employees: classification by sex, 2001-02 to 2015-16
Year ending June
Classification 2002 2003 2004 2005 2006 2007 2008 2009 2010 2011 2012 2013 2014 2015 2016
Men
Trainee 353 235 175 240 332 231 299 82 89 137 158 108 99 66 245Graduate 293 435 323 434 503 555 553 583 585 740 706 586 585 530 538APS 1 284 153 86 65 255 230 137 124 69 139 73 55 74 23 24APS 2 775 596 356 358 362 418 345 220 141 220 169 67 119 48 191APS 3 811 1673 860 1207 1903 1916 1550 1246 739 1059 725 485 163 82 979APS 4 1073 1010 523 555 838 969 749 555 451 648 650 453 161 57 598APS 5 472 570 396 427 795 842 731 548 538 704 722 349 170 71 536APS 6 846 788 612 667 1111 1171 931 802 796 970 924 511 293 121 572EL 1 445 486 402 586 738 783 619 713 713 757 644 426 261 82 390EL 2 174 182 197 277 386 382 295 307 275 282 278 211 103 34 191SES 1 17 20 22 27 50 65 44 46 29 30 35 27 10 13 76SES 2 8 8 4 6 14 23 8 24 14 12 16 10 13 6 22SES 3 3 1 1 1 1 4 3 4 3 2 9 1 1 2 8Total men 5554 6157 3957 4850 7288 7589 6264 5254 4442 5700 5109 3289 2052 1135 4370
Women
Trainee 421 282 70 168 316 167 211 71 107 141 141 175 148 60 270Graduate 419 497 385 551 659 812 786 680 640 754 692 651 568 508 596APS 1 226 202 127 125 991 869 366 299 125 230 87 75 107 14 29APS 2 885 736 632 733 858 836 711 460 280 486 287 198 164 106 349APS 3 1061 3517 1828 2522 5847 4388 3397 2760 1609 1989 1296 818 368 162 1768APS 4 1827 1960 775 812 1441 1491 1466 1108 870 1120 1115 767 298 87 1451APS 5 504 563 444 558 1350 1100 925 746 722 840 879 529 254 86 775APS 6 851 889 741 797 1284 1325 1205 1037 869 902 910 636 378 120 743EL 1 283 292 316 349 666 615 571 497 439 485 571 351 208 69 390EL 2 90 91 119 111 207 201 161 160 192 159 159 136 81 23 170SES 1 16 12 10 10 28 27 18 24 17 17 17 17 14 5 81SES 2 1 3 3 4 12 8 6 8 11 4 10 3 . 4 12SES 3 . . . . 1 1 2 3 . 2 . . . 1 1Total women 6584 9044 5450 6740 13660 11840 9825 7853 5881 7129 6164 4356 2588 1245 6635
Total
Trainee 774 517 245 408 648 398 510 153 196 278 299 283 247 126 515Graduate 712 932 708 985 1162 1367 1339 1263 1225 1494 1398 1237 1153 1038 1134APS 1 510 355 213 190 1246 1099 503 423 194 369 160 130 181 37 53APS 2 1660 1332 988 1091 1220 1254 1056 680 421 706 456 265 283 154 540APS 3 1872 5190 2688 3729 7750 6304 4947 4006 2348 3048 2021 1303 531 244 2747APS 4 2900 2970 1298 1367 2279 2460 2215 1663 1321 1768 1765 1220 459 144 2049APS 5 976 1133 840 985 2145 1942 1656 1294 1260 1544 1601 878 424 157 1311APS 6 1697 1677 1353 1464 2395 2496 2136 1839 1665 1872 1834 1147 671 241 1315EL 1 728 778 718 935 1404 1398 1190 1210 1152 1242 1215 777 469 151 780EL 2 264 273 316 388 593 583 456 467 467 441 437 347 184 57 361SES 1 33 32 32 37 78 92 62 70 46 47 52 44 24 18 157SES 2 9 11 7 10 26 31 14 32 25 16 26 13 13 10 34SES 3 3 1 1 1 2 5 5 7 3 4 9 1 1 3 9
79

Total 12138 15201 9407 11590 20948 19429 16089 13107 10323 12829 11273 7645 4640 2380 11005Source: APSED
80

Table 32: Engagements of ongoing employees: agency by major classification group, 2014-15 and 2015-16 *
Classification
Trainee & Graduate APS EL SES Total
Agency 2015 2016 2015 2016 2015 2016 2015 2016 2015 2016Agriculture and Water Resources 28 2 27 275 1 33 . 1 56 311- Australian Fisheries Management Authority 1 2 . 10 . . . . 1 12- APVMA . . . 35 . 7 . . . 42- Murray Darling Basin Authority 8 13 . 25 . 6 . . 8 44Attorney-General's 35 60 5 358 2 210 1 127 43 755- Administrative Appeals Tribunal . . . 7 1 3 . . 1 10- ACLEI . . . 3 . 5 . . . 8- AUSTRAC . . 8 28 2 15 . . 10 43- Australian Crime Commission . . 5 28 14 21 1 1 20 50- Australian Financial Security Authority . . 37 75 1 11 . 1 38 87- Australian Human Rights Commission . 4 7 12 . 1 . . 7 17- Commonwealth DPP . . 47 48 1 4 . 1 48 53- CrimTrac Agency 1 5 1 17 . 8 . . 2 30- Family Court and Federal Circuit Court . . 1 53 8 11 . . 9 64- Federal Court of Australia . . . 36 . 5 . . . 41- National Archives of Australia . . 1 10 . 3 . . 1 13- OAIC . . 3 22 . 1 . . 3 23- Office of Parliamentary Counsel . . 4 5 . 3 . . 4 8Communications and the Arts 6 8 4 32 1 7 1 1 12 48- ACMA . . 2 10 3 6 . . 5 16- Australian National Maritime Museum . . 4 9 2 8 . . 6 17- National Film and Sound Archive . . 7 10 . 4 . 1 7 15- National Library of Australia 1 2 8 20 . 2 . . 9 24- National Museum of Australia . . 2 6 . 1 . . 2 7- National Portrait Gallery . . . 5 . 1 . . . 6- Old Parliament House . . 2 10 1 3 . . 3 13- Screen Australia . . 1 . . . . . 1 .Defence 228 288 70 301 7 39 . 2 305 630- Defence Housing Australia . . 7 117 6 41 . . 13 158Education and Training 27 54 . 63 . 1 1 3 28 121- AIATSIS . . . 60 . 11 . . . 71- Australian Research Council . . . 12 . . . . . 12- Australian Skills Quality Authority . . 1 15 . 2 . . 1 17- TEQSA . . . 5 . 1 . . . 6Employment 33 49 3 77 1 15 . 1 37 142- Asbestos Safety and Eradication Agency . . . 1 . . . . . 1- Comcare 4 5 . 78 2 8 2 . 8 91- Fair Work Commission . . . 24 . 2 . . . 26- OFWBII 1 . 12 20 2 4 1 1 16 25- Office of the Fair Work Ombudsman 9 4 9 53 6 3 . . 24 60- Safe Work Australia 1 1 . 3 . 2 . . 1 6- Workplace Gender Equality Agency . . . 4 . 2 . 1 . 7Environment 17 29 14 142 6 9 . 1 37 181- Bureau of Meteorology 21 15 4 40 2 33 . . 27 88- Clean Energy Regulator 4 5 . 50 . 4 . . 4 59- Climate Change Authority . . . 1 . . . . . 1- GBRMPA . . 2 19 . . . . 2 19Finance 23 23 24 57 3 9 . 1 50 90- Australian Electoral Commission . 5 35 107 . 18 . 1 35 131
81

Classification
Trainee & Graduate APS EL SES Total
Agency 2015 2016 2015 2016 2015 2016 2015 2016 2015 2016- Future Fund Management Agency . . 7 33 3 8 . . 10 41Foreign Affairs and Trade 41 33 12 48 2 14 2 1 57 96- ACIAR . . . 7 . . . . . 7- AUSTRADE . . 1 24 4 22 1 5 6 51Health 39 13 49 332 26 48 . 7 114 400- Australian Aged Care Quality Agency . . . 4 . 1 . . . 5- ACSQHC . . . 3 3 12 . . 3 15- Australian Institute of Health and Welfare 5 9 3 21 . . . . 8 30- ARPANSA . . 1 5 1 8 1 1 3 14- Australian Sports Anti-Doping Authority . . . 2 . 1 . . . 3- Cancer Australia . . . 8 . 4 . . . 12- FSANZ . . 1 2 3 1 . . 4 3- Independent Hospital Pricing Authority . . . 7 4 2 . . 4 9- National Blood Authority . . 1 10 . 2 . . 1 12- NHMRC . . 2 17 . 3 . . 2 20- National Health Funding Body . . . 2 . 1 . . . 3- National Health Performance Authority . . . . . 8 . . . 8- National Mental Health Commission . . . . . 2 . . . 2- Organ and Tissue Authority . . 2 . . 1 . . 2 1- Professional Services Review . . . 2 . 1 . . . 3Human Services 114 279 107 2269 8 22 4 2 233 2572Immigration and Border Protection 44 232 8 902 5 75 2 13 59 1222Industry, Innovation and Science 50 79 58 312 5 68 1 . 114 459- NOPSEMA . . . 9 4 1 . . 4 10Infrastructure and Regional Development 27 34 3 62 2 16 3 1 35 113- Australian Transport Safety Bureau . . 5 6 1 4 . . 6 10- National Capital Authority . . 1 7 1 4 . . 2 11Prime Minister and Cabinet 18 30 26 81 26 22 1 2 71 135- Aboriginal Hostels Ltd. 1 2 . 13 . 2 . . 1 17- ANAO 13 19 3 24 2 3 . 1 18 47- Australian Public Service Commission . . . 10 . 6 . . . 16- Commonwealth Ombudsman . . 5 15 . 3 . . 5 18- Digital Transformation Office . . . 1 . 4 . 1 . 6- OIGIS . . . 2 . 1 . . . 3- Office of National Assessments . . 2 2 2 6 . . 4 8- Torres Strait Regional Authority . . . 3 . . . . . 3Social Services 49 63 13 72 1 9 1 . 64 144- Australian Institute of Family Studies . . . 1 . 3 . . . 4- National Disability Insurance Agency . . 124 240 21 49 2 10 147 299Treasury 22 41 . 26 1 14 . 2 23 83- Australian Bureau of Statistics 41 132 1 98 . 7 . 1 42 238- ACCC 9 38 1 46 . 18 . 1 10 103- ASIC 16 17 2 150 1 56 . . 19 223- Australian Taxation Office 178 30 92 623 6 10 4 7 280 670- Productivity Commission 5 7 1 4 . 4 . . 6 15Veterans' Affairs 15 17 20 82 . 6 1 1 36 106- Australian War Memorial . . 6 26 1 4 . . 7 30Customs & Border Protection (NC) 29 . 62 . 3 . 1 . 95 .MRT - RRT (NC) . . 1 . . . . . 1 .Australian Institute of Criminology (NC) . . . 4 . 2 . . . 6Total 1164 1649 977 8015 208 1141 31 200 2380 11005Source: APSED
82

Classification
Trainee & Graduate APS EL SES Total
Agency 2015 2016 2015 2016 2015 2016 2015 2016 2015 2016* A number of agencies were affected by machinery-of-government changes changes during 2015-16. Appendixes 3 and 4 should be noted when making comparisons between the two years' data.
83

Table 33: Engagements of ongoing employees: age group by classification and sex, 2015-16
Classification
Age group Trainee Graduate APS 1 APS 2 APS 3 APS 4 APS 5 APS 6 EL 1 EL 2 SES 1 SES 2 SES 3 Total
Men
Under 20 20 3 8 11 12 2 . . . . . . . 5620-24 70 237 3 69 192 103 71 19 2 . . . . 76625-29 65 196 7 47 220 168 155 99 25 4 . . . 98630-34 33 66 1 14 173 108 112 126 79 23 2 . . 73735-39 25 22 1 11 147 69 68 89 77 38 8 1 . 55640-44 15 7 2 8 86 50 37 81 63 46 10 4 1 41045-49 13 5 1 9 61 41 39 62 53 31 17 6 . 33850-54 4 1 . 10 45 28 34 43 43 26 12 7 4 25755-59 . 1 1 6 29 21 14 36 39 18 18 3 2 18860 and over . . . 6 14 8 6 17 9 5 9 1 1 76Total men 245 538 24 191 979 598 536 572 390 191 76 22 8 4370
Women
Under 20 30 1 15 19 22 15 . . . . . . . 10220-24 76 331 2 69 362 315 64 21 1 . . . . 124125-29 56 193 2 71 400 377 236 159 36 3 . . . 153330-34 36 42 2 31 277 197 151 167 99 42 2 . . 104635-39 31 13 3 38 199 123 77 122 84 37 10 1 . 73840-44 18 7 1 42 182 129 70 90 58 29 20 . . 64645-49 12 7 2 32 148 124 66 72 52 18 18 3 . 55450-54 9 1 1 29 105 95 52 61 39 17 19 3 . 43155-59 2 . 1 13 56 42 40 37 16 20 10 3 . 24060 and over . 1 . 5 17 34 19 14 5 4 2 2 1 104Total women 270 596 29 349 1768 1451 775 743 390 170 81 12 1 6635
Total
Under 20 50 4 23 30 34 17 . . . . . . . 15820-24 146 568 5 138 554 418 135 40 3 . . . . 200725-29 121 389 9 118 620 545 391 258 61 7 . . . 251930-34 69 108 3 45 450 305 263 293 178 65 4 . . 178335-39 56 35 4 49 346 192 145 211 161 75 18 2 . 129440-44 33 14 3 50 268 179 107 171 121 75 30 4 1 105645-49 25 12 3 41 209 165 105 134 105 49 35 9 . 89250-54 13 2 1 39 150 123 86 104 82 43 31 10 4 68855-59 2 1 2 19 85 63 54 73 55 38 28 6 2 42860 and over . 1 . 11 31 42 25 31 14 9 11 3 2 180Total 515 1134 53 540 2747 2049 1311 1315 780 361 157 34 9 11005Source: APSED
84

Table 34: Engagements of ongoing employees: prior service in APS by classification and sex, 2015-16
Classification
Prior service in APS (years) Trainee Graduate APS 1 APS 2 APS 3 APS 4 APS 5 APS 6 EL 1 EL 2 SES 1 SES 2 SES 3 Total
Men
None 226 462 18 115 541 246 317 288 151 85 33 7 4 2493Under 1 13 52 2 19 168 167 68 55 46 14 2 2 . 6081 and < 2 2 7 1 9 104 61 51 47 28 15 3 2 . 3302 and < 3 2 8 1 15 93 53 29 34 31 13 3 1 . 2833 and < 5 . 5 . 24 55 32 33 48 38 24 3 2 . 2645 and < 10 . 4 2 8 6 19 21 53 45 16 11 1 . 18610 and < 15 1 . . 1 3 13 8 22 28 14 10 4 1 10515 and < 20 1 . . . 4 3 3 9 8 7 5 3 1 4420 and < 30 . . . . 2 3 3 9 11 2 5 . 1 3630 and over . . . . 3 1 3 7 4 1 1 . 1 21Total men 245 538 24 191 979 598 536 572 390 191 76 22 8 4370
Women
None 243 504 17 157 812 577 379 356 146 66 35 4 . 3296Under 1 18 60 3 54 333 422 117 103 54 16 6 2 . 11881 and < 2 . 19 . 24 278 160 75 62 34 14 7 . . 6732 and < 3 5 7 2 43 201 122 50 56 29 18 2 . . 5353 and < 5 . 6 1 45 111 70 76 61 35 18 6 . . 4295 and < 10 3 . 5 19 20 52 41 57 51 16 11 1 . 27610 and < 15 1 . 1 4 7 31 16 23 24 8 5 3 . 12315 and < 20 . . . 2 3 11 8 9 8 6 6 2 . 5520 and < 30 . . . 1 3 5 8 10 8 5 3 . 1 4430 and over . . . . . 1 5 6 1 3 . . . 16Total women 270 596 29 349 1768 1451 775 743 390 170 81 12 1 6635
Total
None 469 966 35 272 1353 823 696 644 297 151 68 11 4 5789Under 1 31 112 5 73 501 589 185 158 100 30 8 4 . 17961 and < 2 2 26 1 33 382 221 126 109 62 29 10 2 . 10032 and < 3 7 15 3 58 294 175 79 90 60 31 5 1 . 8183 and < 5 . 11 1 69 166 102 109 109 73 42 9 2 . 6935 and < 10 3 4 7 27 26 71 62 110 96 32 22 2 . 46210 and < 15 2 . 1 5 10 44 24 45 52 22 15 7 1 22815 and < 20 1 . . 2 7 14 11 18 16 13 11 5 1 9920 and < 30 . . . 1 5 8 11 19 19 7 8 . 2 8030 and over . . . . 3 2 8 13 5 4 1 . 1 37Total 515 1134 53 540 2747 2049 1311 1315 780 361 157 34 9 11005Source: APSEDNote: prior service includes service as a non-ongoing employee prior to being engaged as an ongoing employee, as well as prior ongoing employment in the APS where that service has been recorded on APSED.Note: classification is the level at engagement, not the classification of the prior service.
85

Table 35: Engagements of ongoing employees: highest educational qualification by classification and sex, 2015-16
Classification
Highest educational qualification Trainee Graduate APS 1 APS 2 APS 3 APS 4 APS 5 APS 6 EL 1 EL 2 SES 1 SES 2 SES 3 Total
Men
Doctorate . 4 . . 1 1 9 33 23 8 . 1 . 80Masters 2 27 . 3 18 13 35 40 33 14 2 . . 187Postgraduate diploma 6 8 . 1 8 11 10 30 14 8 4 . . 100Bachelor degree 6 126 . 16 73 61 91 89 62 26 14 6 5 575Undergraduate diploma 5 . . 1 15 7 11 7 7 . . . . 53Associate diploma 6 2 . 7 33 11 19 16 16 2 1 . . 113Skilled vocational qualification 4 . . 5 12 6 7 8 3 . . . . 45Basic vocational qualification 2 . . 1 4 3 1 5 . . . . . 16Year 12 7 3 1 5 29 14 10 7 8 1 2 2 . 89Year 11 . . . 1 3 3 3 . . . . . . 10Year 10 2 . . 2 6 1 . . 1 . . . . 12Less than year 10 . . . . . . . . . . . . . .No data 205 368 23 149 777 467 340 337 223 132 53 13 3 3090Total men 245 538 24 191 979 598 536 572 390 191 76 22 8 4370
Women
Doctorate . 7 . . 2 1 10 40 13 5 . 2 . 80Masters . 37 . 4 26 39 36 37 40 19 . 1 . 239Postgraduate diploma 1 14 . 4 16 29 22 30 27 6 4 1 . 154Bachelor degree 5 145 . 21 110 126 96 104 58 16 17 1 1 700Undergraduate diploma 5 4 . . 16 15 14 10 3 2 . . . 69Associate diploma 8 1 . 19 62 48 17 15 6 1 . . . 177Skilled vocational qualification 4 . . 8 30 24 3 6 . . . . . 75Basic vocational qualification 2 . . 9 13 14 6 3 . . . . . 47Year 12 14 6 . 18 30 69 23 13 5 1 2 1 . 182Year 11 3 . . 4 6 4 2 1 . . . . . 20Year 10 1 . . 2 5 9 8 . 1 . . . . 26Less than year 10 . . . . 1 1 . 1 . . . . . 3No data 227 382 29 260 1451 1072 538 483 237 120 58 6 . 4863Total women 270 596 29 349 1768 1451 775 743 390 170 81 12 1 6635
Total
Doctorate . 11 . . 3 2 19 73 36 13 . 3 . 160Masters 2 64 . 7 44 52 71 77 73 33 2 1 . 426Postgraduate diploma 7 22 . 5 24 40 32 60 41 14 8 1 . 254Bachelor degree 11 271 . 37 183 187 187 193 120 42 31 7 6 1275Undergraduate diploma 10 4 . 1 31 22 25 17 10 2 . . . 122Associate diploma 14 3 . 26 95 59 36 31 22 3 1 . . 290Skilled vocational qualification 8 . . 13 42 30 10 14 3 . . . . 120Basic vocational qualification 4 . . 10 17 17 7 8 . . . . . 63Year 12 21 9 1 23 59 83 33 20 13 2 4 3 . 271Year 11 3 . . 5 9 7 5 1 . . . . . 30Year 10 3 . . 4 11 10 8 . 2 . . . . 38Less than year 10 . . . . 1 1 . 1 . . . . . 3No data 432 750 52 409 2228 1539 878 820 460 252 111 19 3 7953
86

Total 515 1134 53 540 2747 2049 1311 1315 780 361 157 34 9 11005Source: APSED
87

Table 36: Engagements of ongoing employees: previous employment by classification and sex, 2015-16
Classification
Previous employment Trainee Graduate APS 1 APS 2 APS 3 APS 4 APS 5 APS 6 EL 1 EL 2 SES 1 SES 2 SES 3 Total
Men
Private sector 5 36 4 16 63 58 64 97 69 34 5 1 . 452Commonwealth public sector . 12 . 5 11 19 21 36 25 15 2 . . 146State and local government public sector . 11 . 5 7 8 16 24 21 10 1 . . 103Self employed 1 1 . 5 3 1 1 7 6 2 . . . 27Student 3 62 6 8 21 9 13 9 4 3 1 . . 139Unemployed (looking for work) 1 2 . 6 7 9 4 6 4 2 1 . . 42Not in labour force (not looking for work) . 3 . 2 . . 2 5 2 1 . . . 15NGO/Charity . 4 1 1 3 4 3 4 4 1 . . . 25No data 235 407 13 143 864 490 412 384 255 123 66 21 8 3421Total men 245 538 24 191 979 598 536 572 390 191 76 22 8 4370
Women
Private sector 5 44 5 63 116 148 93 111 56 23 4 1 . 669Commonwealth public sector 2 5 . 12 17 60 25 30 17 8 1 1 . 178State and local government public sector . 14 . 15 17 32 25 54 27 10 2 . . 196Self employed . 1 1 5 2 2 2 7 3 4 . . . 27Student . 61 8 15 24 13 14 19 7 2 . . . 163Unemployed (looking for work) 2 3 1 18 17 11 6 8 4 1 1 . . 72Not in labour force (not looking for work) 1 . 3 3 2 5 3 3 2 . . . . 22NGO/Charity . 11 . 4 6 13 9 11 5 1 . . . 60No data 260 457 11 214 1567 1167 598 500 269 121 73 10 1 5248Total women 270 596 29 349 1768 1451 775 743 390 170 81 12 1 6635
Total
Private sector 10 80 9 79 179 206 157 208 125 57 9 2 . 1121Commonwealth public sector 2 17 . 17 28 79 46 66 42 23 3 1 . 324State and local government public sector . 25 . 20 24 40 41 78 48 20 3 . . 299Self employed 1 2 1 10 5 3 3 14 9 6 . . . 54Student 3 123 14 23 45 22 27 28 11 5 1 . . 302Unemployed (looking for work) 3 5 1 24 24 20 10 14 8 3 2 . . 114Not in labour force (not looking for work) 1 3 3 5 2 5 5 8 4 1 . . . 37NGO/Charity . 15 1 5 9 17 12 15 9 2 . . . 85No data 495 864 24 357 2431 1657 1010 884 524 244 139 31 9 8669Total 515 1134 53 540 2747 2049 1311 1315 780 361 157 34 9 11005Source: APSED
88

Table 37: Engagements of ongoing employees: location by classification and sex, 2015-16
Classification
Location Trainee Graduate APS 1 APS 2 APS 3 APS 4 APS 5 APS 6 EL 1 EL 2 SES 1 SES 2 SES 3 Total
Men
Australian Capital Territory 57 426 17 48 197 251 277 334 223 91 40 16 7 1984New South Wales 71 20 2 56 260 102 50 84 52 37 16 2 . 752Victoria 38 58 5 16 195 87 59 85 63 31 11 1 . 649Queensland 25 13 . 17 139 65 66 32 31 11 1 2 1 403South Australia 17 11 . 15 65 44 44 13 3 6 1 1 . 220Western Australia 22 6 . 7 62 23 22 7 11 8 5 . . 173Tasmania 1 4 . 26 45 18 9 5 1 2 . . . 111Northern Territory 14 . . 6 16 8 8 11 6 2 1 . . 72Overseas . . . . . . 1 1 . 3 1 . . 6Total men 245 538 24 191 979 598 536 572 390 191 76 22 8 4370
Women
Australian Capital Territory 57 490 17 39 217 771 441 417 207 93 54 9 1 2813New South Wales 74 28 4 112 496 191 85 153 80 31 11 2 . 1267Victoria 26 51 7 60 370 147 129 73 62 25 7 1 . 958Queensland 55 9 1 50 316 159 48 46 12 8 4 . . 708South Australia 7 6 . 28 113 73 24 12 9 6 1 . . 279Western Australia 21 6 . 12 124 56 28 18 12 3 4 . . 284Tasmania 7 5 . 40 88 33 4 10 5 1 . . . 193Northern Territory 23 1 . 8 44 18 16 14 3 2 . . . 129Overseas . . . . . 3 . . . 1 . . . 4Total women 270 596 29 349 1768 1451 775 743 390 170 81 12 1 6635
Total
Australian Capital Territory 114 916 34 87 414 1022 718 751 430 184 94 25 8 4797New South Wales 145 48 6 168 756 293 135 237 132 68 27 4 . 2019Victoria 64 109 12 76 565 234 188 158 125 56 18 2 . 1607Queensland 80 22 1 67 455 224 114 78 43 19 5 2 1 1111South Australia 24 17 . 43 178 117 68 25 12 12 2 1 . 499Western Australia 43 12 . 19 186 79 50 25 23 11 9 . . 457Tasmania 8 9 . 66 133 51 13 15 6 3 . . . 304Northern Territory 37 1 . 14 60 26 24 25 9 4 1 . . 201Overseas . . . . . 3 1 1 . 4 1 . . 10Total 515 1134 53 540 2747 2049 1311 1315 780 361 157 34 9 11005Source: APSED
89

Table 38: Engagements of ongoing employees: mean age (years) by location, classification and sex, 2015-16
Classification
Location Trainee Graduate APS 1 APS 2 APS 3 APS 4 APS 5 APS 6 EL 1 EL 2 SES 1 SES 2 SES 3 Total
Men
Australian Capital Territory 26.1 26.3 24.5 26.4 31.7 31.5 33.7 38.1 41.5 42.6 49.3 48.9 54.3 33.7New South Wales 30.6 26.7 26.5 33.8 33.7 33.5 37.9 38.3 41.6 45.5 49.3 55.0 . 35.5Victoria 30.4 25.9 39.4 25.5 33.3 35.8 35.7 39.2 41.0 42.7 48.2 58.0 . 35.1Queensland 27.5 28.3 . 28.6 33.9 35.2 30.3 41.6 41.0 47.6 59.0 54.5 51.0 34.5South Australia 23.5 27.9 . 31.9 32.2 34.9 28.3 37.5 39.3 39.8 48.0 43.0 . 31.8Western Australia 33.1 22.3 . 27.1 36.7 32.3 39.3 38.9 44.9 45.5 55.2 . . 36.6Tasmania 49.0 28.3 . 35.5 35.0 38.1 40.2 49.4 34.0 50.0 . . . 36.9Northern Territory 27.5 . . 26.0 31.8 40.1 40.0 44.5 48.0 43.0 52.0 . . 36.2Overseas . . . . . . 31.0 41.0 . 41.7 61.0 . . 43.0Total men 28.8 26.3 27.8 30.4 33.4 33.5 33.9 38.7 41.6 43.6 49.8 50.1 53.9 34.4
Women
Australian Capital Territory 27.3 25.5 21.8 29.8 28.7 33.0 34.7 37.6 40.0 42.1 46.9 52.6 63.0 33.2New South Wales 28.1 25.7 23.8 37.2 35.1 35.0 37.5 36.8 38.2 42.9 45.0 56.0 . 35.5Victoria 36.0 25.4 41.7 33.5 33.0 35.0 36.3 38.3 38.3 42.4 48.6 48.0 . 34.6Queensland 28.9 25.4 22.0 32.6 34.9 34.8 35.0 40.4 39.3 37.6 46.3 . . 34.6South Australia 34.0 28.5 . 37.0 36.0 31.3 34.7 34.1 40.6 40.5 40.0 . . 34.7Western Australia 30.2 25.2 . 31.2 35.8 35.3 46.1 39.1 40.3 40.7 49.0 . . 36.5Tasmania 32.7 25.4 . 34.2 34.8 35.3 41.3 41.6 44.6 44.0 . . . 35.2Northern Territory 27.2 31.0 . 32.6 30.6 34.3 34.5 36.4 39.7 44.5 . . . 32.2Overseas . . . . . 43.3 . . . 41.0 . . . 42.8Total women 29.2 25.6 26.9 34.4 33.8 33.7 35.7 37.7 39.4 42.0 46.7 52.8 63.0 34.3
Total
Australian Capital Territory 26.7 25.9 23.1 28.0 30.2 32.6 34.3 37.8 40.8 42.3 47.9 50.2 55.4 33.4New South Wales 29.3 26.1 24.7 36.1 34.6 34.5 37.6 37.3 39.5 44.4 47.5 55.5 . 35.5Victoria 32.7 25.7 40.8 31.8 33.1 35.3 36.1 38.8 39.7 42.6 48.3 53.0 . 34.8Queensland 28.5 27.1 22.0 31.6 34.6 34.9 32.3 40.9 40.5 43.4 48.8 54.5 51.0 34.6South Australia 26.6 28.1 . 35.2 34.6 32.7 30.6 35.9 40.3 40.2 44.0 43.0 . 33.4Western Australia 31.7 23.8 . 29.7 36.1 34.4 43.1 39.0 42.5 44.2 52.4 . . 36.6Tasmania 34.8 26.7 . 34.7 34.8 36.3 40.5 44.2 42.8 48.0 . . . 35.8Northern Territory 27.3 31.0 . 29.8 30.9 36.1 36.3 39.9 45.2 43.8 52.0 . . 33.6Overseas . . . . . 43.3 31.0 41.0 . 41.5 61.0 . . 42.9Total 29.0 25.9 27.3 33.0 33.7 33.7 35.0 38.1 40.5 42.8 48.2 51.0 54.9 34.3Source: APSED
90

Table 39: Promotions of ongoing employees: classification promoted from and to by sex, 2015-16
Classification promoted to
Classification promoted from Graduate APS 2 APS 3 APS 4 APS 5 APS 6 EL 1 EL 2 SES 1 SES 2 SES 3 Total
Men
Trainee . . 35 4 1 1 . . . . . 41Graduate . . . 28 18 8 . . . . . 54APS 1 3 16 21 13 7 . . . . . . 60APS 2 3 . 97 20 20 7 . . . . . 147APS 3 . . . 323 181 24 2 . . . . 530APS 4 . . . 1 724 341 15 1 . . . 1082APS 5 . . . . . 1053 39 2 . . . 1094APS 6 . . . . . . 857 12 . . . 869EL 1 . . . . . . . 380 . . . 380EL 2 . . . . . . . . 91 4 . 95SES 1 . . . . . . . . . 39 . 39SES 2 . . . . . . . . . . 11 11Total men 6 16 153 389 951 1434 913 395 91 43 11 4402
Women
Trainee 1 . 22 2 1 . . . . . . 26Graduate . . . 40 21 5 1 . . . . 67APS 1 2 20 33 9 3 . . . . . . 67APS 2 2 . 228 56 12 1 . . . . . 299APS 3 . . . 817 222 36 . . . . . 1075APS 4 . . . . 1287 466 15 . . . . 1768APS 5 . . . . . 1572 55 . . . . 1627APS 6 . . . . . . 1032 8 . . . 1040EL 1 . . . . . . . 512 . . . 512EL 2 . . . . . . . . 125 1 . 126SES 1 . . . . . . . . . 28 . 28SES 2 . . . . . . . . . . 9 9Total women 5 20 283 924 1546 2080 1103 520 125 29 9 6644
Total
Trainee 1 . 57 6 2 1 . . . . . 67Graduate . . . 68 39 13 1 . . . . 121APS 1 5 36 54 22 10 . . . . . . 127APS 2 5 . 325 76 32 8 . . . . . 446APS 3 . . . 1140 403 60 2 . . . . 1605APS 4 . . . 1 2011 807 30 1 . . . 2850APS 5 . . . . . 2625 94 2 . . . 2721APS 6 . . . . . . 1889 20 . . . 1909EL 1 . . . . . . . 892 . . . 892EL 2 . . . . . . . . 216 5 . 221SES 1 . . . . . . . . . 67 . 67SES 2 . . . . . . . . . . 20 20Total 11 36 436 1313 2497 3514 2016 915 216 72 20 11046Source: APSED
91

Table 40: Promotions of ongoing employees: mean age (years) by location, classification and sex, 2015-16
Classification
Location Graduate APS 2 APS 3 APS 4 APS 5 APS 6 EL 1 EL 2 SES 1 SES 2 SES 3 Total
Men
Australian Capital Territory 25.0 21.0 27.4 30.0 30.6 32.5 35.0 39.1 44.6 46.1 52.3 33.8New South Wales 31.0 . 34.1 34.0 36.4 35.8 38.8 37.4 40.0 . 59.0 36.3Victoria 35.0 32.8 36.7 36.3 34.8 36.1 38.0 39.8 52.7 50.0 . 36.6Queensland . . 35.4 36.7 35.3 37.3 36.1 42.0 46.7 . . 36.9South Australia . . 33.0 36.6 33.6 35.3 37.5 39.1 . 58.0 . 35.6Western Australia . . 30.4 35.4 37.6 38.2 41.8 44.8 41.0 . . 37.4Tasmania . 28.0 35.0 34.4 39.8 37.6 42.3 42.8 . 56.0 . 37.4Northern Territory . . 51.0 37.5 38.9 36.2 40.4 42.0 49.0 . . 39.5Overseas . . . 32.0 49.0 32.0 34.3 38.0 45.0 . . 34.0Total men 29.7 28.2 33.4 33.7 33.0 34.0 36.1 39.3 44.7 46.9 52.9 35.0
Women
Australian Capital Territory 23.7 . 30.7 31.6 31.8 32.8 35.2 39.9 42.8 47.9 49.9 34.1New South Wales . 31.6 41.0 39.3 35.1 36.4 38.1 41.2 49.9 40.0 53.0 37.8Victoria 35.0 38.3 41.0 38.3 37.0 35.5 38.5 39.2 45.4 51.0 . 37.5Queensland 27.0 19.0 43.3 38.5 37.7 38.3 40.8 41.8 42.3 . . 39.1South Australia . . 38.9 40.3 36.5 37.5 40.1 39.8 51.0 . . 38.3Western Australia . . 44.1 36.1 35.5 38.1 40.8 38.1 . . . 37.7Tasmania . 41.3 32.5 40.8 38.3 38.1 39.7 45.6 49.0 . . 39.3Northern Territory . . 38.0 31.4 40.3 39.3 34.0 43.9 45.3 . . 37.5Overseas . . . 40.5 28.0 32.7 35.2 38.2 59.0 . . 34.5Total women 26.6 36.3 39.7 36.7 33.9 34.3 36.4 40.1 43.9 47.7 50.2 35.9
Total
Australian Capital Territory 24.2 21.0 29.4 31.1 31.3 32.7 35.1 39.6 43.6 46.8 51.2 34.0New South Wales 31.0 31.6 38.7 37.9 35.6 36.2 38.4 39.8 45.9 40.0 56.0 37.3Victoria 35.0 36.5 39.7 37.7 36.2 35.7 38.2 39.5 47.1 50.2 . 37.1Queensland 27.0 19.0 40.7 38.2 36.7 37.8 39.0 41.9 45.4 . . 38.3South Australia . . 36.0 39.1 35.4 36.7 38.7 39.2 51.0 58.0 . 37.2Western Australia . . 38.7 35.8 36.4 38.1 41.2 40.5 41.0 . . 37.6Tasmania . 32.4 33.2 39.2 38.8 37.9 40.3 44.2 49.0 56.0 . 38.6Northern Territory . . 40.6 32.8 39.7 38.7 38.0 43.3 46.3 . . 38.1Overseas . . . 37.7 38.5 32.4 34.8 38.1 52.0 . . 34.3Total 28.3 32.7 37.5 35.8 33.6 34.2 36.3 39.8 44.3 47.3 51.7 35.5Source: APSED
92

Table 41: Promotions of ongoing employees: agency by classification, 2015-16
Classification
Agency Graduate APS 2 APS 3 APS 4 APS 5 APS 6 EL 1 EL 2 SES 1 SES 2 SES 3 Total
Agriculture and Water Resources . 2 6 35 131 125 75 23 5 2 1 405- Australian Fisheries Management Authority . . . 1 3 12 7 . . . . 23- APVMA . . . 3 8 10 12 6 . . . 39- Murray Darling Basin Authority . . . . 5 12 5 2 . . . 24Attorney-General's . . 1 18 21 52 64 41 3 2 1 203- Administrative Appeals Tribunal . . . 1 3 7 1 1 . . . 13- ACLEI . . . . . 1 1 . . . . 2- AUSTRAC . . . 1 7 9 19 6 1 . . 43- Australian Crime Commission . . . 4 12 15 6 5 1 . . 43- Australian Financial Security Authority . . 1 26 15 12 4 . . . . 58- Australian Human Rights Commission . . . . . . 1 1 . . . 2- Australian Law Reform Commission . . . . . . 1 . . . . 1- Commonwealth DPP . . 1 3 44 9 34 2 1 1 . 95- CrimTrac Agency . . 1 3 9 6 4 1 . . . 24- Family Court and Federal Circuit Court . . 5 6 8 4 2 . 1 . . 26- Federal Court of Australia . . 1 . 1 6 3 2 . . . 13- National Archives of Australia . . 1 6 2 6 6 2 . . . 23- OAIC . . . . . 5 4 2 . . . 11- Office of Parliamentary Counsel . . . . 7 2 . 5 3 . 1 18Communications and the Arts . . 1 2 15 15 20 9 2 . . 64- ACMA . . . . . 2 3 . . . . 5- Australian National Maritime Museum . . . 3 . 2 1 . . . . 6- National Film and Sound Archive . . . 4 1 2 1 1 . . . 9- National Library of Australia . . 5 2 13 3 2 1 1 . . 27- National Museum of Australia . . 1 3 1 3 2 . 1 . . 11- National Portrait Gallery . . . . . 1 . . . . . 1- Old Parliament House . . . 1 3 2 . . . . . 6Defence . . 32 26 176 220 138 52 13 10 . 667- Defence Housing Australia . . . . 20 4 11 7 1 . . 43Education and Training . . 2 3 24 53 5 4 7 5 . 103- AIATSIS . . . 2 3 4 3 1 . . . 13- Australian Research Council . . . . . 4 4 1 . . . 9- Australian Skills Quality Authority . . . . 1 10 8 6 2 . . 27- TEQSA . . . . 1 1 . . . . . 2Employment . . . 6 12 18 15 9 1 . . 61- Asbestos Safety and Eradication Agency . . . . . . 1 . . . . 1- Comcare . . 3 19 24 22 13 7 . . . 88- Fair Work Commission . . . . 4 2 2 . 1 . . 9- OFWBII . . . . 3 6 3 . . . . 12- Office of the Fair Work Ombudsman . . 1 3 3 18 10 3 . . . 38- Safe Work Australia . . . . 2 3 4 2 1 . . 12Environment 1 . 4 10 65 77 9 24 4 4 1 199- Bureau of Meteorology . . 1 . 3 13 23 10 . 1 . 51- Clean Energy Regulator . . . 5 17 18 11 5 . . . 56- GBRMPA . . 2 3 2 5 2 3 . . . 17Finance . 1 10 18 45 66 48 21 7 4 1 221- Australian Electoral Commission . . 14 6 17 23 19 2 . . . 81- Future Fund Management Agency . . . 1 1 . . . . . . 2Foreign Affairs and Trade 1 . 1 12 12 172 75 79 6 1 1 360- ACIAR . . . . 1 1 1 . . . . 3- AUSTRADE . . . . 5 3 13 8 3 . 2 34Health . . 2 43 138 220 88 37 16 6 . 550
93

Classification
Agency Graduate APS 2 APS 3 APS 4 APS 5 APS 6 EL 1 EL 2 SES 1 SES 2 SES 3 Total
- Australian Aged Care Quality Agency . . . . 1 . . . 2 . . 3- ACSQHC . . . 1 2 2 . 3 . . . 8- Australian Institute of Health and Welfare . . . 2 18 12 . 3 . . . 35- ARPANSA . . . 1 3 3 1 3 . . . 11- Cancer Australia . . . . 3 3 1 . 1 . . 8- FSANZ . . . . 1 1 . . . . . 2- Independent Hospital Pricing Authority . . . . 1 1 4 1 . . . 7- National Blood Authority . . . . 2 1 2 . . . . 5- NHMRC . . . 1 12 7 9 2 . . . 31- National Health Funding Body . . . . 1 1 1 . . . . 3- National Health Performance Authority . . . . . 2 3 1 . . . 6- National Mental Health Commission . . . 1 2 . . 2 . . . 5- Organ and Tissue Authority . . . . 1 . 1 . . . . 2- Professional Services Review . . . . . 2 . . . . . 2Human Services . . 54 406 295 500 302 99 8 4 2 1670Immigration and Border Protection . 1 66 337 440 475 307 105 35 8 . 1774Industry, Innovation and Science . 1 . 14 55 159 103 40 11 5 . 388- NOPSEMA . . . . 1 . . 1 . . . 2Infrastructure and Regional Development . . . . 26 59 23 11 1 3 1 124- Australian Transport Safety Bureau . . . . . . 2 . 1 . . 3- National Capital Authority . . . 3 2 3 1 . . . . 9Prime Minister and Cabinet . . . 17 47 46 48 25 17 1 1 202- Aboriginal Hostels Ltd. . . 2 . 1 . 2 . 2 . . 7- ANAO . . 1 1 20 15 3 3 1 . . 44- Australian Public Service Commission . . 1 . . 5 8 2 3 . . 19- Commonwealth Ombudsman . . . 3 2 6 3 3 . . . 17- Digital Transformation Office . . . 1 . 2 1 1 . . . 5- OIGIS . . . . . . 1 1 . . . 2- Office of National Assessments . . . 1 6 1 7 7 . . . 22- Torres Strait Regional Authority . . 1 . 1 1 . 1 . . . 4Social Services . . 2 14 72 181 77 44 2 1 1 394- Australian Institute of Family Studies . . . . . 1 . . . . . 1- National Disability Insurance Agency . . 2 8 30 36 21 17 3 3 2 122Treasury . . 1 . 24 13 52 39 10 5 3 147- Australian Bureau of Statistics 1 . . 49 249 207 97 32 11 4 1 651- ACCC . . . 8 5 50 26 13 3 1 . 106- ASIC . 5 . 6 1 67 40 25 . . . 144- Australian Taxation Office 7 26 205 132 242 331 67 33 23 1 1 1068- Productivity Commission . . . . 8 2 2 1 1 . . 14Veterans' Affairs 1 . 4 27 29 27 8 5 . . . 101- Australian War Memorial . . 1 1 6 6 9 1 . . . 24Total 11 36 436 1313 2497 3514 2016 915 216 72 20 11046Source: APSED
94
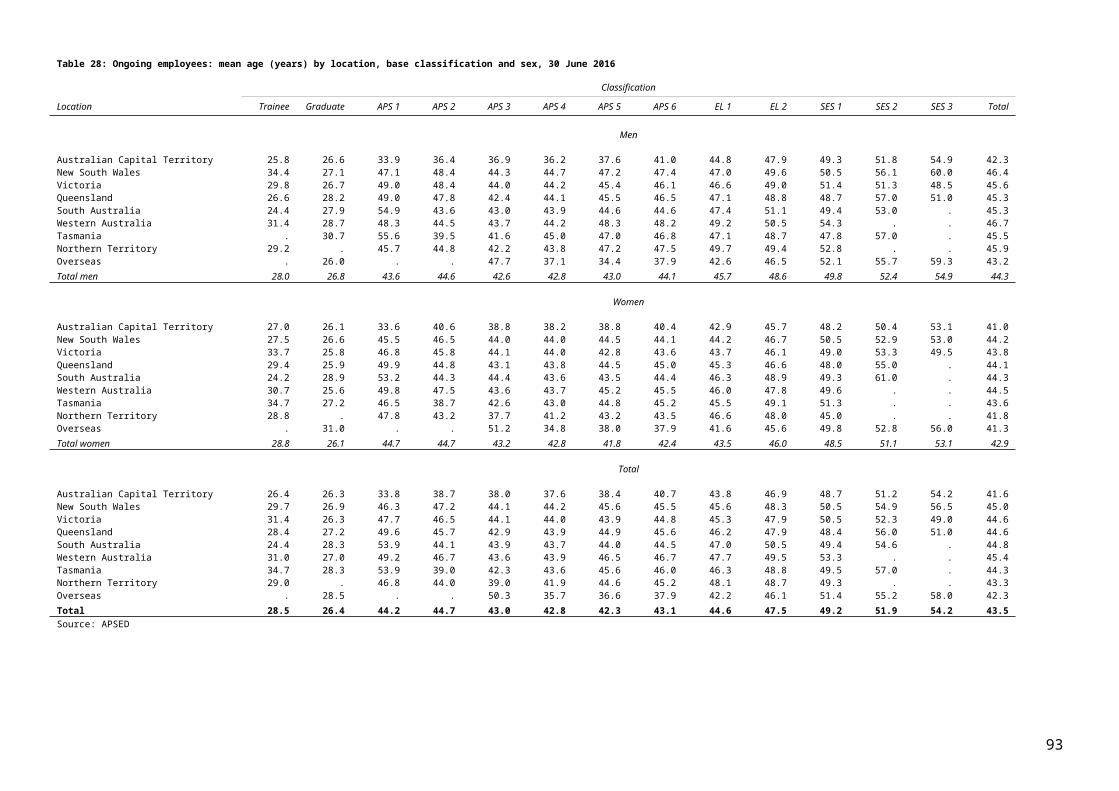
Table 42: Promotions of ongoing employees: within, from and to other agencies, 2015-16
Agency Promoted within agency
Promoted from other agency
Promoted to other agency Gain or loss % of promotions that
are within agencyTotal promotions
in agency
Agriculture and Water Resources 352 53 43 10 86.9 405- Australian Fisheries Management Authority 21 2 3 -1 91.3 23- APVMA 24 15 5 10 61.5 39- Murray Darling Basin Authority 17 7 7 0 70.8 24Attorney-General's 173 30 22 8 85.2 203- Administrative Appeals Tribunal 13 . 5 -5 100.0 13- ACLEI . 2 . 2 . 2- AUSTRAC 23 20 . 20 53.5 43- Australian Crime Commission 37 6 9 -3 86.0 43- Australian Financial Security Authority 52 6 7 -1 89.7 58- Australian Human Rights Commission 2 . 1 -1 100.0 2- Australian Law Reform Commission 1 . . 0 100.0 1- Commonwealth DPP 94 1 4 -3 98.9 95- CrimTrac Agency 17 7 4 3 70.8 24- Family Court and Federal Circuit Court 24 2 3 -1 92.3 26- Federal Court of Australia 12 1 2 -1 92.3 13- National Archives of Australia 19 4 6 -2 82.6 23- OAIC 7 4 . 4 63.6 11- Office of Parliamentary Counsel 18 . . 0 100.0 18Communications and the Arts 45 19 10 9 70.3 64- ACMA 3 2 4 -2 60.0 5- Australian National Maritime Museum 6 . . 0 100.0 6- National Film and Sound Archive 8 1 1 0 88.9 9- National Library of Australia 26 1 3 -2 96.3 27- National Museum of Australia 8 3 4 -1 72.7 11- National Portrait Gallery 1 . . 0 100.0 1- Old Parliament House 5 1 1 0 83.3 6Defence 644 23 157 -134 96.6 667- Defence Housing Australia 41 2 2 0 95.3 43Education and Training 79 24 23 1 76.7 103- AIATSIS 13 . . 0 100.0 13- Australian Research Council 7 2 2 0 77.8 9- Australian Skills Quality Authority 23 4 4 0 85.2 27- TEQSA 2 . . 0 100.0 2Employment 27 34 29 5 44.3 61- Asbestos Safety and Eradication Agency 1 . . 0 100.0 1- Comcare 74 14 17 -3 84.1 88- Fair Work Commission 7 2 1 1 77.8 9- OFWBII 12 . 4 -4 100.0 12- Office of the Fair Work Ombudsman 36 2 5 -3 94.7 38- Safe Work Australia 7 5 2 3 58.3 12Environment 181 18 37 -19 91.0 199- Bureau of Meteorology 47 4 3 1 92.2 51- Clean Energy Regulator 50 6 9 -3 89.3 56- GBRMPA 17 . . 0 100.0 17Finance 195 26 29 -3 88.2 221- Australian Electoral Commission 66 15 6 9 81.5 81- Future Fund Management Agency 2 . . 0 100.0 2Foreign Affairs and Trade 326 34 22 12 90.6 360- ACIAR 1 2 1 1 33.3 3- AUSTRADE 21 13 1 12 61.8 34
95

Agency Promoted within agency
Promoted from other agency
Promoted to other agency Gain or loss % of promotions that
are within agencyTotal promotions
in agency
Health 502 48 67 -19 91.3 550- Australian Aged Care Quality Agency 1 2 1 1 33.3 3- ACSQHC 4 4 1 3 50.0 8- Australian Institute of Health and Welfare 32 3 9 -6 91.4 35- ARPANSA 8 3 . 3 72.7 11- Cancer Australia 7 1 1 0 87.5 8- FSANZ 2 . . 0 100.0 2- Independent Hospital Pricing Authority 5 2 2 0 71.4 7- National Blood Authority 3 2 . 2 60.0 5- NHMRC 29 2 1 1 93.5 31- National Health Funding Body 2 1 . 1 66.7 3- National Health Performance Authority 3 3 . 3 50.0 6- National Mental Health Commission 1 4 . 4 20.0 5- Organ and Tissue Authority 1 1 . 1 50.0 2- Professional Services Review 1 1 . 1 50.0 2Human Services 1563 107 94 13 93.6 1670Immigration and Border Protection 1641 133 66 67 92.5 1774Industry, Innovation and Science 318 70 36 34 82.0 388- NOPSEMA 2 . . 0 100.0 2Infrastructure and Regional Development 96 28 13 15 77.4 124- Australian Transport Safety Bureau 2 1 . 1 66.7 3- National Capital Authority 9 . . 0 100.0 9Prime Minister and Cabinet 167 35 47 -12 82.7 202- Aboriginal Hostels Ltd. 5 2 . 2 71.4 7- ANAO 39 5 12 -7 88.6 44- Australian Public Service Commission 12 7 5 2 63.2 19- Commonwealth Ombudsman 15 2 3 -1 88.2 17- Digital Transformation Office 2 3 . 3 40.0 5- OIGIS 2 . . 0 100.0 2- Office of National Assessments 14 8 1 7 63.6 22- Torres Strait Regional Authority 4 . . 0 100.0 4Social Services 339 55 46 9 86.0 394- Australian Institute of Family Studies 1 . . 0 100.0 1- National Disability Insurance Agency 87 35 5 30 71.3 122Treasury 115 32 21 11 78.2 147- Australian Bureau of Statistics 615 36 21 15 94.5 651- ACCC 96 10 7 3 90.6 106- ASIC 136 8 5 3 94.4 144- Australian Taxation Office 1045 23 128 -105 97.8 1068- Productivity Commission 11 3 2 1 78.6 14Veterans' Affairs 92 9 13 -4 91.1 101- Australian War Memorial 21 3 3 0 87.5 24ComSuper (NC) . . 1 -1 . .Total 9937 1109 1109 0 90.0 11046Source: APSED
96

Table 43: Transfers of ongoing employees: from and to other agencies, 2015-16
Agency From other agencies To other agencies Total gain or loss
Agriculture and Water Resources 78 78 0- Australian Fisheries Management Authority 3 9 -6- APVMA 8 16 -8- Murray Darling Basin Authority 10 9 1Attorney-General's 55 71 -16- Administrative Appeals Tribunal 6 5 1- ACLEI 5 . 5- AUSTRAC 34 7 27- Australian Crime Commission 8 29 -21- Australian Financial Security Authority 9 14 -5- Australian Human Rights Commission 1 . 1- Commonwealth DPP 4 6 -2- CrimTrac Agency 15 9 6- Family Court and Federal Circuit Court 1 8 -7- Federal Court of Australia 5 2 3- National Archives of Australia 7 7 0- OAIC . 1 -1- Office of Parliamentary Counsel 1 1 0Communications and the Arts 31 43 -12- ACMA 3 12 -9- Australian National Maritime Museum 2 . 2- National Film and Sound Archive 4 3 1- National Library of Australia 7 3 4- National Museum of Australia 5 4 1- National Portrait Gallery . 1 -1- Old Parliament House 2 2 0Defence 50 168 -118- Defence Housing Australia 10 3 7Education and Training 76 80 -4- AIATSIS 5 8 -3- Australian Research Council 3 2 1- Australian Skills Quality Authority 5 10 -5- TEQSA 3 2 1Employment 101 71 30- Comcare 17 32 -15- Fair Work Commission 4 4 0- OFWBII 5 2 3- Office of the Fair Work Ombudsman 9 14 -5- Safe Work Australia 13 15 -2- Workplace Gender Equality Agency 1 1 0Environment 54 60 -6- Bureau of Meteorology 10 4 6- Clean Energy Regulator 21 21 0- Climate Change Authority 2 1 1- GBRMPA 4 . 4Finance 111 69 42- Australian Electoral Commission 40 22 18Foreign Affairs and Trade 79 25 54- ACIAR 1 3 -2- AUSTRADE 18 6 12Health 161 140 21
97

Agency From other agencies To other agencies Total gain or loss
- Australian Aged Care Quality Agency 1 . 1- ACSQHC 12 1 11- Australian Institute of Health and Welfare 19 15 4- ARPANSA . 2 -2- Australian Sports Anti-Doping Authority 3 2 1- Cancer Australia 1 . 1- FSANZ . 1 -1- Independent Hospital Pricing Authority 1 6 -5- National Blood Authority . 1 -1- NHMRC 9 6 3- National Health Funding Body 3 1 2- National Health Performance Authority . 29 -29- National Mental Health Commission 1 . 1- Organ and Tissue Authority 4 2 2- Professional Services Review 1 3 -2Human Services 141 183 -42Immigration and Border Protection 266 214 52Industry, Innovation and Science 102 95 7- NOPSEMA 1 1 0Infrastructure and Regional Development 38 68 -30- Australian Transport Safety Bureau 2 1 1- National Capital Authority . 1 -1Prime Minister and Cabinet 102 136 -34- Aboriginal Hostels Ltd. 1 2 -1- ANAO 12 21 -9- Australian Public Service Commission 8 13 -5- Commonwealth Ombudsman 5 6 -1- Digital Transformation Office 10 2 8- OIGIS 1 . 1- Office of National Assessments 7 5 2- Torres Strait Regional Authority . 1 -1Social Services 101 104 -3- Australian Institute of Family Studies 1 . 1- National Disability Insurance Agency 68 8 60Treasury 56 41 15- Australian Bureau of Statistics 66 22 44- ACCC 15 8 7- ASIC 3 13 -10- Australian Taxation Office 44 76 -32- Productivity Commission 5 6 -1Veterans' Affairs 19 25 -6- Australian War Memorial . 5 -5ComSuper (NC) . 4 -4Customs & Border Protection (NC) . 3 -3Total 2236 2236 0Source: APSED
98

Table 44: Movement of ongoing employees: location from and to by sex, 2015-16
Location moved to
Location moved from ACT NSW Vic Qld SA WA Tas NT O'seas Total
Men
Australian Capital Territory . 263 331 113 57 32 19 39 254 1108New South Wales 215 . 82 69 8 24 5 7 15 425Victoria 147 43 . 34 17 15 10 8 25 299Queensland 92 61 48 . 8 11 5 6 14 245South Australia 51 11 24 15 . 12 4 13 10 140Western Australia 53 20 18 11 15 . 6 8 10 141Tasmania 18 4 16 9 3 4 . 1 . 55Northern Territory 41 8 10 10 11 8 4 . 2 94Overseas 263 7 20 13 16 9 . 1 . 329Total men 880 417 549 274 135 115 53 83 330 2836
Women
Australian Capital Territory . 463 497 177 91 61 37 55 276 1657New South Wales 307 . 130 120 13 13 8 6 18 615Victoria 198 53 . 39 23 21 15 6 26 381Queensland 138 110 42 . 14 24 10 14 9 361South Australia 71 16 30 18 . 3 4 10 4 156Western Australia 51 16 27 27 7 . 6 3 6 143Tasmania 32 6 15 17 1 10 . 1 . 82Northern Territory 53 14 19 26 11 15 6 . 1 145Overseas 264 15 23 7 4 4 1 . . 318Total women 1114 693 783 431 164 151 87 95 340 3858
Total
Australian Capital Territory . 726 828 290 148 93 56 94 530 2765New South Wales 522 . 212 189 21 37 13 13 33 1040Victoria 345 96 . 73 40 36 25 14 51 680Queensland 230 171 90 . 22 35 15 20 23 606South Australia 122 27 54 33 . 15 8 23 14 296Western Australia 104 36 45 38 22 . 12 11 16 284Tasmania 50 10 31 26 4 14 . 2 . 137Northern Territory 94 22 29 36 22 23 10 . 3 239Overseas 527 22 43 20 20 13 1 1 . 647Total 1994 1110 1332 705 299 266 140 178 670 6694Source: APSEDNote: movements include all promotions and transfers within and between agencies, where the employee moved interstate or overseas. Movements of less than 90 days are not included.
99

Table 45: Separations of ongoing employees: type of separation by sex, 2001-02 to 2015-16
Year ending June
Separation type 2002 2003 2004 2005 2006 2007 2008 2009 2010 2011 2012 2013 2014 2015 2016
Men
Resignation 2162 2113 2252 2546 2751 3364 3769 2651 2310 2631 2341 1942 1724 1617 1794Age retirement 448 443 534 599 715 714 975 859 795 1018 974 949 952 868 973Retrenchment 1205 490 334 1141 497 385 398 877 724 795 991 1303 2171 2098 1462Physical or mental incapacity 88 114 103 111 114 101 116 119 127 126 129 112 130 109 107Termination of appointment 310 167 160 143 141 146 146 109 119 95 93 94 80 73 80Compulsory move to non-APS agency . . . 1131 . 2 . . . . 4 . 2 . 132Deceased 47 47 71 58 59 67 55 52 59 75 52 66 46 49 42Other 8 . 2 . . . 1 . . . . . . . .Total men 4268 3374 3456 5729 4277 4779 5460 4667 4134 4740 4584 4466 5105 4814 4590
Women
Resignation 2583 2788 2893 3234 3761 4415 5116 3955 3461 3459 3262 2555 2460 2092 2301Age retirement 326 371 454 548 655 749 967 854 900 1000 1016 961 972 984 1025Retrenchment 937 400 286 663 521 277 414 866 955 1007 1268 1377 2471 2459 1375Physical or mental incapacity 61 67 85 97 137 122 141 137 160 191 178 165 178 196 168Termination of appointment 279 163 162 106 156 163 142 117 119 92 92 88 79 68 83Compulsory move to non-APS agency 1 . 1 230 . 1 . . . . . . . . 167Deceased 31 29 25 53 49 46 42 44 47 40 40 60 50 49 50Other 8 1 1 . . . . . . . . . . . .Total women 4226 3819 3907 4931 5279 5773 6822 5973 5642 5789 5856 5206 6210 5848 5169
Total
Resignation 4745 4901 5145 5780 6512 7779 8885 6606 5771 6090 5603 4497 4184 3709 4095Age retirement 774 814 988 1147 1370 1463 1942 1713 1695 2018 1990 1910 1924 1852 1998Retrenchment 2142 890 620 1804 1018 662 812 1743 1679 1802 2259 2680 4642 4557 2837Physical or mental incapacity 149 181 188 208 251 223 257 256 287 317 307 277 308 305 275Termination of appointment 589 330 322 249 297 309 288 226 238 187 185 182 159 141 163Compulsory move to non-APS agency 1 . 1 1361 . 3 . . . . 4 . 2 . 299Deceased 78 76 96 111 108 113 97 96 106 115 92 126 96 98 92Other 16 1 3 . . . 1 . . . . . . . .Total 8494 7193 7363 10660 9556 10552 12282 10640 9776 10529 10440 9672 11315 10662 9759Source: APSEDNote: age retirement includes resignations after age 55.
100

Table 46: Separations of ongoing employees: base classification by sex, 2001-02 to 2015-16
Year ending June
Classification 2002 2003 2004 2005 2006 2007 2008 2009 2010 2011 2012 2013 2014 2015 2016
Men
Trainee 44 17 25 52 18 28 47 22 13 22 27 21 13 11 27Graduate 28 24 20 21 23 31 44 35 31 44 41 32 20 20 24APS 1 184 73 76 341 104 112 98 60 48 61 61 55 32 49 16APS 2 322 235 212 1163 166 167 200 172 127 143 107 96 111 98 96APS 3 468 406 514 705 597 773 821 687 566 540 528 442 441 356 335APS 4 779 686 525 742 627 642 702 594 606 691 578 525 631 592 508APS 5 464 327 379 501 548 624 667 695 544 669 593 583 594 608 608APS 6 802 689 725 919 942 1044 1168 996 781 1028 957 969 1062 1072 873EL 1 583 433 516 684 695 794 961 815 810 866 960 1019 1213 1149 1293EL 2 478 398 366 490 466 471 615 471 501 556 588 586 821 703 652SES 1 81 59 62 81 59 60 93 78 82 77 93 97 108 102 99SES 2 25 19 29 20 27 23 37 32 16 31 38 30 49 43 51SES 3 10 8 7 10 5 10 7 10 9 12 13 11 10 11 8Total men 4268 3374 3456 5729 4277 4779 5460 4667 4134 4740 4584 4466 5105 4814 4590
Women
Trainee 46 18 21 16 29 17 19 22 13 14 25 19 31 27 29Graduate 41 24 28 28 28 35 55 48 36 41 35 23 40 18 18APS 1 159 94 159 155 192 243 213 143 89 82 74 68 68 36 43APS 2 353 309 264 422 314 365 418 337 239 232 256 219 217 233 183APS 3 689 645 861 993 1247 1616 1708 1289 1271 1035 923 793 832 783 654APS 4 1192 1308 1059 1254 1250 1169 1417 1305 1199 1383 1191 1102 1169 1155 1043APS 5 472 331 347 535 604 604 803 783 713 797 843 771 828 783 675APS 6 729 677 680 893 962 981 1190 1094 1039 1139 1205 1083 1209 1228 1021EL 1 332 245 321 396 411 495 656 626 656 722 882 716 1161 1042 976EL 2 178 142 137 208 196 208 283 265 321 287 363 346 543 444 424SES 1 29 21 22 25 33 31 51 46 47 42 38 45 80 68 77SES 2 5 5 8 5 10 8 7 8 17 13 19 17 29 29 20SES 3 1 . . 1 3 1 2 7 2 2 2 4 3 2 6Total women 4226 3819 3907 4931 5279 5773 6822 5973 5642 5789 5856 5206 6210 5848 5169
Total
Trainee 90 35 46 68 47 45 66 44 26 36 52 40 44 38 56Graduate 69 48 48 49 51 66 99 83 67 85 76 55 60 38 42APS 1 343 167 235 496 296 355 311 203 137 143 135 123 100 85 59APS 2 675 544 476 1585 480 532 618 509 366 375 363 315 328 331 279APS 3 1157 1051 1375 1698 1844 2389 2529 1976 1837 1575 1451 1235 1273 1139 989APS 4 1971 1994 1584 1996 1877 1811 2119 1899 1805 2074 1769 1627 1800 1747 1551APS 5 936 658 726 1036 1152 1228 1470 1478 1257 1466 1436 1354 1422 1391 1283APS 6 1531 1366 1405 1812 1904 2025 2358 2090 1820 2167 2162 2052 2271 2300 1894EL 1 915 678 837 1080 1106 1289 1617 1441 1466 1588 1842 1735 2374 2191 2269EL 2 656 540 503 698 662 679 898 736 822 843 951 932 1364 1147 1076SES 1 110 80 84 106 92 91 144 124 129 119 131 142 188 170 176SES 2 30 24 37 25 37 31 44 40 33 44 57 47 78 72 71SES 3 11 8 7 11 8 11 9 17 11 14 15 15 13 13 14
101

Total 8494 7193 7363 10660 9556 10552 12282 10640 9776 10529 10440 9672 11315 10662 9759Source: APSED
102

Table 47: Separations of ongoing employees: age group by sex, 2001-02 to 2015-16
Year ending June
Age group 2002 2003 2004 2005 2006 2007 2008 2009 2010 2011 2012 2013 2014 2015 2016
Men
Under 20 13 8 17 8 4 12 23 12 12 7 12 9 8 6 620-24 185 151 163 264 200 284 317 231 186 182 174 146 121 81 9225-29 395 388 376 685 547 585 739 547 455 527 522 427 451 413 40030-34 463 415 455 710 502 616 646 530 440 497 437 392 455 479 46435-39 434 358 326 631 402 533 617 468 399 451 412 370 341 351 35140-44 473 335 338 677 394 500 451 373 327 412 402 346 403 316 38145-49 397 301 303 549 389 401 453 405 319 354 352 320 332 372 32750-54 1048 759 756 1074 877 926 1010 874 800 828 741 687 829 787 70255-59 505 409 415 648 523 496 566 583 531 609 627 721 905 862 76460-64 268 189 222 356 328 307 472 494 481 583 627 698 814 795 73665 and over 87 61 85 127 111 119 166 150 184 290 278 350 446 352 367Total men 4268 3374 3456 5729 4277 4779 5460 4667 4134 4740 4584 4466 5105 4814 4590
Women
Under 20 23 13 7 12 23 25 41 26 24 18 13 15 16 7 720-24 310 341 317 350 346 459 535 461 352 310 304 210 205 130 13325-29 718 732 730 903 929 1029 1198 938 814 894 791 602 691 550 53830-34 720 621 664 850 837 884 994 860 722 708 751 603 710 635 62135-39 593 509 474 586 696 731 941 789 683 697 666 578 604 612 53140-44 486 396 428 537 552 602 694 610 525 513 604 486 611 505 49045-49 384 359 353 416 451 541 598 521 536 510 499 466 520 546 44850-54 471 349 365 512 568 599 684 621 676 657 672 627 808 832 72955-59 346 325 366 460 553 543 557 634 657 718 755 746 966 956 78960-64 152 147 176 246 266 288 468 410 487 614 628 612 767 727 60265 and over 23 27 27 59 58 72 112 103 166 150 173 261 312 348 281Total women 4226 3819 3907 4931 5279 5773 6822 5973 5642 5789 5856 5206 6210 5848 5169
Total
Under 20 36 21 24 20 27 37 64 38 36 25 25 24 24 13 1320-24 495 492 480 614 546 743 852 692 538 492 478 356 326 211 22525-29 1113 1120 1106 1588 1476 1614 1937 1485 1269 1421 1313 1029 1142 963 93830-34 1183 1036 1119 1560 1339 1500 1640 1390 1162 1205 1188 995 1165 1114 108535-39 1027 867 800 1217 1098 1264 1558 1257 1082 1148 1078 948 945 963 88240-44 959 731 766 1214 946 1102 1145 983 852 925 1006 832 1014 821 87145-49 781 660 656 965 840 942 1051 926 855 864 851 786 852 918 77550-54 1519 1108 1121 1586 1445 1525 1694 1495 1476 1485 1413 1314 1637 1619 143155-59 851 734 781 1108 1076 1039 1123 1217 1188 1327 1382 1467 1871 1818 155360-64 420 336 398 602 594 595 940 904 968 1197 1255 1310 1581 1522 133865 and over 110 88 112 186 169 191 278 253 350 440 451 611 758 700 648Total 8494 7193 7363 10660 9556 10552 12282 10640 9776 10529 10440 9672 11315 10662 9759Source: APSED
103

Table 48: Separations of ongoing employees: resignations by age group and sex, 2001-02 and 2015-16
Year ending June
Age group 2002 2003 2004 2005 2006 2007 2008 2009 2010 2011 2012 2013 2014 2015 2016
Men
Under 20 8 7 12 6 4 10 20 11 12 5 12 9 6 5 420-24 148 137 155 160 184 269 306 195 172 176 169 135 112 69 7825-29 315 354 355 433 519 557 706 474 433 498 475 398 374 345 36230-34 336 341 411 418 452 578 598 446 390 454 389 337 318 359 40335-39 287 285 277 325 343 477 552 367 335 389 326 294 211 233 25440-44 277 244 253 308 321 412 398 262 245 330 284 231 228 160 24045-49 205 194 201 223 264 297 337 259 205 221 235 174 131 145 16250-54 586 551 588 673 664 764 852 637 518 558 451 364 344 301 291Total men 2162 2113 2252 2546 2751 3364 3769 2651 2310 2631 2341 1942 1724 1617 1794
Women
Under 20 17 13 7 10 20 23 35 24 23 16 11 14 14 6 620-24 255 322 298 308 335 440 520 418 333 299 284 194 181 117 11425-29 615 687 695 814 887 993 1153 855 757 869 728 548 563 429 48230-34 514 552 600 697 768 836 934 751 643 644 655 505 487 452 51135-39 383 422 415 458 595 667 851 662 545 560 514 428 363 371 36740-44 300 302 345 354 430 529 600 471 392 376 413 315 338 273 29845-49 222 252 258 275 330 437 473 369 363 306 307 248 213 200 22350-54 277 238 275 318 396 490 550 405 405 389 350 303 301 244 300Total women 2583 2788 2893 3234 3761 4415 5116 3955 3461 3459 3262 2555 2460 2092 2301
Total
Under 20 25 20 19 16 24 33 55 35 35 21 23 23 20 11 1020-24 403 459 453 468 519 709 826 613 505 475 453 329 293 186 19225-29 930 1041 1050 1247 1406 1550 1859 1329 1190 1367 1203 946 937 774 84430-34 850 893 1011 1115 1220 1414 1532 1197 1033 1098 1044 842 805 811 91435-39 670 707 692 783 938 1144 1403 1029 880 949 840 722 574 604 62140-44 577 546 598 662 751 941 998 733 637 706 697 546 566 433 53845-49 427 446 459 498 594 734 810 628 568 527 542 422 344 345 38550-54 863 789 863 991 1060 1254 1402 1042 923 947 801 667 645 545 591Total 4745 4901 5145 5780 6512 7779 8885 6606 5771 6090 5603 4497 4184 3709 4095Source: APSEDNote: resignations after age 55 are included with age retirements.
104

Table 49: Separations of ongoing employees: age retirements by age group and sex, 2001-02 and 2015-16
Year ending June
Age group 2002 2003 2004 2005 2006 2007 2008 2009 2010 2011 2012 2013 2014 2015 2016
Men
55-56 107 116 139 169 196 181 211 184 168 192 185 160 164 132 14557-58 84 76 97 102 124 121 171 126 93 111 124 102 103 86 12859-60 91 98 104 106 121 150 199 179 155 175 191 175 140 157 16561-62 52 64 66 71 114 94 148 153 137 172 147 149 145 149 15963-64 39 35 49 69 64 67 101 90 97 127 119 123 116 128 12565-66 67 48 65 57 67 65 98 84 84 151 118 140 164 114 14467-68 5 6 12 18 18 19 27 27 31 46 50 59 59 54 5569-70 2 . 1 7 7 14 18 9 23 29 29 26 41 29 25Over 70 1 . 1 . 4 3 2 7 7 15 11 15 20 19 27Total men 448 443 534 599 715 714 975 859 795 1018 974 949 952 868 973
Women
55-56 106 137 175 176 195 225 250 238 220 220 245 205 200 205 19157-58 63 86 86 100 134 152 157 146 136 161 146 155 137 127 16759-60 52 53 67 91 128 127 203 165 141 198 198 153 163 160 17661-62 55 52 67 81 81 92 136 118 143 150 138 135 152 146 14863-64 30 20 37 52 67 86 120 100 118 158 158 127 134 119 13065-66 19 21 16 38 37 39 63 58 83 69 78 111 119 143 14267-68 1 2 5 8 11 18 29 20 35 30 40 37 41 48 4869-70 . . 1 2 2 6 6 6 15 12 6 27 15 22 14Over 70 . . . . . 4 3 3 9 2 7 11 11 14 9Total women 326 371 454 548 655 749 967 854 900 1000 1016 961 972 984 1025
Total
55-56 213 253 314 345 391 406 461 422 388 412 430 365 364 337 33657-58 147 162 183 202 258 273 328 272 229 272 270 257 240 213 29559-60 143 151 171 197 249 277 402 344 296 373 389 328 303 317 34161-62 107 116 133 152 195 186 284 271 280 322 285 284 297 295 30763-64 69 55 86 121 131 153 221 190 215 285 277 250 250 247 25565-66 86 69 81 95 104 104 161 142 167 220 196 251 283 257 28667-68 6 8 17 26 29 37 56 47 66 76 90 96 100 102 10369-70 2 . 2 9 9 20 24 15 38 41 35 53 56 51 39Over 70 1 . 1 . 4 7 5 10 16 17 18 26 31 33 36Total 774 814 988 1147 1370 1463 1942 1713 1695 2018 1990 1910 1924 1852 1998Source: APSEDNote: age retirements include resignations after age 55.
105

Table 50: Separations of ongoing employees: retrenchments by age group and sex, 2001-02 to 2015-16
Year ending June
Age group 2002 2003 2004 2005 2006 2007 2008 2009 2010 2011 2012 2013 2014 2015 2016
Men
Under 20 . . . . . . . 1 . . . . . . .20-24 11 2 . 9 1 1 1 28 4 1 2 3 5 6 225-29 29 6 5 31 9 5 11 58 5 13 27 20 67 59 1030-34 65 29 7 70 21 6 21 58 23 25 31 40 120 110 3235-39 101 37 15 79 22 25 34 75 42 41 55 61 115 99 6240-44 135 49 31 137 47 48 25 79 55 55 80 85 150 132 9045-49 132 51 45 161 79 62 61 102 73 78 79 97 161 182 11650-54 364 151 101 253 145 107 93 180 205 205 242 264 424 442 33255-59 251 121 87 238 110 77 82 168 163 188 210 351 542 548 39160-64 108 37 39 120 53 41 55 108 119 147 198 280 432 389 31865 and over 9 7 4 43 10 13 15 20 35 42 67 102 155 131 109Total men 1205 490 334 1141 497 385 398 877 724 795 991 1303 2171 2098 1462
Women
Under 20 . . . . . . . . . . . . 1 . .20-24 13 3 1 6 . 2 1 20 5 3 12 8 18 7 225-29 50 13 11 30 9 7 20 64 27 14 50 43 111 113 1930-34 140 31 23 75 35 13 29 82 54 35 77 73 199 170 6535-39 160 52 22 75 63 20 42 97 102 104 120 119 214 202 10740-44 137 55 49 98 69 32 57 100 92 86 153 135 222 196 13445-49 121 58 51 78 67 42 60 108 124 143 140 164 268 288 15950-54 148 77 46 126 115 61 80 157 204 201 247 241 433 510 34355-59 129 69 53 107 110 68 58 141 202 232 255 284 528 524 29360-64 36 39 25 58 47 30 56 84 122 153 173 239 357 331 19165 and over 3 3 5 10 6 2 11 13 23 36 41 71 120 118 62Total women 937 400 286 663 521 277 414 866 955 1007 1268 1377 2471 2459 1375
Total
Under 20 . . . . . . . 1 . . . . 1 . .20-24 24 5 1 15 1 3 2 48 9 4 14 11 23 13 425-29 79 19 16 61 18 12 31 122 32 27 77 63 178 172 2930-34 205 60 30 145 56 19 50 140 77 60 108 113 319 280 9735-39 261 89 37 154 85 45 76 172 144 145 175 180 329 301 16940-44 272 104 80 235 116 80 82 179 147 141 233 220 372 328 22445-49 253 109 96 239 146 104 121 210 197 221 219 261 429 470 27550-54 512 228 147 379 260 168 173 337 409 406 489 505 857 952 67555-59 380 190 140 345 220 145 140 309 365 420 465 635 1070 1072 68460-64 144 76 64 178 100 71 111 192 241 300 371 519 789 720 50965 and over 12 10 9 53 16 15 26 33 58 78 108 173 275 249 171Total 2142 890 620 1804 1018 662 812 1743 1679 1802 2259 2680 4642 4557 2837Source: APSED
106

Table 51: Separations of ongoing employees: separation type by base classification and sex, 2015-16
Classification
Separation type Trainee Graduate APS 1 APS 2 APS 3 APS 4 APS 5 APS 6 EL 1 EL 2 SES 1 SES 2 SES 3 Total
Men
Resignation 23 23 3 35 163 245 321 410 380 160 21 7 3 1794Age retirement . . 7 33 91 125 136 225 183 127 26 18 2 973Retrenchment . . 5 20 36 69 87 163 656 346 52 25 3 1462Physical or mental incapacity . . . 2 15 20 23 19 19 9 . . . 107Compulsory move to non-APS agency . . . . 8 21 20 40 37 6 . . . 132Deceased 1 . . . 4 10 8 7 8 3 . 1 . 42Inappropriately qualified . . . . . 1 . 1 . . . . . 2Underperformance 1 . . 4 7 8 4 4 6 1 . . . 35Section 29(3)(e) * . . . 1 . . . . . . . . . 1Breach of engagement condition ** 1 . . 1 4 1 3 . . . . . . 10Misconduct 1 1 1 . 7 8 6 4 4 . . . . 32Total men 27 24 16 96 335 508 608 873 1293 652 99 51 8 4590
Women
Resignation 26 18 18 87 334 512 375 498 305 94 24 9 1 2301Age retirement 1 . 13 43 161 274 128 227 101 56 15 4 2 1025Retrenchment . . 10 36 84 105 101 222 512 259 36 7 3 1375Physical or mental incapacity . . 1 6 20 62 20 26 25 7 1 . . 168Compulsory move to non-APS agency . . 1 4 20 44 37 30 27 4 . . . 167Deceased . . . . 10 15 6 13 2 3 1 . . 50Inappropriately qualified . . . . . . . . . . . . . .Underperformance . . . 3 8 21 5 2 2 . . . . 41Section 29(3)(e) * . . . . . . . . . . . . . .Breach of engagement condition ** 1 . . 4 9 . . . . . . . . 14Misconduct 1 . . . 8 10 3 3 2 1 . . . 28Total women 29 18 43 183 654 1043 675 1021 976 424 77 20 6 5169
Total
Resignation 49 41 21 122 497 757 696 908 685 254 45 16 4 4095Age retirement 1 . 20 76 252 399 264 452 284 183 41 22 4 1998Retrenchment . . 15 56 120 174 188 385 1168 605 88 32 6 2837Physical or mental incapacity . . 1 8 35 82 43 45 44 16 1 . . 275Compulsory move to non-APS agency . . 1 4 28 65 57 70 64 10 . . . 299Deceased 1 . . . 14 25 14 20 10 6 1 1 . 92Inappropriately qualified . . . . . 1 . 1 . . . . . 2Underperformance 1 . . 7 15 29 9 6 8 1 . . . 76Section 29(3)(e) * . . . 1 . . . . . . . . . 1Breach of engagement condition ** 2 . . 5 13 1 3 . . . . . . 24Misconduct 2 1 1 . 15 18 9 7 6 1 . . . 60Total 56 42 59 279 989 1551 1283 1894 2269 1076 176 71 14 9759Source: APSED* Termination resulting from the failure to complete an entry level training course Section
107
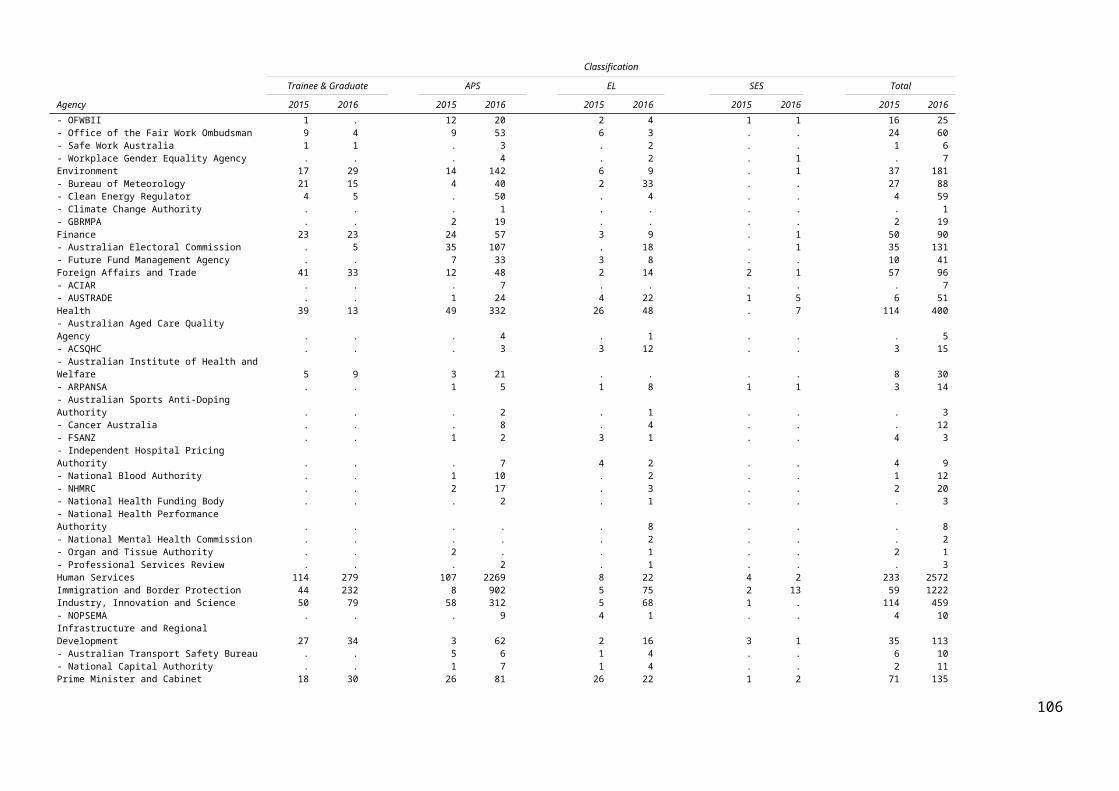
29(3)(e)** Termination resulting from the failure to meet a condition of engagement imposed under subsection 22 (6) of PS Act (PS Act s29 (3)(f)) (i.e. probation, citizenship, formal qualifications, security and character clearances, health clearances)Note: age retirements include resignations after age 55.
108

Table 52: Separations of ongoing employees: agency by type of separation, 2014-15 and 2015-16
Resignation Age Retirement Retrenchment
Physical or mental
incapacity
Termination of
Appointment
Compulsory move to non-APS agency
Deceased Total
Agency 2015 2016 2015 2016 2015 2016 2015 2016 2015 2016 2015 2016 2015 2016 2015 2016
Agriculture and Water Resources 90 86 23 28 103 56 6 8 . 5 . . 2 2 224 185- Australian Fisheries Management Authority 2 14 2 3 . . . . . . . . . . 4 17- APVMA 3 5 2 4 1 1 1 2 . . . . . . 7 12- Murray Darling Basin Authority 12 7 5 5 10 12 . 1 . . . . . . 27 25Attorney-General's 54 120 4 20 41 81 1 . . . . . . 2 100 223- Administrative Appeals Tribunal 5 18 4 9 . 15 . . 1 . . . . . 10 42- ACLEI 1 2 1 . . 1 . . . . . . . . 2 3- AUSTRAC 10 20 1 5 6 5 1 1 . . . . . . 18 31- Australian Crime Commission 18 20 4 3 19 6 1 1 1 . . . . 1 43 31- Australian Financial Security Authority 18 23 7 6 8 3 . 1 . 1 . . . . 33 34- Australian Human Rights Commission 6 12 1 1 3 1 . . . . . . . . 10 14- Australian Law Reform Commission 2 1 . . . . . . . . . . . . 2 1- Commonwealth DPP 30 28 9 6 30 31 . . . . . . . . 69 65- CrimTrac Agency 19 13 . . 7 2 1 . . . . . . . 27 15- Family Court and Federal Circuit Court 15 35 13 21 3 2 . . . 2 . . . . 31 60- Federal Court of Australia 11 11 5 6 14 13 2 1 . . . . 1 . 33 31- National Archives of Australia 10 11 11 7 . . . . . 1 . . . . 21 19- OAIC 10 11 1 . 7 2 . . . . . . . . 18 13- Office of Parliamentary Counsel 1 4 4 2 1 1 . . . . . . . . 6 7Communications and the Arts 17 20 2 3 60 23 2 . . 1 . . . . 81 47- ACMA 12 17 1 . 27 19 . . . 2 . . 1 1 41 39- Australian National Maritime Museum 5 7 1 3 . 1 . . . . . . . . 6 11- National Film and Sound Archive 10 3 2 2 12 24 . . . 1 . . . . 24 30- National Library of Australia 16 17 11 17 3 3 . 2 . 1 . . . . 30 40- National Museum of Australia 5 5 1 3 2 1 . . . . . . . . 8 9- National Portrait Gallery 2 2 2 . . 2 . . . . . . . . 4 4- Old Parliament House 7 4 . 1 . 2 . . . . . . . . 7 7- Screen Australia . 2 . . 3 2 . . . . . . . . 3 4
Defence 652 646 396 391 247 673 31 50 13 18 . . 24 15 1363179
3- Defence Housing Australia 28 26 6 5 65 5 1 . . . . . . 1 100 37Education and Training 37 44 5 12 193 35 2 1 2 3 . . . 1 239 96- AIATSIS 1 4 1 1 8 . . . . . . . . . 10 5- Australian Research Council 4 6 . . 4 3 . . . . . . . . 8 9- Australian Skills Quality Authority 4 9 2 6 . . . . . . . . 1 . 7 15- TEQSA 10 8 1 1 11 4 . 1 . . . . . . 22 14Employment 53 58 15 10 32 39 2 1 1 5 . . 2 2 105 115- Comcare 24 29 5 8 14 3 . 2 . 1 . . 1 . 44 43- Fair Work Commission 11 14 1 . . 18 1 . . . . . . . 13 32- OFWBII 9 13 3 2 . . . . 4 1 . . . . 16 16- Office of the Fair Work Ombudsman 31 34 6 8 3 4 1 . 1 . . . 1 . 43 46- Safe Work Australia 4 3 4 4 4 4 . . . . . . . . 12 11- Workplace Gender Equality Agency 3 7 . . . . . . . . . . . . 3 7Environment 43 57 7 11 206 70 . 4 1 1 . . 1 1 258 144- Bureau of Meteorology 46 44 33 35 9 7 4 . 2 1 . . . 1 94 88
109

Resignation Age Retirement Retrenchment
Physical or mental
incapacity
Termination of
Appointment
Compulsory move to non-APS agency
Deceased Total
Agency 2015 2016 2015 2016 2015 2016 2015 2016 2015 2016 2015 2016 2015 2016 2015 2016
- Clean Energy Regulator 17 20 3 4 8 1 . . . 1 . . . . 28 26- Climate Change Authority 7 1 . . . 2 . . . . . . . . 7 3- GBRMPA 5 7 2 1 9 . . . . . . . . 1 16 9Finance 57 58 10 21 7 18 1 1 . . . . . 1 75 99- Australian Electoral Commission 25 35 29 46 26 8 2 . . 3 . . 3 . 85 92- Future Fund Management Agency 11 8 . 1 . . . . . . . . . . 11 9Foreign Affairs and Trade 95 76 18 29 178 21 1 3 2 6 . . 4 3 298 138- ACIAR 1 . . 2 5 1 . . . . . . . . 6 3- AUSTRADE 19 30 3 9 13 13 1 . 1 . . . . . 37 52Health 109 139 39 42 29 95 7 2 1 2 . . 2 1 187 281- Australian Aged Care Quality Agency 7 6 4 11 . 35 1 . . . . . . . 12 52- ACSQHC 3 4 2 . . . . . . . . . . 1 5 5- Australian Institute of Health and Welfare 11 13 6 7 . . . . . . . . . . 17 20- ARPANSA 4 2 1 2 4 5 . . . . . . . . 9 9- Australian Sports Anti-Doping Authority 2 1 . . 9 6 . . . . . . . . 11 7- Cancer Australia 12 4 3 2 . 2 . . . . . . . . 15 8- FSANZ 1 3 4 1 . . 1 . . . . . . . 6 4- Independent Hospital Pricing Authority 2 7 . 1 . . . . . . . . . . 2 8- National Blood Authority 1 4 . . 1 . 1 . . . . . . . 3 4- NHMRC 11 8 7 4 6 6 . . . . . . 1 . 25 18- National Health Funding Body 1 2 . 1 . . . . . . . . . . 1 3- National Health Performance Authority 8 6 . . . 8 . . . . . . . . 8 14- National Mental Health Commission . 1 1 2 . . . . . . . . . . 1 3- Organ and Tissue Authority 1 1 . . 1 3 . . . . . . . . 2 4- Professional Services Review 1 . . . 1 3 . . . . . . . . 2 3
Human Services 705 715 642 609 63 138 112 99 52 52 . . 23 25 1597163
8Immigration and Border Protection 165 344 100 184 48 101 11 14 6 10 . . 4 7 334 660Industry, Innovation and Science 124 134 45 42 129 86 7 1 4 3 . . 3 4 312 270- NOPSEMA 7 . 1 1 . . . . . 1 . . . . 8 2Infrastructure and Regional Development 44 56 17 27 20 32 2 . 3 1 . . 1 1 87 117- Australian Transport Safety Bureau 4 7 . 2 4 3 . . . . . . . . 8 12- National Capital Authority 7 6 1 . 5 . . . . . . . . . 13 6Prime Minister and Cabinet 80 81 19 15 164 119 1 2 1 7 . . 1 1 266 225- Aboriginal Hostels Ltd. 12 15 16 14 13 8 . 1 4 . . . 2 . 47 38- ANAO 22 27 5 6 . 2 . . . . . . 1 . 28 35- Australian Public Service Commission 7 12 2 2 . 5 . . 1 . . . 1 . 11 19- Commonwealth Ombudsman 5 10 . 2 9 6 . . . . . . . . 14 18- OIGIS 1 2 . . . . . . . . . . . . 1 2- Office of National Assessments 7 10 3 3 . 1 . . . . . . . . 10 14- Torres Strait Regional Authority 2 4 . . . . . . . . . . . . 2 4Social Services 67 65 16 15 263 92 5 5 2 4 . . 1 1 354 182- Australian Institute of Family Studies 3 2 . 2 . . . . . . . . . . 3 4- National Disability Insurance Agency 34 35 6 11 2 3 . . 2 1 . . . 1 44 51Treasury 27 57 1 10 98 8 . . 3 . . . . . 129 75- Australian Bureau of Statistics 81 80 16 25 32 51 4 1 4 3 . . . . 137 160
110

Resignation Age Retirement Retrenchment
Physical or mental
incapacity
Termination of
Appointment
Compulsory move to non-APS agency
Deceased Total
Agency 2015 2016 2015 2016 2015 2016 2015 2016 2015 2016 2015 2016 2015 2016 2015 2016
- ACCC 32 30 . 2 7 3 . . . . . . . . 39 35- ASIC 66 69 6 9 59 29 . . 3 1 . . 1 1 135 109
- Australian Taxation Office 243 305 85 104 2060 706 70 60 18 21 . . 14 15 2490121
1- National Competition Council . . . . 1 . . . . . . . . . 1 .- Productivity Commission 7 11 2 2 4 2 . . . . . . . . 13 15Veterans' Affairs 36 49 52 70 14 35 4 9 3 2 . . . 2 109 167- Australian War Memorial 7 11 6 4 13 1 1 . . 1 . . . . 27 17ComSuper (NC) 18 1 2 . 28 . 2 . . . . 299 . . 50 300Customs & Border Protection (NC) 111 1 71 2 39 3 14 1 3 . . . 2 . 240 7MRT - RRT (NC) 19 . 3 . 14 . . . 1 . . . . . 37 .National Water Commission (NC) . . . . 15 . . . . . . . . . 15 .Private Health Insurance Ombudsman (NC) 1 . . . . . . . . . . . . . 1 .Australian Institute of Criminology (NC) 2 . 1 . . 2 . . 1 . . . . . 4 2TUSMA (NC) 1 . . . . . . . . . . . . . 1 .
Total 3709 4095 1852 1998 4557 2837 305 275 141 163 . 299 98 921066
2975
9Source: APSEDNote: age retirements include resignations after age 55.
111

Table 53: Separations of ongoing employees: agency by type of termination, 2015-16
Type of Termination
Agency Retrenchment
Physical or mentalincapacity
Inappropriately qualified Underperformance Section 29(3)(e)*
Breach of engagement
condition**Misconduct Total
Agriculture and Water Resources 56 8 . 5 . . . 69- Australian Fisheries Management Authority . . . . . . . .- APVMA 1 2 . . . . . 3- Murray Darling Basin Authority 12 1 . . . . . 13Attorney-General's 81 . . . . . . 81- Administrative Appeals Tribunal 15 . . . . . . 15- ACLEI 1 . . . . . . 1- AUSTRAC 5 1 . . . . . 6- Australian Crime Commission 6 1 . . . . . 7- Australian Financial Security Authority 3 1 . 1 . . . 5- Australian Human Rights Commission 1 . . . . . . 1- Australian Law Reform Commission . . . . . . . .- Commonwealth DPP 31 . . . . . . 31- CrimTrac Agency 2 . . . . . . 2- Family Court and Federal Circuit Court 2 . . . . . 2 4- Federal Court of Australia 13 1 . . . . . 14- National Archives of Australia . . . 1 . . . 1- OAIC 2 . . . . . . 2- Office of Parliamentary Counsel 1 . . . . . . 1Communications and the Arts 23 . . 1 . . . 24- ACMA 19 . . . . . 2 21- Australian National Maritime Museum 1 . . . . . . 1- National Film and Sound Archive 24 . . . . . 1 25- National Library of Australia 3 2 . 1 . . . 6- National Museum of Australia 1 . . . . . . 1- National Portrait Gallery 2 . . . . . . 2- Old Parliament House 2 . . . . . . 2- Screen Australia 2 . . . . . . 2Defence 673 50 2 6 . 1 9 741- Defence Housing Australia 5 . . . . . . 5Education and Training 35 1 . 3 . . . 39- AIATSIS . . . . . . . .- Australian Research Council 3 . . . . . . 3- Australian Skills Quality Authority . . . . . . . .- TEQSA 4 1 . . . . . 5Employment 39 1 . 3 . 1 1 45- Asbestos Safety and Eradication Agency . . . . . . . .- Comcare 3 2 . 1 . . . 6- Fair Work Commission 18 . . . . . . 18- OFWBII . . . . . 1 . 1- Office of the Fair Work Ombudsman 4 . . . . . . 4- Safe Work Australia 4 . . . . . . 4- Workplace Gender Equality Agency . . . . . . . .Environment 70 4 . 1 . . . 75- Bureau of Meteorology 7 . . 1 . . . 8- Clean Energy Regulator 1 . . 1 . . . 2- Climate Change Authority 2 . . . . . . 2- GBRMPA . . . . . . . .Finance 18 1 . . . . . 19- Australian Electoral Commission 8 . . 2 . . 1 11- Future Fund Management Agency . . . . . . . .Foreign Affairs and Trade 21 3 . 2 . . 4 30- ACIAR 1 . . . . . . 1- AUSTRADE 13 . . . . . . 13
112

Type of Termination
Agency Retrenchment
Physical or mentalincapacity
Inappropriately qualified Underperformance Section 29(3)(e)*
Breach of engagement
condition**Misconduct Total
Health 95 2 . 2 . . . 99- Australian Aged Care Quality Agency 35 . . . . . . 35- ACSQHC . . . . . . . .- Australian Institute of Health and Welfare . . . . . . . .- ARPANSA 5 . . . . . . 5- Australian Sports Anti-Doping Authority 6 . . . . . . 6- Cancer Australia 2 . . . . . . 2- FSANZ . . . . . . . .- Independent Hospital Pricing Authority . . . . . . . .- National Blood Authority . . . . . . . .- NHMRC 6 . . . . . . 6- National Health Funding Body . . . . . . . .- National Health Performance Authority 8 . . . . . . 8- National Mental Health Commission . . . . . . . .- Organ and Tissue Authority 3 . . . . . . 3- Professional Services Review 3 . . . . . . 3Human Services 138 99 . 13 . 11 28 289Immigration and Border Protection 101 14 . 6 . 1 3 125Industry, Innovation and Science 86 1 . 3 . . . 90- NOPSEMA . . . 1 . . . 1Infrastructure and Regional Development 32 . . . . . 1 33- Australian Transport Safety Bureau 3 . . . . . . 3- National Capital Authority . . . . . . . .Prime Minister and Cabinet 119 2 . 4 . 2 1 128- Aboriginal Hostels Ltd. 8 1 . . . . . 9- ANAO 2 . . . . . . 2- Australian Public Service Commission 5 . . . . . . 5- Commonwealth Ombudsman 6 . . . . . . 6- Digital Transformation Office . . . . . . . .- OIGIS . . . . . . . .- Office of National Assessments 1 . . . . . . 1- Torres Strait Regional Authority . . . . . . . .Social Services 92 5 . 2 1 1 . 101- Australian Institute of Family Studies . . . . . . . .- National Disability Insurance Agency 3 . . . . 1 . 4Treasury 8 . . . . . . 8- Australian Bureau of Statistics 51 1 . 1 . 2 . 55- ACCC 3 . . . . . . 3- ASIC 29 . . 1 . . . 30- Australian Taxation Office 706 60 . 11 . 3 7 787- Productivity Commission 2 . . . . . . 2Veterans' Affairs 35 9 . 2 . . . 46- Australian War Memorial 1 . . 1 . . . 2Australian Institute of Criminology (NC) 2 . . . . . . 2Customs & Border Protection (NC) 3 1 . . . . . 4
Total 2837 275 2 76 1 24 60 3275Source: APSED* Termination resulting from the failure to complete an entry level training course Section 29(3)(e)** Termination resulting from the failure to meet a condition of engagement imposed under subsection 22 (6) of PS Act (PS Act s29 (3)(f)) (i.e. probation, citizenship, formal qualifications, security and character clearances, health clearances)
113

Table 54: Separations of ongoing employees: agency by base classification, 2015-16
Classification
Agency Trainee Graduate APS 1 APS 2 APS 3 APS 4 APS 5 APS 6 EL 1 EL 2 SES 1 SES 2 SES 3 Total
Agriculture and Water Resources . . 1 1 32 36 30 32 35 16 2 . . 185- Australian Fisheries Management Authority . . . . . 2 2 8 3 2 . . . 17- APVMA . . . . 1 1 . 4 3 2 1 . . 12- Murray Darling Basin Authority . . . . 2 3 3 3 6 7 . 1 . 25Attorney-General's . . 2 . 4 32 33 56 51 25 12 6 2 223- Administrative Appeals Tribunal . 1 . 1 9 15 5 5 2 3 . 1 . 42- ACLEI . . . . . . 1 . 1 1 . . . 3- AUSTRAC . . . . . . 3 10 7 9 1 1 . 31- Australian Crime Commission . . . 1 2 4 2 5 11 6 . . . 31- Australian Financial Security Authority . . . 2 17 2 7 3 2 1 . . . 34- Australian Human Rights Commission . . . . . 6 1 1 5 1 . . . 14- Australian Law Reform Commission . . . . . . . 1 . . . . . 1- Commonwealth DPP . . . 4 3 9 6 11 13 17 1 1 . 65- CrimTrac Agency . . . . . 1 3 4 5 2 . . . 15- Family Court and Federal Circuit Court . . . 3 22 5 10 2 11 4 2 1 . 60- Federal Court of Australia . . . 3 3 5 5 5 5 4 1 . . 31- National Archives of Australia . . . . 1 2 3 6 6 . 1 . . 19- OAIC . . . . . 2 1 7 2 1 . . . 13- Office of Parliamentary Counsel . . . . . 2 3 . . 1 1 . . 7Communications and the Arts . 1 . . 1 6 7 11 12 4 3 2 . 47- ACMA . . . . . 5 1 12 18 2 1 . . 39- Australian National Maritime Museum . . . . 2 2 2 4 1 . . . . 11- National Film and Sound Archive . . . 2 6 4 6 5 4 3 . . . 30- National Library of Australia . 1 . 1 11 2 8 7 6 2 2 . . 40- National Museum of Australia . . . 1 2 . . 3 1 . 2 . . 9- National Portrait Gallery . . . . . . 1 1 1 1 . . . 4- Old Parliament House . . . . 2 . 2 1 1 1 . . . 7- Screen Australia . . . . . . 1 2 . 1 . . . 4Defence 9 9 8 71 105 145 230 330 608 247 19 10 2 1793- Defence Housing Australia . . . . 9 8 5 7 4 4 . . . 37Education and Training 2 1 . . 1 9 10 26 21 14 5 6 1 96- AIATSIS . . . . 1 1 1 1 . 1 . . . 5- Australian Research Council . . . . . . 3 6 . . . . . 9- Australian Skills Quality Authority . . . . . 3 2 4 4 2 . . . 15- TEQSA . . . . . 1 2 4 3 4 . . . 14Employment . . . 1 5 22 15 26 31 14 . 1 . 115- Comcare . . . 2 5 9 9 13 4 1 . . . 43- Fair Work Commission . . . . . 7 2 16 1 5 1 . . 32- OFWBII . . . . . 4 2 7 2 1 . . . 16- Office of the Fair Work Ombudsman . . . 1 5 5 10 8 13 2 2 . . 46- Safe Work Australia . . . . . . 3 1 2 5 . . . 11- Workplace Gender Equality Agency . . . . . . 1 4 1 1 . . . 7Environment . . . 6 8 11 20 24 60 12 1 1 1 144- Bureau of Meteorology 2 . 1 . 17 2 9 16 25 14 1 1 . 88- Clean Energy Regulator . . . . . 1 8 11 2 3 . 1 . 26- Climate Change Authority . . . . . . 1 . . 1 1 . . 3- GBRMPA . . . 2 1 . 2 2 1 1 . . . 9Finance . 1 . 1 5 10 16 18 18 24 5 1 . 99- Australian Electoral Commission . . . 22 10 9 15 23 11 2 . . . 92- Future Fund Management Agency . . . . . 3 3 . . 3 . . . 9Foreign Affairs and Trade 1 5 . 1 4 4 32 20 47 18 4 2 . 138- ACIAR . . . . . 2 . . . 1 . . . 3- AUSTRADE . . . . . 4 4 5 13 17 6 1 2 52Health . 5 . 3 7 33 22 65 70 56 15 4 1 281- Australian Aged Care Quality Agency . . . . 10 3 11 22 1 5 . . . 52
114

Classification
Agency Trainee Graduate APS 1 APS 2 APS 3 APS 4 APS 5 APS 6 EL 1 EL 2 SES 1 SES 2 SES 3 Total
- ACSQHC . . . . . . . 1 2 2 . . . 5- Australian Institute of Health and Welfare . . . . . 2 4 5 6 2 1 . . 20- ARPANSA . . . 1 1 . 1 3 1 2 . . . 9- Australian Sports Anti-Doping Authority . . . . . 3 1 . 3 . . . . 7- Cancer Australia . . . . . 1 2 1 2 2 . . . 8- FSANZ . . . . . 1 . 1 1 1 . . . 4- Independent Hospital Pricing Authority . . . . . 1 . . 5 2 . . . 8- National Blood Authority . . . . . . 1 . 2 1 . . . 4- NHMRC . . . . 1 1 4 4 5 1 1 1 . 18- National Health Funding Body . . . . . . . . 2 1 . . . 3- National Health Performance Authority . . . . . . . 3 4 6 1 . . 14- National Mental Health Commission . . . . . . . . 1 2 . . . 3- Organ and Tissue Authority . . . . 1 1 1 . . 1 . . . 4- Professional Services Review . . . . . . . . 2 1 . . . 3Human Services 24 . 13 32 306 628 168 276 111 62 14 4 . 1638Immigration and Border Protection 17 1 . 2 117 79 109 128 131 50 19 5 2 660Industry, Innovation and Science 1 2 1 1 2 26 38 86 73 31 6 2 1 270- NOPSEMA . . . . . . . . 1 1 . . . 2Infrastructure and Regional Development . . . . 1 9 23 25 32 22 3 2 . 117- Australian Transport Safety Bureau . . . . . . 2 . 6 3 1 . . 12- National Capital Authority . . . . 1 1 . 4 . . . . . 6Prime Minister and Cabinet . 1 . 1 4 33 32 43 65 34 8 3 1 225- Aboriginal Hostels Ltd. . . 18 3 9 1 2 1 3 . 1 . . 38- ANAO . 1 . . 2 3 8 5 4 9 1 2 . 35- Australian Public Service Commission . . . . . 4 2 2 4 7 . . . 19- Commonwealth Ombudsman . . . . 2 4 2 . 5 5 . . . 18- OIGIS . . . . . . . 1 . 1 . . . 2- Office of National Assessments . . . . . 3 2 3 3 2 1 . . 14- Torres Strait Regional Authority . . . 1 . . . 1 . 2 . . . 4Social Services . 1 . 4 2 16 28 48 50 29 2 2 . 182- Australian Institute of Family Studies . . . . . . . 1 3 . . . . 4- National Disability Insurance Agency . . . . 3 1 11 16 8 8 3 1 . 51Treasury . 2 . 5 1 7 12 20 17 7 2 1 1 75- Australian Bureau of Statistics . 4 . . 8 31 37 34 34 5 5 2 . 160- ACCC . . . . 6 4 8 7 6 3 1 . . 35- ASIC . 1 1 13 4 9 8 25 28 20 . . . 109- Australian Taxation Office . 5 13 74 149 157 99 156 392 151 11 4 . 1211- Productivity Commission . . . . . . 3 5 4 . 3 . . 15Veterans' Affairs . . . 6 25 15 29 49 28 12 2 1 . 167- Australian War Memorial . . . 3 1 2 2 2 6 1 . . . 17ComSuper (NC) . . 1 4 28 66 57 70 64 10 . . . 300Customs & Border Protection (NC) . . . . 2 . 2 . 1 2 . . . 7Australian Institute of Criminology (NC) . . . . . . 1 . . 1 . . . 2Total 56 42 59 279 989 1551 1283 1894 2269 1076 176 71 14 9759Source: APSED
115

Table 55: Separations of ongoing employees: length of service by base classification and sex, 2015-16
Classification
Length of service (years) Trainee Graduate APS 1 APS 2 APS 3 APS 4 APS 5 APS 6 EL 1 EL 2 SES 1 SES 2 SES 3 Total
Men
Under 1 18 16 . 15 36 11 18 9 12 7 1 . . 1431 and < 2 2 7 . 5 12 13 29 11 4 3 . . . 862 and < 3 4 1 . 8 22 29 42 18 17 10 4 1 . 1563 and < 5 2 . 4 8 42 99 102 114 80 36 2 . . 4895 and < 10 . . 3 10 75 110 144 279 264 92 9 5 2 99310 and < 15 1 . 4 17 47 75 81 98 236 106 19 7 1 69215 and < 20 . . 2 8 26 42 53 76 163 71 13 5 1 46020 and < 30 . . 3 18 40 82 60 132 231 141 15 9 2 73330 and <40 . . . 4 25 39 69 117 259 162 27 19 1 72240 and over . . . 3 10 8 10 19 27 24 9 5 1 116Total men 27 24 16 96 335 508 608 873 1293 652 99 51 8 4590
Women
Under 1 20 14 . 35 66 62 20 17 9 5 2 . . 2501 and < 2 3 2 1 5 33 30 24 13 6 2 1 . . 1202 and < 3 3 1 3 6 42 47 49 54 19 8 2 . . 2343 and < 5 1 1 7 25 70 129 110 127 60 26 2 1 1 5605 and < 10 1 . 15 35 186 273 189 259 218 66 10 3 . 125510 and < 15 1 . 9 20 123 168 105 190 197 70 15 3 . 90115 and < 20 . . 2 21 45 120 56 111 162 61 9 1 1 58920 and < 30 . . 6 19 60 135 73 151 178 98 15 6 . 74130 and <40 . . . 14 26 75 45 85 121 83 17 6 3 47540 and over . . . 3 3 4 4 14 6 5 4 . 1 44Total women 29 18 43 183 654 1043 675 1021 976 424 77 20 6 5169
Total
Under 1 38 30 . 50 102 73 38 26 21 12 3 . . 3931 and < 2 5 9 1 10 45 43 53 24 10 5 1 . . 2062 and < 3 7 2 3 14 64 76 91 72 36 18 6 1 . 3903 and < 5 3 1 11 33 112 228 212 241 140 62 4 1 1 10495 and < 10 1 . 18 45 261 383 333 538 482 158 19 8 2 224810 and < 15 2 . 13 37 170 243 186 288 433 176 34 10 1 159315 and < 20 . . 4 29 71 162 109 187 325 132 22 6 2 104920 and < 30 . . 9 37 100 217 133 283 409 239 30 15 2 147430 and <40 . . . 18 51 114 114 202 380 245 44 25 4 119740 and over . . . 6 13 12 14 33 33 29 13 5 2 160Total 56 42 59 279 989 1551 1283 1894 2269 1076 176 71 14 9759Source: APSED
116

Table 56: Separations of ongoing employees: length of service by type of separation and sex, 2015-16
Separation type
Length of service (years) Resignation Age Retirement Retrenchment Physical or Mental incapacity
Termination of Appointment
Compulsory move to
non-APS agencyDeceased Total
Men
Under 1 121 9 4 . 8 . 1 1431 and < 2 76 4 . . 4 2 . 862 and < 3 131 7 10 . 2 6 . 1563 and < 5 395 31 32 5 10 15 1 4895 and < 10 594 97 195 14 26 57 10 99310 and < 15 207 165 244 35 15 15 11 69215 and < 20 66 146 208 17 6 14 3 46020 and < 30 73 247 356 27 8 13 9 73330 and <40 131 195 373 7 1 9 6 72240 and over . 72 40 2 . 1 1 116Total men 1794 973 1462 107 80 132 42 4590
Women
Under 1 213 15 8 . 13 . 1 2501 and < 2 105 10 1 . 2 2 . 1202 and < 3 179 9 29 . 8 6 3 2343 and < 5 447 36 47 4 9 16 1 5605 and < 10 759 143 215 28 29 66 15 125510 and < 15 310 210 285 40 12 34 10 90115 and < 20 134 152 238 36 7 19 3 58920 and < 30 74 267 317 50 2 17 14 74130 and <40 80 159 216 10 1 7 2 47540 and over . 24 19 . . . 1 44Total women 2301 1025 1375 168 83 167 50 5169
Total
Under 1 334 24 12 . 21 . 2 3931 and < 2 181 14 1 . 6 4 . 2062 and < 3 310 16 39 . 10 12 3 3903 and < 5 842 67 79 9 19 31 2 10495 and < 10 1353 240 410 42 55 123 25 224810 and < 15 517 375 529 75 27 49 21 159315 and < 20 200 298 446 53 13 33 6 104920 and < 30 147 514 673 77 10 30 23 147430 and <40 211 354 589 17 2 16 8 119740 and over . 96 59 2 . 1 2 160Total 4095 1998 2837 275 163 299 92 9759Source: APSEDNote: age retirements include resignations after age 55.
117

Section 5: Diversity
Under Clause 7.6 (1) of the Australian Public Service Commissioner’s Directions 2013 an Agency Head must ensure that there are measures in place to collect certain information from employees of their agency and to give that information to the Commissioner. This includes information about an employee’s Indigenous status, their disability status and certain information that is used to derive an employee’s non-English speaking background (NESB) status.
With the exception of gender, diversity data is supplied to agencies by individuals on a voluntary basis. As with any large voluntary data collection, APSED data tends to under-represent the number and proportion of Indigenous Australians, people with disability, and employees from a non-English speaking background in the APS.
The Commission continues to work with agencies to increase the number of employees that provide their diversity data to their agency, and to improve the quality of data provided by agencies to APSED. There have been some improvements, however the overall quality of the data continues to be poor and there are a number of agencies that still provide little or no data about the diversity status of their employees.
The proportion of NESB employees has decreased from 14.7% at June 2015 to 14.5% at June 2016. This includes both NESB 1 and NESB 2. Appendix 1 provides an explanation of NESB.
Figure 19 shows the change in the representation of the four diversity groups from their proportion at June 2002. Each of these proportions is weighted by the ratio of the June 2002 total ongoing APS number, to the number of employees in the respective diversity group at June 2002. Weighting eliminates the effects that the changes in the overall size of the APS have on representation. The index is given a value of 100 at June 2002, and rises and falls proportionally with the particular group’s change in the weighted number over time. For example, at June 2002 the number of Indigenous employees was 3,058 out of an ongoing APS population of 112,232. By June 2016 the number of Indigenous employees had risen to 3,972 and the ongoing APS number had risen to 137,848. Therefore the weighted Indigenous number for June 2016 is 3,234, which is 105.8% of the original index.
118

119
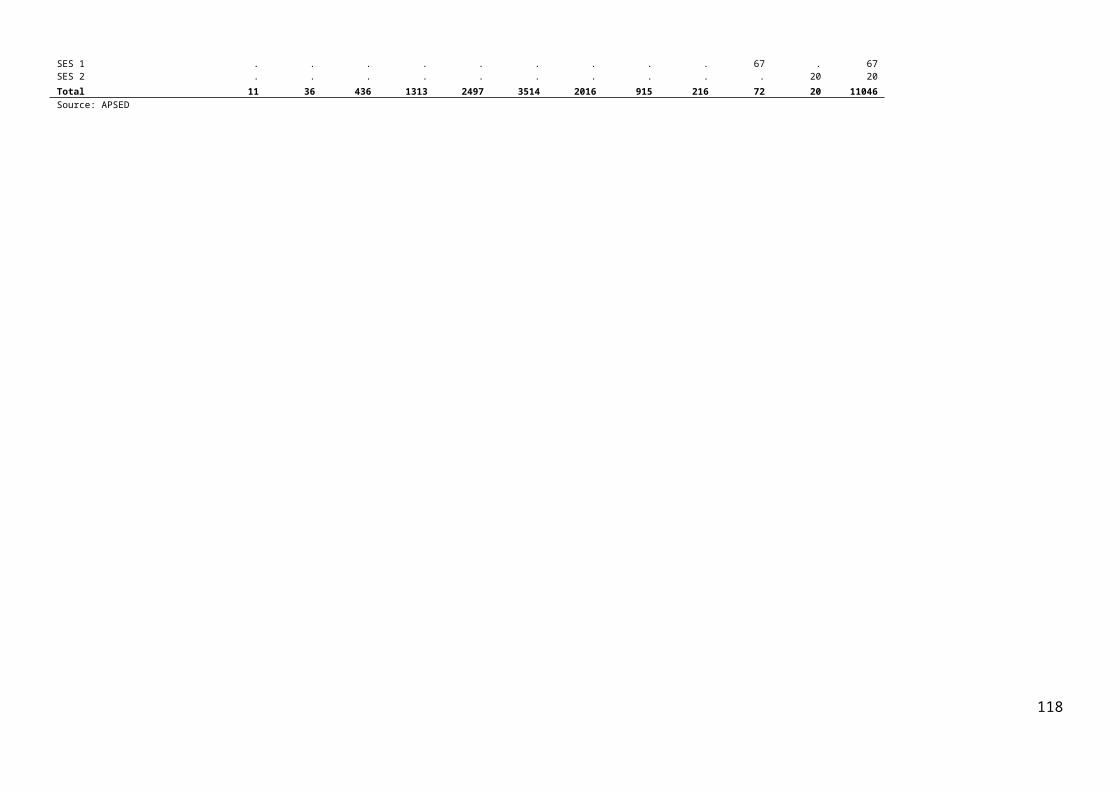
Table 57: Ongoing employees: diversity group, 30 June 2002 to 30 June 2016
June
Diversity group 2002 2003 2004 2005 2006 2007 2008 2009 2010 2011 2012 2013 2014 2015 2016
Number
Women 58224 63475 65045 66874 75248 81284 84304 86185 86465 87798 88044 87173 83653 78987 80519Indigenous Australians 3058 3252 3211 3094 3214 3457 3474 3583 3688 3589 3578 3694 3742 3741 3972People with disability 4652 5072 5210 5130 5222 5302 5279 5188 5222 5111 5035 4937 5057 4925 5161NESB 1 4785 5048 5231 5485 6109 6637 6905 7175 7378 7814 8079 8111 7859 7514 7486NESB 2 8076 8691 8960 9324 10477 11462 12013 12433 12687 13300 13695 13734 13285 12587 12548
Total ongoing employees11223
212027
612235
012336
913470
514353
414736
414981
815042
815272
015346
615139
314489
513652
413784
8
Per cent
Women 51.9 52.8 53.2 54.2 55.9 56.6 57.2 57.5 57.5 57.5 57.4 57.6 57.7 57.9 58.4Indigenous Australians 2.7 2.7 2.6 2.5 2.4 2.4 2.4 2.4 2.5 2.4 2.3 2.4 2.6 2.7 2.9People with disability 4.1 4.2 4.3 4.2 3.9 3.7 3.6 3.5 3.5 3.3 3.3 3.3 3.5 3.6 3.7NESB 1 4.3 4.2 4.3 4.4 4.5 4.6 4.7 4.8 4.9 5.1 5.3 5.4 5.4 5.5 5.4NESB 2 7.2 7.2 7.3 7.6 7.8 8.0 8.2 8.3 8.4 8.7 8.9 9.1 9.2 9.2 9.1Source: APSED
120

Table 58: Ongoing employees: agency by diversity group, 30 June 2016
Sex Indigenous Disability English Speaking Background
Agency Men Women Total Indigenous Non-
Indigenous No data Disability No Disability No data NESB 1 NESB 2 Eng
Spkng No data
Agriculture and Water Resources 2219 2205 4424 91 3492 841 100 3190 1134 267 362 2483 1312- Australian Fisheries Management Authority 93 68 161 1 123 37 4 130 27 2 6 98 55- APVMA 67 109 176 . 174 2 1 170 5 8 12 140 16- Murray Darling Basin Authority 136 156 292 5 284 3 10 274 8 21 15 230 26Attorney-General's 541 1099 1640 18 917 705 21 947 672 50 63 759 768- Administrative Appeals Tribunal 156 277 433 7 385 41 13 367 53 45 77 256 55- ACLEI 22 14 36 . 36 . . 36 . . 2 34 .- AUSTRAC 148 194 342 1 337 4 9 327 6 25 51 259 7- Australian Crime Commission 281 275 556 10 416 130 5 505 46 19 36 380 121- Australian Financial Security Authority 188 271 459 10 404 45 8 398 53 58 62 274 65- Australian Human Rights Commission 26 73 99 3 78 18 4 75 20 12 11 52 24- Australian Law Reform Commission . 10 10 . 10 . . 10 . . 1 4 5- Commonwealth DPP 119 273 392 2 351 39 11 356 25 17 48 288 39- CrimTrac Agency 107 117 224 1 211 12 11 203 10 24 11 174 15- Family Court and Federal Circuit Court 156 441 597 7 537 53 15 533 49 26 49 407 115- Federal Court of Australia 77 216 293 8 274 11 6 270 17 19 28 226 20- National Archives of Australia 141 215 356 4 295 57 10 293 53 21 22 258 55- OAIC 21 50 71 1 67 3 1 67 3 3 12 53 3- Office of Parliamentary Counsel 38 59 97 1 75 21 1 76 20 4 4 67 22Communications and the Arts 201 341 542 20 478 44 14 474 54 19 46 400 77- ACMA 200 228 428 4 416 8 6 406 16 45 49 276 58- Australian National Maritime Museum 43 51 94 2 88 4 4 87 3 4 11 74 5- National Film and Sound Archive 65 86 151 4 80 67 5 114 32 7 9 102 33- National Library of Australia 117 286 403 10 359 34 29 350 24 50 32 302 19- National Museum of Australia 64 143 207 10 164 33 8 176 23 12 12 156 27- National Portrait Gallery 11 32 43 1 37 5 . 41 2 . 2 36 5- Old Parliament House 22 39 61 1 42 18 2 45 14 . . 45 16- Screen Australia 4 8 12 . 10 2 . 9 3 2 1 6 3Defence 10847 7609 18456 335 8333 9788 599 5071 12786 323 1502 10787 5844- Defence Housing Australia 190 354 544 8 521 15 4 522 18 23 20 446 55Education and Training 729 1308 2037 77 1595 365 56 1667 314 109 127 1344 457- AIATSIS 56 65 121 24 91 6 10 98 13 2 3 104 12- Australian Research Council 33 82 115 . 91 24 3 93 19 7 8 78 22- Australian Skills Quality Authority 52 112 164 1 80 83 5 75 84 3 12 70 79- TEQSA 16 33 49 . 45 4 . 42 7 2 7 35 5Employment 842 1047 1889 54 1298 537 76 1361 452 113 133 1193 450- Asbestos Safety and Eradication Agency 6 1 7 . 7 . . 7 . . . 6 1- Comcare 230 392 622 4 577 41 13 594 15 29 77 490 26- Fair Work Commission 86 166 252 . 231 21 6 224 22 10 40 184 18- OFWBII 69 62 131 1 64 66 4 62 65 . 3 58 70- Office of the Fair Work Ombudsman 270 490 760 8 631 121 30 601 129 37 70 534 119- Safe Work Australia 25 75 100 . 80 20 6 76 18 3 3 78 16- Workplace Gender Equality Agency 4 21 25 . 14 11 1 15 9 . 1 15 9Environment 855 1127 1982 80 1571 331 43 1668 271 54 97 1453 378- Bureau of Meteorology 1012 428 1440 14 1279 147 48 1305 87 177 121 1047 95- Clean Energy Regulator 162 168 330 4 313 13 6 312 12 8 35 272 15- Climate Change Authority 7 11 18 . 16 2 . 17 1 . 1 14 3- GBRMPA 68 121 189 10 156 23 5 149 35 3 10 103 73Finance 649 803 1452 26 1271 155 49 1255 148 70 133 873 376- Australian Electoral Commission 262 576 838 23 760 55 8 766 64 16 55 550 217- Future Fund Management Agency 66 58 124 . 2 122 . 1 123 . . 1 123
121

Sex Indigenous Disability English Speaking Background
Agency Men Women Total Indigenous Non-
Indigenous No data Disability No Disability No data NESB 1 NESB 2 Eng
Spkng No data
Foreign Affairs and Trade 1569 2126 3695 72 3468 155 59 3633 3 149 302 2740 504- ACIAR 6 27 33 . 33 . . 33 . 3 3 26 1- AUSTRADE 245 282 527 3 446 78 12 368 147 40 44 283 160Health 1434 3218 4652 114 4164 374 264 4127 261 241 392 3403 616- Australian Aged Care Quality Agency 38 168 206 1 156 49 5 145 56 9 16 126 55- ACSQHC 20 62 82 . 77 5 2 76 4 6 7 63 6- Australian Institute of Health and Welfare 96 221 317 2 308 7 8 290 19 6 37 236 38- ARPANSA 72 54 126 . 95 31 3 106 17 9 12 85 20- Australian Sports Anti-Doping Authority 21 21 42 . 37 5 . 38 4 1 3 28 10- Cancer Australia 6 49 55 . 21 34 2 22 31 1 1 20 33- FSANZ 32 62 94 2 68 24 3 66 25 5 4 53 32- Independent Hospital Pricing Authority 16 24 40 2 36 2 1 38 1 5 6 24 5- National Blood Authority 17 34 51 . 31 20 1 32 18 2 1 23 25- NHMRC 58 133 191 2 181 8 10 179 2 15 15 157 4- National Health Funding Body 4 9 13 2 9 2 . 13 . 4 1 7 1- National Health Performance Authority 1 5 6 . 6 . . 6 . . 1 5 .- National Mental Health Commission 2 12 14 1 11 2 2 11 1 . 1 11 2- Organ and Tissue Authority 9 14 23 . 22 1 1 21 1 1 5 10 7- Professional Services Review 8 8 16 . 11 5 1 12 3 1 4 9 2Human Services 8986 22640 31626 1507 27730 2389 1852 17808 11966 1616 2922 20777 6311Immigration and Border Protection 6239 7274 13513 259 10299 2955 300 10202 3011 912 1551 8213 2837Industry, Innovation and Science 2239 2080 4319 44 3563 712 100 3649 570 468 352 2752 747- NOPSEMA 66 43 109 . 108 1 . 107 2 5 7 96 1Infrastructure and Regional Development 574 571 1145 24 1076 45 44 1066 35 66 89 941 49- Australian Transport Safety Bureau 67 27 94 . 85 9 1 84 9 . 7 77 10- National Capital Authority 19 28 47 4 34 9 . 38 9 2 3 32 10Prime Minister and Cabinet 687 1343 2030 321 1527 182 82 1738 210 68 115 1512 335- Aboriginal Hostels Ltd. 74 137 211 144 66 1 6 188 17 5 16 134 56- ANAO 135 192 327 2 212 113 6 320 1 24 26 244 33- Australian Public Service Commission 51 146 197 11 176 10 22 165 10 3 9 162 23- Commonwealth Ombudsman 45 101 146 1 120 25 6 121 19 5 11 112 18- Digital Transformation Office 20 16 36 1 26 9 2 23 11 . . 25 11- OIGIS 6 7 13 . 13 . 2 11 . . 1 11 1- Office of National Assessments 78 53 131 . 116 15 . 121 10 1 8 112 10- Torres Strait Regional Authority 13 30 43 26 16 1 . 30 13 1 1 12 29Social Services 772 1457 2229 102 1835 292 161 1699 369 85 175 1417 552- Australian Institute of Family Studies 9 34 43 . 41 2 1 39 3 2 7 31 3- National Disability Insurance Agency 286 827 1113 19 955 139 175 754 184 32 76 862 143Treasury 579 555 1134 3 1031 100 22 1021 91 111 117 795 111- Australian Bureau of Statistics 1270 1435 2705 37 1839 829 80 1761 864 161 174 1410 960- ACCC 376 434 810 9 786 15 15 778 17 38 107 636 29- ASIC 654 906 1560 9 813 738 1 1559 . 57 186 879 438- Australian Taxation Office 7717 9861 17578 322 13352 3904 590 12969 4019 1505 2079 8874 5120- Productivity Commission 83 83 166 1 161 4 2 156 8 12 22 127 5Veterans' Affairs 716 1135 1851 32 1549 270 43 1808 . 56 126 1130 539- Australian War Memorial 115 130 245 2 187 56 4 183 58 4 14 183 44
Total 57329 8051913784
8 3972 106062 27814 5161 93524 39163 7486 12548 86439 31375Source: APSED
122

Table 58: Non-ongoing employees: agency by diversity group, 30 June 2016
Sex Indigenous Disability English Speaking Background
Agency Men Women Total Indigenous Non-
Indigenous No data Disability No Disability No data NESB 1 NESB 2 Eng
Spkng No data
Agriculture and Water Resources 338 272 610 11 492 107 11 393 206 43 26 186 355- Australian Fisheries Management Authority 19 4 23 1 10 12 . 15 8 . . 12 11- APVMA 7 7 14 . 14 . . 14 . 1 . 13 .- Murray Darling Basin Authority 16 13 29 . 29 . 3 25 1 2 2 21 4Attorney-General's 116 247 363 5 168 190 . 208 155 5 16 171 171- Administrative Appeals Tribunal 41 67 108 1 88 19 3 79 26 5 9 72 22- ACLEI 9 3 12 . 12 . 2 10 . 1 . 10 1- AUSTRAC . 3 3 . 3 . . 3 . 2 1 . .- Australian Crime Commission 16 18 34 1 31 2 3 30 1 2 2 29 1- Australian Financial Security Authority 11 30 41 2 37 2 1 38 2 5 4 29 3- Australian Human Rights Commission 5 13 18 1 14 3 1 13 4 2 2 9 5- Commonwealth DPP 8 24 32 . 23 9 . 30 2 4 6 21 1- CrimTrac Agency 3 3 6 . 6 . 1 5 . . . 6 .- Family Court and Federal Circuit Court 50 145 195 1 191 3 3 189 3 5 30 158 2- Federal Court of Australia 74 117 191 2 175 14 . 173 18 5 23 142 21- National Archives of Australia 27 58 85 1 63 21 5 73 7 6 6 66 7- OAIC 2 1 3 . 3 . . 3 . . . 3 .- Office of Parliamentary Counsel . 4 4 . 4 . . 4 . 1 . 3 .Communications and the Arts 14 30 44 2 40 2 . 41 3 . 2 37 5- ACMA 7 10 17 . 17 . . 17 . 2 . 13 2- Australian National Maritime Museum 9 12 21 . 19 2 . 19 2 . . 18 3- National Film and Sound Archive 17 31 48 . 11 37 1 23 24 2 2 22 22- National Library of Australia 21 32 53 1 49 3 2 49 2 3 3 45 2- National Museum of Australia 14 35 49 1 45 3 1 44 4 2 2 40 5- National Portrait Gallery 8 10 18 . 12 6 . 15 3 . . 14 4- Old Parliament House 10 26 36 . 17 19 2 16 18 . . 20 16Defence 82 29 111 1 28 82 2 22 87 2 8 39 62- Defence Housing Australia 27 54 81 1 78 2 . 79 2 5 8 66 2Education and Training 22 27 49 . 38 11 3 24 22 . 2 28 19- AIATSIS 20 29 49 13 34 2 1 45 3 4 2 41 2- Australian Research Council 2 7 9 . 9 . . 9 . 1 . 8 .- Australian Skills Quality Authority 11 32 43 . 29 14 1 30 12 2 3 25 13- TEQSA 1 2 3 . 3 . . 3 . . . 2 1Employment 49 63 112 . 73 39 3 76 33 3 6 78 25- Asbestos Safety and Eradication Agency 1 2 3 . 1 2 . 2 1 . . 2 1- Comcare 21 46 67 . 61 6 1 64 2 6 10 47 4- Fair Work Commission 16 36 52 . 32 20 . 32 20 1 5 25 21- OFWBII 3 11 14 . 2 12 . 2 12 . . 2 12- Office of the Fair Work Ombudsman 21 27 48 1 43 4 3 44 1 . 8 39 1- Safe Work Australia 1 5 6 . 6 . . 6 . . . 6 .- Workplace Gender Equality Agency 1 5 6 . 3 3 . 3 3 1 . 2 3Environment 216 254 470 76 257 137 6 364 100 4 25 326 115- Bureau of Meteorology 149 78 227 2 188 37 4 208 15 47 23 149 8- Clean Energy Regulator 15 24 39 2 33 4 1 35 3 . 7 27 5- Climate Change Authority 1 5 6 . 3 3 . 3 3 . . 3 3- GBRMPA 17 34 51 3 36 12 1 37 13 1 3 13 34Finance 284 70 354 . 301 53 8 299 47 12 23 126 193- Australian Electoral Commission 374 1015 1389 25 1272 92 10 1325 54 25 90 1193 81- Future Fund Management Agency 3 3 6 . . 6 . . 6 . . . 6Foreign Affairs and Trade 46 72 118 . 58 60 1 117 . 2 9 68 39
123

Sex Indigenous Disability English Speaking Background
Agency Men Women Total Indigenous Non-
Indigenous No data Disability No Disability No data NESB 1 NESB 2 Eng
Spkng No data
- ACIAR 18 4 22 . 22 . . 22 . 4 1 17 .- AUSTRADE 15 23 38 1 34 3 2 32 4 . 2 32 4Health 134 289 423 8 349 66 21 354 48 16 30 317 60- Australian Aged Care Quality Agency 9 11 20 . 17 3 . 18 2 3 3 11 3- ACSQHC 5 16 21 . 15 6 1 16 4 . 2 16 3- Australian Institute of Health and Welfare 8 20 28 . 23 5 . 22 6 . 1 20 7- ARPANSA 5 12 17 . 14 3 1 13 3 2 1 10 4- Australian Sports Anti-Doping Authority 147 101 248 . 43 205 . 22 226 . . 9 239- Cancer Australia 4 11 15 . . 15 . . 15 . . . 15- FSANZ 3 5 8 . 6 2 . 6 2 . 1 5 2- Independent Hospital Pricing Authority 6 10 16 . 12 4 . 15 1 1 1 12 2- National Blood Authority 2 3 5 . 2 3 . 1 4 . . 2 3- NHMRC 9 18 27 . 27 . 2 24 1 1 2 24 .- National Health Funding Body 2 2 4 . 3 1 . 4 . 1 . 2 1- National Health Performance Authority . 1 1 . . 1 . 1 . . . 1 .- Organ and Tissue Authority 2 3 5 . 3 2 . 5 . . . 4 1- Professional Services Review 1 2 3 . 3 . . 3 . . 1 2 .Human Services 1412 3533 4945 89 4436 420 73 605 4267 99 198 1409 3239Immigration and Border Protection 302 456 758 4 313 441 8 295 455 20 42 223 473Industry, Innovation and Science 197 200 397 4 253 140 8 293 96 18 35 243 101- NOPSEMA 5 1 6 . 6 . . 6 . 1 1 4 .Infrastructure and Regional Development 8 7 15 . 12 3 . 12 3 . 1 12 2- Australian Transport Safety Bureau 3 3 6 . 5 1 . 5 1 1 . 4 1- National Capital Authority 4 11 15 . 3 12 . 6 9 . . 6 9Prime Minister and Cabinet 57 77 134 28 86 20 2 104 28 6 3 94 31- Aboriginal Hostels Ltd. 115 185 300 189 104 7 6 283 11 11 31 217 41- ANAO 6 9 15 1 11 3 2 13 . 1 2 12 .- Australian Public Service Commission 16 24 40 . 31 9 1 31 8 . 1 29 10- Commonwealth Ombudsman 11 12 23 3 17 3 1 16 6 1 . 19 3- Digital Transformation Office 18 16 34 . 4 30 . 2 32 . . . 34- Office of National Assessments 3 3 6 . 3 3 . 4 2 1 . 3 2- Torres Strait Regional Authority 65 40 105 66 8 31 . 6 99 . . 5 100Social Services 47 86 133 4 87 42 9 65 59 2 13 83 35- Australian Institute of Family Studies 14 25 39 . 35 4 . 34 5 1 3 31 4- National Disability Insurance Agency 97 296 393 12 316 65 70 242 81 7 23 286 77Treasury 48 84 132 1 107 24 4 94 34 2 10 91 29- Australian Bureau of Statistics 430 436 866 8 95 763 5 90 771 12 10 65 779- ACCC 28 29 57 2 51 4 5 49 3 1 6 45 5- ASIC 81 128 209 1 63 145 1 207 1 1 12 62 134- Australian Taxation Office 863 1943 2806 14 870 1922 43 831 1932 90 136 632 1948- Productivity Commission 3 3 6 . 6 . . 6 . 2 2 2 .Veterans' Affairs 47 108 155 1 88 66 . 155 . 1 7 75 72- Australian War Memorial 20 37 57 2 28 27 . 43 14 . 2 40 15
Total 64951142
81792
3 592 11772 5559 349 8413 9161 520 951 7651 8801Source: APSED
124

Table 58: All employees: agency by diversity group, 30 June 2016
Sex Indigenous Disability English Speaking Background
Agency Men Women Total Indigenous Non-
Indigenous No data Disability No Disability No data NESB 1 NESB 2 Eng
Spkng No data
Agriculture and Water Resources 2557 2477 5034 102 3984 948 111 3583 1340 310 388 2669 1667- Australian Fisheries Management Authority 112 72 184 2 133 49 4 145 35 2 6 110 66- APVMA 74 116 190 . 188 2 1 184 5 9 12 153 16- Murray Darling Basin Authority 152 169 321 5 313 3 13 299 9 23 17 251 30Attorney-General's 657 1346 2003 23 1085 895 21 1155 827 55 79 930 939- Administrative Appeals Tribunal 197 344 541 8 473 60 16 446 79 50 86 328 77- ACLEI 31 17 48 . 48 . 2 46 . 1 2 44 1- AUSTRAC 148 197 345 1 340 4 9 330 6 27 52 259 7- Australian Crime Commission 297 293 590 11 447 132 8 535 47 21 38 409 122- Australian Financial Security Authority 199 301 500 12 441 47 9 436 55 63 66 303 68- Australian Human Rights Commission 31 86 117 4 92 21 5 88 24 14 13 61 29- Australian Law Reform Commission . 10 10 . 10 . . 10 . . 1 4 5- Commonwealth DPP 127 297 424 2 374 48 11 386 27 21 54 309 40- CrimTrac Agency 110 120 230 1 217 12 12 208 10 24 11 180 15- Family Court and Federal Circuit Court 206 586 792 8 728 56 18 722 52 31 79 565 117- Federal Court of Australia 151 333 484 10 449 25 6 443 35 24 51 368 41- National Archives of Australia 168 273 441 5 358 78 15 366 60 27 28 324 62- OAIC 23 51 74 1 70 3 1 70 3 3 12 56 3- Office of Parliamentary Counsel 38 63 101 1 79 21 1 80 20 5 4 70 22Communications and the Arts 215 371 586 22 518 46 14 515 57 19 48 437 82- ACMA 207 238 445 4 433 8 6 423 16 47 49 289 60- Australian National Maritime Museum 52 63 115 2 107 6 4 106 5 4 11 92 8- National Film and Sound Archive 82 117 199 4 91 104 6 137 56 9 11 124 55- National Library of Australia 138 318 456 11 408 37 31 399 26 53 35 347 21- National Museum of Australia 78 178 256 11 209 36 9 220 27 14 14 196 32- National Portrait Gallery 19 42 61 1 49 11 . 56 5 . 2 50 9- Old Parliament House 32 65 97 1 59 37 4 61 32 . . 65 32- Screen Australia 4 8 12 . 10 2 . 9 3 2 1 6 3Defence 10929 7638 18567 336 8361 9870 601 5093 12873 325 1510 10826 5906- Defence Housing Australia 217 408 625 9 599 17 4 601 20 28 28 512 57Education and Training 751 1335 2086 77 1633 376 59 1691 336 109 129 1372 476- AIATSIS 76 94 170 37 125 8 11 143 16 6 5 145 14- Australian Research Council 35 89 124 . 100 24 3 102 19 8 8 86 22- Australian Skills Quality Authority 63 144 207 1 109 97 6 105 96 5 15 95 92- TEQSA 17 35 52 . 48 4 . 45 7 2 7 37 6Employment 891 1110 2001 54 1371 576 79 1437 485 116 139 1271 475- Asbestos Safety and Eradication Agency 7 3 10 . 8 2 . 9 1 . . 8 2- Comcare 251 438 689 4 638 47 14 658 17 35 87 537 30- Fair Work Commission 102 202 304 . 263 41 6 256 42 11 45 209 39- OFWBII 72 73 145 1 66 78 4 64 77 . 3 60 82- Office of the Fair Work Ombudsman 291 517 808 9 674 125 33 645 130 37 78 573 120- Safe Work Australia 26 80 106 . 86 20 6 82 18 3 3 84 16- Workplace Gender Equality Agency 5 26 31 . 17 14 1 18 12 1 1 17 12Environment 1071 1381 2452 156 1828 468 49 2032 371 58 122 1779 493- Bureau of Meteorology 1161 506 1667 16 1467 184 52 1513 102 224 144 1196 103- Clean Energy Regulator 177 192 369 6 346 17 7 347 15 8 42 299 20- Climate Change Authority 8 16 24 . 19 5 . 20 4 . 1 17 6- GBRMPA 85 155 240 13 192 35 6 186 48 4 13 116 107Finance 933 873 1806 26 1572 208 57 1554 195 82 156 999 569- Australian Electoral Commission 636 1591 2227 48 2032 147 18 2091 118 41 145 1743 298- Future Fund Management Agency 69 61 130 . 2 128 . 1 129 . . 1 129
125
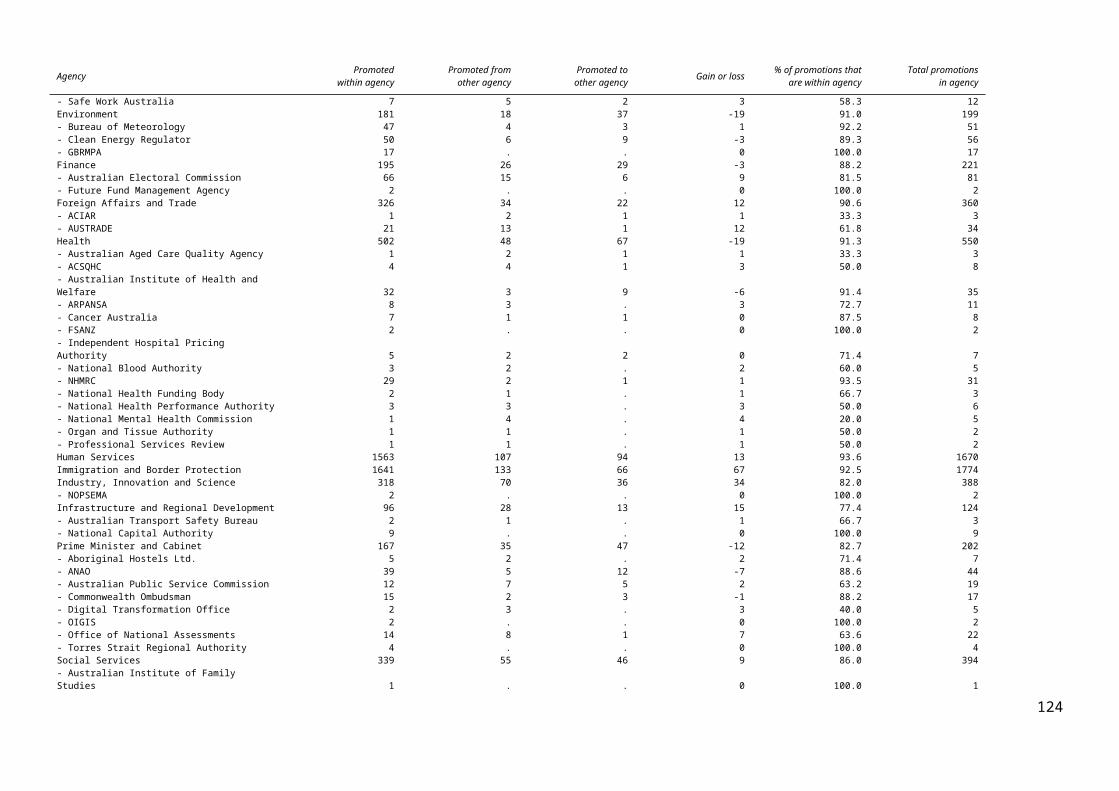
Sex Indigenous Disability English Speaking Background
Agency Men Women Total Indigenous Non-
Indigenous No data Disability No Disability No data NESB 1 NESB 2 Eng
Spkng No data
Foreign Affairs and Trade 1615 2198 3813 72 3526 215 60 3750 3 151 311 2808 543- ACIAR 24 31 55 . 55 . . 55 . 7 4 43 1- AUSTRADE 260 305 565 4 480 81 14 400 151 40 46 315 164Health 1568 3507 5075 122 4513 440 285 4481 309 257 422 3720 676- Australian Aged Care Quality Agency 47 179 226 1 173 52 5 163 58 12 19 137 58- ACSQHC 25 78 103 . 92 11 3 92 8 6 9 79 9- Australian Institute of Health and Welfare 104 241 345 2 331 12 8 312 25 6 38 256 45- ARPANSA 77 66 143 . 109 34 4 119 20 11 13 95 24- Australian Sports Anti-Doping Authority 168 122 290 . 80 210 . 60 230 1 3 37 249- Cancer Australia 10 60 70 . 21 49 2 22 46 1 1 20 48- FSANZ 35 67 102 2 74 26 3 72 27 5 5 58 34- Independent Hospital Pricing Authority 22 34 56 2 48 6 1 53 2 6 7 36 7- National Blood Authority 19 37 56 . 33 23 1 33 22 2 1 25 28- NHMRC 67 151 218 2 208 8 12 203 3 16 17 181 4- National Health Funding Body 6 11 17 2 12 3 . 17 . 5 1 9 2- National Health Performance Authority 1 6 7 . 6 1 . 7 . . 1 6 .- National Mental Health Commission 2 12 14 1 11 2 2 11 1 . 1 11 2- Organ and Tissue Authority 11 17 28 . 25 3 1 26 1 1 5 14 8- Professional Services Review 9 10 19 . 14 5 1 15 3 1 5 11 2Human Services 10398 26173 36571 1596 32166 2809 1925 18413 16233 1715 3120 22186 9550Immigration and Border Protection 6541 7730 14271 263 10612 3396 308 10497 3466 932 1593 8436 3310Industry, Innovation and Science 2436 2280 4716 48 3816 852 108 3942 666 486 387 2995 848- NOPSEMA 71 44 115 . 114 1 . 113 2 6 8 100 1Infrastructure and Regional Development 582 578 1160 24 1088 48 44 1078 38 66 90 953 51- Australian Transport Safety Bureau 70 30 100 . 90 10 1 89 10 1 7 81 11- National Capital Authority 23 39 62 4 37 21 . 44 18 2 3 38 19Prime Minister and Cabinet 744 1420 2164 349 1613 202 84 1842 238 74 118 1606 366- Aboriginal Hostels Ltd. 189 322 511 333 170 8 12 471 28 16 47 351 97- ANAO 141 201 342 3 223 116 8 333 1 25 28 256 33- Australian Public Service Commission 67 170 237 11 207 19 23 196 18 3 10 191 33- Commonwealth Ombudsman 56 113 169 4 137 28 7 137 25 6 11 131 21- Digital Transformation Office 38 32 70 1 30 39 2 25 43 . . 25 45- OIGIS 6 7 13 . 13 . 2 11 . . 1 11 1- Office of National Assessments 81 56 137 . 119 18 . 125 12 2 8 115 12- Torres Strait Regional Authority 78 70 148 92 24 32 . 36 112 1 1 17 129Social Services 819 1543 2362 106 1922 334 170 1764 428 87 188 1500 587- Australian Institute of Family Studies 23 59 82 . 76 6 1 73 8 3 10 62 7- National Disability Insurance Agency 383 1123 1506 31 1271 204 245 996 265 39 99 1148 220Treasury 627 639 1266 4 1138 124 26 1115 125 113 127 886 140- Australian Bureau of Statistics 1700 1871 3571 45 1934 1592 85 1851 1635 173 184 1475 1739- ACCC 404 463 867 11 837 19 20 827 20 39 113 681 34- ASIC 735 1034 1769 10 876 883 2 1766 1 58 198 941 572- Australian Taxation Office 8580 11804 20384 336 14222 5826 633 13800 5951 1595 2215 9506 7068- Productivity Commission 86 86 172 1 167 4 2 162 8 14 24 129 5Veterans' Affairs 763 1243 2006 33 1637 336 43 1963 . 57 133 1205 611- Australian War Memorial 135 167 302 4 215 83 4 226 72 4 16 223 59
Total 63824 9194715577
1 4564 117834 33373 5510 101937 48324 8006 13499 94090 40176Source: APSED
126

Table 59: Ongoing employees: base classification by diversity group and sex, 30 June 2016
Indigenous Disability English Speaking Background
Classification Indigenous
Non-Indigenou
sNo data Disability No
Disability No data NESB 1 NESB 2 Eng. Spkng. No data
Men
Trainee 72 66 98 9 83 144 1 5 86 144Graduate 15 346 262 15 361 247 12 58 285 268APS 1 33 167 62 49 127 86 5 25 146 86APS 2 86 503 340 80 451 398 29 60 517 323APS 3 264 3458 1565 203 3019 2065 317 479 2854 1637APS 4 277 6414 1828 438 4915 3166 562 832 4862 2263APS 5 166 5666 2162 327 4816 2851 420 747 4798 2029APS 6 164 10051 3532 496 8805 4446 926 1289 8191 3341EL 1 129 9481 2508 352 8829 2937 758 988 7839 2533EL 2 42 4923 1206 174 4687 1310 263 373 4165 1370SES 1 11 912 130 31 883 139 14 39 771 229SES 2 1 281 37 10 261 48 3 14 228 74SES 3 . 63 8 . 58 13 . 2 51 18Total men 1260 42331 13738 2184 37295 17850 3310 4911 34793 14315
Women
Trainee 191 40 37 8 93 167 2 6 175 85Graduate 29 378 232 29 364 246 22 51 302 264APS 1 47 190 43 39 154 87 15 22 166 77APS 2 183 1022 538 91 945 707 80 120 968 575APS 3 557 7066 2190 278 6147 3388 544 1015 5436 2818APS 4 791 15824 3050 911 11771 6983 985 1924 12337 4419APS 5 357 9244 2312 436 8564 2913 653 1203 7603 2454APS 6 324 14330 3060 638 13102 3974 1003 1781 11702 3228EL 1 170 10536 1813 375 10100 2044 695 1103 8657 2064EL 2 54 4134 676 147 4059 658 162 364 3511 827SES 1 8 748 102 19 720 119 13 39 618 188SES 2 1 175 20 3 169 24 2 8 140 46SES 3 . 44 3 3 41 3 . 1 31 15Total women 2712 63731 14076 2977 56229 21313 4176 7637 51646 17060
Total
Trainee 263 106 135 17 176 311 3 11 261 229Graduate 44 724 494 44 725 493 34 109 587 532APS 1 80 357 105 88 281 173 20 47 312 163APS 2 269 1525 878 171 1396 1105 109 180 1485 898APS 3 821 10524 3755 481 9166 5453 861 1494 8290 4455APS 4 1068 22238 4878 1349 16686 10149 1547 2756 17199 6682APS 5 523 14910 4474 763 13380 5764 1073 1950 12401 4483APS 6 488 24381 6592 1134 21907 8420 1929 3070 19893 6569EL 1 299 20017 4321 727 18929 4981 1453 2091 16496 4597EL 2 96 9057 1882 321 8746 1968 425 737 7676 2197SES 1 19 1660 232 50 1603 258 27 78 1389 417SES 2 2 456 57 13 430 72 5 22 368 120
127

SES 3 . 107 11 3 99 16 . 3 82 33Total 3972 106062 27814 5161 93524 39163 7486 12548 86439 31375Source: APSEDTable 60: Ongoing employees: diversity group by highest educational qualification and sex, 30 June 2016
Indigenous Disability English Speaking Background
Highest educational qualification Indigenous Non-Indigenous No data Disability No
Disability No data NESB 1 NESB 2 Eng. Spkng. No data
Men
Doctorate 9 1221 280 44 1110 356 257 145 809 299Masters 28 3740 655 157 3453 813 712 561 2466 684Postgraduate diploma 28 2615 333 139 2430 407 251 283 2033 409Bachelor degree 142 10346 1936 407 9388 2629 821 1365 8144 2094Undergraduate diploma 20 704 106 45 651 134 54 90 536 150Associate diploma 87 2471 507 202 2064 799 115 261 2174 515Skilled vocational qualification 54 892 220 86 783 297 35 90 877 164Basic vocational qualification 8 255 50 19 220 74 10 25 237 41Year 12 117 3549 361 208 3295 524 64 321 2930 712Year 11 9 396 56 27 358 76 10 35 301 115Year 10 46 689 125 86 596 178 8 36 616 200Less than year 10 5 54 9 8 43 17 . 3 50 15No data 707 15399 9100 756 12904 11546 973 1696 13620 8917Total men 1260 42331 13738 2184 37295 17850 3310 4911 34793 14315
Women
Doctorate 2 749 78 33 693 103 115 70 524 120Masters 44 3709 479 122 3511 599 696 503 2502 531Postgraduate diploma 54 3530 330 187 3294 433 252 400 2799 463Bachelor degree 230 13404 1714 530 12256 2562 1052 2005 10205 2086Undergraduate diploma 38 872 96 39 846 121 64 103 708 131Associate diploma 232 4390 496 318 3506 1294 191 467 3797 663Skilled vocational qualification 106 1537 179 117 1336 369 57 132 1460 173Basic vocational qualification 36 706 94 35 668 133 17 74 663 82Year 12 209 5164 405 232 4918 628 127 559 4365 727Year 11 53 817 59 47 799 83 20 92 671 146Year 10 126 1996 220 144 1892 306 34 150 1722 436Less than year 10 20 145 19 11 148 25 2 15 125 42No data 1562 26712 9907 1162 22362 14657 1549 3067 22105 11460Total women 2712 63731 14076 2977 56229 21313 4176 7637 51646 17060
Total
Doctorate 11 1970 358 77 1803 459 372 215 1333 419Masters 72 7449 1134 279 6964 1412 1408 1064 4968 1215Postgraduate diploma 82 6145 663 326 5724 840 503 683 4832 872Bachelor degree 372 23750 3650 937 21644 5191 1873 3370 18349 4180Undergraduate diploma 58 1576 202 84 1497 255 118 193 1244 281Associate diploma 319 6861 1003 520 5570 2093 306 728 5971 1178Skilled vocational qualification 160 2429 399 203 2119 666 92 222 2337 337Basic vocational qualification 44 961 144 54 888 207 27 99 900 123Year 12 326 8713 766 440 8213 1152 191 880 7295 1439
128

Year 11 62 1213 115 74 1157 159 30 127 972 261Year 10 172 2685 345 230 2488 484 42 186 2338 636Less than year 10 25 199 28 19 191 42 2 18 175 57No data 2269 42111 19007 1918 35266 26203 2522 4763 35725 20377Total 3972 106062 27814 5161 93524 39163 7486 12548 86439 31375Source: APSED
129

Table 61: Engagements of ongoing employees: classification by diversity group and sex, 2015-16
Indigenous Disability English Speaking Background
Classification Indigenous Non-Indigenous No data Disability No
Disability No data NESB 1 NESB 2 Eng. Spkng. No data
Men
Trainee 61 57 127 6 71 168 1 4 76 164Graduate 9 309 220 14 293 231 11 48 241 238APS 1 2 12 10 . 17 7 . 2 7 15APS 2 33 63 95 8 93 90 1 7 76 107APS 3 48 616 315 22 276 681 33 51 325 570APS 4 8 396 194 14 299 285 26 40 284 248APS 5 9 383 144 18 300 218 36 56 256 188APS 6 6 392 174 12 399 161 31 36 311 194EL 1 8 271 111 7 286 97 21 23 213 133EL 2 . 110 81 3 112 76 2 9 96 84SES 1 1 36 39 1 36 39 . . 16 60SES 2 . 14 8 1 12 9 . . 5 17SES 3 . 4 4 . 3 5 . . 3 5Total men 185 2663 1522 106 2197 2067 162 276 1909 2023
Women
Trainee 182 34 54 8 85 177 1 4 165 100Graduate 20 356 220 25 325 246 20 45 283 248APS 1 2 18 9 1 23 5 . 1 8 20APS 2 56 166 127 8 212 129 12 18 168 151APS 3 94 1346 328 31 539 1198 39 109 687 933APS 4 20 1014 417 32 795 624 41 110 738 562APS 5 10 503 262 11 478 286 40 57 373 305APS 6 13 499 231 21 519 203 37 49 406 251EL 1 3 266 121 1 276 113 9 29 214 138EL 2 3 94 73 4 99 67 6 7 85 72SES 1 1 34 46 . 34 47 1 3 15 62SES 2 . 7 5 2 5 5 . . 4 8SES 3 . 1 . . 1 . . . . 1Total women 404 4338 1893 144 3391 3100 206 432 3146 2851
Total
Trainee 243 91 181 14 156 345 2 8 241 264Graduate 29 665 440 39 618 477 31 93 524 486APS 1 4 30 19 1 40 12 . 3 15 35APS 2 89 229 222 16 305 219 13 25 244 258APS 3 142 1962 643 53 815 1879 72 160 1012 1503APS 4 28 1410 611 46 1094 909 67 150 1022 810APS 5 19 886 406 29 778 504 76 113 629 493APS 6 19 891 405 33 918 364 68 85 717 445EL 1 11 537 232 8 562 210 30 52 427 271EL 2 3 204 154 7 211 143 8 16 181 156SES 1 2 70 85 1 70 86 1 3 31 122SES 2 . 21 13 3 17 14 . . 9 25
130

SES 3 . 5 4 . 4 5 . . 3 6Total 589 7001 3415 250 5588 5167 368 708 5055 4874Source: APSEDTable 62: Separations of ongoing employees: base classification by diversity group and sex, 2015-16
Indigenous Disability English Speaking Background
Classification Indigenous Non-Indigenous No data Disability No
Disability No data NESB 1 NESB 2 Eng. Spkng. No data
Men
Trainee 11 10 6 . 12 15 . 1 15 11Graduate . 14 10 2 14 8 . 3 9 12APS 1 1 12 3 4 6 6 . 1 9 6APS 2 15 44 37 8 50 38 5 5 61 25APS 3 35 215 85 17 186 132 15 24 175 121APS 4 24 363 121 34 304 170 29 49 287 143APS 5 17 420 171 27 375 206 24 56 375 153APS 6 7 667 199 49 577 247 52 77 530 214EL 1 10 1011 272 68 871 354 48 103 856 286EL 2 7 522 123 25 494 133 16 39 455 142SES 1 1 87 11 2 77 20 4 4 62 29SES 2 . 48 3 2 46 3 1 . 44 6SES 3 . 6 2 2 6 . . 1 6 1Total men 128 3419 1043 240 3018 1332 194 363 2884 1149
Women
Trainee 19 7 3 2 8 19 . 1 15 13Graduate 1 9 8 . 12 6 1 3 10 4APS 1 14 21 8 6 27 10 2 1 29 11APS 2 29 98 56 13 98 72 5 10 107 61APS 3 60 494 100 26 412 216 28 54 391 181APS 4 48 804 191 60 666 317 42 95 654 252APS 5 28 520 127 46 477 152 28 56 455 136APS 6 17 822 182 50 771 200 51 75 695 200EL 1 10 813 153 50 750 176 34 75 691 176EL 2 6 344 74 23 330 71 14 19 299 92SES 1 2 64 11 4 61 12 3 9 48 17SES 2 . 15 5 1 15 4 . 1 12 7SES 3 . 5 1 . 6 . . . 4 2Total women 234 4016 919 281 3633 1255 208 399 3410 1152
Total
Trainee 30 17 9 2 20 34 . 2 30 24Graduate 1 23 18 2 26 14 1 6 19 16APS 1 15 33 11 10 33 16 2 2 38 17APS 2 44 142 93 21 148 110 10 15 168 86APS 3 95 709 185 43 598 348 43 78 566 302APS 4 72 1167 312 94 970 487 71 144 941 395APS 5 45 940 298 73 852 358 52 112 830 289APS 6 24 1489 381 99 1348 447 103 152 1225 414EL 1 20 1824 425 118 1621 530 82 178 1547 462
131

EL 2 13 866 197 48 824 204 30 58 754 234SES 1 3 151 22 6 138 32 7 13 110 46SES 2 . 63 8 3 61 7 1 1 56 13SES 3 . 11 3 2 12 . . 1 10 3Total 362 7435 1962 521 6651 2587 402 762 6294 2301Source: APSED
132

Appendix 1: Explanatory notes
Agencies The organisations separately identified in this publication are based on the publication APS Agencies, which is available on the Commission’s website at http://www.apsc.gov.au/publications-and-media/current-publications/australian-public-service-agencies. Some agencies due to their small size are not separately identified in the tables. A list of these agencies is in Appendix 5.
Calculation of yearly APS changeFrom time to time, the number of employees covered by the PS Act is affected by changes in administrative arrangements when agencies move into or out of coverage of the PS Act. It is necessary to adjust for changes in coverage when comparing the data with previous years’ data and calculating changes for the APS. Refer to Appendix 3 for the number of employees who moved into or out of coverage of the PS Act over the past 15 years, and Appendix 4 for the number of employees affected by machinery of government changes.
ClassificationThe classifications used in this Bulletin are those classifications listed in the Public Service Classification Rules 2000 (the Classification Rules).
Data in this Bulletin generally refers to the base (substantive) classification, except those tables where temporary assignment or
paid classification is used. See Section 3: Ongoing employees for more information on temporary assignment.
133

SES includes Senior Executive Service (SES) Bands 1, 2 and 3 and SES Specialist Bands 1, 2 and 3. It also includes employees grouped with the equivalent SES Bands under the Classification Rules.
EL classifications include Executive Levels 1 and 2. It also includes employees grouped with the equivalent Executive Levels under the Classification Rules such as Medical Officers.
APS classifications include employees at the APS 1 to 6 levels. It also includes employees grouped with the equivalent APS levels under the Classification Rules.
Trainee includes cadets, trainees and apprentices (but not Graduate APS, even though this is a training classification under the Classification Rules).
Graduate refers only to those employees in a specific graduate program.
EngagementAn engagement refers to the engagement or re-engagement of employees under s. 22 of the PS Act. Employees of agencies moving into coverage of the PS Act under s. 72 are counted as engagements.
Exit rateIs calculated as the number of separations from an agency (i.e. employees leaving the APS) plus the number of transfers and promotions out of the agency during the reporting period, divided
by the average number of employees at the beginning and end of the reporting period. It refers to ongoing employees only.
134

Full-time/Part-timeThe full-time and part-time employment status categories used in this publication refer to the number of hours worked. Full-time employees are defined as those who ordinarily work 35 hours or more per week. Employees working fewer than 35 hours per week are defined as working part-time. This definition is based on that used by the Australian Bureau of Statistics in their Australian Labour Market Statistics publication (catalogue no. 6105.0).
Highest educational qualification Data reported in this Bulletin is the highest qualification that the employee has reported to their agency. The full list of qualification categories is shown in the APS Employment Database Manual (Version 4.2), available on the Commission’s website at http://www.apsc.gov.au/about-the-apsc/commission-services/apsed.
Length of serviceLength of service is based on an employee’s combined periods of service. Where possible, an individual’s separate periods of services have been linked by matching date of birth, sex, first name (first four letters) and surname. The length of these periods of service is combined. For example, an individual who had five years of service, left the APS for two years and then returned for seven years would have a total length of service of 12 years. Previously, this individual would have been recorded as having seven years of service if they had changed Australian Government Staff Number (AGSN). Using this method it is possible to determine an individual’s prior service in the APS (as shown in Table 34).
Non-ongoing service is included in this calculation only where the service is on APSED; the collection of data for non-ongoing
employees on APSED commenced in July 1999. Service in an agency is only included in the period that the agency was covered under the PS Act or the Public Service Act 1922 (the PS Act 1922). When an agency moves out of coverage of either of these Acts, accumulation of service ceases until the individual re-joins the APS. See Appendix 3 for PS Act coverage changes.
Maternity-related leaveMaternity related leave should not be confused with leave under the provisions of the Maternity Leave (Commonwealth Employees) Act 1973. APSED measures the amount of time spent away from work due to having a baby. It records the date the employee commences leave and the date the employee returns to work, irrespective of the type of leave taken during this period. For further details see the APS Employment Database Manual (Version 4.2) available on the Commission’s website at http://www.apsc.gov.au/about-the-apsc/commission-services/apsed.
Mobility rateIs calculated as the number of transfers and promotions (s. 26 of the PS Act) between APS agencies over a financial year, divided by the average number of ongoing employees over that period.
NESBIn the absence of alternative measures, the concept ‘NESB’, representing people from a non-English speaking background, is used with APSED. This captures information about first language spoken, place of birth and parents’ language. NESB 1 refers to people born overseas who arrived in Australia after the age of five and whose first language was not English. NESB 2 refers to children of migrants including:
135

those who were born overseas and arrived in Australia when they were aged five or younger but did not speak English as a first language;
those who were Australian born but did not speak English as a first language and had at least one parent who did not speak English as a first language;
those who spoke English as a first language and had neither parent speaking English as a first language.
Number of agencies worked inNumber of agencies worked in is based on an employee’s combined periods of service. Non-ongoing experience is not included. Movements due to machinery of government changes are not counted.
Ongoing/Non-ongoing‘Ongoing’ refers to the employment of an APS employee as mentioned ins. 22(2)(a) of the PS Act. The employee is referred to as an ongoing employee. ‘Non-ongoing’ is a generic term which refers to the engagement of APS employees for either a specified term or for the duration of a specified task or for duties that are irregular or intermittent as mentioned in ss. 22(2)(b) and (c) of the PS Act. A person engaged on a non-ongoing basis is referred to as a non-ongoing employee.
Operative/Inoperative statusEmployees who are inoperative are those on mandatory or discretionary leave without pay, or compensation leave. Maternity leave is not included. For further details see the APS Employment Database Manual (Version 4.2) available on the Commission’s website at http://www.apsc.gov.au/about-the-apsc/commission-services/apsed.
PromotionsPromotions are ongoing assignments to a higher APS classification level, either within or between APS agencies. Promotions do not include advancements within a broadband to a higher classification level.
Retention rateIs calculated as the number of individual ongoing employees who are employed both at the beginning and end of the reporting period, divided by the number of employees at the start of the reporting period.
SeparationA separation occurs when an employee ceases to be employed under the PS Act. It does not refer to employees moving from one APS agency to another. The terms used in this Bulletin are:
136

Resignation Age retirement (s. 30 of the PS Act) , which includes:
- resignations at age 55 and above Retrenchment, which includes:
- employee excess to the requirements of the agency (s. 29(3)(a))
- SES incentive to retire (s. 37) Physical or mental incapacity (s. 29(3)(d)) Terminations of employment, which includes:
- inappropriately qualified (s. 29(3)(b))- underperformance (s. 29(3)(c))- non-completion of entry level training (s. 29(3)(e))- breach of engagement condition (s. 29(3)(f))- misconduct (s. 29(3)(g))
Compulsory move to non-APS agency by determination made by the Public Service Commissioner under s. 72(1)(b)
Deceased
Separation rateIs calculated as the number of ongoing separations from the APS over a reporting period, divided by the average number of ongoing employees over that period.
Symbols and other initials. zero value
(NC) Not Current—agency is no longer under coverage of the PS Act, or its functions were part of another agency, at the date of effect
Transfers For the purpose of the Bulletin reporting, transfers are ongoing movements between agencies, either at the same classification level or to a lower classification level.
137

138

Appendix 2: Agency abbreviations
ACCC Australian Competition and Consumer Commission
ACIAR Australian Centre for International Agricultural Research
ACLEI Australian Commission for Law Enforcement Integrity
ACMA Australian Communications and Media Authority
ACSQHC Australian Commission on Safety and Quality in Heath Care
AIATSIS Australian Institute of Aboriginal and Torres StraitIslanders Studies
ANAO Australian National Audit Office
APVMA Australian Pesticides and Veterinary Medicines Authority
ARPANSA Australian Radiation Protection and Nuclear Safety Agency
ASIC Australian Securities and Investments Commission
AUSTRAC Australian Transaction Reports and Analysis Centre
AUSTRADE Australian Trade Commission
Commonwealth DPP Commonwealth Director of Public Prosecutions
FSANZ Food Standards Australia New Zealand
GBRMPA Great Barrier Reef Marine Park Authority
MRT-RRT Migration Review Tribunal and Refugee Review Tribunal
NHMRC National Health and Medical Research Council
NICNAS National Industrial Chemicals Notification and Assessment Scheme
NOPSEMA National Offshore Petroleum Safety and Environmental Management Authority
OAIC Office of the Australian Information Commissioner
OFWBII Office of the Fair Work Building Industry Inspectorate
OGTR Office of the Gene Technology Regulator
OIGIS Office of the Inspector-General of Intelligence and Security
PHIO Private Health Insurance Ombusman
TEQSA Tertiary Education Quality Standards Agency
TUSMA Telecommunications Universal Service Management Agency
139

140

Appendix 3: Public Service Act coverage changes
Additions Reductions
Ongoing Non-ongoing Total Ongoing Non-ongoing Total
2001-02 0 0 0 1 0 1
2002-03 37 2 39 0 0 0
2003-04 231 0 231 1 0 1
2004-05 121 5 126 1361 101 1462
2005-06 5081 259 5340 0 0 0
2006-07 492 56 548 3 1 4
2007-08 150 400 550 0 2 2
2008-09 359 65 424 0 464 464
2009-10 21 0 21 0 0 0
2010-11 214 41 255 0 0 0
2011-12 212 32 244 4 0 4
2012-13 12 0 12 0 0 0
2013-14 222 2 224 2 0 2
2014-15 40 0 40 0 0 0
2015-16 727 50 777 299 87 386
Total 7919 912 8831 1671 655 2326
Additions of employees to the APS in 2015-16 Ongoing Non-ongoing Total
Australian Government Solicitor to Attorney-General’s Department 647 49 696
NSW and QLD State Government to the National Disability Insurance Agency 80 1 81
Total additions to coverage July 2015 to June 2016 727 50 777
Reduction of employees in the APS in 2015-16 Ongoing Non-ongoing Total
ComSuper to the Commonwealth Superannuation Corporation 299 87 386
Total reductions to coverage July 2015 to June 2016 299 87 386
141

Appendix 4: Machinery of Government changes
The following table shows machinery of government changes that occurred during 2015–16. This table should be referred to when comparing agency numbers from one year to another.
Date Agency moved from Agency moved to Ongoing employees
Non-ongoing employees Change
1/07/2015 Customs & Border Protection (NC) Immigration and Border Protection 5121 187 Customs and Border Protection merged into Department of Immigration
1/07/2015 Social Services Administrative Appeals Tribunal 71 14 Commonwealth merits review tribunals amalgamated
1/07/2015 MRT - RRT (NC) Administrative Appeals Tribunal 289 11 Commonwealth merits review tribunals amalgamated
1/07/2015 Private Health Insurance Ombudsman (NC) Commonwealth Ombudsman 12 . Private Health Insurance Ombudsman merged into the Commonwealth Ombudsman
1/07/2015 TUSMA (NC) Communications and the Arts 11 3 TUSMA merged into Department of Communications
8/10/2015 Australian Institute of Criminology (NC) Australian Crime Commission 25 15 Australian Institute of Criminology merged into Australian Crime Commission
22/10/2015 Finance Prime Minister and Cabinet 2 1 Gov 2.0 and related matters
22/10/2015 Finance Digital Transformation Office 11 . Phase 1 of establishment of Digital Transformation Office as an executive agency
22/10/2015 Attorney-General's Communications and the Arts 169 16 Classification, copyright, cultural affairs and support for the arts
22/10/2015 Environment Agriculture and Water Resources 137 12 Water policy and resources
22/10/2015 Industry, Innovation and Science Environment 48 1 Renewable energy technology development – Australian Renewable Energy Agency
22/10/2015 Communications and the Arts Prime Minister and Cabinet 15 1 Whole of government service delivery policy. Public data policy.
22/10/2015 Communications and the Arts Industry, Innovation and Science 20 . National policy issues related to the digital economy
23/10/2015 Infrastructure and Regional Development Industry, Innovation and Science 8 . Northern Australia policy and coordination
5/11/2015 Finance Digital Transformation Office 4 . Phase 2 of establishment of Digital Transformation Office as an executive agency
5/11/2015 Attorney-General's Communications and the Arts 17 . Corporate staff associated with the move on 22/10/15
5/11/2015 Environment Agriculture and Water Resources 12 . Corporate staff associated with the move on 22/10/15
5/11/2015 Social Services Health 919 100 Services for older people. Policy for and promotion of active ageing, other than employment policy.
5/11/2015 Social Services Education and Training 381 14 Childcare policy and programs. Coordination of early childhood development policy and responsibilities.
5/11/2015 Human Services Health 355 4 Medicare Provider compliance
10/03/2016 Environment Prime Minister and Cabinet 3 . Cities and built environment functions
142

Appendix 5: Organisations not separately identified in tables
Employees of indented organisations are included in the employment numbers of their portfolio Department in the tables of this Bulletin.
Attorney-General’s
Australian Government Solicitor
Environment
Australian Antarctic Division
Health
Therapeutic Goods Administration
OGTR & NICNAS
Industry
Geoscience Australia
IP Australia
Questacon—National Science and Technology Centre
Treasury
Australian Office of Financial Management
Commonwealth Grants Commission
Office of the Inspector-General of Taxation
Royal Australian Mint
143

144

145