apsimoryza - icrisat
TRANSCRIPT

APSIM-‐ORYZA
CSIRO SUSTAINABLE AGRICULTURE FLAGSHIP
Perry Poulton John Hargreaves
18 March 2013
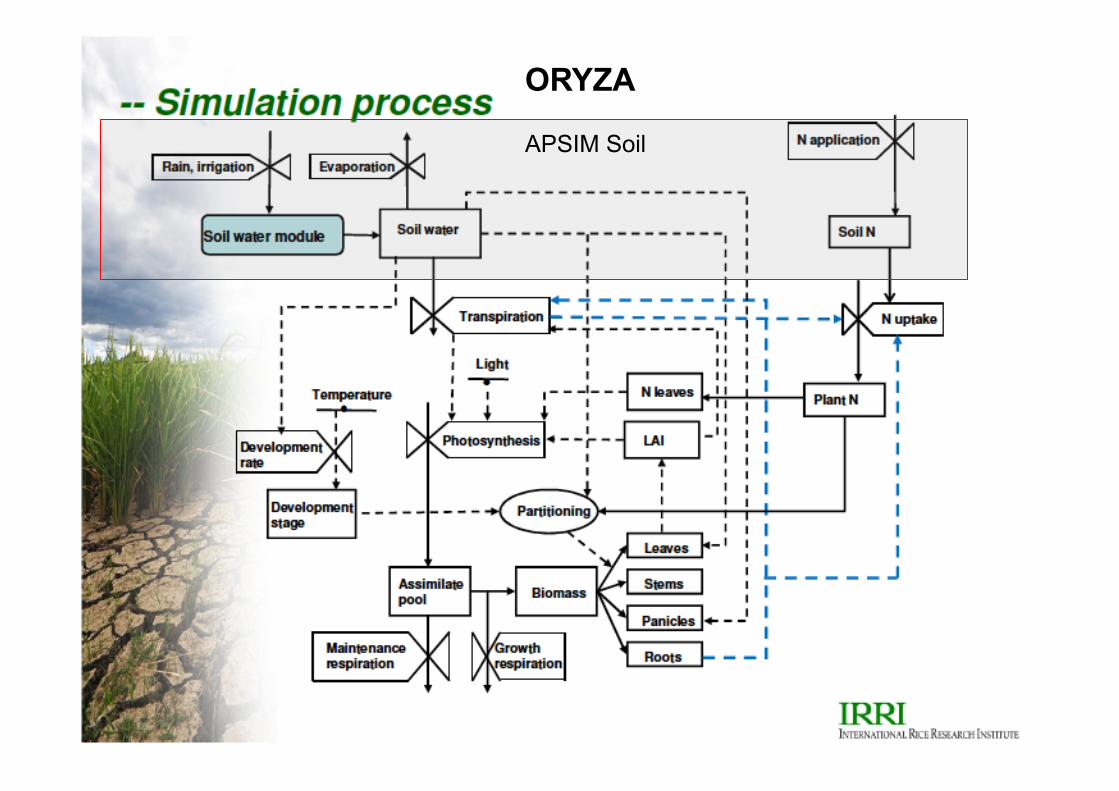
APSIM Soil
ORYZA

Crop growth and development
ORYZA follows a daily calculation scheme for the rate of dry matter production of the plant organs and for the rate of phenological development. (Bouman and Laar, 2006)
Gross daily growth rate: Gp = (Ad × (30/44) – Rm f (CO2 Assimilation - respiration + retranslocation from reserve) Ad is the daily rate of gross CO2 assimilation) Rm is the maintenance respiration) Rt is the amount of available stem reserves for growth Q is the assimilate requirement for dry matter

CO2 assimilation is calculated from daily incoming radiation, temperature, and leaf area index (LAI).
(Bouman and Laar, 2006)

Response to increased CO2 concentration (Bouman and Laar, 2006)

Response to temperature and nitrogen (Bouman and Laar, 2006)

f (temperature and biomass)
f (biomass growth)
Maintenance respiration requirements are subtracted from the gross assimilation rate to obtain net daily growth
(Bouman and Laar, 2006)
Carbohydrates is partitioned to roots, leaves, stems, and panicles as a function of development stage

<!-- Table of fraction total dry matter partitioned to the shoot as a function of development stage (-; X value): --> <FSHT>0.00 0.43 1.00 2.50 </FSHT> <FSH>0.50 0.80 1.00 1.00 </FSH> <!-- Table of fraction shoot dry matter partitioned to the leaves as a function of development stage (-; X value): --> <FLVT>0.00 0.50 0.75 1.00 1.20 2.50 </FLVT> <FLV>0.50 0.50 0.34 0.00 0.00 0.00 </FLV> <!-- Table of fraction shoot dry matter partitioned to the stems as a function of development stage (-; X value): --> <FSTT>0.00 0.50 0.75 1.00 1.01 1.20 2.50 </FSTT> <FST>0.40 0.40 0.35 0.35 0.00 0.00 0.00 </FST> <!-- Table of fraction shoot dry matter partitioned to the panicles as a function of development stage (-; X value): --> <FSOT>0.00 0.50 0.75 1.00 1.20 2.50 </FSOT> <FSO>0.00 0.00 0.00 0.20 1.00 1.00 </FSO>
APSIM-ORYZA: Oryza.xml • Allocation of assimilate to roots leaf stem panicle

Consider data requirements…..
!
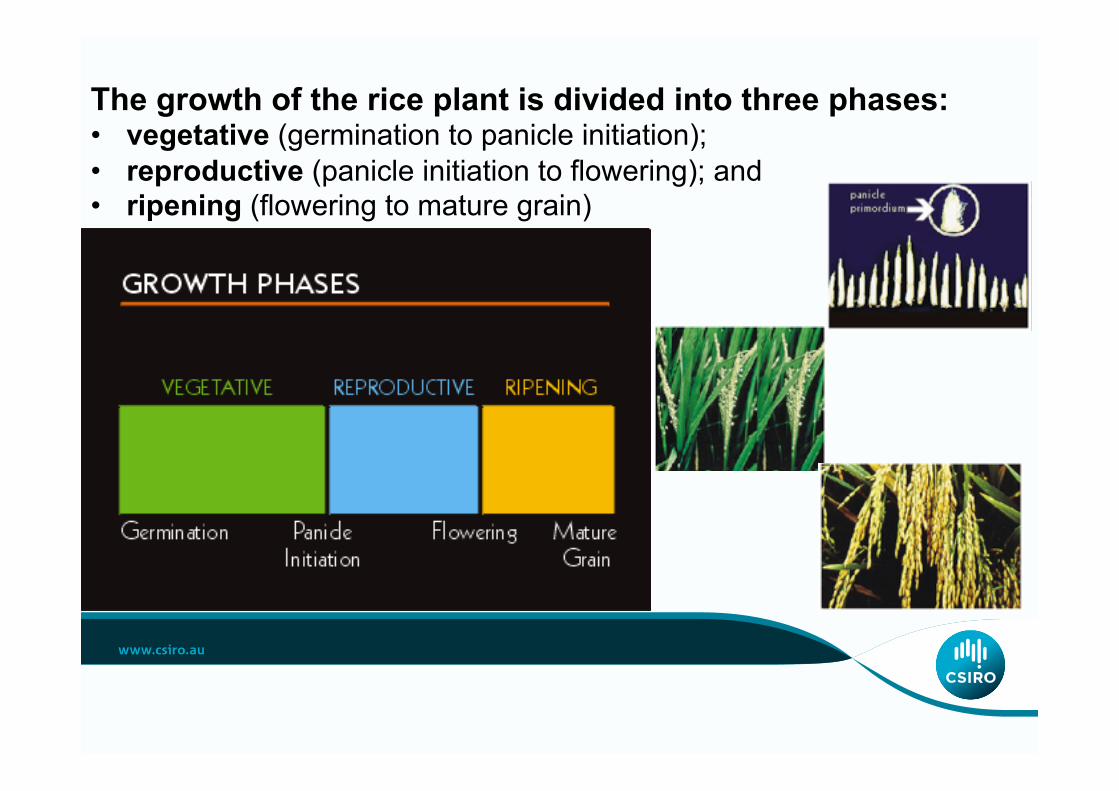
The growth of the rice plant is divided into three phases: • vegetative (germination to panicle initiation); • reproductive (panicle initiation to flowering); and • ripening (flowering to mature grain)

Tbase = 8 °C, Topt = 30 °C, and Thigh = 42.5 °C.

<IR58 cultivar="yes"> <DVRJ description="Development rate in juvenile phase (oCd-1)">.000873 </DVRJ> <DVRI description="Development rate in photoperiod-sensitive phase (oCd-1)">.000738 </DVRI> <DVRP description="Development rate in panicle development (oCd-1)">.000710 </DVRP> <DVRR description="Development rate in reproductive phase (oCd-1)">.001765 </DVRR> <MOPP description="Maximum optimum photoperiod (h)">11.50 </MOPP> <PPSE description="Photoperiod sensitivity (h-1)">0.0 </PPSE> </IR58> <cigeulis cultivar="yes"> <DVRJ description="Development rate in juvenile phase (oCd-1)">.000600 </DVRJ> <DVRI description="Development rate in photoperiod-sensitive phase (oCd-1)">.000570 </DVRI> <DVRP description="Development rate in panicle development (oCd-1)">.000884 </DVRP> <DVRR description="Development rate in reproductive phase (oCd-1)">.001580 </DVRR> <MOPP description="Maximum optimum photoperiod (h)">11.50 </MOPP> <PPSE description="Photoperiod sensitivity (h-1)">0.0 </PPSE> </cigeulis>
APSIM-ORYZA: Oryza.xml • Phenology parameters

0
0.5
1
1.5
2
2.5
0 20 40 60 80 100 120
Phe
nolo
gica
l sta
ge ()
Days after sowing (days)
Observed Phenological stage Predicted phenological stages
Fl#PI#
PM#b.#
Observed and predicted phenological stages in development stage units (DVS) for panicle initiation (PI), flowering (Fl) and physiological maturity (PM) for variety, Sen Pidao (110 days).
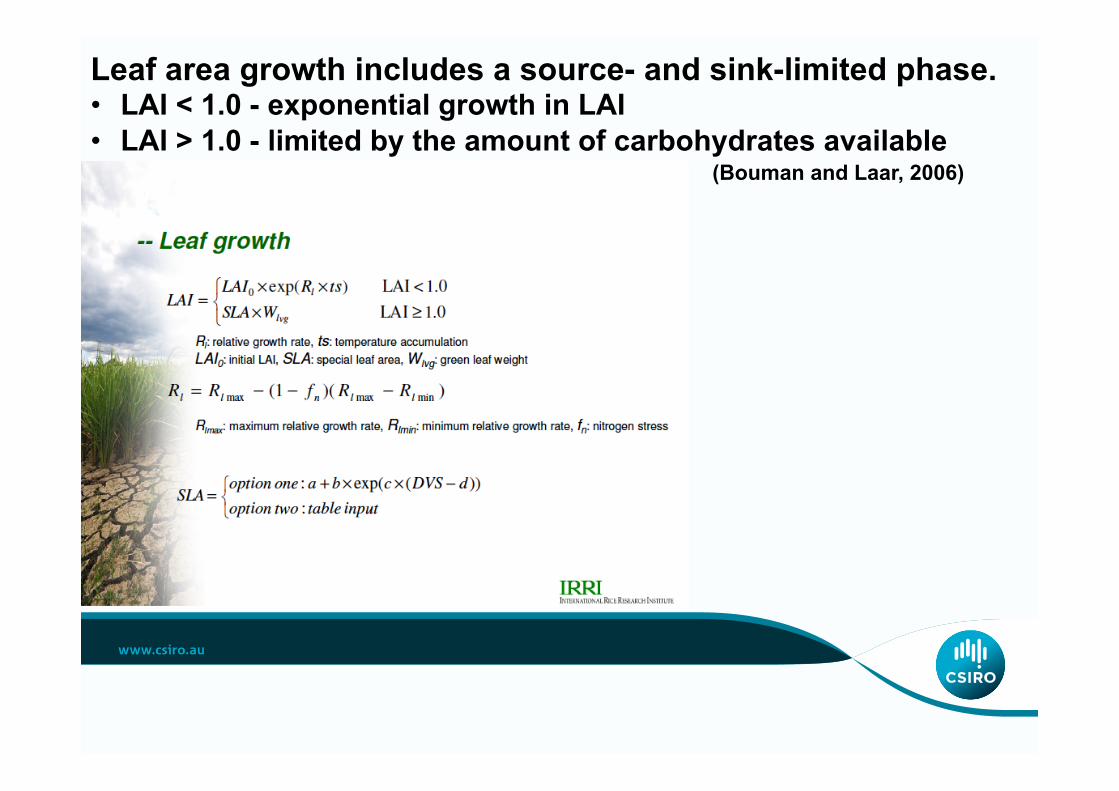
Leaf area growth includes a source- and sink-limited phase. • LAI < 1.0 - exponential growth in LAI • LAI > 1.0 - limited by the amount of carbohydrates available
(Bouman and Laar, 2006)

At transplanting: • LAI and all biomass values are reset based on the plant density after
transplanting relative to the plant density in the seedbed.
• Crop growth resumes only after a ‘‘transplanting shock’’ has elapsed.
(Bouman and Laar, 2006)
The transplanted seedlings need/require about 9 days to recover from the shock of uprooting during transplanting after which new roots appear.
Transplant shock

APSIM-Pond simulates anaerobic and flooded systems
Bulk of soil becomes anaerobic
-Different soil organisms dominate in anaerobic conditions
-Methane produced as a product of ammonification
Slow decomposition of crop residues and organic
materials
Denitrification will see disappearance of NO3 in saturated profile, and
nitrification stops
Volatilisation of Ammonia
N fertiliser broadcast into floodwater, not
onto soil
Diffusion & mass flow determine the flow of nutrients between pond and soil
Growth of algae and photosynthetic aquatic
biomass
Aerobic Floodwater
Anaerobic soil layers
Aerobic soil layer Bulk of soil becomes
anaerobic
-Different soil organisms dominate in anaerobic conditions
-Methane produced as a product of ammonification
Slow decomposition of crop residues and organic
materials
Denitrification will see disappearance of NO3 in saturated profile, and
nitrification stops
Volatilisation of Ammonia
N fertiliser broadcast into floodwater, not
onto soil
Diffusion & mass flow determine the flow of nutrients between pond and soil
Growth of algae and photosynthetic aquatic
biomass
Aerobic Floodwater
Anaerobic soil layers
Aerobic soil layer
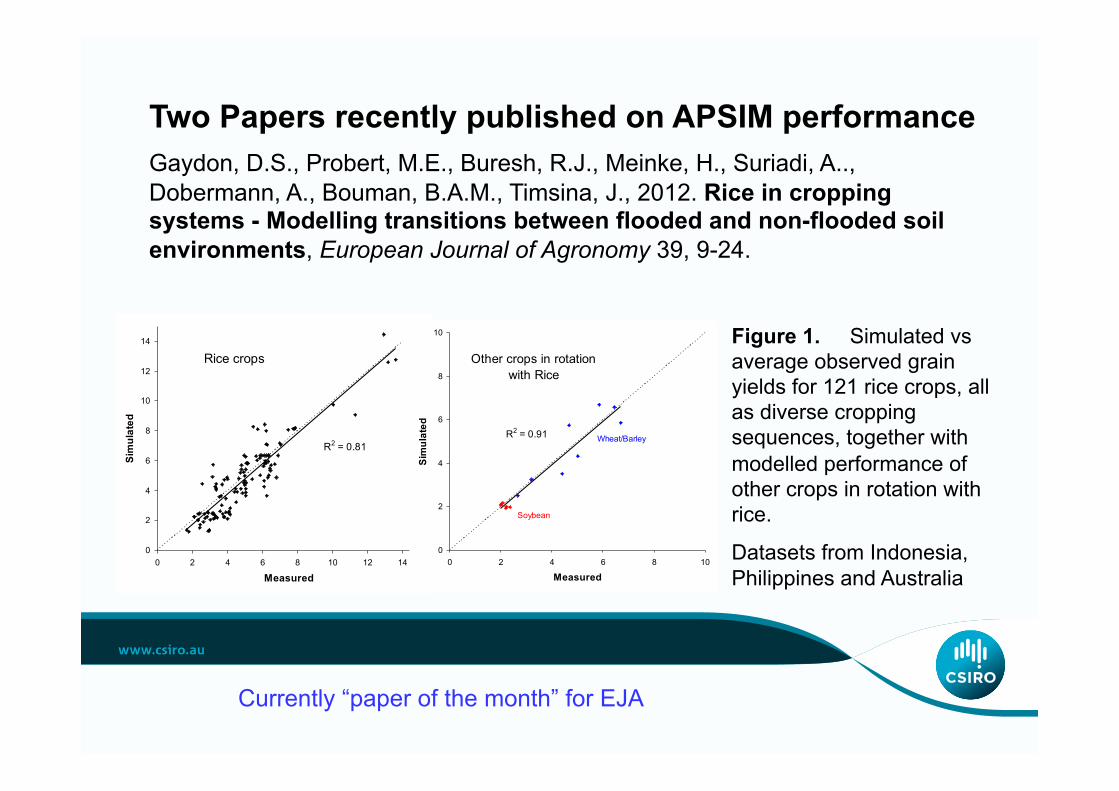
Two Papers recently published on APSIM performance Gaydon, D.S., Probert, M.E., Buresh, R.J., Meinke, H., Suriadi, A.., Dobermann, A., Bouman, B.A.M., Timsina, J., 2012. Rice in cropping systems - Modelling transitions between flooded and non-flooded soil environments, European Journal of Agronomy 39, 9-24.
R2 = 0.81
0
2
4
6
8
10
12
14
0 2 4 6 8 10 12 14
Measured
Simulated
Rice crops
R2 = 0.91
0
2
4
6
8
10
0 2 4 6 8 10
Measured
Simulated
Other crops in rotation with Rice
Soybean
Wheat/Barley R2 = 0.81
0
2
4
6
8
10
12
14
0 2 4 6 8 10 12 14
Measured
Simulated
Rice crops
R2 = 0.91
0
2
4
6
8
10
0 2 4 6 8 10
Measured
Simulated
Other crops in rotation with Rice
Soybean
Wheat/Barley
Figure 1. Simulated vs average observed grain yields for 121 rice crops, all as diverse cropping sequences, together with modelled performance of other crops in rotation with rice.
Datasets from Indonesia, Philippines and Australia
Currently “paper of the month” for EJA
Two Papers
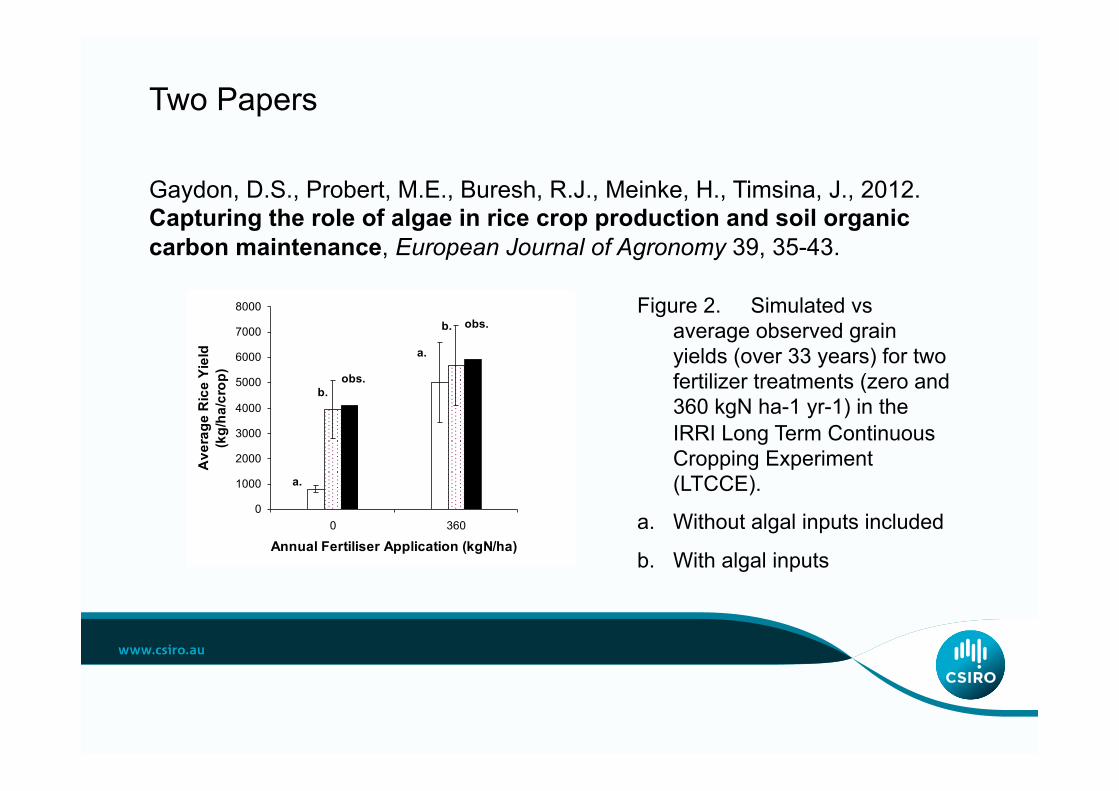
Gaydon, D.S., Probert, M.E., Buresh, R.J., Meinke, H., Timsina, J., 2012. Capturing the role of algae in rice crop production and soil organic carbon maintenance, European Journal of Agronomy 39, 35-43.
0
1000
2000
3000
4000
5000
6000
7000
8000
0 360
Annual Fertiliser Application (kgN/ha)
Ave
rage
Ric
e Yi
eld
(kg/
ha/c
rop)
a.
a.
b.
b.
obs.
obs.Figure 2. Simulated vs
average observed grain yields (over 33 years) for two fertilizer treatments (zero and 360 kgN ha-1 yr-1) in the IRRI Long Term Continuous Cropping Experiment (LTCCE).
a. Without algal inputs included
b. With algal inputs

Consider the key features of an agricultural production system……
Establishment
Leaf area / biomass production
Harvest
Residue
Root growth
Flowering/grain production
Climate Transpiration
Soil water & solutes
Redistribution
Soil Organic Matter / Nutrients
Leaching
Management
Evaporation Runoff/ Erosion
Decomposition/ Incorporation
Water uptake
Nutrient uptake
Manure
Livestock
Drainage
Drainage

APSIM structure……
APSIM – Plug-in / Pull-out modularity
Clock
Report
Met
Manager
field1 Soilwat
SoilN
Residue
ORYZA
field2 Soilwat
SoilN
Residue
Wheat
farm
Now Multi-point Water Supply Water Supply

• Native pasture (GRASP) • Navybean • Rice (ORYZA)A
• Cotton (OZCOT)B
• Peanut • PigeonpeaC
• Sorghum • Soybean • Stylo pasture • Sugarcane • Sunflower • Weed • Wheat • Hemp
• Barley • Bambatsi • Canola • Chickpea • Cowpea • E. GrandisD
• Faba bean • Fieldpea • Grape (VineLogic) B
• Lablab • Lucerne • Lupin • Maize • MilletC • Mucuna • Mungbean
Ain association with Uni. Wageningen & IRRI B by arrangement with CSIRO Plant Industry C in association with ICRISAT D In association with CSIRO L&W
• Mucuna • Navybean
Crop, pasture and tree modules