aquabest 24 2014 report
TRANSCRIPT

8/10/2019 Aquabest 24 2014 Report
http://slidepdf.com/reader/full/aquabest-24-2014-report 1/23
Economic feasibility tool forfish farming – case study onthe Danish model fish farm in
Finnish production environ-ment
Markus Kankainen, Peder Nielsen, Jouni Vielma
8/10/2019 Aquabest 24 2014 Report
http://slidepdf.com/reader/full/aquabest-24-2014-report 2/23
Finnish Game and Fisheries Research Institute, Helsinki
2014
ISBN 978-952-303-121-0

8/10/2019 Aquabest 24 2014 Report
http://slidepdf.com/reader/full/aquabest-24-2014-report 3/23
Reports of Aquabest projects 24 / 2014
Economic feasibility tool forfish farming – case study onthe Danish model fish farm inFinnish production environ-
ment
Markus Kankainen, Peder Nielsen, Jouni Vielma

8/10/2019 Aquabest 24 2014 Report
http://slidepdf.com/reader/full/aquabest-24-2014-report 4/23
Description
AuthorsMarkus Kankainen, Peder Nielsen and Jouni Vielma
Title
Economic feasibility tool for fish farming – case study on the Danish model fish farm in Finnish production envi-ronment
Year
2014Pages
23ISBN
978-952-303-121-0
Abstract
This report introduces the use of the Excel tool published by Aquabest-project for evaluating economic feasibility of fish farm-
ing. The present report is a case study on profitability and production costs of using the Danish model fish farm concept in the
Finnish production environment (including market, cost structure, climate). For such conditions, an isolated building is needed
for temperature control, but we also calculated a case where the fish tanks are not placed in a building, which will reduce the
annual fish production.
Production cost was to 4.48 €/kg gutted 500 gr rainbow trout. Feed cost was the highest cost factor with 31% of the cost. Sec-
ond highest costs were investment deprecation with capital costs, together 21% of the production cost. Therefore efficient use
of the investment by temperature control and especially investment need for isolated building become important cost factors in
colder climate. Electricity cost that is generally highlighted as one of the disadvantages of RAS farming, is not among the main
cost factors in the Danish Model farm concept.
Finally, the regional market price is of utmost importance since the production cost will be higher than the current price at the
highly competed European markets. We assumed a producer price 4.50 €/kg in the Finnish market.
Keywords
RAS, Fish farming, Investment, Profitability, Model, Rainbow trout
Publications internet addresshttp://www.aquabestproject.eu/reports.aspx
Contact
[email protected] information

8/10/2019 Aquabest 24 2014 Report
http://slidepdf.com/reader/full/aquabest-24-2014-report 5/23
Contents
Description 4
1. Introduction 6 1.1. Economic feasibility assessment 6
1.2. Danish model fish farms 6
1.3. Model farm concept in colder climate conditions 7
1.4. Profitability case study 8
2. Cost and productivity factor assumptions 11
2.1. Investment and other fixed costs 11
2.1.1. Investments and the annual production 11
2.1.2. Permanent personnel 12 2.1.3. Other costs with fixed character 13
2.2. Variable costs 14
2.3. Production efficacy parameters 14
2.4. Market value 15
3. Preliminary profitability analysis of model farm concept 16
3.1. Results 16
3.2. Sensitivity analysis 16
3.3. Model farm without isolated building with northern growth rate 17
3.4. Discussion and conclusions 18
3.4.1. On the profitability analyses model 18
3.4.2. Economic feasibility of producing portion size trout in colder climate of Finland 19
3.4.3. On the RAS farm design 20
References 23
8/10/2019 Aquabest 24 2014 Report
http://slidepdf.com/reader/full/aquabest-24-2014-report 6/23
Reports of Aquabest projects 24 / 2014 Economic feasibility tool for fish farming – case study on
the Danish model fish farm in Finnish production environment
6
1. Introduction
1.1. Economic feasibility assessment
Environmental policy goals to decrease nutrient emissions have led to stagnated fish production in the
Baltic Sea Region (BSR). Fish products are imported into BSR to meet the demand, while environ-
mental consequences are externalized to those regions that produce the fish consumed in the BSR.
To switch this trend, BSR aquaculture must adopt new sustainable practices and technologies, and
introduce regulation that encourages the development and use of abatement measures.
New environmentally sustainable technologies are emerging in aquaculture and the opportunity to
increase production without additional nutrient discharges makes recirculation aquaculture systems
(RAS) an interesting option. In addition to reduced discharges, RAS allows better control of production
conditions especially temperature and the technology drastically reduces the need for intake water
which enables these farms to be placed in unconventional locations.
There are high expectations among decision makers on adopting RAS farming. However, markets
are global and highly competed, and new technologies need to be economically competitive to be
viable in the long term. RAS systems require higher investments and there are other additional cost
items which may increase production costs. Therefore, assessment of economic feasibility by compar-
ing production costs and market price is thus of utmost importance within the BSR, including Finland
(Nielsen et al. 2014).
This report illustrates the use of the Excel spreadsheet published by Aquabest-project, to evaluate
economic feasibility of RAS farming (Kankainen 2014). As the example, we use Danish model fishfarm concept applied in Finnish production environment (market, cost structure, climate) to assess the
opportunities by meeting the nutrient discharge reduction targets by RAS farming. The production
equipment and tank investment costs were evaluated according to Danish cost level. Other cost fac-
tors, such as isolated building and variable costs such us energy, work and fingerlings, were estimated
according to Finnish cost level. The technology used in these farms is briefly described below.
1.2. Danish model fish farms
In traditional freshwater or marine production systems, the water flows through the system only once.
In RAS farms, 95-99% of the water is directed back to the production system after used in fish tanks.To maintain proper water quality before the water is reused, mechanical and biological water treat-
ment is needed. The main emphasis to maintain proper conditions for fish welfare and viable business
is to, firstly, remove particle substances quickly by sedimentation and filtration, secondly, to remove
carbon dioxide by aeration and/or stripping, thirdly, to add oxygen, and finally, to transform toxic am-
monia to less harmful nitrate by biological filtration. Further information on RAS technology is available
at e.g., Jokumsen and Svendsen (2010), Dalsgaard et al. (2013), Pedersen and Jokumsen (2014),
and Suhr (2014).
The Danish model fish farm concept was developed to reduce nutrient discharges due to stringent
environmental regulation (Jokumsen and Svendsen 2010). The first generation of these farms (model
trout farm type 1) was actually not recirculation aquaculture, but merely used mechanical filtration and
re-used a part of the water after aeration and in some cases oxygenation. The second generation
(model trout farm type 2) introduced the biological filtration, and can thus be classified as RAS farms.
8/10/2019 Aquabest 24 2014 Report
http://slidepdf.com/reader/full/aquabest-24-2014-report 7/23
Reports of Aquabest projects 24 / 2014 Economic feasibility tool for fish farming – case study on
the Danish model fish farm in Finnish production environment
7
However, many engineering changes to these farms have emerged, and the current farms (model
trout farm type 3) are more intensive. Model farms mostly use raceways, but lately, octagonal or
rounds tanks have become more common in new type 3 farms. Model farm water treatment technolo-
gy can also be placed indoors for especially juvenile production (Figures 1-4).
Model fish farms are not the most intensive RAS farms. Model fish farms typically use 3000-4000
liters of water per kg feed in comparison to 100-1000 liters per kg in more intensive RAS farms. Model
fish farms do not heat or cool the water, nor have used UV or ozone in water treatment. So far, these
farms have been placed outdoors whereas globally most RAS farms are located indoors, even in iso-
lated buildings. However, type 3 farms may in future be located in buildings in Denmark. Typical for
the Danish concept is also the use of constructed wetlands to decrease nutrient discharges further.
These characteristics make model trout farms a rather unique.
An additional characteristic of model farms is low water pumping heights and, thus, moderate en-
ergy consumption than has been typically considered high in RAS. Lower pumping heights (typically0.5-1.0 meters) decrease energy consumption, which can be as low as 1.0-2.0 kWh per kg growth.
Low pumping heights are achieved by several engineering decisions, especially biofilter design, low-
head aeration and oxygenation systems, and by modern pump technology.
The waste from a model farm is similar but smaller in quantity to the waste from a traditional farm,
and will mainly consist of organic matter (measured as BOD, biological oxygen demand), nitrogen (N)
and phosphorus (P). Table 1 shows a comparison in discharges between traditional Danish farms and
a Danish model 3 farm. The specific discharge (kg/t fish produced) of N, P, and organic matter from
the model farms amounted to 64, 38, and 6%, respectively, of the corresponding estimated discharge
from traditional Danish freshwater trout farms (Svendsen et al., 2008). Without the wetlands, phospho-
rus load (the main target of regulation in Finland) would be 1.3 kg per tn produced fish based on the
data by Svendsen et al. (2008).
Table 1. Comparison of discharges of Nitrogen (N), Phosphorus (P) and organic matter (BOD) from
model trout farms (type 3) and traditional trout farms in Denmark during the monitoring project.
Kg/tn produced fish Traditional farms in
2006
Model farm type 3
2006-2007
Model farms, % of
traditional farms
Total nitrogen 31.2 20.0 64
Total phosphorus 2.9 1.1 38
BOD 93.6 5.6 6
1.3. Model farm concept in colder climate conditions
Climate and access to ground water sources makes model farm concept ideal for the Danish condi-
tions. Within the Baltic Sea region, similar conditions can be expected in southern Sweden, Germany
and Poland. However towards the north, the concept will face the challenge of colder winter tempera-
tures and consequent decrease in fish growth and annual production. The important question now
becomes if farms should invest in water temperature control consisting of isolated building and even
heat pumps and relating temperature control systems. By these investments, winter growth can be
increased and also peaks of high temperature during the summer can be avoided, but with additional
capital and variable costs.

8/10/2019 Aquabest 24 2014 Report
http://slidepdf.com/reader/full/aquabest-24-2014-report 8/23
Reports of Aquabest projects 24 / 2014 Economic feasibility tool for fish farming – case study on
the Danish model fish farm in Finnish production environment
8
1.4. Profitability case study
In the present economic feasibility study we analyze production costs of portion size (500 gram) rain-
bow trout production in the northern BSR by using Finnish temperatures in the case study, and thendo sensitivity analyses by varying the most important parameters likely to be encountered in practical
business cases. Of special interest will be the influence of water temperature and consequent annual
production. Furthermore, the economic feasibility of investing in isolated building to control the tem-
perature will be analyzed.
We have designed a cost structure for a farm producing 500 gram rainbow trout, which is a rather
common product for the European markets. It is also currently the major product for Danish model
trout farms. The investment, which stems from the knowledge on several farming projects in Denmark,
would be able to produce 500-600 tons of fish under typical Danish model fish farm temperature con-
ditions. The production equipment and tank investment costs were evaluated according to Danish cost
level. Other cost factors, such as isolated building and variable costs such us energy, work and finger-
lings, were estimated according to Finnish cost level.
The production costs are compared to assumed producer price of 500 gram rainbow trout in Fin-
land. In Finnish domestic market neither portion size rainbow trout nor filet of portion size fish are
common products. Thus market price or producer price was not available. Based on substitute product
prices and discussion with the processing and retail sectors, producer price of 4.5 €/kg could be pos-
sible in Finnish market for a small volume of domestic production of fresh (nor frozen), high quality
production. In comparison, the producer price for larger trout has varied in the past few years between
3.20 and 5.50 €/kg.

8/10/2019 Aquabest 24 2014 Report
http://slidepdf.com/reader/full/aquabest-24-2014-report 9/23
Reports of Aquabest projects 24 / 2014 Economic feasibility tool for fish farming – case study on
the Danish model fish farm in Finnish production environment
9
Figure 1. Abild model trout farm in Denmark. Photo: Peder Nielsen.
Figure 2. Løjstrup model trout farm in Denmark. Photo: Peder Nielsen.
8/10/2019 Aquabest 24 2014 Report
http://slidepdf.com/reader/full/aquabest-24-2014-report 10/23
Reports of Aquabest projects 24 / 2014 Economic feasibility tool for fish farming – case study on
the Danish model fish farm in Finnish production environment
10
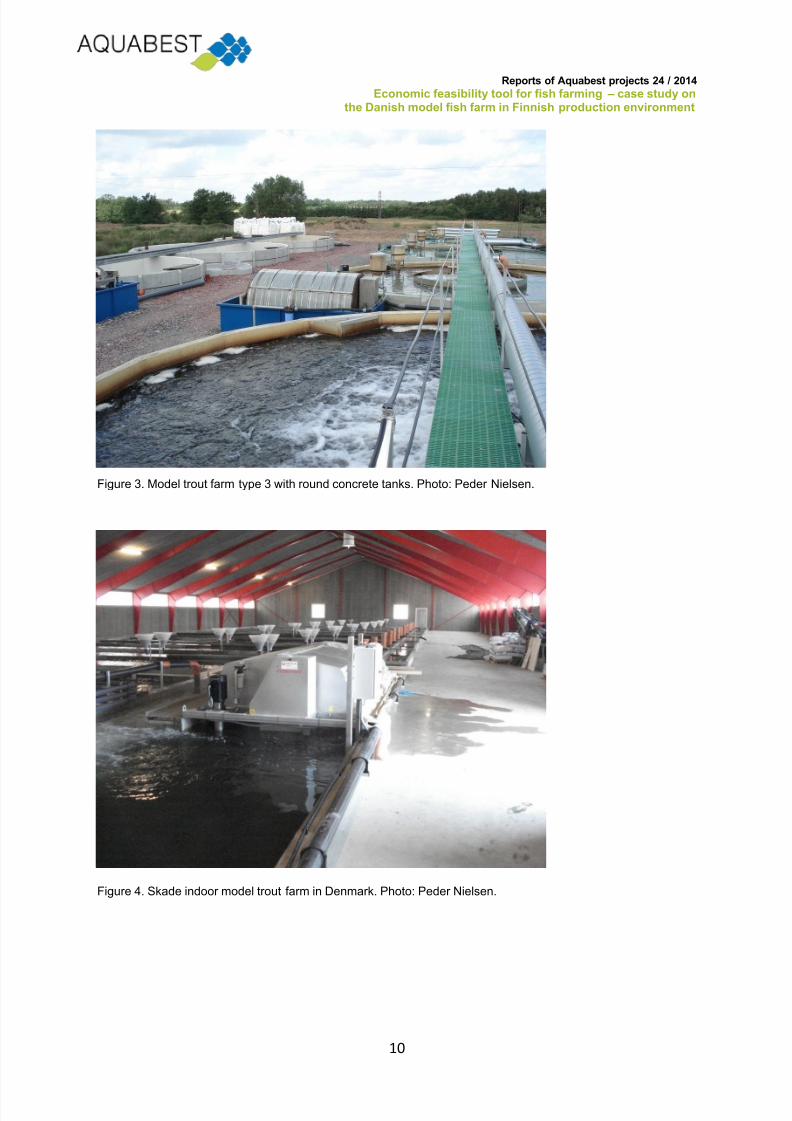
Figure 3. Model trout farm type 3 with round concrete tanks. Photo: Peder Nielsen.
Figure 4. Skade indoor model trout farm in Denmark. Photo: Peder Nielsen.

8/10/2019 Aquabest 24 2014 Report
http://slidepdf.com/reader/full/aquabest-24-2014-report 11/23
Reports of Aquabest projects 24 / 2014 Economic feasibility tool for fish farming – case study on
the Danish model fish farm in Finnish production environment
11
2. Cost and productivity factor assumptions
2.1. Investment and other fixed costs
2.1.1. Investments and the annual production
The farm consists of 24 pcs of octagonal /or round concrete tanks, each of 135 m3 in volume. The
large number of tanks allows constant delivery of fish to markets, and is also beneficial for the disease
control since several separate water treatment units are used.
Fish are put into the systems at an average size of approx. 20 g and are feed until they reach a
size of 500 g. Farm has four water treatment systems for six tanks each, with common water treat-
ment unit consisting of a drum filter, submerged bed filter, degassing and oxygenation units. The
above mentioned production system with fish tanks and water treatment systems would require 3.600
m2 building.
The total tank volume of 3240 m3 is adequate for 500-600 tn production in typical for Danish farm
using groundwater. With a typical annually turnover between 2.5-3 for fish up to 500 gr and a stocking
density up to approx. 70 kg/m3 the total standing stock (average biomass) will be approx. 227 tn. For
the present case study, we estimated annual production by using temperature profile from a lake in
the Middle-Finland, and assumed based on experience at RAS farms, that pumps and other devices
increase the temperature within the isolated building by two degrees. Annual growth was estimated
using TGC-model (e.g., Jobling 2003), and found to be 430 tons. This annual production is the value
used in further profitability calculations. Without the isolated building, ambient lake temperature would
provide annual growth of 370 tons, whereas additional investments in heat pumps and additional en-ergy would allow annual production similar to the Danish conditions. These issues are discussed fur-
ther in the sensitivity calculations (Chapter 3.2 and 3.3).
Farm should locate near the water resource that generally increases the value of estate. The
“Constructions” include earthwork, water canals/pipes, concrete tanks as well as feed and pump
warehouses; “Covered isolated building” price estimate (500€/m2) is for Finnish conditions with high
construction costs due to earthwork for cold climate, thick insulation and snow load for winter times.
The building price includes also the basic electricity and air-conditioning devices. “Equipment” includes
technical equipment and items such as biofilters and drum filters aeration, oxygenation and pumps.
Back-up power, alarm system, electricity installation and fish and feed handling devices (e.g. separa-
tion, harvesting, gutting equipment) are estimated to “Other production equipment”. Transport includes
lift trucks, bulk trucks and tractors for managing the feed and harvest operations and transfers. Also
“Monitoring and management” of the construction work and “Technical consultancy and supervision”
of fish farm are calculated separately. The work related to other cost item is included in investment
prices. For estates and constructions we used 10 year depreciation time. For technical equipment we
used 5 years write-off period. Constructed wetland is not included in this investment.
Public investment subsidy in for such investment has been lately 30% through European Fisher-
ies Funds (EFF, in the future European Maritime and Fisheries Fund EMFF). However some com-
munes may support these kind of projects even with larger subsidies or discounts, for example for
purchasing the estates. All cost factors include VAT.

8/10/2019 Aquabest 24 2014 Report
http://slidepdf.com/reader/full/aquabest-24-2014-report 12/23
Reports of Aquabest projects 24 / 2014 Economic feasibility tool for fish farming – case study on
the Danish model fish farm in Finnish production environment
12
Table 2. Investment costs and deprecation by item
Figure 5. Technical details on the water treatment systems at a model trout farm. Photos: Peder Nielsen.
2.1.2. Permanent personnel
According to experience from Denmark it should be possible to produce approximately 250 – 300 tn
annually with one person year, however manager personnel is also needed for running operations.
The larger the farm, the less personnel are needed per produced kilo fish.
In this feasibility study it is assumed that personnel costs consist of entrepreneur who participatesdaily fish farm operations and two operational staff. RAS farms should have personnel on standby
24/7 in case of production risks, such us electricity or water quality problems. Salary overhead rate of
Investment costs Investment total value € 3 710 000 Investment weighted average depreciation 8,8
Production estates Investment initial value 200 000 Deprecation years 10
Production constructions Investment initial value 900 000 Deprecation years 10
Farming equipment Investment initial value 400 000 Deprecation years 5
Othe r production equipment Inve stment initia l va lue 200 000 Deprecation years 5
Transport Investment initial value 100 000 Deprecation years 5
Monitoring and Management Inve stment initia l va lue 50 000 Deprecation years 3
Other Furniture Investment initial value 10 000 Deprecation years 5
Other Isolated production building Investment initial value 1 800 000 Deprecation years 10
Other Consultancy and supervision Investment initial value 50 000 Deprecation years 5
Investment subsidy Investment value with subsidy € 2 597 000
% of the investment total value 30 %

8/10/2019 Aquabest 24 2014 Report
http://slidepdf.com/reader/full/aquabest-24-2014-report 13/23
Reports of Aquabest projects 24 / 2014 Economic feasibility tool for fish farming – case study on
the Danish model fish farm in Finnish production environment
13
30% cover obligatory insurance, pension, holiday pay-reserve, social security payment and taxes paid
by employer. In addition to permanent personnel, gutting of the fish needs extra employees. That is
estimated into variable personnel costs.
Table 3. Fixed personnel cost factors
Figure 6. Preparing to grade fish at a model trout farm. Photo: Jouni Vielma.
2.1.3. Other costs with fixed character
Fixed costs means cost factors that will not directly change when production volume changes. Other
fixed costs herein consist of miscellaneous cost factors listed in Table 3. The more specific descrip-
tions of each fixed cost item can be found at red info triangles in the model (Kankainen 2014). In prac-
tice many of these cost factors may turn out to be much higher, or, in some occasions some cost fac-
tors, such as marketing is not needed at all. Infrastructure, vehicles and equipment maintenance costs
increase in time and generally become significant cost factor at the end of the investment lifetime. The
electricity costs estimated does not cover the electricity needed in production but includes heating and
air-conditioning of the buildings, and technical devices for the gutted fish. All cost factors include VAT.
Fixed personel costs Person-years total 3 Average month person costs 3333
Number of staff Person-years 2 Average month salary staff € 3000
Number of manager personnel Person-years 1 Average month salary managers € 4000
Salary overhead rate Share of the salary 30 % Annual person costs 156 000

8/10/2019 Aquabest 24 2014 Report
http://slidepdf.com/reader/full/aquabest-24-2014-report 14/23
Reports of Aquabest projects 24 / 2014 Economic feasibility tool for fish farming – case study on
the Danish model fish farm in Finnish production environment
14
Table 4. Annual fixed costs
2.2. Variable costs
Feed is usually the major variable cost factor (Table 5). Feeds for smaller fish are more expensive, but
feeds for larger fish form bulk of the feed usage. Also FCR (Feed conversion ratio) changes with fish
size. However these details are not included in the present model. Instead, average feed price and
FCR is used.
The price of fingerlings becomes relevant factor for profitability especially in the production of ta-
ble size fish when fish are sold small. The larger the fish are farmed, the less significant becomes the
fingerling purchasing cost, because less fingerlings are needed for producing the same tonnage. We
estimated the price of 15 €/kg for 20 gram vaccinated fingerling.
Other variable costs consist of fish insurance, electricity and transport. Also oxygenation, medical
treatments and waste water treatment costs are important cost factors in RAS farming. We assumed
the cost of 0.10 euros per kWh for the electricity and electricity consumption is assumed to be 2.0 kWhper kg fish growth. The modern Danish low-head model farms can be designed to use even down to
1.0 kWh per kg, but we wanted to be more conservative with the estimation. All cost factors include
VAT.
2.3. Production efficacy parameters
Bio-economical productivity factors, such us growth, mortality and feed efficiency influence the effi-
ciency of production and thereby the need for cost items introduced above (Kankainen et al 2011).
Production cycle length also influences the effect of certain cost items.
The average harvest size of 500 gram was chosen because it is common European market sizefor rainbow trout and also produced in Danish model fish farms. In our example, at 500 g fish are gut-
ted, although they can also be transferred to sea cage production or grown to traditional market size of
over 2 kg in RAS. To calculate costs for that kind of production, gutting investments and variable la-
bour costs can be deleted and “Gutting yield” is 100%.
Mortality varies between years, fish populations and production environments. Sometimes dis-
eases or realisation of production risks may cause loss of a complete production batch. Normal yearly
mortality is around 2-3% of individuals; however we used 10% mortality to include unexpected higher
losses. To avoid total monetary lost and bankruptcy, insurance is included as variable costs in the
feasibility calculation.
Other fixed costs Annual value estimate 70 000
Rents Annual value 5 000
Maintenance Annual value 20 000
Production l isences and monitoring Annual value 5 000
Book keeping and financial administration Annual value 5 000
Marketing Annual value 5 000
Fixed electricity Annual value 10 000
Travel Annual value 5 000
Research and development expenses Annual value 5 000
Insurance Annual value 5 000
Other Logistic (road) fee Annual value 5 000
Other Annual value
Other Annual value

8/10/2019 Aquabest 24 2014 Report
http://slidepdf.com/reader/full/aquabest-24-2014-report 15/23
Reports of Aquabest projects 24 / 2014 Economic feasibility tool for fish farming – case study on
the Danish model fish farm in Finnish production environment
15
Table 5. Volume dependent company variable costs
Table 6. Production cycle, volume and bioeconomic productivity factors
2.4. Market value
Market price for the fish is of utmost importance for the profitability. In Denmark, portion size trout pro-
ducer price has lately been approximately 3.5 - 3.8 €/kg including VAT (26-28 DKK/kg)
(www.danskakvakultur.dk), and has faced tough competition by especially the Turkish production. In
Finnish domestic market neither portion size rainbow trout nor filet of portion size fish are common
products. Thus market price or producer price was not available. Based on discussion with the pro-
cessing and retail sectors on subsidy products for traditional salmonids, producer price of 4.5 €/kg
could be possible in Finnish market for a small volume of domestic production of fresh, high quality
production. In comparison, the producer price for larger trout has varied in the past few years between
3.20 and 5.50 €/kg. It is not obvious why consumers would be willing to pay extra or even an equal
price for smaller fillets of trout, in comparison to large fillet. Furthermore, typical products (cold smoked
and dill-cured “gravlax”) would be more expensive and less convenient to produce using small portion
size fish.
Variable cost factors Targeted by: € Annual total variable cost € 1 112 310
Annual total variable cost €/kg 2,87
Feed cost average €/kg feed 1,4 546 616 1,41
Fingerling cost 20 average €/kg 15 286 667 0,74
Roe cost average €/kg roe 0,00
Other annual variable cost € 279 027
Other variable cost €/kg 0,72
Volume depended investment €/gutted fish 0 0
Personnel €/gutted fish 0,1 38 700
Fish insurance €/gutted fish 0,2 77 400
Vaccination €/fish 0 0
Medicines €/gutted fish 0,02 7 740
Fuel €/gutted fish 0,02 7 740
Electricity €/gutted fish 0,2 77 400
Oxygen €/gutted fish 0,01 3 870
Transport €/gutted fish 0,05 19 350
Washing water €/gutted fish 0,001 387
Waste water €/gutted fish 0,01 3 870
Ice €/gutted fish 0,01 3 870
Sludge treatment chemicals 0,05 19 350
pH-control chemicals 0,05 19 350
Other €/gutted fish 0 0
Other €/gutted fish 0 0
Other €/piece 0 0
Fingerling purchasing Average size of fingerling gram 20 Production volume per year, kg 430 000
Growth Estimated average final weight 500 Growth, x times the initial weight 25Mortality Total mortality % 10 % Number of fingerlings 955 556
Harvest yield Gutting yield % 90 % Sales volume, kg 387 000
Feed efficiency Feed conversion ratio (FCR) 0,90 Feed usage, kg 390 440

8/10/2019 Aquabest 24 2014 Report
http://slidepdf.com/reader/full/aquabest-24-2014-report 16/23
Reports of Aquabest projects 24 / 2014 Economic feasibility tool for fish farming – case study on
the Danish model fish farm in Finnish production environment
16
3. Preliminary profitability analysis of model farmconcept
3.1. Results
Production cost based on the present calculation is 4.48 €/kg gutted fish. The production costs would
mean profit of 0.02 €/kg at the producer price 4.5 €/kg. In other words, on the basis of our assump-
tions, productions costs would be very close to the break-even price.
3.2. Sensitivity analysis
Sensitivity analyses is a useful exercise to evaluate the influence of assumptions in the profitability
calculations. Profitability analysis is useful to evaluate effects of one or several simultaneously chang-ing cost factors. For example it is possible that water treatment system functions well and allows using
higher densities and thus higher annual production of fish. On the opposite, it is also possible that the
farm is still on a learning curve during the first few years of the operation, and the annual production is
less than anticipated. Similar differences can take place in investments, mortality and many other pa-
rameters.
For sensitivity analysis we have given realistic risk and improvement margin for cost factors to
highlight which factors may have a significant effect on the profitability (Table 8).
Table 7. Profit account for 430 tn fish farm and related production cost.
Factor based profit account €/kg
Revenue 1 741 500 4,50
Variable costs
Feed cost 546 616 1,41
Fingerling cost 286 667 0,74
Other variable costs 278 640 0,72
Fixed costs
Fixed personnel 179 982 0,47
Investment depreciation 295 114 0,76
Other fixed costs 70 000 0,18
Financial costs
Capital costs 75 421 0,19
Total costs 1 732 439 4,48
Taxes 2 537 0,01
Profit 6 524 0,02

8/10/2019 Aquabest 24 2014 Report
http://slidepdf.com/reader/full/aquabest-24-2014-report 17/23
Reports of Aquabest projects 24 / 2014 Economic feasibility tool for fish farming – case study on
the Danish model fish farm in Finnish production environment
17
Table 8. Profitability sensitivity analysis for major cost factors. The cost estimate for business as usual
is 4.48 €/kg.
Major cost savings could be achieved by lower feed or fingerling costs. Also deviation from growth
expectations have major influence on probability. RAS operations tend to overestimate fish growth
especially during the first years of operation, when the new farm is still on a learning curve regarding
daily management routines. Our growth estimate for the investment used in this feasibility study is
somewhat conservative. Higher densities and elevated water temperatures might yield higher produc-
tion. On the other hand, the water treatment systems have their maximum capacity above which prob-
lems with water quality will become apparent. Lower feed costs are not easy to realize either. The
trend for feed price is rather increasing than decreasing. Higher volumes for feed purchases may give
scale discounts. The feeds assumed in the present calculation contain astaxanthin, whereas for some
markets table size fish do not need to be pigmented. Fish are usually fed at restricted feeding ratios
without feed wastage. Good water quality and careful observation of the feeding and fish stock are
essential for good FCR. Savings in feed price do not necessarily translate into lower feed costs, since
RAS farms are sensitive to feed quality. Fingerling could be purchased for a lower price than we have
estimated, especially if they are produced within the company. Other variable cost include some spe-
cific cost factors that may change significantly from the assumed; for example electricity, oxygenation,
transport, medicines and most of all insurance are such cost factors that can vary extensively. In the
Baltic Sea region, EU member states can use European Maritime and Fisheries Funds to support
(subsidy) investments. In the present calculation, we have assumed 30 % subsidy for the investment.
3.3. Model farm without isolated building with northern growth rate
In our example for the cold climate, isolated production building is costing as much as 0.47 € per kg,
although the building is the only way to preserve the heat loss and thus produce more than in ambient
tempareture. There is no proven example of using the model trout farm technology in a colder climate
without isolated production building. At minimum, the water treatment systems would require a small
isolated building of approximately 400 m2 (0.2 milj. €). Without the isolated building, due to the colder
ambient temperature the annual production would be some 60 tons lower than with the building con-
serving the heat loss from the pumps.
This operation would result in production cost of 4.26 €/kg (Table 9). The cost is 0.2 euros lower
than when company invests in the isolated building to utilize the heat loss. We want to emphasize that
this kind of solution has not been tested yet in colder climate. During cold winters, severe mechanical
failures may occur despite isolated building for the water treatment system.
For temperature control, access to borehole or well water sources and efficient use of space at
the farm become important factors influencing the production costs. All real investments in RAS in
Finland rely on isolated building and simultaneous investments in full temperature control. This will
allow larger production thus decreasing the share of the isolated building costs. It may well be the
Cost factor Assume d value Sensitivity values Unit New production cost Change in production cost
Low end High end Low end High end Low end High endGrowth 430 000 380 000 480 000 Kg/year 4,69 4,31 -0,21 0,17
Investment (subsidy included) 2 600 000 2 200 000 3 000 000 € 4,33 4,63 0,15 -0,15
Interest 5 % 3 % 7 % % 4,40 4,56 0,08 -0,08
Feed conversion ratio 0,90 0,85 0,95 kg/kg 4,40 4,56 0,08 -0,08
Feed cost 1,40 1,20 1,60 €/kg 4,27 4,68 0,21 -0,20
Fingerling cost 15,00 10,00 20,00 €/kg 4,23 4,72 0,25 -0,24

8/10/2019 Aquabest 24 2014 Report
http://slidepdf.com/reader/full/aquabest-24-2014-report 18/23
Reports of Aquabest projects 24 / 2014 Economic feasibility tool for fish farming – case study on
the Danish model fish farm in Finnish production environment
18
most economical way of utilizing model trout farm technology in colder winter than in Denmark. Build-
ing that covers the entire production area would also bring other benefits, such as better working con-
ditions, use of more advanced feeding systems, shelter from direct sunlight (less algae growth) and
protection against predators.
Table 9. Profit account with 400 m2 isolated building investment for water treatment system. but there-
fore with 14 % smaller production due to colder water temperature
3.4. Discussion and conclusions
3.4.1. On the profitability analyses model
Economic feasibility calculations are routinely used by the business sector, but the information these
calculations provide on the opportunities of new technologies are also useful for decision makers and
R&D community. This report serves as an example on the use of Excel spreadsheet tool produced as
part of the Aquabest-project. We have extended this simple profitability analyses model to include
more detailed production planning and economic performance analysis. As an example, we have
combined the spreadsheet with growth modeling that also provides information on the daily use of
feed, oxygen and energy for heating the water. As an example of more detailed economic evaluation,
different production cycles, multispecies farming, seasonally varying fish prices and company cash
flow-analyses can be combined with the present basic model.
Factor based profit account €/kg
Revenue 1 498 500 4,50
Variable costs
Feed cost 470 344 1,41
Fingerling cost 246 667 0,74
Other variable costs 239 760 0,72
Fixed costs
Fixed personnel 179 982 0,54
Investment depreciation 167 841 0,50
Other fixed costs 70 000 0,21
Financial costs
Capital costs 42 894 0,13
Total costs 1 417 488 4,26
Taxes 22 683 0,07
Profit 58 329 0,18

8/10/2019 Aquabest 24 2014 Report
http://slidepdf.com/reader/full/aquabest-24-2014-report 19/23
Reports of Aquabest projects 24 / 2014 Economic feasibility tool for fish farming – case study on
the Danish model fish farm in Finnish production environment
19
3.4.2. Economic feasibility of producing portion size trout in colder climate ofFinland
The current calculation would indicate possible economic loss even at producer price of 4.5 €/kg, a
price which could be available in Finnish market. We are aware of the fact that the producer price of
portion size rainbow trout is lower in Denmark and Poland. This has been especially true in recent
couple of years due to imports from Turkey, a case which will be further investigated by EU during
2014. Therefore, exporting this product profitably seems not to be a realistic option either. We should
also notice that the European portion size fish has not been imported to Finland even at the European
price, since there appears not to be enough demand for portion size rainbow trout in Finland.
Finnish Game and Fisheries Research Institute has very recently studied the interest of the
wholesale sector and processors on the locally produced table size rainbow trout. Finnish consumers
have traditionally used large salmon or rainbow trout filets that are cheaper to produce, process and
buy. Therefore it is not obvious why consumers would choose smaller and more expensive table size
fish file instead. Also, the consumption of whole fish has decreased continuously in Finland and there-
fore it is not realistic to forecast large markets for gutted fish, even if the size would be more attractive
than the large fish. However with some special quality characteristic and marketing, table size fish may
win some markets from the bulk salmon filet products. In the Finnish markets, there is a higher de-
mand for filet of fish over 2 kg. Therefore, it would be interesting to evaluate how competitive RAS
farming, for example using the model farm technology, could be in such production. Some cost factors
would decrease, such as fingerling price, whereas some cost factors would increase such as capital
costs due to slower stock turnover rate of the larger, slower growing fish.
In the sensitivity analyses, single cost factors were varied but only some of them separately re-
sulted in profitable production. However, we did not calculate cases where several cost factors are
changed simultaneously. Combined effect of several cost factors such as cheaper juveniles, lower
mortality, and higher annual production due to increased fish density – a possible scenario based on
the information from the sector – would make the production profitable albeit on a narrow margin.
However, it is also quite possible to encounter increasing building costs, delays in the start-up phase,
slower growth of fish and even drastic losses due to unexpected failures in the technology, which
would increase the production costs even from the estimated.
The single most important cost factor that is different between the established Danish production
and our case study, is the need for isolated building. The influence of the building was as high as 0.46
€/kg fish in the present calculation. In Finland costs was evaluated to be more than 500 €/m² for iso-
lated building. The estimations for insulated building in Denmark is around 150 €/m². This difference,
together with the need to warm the water, or lower annual output without heating, become a major
cause of the price difference between production in Denmark and northern BSR. Therefore, more
detailed analyses on the optimal water temperature control such as alternative ways to isolate the
tanks and water treatment systems, and when to heat the water, is needed. If full control of the water
temperature is targeted, then heating pumps and further filtration systems are required which means
additional investments and higher energy consumption. On the other hand, the investment such as the
building and water treatment system could be used at the full capacity around the year.
A final but important note on the sensitivity analyses is the size of the production unit. Our exam-
ple farm is smaller than several latest true investment cases, where annual production fetch to 1000tons and more. Significant savings can be expected due to scale of economics. However, financing
such investments becomes more complicated and investors outside the traditional farming sector may

8/10/2019 Aquabest 24 2014 Report
http://slidepdf.com/reader/full/aquabest-24-2014-report 20/23
Reports of Aquabest projects 24 / 2014 Economic feasibility tool for fish farming – case study on
the Danish model fish farm in Finnish production environment
20
be needed. Such large RAS farms have not been granted licenses in Finland and the regulation prac-
tices remains to be seen. Phosphorus load of the current example, 430 ton producing farm, approxi-
mately 500 kg P, would higher than most traditional inland fish farms, although largest licenses are
1000-200 kg P per year. In the current assessment, we did not include wetlands, since their efficiency
in removing nutrients in the Northern conditions is not certain. Wetland would allow higher production,
if the nutrient discharge quota is the limiting factor for the production.
One option for profitable RAS business is to produce larger trout for further sea cage farming.
Similar development is taking place in Norway, where larger salmon smolts for cage farming are pro-
duced in RAS than in conventional farms. The most likely scenario in the Baltic Sea cage farming is
that new production will be located in harsh conditions towards the open sea. In such sites, growing
season may be too short to reach the market size if regular size juveniles are used. With RAS system
larger fish could be produced for the beginning of the season in the spring so that fish would reach
market size before cages are towed away from the open sea before the winter. RAS farming may alsobe the only solution to get new licenses for smolt production on the coastal areas nearby the cage
operations due to stringent environmental policies. (Kankainen et al. 2014, Kankainen and Mikalsen
2014, Vielma and Kankainen 2013).
3.4.3. On the RAS farm design
There is a continuous discussion on the best way to design a RAS farm. Currently in Denmark, there
is a tendency of shifting from serial connected raceways to parallel connected raceways or tanks with
circular flow. Each design has its own advantages and disadvantages and should be evaluated sepa-
rately for each investment case. Below is a summary of advantages and disadvantages of different
designs. In the case of colder climate where investments in the isolated building can be significant, the
efficient use of space, both by the fish tanks but also by the water treatment technology, becomes a
cost factor worth closer analyses.

8/10/2019 Aquabest 24 2014 Report
http://slidepdf.com/reader/full/aquabest-24-2014-report 21/23
Reports of Aquabest projects 24 / 2014 Economic feasibility tool for fish farming – case study on
the Danish model fish farm in Finnish production environment
21
Serial connected raceway systems
Advantages Disadvantages
Simple construction.
Few pipes and valves reduce the pres-
sure loss in the system.
Simple operations.
Relatively low energy consumption (1.7 –
2.2 kW/kg produced table size fish).
Low investment cost.
Sedimentation of sludge around the sys-
tem.
Attention must be kept to prevent sedi-
mentation of sludge’ in each single sec-
tion. Water quality may vary within the
raceway.
High risk of a complete loss of fish stock
due to chain reaction.
Require fish in all section of each systemat all time.
Poor oxygen and high CO2 level can oc-
cur.
Fluctuating temperature (if outdoor).
Moderate growth rate.
Difficult to treat against diseases.
Parallel connected raceway systems
Advantages Disadvantages
Simple construction.
Simple operations.
Very secure system.
Very low energy consumption (1.0 – 1.5
kW/kg produced table size fish).
Few pipes and valves reduce the pres-sure loss in the system.
Each individual raceway can be emptied
and disinfected without any influence on
the other raceways.
Easy to treat against diseases.
Relatively high growth rate.
Moderate investment cost.
Attention must be kept to prevent sedi-
mentation of sludge in channels and
raceways (the risk is highest with small
fish in the raceways).

8/10/2019 Aquabest 24 2014 Report
http://slidepdf.com/reader/full/aquabest-24-2014-report 22/23
Reports of Aquabest projects 24 / 2014 Economic feasibility tool for fish farming – case study on
the Danish model fish farm in Finnish production environment
22
Round or octagonal tanks with circular flow
Advantages Disadvantages
Self-cleaning ability.
Very secure system.
Stabile temperature because of sur-
face/volume ration.
Each individual tank can be emptied and
disinfected without any influence on the
other tanks. Easy to treat against diseases.
Possible to achieve good oxygen condi-
tion in all tanks.
Possible to achieve low CO2 concentra-
tion if all tanks have own aerators.
High growth rate.
Low investment cost (in Denmark due to
the pre-casted concrete tanks used in ag-
riculture).
Relatively complicated construction.
Relatively complicated operation.
Moderate energy consumption (1.5 – 2.3
kW/kg produced table size fish).
More pipes and valves complicate the
construction and result in higher pressure
loss.

8/10/2019 Aquabest 24 2014 Report
http://slidepdf.com/reader/full/aquabest-24-2014-report 23/23
Reports of Aquabest projects 24 / 2014 Economic feasibility tool for fish farming – case study on
the Danish model fish farm in Finnish production environment
References
Dalsgaard J. , Lund I.,
Thorarinsdottir R.,,
Drengstig A.,,
Arvonen K., Pedersen P., 2013,,
Farming dif-ferent species in RAS in Nordic countries: Current status and future perspectives. Aquacultural
Engineering, Volume 53, 2 –13.
Jobling, M., 2003. The thermal growth coefficient (TGC) model of fish growth: a cautionary note. Aq-
uaculture Research 34: 581-584.
Jokumsen, A., Svendsen, L.M., 2010. Farming of freshwater rainbow trout in Denmark, DTU Aqua
Research Report No. 219-2010, Technical University of Denmark, Denmark.
Kankainen M., 2014, Simplified profitability analysis model for fish farming. Excel spreadsheet at
http://www.aquabestproject.eu/reports.aspx
Kankainen, M., Niukko J., Tarkki V., 2013. Fish farm production conditions in Finnish coastline of the
Baltic sea Reports of Aquabest project 11/2013
Kankainen, M. and Mikalsen, R., 2014. Offshore fish farm investment and competitiveness in the
Baltic Sea. Reports of Aquabest project 2/2014.
Kankainen M., Setälä J., Berrill I. K., Ruohonen K. , Nobel C., Schneider O., 2011, The economic ef-
fects of improving productivity in fish farming with the specific focus on growth, feed efficiency
and survival, Aquaculture Economics and Management, Volume 16: 341-364.
Nielsen, P., Järvisalo, O., Jokumsen, A., 2014. Feasibilitystudy guidelines to implement innovative
land-based farm concepts. Reports of Aquabest project 15/2014.
Pedersen, L.F. and Jokumsen, A., 2014. Report on Baltic Sea Region Short Course in Salt Water
Recirculation Aquaculture Technology 5th – 9th October 2013. Reports of Aquabest project
17/2014.
Suhr, K., 2014. Nitrogen removal in RAS farms for Baltic Sea coastal farming. Reports of Aquabest
project 18/2014.
Svendsen, L.M., Sortkjær, O., Ovesen, N.B., Skriver, J., Larsen, S.E., Bouttrup, S., Pedersen, P.B.,
Rasmussen, R. S., Dalsgaard, A.J.T., Suhr, K. 2008. Modeldambrug under forsøgsordningen.
Faglig slutrapport for ”Måle- og dokumentationsprojekt for modeldambrug”. DTU aqua-rapportnr. 193-08. In Danish.
Vielma, J. and Kankainen, M. 2013. Offshore fish farming technology in Baltic Sea conditions. Re-
ports of Aquabest project 10/2013.