aquaculture in vietnam: present status & strategic plan · aquaculture in vietnam: present...
TRANSCRIPT

AQUACULTURE IN VIETNAM: PRESENT STATUS
& STRATEGIC PLAN
NHU VAN CAN Department of Aquaculture
MINISTRY OF AGRICULTURE AND RURAL DEVELOPMENT DIRECTORATE OF FISHERIES
---------------------------------------------------------------------------------
Present situation of Aquaculture in Vietnam
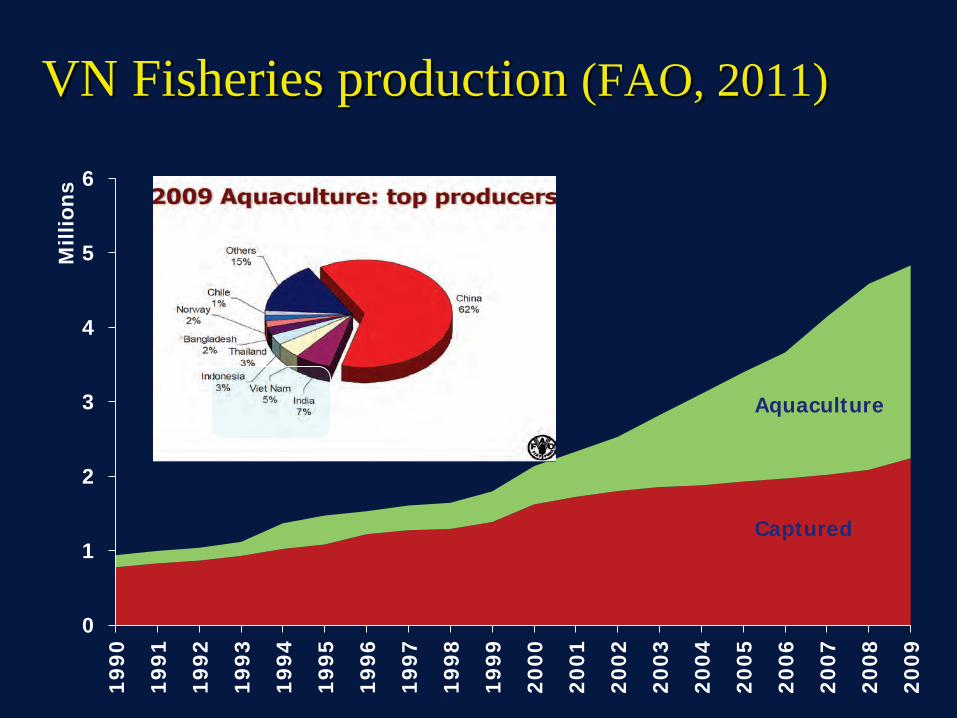
VN Fisheries production (FAO, 2011)
0
1
2
3
4
5
6
1990
1991
1992
1993
1994
1995
1996
1997
1998
1999
2000
2001
2002
2003
2004
2005
2006
2007
2008
2009
Mill
ions
Aquaculture
Captured
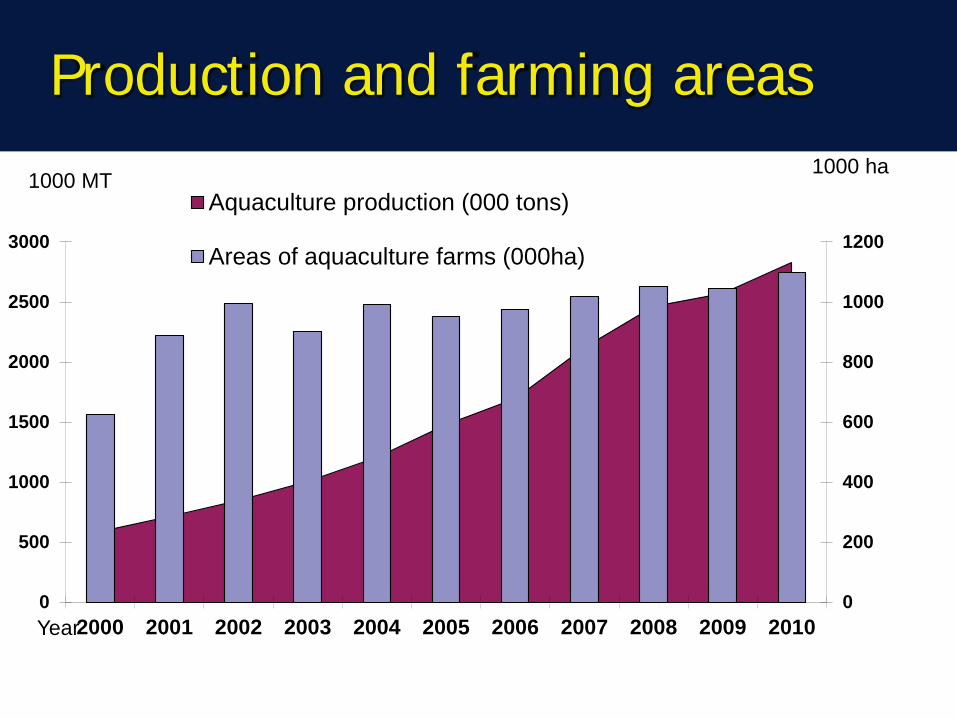
Production and farming areas
0
200
400
600
800
1000
1200
0
500
1000
1500
2000
2500
3000
2000 2001 2002 2003 2004 2005 2006 2007 2008 2009 2010
1000 ha
Year
1000 MT Aquaculture production (000 tons)
Areas of aquaculture farms (000ha)

Aquaculture Structure in 2012
• Total Aquaculture production: 3.273.018 MT
• Brackish and Marine aquaculture (32%): – Farming areas: 763,708 ha – Production 1,043,000 MT
• Freshwater aquaculture (68%): – Farming areas: 431,659 ha – Production 2,229,000 MT
2,229, 68%
1,043 , 32%
Freshwater Brackish & sea water

Northern Part
Central Part
Southern Part
Black tiger Shrimp (Penaeus monodon) X X XXX White shrimp (Litopenaeus vannamei) XX XX X Clam (Meretrix lyrata & M. meretrix) X XXX Oyster (Crassostrea spp.) X X X Blood cockles (Anadara granosa) X Sea bass (Lates calcarifer) X XXX Muddy Goby (Pseudapocryptes elongatus)
X XX
Mud crab (Scylla paramosaim) XX XX XX Groupers (Ephenelus sp) XX XXX X
Cobia (Rachycentron canadum) XX XX X
Mollusk (Lutraria spp.), X X Pearl oyster (Pieria martensii) X X X
Important brackish and marine Aq. species !

Shrimp production, 496 , 16%
Marine finfish, 81,
3%
Mollusks, 180 , 6%
Others marine fish,
221 , 7% Pangasius,
1,151 , 38%
Giant freshwater prawn, 8.5,
0%
Tilapia, 65, 2%
Traditional carps and
others, 850, 28%
Aquaculture production composition (2011)

Development of the key cultured species
0.00.20.40.60.81.01.21.41.61.82.0
1999 2005 2006 2007 2008 2009 2010
Pro
duct
ion
(mt)
M
illio
ns
Years
Molusks
Marine fish
Pangasius
Whiteleg shrimp
Tiger shrimp

Shrimp aquaculture
• 30 Provinces • 656,425 ha & 495,657 MT
- 100,000 200,000 300,000 400,000 500,000 600,000 700,000
Areas (ha) Production(MT)
623,377
319,206
33,049 (5%)
176,451 (36%)
White leg shrimp Tiger shrimp

Pangasius aquaculture (11 provinces)
(S. S. De Silva and N. T. Phuong, 2011)
Provicnes Areas (ha) Production (ton)
Đồng Tháp 1,663 333,000
An Giang 960 251,000
Cần Thơ 937 163,444
Bến Tre 650 126,750
Vĩnh Long 485 113,374
Hậu Giang 190 47,707
Tiền Giang 207 41,000
Trà Vinh 178 32,596
Sóc Trăng 167 27,400
Kiên Giang 27 6,966
Tây Ninh 25 5,500
Total 5,509 1,150,737

Export product structure (2012) (by value)
Tuna9.3%
Frozen shrimp36.5%
Other crustacean
1.9%
Pangasius28.4%
Mollusks9.5%
Otherfishes 14.5%
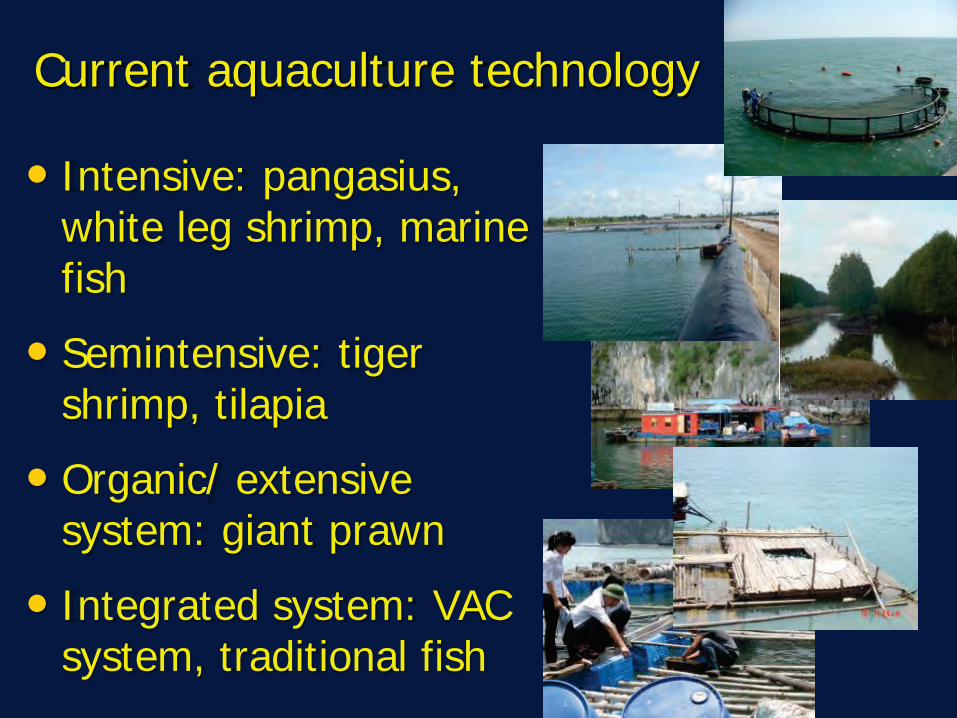
Current aquaculture technology
• Intensive: pangasius, white leg shrimp, marine fish
• Semintensive: tiger shrimp, tilapia
• Organic/ extensive system: giant prawn
• Integrated system: VAC system, traditional fish

Aq. production relates to the common water bodies
13
• Mollusk culture 26.566 ha, 158.277 MT
• Cage culture: tilapia, pangasius, common caps, sturgeon, lobster … in river, lakes, reservoir, coastal bay:
Cages (number) Production (MT)
Total FW M&B Total FW M&B 107,190 21,098 86,092 154,477 138,705 15,771

Management • Quality control of input elements:
seed, feed, probiotics, chemical and drugs (Circular 26)
• Farming conditions (Circular 44, 45)
• Farms assessment and classification (Circular 14)
• Encourage/ Promotion of GAP application and certification (PM Decision 01)
• National environment monitoring program

Aquafeed production and use
• 130 aquafeed plans, appx. 4000 products
• Annual production of 2.925 mill MT of manufactured pellets (85.6% demand)
• Imported: 7.9%
• Homemade feed: 6.5%
• Feed cost: 60-85%
• FCR: increasing

Feed cost and FCR increasing ?
Feed cost (Mill VND/kg)
2005 2010 2013
Shrimp feed 15-16 20,5-
29,2 28-37,2
Pangasius feed 5,6-6 9,8-13 11,9-
17,1
FCR
2005 2008 2012
Pangasius
1,4 -1,6
1,5 – 1,8
1,6 – 2,0
Shrimp
1,0 – 1,3
1,2 – 1,35
1,3 – 1,5
Vietnam Aquaculture Towards 2020: Sustainable development and improve
trading value !

Potential and opportunity
• Demand: World population reach 9.2 billion by 2050: Need >110 % seafood increase
• 3260 km coastal line
• More than 1 mill ha ponds for aquaculture farming

Vietnam Aquaculture Plan Toward 2020: Prime Minister Decision No. 1690/QD-TTg
• Development Goal: - Ensure food security - Increase export value
• Targets: - 7,000,000 MT of fisheries - 4,500,000 MT from aquaculture - 5,5 billion USD from exporting of aquaculture - 2,5 million of jobs in aquaculture
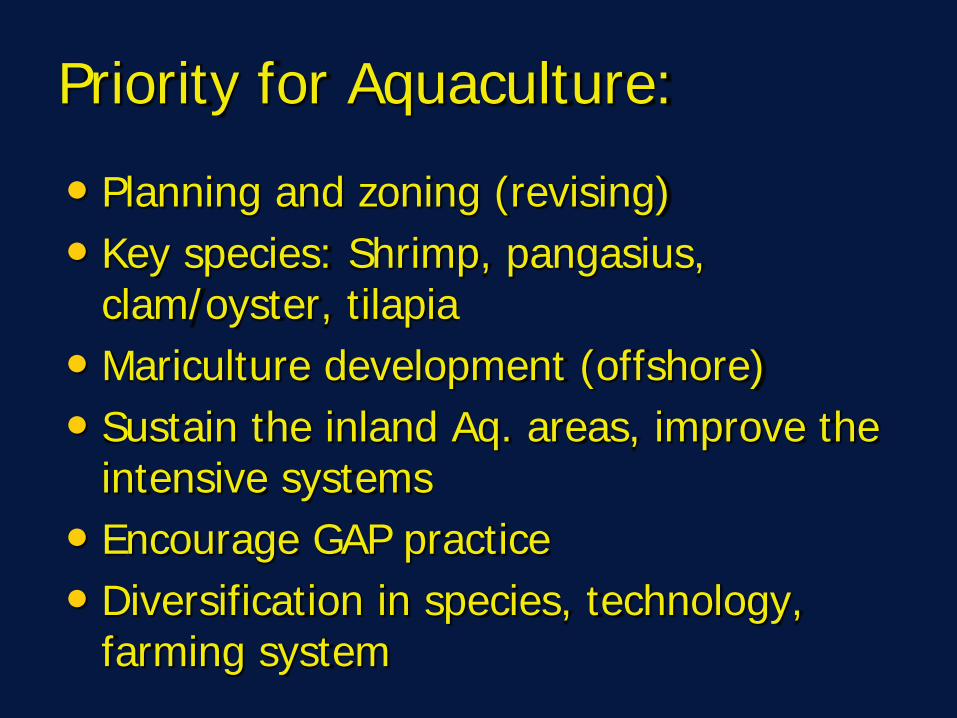
Priority for Aquaculture:
• Planning and zoning (revising) • Key species: Shrimp, pangasius,
clam/oyster, tilapia • Mariculture development (offshore) • Sustain the inland Aq. areas, improve the
intensive systems • Encourage GAP practice • Diversification in species, technology,
farming system

Priority programs
• Marine aquaculture program to 2020
• Tilapia aquaculture program to 2020
• Human resource capacity building program to 2020
• Research and technology transfer program period 2010-2020
• National Aquaculture Planning & Zoning – Marine aquaculture planning
– Establishment of 5 Regional fishery centers

Constrains and challenges
• Low trading value !
• Unsustainable production & imbalance in supply – demand (pangasius crisis) !
• High feed cost & high FCR – high production cost !
• Environment deterioration – outbreak of disease ?
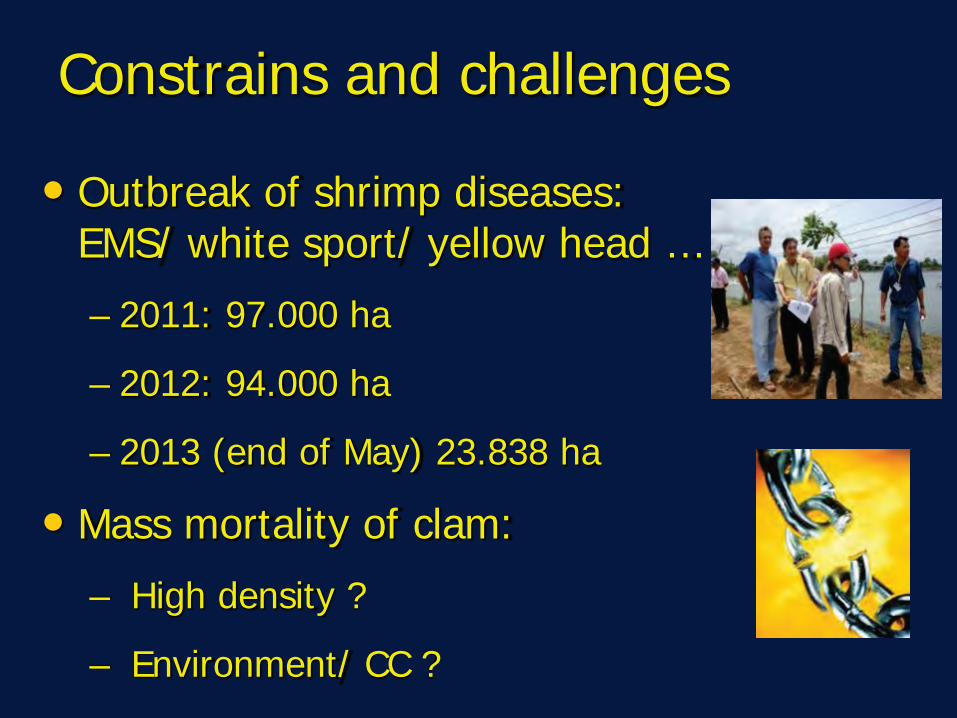
Constrains and challenges
• Outbreak of shrimp diseases: EMS/ white sport/ yellow head …
– 2011: 97.000 ha
– 2012: 94.000 ha
– 2013 (end of May) 23.838 ha
• Mass mortality of clam:
– High density ?
– Environment/ CC ?

How to sustain production and Environment integrity ?
• For closed systems (ponds, RAS, tanks…): better control of sewage/ effluents discharged from ponds ?
• For aquaculture systems in natural water bodies: cage/pen culture in reservoir, river, coastal bays: how to avoid/ mitigate pollution ?
• …
What we are expecting ?
• Modeling ACC for better Aquaculture Planning & Zoning/ appropriate policy for sustainable development ? – Simple demonstration – Resources

Thank you !