aquatic insect diversity in two temple ponds of silchar ... in the two urban temple ponds –...
TRANSCRIPT
Knowledge and Management of Aquatic Ecosystems (2014) 415, 09 http://www.kmae-journal.orgc© ONEMA, 2014
DOI: 10.1051/kmae/2014035
Aquatic insect diversity in two temple ponds of Silchar,Assam, N.E. India and their conservation values
A. Dalal(1), S. Gupta(1),�
Received August 1, 2014
Revised October 23, 2014
Accepted October 31, 2014
ABSTRACT
Key-words:Aquatic insects,diversity,pond,Silchar
A study was carried out on the diversity and density of aquatic insectcommunity in the two urban temple ponds – Radhamadhav akhra pondand Mandir dighi pond of Silchar town, Assam, Northeast India. All to-tal 22 taxa of aquatic insects were recorded, 13 taxa from Radhamad-hav akhra pond and 18 taxa from Mandir dighi pond. 9 taxa were foundcommon in both the ponds. In Radhamadhav akhra pond classical re-lationship of dissolved oxygen and free carbon dioxide was establishedwith low dissolved oxygen and high free carbon dioxide concentration.Pearson correlation coefficient analysis showed that the number of taxonwas highly correlated with the density of taxon in both the ponds. Canon-ical correspondence analysis revealed that for Radhamadhav akhra pond,eigen values were 0.784 for axis 1 and 0.630 for axis 2 while for Mandirdighi pond eigen values were 0.825 for axis 1 and 0.740 for axis 2. Taxon-environment correlation showed that aquatic insect community and en-vironmental variables were highly correlated in both the ponds. Shannondiversity index of Radhamadhav akhra pond was in the range of 1.5−1.7and Mandir dighi pond was in the range of 1.9−2.0. According to the dom-inance status by Engelmann’s Scale, only Rhagovelia sp. was found Eu-dominant in Radhamadhav akhra pond. No eudominant taxon was foundin Mandir dighi pond.
RÉSUMÉ
Diversité des insectes aquatiques dans deux étangs des temples de Silchar, Assam, NEInde et leurs valeurs de conservation
Mots-clés :insecteaquatique,diversité,étang,Silchar
Une étude a été réalisée sur la diversité et la densité de la communauté d’in-sectes aquatiques dans les étangs de deux temples urbains Radhamadhav akhraet Mandir Dighi de la ville Silchar, Assam, Inde du Nord. Un total de 22 taxonsd’insectes aquatiques a été enregistré, 13 taxons dans l’étang Radhamadhavakhra et 18 taxons dans l’étang Mandir Dighi. 9 taxons ont été trouvés com-muns aux deux étangs. Dans l’étang Radhamadhav akhra la relation classiqueentre l’oxygène dissous et le dioxyde de carbone libre a été constatée avec unefaible concentration d’oxygène dissous et une concentration élevée de dioxydede carbone libre. L’analyse des coefficients de corrélation de Pearson a montréque le nombre de taxons est fortement corrélé avec la densité de taxons dans lesdeux étangs. L’analyse canonique des correspondances a révélé que pour l’étangRadhamadhav akhra, les valeurs propres étaient 0,784 pour l’axe 1 et 0,630 pour
(1) Department of Ecology and Environmental Science, Assam University, Silchar, Assam, 788011, India� Corresponding author: [email protected]
Article published by EDP Sciences
A. Dalal and S. Gupta: Knowl. Managt. Aquatic Ecosyst. (2014) 415, 09
l’axe 2 tandis que pour l’étang Mandir Dighi les valeurs propres étaient de 0,825pour l’axe 1 et 0,740 pour l’axe 2. La corrélation taxon-environnement a mon-tré que la communauté d’insectes aquatiques et les variables environnementalesétaient fortement corrélées dans les deux étangs. L’indice de diversité de Shannonde l’étang Radhamadhav akhra était de l’ordre de 1,5 à 1,7 et de l’ordre de 1,9−2,0dans l’étang Mandir Dighi. Selon le statut de dominance de l’échelle d’Engelmann,seulement Rhagovelia sp. a été trouvé eudominant dans l’étang Radhamadhavakhra. Aucun taxon eudominant n’a été trouvé dans l’étang Mandir Dighi.
INTRODUCTION
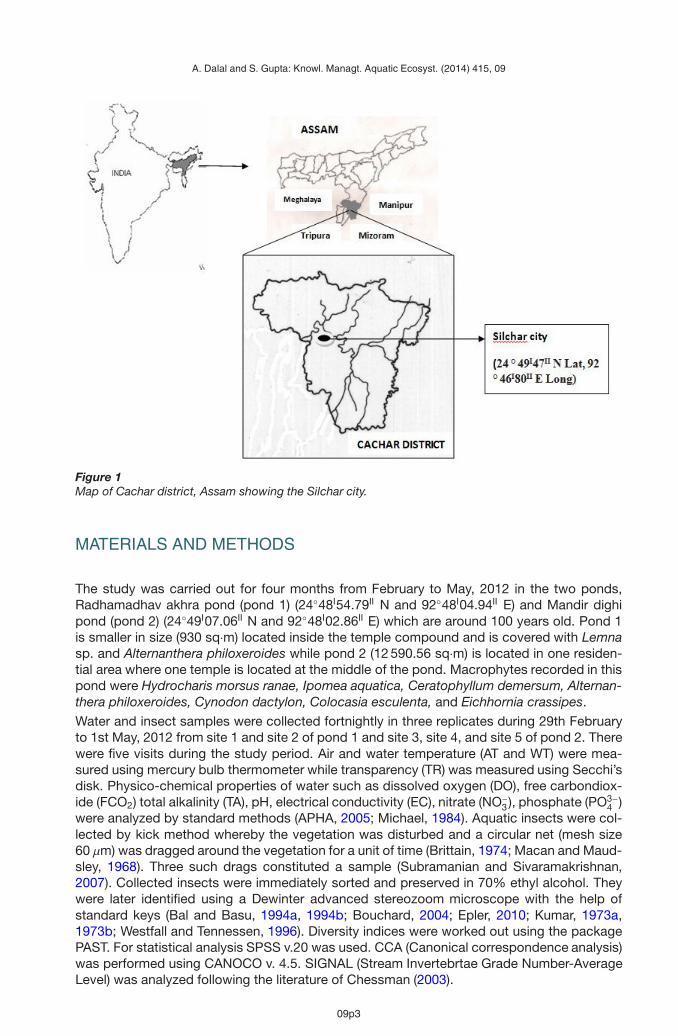
Water is treated as a service provided by ecosystems. Together with energy and nutrients,water is arguably the centerpiece for the delivery of eco-system services to humankind(Falkenmark and Folke, 2003). The Millennium Ecosystem Assessment defines ecosystemsas a dynamic complex of plant, animal and microorganism communities and their nonlivingenvironment interacting as a functional unit. Despite their importance, freshwater ecosystemsare rapidly being modified or destroyed (Allan and Flecker, 1993; Green et al., 2002) and manyspecies have consequently become endangered (Abellan et al., 2005; Duncan and Lockwood,2001; Perez-Losada et al., 2002). The global freshwater biodiversity crisis is most striking intropical Asia (Dudgeon, 2003). Among different fresh water ecosystems the ponds, reservoirsand lakes of urban areas are highly affected. While urbanized area accounts only for ∼1 to6 percent of the earth surface, cities appropriate a large share of earth’s carrying capacity interms of resource input and waste sinks. By the year 2030, more than 60 percent (4.9 billion)of the estimated world population (8.1 billion) will live in cities: 56.2 percent of the popula-tion of developing countries (3.88 billion) and 83.5 percent of that of the developed countries(1.01 billion) (UN, 1999). The world’s urban population will grow at an average annual rate of1.8 percent, nearly double the rate expected for the total population of the world (1 percentper year). Since human being depends on earth ecosystems for food, water, and other impor-tant products and services, changes in ecological conditions that result from human actionsin urban areas ultimately affect human health and well-being.In urban areas fresh water systems have been misused for many centuries. Urban develop-ment fragments, isolates and degrades natural habitats; simplifies and homogenizes speciescomposition; disrupts hydrological systems; and modifies energy flow and nutrient cycling(Alberti et al., 2003). Recent research, driven by the need to improve pond conservationstrategies (Biggs et al., 2005; McAbendroth et al., 2005), has started to shed interesting newlight on pond ecosystem structure and function. Despite their small size, they are collectivelyexceptionally rich in biodiversity terms (Williams et al., 2004).Silchar (24◦ 49I47II N Lat, 92◦ 46I80II E Long), a major city of south Assam and a district headquarter of Cachar, Assam, North east India is the principal commercial and health care centrefor the people of the three districts of South Assam, entire state of Mizoram, and parts ofManipur and Tripura (Figure 1). According to the 2001 census the population of Silchar mu-nicipality area was 1, 41, 041 with a decadal growth of 22.13%. As such there is increasingtrend of construction of multistoried building by draining and filling in the house hold ponds orcommunity ponds of the municipality areas which have been serving the locality so long. Atthis juncture in this city, ponds or freshwater ecosystems of only sacred places which are veryold and still vibrant with aquatic lives need to be conserved with utmost priority. The potentialof community based land and resource management systems to conserve biodiversity begunto be recognized by anthropologists, biologists, conservationists, environmentalists, and oth-ers only in the last two decades. Hence the objectives of this study were to investigate andcompare the aquatic insect diversity of two temple ponds, their water quality status and tofind out the role of these ponds in biodiversity conservation.
09p2
A. Dalal and S. Gupta: Knowl. Managt. Aquatic Ecosyst. (2014) 415, 09
Figure 1Map of Cachar district, Assam showing the Silchar city.
MATERIALS AND METHODS
The study was carried out for four months from February to May, 2012 in the two ponds,Radhamadhav akhra pond (pond 1) (24◦48I54.79II N and 92◦48I04.94II E) and Mandir dighipond (pond 2) (24◦49I07.06II N and 92◦48I02.86II E) which are around 100 years old. Pond 1is smaller in size (930 sq·m) located inside the temple compound and is covered with Lemnasp. and Alternanthera philoxeroides while pond 2 (12 590.56 sq·m) is located in one residen-tial area where one temple is located at the middle of the pond. Macrophytes recorded in thispond were Hydrocharis morsus ranae, Ipomea aquatica, Ceratophyllum demersum, Alternan-thera philoxeroides, Cynodon dactylon, Colocasia esculenta, and Eichhornia crassipes.Water and insect samples were collected fortnightly in three replicates during 29th Februaryto 1st May, 2012 from site 1 and site 2 of pond 1 and site 3, site 4, and site 5 of pond 2. Therewere five visits during the study period. Air and water temperature (AT and WT) were mea-sured using mercury bulb thermometer while transparency (TR) was measured using Secchi’sdisk. Physico-chemical properties of water such as dissolved oxygen (DO), free carbondiox-ide (FCO2) total alkalinity (TA), pH, electrical conductivity (EC), nitrate (NO−3 ), phosphate (PO3−
4 )were analyzed by standard methods (APHA, 2005; Michael, 1984). Aquatic insects were col-lected by kick method whereby the vegetation was disturbed and a circular net (mesh size60 µm) was dragged around the vegetation for a unit of time (Brittain, 1974; Macan and Maud-sley, 1968). Three such drags constituted a sample (Subramanian and Sivaramakrishnan,2007). Collected insects were immediately sorted and preserved in 70% ethyl alcohol. Theywere later identified using a Dewinter advanced stereozoom microscope with the help ofstandard keys (Bal and Basu, 1994a, 1994b; Bouchard, 2004; Epler, 2010; Kumar, 1973a,1973b; Westfall and Tennessen, 1996). Diversity indices were worked out using the packagePAST. For statistical analysis SPSS v.20 was used. CCA (Canonical correspondence analysis)was performed using CANOCO v. 4.5. SIGNAL (Stream Invertebrtae Grade Number-AverageLevel) was analyzed following the literature of Chessman (2003).
09p3
A. Dalal and S. Gupta: Knowl. Managt. Aquatic Ecosyst. (2014) 415, 09
RESULTS AND DISCUSSION
Urban ecosystems are highly dynamic and have usually been examined in terms of their im-pact on biodiversity (Adams, 1994; Gilbert, 1989; Middleton, 1994; Wackernagel and Rees,1996). The physico-chemical characteristics of any aquatic ecosystem and the nature anddistribution of its biota are directly related to and influenced by each other and controlled bya multiplicity of natural regulatory mechanisms (Bhat et al., 2009). Thus macro-invertebrateshave served as valuable indicators of degradation of aquatic ecosystems. According toWallace and Webster (1996) as there is increasing pressure on our water resources, macroin-vertebrates should be used for assessing the impact of pollution in aquatic ecosystems. Theycannot change their habitats quickly because of their less moving ability and they respond toany pollutants by changing their community composition (Turkmen and Kazanci, 2010).
> PHYSICO-CHEMICAL VARIABLES
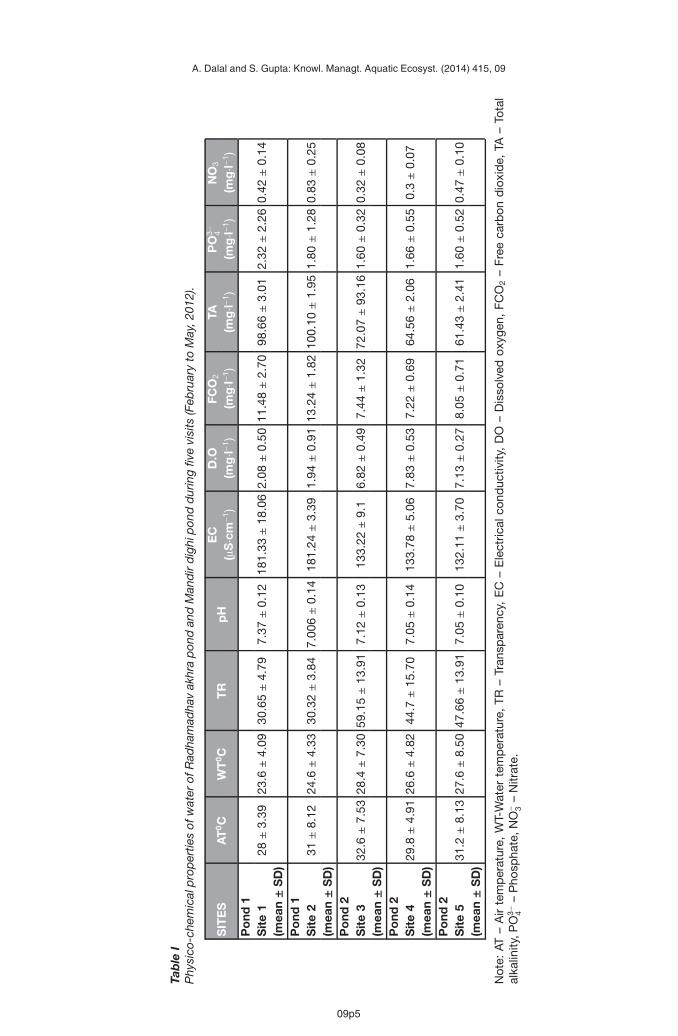
The physico-chemical variables of water of the two ponds did not show much fluctuationexcept DO concentration. The most striking feature of water of pond 1 is low DO (2.08 mg·l−1
in site 1 and 1.94 mg·l−1 in site 2) while in pond 2 DO is relatively high (6.82 mg·l−1 in site 3,7.83 mg·l−1 in site 4 and 7.13 mg·l−1 in site 5) (Table I). In both the ponds pH showed highly sig-nificant positive relationship with TR. In the pond 1 both diversity and density of insect taxashowed highly significant positive correlation with TR and significant negative relationshipwith TA. The pond is covered by Lemna sp. which obstructs penetration of light facilitatingmore amount of organic matter decomposition instead of photosynthesis. This is confirmedby very low DO, higher concentration of FCO2 compared to pond 2 and absence of its signifi-cant relationship with free CO2 (Table I). In pond 2 FCO2 showed significant negative relation-ship with TR, pH and DO. Significant classical negative correlation of DO with FCO2 showedthat photosynthesis was the main driver of DO production in the system. Significant positivecorrelation between DO and PO3−
4 could be due to the fact that high sunlight penetrationand PO3−
4 concentration increased phytoplankton in the pond which in turn produced moreDO. The significant positive relationship of pH with PO3−
4 is due to the fact that at high pH,phosphorus is released from sediment during summer (Brabrand et al., 1990) (Table II).
> AQUATIC INSECTS
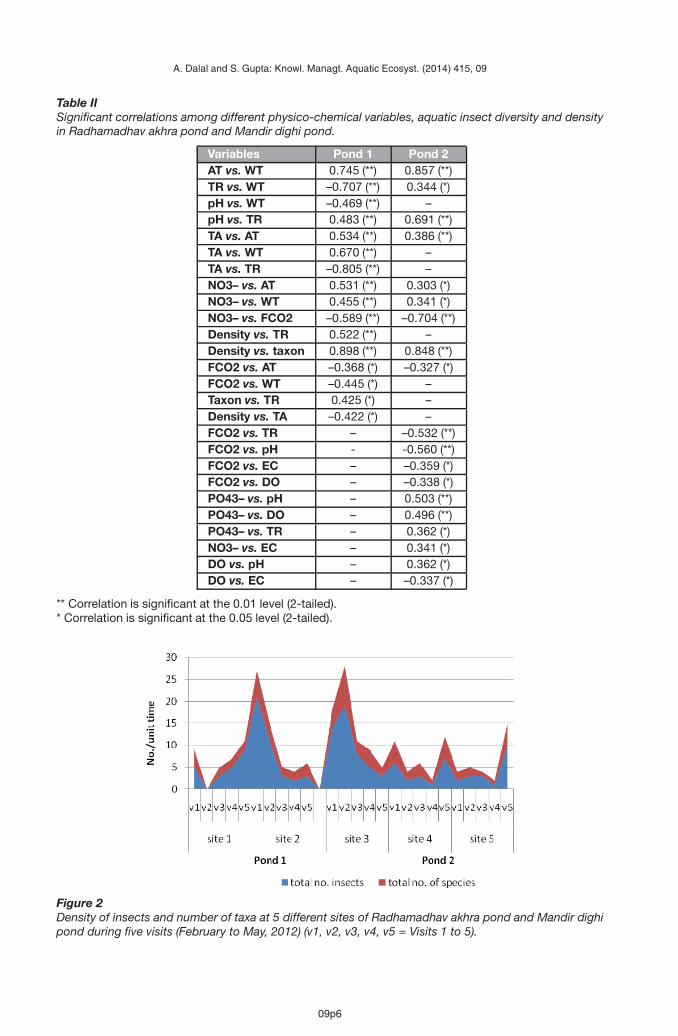
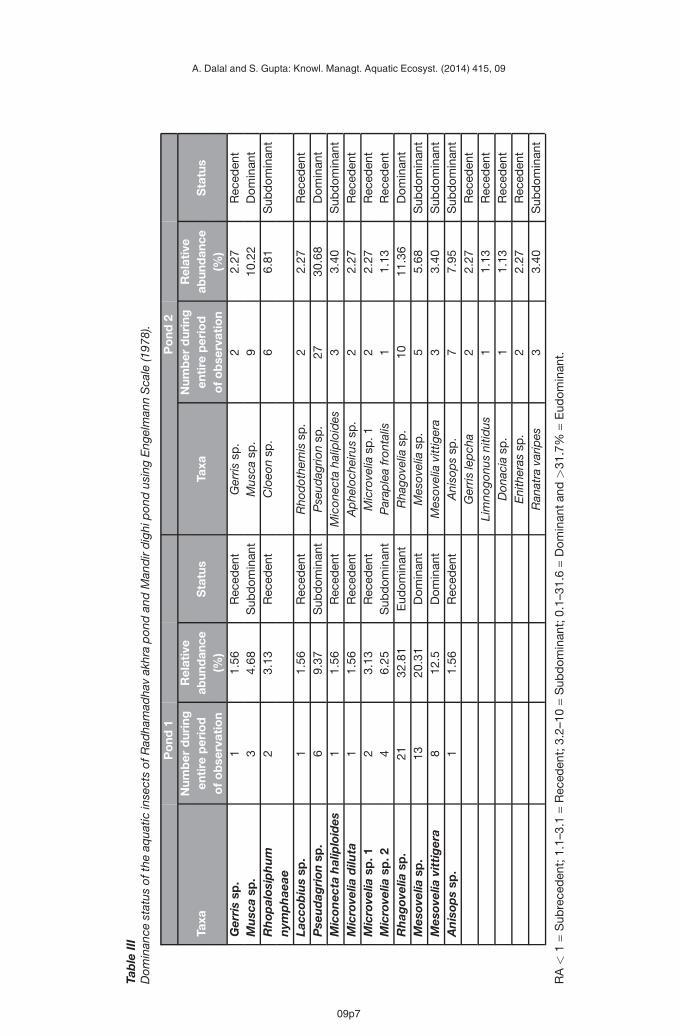
In both pond 1 and 2, insect density showed very high significance with the taxa richness(Table II). A total of thirteen taxa from pond 1 and eighteen taxa from pond 2 were recorded.The study revealed that though the density of insect was found highest in pond 1 (1st visit,site 2), the number of insect taxon was found highest in pond 2 (2nd visit, site 3) (Figure 2). Inpond 1 four aquatic insect orders (Hemiptera, Odonata, Diptera and Coleoptera) and in pond2 five orders (Hemiptera, Odonata, Diptera, Coleoptera, and Ephemeroptera) were recorded.Preponderance of order Hemiptera with very low DO in pond 1 could be explained by thefact that aquatic and semiaquatic Hemipterans do not rely heavily on DO in the water dueto their abilities to utilize atmospheric oxygen, by possessing respiratory apparatus (siphon,plastron, presence of hemoglobin etc.) (Fernando and Cheng 1974; Lansbury 1972; Thorpeand Crisp 1947; Thorpe 1950; Wells et al., 1981). In the lakes and rivers of North East Indiaalso preponderance of Hemiptera has been noted in several studies (Das and Gupta 2010;Gupta and Narzary 2013; Purkayastha and Gupta 2012, 2013; Takhelmayum and Gupta 2011).The dominance status according to Engelmann’s Scale (Engelmann, 1978) at pond 1 revealedRhagovelia sp. as eudominant taxon while Mesovelia sp. and Mesovelia vittigera as dominanttaxa. In contrast, at pond 2 no taxon was found eudominant (Table III). This is reflected inthe high Shannon diversity index values in all sites of pond 2 indicating taxon richness andevenness. This is further confirmed by their low Berger Parker index of Dominance value(Table IV).
09p4
A. Dalal and S. Gupta: Knowl. Managt. Aquatic Ecosyst. (2014) 415, 09
Tab
leI
Phy
sico
-che
mic
alp
rop
ertie
sof
wat
erof
Rad
ham
adha
vak
hra
pon
dan
dM
and
ird
ighi
pon
dd
urin
gfiv
evi
sits
(Feb
ruar
yto
May
,201
2).
SIT
ES
AT
0C
WT
0C
TR
pH
EC
D.O
FCO
2TA
PO
3− 4N
O3
(µS·cm
−1)
(mg·l−
1)
(mg·l−
1)
(mg·l−
1)
(mg·l−
1)
(mg·l−
1)
Po
nd1
Sit
e1
28±
3.39
23.6±
4.09
30.6
5±
4.79
7.37±
0.12
181.
33±
18.0
62.
08±
0.50
11.4
8±
2.70
98.6
6±
3.01
2.32±
2.26
0.42±
0.14
(mea
n±
SD
)P
ond
1S
ite
231±
8.12
24.6±
4.33
30.3
2±
3.84
7.00
6±
0.14
181.
24±
3.39
1.94±
0.91
13.2
4±
1.82
100.
10±
1.95
1.80±
1.28
0.83±
0.25
(mea
n±
SD
)P
ond
2S
ite
332
.6±
7.53
28.4±
7.30
59.1
5±
13.9
17.
12±
0.13
133.
22±
9.1
6.82±
0.49
7.44±
1.32
72.0
7±
93.1
61.
60±
0.32
0.32±
0.08
(mea
n±
SD
)P
ond
2S
ite
429
.8±
4.91
26.6±
4.82
44.7±
15.7
07.
05±
0.14
133.
78±
5.06
7.83±
0.53
7.22±
0.69
64.5
6±
2.06
1.66±
0.55
0.3±
0.07
(mea
n±
SD
)P
ond
2S
ite
531
.2±
8.13
27.6±
8.50
47.6
6±
13.9
17.
05±
0.10
132.
11±
3.70
7.13±
0.27
8.05±
0.71
61.4
3±
2.41
1.60±
0.52
0.47±
0.10
(mea
n±
SD
)
Not
e:AT
–A
irte
mp
erat
ure,
WT-
Wat
erte
mp
erat
ure,
TR–
Tran
spar
ency
,E
C–
Ele
ctric
alco
nduc
tivity
,D
O–
Dis
solv
edox
ygen
,FC
O2
–Fr
eeca
rbon
dio
xid
e,TA
–To
tal
alka
linity
,PO
3− 4–
Pho
spha
te,N
O− 3
–N
itrat
e.
09p5
A. Dalal and S. Gupta: Knowl. Managt. Aquatic Ecosyst. (2014) 415, 09
Table IISignificant correlations among different physico-chemical variables, aquatic insect diversity and densityin Radhamadhav akhra pond and Mandir dighi pond.
Variables Pond 1 Pond 2AT vs. WT 0.745 (**) 0.857 (**)TR vs. WT –0.707 (**) 0.344 (*)pH vs. WT –0.469 (**) –pH vs. TR 0.483 (**) 0.691 (**)TA vs. AT 0.534 (**) 0.386 (**)TA vs. WT 0.670 (**) –TA vs. TR –0.805 (**) –NO3– vs. AT 0.531 (**) 0.303 (*)NO3– vs. WT 0.455 (**) 0.341 (*)NO3– vs. FCO2 –0.589 (**) –0.704 (**)Density vs. TR 0.522 (**) –Density vs. taxon 0.898 (**) 0.848 (**)FCO2 vs. AT –0.368 (*) –0.327 (*)FCO2 vs. WT –0.445 (*) –Taxon vs. TR 0.425 (*) –Density vs. TA –0.422 (*) –FCO2 vs. TR – –0.532 (**)FCO2 vs. pH - -0.560 (**)FCO2 vs. EC – –0.359 (*)FCO2 vs. DO – –0.338 (*)PO43– vs. pH – 0.503 (**)PO43– vs. DO – 0.496 (**)PO43– vs. TR – 0.362 (*)NO3– vs. EC – 0.341 (*)DO vs. pH – 0.362 (*)DO vs. EC – –0.337 (*)
** Correlation is significant at the 0.01 level (2-tailed).* Correlation is significant at the 0.05 level (2-tailed).
Figure 2Density of insects and number of taxa at 5 different sites of Radhamadhav akhra pond and Mandir dighipond during five visits (February to May, 2012) (v1, v2, v3, v4, v5 = Visits 1 to 5).
09p6
A. Dalal and S. Gupta: Knowl. Managt. Aquatic Ecosyst. (2014) 415, 09
Tab
leIII
Dom
inan
cest
atus
ofth
eaq
uatic
inse
cts
ofR
adha
mad
hav
akhr
ap
ond
and
Man
dir
dig
hip
ond
usin
gE
ngel
man
nS
cale
(197
8).
Po
nd1
Po
nd2
Num
ber
dur
ing
Rel
ativ
eN
umb
erd
urin
gR
elat
ive
Taxa
enti
rep
erio
dab
und
ance
Sta
tus
Taxa
enti
rep
erio
dab
und
ance
Sta
tus
of
ob
serv
atio
n(%
)o
fo
bse
rvat
ion
(%)
Ger
ris
sp.
11.
56R
eced
ent
Ger
rissp
.2
2.27
Rec
eden
tM
usc
asp
.3
4.68
Sub
dom
inan
tM
usca
sp.
910
.22
Dom
inan
tR
hop
alos
iph
um
23.
13R
eced
ent
Clo
eon
sp.
66.
81S
ubd
omin
ant
nym
ph
aeae
Lacc
obiu
ssp
.1
1.56
Rec
eden
tR
hod
othe
mis
sp.
22.
27R
eced
ent
Pse
ud
agri
onsp
.6
9.37
Sub
dom
inan
tP
seud
agrio
nsp
.27
30.6
8D
omin
ant
Mic
onec
tah
alip
loid
es1
1.56
Rec
eden
tM
icon
ecta
halip
loid
es3
3.40
Sub
dom
inan
tM
icro
velia
dilu
ta1
1.56
Rec
eden
tA
phe
loch
eiru
ssp
.2
2.27
Rec
eden
tM
icro
velia
sp.1
23.
13R
eced
ent
Mic
rove
liasp
.12
2.27
Rec
eden
tM
icro
velia
sp.2
46.
25S
ubd
omin
ant
Par
aple
afr
onta
lis1
1.13
Rec
eden
tR
hag
ovel
iasp
.21
32.8
1E
udom
inan
tR
hago
velia
sp.
1011
.36
Dom
inan
tM
esov
elia
sp.
1320
.31
Dom
inan
tM
esov
elia
sp.
55.
68S
ubd
omin
ant
Mes
ovel
iavi
ttig
era
812
.5D
omin
ant
Mes
ovel
iavi
ttig
era
33.
40S
ubd
omin
ant
An
isop
ssp
.1
1.56
Rec
eden
tA
niso
ps
sp.
77.
95S
ubd
omin
ant
Ger
risle
pch
a2
2.27
Rec
eden
tLi
mno
gonu
sni
tidus
11.
13R
eced
ent
Don
acia
sp.
11.
13R
eced
ent
Eni
ther
assp
.2
2.27
Rec
eden
tR
anat
rava
ripes
33.
40S
ubd
omin
ant
RA
<1=
Sub
rece
den
t;1.
1–3.
1=
Rec
eden
t;3.
2–10=
Sub
dom
inan
t;0.
1–31
.6=
Dom
inan
tand
>31
.7%=
Eud
omin
ant.
09p7
A. Dalal and S. Gupta: Knowl. Managt. Aquatic Ecosyst. (2014) 415, 09
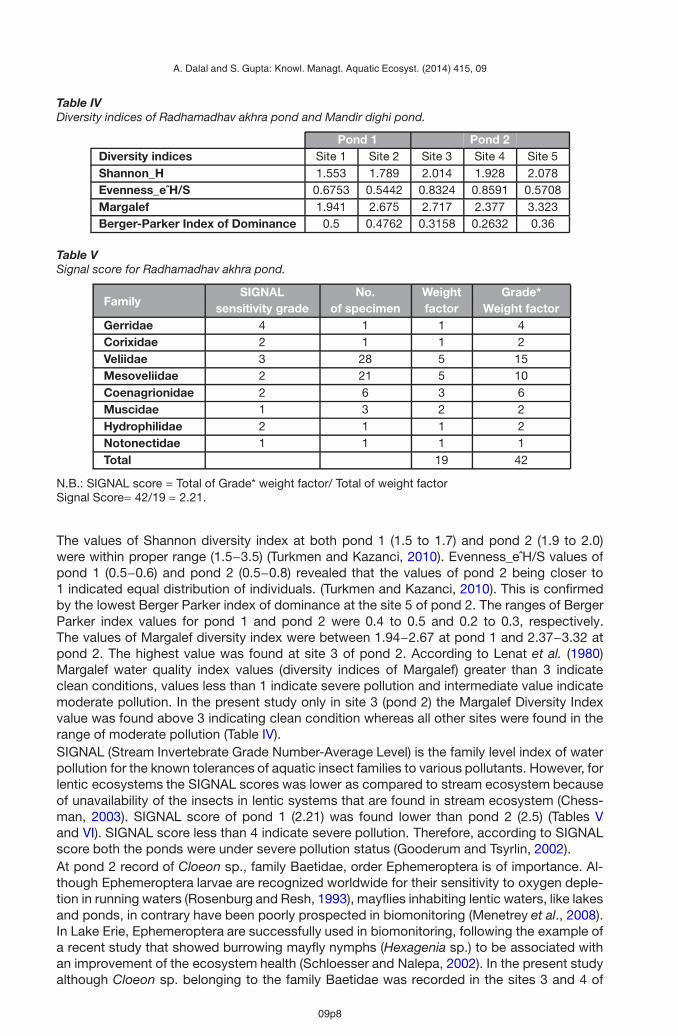
Table IVDiversity indices of Radhamadhav akhra pond and Mandir dighi pond.
Pond 1 Pond 2Diversity indices Site 1 Site 2 Site 3 Site 4 Site 5Shannon_H 1.553 1.789 2.014 1.928 2.078Evenness_eˆH/S 0.6753 0.5442 0.8324 0.8591 0.5708Margalef 1.941 2.675 2.717 2.377 3.323Berger-Parker Index of Dominance 0.5 0.4762 0.3158 0.2632 0.36
Table VSignal score for Radhamadhav akhra pond.
FamilySIGNAL No. Weight Grade*
sensitivity grade of specimen factor Weight factorGerridae 4 1 1 4Corixidae 2 1 1 2Veliidae 3 28 5 15Mesoveliidae 2 21 5 10Coenagrionidae 2 6 3 6Muscidae 1 3 2 2Hydrophilidae 2 1 1 2Notonectidae 1 1 1 1Total 19 42
N.B.: SIGNAL score = Total of Grade* weight factor/ Total of weight factorSignal Score= 42/19 = 2.21.
The values of Shannon diversity index at both pond 1 (1.5 to 1.7) and pond 2 (1.9 to 2.0)were within proper range (1.5−3.5) (Turkmen and Kazanci, 2010). Evenness_eˆH/S values ofpond 1 (0.5−0.6) and pond 2 (0.5−0.8) revealed that the values of pond 2 being closer to1 indicated equal distribution of individuals. (Turkmen and Kazanci, 2010). This is confirmedby the lowest Berger Parker index of dominance at the site 5 of pond 2. The ranges of BergerParker index values for pond 1 and pond 2 were 0.4 to 0.5 and 0.2 to 0.3, respectively.The values of Margalef diversity index were between 1.94−2.67 at pond 1 and 2.37−3.32 atpond 2. The highest value was found at site 3 of pond 2. According to Lenat et al. (1980)Margalef water quality index values (diversity indices of Margalef) greater than 3 indicateclean conditions, values less than 1 indicate severe pollution and intermediate value indicatemoderate pollution. In the present study only in site 3 (pond 2) the Margalef Diversity Indexvalue was found above 3 indicating clean condition whereas all other sites were found in therange of moderate pollution (Table IV).SIGNAL (Stream Invertebrate Grade Number-Average Level) is the family level index of waterpollution for the known tolerances of aquatic insect families to various pollutants. However, forlentic ecosystems the SIGNAL scores was lower as compared to stream ecosystem becauseof unavailability of the insects in lentic systems that are found in stream ecosystem (Chess-man, 2003). SIGNAL score of pond 1 (2.21) was found lower than pond 2 (2.5) (Tables Vand VI). SIGNAL score less than 4 indicate severe pollution. Therefore, according to SIGNALscore both the ponds were under severe pollution status (Gooderum and Tsyrlin, 2002).At pond 2 record of Cloeon sp., family Baetidae, order Ephemeroptera is of importance. Al-though Ephemeroptera larvae are recognized worldwide for their sensitivity to oxygen deple-tion in running waters (Rosenburg and Resh, 1993), mayflies inhabiting lentic waters, like lakesand ponds, in contrary have been poorly prospected in biomonitoring (Menetrey et al., 2008).In Lake Erie, Ephemeroptera are successfully used in biomonitoring, following the example ofa recent study that showed burrowing mayfly nymphs (Hexagenia sp.) to be associated withan improvement of the ecosystem health (Schloesser and Nalepa, 2002). In the present studyalthough Cloeon sp. belonging to the family Baetidae was recorded in the sites 3 and 4 of
09p8
A. Dalal and S. Gupta: Knowl. Managt. Aquatic Ecosyst. (2014) 415, 09
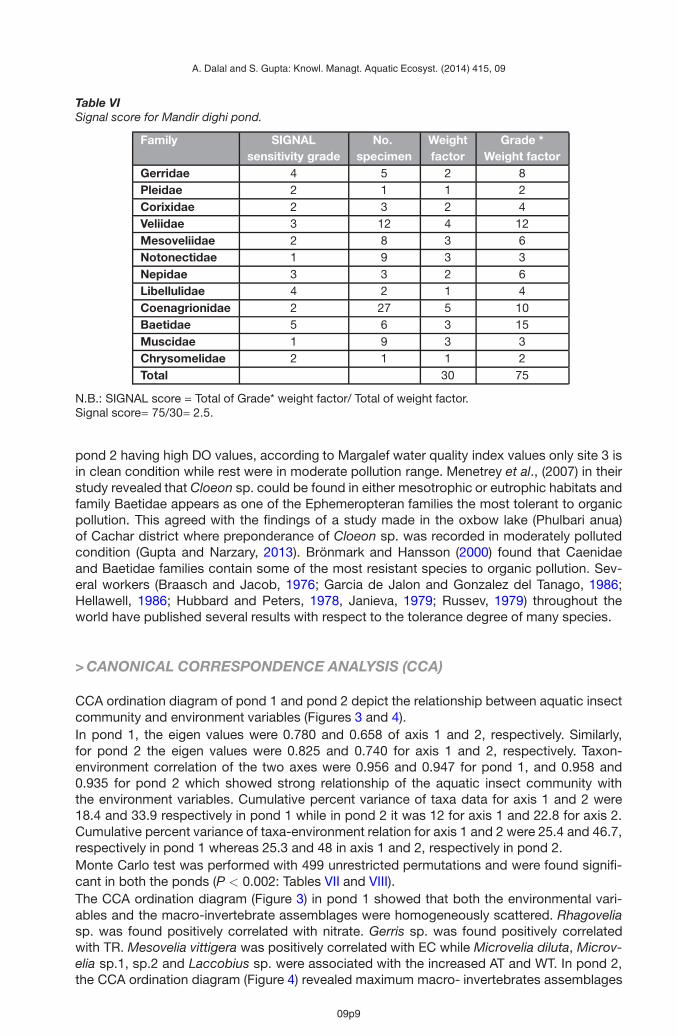
Table VISignal score for Mandir dighi pond.
Family SIGNAL No. Weight Grade *sensitivity grade specimen factor Weight factor
Gerridae 4 5 2 8Pleidae 2 1 1 2Corixidae 2 3 2 4Veliidae 3 12 4 12Mesoveliidae 2 8 3 6Notonectidae 1 9 3 3Nepidae 3 3 2 6Libellulidae 4 2 1 4Coenagrionidae 2 27 5 10Baetidae 5 6 3 15Muscidae 1 9 3 3Chrysomelidae 2 1 1 2Total 30 75
N.B.: SIGNAL score = Total of Grade* weight factor/ Total of weight factor.Signal score= 75/30= 2.5.
pond 2 having high DO values, according to Margalef water quality index values only site 3 isin clean condition while rest were in moderate pollution range. Menetrey et al., (2007) in theirstudy revealed that Cloeon sp. could be found in either mesotrophic or eutrophic habitats andfamily Baetidae appears as one of the Ephemeropteran families the most tolerant to organicpollution. This agreed with the findings of a study made in the oxbow lake (Phulbari anua)of Cachar district where preponderance of Cloeon sp. was recorded in moderately pollutedcondition (Gupta and Narzary, 2013). Brönmark and Hansson (2000) found that Caenidaeand Baetidae families contain some of the most resistant species to organic pollution. Sev-eral workers (Braasch and Jacob, 1976; Garcia de Jalon and Gonzalez del Tanago, 1986;Hellawell, 1986; Hubbard and Peters, 1978, Janieva, 1979; Russev, 1979) throughout theworld have published several results with respect to the tolerance degree of many species.
> CANONICAL CORRESPONDENCE ANALYSIS (CCA)
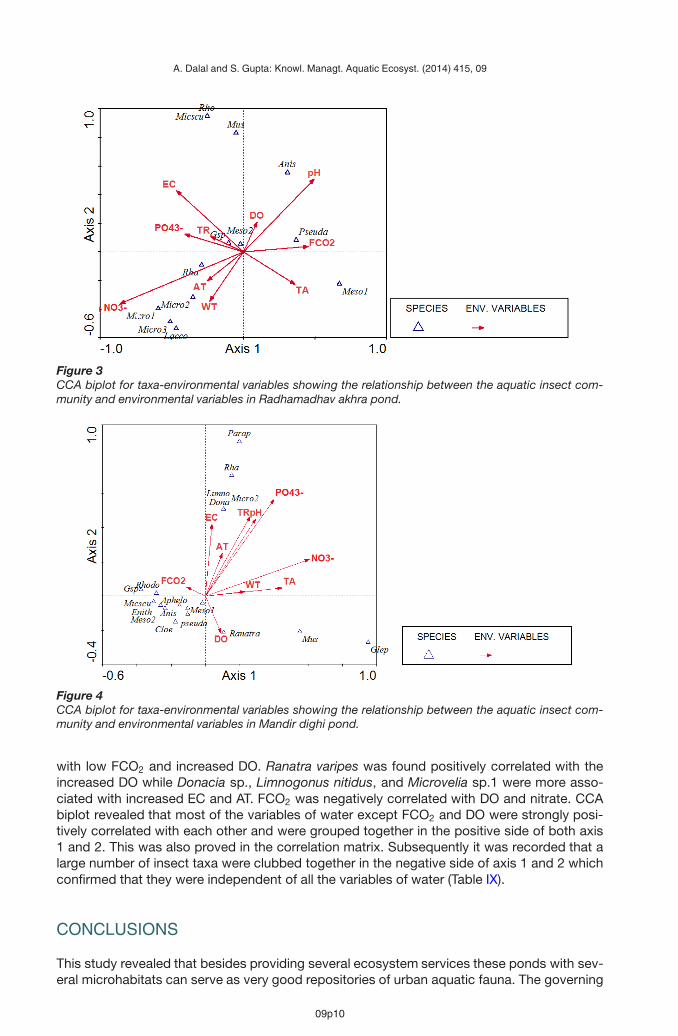
CCA ordination diagram of pond 1 and pond 2 depict the relationship between aquatic insectcommunity and environment variables (Figures 3 and 4).In pond 1, the eigen values were 0.780 and 0.658 of axis 1 and 2, respectively. Similarly,for pond 2 the eigen values were 0.825 and 0.740 for axis 1 and 2, respectively. Taxon-environment correlation of the two axes were 0.956 and 0.947 for pond 1, and 0.958 and0.935 for pond 2 which showed strong relationship of the aquatic insect community withthe environment variables. Cumulative percent variance of taxa data for axis 1 and 2 were18.4 and 33.9 respectively in pond 1 while in pond 2 it was 12 for axis 1 and 22.8 for axis 2.Cumulative percent variance of taxa-environment relation for axis 1 and 2 were 25.4 and 46.7,respectively in pond 1 whereas 25.3 and 48 in axis 1 and 2, respectively in pond 2.Monte Carlo test was performed with 499 unrestricted permutations and were found signifi-cant in both the ponds (P < 0.002: Tables VII and VIII).The CCA ordination diagram (Figure 3) in pond 1 showed that both the environmental vari-ables and the macro-invertebrate assemblages were homogeneously scattered. Rhagoveliasp. was found positively correlated with nitrate. Gerris sp. was found positively correlatedwith TR. Mesovelia vittigera was positively correlated with EC while Microvelia diluta, Microv-elia sp.1, sp.2 and Laccobius sp. were associated with the increased AT and WT. In pond 2,the CCA ordination diagram (Figure 4) revealed maximum macro- invertebrates assemblages
09p9
A. Dalal and S. Gupta: Knowl. Managt. Aquatic Ecosyst. (2014) 415, 09
Figure 3CCA biplot for taxa-environmental variables showing the relationship between the aquatic insect com-munity and environmental variables in Radhamadhav akhra pond.
Figure 4CCA biplot for taxa-environmental variables showing the relationship between the aquatic insect com-munity and environmental variables in Mandir dighi pond.
with low FCO2 and increased DO. Ranatra varipes was found positively correlated with theincreased DO while Donacia sp., Limnogonus nitidus, and Microvelia sp.1 were more asso-ciated with increased EC and AT. FCO2 was negatively correlated with DO and nitrate. CCAbiplot revealed that most of the variables of water except FCO2 and DO were strongly posi-tively correlated with each other and were grouped together in the positive side of both axis1 and 2. This was also proved in the correlation matrix. Subsequently it was recorded that alarge number of insect taxa were clubbed together in the negative side of axis 1 and 2 whichconfirmed that they were independent of all the variables of water (Table IX).
CONCLUSIONS
This study revealed that besides providing several ecosystem services these ponds with sev-eral microhabitats can serve as very good repositories of urban aquatic fauna. The governing
09p10
A. Dalal and S. Gupta: Knowl. Managt. Aquatic Ecosyst. (2014) 415, 09
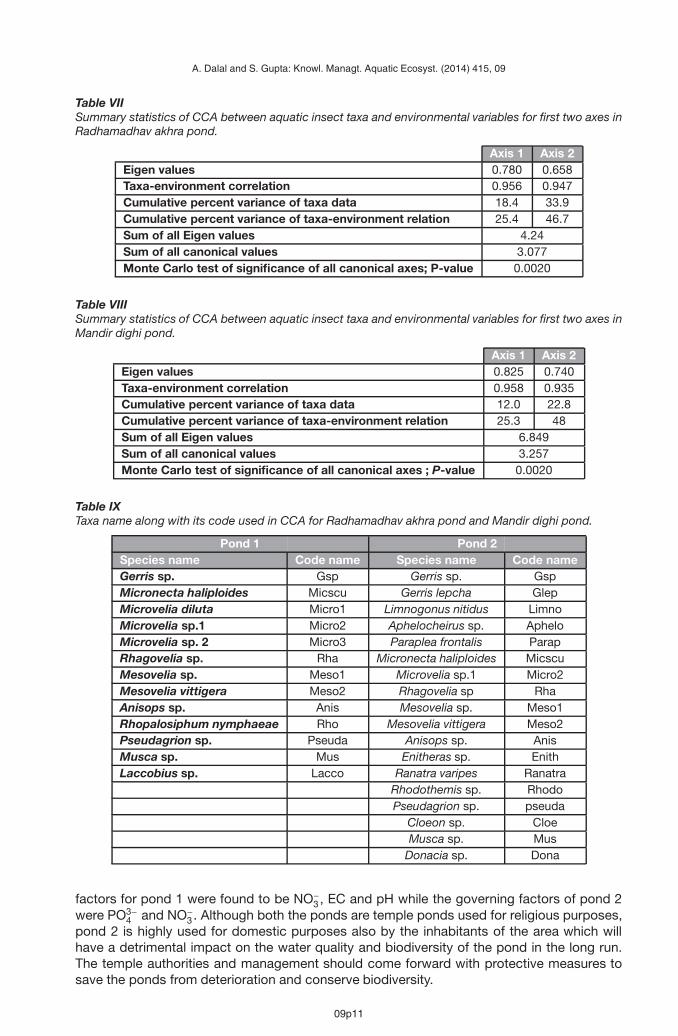
Table VIISummary statistics of CCA between aquatic insect taxa and environmental variables for first two axes inRadhamadhav akhra pond.
Axis 1 Axis 2Eigen values 0.780 0.658Taxa-environment correlation 0.956 0.947Cumulative percent variance of taxa data 18.4 33.9Cumulative percent variance of taxa-environment relation 25.4 46.7Sum of all Eigen values 4.24Sum of all canonical values 3.077Monte Carlo test of significance of all canonical axes; P-value 0.0020
Table VIIISummary statistics of CCA between aquatic insect taxa and environmental variables for first two axes inMandir dighi pond.
Axis 1 Axis 2Eigen values 0.825 0.740Taxa-environment correlation 0.958 0.935Cumulative percent variance of taxa data 12.0 22.8Cumulative percent variance of taxa-environment relation 25.3 48Sum of all Eigen values 6.849Sum of all canonical values 3.257Monte Carlo test of significance of all canonical axes ; P-value 0.0020
Table IXTaxa name along with its code used in CCA for Radhamadhav akhra pond and Mandir dighi pond.
Pond 1 Pond 2Species name Code name Species name Code nameGerris sp. Gsp Gerris sp. GspMicronecta haliploides Micscu Gerris lepcha GlepMicrovelia diluta Micro1 Limnogonus nitidus LimnoMicrovelia sp.1 Micro2 Aphelocheirus sp. ApheloMicrovelia sp. 2 Micro3 Paraplea frontalis ParapRhagovelia sp. Rha Micronecta haliploides MicscuMesovelia sp. Meso1 Microvelia sp.1 Micro2Mesovelia vittigera Meso2 Rhagovelia sp RhaAnisops sp. Anis Mesovelia sp. Meso1Rhopalosiphum nymphaeae Rho Mesovelia vittigera Meso2Pseudagrion sp. Pseuda Anisops sp. AnisMusca sp. Mus Enitheras sp. EnithLaccobius sp. Lacco Ranatra varipes Ranatra
Rhodothemis sp. RhodoPseudagrion sp. pseuda
Cloeon sp. CloeMusca sp. Mus
Donacia sp. Dona
factors for pond 1 were found to be NO−3 , EC and pH while the governing factors of pond 2were PO3−
4 and NO−3 . Although both the ponds are temple ponds used for religious purposes,pond 2 is highly used for domestic purposes also by the inhabitants of the area which willhave a detrimental impact on the water quality and biodiversity of the pond in the long run.The temple authorities and management should come forward with protective measures tosave the ponds from deterioration and conserve biodiversity.
09p11

A. Dalal and S. Gupta: Knowl. Managt. Aquatic Ecosyst. (2014) 415, 09
ACKNOWLEDGEMENTS
The authors would like to acknowledge the Head, Prof. Jayashree Rout, Ph.D, Departmentof Ecology and Environmental Science, Assam University, Silchar, Assam, India for providinglaboratory facilities.
REFERENCES
Abellan P., Sanchez-Fernandez D., Velasco J. and Millan A., 2005. Assessing conservation priorities forinsects: status of water beetles in southeast Spain. Biol. Conserv., 12, 79–90.
Adams L.W., 1994. Urban Wildlife Habitats: A Landscape Perspective, Mineapolis, MN, University ofMinnesota Press.
Alberti M., Marzluff J., Shulenberger E., Bradley G., Ryan C. and ZumBrunnen C., 2003. Integratinghumans into ecology: Opportunities and challenges for studying urban ecosystems. Bioscience,53, 1169–79.
Allan J.D. and Flecker A.S., 1993. Biodiversity conservation in running waters. BioScience, 43, 32–43.
APHA, 2005. Standard methods for the Examination of Water and Wastewater, 21st edn., Washington,D.C. USA.
Bal A. and Basu R.C., 1994a. Insecta: Hemiptera: Mesovelidae, Hydrometridae, Veliidae and Gerridae.In: State fauna Series 3: Fauna of West Bengal. Part 5, Zoological Survey of India, Culcutta,511−534.
Bal A. and Basu R.C., 1994b. Insecta: Hemiptera: Belostomatidae, Nepidae, Notonectidae and Pleidae.In: State fauna Series 3: Fauna of West Bengal. Part 5, Zoological Survey of India, Culcutta,535−558.
Bhat M.M., Yazdani T., Narain K., Yunus M. and Shukla R.N., 2009. Water Quality Status of Some UrbanPonds of Lucknow, Uttar Pradesh. J. Wetlands Ecology, 2, 67–73.
Biggs J., Williams P., Whitfield M., Nicolet P. and Weatherby A., 2005. 15 years of pond assessmentin Britain: results and lessons learned from the work of Pond Conservation. Aquat. Conserv. Mar.Freshw. Ecosyst., 15, 693–714.
Bouchard R.W., Jr., 2004. Guide to Aquatic Invertebrates of the Upper Midwest. Water ResourcesCenter, University of Minnesota, St. Paul, MN, 208.
Braasch D. and Jacob U., 1976. Die Verwendung von Ephemeropteren (Insecta) der DDR als indicatorenfur die Wassergiitte. Entomologische Nachrichten, 20, 101–109.
Brabrand A.F., Faafeng B. and Nilssen J.P.M., 1990.Relative importance of phosphorus supply to phy-toplankton production, fish excretion versus external loading. Canadian J. Fish. Aquat. Sci., 47,364–372.
Brittain J.E., 1974. Studies on the lentic Ephemeroptera and Plecoptera of Southern Norway. NorskEntomologisk Tidsskrift, 21, 135–151.
Brönmark C. and Hansson L.A., 2000. Chemical communication in aquatic systems: an introduction.Oikos, 88, 103–111.
Chessman B.C., 2003. New sensitivity grades for Australian river macroinvertebrates. Marine Freshw.Res., 54, 95–103.
Das K. and Gupta S., 2010. Aquatic Hemiptera Community of Agricultural Fields and Rain Pools inCachar District, Assam, North East India. Assam University Journal of Science & Technology: Biol.Sci., 5, 123–128.
Dudgeon D., 2003. The contribution of scientific information to the conservation and management offreshwater biodiversity in tropical Asia. Hydrobiologia, 500, 295–314.
Duncan J.R. and Lockwood J.L., 2000. Extinction in a field of bullets: a search for causes in the declineof the world’s freshwater fishes. Biol. Conserv., 102, 97–105.
Engelmann H.D., 1978. Zur Dominanzklassifikazierung von Bodenarthropoden. Pedobilogia, 18,378−380.
Epler J.H., 2010. The Water Beetles of Florida- an identification manual for the families Chrysomelidae,Curculionidae, Dryopidae, Dytiscidae, Elmidae, Gyrinidae, Haliplidae, Helophoridae, Hydraenidae,Hydrochidae, Hydrophilidae, Noteridae, Psephenidae, Ptilodactylidae and Scirtidae. FloridaDepartment of Environmental Protection, Tallahassee, FL. 399 + iv p.
09p12
A. Dalal and S. Gupta: Knowl. Managt. Aquatic Ecosyst. (2014) 415, 09
Falkenmark M. and Folke C., 2003. Theme issue: Freshwater and welfare fragility: Syndromes, vulnera-bilities and challenges, Royal Society’s Philosophical Transactions B Biology, 358, 1440.
Fernando C.H. and Cheng L., 1974. A preliminary study on the fauna and distribution of aquaticHemiptera in Malaya and Singapore. Federation Museums J., 19, 21–46.
Garcia de Jalon D. and Gonzalez del Tanago M., 1986. MetodosBiologicos para el Estudio de la Calidadde las Aguas. Aplicacion a la Cuenca del Duero, ICONA, Madrid, 241 p.
Gilbert O.L., 1989. The Ecology of Urban Habitats. Chapman & Hall, New York, 369 p.
Gooderum J. and Tsyrlin E., 2002. The Waterbug book, A guide to the Freshwater Macro-invertebratesof Temperate Australia, CSIRO Publishing, Collingwood Vic.
Green A.J., El Hamzaoui M., El Agbani M.A. and Franchimont J., 2002. The conservation status ofMoroccan wetlands with particular reference to waterbirds and to changes since 1978. Biol.Conserv., 104, 71–82.
Gupta S. and Narzary R., 2013. Aquatic insect community of lake, Phulbari anua of Cachar, Assam. J.Environ. Biol., 34, 591–597.
Hellawell J., 1986. Biological Indicators of Freshwater Pollution and Environmental Management.Elsevier Applied Science Publ, London and New York.
Hubbard M.D. and Peters W.L., 1978. Environmental requirements and pollution tolerance ofEphemeroptera.EPA 600-4-78-061 U.S. Environmental Protection Agency, Cincinnati, OH, VI.
Janieva I., 1979. Einigevertreter der Gattung Baetes (Ephemeroptera) als Limnosaprobe bioindikatoren.In: Pasternak K. and Sowa R. (eds.), Proceedings of the second International Conference onEphemeroptera, Warsaw and Krakow: Panstwowe Wydawnictwo naudkowe, 139–143.
Kumar A., 1973a. Descriptions of the last instar larvae of odonata from the Dehra Dun Valley (India), withnotes on biology I (Suborder: Zygoptera). Oriental Insects, 7, 23–61.
Kumar A., 1973b. Descriptions of the last instar larvae of Odonata from the Dehra Dun Valley (India),with notes on biology I I. (Suborder: Anisoptera). Oriental Insects, 7, 291–331.
Lansbury I., 1972. A revision of the genus Telmatotrephes Stal (Hemiptera – Heteroptera, Nepidae).Zoologica Scripta, 1, 271–286.
Lenat D.R., Smock L.A. and Penrose D.L., 1980. Use of benthic macroinvertebrates as Indicators ofEnvironmental Quality. In: Douglass L.W. (ed.), Biological Monitoring for Environmental Effects,Lexington books, Toronto, 97–114.
Macan T. T and Maudsley R., 1968. The insects of the stony substratum of Windermere. Transaction ofthe Society for British Entomology, 18, 1–18.
McAbendroth L., Foggo A., Rundle S.D. and Bilton D.T., 2005. Unravelling nestedness and spatial pat-tern in pond assemblages. J. Anim. Ecology, 74, 41–49.
Menetrey N., Oertli B., Sartori M., Wagner A. and Lachavanne J.B., 2008. Eutrophication: are mayflies(Ephemeroptera) good indicators for ponds? Hydrobiologia, 597, 125–135.
Michael P., 1984. Ecological Methods for Field and Laboratory Investigation. Tata Mc. Graw-Hill pub-lishing Company Ltd., New Delhi, 434 p.
Middleton J., 1994. Effects of urbanization on biodiversity in Canada. In: Biodiversity in Canada: AScience Assessment for Environment Canada. Environment Canada, Ottawa, 15–20.
Perez-Losada M., Jara C.G., Bond-Buckup G. and Crandall K.A., 2002. Conservation phylogeneticsof Chilean freshwater crabs Aegla (Anomura, Aeglidae): assigning priorities for aquatic habitatprotection. Biol. Conserv., 105, 345–353.
Purkayastha P. and Gupta S., 2012. Insect Diversity and Water Quality Parameters of Two Ponds ofChatla Wetland, Barak Valley, Assam. Curr. World Environ., 7, 243–250.
Purkayastha P. and Gupta S., 2013. Estimating ecosystem health of shallow water pond in lowerIrongmara, Barak Valley, Assam, India, using ASPT, SPI and BMWP score. Int. Res. J. Biol. Sci., 2,1–4.
Rosenberg D.M. and Resh V.H., 1993. Freshwater biomonitoring and benthic invertebrates. Chapmanand Hall publication, New York, 488 p.
Russev B.K., 1979. Die anpassunsfahigkeit der ephemeropteren and die Verunreiningung der Gewasserun die Moglichkeit ihrer ausnutzung als Limnosaprobe Bioindikatoren. In: Pasternak K. and SowaR. (eds.), Proceedings of the second International Conference on Ephemeroptera, Warsaw andKrakow: Panstwowe Wydawnictwo Naudkowe, pp. 145–149.
09p13
A. Dalal and S. Gupta: Knowl. Managt. Aquatic Ecosyst. (2014) 415, 09
Schloesser D.W. and Nalepa T.F., 2002. Comparison of 5 benthic samplers to collect burrowing mayflynymphs (Hexageniaspp: Ephemeroptera: Ephemeridae) in sediments of the Laurentian GreatLakes. J. N. Amer. Benthol. Soc., 21, 487–501.
Subramanian K.A. and Sivaramakrishnan K.G., 2007. Aquatic Insects for Biomonitoring FreshwaterEcosystems – A Methodology Manual. Asoka Trust for Research in Ecology and Environment(ATREE), Bangalore, India, 31 p.
Takhelmayum K. and Gupta S., 2011. Distribution of aquatic insects in phumdis (floating island) of LoktakLake, Manipur, northeastern India. J. Threatened Taxa, 3, 1856–1861.
Thorpe W.H., 1950. Plastron respiration in aquatic insects. Biological Reviews of the CambridgePhilosophical Society, 25, 344–390.
Thorpe W.H. and Crisp D.J., 1947. Studies on plastron respiration. I. The biology of Aphelocheirus(Hemiptera, Aphelocheiridae) and the mechanism of plastron retension. J. Exp. Biol., 24, 227–270.
Turkmen G. and Kazanci N., 2010. Applications of various biodiversity indices to benthic macroinverte-brate assemblages in streams of a national park in Turkey. Rev. Hydrobiol., 3, 111–125.
United Nations, 1999. The State of World Population 1999–1996 Billion: A Time for Choices. UnitedNations Population Fund, New York.
Wackernagel M. and Rees W., 1996. Our Ecological Footprint: Reducing Human Impact on the Earth.The New Catalyst Bioregional Series, New Society Publishers, 160 p.
Wallace J.B. and Webster J.R., 1996. The role of macro-invertebrates in stream ecosystem function.Annual Rev. Entomol., 41, 115–139.
Wells R.M.G., Hudson M.J.Q. and Brittain T., 1981. Function of the haemoglobin and the gas bubble inthe backswimmer Anisops assimilis (Hemiptera, Notonectidae). J. Comparative Physiology, 142,515–522.
Westfall M.J. and Tennessen K.J., 1996. Odonata. In: Merrit, R. and Cummins., (eds), An Introductionto the Aquatic Insects of North America, 3rd edn., Kendall-Hunt Publishing Co., Dubuque, IA,164−211.
Williams P., Whitfield M., Biggs J., Bray S., Fox G., Nicolet P. and Sear D., 2004. Comparative biodiversityof rivers, streams, ditches and ponds in an agricultural landscape. Biol. Conserv., 115, 329–341.
09p14