aquatic macroinvertebrates as an indicator of water quality after an
TRANSCRIPT

Sean Meyrick W2922701. S216 2005 TMA05 1
Aquatic macroinvertebrates as an
indicator of water quality after an
incident of organic pollution in the
Bourne Stream, Dorset
A S216 Environmental Science, Open University Project
By Sean Meyrick

Sean Meyrick W2922701. S216 2005 TMA05 2
Contents
Page 2 Contents Page 3 Title and Introduction Page 7 Materials and Method Page 9 Results Page 13 Conclusion Page 15 References Page 17 Appendices

Sean Meyrick W2922701. S216 2005 TMA05 3
Title
Aquatic macroinvertebrates as an indicator of water quality after an incident of
organic pollution in the Bourne Stream, Dorset.
Introduction The Bourne stream runs for approximately 7km from Canford Heath before
discharging into the sea at Bournemouth.1 The Middle and lower reaches flow through
urbanised areas of housing and light industry. Urbanisation reduces the permeable
surface area available for infiltration and drainage, increasing surface runoff.
N
Fig 1. A map of the Bourne Stream, Dorset from its source to discharge points on Bournemouth Beach.2

Sean Meyrick W2922701. S216 2005 TMA05 4
Surface runoff can contain heavy metals, chloride from road salting and organic
materials. Organic compounds are materials derived from living or once-living
organisms. This includes carbohydrates, proteins and fats produced by the hydrolysis
of organic waste, petrochemical residues i.e. oil and petrol and other agricultural,
industrial and domestic effluents.
Oxygen is necessary for aerobic processes such as growth and reproduction. Increased
organic pollutants reduce oxygen levels due to increased biological Oxygen demand
(BOD); a generic term for the oxygen requiring activities of aquatic organisms.
Oxygen is removed from the water, as organic materials are oxidised by biological
processes. These include conversion of ammonia to nitrates, decomposition reactions
and microbial respiration. Maintaining oxygen levels is an essential factor in keeping
water clean. Low O2 levels reduce the capacity for a body of water to clean itself.
Increased organic content reduces ambient oxygen levels immediately downstream of
a pollution point. As BOD increases, oxygen level drop i.e. there is an inverse
relationship between BOD and oxygen concentration. As the stream flows away from
the incident, organic levels decrease. They settle as sediment, become diluted or are
processed by bacteria to less noxious substances. For example ammonia, produced by
decaying organic waste, is oxidised to less toxic nitrites and nitrates by nitrosomonas
and nitrobacter bacteria3. As pollutants decrease BOD consumes less oxygen and
ambient O2 levels return to normal.

Sean Meyrick W2922701. S216 2005 TMA05 5
Freshwater macroinvertebrates are defined as animals without backbones that are
visible to the naked eye. They are ideal indicators of long-term water quality due to
their relative longevity and long term residence in the stream.
Invertebrate families exhibit different sensitivities to organic pollution, specifically
the resultant low oxygen levels, a characteristic that makes them effective water
quality indicators. Each family is are assigned a biotic score between 1 and 10
according to this tolerance with no weighting given to the relative abundance of
individual organisms. Pollutant intolerant species like mayflies are assigned a high
score, tolerant organisms like worms a low score and shrimps, an intermediate
organism a mid range score. (Fig 2) The definite biotic score is the Biological
Monitoring Working Party (BMWP)4 (Appendix 1)
Stone fly larvae (Capniidae) 10 fresh water shrimp (Gammariidae) 6
Flat worms (planaria) 1 Roundworms (nematodes) 1
Fig 2. Examples of aquatic macro invertebrates with their BMWP score in bold. Image source5

Sean Meyrick W2922701. S216 2005 TMA05 6
This project will analyse pollution tolerances of invertebrates to assess the
environmental impact of organic runoff from a road bridge. The reach the Branksome
Wood Road Grid reference SZ068921 and Prince of Wales Road Grid reference
SZ073917 (fig3) will be analysed. At both sites the potential for rapid and sustained
runoff is increased due to the steep nature of the topography where the roads runs up
and down the valley, either side of the stream.
The abundance of pollutant intolerant invertebrates is expected to increase relative to
the distance away from the point of pollution
The project will test the hypothesis that -
“Organic pollution reduces the aquatic macroinvertebrate diversity of a stream
Branksome wood road (SZ068921)
N
Prince of Wales Road (SZ073917)
Fig 3. A detailed map of the project area. From the upstream Branksome Wood Road bridge to the down stream Prince of Wales Road bridge.6

Sean Meyrick W2922701. S216 2005 TMA05 7
Materials and Method
Data was collected on the 25th June 2005.
Invertebrate populations were sampled using a standard 3-minute kick-sampling
regime.7 A flat-bottomed net, mesh size 1mm, was used. The head was placed firmly
on the substrate to ensure all invertebrates were trapped. The substrate was agitated
vigorously by foot upstream of the net trapping any dislodged invertebrates. To
standardise the test the substrate in each sample was agitated for three minutes. The
net contents were emptied into a white tray to aid identification. Invertebrates were
identified in situ with the aid of a hand lens to family level. All samples were released
back to the stream.
A point 5m upstream of the Branksome Road Bridge was sampled. An assumption
was made that this upstream point was pollution free. The invertebrate diversity at this
point provided a control biotic index.
Immediately after the bridge the stream flows along a concrete channel. It was
decided that this lack of natural substrate could influence the result. The first sample
was therefore taken 40m downstream of the bridge where the natural stream substrate
started. Sites were sampled downstream of this point at 50m intervals with the
following exceptions.
Site E- There were access problems so samples was taken at the nearest accessible
point upstream.

Sean Meyrick W2922701. S216 2005 TMA05 8
Site G – Rocks present in this section created turbulence in the stream. Turbulence
increases the surface area of a stream and hence the oxygen content of water due to
surface diffusion. As no other sample point was affected by turbulence this could
affect the results. A point 5m upstream was sampled where there was no visible
turbulence.
To enable an average score to be calculated three separate samples were taken at each
site, one mid stream with the other two 25cm from each bank.
The following parameters were recorded at each site. Water temperature, water depth
and stream width. (Appendix 2). Water Temperature was measured with a hand held
thermometer placed midstream for 60 seconds. Water depth was measured at the mid
stream point and the stream width between the top surfaces of each bank.
A second control sample was made after the second road bridge using the same methodology.
Sean Meyrick W2922701. S216 2005 TMA05 9
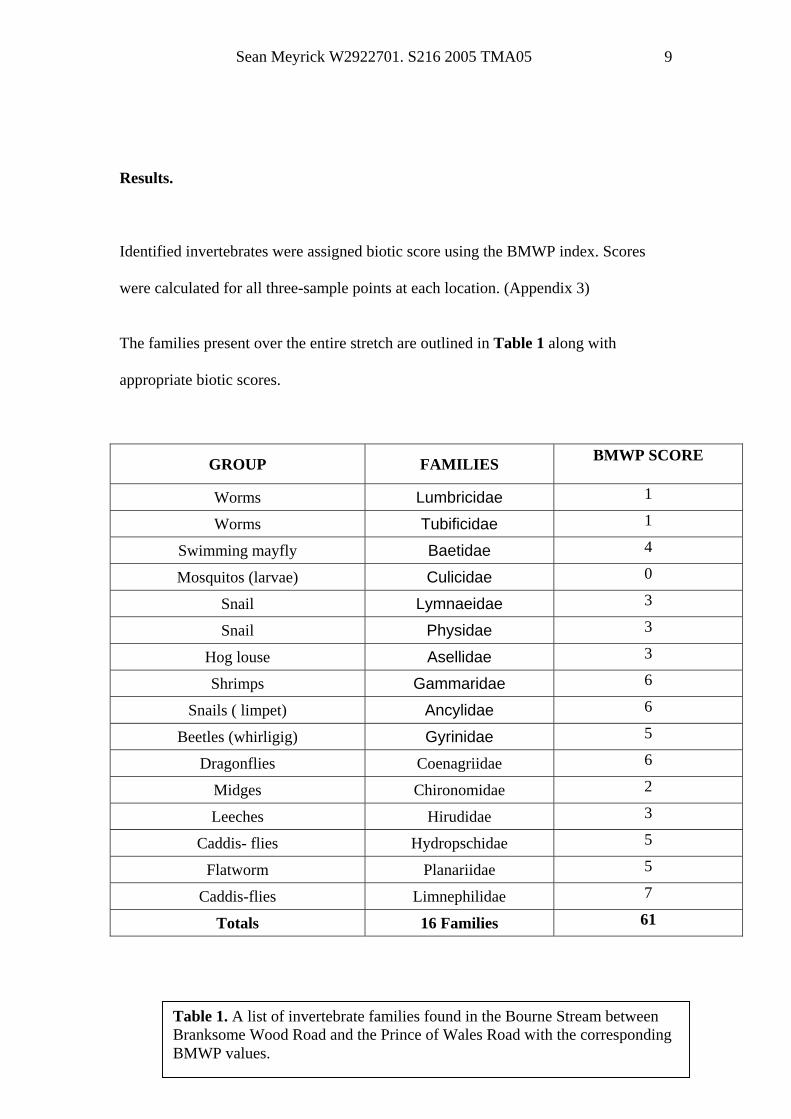
Results.
Identified invertebrates were assigned biotic score using the BMWP index. Scores
were calculated for all three-sample points at each location. (Appendix 3)
The families present over the entire stretch are outlined in Table 1 along with
appropriate biotic scores.
GROUP FAMILIES BMWP SCORE
Worms Lumbricidae 1
Worms Tubificidae 1
Swimming mayfly Baetidae 4
Mosquitos (larvae) Culicidae 0
Snail Lymnaeidae 3
Snail Physidae 3
Hog louse Asellidae 3
Shrimps Gammaridae 6
Snails ( limpet) Ancylidae 6
Beetles (whirligig) Gyrinidae 5
Dragonflies Coenagriidae 6
Midges Chironomidae 2
Leeches Hirudidae 3
Caddis- flies Hydropschidae 5
Flatworm Planariidae 5
Caddis-flies Limnephilidae 7
Totals 16 Families 61
Table 1. A list of invertebrate families found in the Bourne Stream between Branksome Wood Road and the Prince of Wales Road with the corresponding BMWP values.

Sean Meyrick W2922701. S216 2005 TMA05 10
The average BMWP scores were calculated for each sample site. (Table 2)
Site Distance from Road Bridge/Meters
Average BMWP Score
Control - 5 m 25
A 40 9
B 100 10
C 150 10
D 200 13
E 245 21
F 300 15
G 345 18
H 400 16
I 450 19
J 500 16
K 550 16
L 600 26
N 650 21
Control 5 5
Table 2. The average BMWP score recorded at each test site.

Sean Meyrick W2922701. S216 2005 TMA05 11
Average BMWP scores were plotted against distance downstream of the pollution
point on a XY Scatter graph. (Fig 4) A Best-fit line was drawn through the data.
0
5
10
15
20
25
30
0 50 100
150
200
250
300
350
400
450
500
550
600
650
700
Distance from road bridge/m
Ave
rage
BM
WP
Scor
e
Fig 4. An XY scatter graph with average BMWP scores plotted against distance from pollution point/m
Visual inspection of the graph indicates a positive relationship between distance from
the pollution point and biotic score. The Excel correlation function gives a correlation
coefficient of 0.792 indicating a positive correlation8. In principle the experimental
data supports the hypotheses. To ensure that this result was not caused by random
variation or sampling errors a statistical test is required.
Sean Meyrick W2922701. S216 2005 TMA05 12
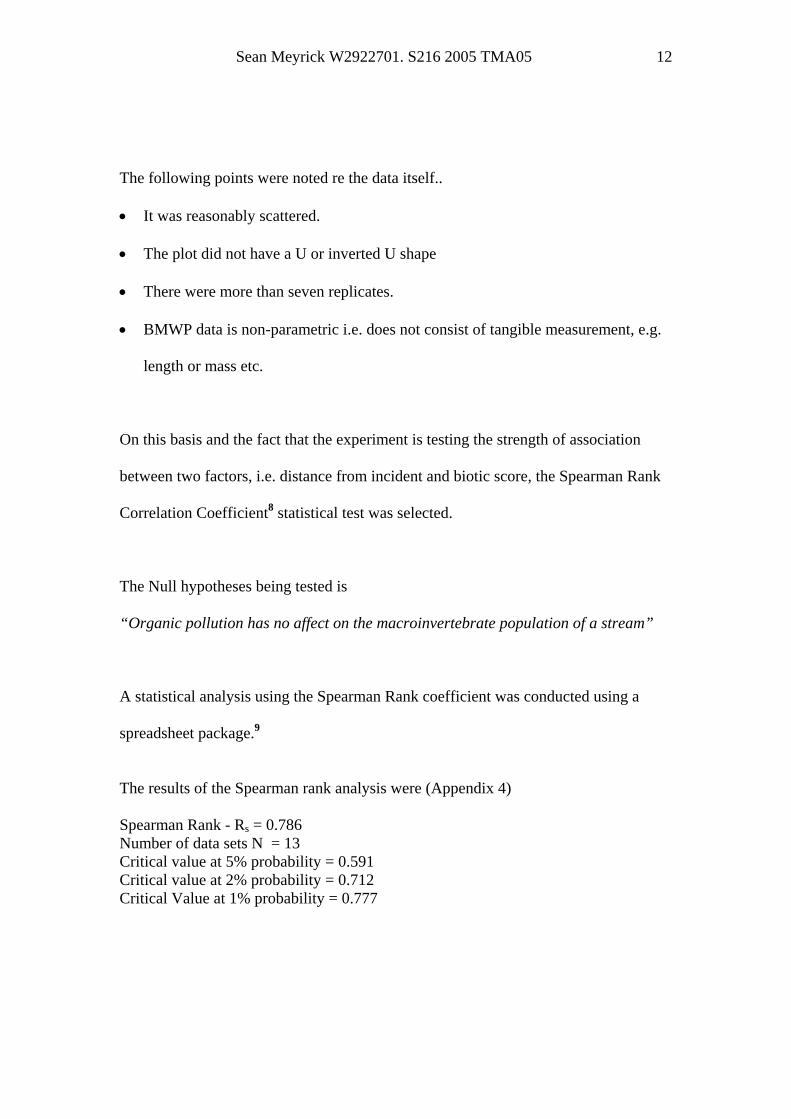
The following points were noted re the data itself..
• It was reasonably scattered.
• The plot did not have a U or inverted U shape
• There were more than seven replicates.
• BMWP data is non-parametric i.e. does not consist of tangible measurement, e.g.
length or mass etc.
On this basis and the fact that the experiment is testing the strength of association
between two factors, i.e. distance from incident and biotic score, the Spearman Rank
Correlation Coefficient8 statistical test was selected.
The Null hypotheses being tested is
“Organic pollution has no affect on the macroinvertebrate population of a stream”
A statistical analysis using the Spearman Rank coefficient was conducted using a
spreadsheet package.9
The results of the Spearman rank analysis were (Appendix 4) Spearman Rank - Rs = 0.786 Number of data sets N = 13 Critical value at 5% probability = 0.591 Critical value at 2% probability = 0.712 Critical Value at 1% probability = 0.777

Sean Meyrick W2922701. S216 2005 TMA05 13
Conclusion
The Rs value of 0.786 exceeds the critical value of probability at 1,2 & 5% hence the
null hypotheses “Organic pollution has no affect on the macroinvertebrate population
of a stream” is firmly rejected.
An overall BMWP score of 61 for the project site indicates a stream of good water
quality10. There are however local areas of the stream with very low BMWP scores
indicative of poor water quality. These appear to be related to the two road bridges.
The results confirm that invertebrate levels increase in relation to the distance from
the pollution point. There is an immediate drop from a biotic score of 25 in the control
section prior to the pollution incident to a level of 9 immediately after. This trend is
corroborated by the results taken before and after the second bridge, a score of 21 and
5 respectively. This data does suggest a link between the road bridges and aquatic
invertebrate diversity.
Before this factor can be solely attributed to the inflow of organic materials and the
resultant low oxygen levels caused by biological processes further testing would need
to be undertaken.
An analysis of the dissolved oxygen content with an oxygen meter would confirm the
exact oxygen levels at each sample site.

Sean Meyrick W2922701. S216 2005 TMA05 14
There were many drainage pipes under both bridges and at several points along the
stream reach. It would be therefore prudent to sample the water to ensure that
invertebrate life was not being affected by high levels of inorganic pollutants, heavy
metals, nitrates or increased chloride levels possible due to inflow from these sources
as well as general runoff. Ideally a map of all the known inflows would be required.
For completeness the parameters of stream width and depth (Appendix 2) should be
analysed against the biotic scores to see if these factors affect invertebrate
populations.
Not withstanding the above the initial results do confirm the original hypotheses that “Organic pollution reduces the aquatic macroinvertebrate diversity of a stream.”
Total words 1461

Sean Meyrick W2922701. S216 2005 TMA05 15
References:
1 Bourne Stream Partnership. [Online] Available from
http://www.bournestreampartnership.org.uk/about_the_bourne_stream.htm [accessed 1st July 2005]
2 Bourne Stream Partnership. [Online] Available from
http://www.bournestreampartnership.org.uk/map_of_stream.htm [Accessed 22nd July 2005]
3 Walker, C. Microbes in the environment in Microbes, The Open University,
Milton Keynes 2001. S204 Uniformity and Diversity. Book 4. 4 Gowing, D et al. Life, in Water and Life, The Open University, Milton Keynes
2002. S216 Environmental Science. Block 3 5 Fore, L. Field Guide to Freshwater Invertebrates[online] Available from
http://www.seanet.com/~leska/Online/Guide.html [Accessed 25th July 2005] 6 Bournemouth & West Hampshire Water plc.[online] www.bhwwater.co.uk intranet. 7 Gowing, D et al. DVD ROM Teign valley Virtual Field Trip The Open
University, Milton Keynes 2002. S216 Environmental Science. Block 1 8 Using the Spearman Rank Correlation Coefficient Booklet. S216
Environmental Science 2003 The open University. Milton Keynes 9 Gardner, M. (Associate Lecturer Open University). Statistics by Mark
Gardener [online] Open University. Available from http://webfc2.open.ac.uk/Login/Open%20University/OU%20Students%20Association/OUSA%20Signpost/OUSA%20S328%20Dark%20Green/?Items=21-40&Folders=1-32767 [ Accessed 5th June 2005 ]
10 River Ouzel invertebrates. BMWP Scores and water quality. [Online] available
from http://www.open.ac.uk/Nature_Trail/R_invert.htm [Accessed 10th July 2005]

Sean Meyrick W2922701. S216 2005 TMA05 16
The author would like to acknowledge that the following sources have been extensively used in the production of this report. Taxonomic classification and identification Croft, p. A key to the major groups of British freshwater invertebrates. FSC Publications. Shrewsbury (1986). Orton, R et al. Freshwater name trail. AIDGAP Project. FSC Publications. Shrewsbury (1996) Identifying freshwater invertebrate life. [online] PDF http://publications.environment-agency.gov.uk/epages/eapublications.storefront/42eb5e1a03444ac6273fc0a802960661/Search/Run?Attributes=1005&1005=04&SearchCombination=And&Attributes=1027&1027=Y&Listheader=Conservation%20and%20EcologyT The Environment Agency Almondsbury (2004) General interest and inspiration Freeman, D. CDROM Riverside Explorer (version 1.0). The Environment Agency Almondsbury (2000) The author would also like to thank Sarah Austin, Project Manager for the Bourne Stream Partnership for her kind permission to reproduce the map in fig1.

Sean Meyrick W2922701. S216 2005 TMA05 17
Appendices

Sean Meyrick W2922701. S216 2005 TMA05 18
Appendix 1 Group Families score mayflies Siphlonuridae, Heptageniidae, Leptophlebidae 10
Ephemerellidae, Ecdyonuridae, Potaminthidae, Ephemeridae
stoneflies Taeniopterigidae, Leuctridae, Capniidae, Perlodidae 10 Perlidae, Chloroperlidae
Caddis-flies Phryganeidae, Mollannidae, Beraeidae, Odontoceridae 10 Leptoceridae, Goeridae, Lepidostomatidae, Brachycentridae Sericostomatidae.
River bugs Aphelocheiriidae 10 caddid-flies Philopotamidae, Glossosomatidae 8
dragonflies Lestidae, Agriidae, Gomphidae, Cordulegasteridae
Aeshnidae, Corduliidae, Libellilidae 8 mayflies Caenidae 7
stoneflies Nemouridae 7
caddis-flies Polycentropidae, Rhyacophilidae, Limnephilidae 7 snails Neritidae, Viviparidae, Ancylidae 6
caddis-flies Hydroptilidae 6
mussels Unionidae 6
shrimps Corophidae, Gammaridae 6
dragonflies Platycnemididae, Coenagriidae 6 bugs Mesovelidae, Hydrometridae, Gerridae, Nepidae, Naucoridae 5
Notonectidae, Pleidae, Corisidae
beetles Hydrophilidae, Clambidae, Elmidae, Dryopidae, Haliplidae 5 Hygrobiidae, Dytiscidae, Gryinidae, Helodidae, Chrysomelidae
caddis-flies Hydropsychidae 5
true flies Tipulidae, Similiidae 5
flatworms Planariidae, Dendrocoelidae 5 mayflies Baetidae 4
alderflies Sialidae 4
leeches Pisicolidae 4 snails Valvatidae, Hydrobidae, Lymnaeidae, Physidae, Planorbidae 3
pea cockles Sphaeridae 3
leeches Glossiphonidae, Hirudidae, Erpobdellidae 3
hoglouse Asellidae 3 midges chironomidae 2 worms Tubificidae, Naididae, Lumbricidae 1
The Biological Monitoring Working Party (BWMP) biotic index4

Sean Meyrick W2922701. S216 2005 TMA05 19
Appendix 2
Site Temperature/Co Depth/m Width/m
Control 15 0.60 2.3
40 15 0.24 2.4
100 15 0.30 2.4
150 15 0.52 2.0
200 15 0.40 2.2
245 15 0.30 2.0
300 15 0.35 2.4
345 15 0.60 2.5
400 15 0.25 2.0
450 15 0.15 2.4
500 15 0.30 2.2
550 15 0.15 1.8
600 15 0.20 1.8
650 15 0.30 2.0
Control 15 0.09 2.70
Results of the measurements of water temperature/Co, Stream width/m and Stream depth/m at all test sites.

Sean Meyrick W2922701. S216 2005 TMA05 20
Appendix 3
Sample sites
Family/BMWP Score A1 A2 A3 B1 B2 B3 C1 C2 C3 D1 D2 D3 E1 E2 E3 F1 F2 F3 G1 G2 G3 H1 H2 H3 I1 I2 I3 J1 J2 J3 K1 K2 K3 L1 L2 L3 M1 M2 M3 N1 N2 N3 O1 O2 O3
Lumbricidae/1 1 1 1 1 1 1 1 1 1 1 1 1 1 1 1 1 1 1 1 1 1 1 1 1 1 1 1
Tubificidae/1 1 1 1 1 1 1 1 1 1 1 1 1 1 1 1 1 1 1 1 1 1 1 1 1 1 1 1 1 1 1 1
Baetidae/4 4 4 4 4 4 4 4 4 4 4 4 4 4 4 4 4 4 4 4 4 4 4 4 4 4 4 4 4 4 4 4 4 4 4 4 4
Culicidae/0 0 0 0 0 0 0 0 0 0 0 0 0 0 0 0 0 0 0 0 0 0 0
Lymnaeidae/3 3 3 3 3 3 3 3 3 3 3 3 3 3 3 3 3 3 3 3
Physidae/4 3 3 3 3 3 3 3 3 3 3 3 3 3 3 3 3 3 3 3 3 3 3 3 3 3 3
Asellidae/3 3 3 3 3 3 3 3 3 3 3 3 3 3 3 3 3 3 3 3 3 3 3 3 3 3 3 3 3 3 3 3 3 3 3 3 3 3 3
Gammaridae/6 6 6 6 6 6 6 6 6 6 6
Ancylidae/6 6
Gyrinidae/5 5
Coenagriidae/6 6
Chironomidae/2 2 2 2 2 2 2 2 2 2 2 2 2 2 2 2 2 2 2 2 2 2 2 2 2 2 2 2
Hirudidae/3 3 3 3 3 3 3 3 3 3 3
Hydropschidae/5 5 5 5
Planariidae/5 5 5 5 5 5 5 5 5 5 5 5 5 5 5 5
Limnephilidae/7 7
Beetle larvae/5 5
Totals 27 23 24 8 8 12 16 9 6 15 7 9 16 13 11 21 20 23 18 13 15 16 22 14 17 17 20 22 16 20 12 16 19 12 18 38 17 23 20 19 25 6 4 6
BMWP biotic scores for all 3 samples taken at each te site between Branksome Wood Road and the Prince of Wal Road
4
0
3
3
6
17
st es

Sean Meyrick W2922701. S216 2005 TMA05 21
Appendix 4
n Data1 Data2 Rank1 Rank2 Rank diff Diff Sq 1 40 9 1 1 0 0 2 100 10 2 2.5 -0.5 0.25 3 150 10 3 2.5 0.5 0.25 4 200 13 4 4 0 0 5 245 21 5 11.5 -6.5 42.25 6 300 15 6 5 1 1 7 345 18 7 9 -2 4 8 400 16 8 7 1 1 9 450 19 9 10 -1 1
10 500 16 10 7 3 9 11 550 16 11 7 4 16 12 600 26 12 13 -1 1 13 650 21 13 11.5 1.5 2.25 14 15 16 17 18 19 20 21 Significance level 22 5% 2% 1%
n 13 Total 0 78 rs crit 0.591 0.712 0.777 rs 0.786 Significant Yes Yes Yes
Results of the statistical analysis and associated levels of significance, Rs and number of data pairs9

Sean Meyrick W2922701. S216 2005 TMA05 22