ar treasury 1977 2
TRANSCRIPT

I J }
Y.iin'tlhi StiHe i f t k FiPiraei
fiS€Ml VMH WII
Digitized for FRASER http://fraser.stlouisfed.org/ Federal Reserve Bank of St. Louis

Digitized for FRASER http://fraser.stlouisfed.org/ Federal Reserve Bank of St. Louis

Digitized for FRASER http://fraser.stlouisfed.org/ Federal Reserve Bank of St. Louis

DEPARTMENT OF THE TREASURY
DOCUMENT NO. 3273 A
Secretary
For sale by the Superintendent of Documents, U. S. Government Printing Office Washington, D. C. 20402
Stock N u m b e r 048 -000 -00313 -3
Digitized for FRASER http://fraser.stlouisfed.org/ Federal Reserve Bank of St. Louis

CONTENTS Page
Bases of Tables , IX
Summary of Fiscal Operations
1. Summary of fiseal operations, fiscal year 1962 to date 3
Receipts and Outlays
2. Receipts and outlays, beginning fiscal year 1789 4 3. Refunds of receipts, fiscal year 1962 to date 14 4. Budget receipts and outlays, fiscal years 1976-77 15 5. Means of fmancing, June 30, 1976, and Sept. 30, 1976 and 1977 33 6. Investments of Govemment accounts in Federal securities (net), June
30, 1976, and Sept. 30, 1976 and 1977 36 7. Receipts by department and agency, fiscal year 1977 38 8. Budget receipts and outlays montlily and totals for fiscal years 1976-
77 39 9. Budget receipts by source and outlays by function, fiscal year 1968 to
date 42 10. Intemal revenue collections by tax source, fiscal year 1946 to date ... 48 11. Intemal revenue collections and refunds by State, fiscal year 1977 ... 55 12. Deposits of eamings by Federal Reserve banks, fiscal year 1947 to
date 57 13. Customs collections and payments by region and district, fiscal year
1977 58 14. Summary of customs coUections and payments, fiscal years 1976-77 60 15. Postal receipts and expenditures, fiscal year 1936 to date 61 16. Seigniorage on coin and silver bullion, Jan. 1, 1935-Sept. 30, 1977 ... 62
Federal Debt
I.-OUTSTANDING
17. Federal securities outstanding, fiscail year 1962 to date 63 18. Federal securities held by the public, fiscal year 1962 to date 63 19. Principal of the public debt, beginning fiscal year 1790 64 20. Investment holdings of Govemment accounts in Federal securities,
Sept.30, 1976and 1977 67 21. Debt subject to statutory limitation, outstanding June 30, 1940-76,
andSept.30, 1976-77 70 22. Public debt outstanding by classification, June 30, 1968-76, and Sept.
30, 1976-77 71 23. Securities issued by Govemment agencies subject to statutory debt
limitation, June 30, 1968-76, and Sept. 30, 1976-77 78 24. Interest-bearing securities issued by Federal agencies, fiscal year 1963
todate 79 25. Maturity distribution and average length of marketable interest-
bearing public debt, June 30, 1946-76, and Sept. 30, 1976-77 81 26. Summary ofthe public debt on an accounting basis, Sept. 30, 1977 .. 83 27. Public debt securities outstanding on an accounting basis, June 30,
1962-76, and Sept. 30, 1976-77 86 28. Description ofpublic debt issues outstanding, Sept. 30, 1977 87 29. Securities issued in advance refunding operations 135 30. Description of agency securities and D.C. Armory Board Stadium
bonds subject to statutory limitation, Sept. 30, 1977 139 31. Debt subject to statutory limitation, Sept. 30, 1977 142
III
Digitized for FRASER http://fraser.stlouisfed.org/ Federal Reserve Bank of St. Louis

IV CONTENTS
Page 32. Debt limitation under the Second Liberty Bond Act, as amended,
beginning 1917 144 II.-OPERATIONS
33. Public debt receipts and expenditures by class, monthly for fiscal 1977 148
34. Changes in public debt issues, fiscal year 1977 160 35. Issues, maturities, and redemptions of interest-bearing public debt
securities, excluding Govemment account series, October 1976-September 1977 204
36. Allotments by investor class pn subscriptions for marketable securities, fiscal year 1977 258
37. Allotments of Treasury notes issued during fiscal year 1977, by Federal Reserve district 261
38. Allotments of Treasury bonds issued during fiscal year 1977, by Federal Reserve district 264
39. Summary of information pertaining to Treasury bills issued during fiscal year 1977 265
40. Statutory debt retirements, beginning fiscal year 1918 269 41. Cumulative sinking fund, beginning fiscal year 1921 270
III.—U.S. SAVINGS BONDS AND NOTES
42. Sales and redemptions of series E through K savings bonds by series, fiscal year 1941 to date 272
43. Sales and redemptions of series E and H savings bonds by denomination, fiscal 1941 to date 278
44. Sales and redemptions of U.S. savings notes, fiscal year 1967 to date 280 45. Sales of series E and H savings bonds by State, fiscal years 1976-77
and cumulative 288 IV.-INTEREST
46. Computed amiual interest rate and interest charge on the pubhc debt by class, June 30, 1955-Sept. 30,1977 282
47. Amount of interest-bearing public debt outstanding and the computed annual interest charge and rate of interest, June 30, 1955-Sept. 30, 1977 284
48. Interest on the public debt by class, fiscal year 1973 to date 285 V.-PRICES AND YIELDS OF SECURITIES
49. Average yields of taxable long-term Treasury bonds by month, January 1951-September 1977 286
50. Prices and yields of marketable public debt issues Sept. 30, 1976 and 1977 and price range since first traded 287
VI.-OWNERSHIP OF FEDERAL SECURITIES
51. Estimated ownership of Federal securities outstanding June 30,1965-76, and Sept. 30,1976-77 291
52. Summary of Treasury survey of ownership of Federal securities, Sept. 30,1976 and 1977 294
Accoimt of the United States Treasury
53. Assets and liabilities in the account of the United States Treasury, Sept. 30, 1976 and 1977 296
54. Location of gold, coin, and coinage metals held by the Treasury, Sept.30, 1976andl977 297
55. Elements of changes in Federal Reserve and tax and loan accoimt balances, fiscal year 1960 to date 298
Stock and Circulation of Currency and Coin in the United States
56. Currency and coin in the Treasury, in the Federal Reserve banks, and in circulation, by kind, Sept. 30,1976and 1977 300
Digitized for FRASER http://fraser.stlouisfed.org/ Federal Reserve Bank of St. Louis

CONTENTS V
Page 57. Stock of bullion, coin, and currency, selected dates, June 30, 1945-76,
and Sept. 30, 1976-77 302 58. Currency and coin in circulation by kind, selected dates, June 30,
1945-76, and Sept. 30, 1976-77 304 59. Paper currency issued and redeemed during fiscal 1977 and
outstanding Sept. 30, 1977 305
Trust and Other Funds
60. Airport and airway tmst fund, Sept. 30, 1977 306 61. Civil service retirement and disability fund, Sept. 30, 1977 309 62. Employees health benefits fund, Civil Service Commission, Sept. 30,
1977 310 63. Retired employees health benefits fund. Civil Service Conunission,
Sept.30, 1977 312 64. Employees life insurance fund. Civil Service Commission, Sept. 30,
1977 „ 313 65. Federal disability insurance tmst fund, Sept. 30, 1977 315 66. Federal hospital insurance trust fund, Sept. 30, 1977 317 67. Federal supplementary medical insurance trust fund, Sept. 30, 1977 . 319 68. Federal old -age and survivors insurance trust fund, Sept. 30, 1977 ... 321 69. Foreign service retirement and disability fund, Sept. 30, 1977 324 70. Highway tmst fund, Sept. 30, 1977 326 71. Judicial survivors annuity fund, Sept. 30,1977 328 72. LibraryofCongresstmstfunds, Sept. 30, 1977 329 73. National service life insurance fund, Sept. 30, 1977 331 74. Pershing Hall Memorial fund, Sept. 30, 1977 333 75. Railroad retirement account, Sept. 30, 1977 334 76. Railroad retirement supplemental account, Sept. 30, 1977 336 77. Unemploymenttrustfund, Sept. 30, 1977 337 78. U.S. Govemment Ufe insurance fund, Sept. 30, 1977 343
Customs Operations
79. Seizures of narcotics and dangerous dmgs by the U.S. Customs Service, fiscal years 1976-77 345
80. Seizures of merchandise by the U.S. Customs Service, fiscal years 1976-77 345
81. Imported merchandise entries, fiscal years 1976-77 346 82. Carriers and persons entering the United States by mode of travel,
fiscalyears 1976-77 347 83. Total carriers and persons entering the United States, by Customs
region, fiscal years 1976-77 348 84. Investigative activities, fiscal years 1976-77 349
Engraving and Printing Operations
85. Postage stamp issues deUvered, fiscal year 1977 350 86. DeUveries of finished work by the Bureau of Engraving and Printing,
fiscalyears 1976and 1977 351 87. Statement of fmancial condition, Sept. 30, 1976 and 1977 352 88. Statement of income and expense, fiscal year 1976, transition quarter,
and fiscal year 1977 355 89. Statement of changes in financial position, fiscal year 1976, transition
quarter, and fiscal year 1977 356
International Oaims
90. Status of Class III awards of the Mixed Claims Commission, United States and Germany, and Private Law 509, Sept. 30,1977 357
91. Status of claims of American nationals against certain foreign govemments, Sept. 30, 1977 358
Internationial Financial Transactions
92. U.S. reserve assets, fiscal year 1965 to date 359 Digitized for FRASER http://fraser.stlouisfed.org/ Federal Reserve Bank of St. Louis

VI CONTENTS
Page 93. U.S. Uabilities to foreign official institutions and Uquid UabiUties to
aU other foreigners, 1965 to date 361 94. Intemational investment position of the United States at yearend 363 95. Assets and UabiUties of the Exchange Stabilization Fund, Sept. 30,
1976 and 1977 365 96. Summary of receipts, withdrawals, and balances of nonpurchased
foreign currencies held by the U.S. Govemment, fiscal 1977 367 97. Balances of nonpurchased foreign currencies held by the U.S.
Govemment, Sept. 30, 1977 369
Indebtedness of Foreign Govemments
98. Indebtedness of foreign governments to the United States arising from World War I, Sept. 30, 1977 370
99. Status of German Worid War I indebtedness, Sept. 30, 1977 371 100. Outstanding long-term principal indebtedness of foreign countries on
U.S. Govemment credits (exclusive of indebtedness arising from World War I), as of Sept. 30, 1977, by country and major program . 372
101. Status of accounts under lend-lease and surplus property agreements (World War II), Sept. 30, 1977 376
Corporations and Other Business-Type Activities of the Federal Government
102. Comparative statement of securities of Govemment corporations and other business-type activities held by the Treasury, June 30, 1968-76, and Sept. 30, 1976-77 378
103. Capital stock of Govemment corporations held by the Treasury or other Govemment agencies, Sept. 30, 1976 and 1977 380
104. Status of congressional authorizations to borrow from the Treasury, with borrowings handled as pubUc debt transactions, fiscal year 1932 to date 381
105. Status of borrowings from the Treasury handled as pubUc debt transactions, cumulative through Sept. 30, 1977 383
106. Borrowing authority and outstanding issues of Government corporations and other business-type activities whose securities are issued totheSecretaryofthcTreasury, Sept. 30,1977 387
107. Description of securities of Govermnent corporations and other business-type activities held by the Treasury, Sept. 30, 1977 389
108. Summary statements of fmancial condition of Govermnent corporations, other business-type activities, and regular govemmental activities, Sept. 30, 1977 394
109. Statement of loans outstanding of Government corporations, other business-type activities, and regular govemmental activities, Sept. 30, 1977 395
110. Dividends, interest, and similar eamings received by the Treasury from Government corporations and other business-type activities, fiscalyears 1976-77 400
111. Direct sales and repurchases of loans, fiscal year 1967 to date 402
Govemment Losses in Shipment
112. Govermnent losses in shipment revolving fund, Sept. 30, 1977 403
Personnel
113. Number of employees in the departmental and field services of the Department of the Treasury quarterly from Sept. 30, 1976, to Sept. 30, 1977 404
Digitized for FRASER http://fraser.stlouisfed.org/ Federal Reserve Bank of St. Louis

Bases of Tables Statistical sources
The figures in this report are shown on the basis of: (a) The Daily Treasury Statement; (b) the Monthly Treasury Statement of Receipts and Outlays of the United States Govemment; (c) the Monthly Statement of the Public Debt of the United States; (d) warrants issued; (e) public debt accounts; and (f) administrative accounts and reports. Where no basis is indicated, the figures are derived from administrative reports prepared according to various specifications. Where more than one basis is used in a single table covering a period of years, the date of the change in basis is stated. The term "security," wherever used in the various tables, means any obligation issued pursuant to law for valuable consideration and includes bonds, notes, certificates of indebtedness, debentures, and other evidences of indebtedness.
Following are general explanations of the various bases. For background on the first two bases (the daily and monthly statements) see exhibits 69, 70, and 71 in the 1954 Annual Report; and for the fourth (warrants issued) see 1962 Annual Report, p. 502.
Daily Treasury Statement
The Daily Treasury Statement traditionally has been the basis for several types of financial information. From 1916 to 1974, it was the basis for much ofthe public debt data and all of the figures on the account of the U.S. Treasury. The fiscal years 1916-52 daily statements were the basis for the receipts, outlays, and the resulting surplus or deficit shown in this report.
The basis for the daily statement from 1916 to 1974 was bank transcripts (summarizing charges for checks paid and credits for deposits in banks) cleared and processed through the accounts of the Department of the Treasury in Washington, D.C. In later years, telegraphic reports were used to provide more timely data for certain major types of information pending receipt by the Treasury of the bank transcripts. The only change in procedure occurred in fiscal years 1946-52 when outlays for agencies using the facilities of the Department of the Treasury's Division of Disbursement were shown on the basis of reports of checks issued. Total outlays, however, as well as outlays for the military departments and other agencies using their own disbursing facilities, remained on the basis of bank transcripts cleared.
During the time it served as the basis for the budget results, the daily statement covered certain transactions processed through commercial bank accounts held in the name of Govemment officers other than the Treasurer of the United States, and included intragovemmental and other noncash transactions. The status of the account of the U.S. Treasury and the summarization of various transactions representing deposits and withdrawals in that account, excluding noncash transactions (with minor exceptions) and transactions involving cash held outside the account of the U.S. Treasury, were shown, with only a limited number of deposit and withdrawal classifications. The data presented then did not and even today does not purport to represent budget results. Effective July 1, 1974, the Daily Treasury Statement began publication in a new format derived from the system used intemally in the Treasury for many years in following actual cash flows and estimating future cash movements and borrowing requirements. It is based on information reported daily by wire and telephone from the Federal Reserve System and intemal Treasury sources. The most important advantage of this modification is the more timely and accurate reporting of data relating to Treasury cash and debt operations.
Monthly Treasury Statement of Receipts and Outlays of the United States Government
Beginning with the figures for the fiscal year 1953, this monthly statement replaced the daily statement as the primary source of budget results (surplus or deficit) and other receipt and outlay data classified by type of account. This statement shows all receipts and outlays of the Govemment including those made from cash accounts held outside the
VII
Digitized for FRASER http://fraser.stlouisfed.org/ Federal Reserve Bank of St. Louis

VIII 1977 REPORT OF THE SECRETARY OF THE TREASURY
account of the U.S. Treasury. The information in the monthly statement is based on the central accounts relating to cash operations (see "Description of Accounts Relating to Cash Operations," below).
Monthly Statement of the Public Debt of the United States
The Monthly Statement of the Public Debt of the United States became a separate publication in fiscal 1975 beginning with the July 31, 1974, statement. This statement provides detail and summary public debt information which had been fumished in the monthend Daily Treasury Statements in previous fiscal years. Warrants issued
Receipt and outlay data shown for fiscal years before 1916 were taken from reports based on warrants issued.
For receipts, covering warrants were prepared from certificates of deposit mailed to the Treasury, principally by Govemment depositaries, showing deposits received. The figures thus compiled were on a warrants-issued basis. Since these certificates did not reach the Treasury simultaneously, all receipts for a fiscal year could not be covered into the Treasury by warrant of the Secretary immediately upon the close of the fiscal year. Therefore, certain certificates of deposit representing amounts deposited during one fiscal year were reported as the next year's receipts.
Reports of outlays were based on the amount of accountable and settlement warrants issued and charged to appropriation accounts. Since accountable warrants covered advances to disbursing officers, rather than actual payments, reported outlays necessarily included the changes in balances of funds remaining unexpended to the credit of disbursing officers at the close ofthe fiscal year.
Public debt accounts The figures reported on this basis represent transactions which have been audited by the
Bureau of the Public Debt. It is sometimes several months after a financing operation before all the transactions have been reported and audited. Therefore, the public debt figures on this basis differ from those reported in the Monthly Statement of the Public Debt of the United States since the latter consist of transactions cleared through the account of the U.S. Treasury during the reporting period. A reconciliation of figures on the two bases is given in table 26. Administrative accounts and reports
Certain tables in this report are developed from the accounts, records, and reports of the administrative agencies concemed, which may be on various bases. These tables include intemal revenue and customs statistics, foreign currency transactions in the accounts of the Secretary of the Treasury, and financial statements of Govemment corporations and other business-type activities.
Description of Accounts Relating to Cash Operations
The classes of accounts maintained in connection with the cash operations of the Federal Govemment, exclusive of public debt operations, include: (1) The accounts of fiscal officers or agents, collectively, who receive money for deposit in the U.S. Treasury or for other authorized disposition or who make disbursements by drawing checks on the U.S. Treasury or by effecting payments in some other manner; (2) the accounts of administrative agencies which classify receipt and outlay (disbursement) transactions according to the individual receipt, appropriation, or fund account; and (3) the accounts of the U.S. Treasury in the Bureau of Govemment Financial Operations (which is responsible for the receipt and custody of money deposited by fiscal officers or agents and for the payment of checks drawn on the U.S. Treasury). The Bureau ofthe Public Debt is responsible for the payment ofpublic debt securities redeemed. A set of central accounts is maintained in the Treasury for the purpose of consolidating financial data reported periodically from the above sources in order to present the results of cash operations in central financial reports on a unified basis for the Govemment as a whole, and as a means of intemal control.
The central accounts relating to cash operations disclose monthly and fiscal year information on: (1) The Govemment's receipts by principal sources, and its outlays according to the different appropriations and other funds involved; and (2) the cash transactions, classified by types, together with certain directly related assets and liabilities which underlie such receipts and outlays. The accounting for receipts is substantially on the basis of collections (i.e., as of the time cash receipts are placed under accounting
Digitized for FRASER http://fraser.stlouisfed.org/ Federal Reserve Bank of St. Louis
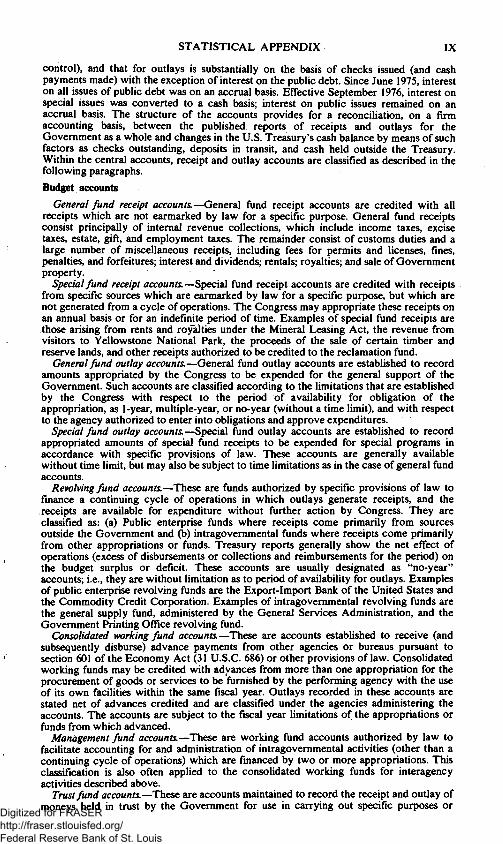
STATISTICAL APPENDIX IX
control), and that for outlays is substantially on the basis of checks issued (and cash payments made) with the exception of interest on the public debt. Since June 1975, interest on all issues ofpublic debt was on an accnial basis. Effective September 1976, interest on special issues was converted to a cash basis; interest on public issues remained on an accmal basis. The stmcture of the accounts provides for a reconciliation, on a firm accounting basis, between the published reports of receipts and outlays for the Govemment as a whole and changes in the U.S. Treasury's cash balance by means of such factors as checks outstanding, deposits in transit, and cash held outside the Treasury. Within the central accounts, receipt and outlay accounts are classified as described in the following paragraphs.
Budget accounts
General ftind receipt accounts.—GenetzX fund receipt accounts are credited with all receipts which are not earmarked by law for a specific purpose. General fund receipts consist principally of intemal revenue collections, which include income taxes, excise taxes, estate, gift, and employment taxes. The remainder consist of customs duties and a large number of miscellaneous receipts, including fees for permits and licenses, fines, penalties, and forfeitures; interest and dividends; rentals; royalties; and sale of Govemment property.
Special fund receipt accounts—Special fund receipt accounts are credited with receipts from specific sources which are earmarked by law for a specific purpose, but which are not generated from a cycle of operations. The Congress may appropriate these receipts on an annual basis or for an indefinite period of time. Examples of special fund receipts are those arising from rents and royalties under the Mineral Leasing Act, the revenue from visitors to Yellowstone National Park, the proceeds of the sale of certain timber and reserve lands, and other receipts authorized to be credited to the reclamation fund.
General fund outlay accounts—General fund outlay accounts are established to record amounts appropriated by the Congress to be expended for the general support of the Govemment. Such accounts are classified according to the limitations that are established by the Congress with respect to the period of availability for obligation of the appropriation, as 1-year, multiple-year, or no-year (without a time limit), and with respect to the agency authorized to enter into obligations and approve expenditures.
Special fund outlay accounts—Special fund outlay accounts are established to record appropriated amounts of special fund receipts to be expended for special programs in accordance with specific provisions of law. These accounts are generally available without time limit, but may also be subject to time limitations as in the case of general fund accounts.
Revolvlngfund accounts—These are funds authorized by specific provisions of law to fmance a continuing cycle of operations in which outlays generate receipts, and the receipts are available for expenditure without further action by Congress. They are classified as: (a) Public enterprise funds where receipts come primarily from sources outside the Govemment and (b) intragovemmental funds where receipts come primarily from other appropriations or funds. Treasury reports generally show the net effect of operations (excess of disbursements or collections and reimbursements for the period) on the budget surplus or deficit. These accounts are usually designated as "no-year" accounts; i.e., they are without limitation as to period of availability for outlays. Examples of public enterprise revolving funds are the Export-Import Bank of the United States and the Commodity Credit Corporation. Examples of intragovemmental revolving funds are the general supply fund, administered by the General Services Administration, and the Govemment Printing Office revolving fund.
Consolidated working fund accounts—These are accounts established to receive (and subsequently disburse) advance payments from other agencies or bureaus pursuant to section 601 ofthe Economy Act (31 U.S.C. 686) or other provisions of law. Consolidated working funds may be credited with advances from more than one appropriation for the procurement of goods or services to be fumished by the performing agency with the use of its own facilities within the same fiscal year. Outlays recorded in these accounts are stated net of advances credited and are classified under the agencies administering the accounts. The accounts are subject to the fiscal year limitations of the appropriations or funds from which advanced.
Management fund accounts—These are working fund accounts authorized by law to facilitate accounting for and administration of intragovemmental activities (other than a continuing cycle of operations) which are financed by two or more appropriations. This classification is also often applied to the consolidated working funds for interagency activities described above.
Trustfund accounts—These are accounts maintained to record the receipt and outlay of moneys held in trust by the Govemment for use in carrying out specific purposes or Digitized for FRASER
http://fraser.stlouisfed.org/ Federal Reserve Bank of St. Louis

X 1977 REPORT OF THE SECRETARY OF THE TREASURY
programs in accordance with the terms of a trust agreement or statute. The receipts of many trust funds, especially the major ones, not needed for current payments are invested in public debt and Govemment agency securities. Generally, trust fund accounts consist of separate receipt and outlay accounts, but when the trust corpus is estabUshed to perform a business-type operation, the fund entity is called a "trust revolving fund" and a combined receipt and outlay account is used. Some of the major trust accounts are the Federal old-age and survivors insurance trust fund, unemployment tmst fund, civil service retirement and disability fund, the national service life insurance fund, and the highway trust fund.
Transfer appropriation accounts.—These accounts are established to receive (and subsequently disburse) allocations which are treated as nonoutlay transactions at the time the allocation is made including certain transfers under section 601 of the Economy Act (31 U.S.C. 686), and similar provisions of law.
Other accounts
Deposit fund accounts.—Deposit funds are combined receipt and outlay accounts established to account for receipts that are either: (a) Held in suspense temporarily and later refunded or paid into some other fund of the Govemment upon administrative or legal determination as to the proper disposition thereof, or (b) held by the Govemment as banker or agent for others and paid out at the direction of the depositor. Such funds are not available for paying salaries, expenses, grants, or other outlays of the Govemment.
Historical Data
Historical data consistent with the unified budget have been compiled for the applicable tables back through fiscal 1954.
Pursuant to Public Law 93-344, the Congressional Budget and Impoundment Control Act of 1974, the fiscal year changed, effective with fiscal year 1977, from July 1-June 30 to October 1-September 30. The time gap necessary to establish this new period occurred from July 1, 1976, through September 30, 1976, and is referred to as the "transition quarter." Historical data has been appropriately modified to provide the reader with consistency and comparability of data presented.
Digitized for FRASER http://fraser.stlouisfed.org/ Federal Reserve Bank of St. Louis

T A B L E S
NOTE.—Details of figures may not add to totals because of rounding.
Digitized for FRASER http://fraser.stlouisfed.org/ Federal Reserve Bank of St. Louis

Digitized for FRASER http://fraser.stlouisfed.org/ Federal Reserve Bank of St. Louis
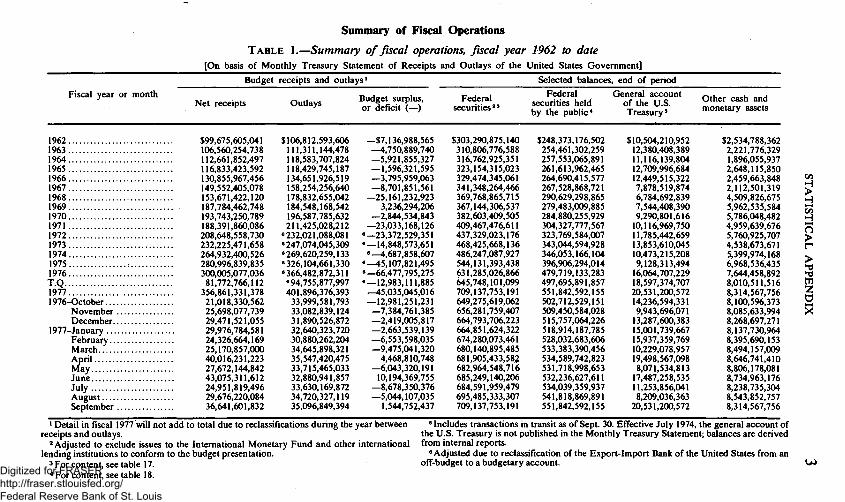
Summary of Fiscal Operations
TABLE 1.—Summary of fiscal operations, fiscal year 1962 to date [On basis of Monthly Treasury Statement of Receipts and Outlays of the United States Govemment]
Fiscal year or month
Budget receipts and outlays^ Selected balances, end of period
Net receipts Outlays Budget surplus, or deficit (—)
Federal securities'
Federal securities held by the public*
General account of the U.S. Treasury'
Other cash and monetary assets
1962 $99,675,605,041 $106,812,593,606 —$7,136,988,565 $303,290,875,140 $248,373,176,502 $10,504,210,952 $2,534,788,362 1963 106.560,254.738 111,311.144,478 —4.750,889,740 310,806.776,588 254.461.302,259 12,380,408.389 2.221,776,329 1964 112,661,852,497 118,583,707,824 —5,921,855,327 316.762,925,351 257,553,065,891 11,116.139,804 1,896,055,937 1965 116.833.423.592 118,429,745,187 —1,596,321,595 323,154,315,023 261.613,962,465 12.709.996.684 2,648,115,850 1966 130,855,967,456 134,651,926.519 —3.795.959.063 329.474.345.061 264.690.415.577 12,449.515,322 2,459,663,848 1967 149,552,405,078 158,254,256,640 —8,701,851,561 341.348.264.466 267,528,868,721 7,878,519,874 2,112,501.319 1968 153.671,422,120 178.832.655,042 —25.161.232,923 369,768,865,715 290.629.298,865 6,784,692,839 4,509,826,675 1969 187,784.462.748 184,548,168,542 3,236,294,206 367,144,306,537 279,483,009,885 7.544.408,390 5.962,535.584 1970 193,743,250.789 196,587,785,632 —2,844,534.843 382.603,409,505 284,880.255,929 9,290,801,616 5,786,048,482 1971 188.391.860,086 211.425.028.212 —23.033.168.126 409,467.476.611 304,327,777,567 10,116,969.750 4,959,639.676 1972 208,648,558,730 «232,021,088,081 «—23,372,529,351 437,329.023,176 323,769,584,007 11,785,442,659 5.760,925.707 1973 232,225,471,658 «247,074,045,309 «—14,848,573,651 468,425,668,136 343,044,594,928 13,853,610,045 4.538,673,671 1974 264,932.400.526 «269,620.259,133 •—4,687,858,607 486,247,087.927 346,053,166,104 10,473,215,208 5,399,974,168 1975 280,996,839.835 «326,104,661,330 «—45,107,821,495 544,131,393,438 396.906.294.014 9,128,313,494 6,968,536,435 1976 300,005,077,036 '366,482,872,311 «—66,477,795,275 631,285,026,866 479,719,133,283 16,064,707,229 7,644,458,892 T.Q 81,772,766,112 •94.755,877,997 •—12,983,111,885 645,748,101,099 497,695.891.857 18.597,374,707 8,010,511,516 1977 356,861,331,378 401,896,376,393 —45,035,045,016 709,137,753,191 551,842,592,155 20,531,200,572 8,314,567,756 1976-October 21,018,330,562 33,999,581,793 —12,981,251,231 649,275,619.062 502,712,529,151 14,236,594,331 8,100,596,373
November 25,698,077,739 33,082,839,124 —7,384,761,385 656,281,759,407 509,450,584,028 9,943,696,071 8,085,633,994 December 29,471,521,055 31,890,526,872 —2,419,005,817 664,793,706,223 515,757,064,226 13,287,600.383 8.268.697,271
1977-January 29,976,784,581 32,640,323,720 —2,663,539,139 664,851,624,322 518,914,187,785 15,001,739,667 8,137,730,964 February 24.326.664,169 30,880,262,204 —6,553,598,035 674,280,073,461 528,032,683.606 15,937,359,769 8,395,690,153 March 25,170,857,000 34.645.898.321 —9.475,041.320 680.140,895.485 533.383.390.456 10.229.078.957 8,494,157,009 April 40,016,231,223 35,547,420,475 4,468,810,748 681,905,433,582 534.589.742.823 19.498,567.098 8.646.741,410 May 27,672,144,842 33,715,465,033 —6,043,320,191 682,964,548,716 531.718.998,653 8,071,534,813 8,806,178,081 June 43,075.311,612 32,880,941,857 10,194,369.755 685.249.140,206 532,236,627,611 17,487,258,535 8.734.963,176 July 24.951,819,496 33,630,169,872 —8.678.350.376 684.591.959,479 534,039,359,937 11,253,856,041 8,238,735,304 August 29,676,220,084 34,720,327,119 —5,044,107,035 695,485,333,307 541,818.869.891 8,209,036.363 8,543,852,757 September 36,641,601,832 35,096,849,394 1,544,752,437 709,137,753,191 551,842,592,155 20,531,200,572 8.314.567.756
* Detail in fiscal 1977 will not add to total due to reclassifications during the year between »Includes transactions in transit as of Sept. 30. Effective July 1974. the general account of receipts and outlays. the U.S. Treasury is not published in the Monthly Treasury Statement; balances are derived
2 Adjusted to exclude issues to the Intemational Monetary Fund and other intemational from intemal reports. lending institutions to conform to the budget presentation. • Adjusted due to reclassification of the Export-Import Bank of the United States from an
3 For content, see table 17. off-budget to a budgetary account. ^ For content, see table 18.
c/5 H > H (/) H n > r > w 2: a ><
U ) Digitized for FRASER http://fraser.stlouisfed.org/ Federal Reserve Bank of St. Louis
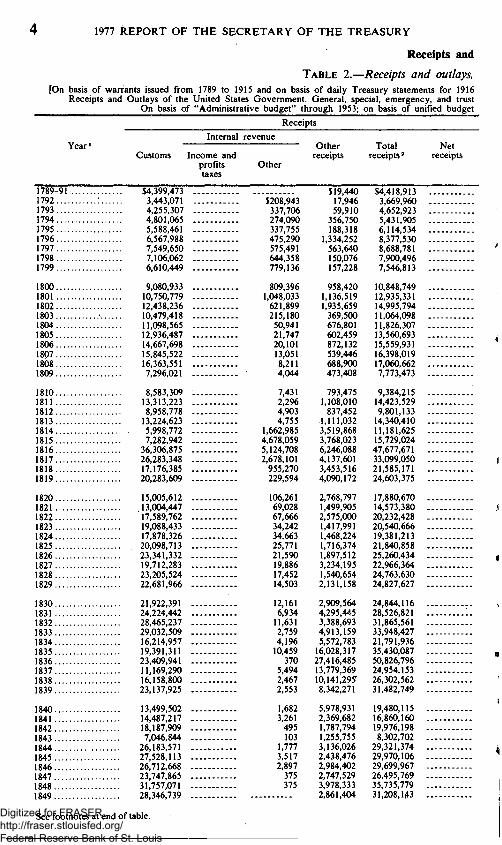
1977 REPORT OF THE SECRETARY OF THE TREASURY
Receipts and
TABLE 2.—Receipts and outlays, [On basis of warrants issued from 1789 to 1915 and on basis of daily Treasury statements for 1916
Receipts and Outlays of the United States Govemment. General, special, emergency, and trust On basis of "Administrative budget" through 1953; on basis of unified budget
Receipts
Year> Intemal revenue
Customs Income and profits taxes
Other
Other receipts
Total receipts'
Net receipts
1789-91 1792 1793 1794 1795 1796 1797 1798 1799
1800. 1801. 1802. 1803. 1804. 1805. 1806. 1807. 1808. 1809.
1810. 1811. 1812. 1813. 1814. 1815. 1816. 1817. 1818. 1819.
1820. 1821. 1822. 1823. 1824. 1825. 1826. 1827. 1828. 1829.
1830. 1831. 1832. 1833. 1834. 1835., 1836. 1837., 1838., 1839.,
1840., 1841.. 1842.. 1843.. 1844.. 1845.. 1846.. 1847.. 1848.. 1849..
$4,399,473 3,443,071 4,255,307 4,801,065 5,588,461 6,567,988 7,549,650 7,106,062 6,610,449
9,080,933 10,750,779 12,438,236 10,479,418 11,098,565 12,936,487 14,667,698 15,845,522 16,363,551 7,296,021
8,583,309 13,313,223 8,958,778 13,224,623 5,998,772 7,282,942
36,306,875 26,283,348 17,176,385 20,283,609
15,005,612 13,004,447 17,589,762 19.088.433 17,878,326 20,098,713 23,341,332 19,712,283 23,205,524 22,681,966
21,922,391 24,224,442 28,465,237 29,032,509 16,214,957 19,391,311 23,409,941 11.169.290 16.158.800 23.137,925
13,499,502 14,487,217 18,187,909 7,046,844
26,183,571 27,528,113 26,712,668 23,747,865 31,757,071 28,346,739
$208,943 337,706 274,090 337,755 475,290 575,491 644,358 779,136
809,396 1,048,033 621,899 215,180 50,941 21,747 20,101 13,051 8,211 4,044
7,431 2,296 4,903 4,755
1,662,985 4,678,059 5,124,708 2,678,101 955,270 229,594
106,261 69,028 67,666 34,242 34,663 25,771 21,590 19,886 17,452 14,503
12,161 6,934 11,631 2,759 4,196 10,459
370 5,494 2,467 2,553
1,682 3,261 495 103
1,777 3,517 2,897 375 375
$19,440 $4,418,913 17,946 3,669,960 59,910 4,652,923
356,750 5,431,905 188,318 6,114,534
1,334,252 8,377,530 563,640 8,688,781 150,076 7,900,496 157,228 7,546,813
958,420 10,848,749 1,136,519 12,935,331 1,935,659 14,995,794 369,500 11,064,098 676,801 11,826,307 602,459 13,560.693 872,132 15,559,931 539,446 16,398,019 688,900 17,060,662 473,408 7,773,473
793,475 9,384,215 1,108,010 14,423,529 837,452 9,801,133
1,111,032 14,340,410 3,519,868 11,181,625 3,768,023 15,729,024 6,246,088 47,677,671 4,137,601 33,099,050 3,453,516 21,585,171 4,090,172 24,603,375
2,768,797 17,880,670 1,499,905 14,573,380 2,575,000 20,232,428 1,417,991 20,540,666 1,468,224 19,381,213 1,716,374 21,840,858 1,897,512 25,260,434 3,234,195 22,966,364 1,540,654 24,763,630 2.131.158 24,827,627
2,909,564 24,844.116 4,295,445 28,526,821 3,388,693 31,865,561 4.913.159 33.948,427 5,572,783 21,791,936 16,028,317 35,430,087 27,416,485 50,826,796 13,779,369 24,954,153 10,141,295" 26,302,562 8,342,271 31,482,749
5,978,931 19,480,115 2,369,682 16,860,160 1,787,794 19,976,198 1,255,755 8,302,702 3,136,026 29,321,374 2,438,476 29,970,106 2,984,402 29,699,967 2,747,529 26,495,769 3,978,333 35,735,779 2,861,404 31,208,143
See footnotes at end of table. Digitized for FRASER http://fraser.stlouisfed.org/ Federal Reserve Bank of St. Louis

STATISTICAL APPENDIX
Outlays
beginning fiscal year 1789 through 1952. Beginning with fiscal year 1953 on basis of the Monthly Treasury Statement of accounts combined from 1789 through 1930. Tmst accounts excluded from 1931 through 1953. thereafter. For explanation of accounts see "Bases of Tables"]
Department of the Army 3
$632,804 1,100,702 1,130,249 2!639,098 2,480.910 1,260,264 1,039,403 2,009,522 2,466,947
2,560,879 1,672,944 1,179,148
822,056 875,424 712,781
1,224,355 1,288,686 2,900,834 3,345,772
2,294,324 2,032,828
11,817,798 19,652,013 20,350,807 14,794,294 16,012,097 8,004,237 5,622,715 6,506,300
2,630,392 4,461,292 3,111,981 3,096,924 3,340,940 3,659,914 3,943,194 3,938,978 4,145,545 4,724,291
4,767,129 4,841,836 5,446,035 6,704,019 5,696,189 5,759,157
12,169,227 13,682,734 12,897,224 8,916,996
7,097,070 8,805.565 6.611,887 2,957,300 5,179,220 5.752,644
10,792,867 38,305,520 25,501,963 14,852,966
Department of the Navy'
$570 53
61,409 410.562 274.784 382,632
1,381,348 2,858.082
3,448.716 2,111,424
915,562 1,215,231 1,189,833 1,597,500 1,649,641 1,722,064 1,884,068 2,427,759
1,654,244 1,965,566 3,959,365 6,446,600 7,311.291 8,660,000 3,908,278 3,314,598 2,953,695 3,847,640
4,387,990 3,319.243 2,224,459 2,503.766 2,904,582 3,049,084 4,218,902 4,263,877 3,918,786 3,308,745
3,239,429 3,856,183 3,956,370 3,901,357 3,956,260 3,864,939 5,807,718 6,646.915 6,131,596 6,182,294
6,113,897 6,001,077 8,397,243 3,727,711 6,498,199 6,297,245 6.454,947 7,900,636 9,408,476 9,786.706
Outlays
Interest on the public debt
$2,349,437 3,201,628 2,772,242 3,490,293 3,189,151 3,195,055 3,300,043 3,053,281 3,186,288
3,374,705 4,412,913 4,125,039 3,848,828 4,266,583 4,148,999 3,723,408 3,369,578 3,428,153 2,866,075
2,845,428 2,465,733 2,451,273 3,599,455 4,593,239 5,754,569 7,213,259 6,389.210 6.016.447 5,163.538
5,126.097 5,087,274 5,172,578 4,922,685 4,996,562 4,366,769 3,973,481 3,486,072 3,098,801 2,542,843
1,913,533 1,383,583
772,562 303,797 202,153
57,863
i4;9^7 399,834
174,598 284,978 773,550 523,595
1,833,867 1,040,032
842,723 1,119,215 2,390,825 3,565,578
Othpr * ^ i n e r
$1,286,216 777,149 579.822 800.039
1.459,186 996,883
1,411,556 1,232,353 1,155,138
1,401,775 1,197,301 1,642,369 1,965,538 2,387,602 4,046,954 3,206,213 1,973,823 1,719,437 1,641,142
1,362,514 1,594,210 2,052,335 1,983,784 2,465,589 3,499,276 3,453,057 4,135,775 5,232,264 5,946.332
6.116,148 2,942,944 4,491,202 4,183,465 9,084,624 4,781,462 4,900,220 4,450,241 5,231,711 4,627,454
5,222,975 5,166,049 7,113,983
12,108,379 8,772,967 7,890,854
12,891,219 16,913,847 14,821,242 11,400,004
10,932,014 11,474,253 9,423,081 4,649,469 8,826,285 9,847,487 9,676,388 9,956,041 8,075.962
16,846,407
Total outlays'
$4,269,027 5,079,532 4,482,313 6,990,839 7,539,809 5,726,986 6,133,634 7,676,504 9,666,455
10,786,075 9,394,582 7.862.118 7.851,653 8,719,442
10,506,234 9,803,617 8,354.151 9,932,492
10.280,748
8.156.510 8,058.337
20.280.771 31,681.852 34.720,926 32,708,139 30,586,691 21,843,820 19,825,121 21,463,810
18,260,627 15,810,753 15,000,220 14,706,840 20,326,708 15,857,229 17,035,797 16,139,168 16,394,843 15,203,333
15,143,066 15,247,651 17,288,950 23,017,552 18,627,569 17,572,813 30,868,164 37,243,496 33,865,059 26,899.128
24.317,579 26,565,873 25,205,761 11,858,075 22,337,571 22,937,408 27,766,925 57,281,412 45,377,226 45,051,657
Surplus, or deficit (—)«
$149,886 —1.409.572
170,610 —1,558,934 —1,425.275
2,650.544 2,555,147
223,992 —2,119,642
62,674 3,540,749 7,133,676 3,212.445 3,106,865 3,054,459 5,756,314 8,043,868 7,128,170
—2,507,275
1,227,705 6.365,192
—10,479,638 —17.341,442 —23,539,301 —16,979,115
17,090.980 11.255,230 1,760,050 3,139,565
—379,957 —1,237,373
5,232,208 5,833.826
—945,495 5,983,629 8,224,637 6,827,196 8,368,787 9,624,294
9,701,050 13,279,170 14,576,611 10,930,875 3,164.367
17.857,274 19,958,632
— 12,289,343 -7,562,497
4,583,621
—4,837,464 —9,705,713
5,229,563 —3,555,373
6,983,803 7,032,698 1,933,042
—30,785,643 —9,641,447
—13,843,514 Digitized for FRASER http://fraser.stlouisfed.org/ Federal Reserve Bank of St. Louis

1977 REPORT OF THE SECRETARY OF THE TREASURY
TABLE 2.—Receipts and outlays, Receipts
Intemal revenue
Year* Customs Income and
profits taxes
Other
Other receipts
Total receipts'
Net receipts
1850 $39,668,686 1851 49,017,568 1852 47,339,327 1853 58,931,866 1854 64.224.190 1855 53.025.794 1856 64.022,863 1857 63,875,905 1858 41,789,621 1859 49,565,824
1860 53,187,512 1861 39.582,126 1862 49,056,398 1863 69,059,642 1864 102,316,153 1865 84,928,261 1866 179.046,652 1867 176,417,811 1868 164,464,600 1869 180.048,427
1870 194,538,374 1871 206,270,408 1872 216,370.287 1873 188,089,523 1874 163,103.834 1875 157,167,722 1876 148,071,985 1877 130,956,493 1878 130,170,680 1879 137,250,048
1880 186,522,064 1881 198,159.676 1882 220,410.730 1883 214,706.497 1884 195.067,490 1885 181,471,939 1886 192.905,023 1887 217.286,893 1888 219,091.174 1889 .* 223.832,742
1890 229,668,585 1891 219,522,205 1892 177,452.964 1893 203,355,017 1894 131,818.531 1895 152.158,617 1896 160,021,752 1897 176.554,127 1898 149,575.062 1899 206,128,482
1900 233,164,871 1901 238,585,456 1902 254,444,708 1903 284,479,582 1904 261,274.565 1905 261.798,857 1906 300.251.878 1907 332.233,363 1908 286.113.130 1909 300.711,934 1910 333.683.445 1911 314.497.071 1912 311.321.672
$2,741,858 20.294,732 60,979,329 72.982.159 66,014.429 41,455,598 34,791,856
$3,934,753 3,541,736 2,507.489 2.655,188 9,576,151 12,324,781 10,033,836 5,089.408 4,865.745 3,920,641
2,877,096 1.927,805 2.931.058
$34,898,930 5,996,861 89,446,402 52,569,484 148,484,886 39,322,129 236,244,654 69,759,155 200,013,108 48,188,662 149,631,991 50,085,894 123,564,605 32,538,859
37,175,874 147,123,882 31,817,347 19,162,651 123,935,503 33,955,383 14,436,862 116,205,316 27.094.403 5.062,312 108,667,002 31,919,368 139,472 102,270.313 39,465,137
233 110,007,261 20.824,835 588 116.700.144 29.323,148 98 118,630,310 31,819,518
110,581,625 17.011,574 113,561,611 23,015.526
124,009,374 22,995,173 3,022 135,261,364 27,358,231
- 146,497,596 36,616,924 144,720,369 38,860,716
55,628 121,530,445 31.866,307 112,498,726 29,720,041 116,805,936 26,728,767 118,823,391 35,292,993 124,296,872 35,878,029 130,881,514 32,335,803
142.606.706 30,805.693 145.686,250 27.403,992 153,971,072 23,513,748 161,027,624 21,436,988 147,111,233 27,425,552
77,131 143.344.541 29,149,130 146.762,865 31,357,830 146.688,574 24,479,004 170,900,642 84,845,631 273.437.162 36,394,977
295,327,927 38,748,054 307,180.664 41,919,218 271,880,122 36,153,403 230,810,124 46,591,016 232.904,119 46.908.401 234,095.741 48.380,087 249,150,213 45,582,355 269,666,773 63,960,250
..... 251,711,127 64,037,650 246,212,644 57,395.920
20.951,781 268,981,738 51.894,751 33.516,977 289,012,224 64,806,639 28,583.304 293,028,896 59,675,332
$43,603,439 52,559,304 49,846,816 61,587,054 73,800,341 65,350,575 74,056,699 68,965,313 46,655,366 53,486,465
56,064,608 41,509,931 51,987.456 112,697.291 264,626.771 333.714,605 558.032.620 490.634.010 405,638.083 370,943,747
411,255,477 383,323,945 374,106.868 333,738,205 304,978,756 288,000,051 294.095,865 281,406,419 257,763,879 273,827,185
333,526,611 360,782,293 403,525,250 398.287.582 348.519,870 323.690.706 336,439,726 371,403,277 379,266,075 387.050,059
403,080,984 392,612,447 354,937,784 385,819,629 306,355,316 324,729,419 338.142.447 347.721.705 405,321.335 515,960.621
567.240.852 587,685.338 562.478.233 561.880,722 541,087,085 544,274,685 594,984,446 665,860,386 601.861.907 604,320,498 675,511,715 701,832,911 692,609,204
See footnotes at end of table. Digitized for FRASER http://fraser.stlouisfed.org/ Federal Reserve Bank of St. Louis

STATISTICAL APPENDIX
beginning fiscal year 1789—Continued
Department of the A n n y «
$9,400,239 11,811,793 8,225,247 9,947,291 11,733,629 14,773.826 16,948.197 19.261.774 25,485,383 23,243,823
16,409,767 22,981,150
394,368,407 599,298,601 690,791,843
1,031,323,361 284.449.702 95,224.415 123.246.648 78,501.991
57,655,676 35,799,992 35,372,157 46,323,138 42,313,927 41,120,646 38,070,889 37,082,736 32,154,148 40,425,661
38,116,916 40,466,461 43,570,494 48,911,383 39,429,603 42,670,578 34,324,153 38,561,026 38,522,436 44,435,271
44,582,838 48.720,065 46.895,456 49,641,773 54,567,930 51,804,759 50,830,921 48,950,268 91,992,000
229,841,254
134,774,768 144,615,697 112,272,216 118,629,505 165,199,911 126,093,894 137,326,066 149,775,084 175,840,453 192,486,904 189,823,379 197,199,491 184,122,793
Department of the Navy 3
$7,904,709 9,005,931 8,952,801 10,918,781 10,798,586 13.312.024 14.091.781 12,747,977 13,984,551 14,642,990
11.514,965 12,420,888 42,668,277 63,221,964 85,725,995 122,612,945 43,324,118 31,034,011 25,775,503 20,000,758
21,780,230 19,431,027 21,249,810 23,526.257 30,932,587 21,497,626 18,963,310 14,959,935 17,365,301 15,125,127
13,536,985 15.686.672 15.032.046 15.283.437 17,292,601 16,021,080 13,907.888 15,141.127 16,926,438 21,378,809
22,006,206 26,113,896 29,174,139 30,136,084 31,701,294 28,797,796 27,147,732 34,561,546 58,823,985 63,942,104
55,953,078 60,506,978 67,803,128 82,618,034 102,956,102 117,550,308 110,474,264 97,128,469 118.037,097 115.546.011 123.173.717 119.937,644 135,591,956
Outlays
[nterest on the public debt
$3,782,331 3,696,721 4,000,298 3,665,833 3,071,017 2,314,375 1,953,822 1,678,265 1,567,056 2,638,464
3,177.315 4.000.174 13.190.325 24.729,847 53,685,422 77,397,712 133,067,742 143,781,592 140,424.046 130,694,243
129,235,498 125,57(6,566 117,357,840 104,750,688 107,119,815 103,093,545 100,243,271 97,124,512 102,500,875 105,327,949
95,757,575 82,508,741 71,077,207 59,160,131 54,578,379 51,386,256 50,580,146 47,741,577 44,715,007 41,001,484
36,099,284 37,547,135 23,378,116 27,264,392 27,841,406 30,978,030 35,385,029 37,791,110 37,585.056 39,896,925
40,160,333 32,342.979 29,108.045 28.556.349 24,646,490 24,590,944 24,308,576 24,481,158 21,426.138 21,803,836 21,342,979 21,311,334 22,616,300
Other*
$18,456,213 23,194,572 23,016,573 23,652,206 32,441,630 29,342,443 36,577,226 34,107,692 33,148,280 28,545.700
32.028.551 27.144.433 24.534.810 27.490,313 35,119,382 66,221,206 59.967.855 87,502,657 87.894,088 93.668.286
100,982,157 111,369,603 103,538,156 115,745,162 122,267,544 108,911,576 107,823,615 92,167,292 84,944,003 106,069,147
120,231.482 122.051.014 128.301,693 142,053,187 132,825,661 150,149,021 143,670,952 166,488,451 167,760,920 192,473,414
215,352,383 253,392,808 245,575,620 276.435.704 253,414,651 244,614,713 238,815,764 244,471,235 254,967,542 271,391,896
289,972.668 287.151,271 276.050.860 287.202.239 290,857,397 299,043,768 298,093,372 307.744.131 343,892,632 363,907,134 359,276,990 352,753,043 347,550.285
Total outlays'
$39,543,492 47,709,017 44,194,919 48,184,111 58.044.862 59.742,668 69,571,026 67,795,708 74,185,270 69,070,977
63,130,598 66,546,645
474,761,819 714,740,725 865,322,642
1.297,555,224 520,809,417 357,542,675 377,340,285 322,865,278
309,653,561 292,177,188 277,517,963 290,345,245 302,633,873 274,623.393 265.101.085 241.334.475 236.964,327 266,947,884
267,642,958 260,712,888 257,981,440 265,408,138 244,126,244 260,226.935 242,483,139 267,932,181 267,924,801 299,288,978
318,040,711 365,773,904 345,023,331 383,477,953 367,525,281 356,195,298 352,179,446 365,774,159 443,368.583 605.072,179
520,860,847 524,616.925 485,234.249 517,006.127 583.659.900 567.278.914 570,202.278 579,128,842 659,196,320 693,743,885 693,617,065 691,201,512 689,881,334
Surplus, or deficit (-)*
$4,059,947 4,850,287 5,651,897 13,402,943 15,755,479 5,607,907 4,485,673 1,169,605
—27,529,904 —15,584,512
—7,065,990 —25,036,714
—422,774,363 —602,043,434 —600,695,871 —963,840,619
37,223,203 133,091,335 28,297,798 48,078,469
101,601,916 91,146,757 96,588,905 43,392,960 2,344,883 13,376,658 28,994,780 40,071,944 20,799,552 6,879,301
65,883,653 100,069,405 145,543,810 132,879,444 104,393,626 63,463,771 93,956,587 103,471,096 111,341.274 87.761.081
85.040.273 26.838.543 9.914,453 2,341,676
—61,169,965 —31,465,879 —14,036,999 —18,052,454 —38,047,248 —89,111,558
46,380,005 63,068,413 77.243,984 44,874,595
—42,572,815 —23,004,229
24,782.168 86,731,544
—57,334,413 —89,423,387 —18,105,350
10,631,399 2,727,870
Digitized for FRASER http://fraser.stlouisfed.org/ Federal Reserve Bank of St. Louis

TABLE 2.—Receipts and outlays, beginning fiscal year 1789—Continued oo
Year*
Receipts
Intemal revenue
Customs Income and profits taxes Other
other receipts X m ^ f ' ^ " r . ^ ' ' sources'
Receipts, less refunds and
transfers
Interfund transactions (deduct)*
Net receipts
1913 $318,891,396 $35,006,300 $309,410,666 $60,802,868 $724.111,230 1914 292,320,014 71,381,275 308,659,733 62,312,145 734,673,167 1915 209.786.672 80.201,759 335,467,887 72,454,509 697,910,827 1916 213,185,846 124,937,253 387,764,776 56,646,673 782,534,548 1917 225,962,393 359,681,228 449.684,980 88,996,194 1,124,324,795 1918 179,998,385 2,314,006,292 872,028,020 298,550,168 3,664,582,865 1919 184.457,867 3.018.783,687 1,296,501,292 652,514,290 5,152,257,136
1920 322,902,650 3,944,949,288 1,460,082,287 966,631,164 6,694,565,389 1921 308,564,391 3,206,046,158 1,390,379,823 719,942,589 5,624,932,961 1922 356,443,387 2,068,128,193 1,145,125,064 539.407.507 4,109,104,151 1923 561,928,867 1,678,607,428 945,865,333 820,733.853 4.007.135.481 1924 545.637.504 1,842,144,418 953,012,618 671,250,162 4,012,044,702
1925 547,561,226 1,760,537,824 828,638,068 643,411,567 3,780,148,685 1926 579,430,093 1,982,040,088 855,599,289 545,686,220 3,962,755,690 1927 605,499.983 2,224,992,800 644,421,542 654,480,116 4,129,394,441 1928 568,986,188 2,173,952,557 621,018,666 678,390,745 4.042.348.156 1929 602.262,786 2,330,711,823 607,307,549 492,968,067 4,033,250,225
1930 587,000,903 2,410,986,978 628,308,036 551,645,785 4,177,941,702 1931 378,354,005 1,860,394,295 569,386,721 381,503,611 3,189,638,632 1932 327,754,969 1,057,335,853 503,670.481 116,964.134 2.005.725,437 1933 250.750,251 746,206,445 858,217,512 224,522,534 2,079,696,742 1934 313,434,302 817,961,481 1,822,642,347 161,515,919 3,115,554,050
1935 343,353,034 1,099,118,638 2,178,571,390 179,424,141 3,800,467,202 1936 386,811,594 1,426,575,434 2,086,276,174 216,293,413 4,115,956,615 1937 486,356,599 2,163,413,817 2,433,726,286 210,093,535 5,293,590,237 1938 359,187,249 2,640,284,711 3,034,033,726 208,155,541 6,241,661,227 1939 318,837,311 2,188,757,289 2,972,463,558 187,765,468 5,667,823,626
1940 348,590,636 2,125,324,635 3,177,809,353 241,643,315 5,893,367,939 1941 391,870,013 3,469,637,849 3,892,037,133 242,066,585 7,995,611,580 1942 388,948,427 7,960,464,973 5,032,652,915 294,614,145 13,676,680,460-1943 324,290,778 16,093,668,781 6,050,300,218 934,062,619 23,402,322,396-1944 431,252,168 34,654,851,852 7,030,135,478 3,324,809,903 45,441,049,402-
—$9,648,197 —9,556,243 — 14,493,508 —21,089,442 —23,824,686 —19,343,075 —22,214,698
—45,667,064 —54,143.041 —83.203,427 — 154,340.910 — 140.831.069
— 139,343,469 —167,647.775 —116.600,643 —142,019,394 — 171,660,851
$714,463,033 $714,463,033 725,116.924 725,116.924 683,417,319 : 683,417.319 761.445,106 761,445,106
1,100,500,109 1,100,500,109 3,645,239,790 3,645.239,790 5,130,042,438 5,130.042,438
6,648,898,325 5.570,789,920 4,025,900,724 3,852,794,571 3.871.213.633
3.640.805.216 3.795,107,915 4.012,793,798 3,900,328,762 3,861.589,374
-120,057,560 4,057,884,142 —74,081,709 3,115,556,923 —81,812,320 1,923,913,117 —58,483,799 2,021.212,943 —51,286.138 3,064.267,912
—70,553,357 —47,019,926 -314,989,542 -626,440,065 -671,524,096
3,729,913,845 4,068,936,689 4,978,600,695 5,615,221,162 4,996,299,530
—749,354,895 5,144,013,044 —892,680.197 7.102.931.383 -1.121,244,376 12,555,436,084 -1,415,621,609 21,986,700,787 -1,805,734,046 43,635,315,356
$21,294 24,369,110 49,298,113
23,958,245 71,877.714 22,988,139 27,209,289 17,233,572
6,763,273 7,255,331 8,817,329
39,417,630 72,705,896
6,648,898,325 5,570,789,920 4,025,9(K),724 3,852,794,571 3,871,213,633
3,640,805,216 3,795,107,915 4,012.793,798 3,900,328,762 3,861,589,374
4,057,884,142 3,115,556,923 1,923,891,824 1,996,843,833 3,014,969,799
3,705.955,600 3,997,058,975 4,955,612,556 5,588,011,873 4,979,065.958
5.137,249,771 7.095,676,052 12,546,618,755 21.947,283,157 43,562,609,460
W
o
o H X w
>
o H
> ifi c
Digitized for FRASER http://fraser.stlouisfed.org/ Federal Reserve Bank of St. Louis

Year* Department of the Army '
Department of the Navy '
Outlays
Interest on the public
debt Other*
Total outlays by major
functions ' *
Interfund transactions (deduct)*
Total outlays'*
Surplus, or deficit (—)*
1913 $202,128,697 $133,262,862 $22,899,108 $356,573,099 1914 208,349,245 139,682,186 22,863,957 354,629,800 1915 202,059,524 141,835,654 22,902.897 379,295,219 1916 183,176,439 153,853,567 22,900,869 353,035,885 1917 377,940,870 239,632,757 24,742,702 1,311,540,736 1918 4,869,955,286 1,278,840,487 189,743,277 6.338.820.346 1919 9.009.075.789 2.002,310,785 619,215,569 6,862,063,114
1920 1,621,953.095 736.021.456 1,020.251.622 2.979.450.604 1921 1.118,076.423 650.373,836 999.144,731 2,294,189,659 1922 457,756,139 476.775.194 991,000,759 1,363,872,381 1923 397,050,596 333.201.198 1.055,923,690 1,354,111,135 1924 357,016,878 332,249,137 940,602,913 1,277,977.968
1925 370,980,708 346,137.110 881.806,662 1,324,837,383 1926 364.089,945 312,743,410 831,937,700 1,421,192,993 1927 369,114,117 318,909,096 787.019,578 1,382,386,240 1928 400,989,683 331,335.492 731,764,476 1,497,155.810 1929 425,945,577 364,561,544 678,330,400 1,658,361,114
1930 464,853,515 374,163,870 659,347,613 1,821,846,326 1931 486,141,754 353,768,185 611,559,704 2,125,964,360 1932 476,305,311 357.517.834 599,276,631 3,226,103.049 1933 434.620.860 349.372.794 689,365,106 3,149,506,267 1934 408,586,783 296,927,490 756,617,127 5,231,768,454
1935 487,995,220 436,265.532 820,926,353 4.775,778,841 1936 618,587,184 528,882,143 749,396,802 6,596,619,790 1937 628,104,285 556,674,066 866,384,331 5,704,858,728 1938 644,263,842 596,129,739 926,280,714 4.625,163,465 1939 695,256,481 672,722,327 940,539,764 6,549,938,998
1940 907,160,151 891,484,523 1,040,935,697 6,222,451,833 1941 3,938,943,048 2,313,057,956 1,110.692,812 5,899,509,926 1942 14,325,508,098 8,579,588,976 1,260,085,336 9.880,496.406 1943 42,525.562.523 20.888,349,026 1,808,160,396 14,185,059,207 1944 49,438,330,158 26,537,633,877 2,608,979,806 16,473.764,057
$714,863,766 725,525,188 746,093,294 712,966,760
1,953,857,065 12.677,359.396 18.492,665,257
6,357,676,777 5.061.784.649 3.289,404,473 3,140,286.619 2,907,846,896
2,923,761,863 2,929,964,048 2,857,429,031 2,961,245,461 3,127,198,635
3,320,211,324 3,577,434,003 4.659,202,825 $21,294 4.622.865.028 24,369,110 6,693,899,854 49,298,113
6.520.965.945 8.493.485,919 7,756,021,409 6,791,837,760 8,858,457,570
9,062,032,204 13,262,203,742 34,045,678,816 79,407,131,152 95,058,707,898
23,958.245 71,877,714 22,988,139 27,209.289 17,233,572
6,763.273 7.255.331 8,817.329
39.417,630 72,705,896
$714,863,766 725,525,188 746.093,294 712,966,760
1,953,857.065 12,677,359,396 18.492.665,257
6,357,676,777 5,061,784,649 3,289,404,473 3,140.286,619 2.907.846.896
2,923,761,863 2,929,964,048 2,857,429,031 2,961,245,461 3,127,198,635
3,320,211,324 3,577,434,003 4,659,181,532 4.598,495,918 6,644,601,741
6,497,007,700 8,421,608,205 7,733,033,270 6,764,628,471 8,841,223,998
9,055,268,931 13,254,948,411 34,036,861,487 79,367,713,522 94,986,002,002
—$400,733 —408,264
—62,675,975 48,478,346
—853,356.956 —9.032.119,606
—13,362.627819
291,221,548 509,005,271 736,496.251 712,507.952 963.366,737
717,043, 865,143,
1,155,364, 939,083, 734,390,
737,672, —461,877,
-2,735,289, -2,601,652, -3,629,631,
353 ,867 766 301 739
,818 ,080 ,708 ,085 ,943
—2,791,052,100 —4,424,549,230 —2,777,420,714 —1,176,616,598 —3,862,158,040
—3,918,019,161 —6,159,272,358
—21,490,242,732 —57,420,430,365 —51,423,392,541
C/3
H > H GO
H
9 r > m z o ><
See footnotes at end of table. VO
Digitized for FRASER http://fraser.stlouisfed.org/ Federal Reserve Bank of St. Louis

TABLE 2.—Receipts and outlays, beginning fiscal year 1789—Continued
Year*
Receipts
Customs Intemal revenue
Income and profits taxes Other
Other receipts Total receipts
by major sources'
Refunds and transfers'
Receipts, less refunds and
transfers
Interfund transactions (deduct) •
Net receipts
1945. 1946. 1947. 1948' 1949'
1950. 1951. 1952. 1953.
$354,775,542 435,475,072 494,078,260 421,723,028 384,484.796
422.650.329 624.008,052 550.696,379 613.419,582
$35,173,051,373 30,884,796,016 29,305.568.454 31,170,968,403 29,482,283,759
28,262,671,097 37,752,553.688 51,346,525.736 54.362.967,793
$8,728,950,555 9.425.537.282
10,073.840,241 10,682,516.849 10.825,001.116
11.185.936.012 13.353,541.306 14.288.368.522 15.808,006,083
$3,493,528,901 3.492,326,920 4,634,701,652 3,823,599,033 2,081,735,850
1,439.370.414 1.638,568,845 1,813,778,921 1,864,741,185
$47,750,306,371 44.238,135,290 44,508,188.607 46.098.807.314 42,773,505.520
41,310,627,852 53,368.671,892 67,999,369.558 72,649,134,647
-$3,275,002,706 —4,466,731,580 —4,722,007.571 —4,610.628.472 —5,077,956.071
-4.815.727.015 —5,801,058,408 —6,608,425,006 —7.824,090.621
$44,475,303,665 39,771,403,710 39.786,181.036 41,488,178.842 37,695,549,449
36.494,900,837 47,567,613,484 61,390,944,552 64,825,044,026
$113,282,721 121.532.724 109,014.012 113.476.853 32.576,510^
72,966,260 87,546,409 104,383,636 154,459,602
$44,362,020,944 39,649,870.986 39.677.167.024 41.374.701.989 37.662.972,939
Outlays
Department of the Army '
Department of the Navy '
Department of the
Air Force '
Interest on the
public debt Other
Total outlays by major
functions'*
Interfund transactions
(deduct)*
Total outlays'*
Surplus, or deficit (—)*
1945 $50,490,101,935 1946 27.986,769.041 1947 9.172.138.869 1948' 7.698.556.403 1949' 7,862,397,097
1950 5,789,467,599 1951* 8,635,938,754 1952 17,452,710,349 1953 17,054,333.370
$30,047,152,135 15,164,412,379 5,597,203.036 4,284,619,125 4,434,705,920 $1,690,460,724
4,129.545.653 5.862.548,845
10,231,264,765 11,874,830,152
3,520,632,580 6,358,603,828
12,851,619,343 15,085,227,952
$3,616,686,048 4.721.957,683 4,957,922,484 5,211,101,865 5.339,396,336
5,749.913.064 5.612.654,812 5,859,263,437 6,503,580,030
$14,262,279,670 12,574,435,216 19,305,128,987 15,874,431,605 20,180,029,420
20,427,444.299 17,588,084,620 19,012,727.036 23.756.285,980
$98,416,219,790 60,447,574.319 39,032,393,376 33,068,708.998 39,506,989,497
39,617,003,195 44,057.830.859 65,407.584.930 74.274,257.484
$113,282,721 121.532,724 109,014,012 113,476,853 32,576.510
72.966.260 87.546.409
104.383.636 154.459.602
$98,302,937,069 60,326,041.595 38.923.379,364 32,955,232,145 39,474,412,987
39.544.036.935 43.970.284.450 65.303,201,294 74,119,797,882
-$53,940,916, —20.676,170,
753,787, 8,419,469,
—1,^11,440,1
—3,122,102, 3,509,782,
—4,016,640, —9,449,213,
,126 ,609 ,660 844 ,048
357 ,624 ,378 ,457
S
36,421,934,577 O 47,480,067,075 ^ 61,286,560,916 H 64,670,584,424 ffi
tfl C/5 Cfl
o
O
H X tfl
>
Digitized for FRASER http://fraser.stlouisfed.org/ Federal Reserve Bank of St. Louis

Income taxes
Year*
Individual Corporation
Excise taxes
Receipts
Estate and gift taxes Customs duties
Social insurance taxes and contributions
Employment taxes and
contributions*
Contributions for other
insurance and retirement"
Miscellaneous taxes and receipts
Refunds of receipts"
Net budget receipts
1954 $32,392,146,700 $21,522,853,908 $10,014,443,842 $945,049,092 $562,020,619 $5,266,575,249 $1,984,346,542 1955 31,654,170,061 18,264,720.352 9.210.581.897 936,267.446 606.396.634 6.031.045.395 1,886.467.854 1956 35.340,349,927 21,298,521,621 10,004,194,869 1,171,237,192 704,897.516 7.124.632,038 2,263,981,844 1957 39,066,646,244 21,530,653,013 10,637,543,788 1,377,998,889 754,461,446 7,463,157,974 2.594.588.920 1958 38.581,942.041 20,533,315,590 10,814,267,526 1,410,925,018 799,504,808 8,699,152,717 2,618,584,155 1959 40,791,874,129 18,091,509,456 10.759.549.109 1.352.982,426 948,412,215 8,904,630,798 2,904,787,240
1960 44,971,310,266 22,179,414,267 11,864,740,881 1,626,347,638 1,123,037,579 11,337,418,282 3,437,824,557 1961 46.153,000.792 21.764.940.001 12.064.302,042 1,916,392,302 1,007,755,214 12,775,130,588 3,762,792,880 1962 50,649,593,506 21,295,711,399 12,752,175,848 2.035,187,128 1,171,205,974 12,976,540,446 4,216,589,270 1963 52,987.580.595 22.336.133.758 13,409.737.348 2,187,457,229 1,240,537,884 14,885,842,299 5,061,090,240 1964 54,590,354,384 24,300,863,236 13,950,231.780 2,416,303,318 1,284,176,380 17,125,163,991 5,056,537,393
1965 53,660,682,653 26,131,333,625 14,792,778,809 2,745,532,499 1,477.548.821 17.550.191.742 4,907.261.587 1966 61.297.551.520 30.834.242.695 13.398.112.012 3.093.921.882 1.811.170,211 20,889,528,322 4,911,369,694 1967 69,370.595.136 34.917.825.260 14.113.747,719 3,014,405,754 1,971,799,791 28,105,097,413 5,532,756,875 1968 78,252,045,190 29,896,519,677 14,320,396,487 3,081,978,790 2,113,474,950 29,487,010,470 5,403,864,807 1969 97,440,405,013 38,337.645.690 15,542.045,719 3,530,064,861 2,387,190,473 34,841,043.355 5,688,676,958
1970 103,651,585,605 35,036,982,990 15,904,263,668 3,680,076,379 2,494,294,171. 39,519,764,951 6,171,434,438 1971 100,752,420,384 30.319.953.030 16.871,851.093 3,784,283.489 2.657.362.160 42.217,172,018 6,886,985,249 1972 108,879,185,548 34,925,545,565 16,847.035,616 5,489,969,119 3,394,299,291 46,567,719,278 7,807,193,026 1973 125,112,005,814 39,045,308,964 16,572,318,106 4,975,862,359 3,307,821,157 55,355,980,120 9,684,300,366 1974 142.903,649,579 41,744,443.900 17,109,853,474 5,100,674,716 3,444,059,013 66,427,867,521 10,914.090.957
1975 156,399.437.843 45.746.659,638 16.848,041,329 4,688.078.838 3,781.600.810 75.564.629,892 11,269,710,720 1976 158,969,097,012 46,782,956,195 17.257,944,702 5.307.465.524 4.208,526,756 80,316,988,196 12,836.997.894 T.Q 39.758,579,163 9.808.904.615 4.518.008.497 1.485.246.783 1.242.772.054 21.803.046.678 3,962,258.648 1977 186,919,103,911 60,056,566,118 17,833,085,295 7,425,325,470 5,287,479,104 92,610,210,964 16,508,758,712
$449,568,926-355,950,702 389,223,885 540,306,673 776,161,635 609,133,892
1,189,529,887 920,422,350 844,270,781
1,023,262.348 1,086,307,634
1,597.638,325 1,875.651.069 2.107,863,544 2,491,496,357-2.908.510.957-
-$3,417,737,374 —3.476.987,625 —3,750,030,132 —3,975,532,487 —4,598,010,555 —5,113,752.669
—5,237,513,807 —5,976,009,231 —6,265,669,311 —6,571,386,963 —7,148,085,619
—6,029,544,469 —7,255,579,949 -9,581,686,414 11,375,364,608 12,891,120,278
3,424,174,505—16,139,325,917 3,858,297,227 —18,956,464,564 3,632,735,338 — 18.895,124,050 3,921,065,805 —25,749,191,032 5.368,892,232—28,081,130,866
6,711.636,380—40,012,955,615 8.028,027,024 —33,702,926,265 1,612,831,617 —2,418,881,943 6,554,498,556 —36.333.696.752
$69,719,267,504 65.468.612.716 74.547.008.760 79,989,824,460 79,635.842.935 79,249,126,596
92,492,109.550 94.388.726.938 99.675.605.041 106,560,254.738 112.661.852.497
116.833.423.592 130,855,967,456 149,552,405,078 153,671.422.120 187,784,462,748
193,743,250,789 188.391.860.086 208.648.558.730 232.225,471,658 264.932.400.526
280,996,839,835 300,005,077,036 81,772,766,112
356,861,331,378
C/3
H c H n > r >
tfl
i
See footnotes at end of table.
Digitized for FRASER http://fraser.stlouisfed.org/ Federal Reserve Bank of St. Louis

TABLE 2.—Receipts and outlays, beginning fiscal year 1789—Continued K)
Year*
Outlays
Department of Agriculture
Department of Defense
Department of Health, Education,
and Welfare"
Department of the Treasury
Interest on the
public debt Other* '" Other
Undistributed intrabudgetary
transactions Net outlays
Surplus, or deficit (—)
1954 $2,613,484,207 $40,625,674,430 $1,977,283,991 $6,382,485,640 1955 4,275,010,967 35,629,778,598 1,989,947,310 6,370,361,774 1956 4,760,671,305 35,692,897,354 2,067,374,737 6,786,598,863 1957 4.560,471,890 38,719,034,957 2,292,685,544 7,244,193,486 1958 4,368,422,114 39,916,688,798 2,636,400,425 7,606,774,062 1959 6,529,382,614 44,602,920,493 3,089,040,327 7,592,769,102
1960 4,842,598.671 ** 43.968,847,762 3,400,074,752 9,179,588,857 1961 5,383,802,475 ** 45,688,376,272 3,680,977,437 8.957,241,615 1962 6,294,073,812 "49,283,444,729 4,210,376,106 9,119,759,808 1963 7,332,799,230 49,242,562,050 20,248,873,528 9,895,303.949 1964 7,458,177.889 50,702,892,890 21,695,149,315 10.665,858,127
1965 6,795,4(X),161 47,179,328,954 22,732,250,917 11,346,454,580 1966 5,513,411,042 55,445,393,783 27,959,129,367 12,013,862,667 1967 5,841,151.394 68.762,932,164 34,607,693,058 13,391,068,052 1968 7,306,960,660 78,672,893,689 40,576,498,177 14,573,008,397 1969 8,330,318,006 79,137,136,574 46,594,029,486 16,588,236,606
1970 8,306,563,325 78,360,167,659 52,337,602,274 19,303,669,514 1971 8,559,794,596 75,921,974,338 61,866,310,997 20,959,044,235 1972 10,942,507,631 76,679,370,170 71,778,816,603 21,848,807,195 1973 10,028,402,705 75,000,209,584 82,042.236,020 24,167,493,308 1974 9,766.890,799 79,307,123,702 93,734,605,811 29,318,933,184
1975 9,724,875,597 87,471,287.777 112,410,756,145 32,665,008,385 1976 12,796,311,150 90,160,407,173 128,784,966,721 37,063,211,191 T.Q 3,849,621,598 22,508,760,119 34,340,745,185 8,101,560.678 1977 16,737,730,112 98,031,451.342 147,455.435,581 41,899,719,541
$5,022,986,962 6,025.333.595 6.804,477,133 8,255,275,789 11,252,262,998 13,934,236,415
13,572,618,347 15,826,494,755 17,518,660,038 —150,424,943 —114,183,494
$15,504,712,513 15,437,425,728 15,801,617,195 17,525,373.669 18.734.205,883 18,593,799,491
19,555,888.511 20,706,655,578 22,899,608,057 27,385,929,284 31,052,420,542
86,677,461 33,398,637,223 413,151,535 36,671,466.641
-327.021.534 39.913,935.072 81.521,582 42,120,742,184
335,558,631 38,679,750,209
205,575,956 31,387,543
275,200,378 6,815,483,612 6,673,817,733
-$1,236,883,402 —1,218,673,794 — 1,453,307,258 —1,856,452,831 — 1,939.661.669 —2,237,689,445
—2,296,263,275 —2,448,969,016 —2,513,328,944 —2,643,898,620 —2,876,607,445
—3,109,004,109 —3,364,488,516 —3,935,501,566 ^J,498,969,647 —5,116,860,970
$70,889,744,341 68,509,184,178 70,460,329,329 76,740,582,504 82,575.092,611 92,104,458,997
92,223,353,625 97,794,579,116 106,812,593,606 111,311,144,478 118,583,707,824
118,429,745.187 134.651,926.519 158,254,256,640 178,832,655.042 184,548,168,542
—$1,170,476,837 —3,040,571,462
4,086.679,431 3,249,241,956
—2,939,249,676 —12,855,332,401
268.755,925 —3,405,852,178 —7,136,988,565 ^4,750,889,740 —5,921.855,327
—1,596.321,595 —3,795,959,063
8,701,851,561 —25,161,232,923
3,236,294,206
44,454,083,531 51,462,873,004
"58,353,899,633 "57,398,480,721 "60,712,181,442
8.512.140,985 "89,418,765,353 7,272,256,641 "105,110,094,101 1,597,528,078 >'26,924,192,483 7,660,462,305 105,164,792,579
—6,379,876,627 196,587,785,632 —2,844,534,843 —7,376,356,501 211,425,028,212 —23,033,168,126 —7,857,513,529 "232,021,088,081 »»—23,372,529,351 —8,378,260,641 "247,074,045.309 *' —14,848,573.651 —9.893,293,538 *'269,620,259,133 »»—4,687,858,607
-14 ,098,172,912 "326,104,661,330 "—45,107,821,495 -14 ,704,374,665 '' 366.482,872,311 *»—66,477,795,275
2,566,530,144 "94,755,877,997 "—12,983,111,885 -15 ,053 ,215 ,066 401,896,376,393 —45,035,045,016
Cfl
3 H O
H X Cfl C/) Cfl o Cfl
o iri H X Cfl
H J« Cfl > c/3 c ?fl
Footnotes on following page.
Digitized for FRASER http://fraser.stlouisfed.org/ Federal Reserve Bank of St. Louis

Footnotes to table 2 *From 1789 to 1842 the fiscal year ended Dec. 31; from 1844 to 1976, on June 30; and
beginning 1977, on ^ p t . 30. Figures for 1843 are for a half year, Jan. 1 to June 30. Transition quarter (T/.Q.) figures are for the period July 1 through Sept. 30, 1976.
'Effective Jan. 3, 1949, amounts refunded by the Govemment, principally for overpayment of taxes, are reported as deductions from total receipts rather than as outlays. Also, effective July 1, 1948, payments to the Treasury, principally by wholly owned Govemment corporations for retirement of capital stock and for disposition of eamings, are excluded in reporting both budget receipts and outlays. Neither change affects the budget surplus or deficit. Figures beginning with fiscal 1913 have been adjusted accordingly for comparability. For adjustments for refunds of receipts for fiscal years 1931-53, see 1967 Annual Report, pp. 448-449. For capital transfers for fiscal 1931 through 1948, see 1958 Annual Report, p. 396, footnote 3. Effective June 1977, eamed income credit payments in excess of an individual's tax liability, formerly treated as outlays, are classified as income tax refunds.
' Includes all military and civil outlays of the Departments of the Army (including the Panama Canal), the Navy, and beginning with fiscal 1949 the Air Force, except civil outlays of War and Navy at Washington through fiscal 1915. Department of the Army outlays include those ofthe Department ofthe Air Force (established Sept. 18, 1947) from funds made available before fiscal 1949. Beginning with fiscal 1952 oudays of the Department of Defense not classified amoung its three departments are included under "Other." Military assistance outlays for foreign aid programs are included under "Other" except as noted. See footnote 14.
*The practice of including statutory debt retirements in budget outlays was discontinued effective with fiscal 1948. Such outlays are not included in this table, nor does the "Surplus or deficit" take into account such outlays. Table 40 shows details of statutory debt retirements.
'Refunds of receipts and transfers to tmst funds. For content for fiscal years 1931-53 see 1967 Annual Report, pp. 448-449.
•For content see 1961 Annual Report, pp. 450-457. 'Sec. 114(0 ofthe Economic Cooperation Act of 1948, approved Apr. 3, 1948 required
that $3 billion be transferred to the "Foreign Economic Cooperation Trust Fund" and
"considered as expended during the fiscal year 1948, for the purpose of reporting govemmental expenditures." The effect of this was to charge the budget in fiscal 1948 for outlays made in fiscal 1949, with consequent effect on the budget surplus or deficit of those years. This bookkeeping transaction had no effect on the actual timing of either receipts or outlays. In order to simplify comparison of figures between years, the transactions shown in this table do not take into account the transfer of $3 billion in fiscal 1948 to the Foreign Economic Cooperation trust fund; outlays of $3 billion during fiscal 1949 from the Foreign Economic Cooperation trust fund are treated as budget outlays in this table. If effect is given to sec. 114(0 of the Economic Cooperation Act of 1948, the budget results for the fiscal years 1948 and 1949 would be as follows: c,. , ,o^c c,. , .^^n
' Fiscal year 1948 Fiscal year 1949 Budget receipts $41,374,701,989 $37,662,972,939 Budget outlays 35,955,232.145 36.474,412,987
Budget surplus 5,419,469,844 1,188,559,952
•Beginning with fiscal 1951, investments of wholly owned Govemment corporations in public debt securities are excluded from budget outlays. See table 6.
* Includes Federal old-age and survivors. Federal disability, Federal hospital, and railroad retirement tax act receipts.
*° Includes unemployment insurance. Federal supplementary medical, civil service retirement, and other employees retirement receipts.
** For content see table 3. *' Social security trust fund outlays are reflected under the Department of the Treasury
through fiscal year 1962, and under the Department of Health, Education, and Welfare, thereafter.
*'Includes interest payments by Govemment corporations and other business-type activities on securities issued to the Treasury and, beginning in 1973, revenue sharing.
** Includes military assistance. *' Adjusted due to reclassification of the Export-Import Bank of the United States from
an off-budget to a budgetary account.
C/3
H i f i H
r >
Cfl
a
U i
Digitized for FRASER http://fraser.stlouisfed.org/ Federal Reserve Bank of St. Louis

TABLE 3.—Refunds of receipts, fiscal year 1962 to date [On basis of M o n t h l y T rea su ry S ta tement of Rece ip t s and Out lays of the Uni ted States G o v e m m e n t ]
I n t e m a l r e v e n u e
Year Ind iv idua l C o r p o r a t i o n
i n c o m e income taxes taxes
Excise taxes*
Es ta te and gift taxes
Cus toms dut ies
Miscellaneous
taxes and receipts
Fede ra l old-age.
disability, and hospital
insurance t rust funds
A i rpo r t and a i rway trust fund
H i g h w a y trust fund
Rai l road re t i rement and unemp loymen t
trust funds
To ta l refunds of receipts
Cfl
H O
Cfl
c/3 Cfl O
o
Cfl
Cfl
> c/3 G
1962 $5,078,503,605 $773,053,077 $86,742,588 $18,816,683 $29,319,402 $1,225,761 1963 5,399,834,529 757,233,633 89.299.718 20.192.232 35.174.904 700,987 1964 5.893.412.362 808.341.188 93.004.025 22.704,075 32,313,299 1,196,525 1965 4,869.010.781 670,388.676 99,423,244 29,368.795 35,205.161 3.161.988 1966 5.851,430.133 761,215.081 216.797.297 27,604.514 44,627,265 285,306 1967 7,844,839,232 946,468,292 183,291,991 36,094,553 71,084.500 107.401 1968 9.526.532.235 1.231.846,317 126,964,025 31,283,087 75,236,726 62,797 1969 10,191.456,409 1,660,087,742 96,034,570 39,211,247 68,228,070 383,232 1970 13,239,798,270 2,207,653,279 166,700,341 35,655,493 64,078.834 60,157 1971 14,522,410,442 3,535,378,271 133,424,802 49,205,814 65,955,521 83,711 1972 14,142,569,841 2,759,629,377 1,055,924,767 54,107.460 107,393,343 146,698 1973.... 21,866,484,657 2,892,779,143 158,322,375 58,792,878 119,841,214 • 505.087 1974 23.952.018.185 3.124.789.480 140,624.127 66,034,063 109,920,085 278,275 1975 34,013,457,954 5,125,480.938 149.906.653 76,954,212 106,068,719 287,066 1976... 27,366,541,863 5.374.253.171 141.444.763 91,236,134 134,350,706 1,572,682 T.Q 957,609,664 1,348,438,946 44,209,349 30,654,352 30,599,390 97,380 1977 30.193,921,365 5,164,202,109 148,174,060 98.448,051 137,328,265 18,333,524
$141,667,500 $131,302,902 $5,037,793 $6,265,669,311 139,425,000 126,319.308 3,206,652 6.571.386.963 165,800.000 126,636,556 4.677.589 7,148.085,619 191,690,000 123,498,341 7,797,483 6,029,544,469 227,675,000 119,771,763 6.173,591 7,255,579,949 282,156,250 211,507,037 6,137,156 9,581,686.414 262.715.000 114.387.492 6.336,929 11,375,364,608 604,952,500 223,754,603 7,011,906 12.891.120,278 386,093,750 32,073,825 7,211,966 16,139.325,917 517,614,000 $1,676,730 122,512,416 8,202.857 18.956,464.564 447.332,000 1,499,163 312,710,263 13,811,137 18,895,124,050 478,856,000 1,631,848 152,502,445 19,475,384 25,749,191,032 535,206,000 2,162,548 123,398,541 26,699,562 28,081,130,866 360,000,000 1,369,101 146,079,815 33,351,156 40,012,955.615 407,628,000 1,882,649 152,035,116 31,981,183 33,702,926,265
579,032 522,307 6,171,523 2.418,881.943 400,140,000 2,068,399 135,127,710 35,953,269 36,333,696,752
* Excludes highway trust and airport and airway trust.
N O T E . — F o r refunds prior to fiscal 1962, see 1967 Annual Report, pp. 448-449.
Digitized for FRASER http://fraser.stlouisfed.org/ Federal Reserve Bank of St. Louis

STATISTICAL APPENDIX 15
TABLE 4.—Budget receipts and outlays, fiscal years 1976-77 [In thousands of dollars. On basis of Monthly Treasury Statement of
Receipts and Outlays of the United States Govemment]
1976 T.Q. 1977
NET RECEIPTS
Individual income taxes 131,602,555 38.800.969 156.725,183
Corporation income taxes 41,408,703 8,460,466 54.892.364
Social insurance taxes and contributions: Employment taxes and contributions:
Federal old-age and survivors insurance tmst fund: Federal Insurance Contributions Act taxes 49,294,805 13,827,917 57,212,744 Self-Employment Contributions Act taxes 2,753,440 211,175 3,143,019 Deposits by States 6.654,445 1.846.756 7,676,046
Total Federal old-age and survivors insurance tmst fund
Federal disability insurance tmst fund: Federal Insurance Contributions Act taxes Self-Employment Contributions Act taxes Deposits by States
Total Federal disability insurance tmst fund
Federal hospital insurance trust fund: Federal Insurance Contributions Act taxes Self-Employment Contributions Act taxes Receipts from railroad retirement account Deposits by States Premiums collected for uninsured individuals
Total Federal hospital insurance trust fund
Railroad retirement accounts: Railroad Retirement Tax Act taxes
Total employment taxes and contributions
Unemployment insurance: Unemployment tmst fund:
State taxes deposited in Treasury Federal Unemployment Tax Act taxes Railroad Unemployment Insurance Act contributions . . . .
Total unemployment trust fund
Contributions for other insurance and retirement: Federal supplementary medical insurance tmst fund:
Premiums collected for the aged Premiums collected for the disabled
Total Federal supplementary medical insurance tmst fund
Federal employees retirement contributions: Civil service retirement and disability fund Foreign service retirement and disability fund Other
Total Federal employees retirement contributions
Other retirement contributions: Civil service retirement and disability fund...,
Total contributions for other insurance and retirement .
Total social insurance taxes and contributions
58.702.690
6,483,738 363,412 838,943
7,686,092
10,141,309 401,386 130,904
1,313,803 7,696
11,995,098
1,525.144
79.909,024
6,404,310 1,531,107 118,241
8.053.658
1.768,967 168,330
1,937.296
2.741,214 14,572 4.380
2,760,167
54.231
4.751,695
92.714.377
15.885.848
1.816.960 27.268
285.823
2.130.051
2,842.436 30.699 135.863 447,557
2.248
3.458.803
328,310
21,803,012
2,289,297 371,241 37.365
2.697.903
492.298 46.350
538.648
702.554 3.489 204
706,247
13,323
1.258,218
25,759,134
68.031.809
7,566.649 413.693 805.160
8.785,502
11,740,578 456,885
1,276,073 10.506
13,484.042
1.908.494
92.209.847
9.252.205 1,874,718 184.583
11.311.506
1.986,937 205,966
2.192.903
2,889.816 18,538 1,343
2,909,697
58.923
5.161,524
108,682,876
Digitized for FRASER http://fraser.stlouisfed.org/ Federal Reserve Bank of St. Louis

16 1977 REPORT OF THE SECRETARY OF THE TREASURY
TABLE 4.—Budget receipts and outlays, fiscal years 1976-77^Continued [In thousands of dollars]
1976 T.Q. 1977
NET RECEIPTS—Continued Excise taxes: Miscellaneous excise taxes Airport and airway trust fund Highway tmst fund.
Total excise taxes
Estate and gift taxes
Customs duties
Miscellaneous receipts: Deposits of eamings by Federal Reserve banks Fees for licenses to import petroleum and petroleum
products* All other'
Total miscellaneous receipts
Total budget receipts
OUTLAYS
Legislative branch: Senate House of Representatives Joint items Congressional Budget Office Architect of the Capitol Library of Congress Govemment Printing Office:
General fund appropriations Revolving fund (net)
General Accounting Office United States Tax Court Other Proprietary receipts from the public Intrabudgetary transactions
Total legislative branch
The judiciary: Supreme Court of the United States Courts of appeals, district courts, and other judicial services
Federal Judicial Center Space and facilities, the judiciary Other Proprietary receipts from the public
Total the judiciary
Executive Office of the President: Compensation of the President The White House Office Office of Management and Budget Office of Telecommunications Policy Special Action Office for Dmg Abuse Prevention.... Other
Total Executive Office of the President
Funds appropriated to the President: Appalachian regional development programs Disaster relief Expansion of defense production Foreign assistance:
Intemational security assistance: Liquidation of foreign military sales fund
See footnotes at end of table.
10.611,502 2,519,737 9,647,548 937,930 276,901 1,190,936
5,413,150 1,676,060 6,709,231
16,962,582
5.216,229
4.074,176
4,472,698
1,454.592
1.212.173
17,547,715
7,326,877
5.150,151
5,450.824 1.500.459 5.908.214
1,890.326 685.305
8.026.454
300.005.077
—49.812 162,088
1.612.734
81.772.766
—12.617 640.568
6.536.165
356.861.331
125.366 197.525 51,233 2,763
57,282 117,195
122,329 —28,938 131,778 6,920 11,397
-15,481 - 3 1 8
31,672 56,648 17,566 1,776
15,200 27,432
32,317 8,271
32,691 1,754 3,108
-3,391 - 1 6 3
138,505 267,015 69,477 8,814
88,807 133,301
139,337 —24,346 154,639 8,564 10,109
-17,280 — 4 4 8
779,052 224,882 976,492
7,165
238,085 4,135 56,454 21,496
—2,315
1,872
61,255 1,149 .
16,189 . 5,550 — 8 2 6
8,319
282,670
""68^137 36,181
—3,468
325.021 85.188 391,839
250 15.791 23,591 9,009 12,826 17.756
63 4.136 5,373 2.136 788
3.712
250 17.236 26,536
29.364
79.224 16.206 73.386
319,283 291,137 —1,861
73,539 71,321
248,868 294,016
-68,155 —16.322 695
Digitized for FRASER http://fraser.stlouisfed.org/ Federal Reserve Bank of St. Louis

366,999
147,589 280,178 600,826 591,093
6,656,753 1,901
244,365 8,879 1,467
757,666 284,638 27,842
1,812,972
209,280
25,259 570,486
1,012,649 10,548
8,209,640 —10,521
—7,257,095 —218.692
1.101.398
64.513
901,949 143,880
—2,539,249 —114,173
468,084
-3.302
345,427 84.286
—9.368.676 —312.074
347.287
3.990
874,615 250.310
STATISTICAL APPENDIX 17
TABLE 4.—Budget receipts and outlays, fiscal years 797(^-77—Continued [In thousands of dollars]
1976 T.Q. 1977
OUTLAYS—Continued
Funds appropriated to the President—Continued Foreign assistance—Continued
Intemational security assistance—Continued Military assistance Foreign military training Military assistance. South Vietnamese forces Foreign military credit sales Security supporting assistance Emergency security assistance for Israel Advances, foreign military sales Other Proprietary receipts from the public: Advances, foreign military sales Other
Total intemational security assistance
Indochina postwar reconstruction assistance
Intemational development assistance: Multilateral assistance:
Intemational financial institutions Intemational organizations and programs
Bilateral assistance: Public enterprise funds: Development loans revolving fund 252,772 107.600 147.956 Overseas Private Investment Corporation —48,286 —1,765 —11,176 Inter-American Foundation 7,128 1,567 5,525 Other —92 616 1,079
Functional development assistance program 641,249 13,316 512,263 Payment to foreign seryice retirement and disability fund 16,090 580 21,250
American schools and hospitals abroad 17,030 6,982 13,799 Intemational disaster assistance 26,170 8,190 64,741 Other assistance programs 66,086 212,454 Intragovemmental funds 2,618 —301 —193 Operating expenses of the Agency for
Intemational Development 195,189 Other 40,192 Proprietary receipts from the public
Total bilateral assistance
Total intemational development assistance
Intemational narcotics control assistance President's foreign assistance contingency fund
Middle East special requirements fund
Total foreign assistance
Petroleum reserve Other
Total funds appropriated to the President
Department of Agriculture: Departmental management:
Departmental administration Federal Grain Inspection Service
—357,249
623,516
1,669,345
42.104 2,402
35.422
2.915.184
950
3.524.692
47.871
—169,889
179.348
609,060
3.044 1,442 7,942
1,086.271
—12.340 2,646
1,221.437
6,328
—483,528
507,098
1,632,023
31,404 467
49,105
2,064,276
—150,157 40,201
2,497,204
38,236 9.374
Science and education programs: Agricultural Research Service 247,442 69,774 294,581 Animal and Plant Health Inspection Service 376,445 96,324 337,120 Cooperative State Research Service 104,587 28,761 120,572 Extension Service 217,506 55,239 240,167 National Agricultural Library 5,372 1,192 6,336
Total science and education programs 951,352 251,290 998,775 Digitized for FRASER http://fraser.stlouisfed.org/ Federal Reserve Bank of St. Louis

18 1977 REPORT OF THE SECRETARY OF THE TREASURY
TABLE 4.—Budget receipts and outlays, fiscal years 1976-77—Continued [In thousands of dollars]
1976 T.Q. 1977
OUTLAYS—Continued
Department of Agriculture—Continued Agricultural economics:
Economic Management Support Center Statistical Reporting Service Economic Research Service
Marketing services Intemational programs: Foreign Agricultural Service Foreign assistance and special export programs
Agricultural Stabilization and Conservation Service: Salaries and expenses Sugar Act program Agricultural conservation program Cropland adjustment program Emergency conservation measures Forestry incentives programs Other
Total Agricultural Stabilization and Conservation Service
Corporations: Federal Crop Insurance Corporation:
Federal Crop Insurance Corporation fund Administrative and operating expenses
Commodity Credit Corporation: Price support and related programs Intragovemmental funds National Wool Act program
Total Commodity Credit Corporation
Total corporations
Rural development: Rural Development Service Rural Electrification Administration (salaries and expenses)
Farmers Home Administration: Public enterprise funds: Rural housing insurance fund Agricultural credit insurance fund Rural development insurance fund Other
Rural water and waste disposal grants Salaries and expenses Other
Total Fanners Home Administration
Total mral development
Soil Conservation Service: Conservation operations Watershed and flood prevention operations Other
Consumer programs: Agricultural Marketing Service:
Marketing services Funds for strengthening markets, income, and supply Milk market orders assessment fund Other
Total Agricultural Marketing Service
31,850 26,680 7,988
33,859 1,089.917
147.994 10.271
117,536 37,351 11,242 8.118 6.480
338.992
3.528 11.762
6.947 3,455 1,740
11,494 146,220
35,503 986
121,196 11
3,399 1,729 2.606
165,430
1,781 3.504
2,954 34,711 33,047 8,406
36.915 1.169.255
160,393
"""182^994
57I275
400.662
78.902 12.066
1.014,386 451,868 3,809,156 —344,942 231,612 —319,025
45,460 1,814 10,427
714,905
730,194
1,076
21,176
1,458 295,779 82,008
-4,666 75,264 148,463 17,031
615.337
637.590
207.483 156.660 74.611
43,240 286,433 —1,511 44,756
372,918
685,294
690,578
252
4.856
514,010 —159,027
- 4 5 5 2,155
24,148 37,383 5.449
423.663
428.771
57,069 47,712 21.325
9,922 63,909 — 9 5 0 9,400
82,280
3,500.559
3.591.526
1,328
21,709
88,803 393,435 167.552 - 9 2 0
112.912 171.329 28.768
961.878
984.914
215.145 177.258 80.441
45.120 41.921
—2.085 34.594
119.550
Digitized for FRASER http://fraser.stlouisfed.org/ Federal Reserve Bank of St. Louis

STATISTICAL APPENDIX 19
TABLE 4.—Budget receipts and outlays, fiscal years 7976-77—Continued [In thousands of dollars]
1976 T.Q. 1977
OUTLAYS—Continued
Department of Agriculture—Continued Food and Nutrition Service:
Food stamp program Special milk program Child nutrition programs Special supplemental food program (WIC) Food donations program Elderly feeding program
Total Food and Nutrition Service
Food Safety and Quality Service
Total consumer programs
Forest Service: Intragovemmental funds Forest protection and utilization Construction and land acquisition Forest roads and trails Forest Service permanent appropriations Cooperative work Other
Total Forest Service
Proprietary receipts from the public
Intrabudgetary transactions
Total Department of Agriculture
Department of Commerce: General administration Office of Energy Programs Bureau of the Census Bureau of Economic Analysis Economic development assistance:
Economic Development Administration: Economic development revolving fund Economic development assistance programs Local public works program Job opportunities program Other
Regional action planning commissions
Total economic development assistance
Promotion of industry and commerce: Domestic and Intemational Business Administration.. Minority Business Enterprise U.S. Travel Service
Total promotion of industry and commerce
Science and technology: National Oceanic and Atmospheric Administration ... National Fire Prevention and Control Administration Patent and Trademark Office Science and technical research
Total science and technology
5,774,500 88,710
1,801,566
7,776
7.672.552
1,366.642 46,993 346,012
446
1,760,093
5.398.795 157,034
2,635,039 245,356 27,752 21,476
8,485,453
95.772
8,045.470
-6,615 562,060 26,627 136,510 152,479 114,245 22.429
1,007,736
—591,942
12,796.311
14.457 1.623
77.988 8.081
—20,275 257,590
269,436 30,037 115.964
652.751
66.647 55,839 11,457
133,944
527,148 7,179 84.155 81.791
700.274
1,842,373
4,480 202,790
6,173 467
167,441 16,346 19,633
417,330
—248,441
3,849.622
4,961 455
18,173 2,655
—10,058 81,793
78,658 6,006
31.025
187,424
15,384 14,472 3,428
33,284
138,504 2,924 19,885 18.166
179.479
8.700,775
-8,365 724,843
201,652 93,152 70,426 81,756
1.163,465
—899,007 —9.121
16.737.730
19.930
89,242 12,304
—19,652 311,994 585,264 98,018 28,618 106,940
1,111,181
69,052 54,258 14,364
137,674
550,888 14,865 87,409 87,324
740,486
Digitized for FRASER http://fraser.stlouisfed.org/ Federal Reserve Bank of St. Louis
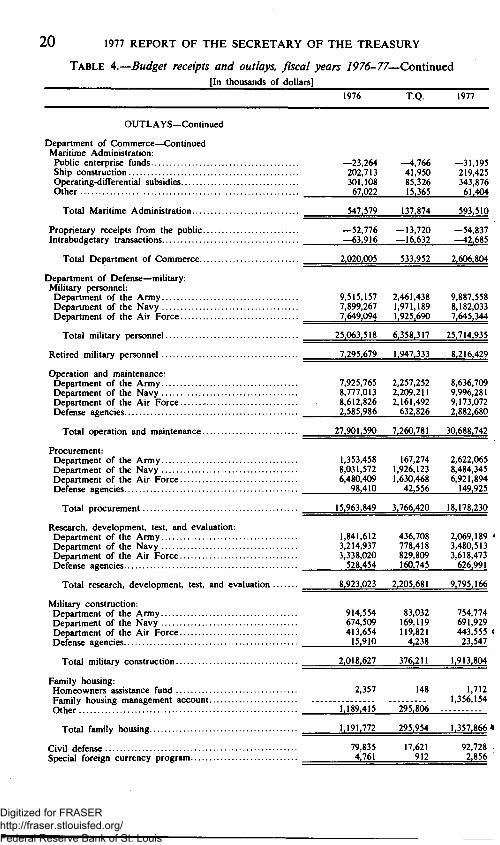
20 1977 REPORT OF THE SECRETARY OF THE TREASURY
TABLE 4.—Budget receipts and outlays, fiscal years 1976-77—Continued [In thousands of dollars]
1976 T.Q. 1977
OUTLAYS—Continued
Department of Commerce—Continued Maritime Administration:
Public enterprise funds Ship constmction Operating-differential subsidies Other
Total Maritime Administration
Proprietary receipts from the public Intrabudgetary transactions
Total Department of Commerce
Department of Defense—military: Military personnel:
Department of the Army Department of the Navy Department of the Air Force
Total military personnel
Retired military personnel
Operation and maintenance: Department of the Army Department of the Navy — Department of the Air Force Defense agencies
Total operation and maintenance
Procurement: Department of the Army Department of the Navy Department of the Air Force Defense agencies
Total procurement
Research, development, test, and evaluation: Department of the Army Department of the Navy Department of the Air Force Defense agencies
Total research, development, test, and evaluation
Military constmction: Department of the Army Department of the Navy Department of the Air Force Defense agencies
Total military constmction
Family housing: Homeowners assistance fund Family housing management account Other
Total family housing
Civil defense Special foreign currency program
_23,264 —4,766 —31,195 202,713 41,950 219,425 301,108 85,326 343,876 67,022 15,365 61,404
547.579
—52.776 —63.916
2.020,005
137.874
— 13,720 -16,632
533.952
593.510
—54.837 -42.685
2.606.804
9.515.157 2.461.438 9.887,558 7,899,267 1,971,189 8,182,033 7.649,094 1.925,690 7,645.344
25,063,518 6.358,317 25,714,935
7.295.679 1.947,333 8,216,429
7,925,765 2,257,252 8,636,709 8,777,013 2,209,211 9,996,281 8,612,826 2,161,492 9,173,072 2,585,986 632,826 2.882.680
27,901,590 7,260,781 30,688,742
1,353,458 167,274 2,622,065 8,031,572 1,926,123 8,484,345 6,480,409 1,630,468 6,921,894
98,410 42,556 149,925
15,963,849 3.766,420 18,178,230
1,841,612 436,708 2,069,189 3,214,937 778,418 3,480,513 3,338,020 829,809 3,618,473 528,454 160,745 626.991
8.923,023 2.205.681 9,795.166
914.554 83.032 754.774 674,509 169,119 691,929 413,654 119,821 443,555 « 15,910 4,238 23.547
2.018.627
2.357
1.189,415
1.191.772
79,835 4,761
376,211
148
295,806
295,954
17,621 912
1,913,804
1,712 1,356,154
1,357.866
92,728 2,856
Digitized for FRASER http://fraser.stlouisfed.org/ Federal Reserve Bank of St. Louis

STATISTICAL APPENDIX 21 TABLE 4.—Budget receipts and outlays, fiscal years 1976-77—Continned
[In thousands of dollars]
1976 T.Q. 1977
OUTLAYS—Continued
Department of Defense—military—Continued Revolving and management funds:
Public enterprise funds: Department of the Army Department of the Navy Department of the Air Force
Intragovemmental funds: Department of the Army Department of the Navy Department of the Air Force Defense agencies
Total revolving and management funds
Miscellaneous trust revolving funds Miscellaneous trust funds Proprietary receipts from the public Intrabudgetary transactions—
Total Department of Defense—military
Department of Defense—civil: Cemeterial expenses. Army Corps of Engineers:
Intragovemmental funds Other Proprietary receipts from the public
Soldiers' and Airmen's Home: Soldiers' and Airmen's Home revolving fund .. . Other
The Panama Canal: Panama Canal Company Other
Other Proprietary receipts from the public Intrabudgetary transactions
Total Department of Defense—civil
Department of Health, Education, and Welfare: Public Health Service:
Food and Drug Administration Health Services Administration:
Health maintenance organization loan and loan guarantee fund
Health services Indian health services and facilities Emergency health Other
Center for Disease Control
National Institutes of Health: Intragovemmental funds Cancer research Heart and lung research Arthritis, metabolism and digestive diseases . . . . Neurological diseases and stroke Allergy and infectious diseases General medical sciences Child health and human development Other research institutes Other
Total National Institutes of Health
1 -406
(•)
(•) -59
—53,956 —150,601 —24,308 28,182 —28,369 —66,416 -133,545 —117.195
4,929 1,501
—6,453 —25,024 2,162,250 621,923 —52,705 —17,420
—21 14,697
—2,552 60,304
-741 —37,606 —19.331
3.501
218.461 54,798
(•) —546
15,336 98,262
165,511 -253,079
—240,583
-19,391 8,379
—147,960 —6,944
88,036,155
—306,089
-5,363 3,635 7,474
—2,671
21,926,215
25.484
—60.855 8,631
—173,471 -9,092
95,751,453
4,815
—68,460 2,378,591 —47,207
2 15,801
— 1,468 —986 15,600 65,494
139 674 —9,803 —50,955 —6,397 —17,771
2,124,252 582,545 2,279,998
245,015
9,074 1,119,744 332,494
94 173,633
776 742,504 374,618 198,738 163,592 134,047 223,412 153,800 294,735 63,066
2.349,289
7,270 191,391 91,176
(*) 45.887
— 156.957 220,365 106,171 51,042 35,853 39,927 53,751 38,358 67,808 15,387
471,704
—8,072 1,028,970 395,321
8
244,647
1,890 798,558 350,357 186,751 147,305 132,636 163,153 129,841 274,778 67,772
2,253,040
See footnotes at end of table.
Digitized for FRASER http://fraser.stlouisfed.org/ Federal Reserve Bank of St. Louis
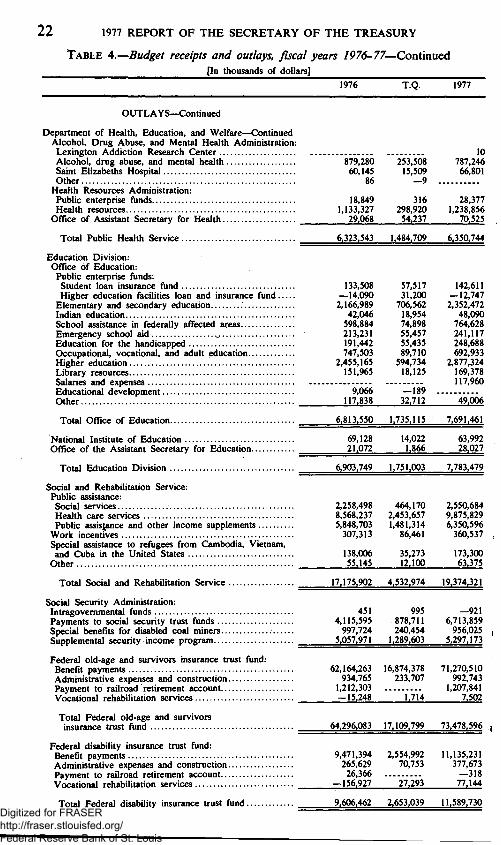
22 1977 REPORT OF THE SECRETARY OF THE TREASURY
TABLE 4.—Budget receipts and outlays, fiscal years 1976-77^Continued [In thousands of dollars]
1976 T.Q. 1977
OUTLAYS—Continued
Department of Health, Education, and Welfare—Continued Alcohol, Dmg Abuse, and Mental Health Administration;
Lexington Addiction Research Center Alcohol, dmg abuse, and mental health Saint Elizabeths Hospital Other
Health Resources Administration: Public enterprise funds Health resources
Office of Assistant Secretary for Health
Total Public Health Service
Education Division: Office of Education:
Public enterprise funds: Student loan insurance fund Higher education facilities loan and insurance fund
Elementary and secondary education Indian education School assistance in federally affected areas Emergency school aid , Education for the handicapped Occupational, vocational, and adult education Higher education Library resources Salaries and expenses Educational development Other
Total Office of Education
National Institute of Education Office of the Assistant Secretary for Education
Total Education Division
Social and Rehabilitation Service: Public assistance:
Social services Health care services Public assisjjance and other income supplements
Work incentives Special assistance to refugees from Cambodia, Vietnam, and Cuba in the United States
Other
Total Social and Rehabilitation Service
Social Security Administration: Intragovemmental funds Payments to social security tmst funds Special benefits for disabled coal miners Supplemental security income program
Federal old-age and survivors insurance tmst fund: Benefit payments Administrative expenses and constmction Payment to railroad retirement account Vocational rehabilitation services
Total Federal old-age and survivors insurance tmst fund
Federal disability insurance trust fund: Benefit payments Administrative expenses and constmction Payment to railroad retirement account Vocational rehabilitation services
Total Federal disability insurance tmst fund
879,280 60,145
86
253,508 15,509 —9
10 787,246 66,801
18,849 316 28,377 1.133,327 298,920 1,238,856
29,068 54.237 70.525
6.323.543
133,508 -14,090 2,166,989
42,046 598,884 213,231 191,442 747,503
2,455,165 151.965
9,066 117.838
6.813.550
69,128 21,072
6,903,749
1.484.709
57.517 31,200
706,562 18,954 74,898 55,457 55,435 89,710
594,734 18,125
— 1 8 9 32.712
1.735.115
14.022 1.866
1.751.003
6.350.744
142,611 -12,747 2,352,472
48,090 764,628 241,117 248,688 692,933
2,877,324 169,378 117,960
49.666
7.691.461
63,992 28.027
7.783.479
2.258.498 464,170 2,550,684 8,568,237 2,453,657 9,875,829 5,848,703 1,481,314 6,350,596 307,313 86,461 360,537
138,006 55,145
35,273 12.100
173,300 63,375
17.175.902 4.532.974 19.374.321
451 995 — 9 2 1 4,115,595 878,711 6,713,859 997,724 240,454 956,025
5,057,971 1,289,603 5,297,173
62,164,263 16,874,378 71,270,510 934,765 233,707 992,743
1,212,303 1,207,841 —15,248 1,714 7,502
64.296.083 17.109.799 73.478.596
9,471,394 2,554,992 11,135,231 265,629 70,753 377,673 26,366 — 3 1 8
—156.927 27,293 77,144
9,606,462 2,653,039 1L589,730 Digitized for FRASER http://fraser.stlouisfed.org/ Federal Reserve Bank of St. Louis

STATISTICAL APPENDIX 23 TABLE 4.—Budget receipts and outlays, fiscal years 1976-77—Continued
[In thousands of dollars]
1976 T.Q. 1977
OUTLAYS—Continued
Department of Health, Education, and Welfare—Continued Federal hospital insurance tmst fund:
Benefit payments Administrative expenses and constmction
Total Federal hospital insurance trust fund
Federal supplementary medical insurance trust fund: Benefit payments Administrative expenses and constmction
Total Federal supplementary medical insurance tmst fund
Total Social Security Administration
Special institutions: American Printing House for the Blind National Technical Institute for the Deaf Gallaudet College Howard University
Total special institutions
Assistant Secretary for Human Development Departmental management:
Intragovemmental funds Office for Civil Rights General departmental management Other
Proprietary receipts from the public Intrabudgetary transactions:
Payments for health insurance for the aged: Federal hospital insurance tmst fund Federal supplementary medical insurance tmst fund
Payments for military service credits and special benefits for the aged:
Federal old-age and survivors insurance tmst fund Federal disability insurance tmst fund Federal hospital insurance trust fund
Receipts transferred to railroad retirement account Interest on reimbursement of administrative and
vocational rehabilitation expenses: Federal old-age and survivors insurance trust fund Federal disability insurance trust fund Federal hospital insurance tmst fund Federal supplementary medical insurance trust fund
Other
Total Department of Health, Education, and Welfare ..
Department of Housing and Urban Development: Housing programs:
Public enterprise funds: Federal Housing Administration fund College housing—loans and other expenses Low-rent public housing—loans and other expenses Revolving fund (liquidating programs) Other
Intragovemmental funds Housing payments: College housing grants Low-rent public housing Home ownership assistance Rental housing assistance Rent supplement program
Payments for operation of low-income housing projects . Other
Total housing programs
12,270,382 308.246
12.578.627
4.671,847 528,246
5.200,093
101,853,006
2,407 11,846 29,678 84,817
128,747
1,639,282
1,485 25,101 99,395 12,608
-19,283
3,315,251 88.408
3.403.659
1,269,038 132.077
1.401.115
26.977.374
602 2,667 10,065 18,128
31,462
447,618
2,477 5,515
24,450 3,687
—4,647
14,912,370 294.779
15.207.149
5.866,922 474.744
6,341,666
119.583.278
2,986 12,671 36,893 101.936
154.487
1,872,290
148,241 24,153 102,366 22,786
-32,024
—610,430 —803,000 —2,939,338 —878,000 —5,052,944
—425,317 —613,902 —90,000 —103,000 —48,000 —141,000
—1,238,669 1,207.523
2,080 3,224 —725 2,267
—1,380 —1,041 25 —4,451
—6.818 —37.875 —7.318
128.784.967 34.340.745 147.455.436
1.191,196 —48,617
7,474 127,559
—13,143 —5,386
19,074 1,390,637 162,268 500,136 210,340 177,881
11
39,326 22,151 11,045 18,422
—5,389 7,840
2,654 280,372 39,695 142,475 53,349 127,586
955
492,384 -64,766 -32,336
36,367 -7,357 36,928
20,966 1,457,581 128,155 585,001 251,180 505,768
3.719.432 740,481 3,409,872 Digitized for FRASER http://fraser.stlouisfed.org/ Federal Reserve Bank of St. Louis

24 1977 REPORT OF THE SECRETARY OF THE TREASURY
TABLE 4.—Budget receipts and outlays, fiscal years 1976-77—Continned [In thousands of dollars]
1976 T.Q. 1977
OUTLAYS—Continued
Department of Housing and Urban Development—Continued
Govemment National Mortgage Association: Public enterprise funds:
Special assistance functions fund Management and liquidating functions fund Guarantees of mortgage-backed securities Participation sales fund
Total Govemment National Mortgage Association
Community planning and development: Public enterprise funds: Rehabilitation loan fund Urban renewal fund programs
Community development grants Comprehensive planning grants Other
Total community planning and development
New Communities Administration Federal Insurance Administration Consumer affairs and regulatory functions Policy development and research Departmental management:
Intragovemmental funds Salaries and expenses Other
Other Proprietary receipts from the public
Total Department of Housing and Urban Development .
Department of the Interior: Land and water resources: Bureau of Land Management:
Management of lands and resources Payments to counties, Oregon and Califomia grant lands Payments to States from receipts under Mineral Leasing Act
Other Bureau of Reclamation: Colorado River and Fort Peck projects Constmction and rehabilitation Operation and maintenance Other
Office of Water Research and Technology
Total land and water resources
Fish and wildlife and parks: Bureau of Outdoor Recreation United States Fish and Wildlife Service:
Resource management Recreational resources Other
National Park Service: Operation of the national park system Constmction Other
Total fish and wildlife and parks
657,695 —232,217 —1,029,193 —57,556 —7,361 —35,562 — 12,106 —4,820 —21,553
8,909 10,086 —5,134
596.941
23.213 1.188.271 982,789 93,837 135,603
2.423,713
15,165 94,530
54,081
-1,241 174,274
3,081 446
-1.289
7.079.133
181,311 49,348
119,601 53,310
40,368 318,432 115,372 99,320 22.838
999,901
281,574
115,070 68,957 34,571
248,148 68,313 77,725
894,357
—234,312
19,141 314,690 438,994 19,651 8,930
801,407
21,129 21,318
11,621
422 35,121
692 — 3 3
— 7 5 6
1,397,090
53,149 59,121
78,176 18,588
17,547 119,695 28,696 38,374 6,478
419,824
87,172
29,761 16,120 9,759
78,713 12,964 20,618
Z55,108
—1,091.442
41,032 850,271
2,088,813 76,914 18.684
3.075.714
88.834 99.678
382 62,593
337 186,502
1.463
5.832.430
302,935 29,563
105,130 166,382
112,317 468,166 141,818 154,163 14,332
1,494,807
350,397
134,758 82,644
^ 35,137
289,947 66,322 40,193
999,397
Digitized for FRASER http://fraser.stlouisfed.org/ Federal Reserve Bank of St. Louis

STATISTICAL APPENDIX 2 5
TABLE 4.—Budget receipts and outlays, fiscal years 1976-77—Continned [In thousands of dollars]
1976 T.Q. 1977
OUTLAYS—Continued
Department of the Interior—Continued Energy and minerals:
Geological Survey Mining Enforcement and Safety Administration Bureau of Mines:
Helium fund Other
Bonneville Power Administration Other power administrations
Total energy and minerals
Bureau of Indian Affairs: Public enterprise funds Operation of Indian programs... Construction Indian tribal funds Other
Total Bureau of Indian Affairs
Office of Territorial Affairs Office of the Solicitor and Office of the Secretary.... Proprietary receipts from the public Intrabudgetary transactions
Total Department of the Interior
Department of Justice: General administration Legal activities Federal Bureau of Investigation Immigration and Naturalization Service Federal Prison System Law Enforcement Assistance Administration Drug Enforcement Administration Proprietary receipts from the public
Total Department of Justice
Department of Labor: Employment and Training Administration:
Program administration Employment and training assistance Community service employment for older Americans Temporary employment assistance Eniergency employment assistance Federal unemployment benefits and allowances Grants to States for unemployment insurance and employment services
Advances to the unemployment trust fund and other funds
Other
Unemployment trust fund: Federal-State unemployment insurance:
State unemployment benefits Grants to States for unemployment insurance and employment services
Federal administrative expenses Railroad unemployment insurance:
Interest on refunds of taxes Railroad unemployment benefits Administrative expenses Payments of interest on advances from railroad retirement account
Total unemployment trust fund
Total Employment and Training Administration....
279.175 84.063
—1,942 133,445
—54,208 7^057
64,019 20,649
—248 31,637
—35,696 2,359
302,400 98,088
—296 150,554 —8,473
21.432
447,591 82,720 563,705
7,718 527,122
1,928 139,889
8,034 629,574 103,982
153,550 214,485
902,875
150,732 40,871
— 1,075,115 —67.731
2.293.480
104.862 70.655
317.334
48.560 11,976
—347,905
787,617
247,387 75.336
1.064.312
148,883 45,218
—1,169,154 —61.908
3.085.260
21,330 249,453 468,764 200,956 238,342 920,555 146,339 -4.165
5.265 66,007 130,177 58,920 64,339
213,082 43,927
—31,082
20,808 276,525 520,218 242,714 282,174 845,740 166,839 —5,292
2,241,574 550,633 2,349,726
116,943 3,175,191
1,887,327 —2,517
1,892,173
181,831
7,883,231
16,412,683
1,212,726 67,180
960 217,910
8,908
20.948 1,058,452
519,058 — 4 0 4
139,928
—26,302
1,110,768
3,105,643
379,812 9,000
462 46,619 2,093
76,881 3,290,860
72,102 2,340,409
""833^689
53,034
4,338,118 10,605
12,338,972
1,514,841 55,827
919 179,691 9,320
45
17.920.413^
33.054.592
215
3.543,844
6.366.292
3.388
14.102.958
25.118.056
Digitized for FRASER http://fraser.stlouisfed.org/ Federal Reserve Bank of St. Louis

26 1977 REPORT OF THE SECRETARY OF THE TREASURY
TABLE 4.—Budget receipts and outlays, fiscal years 1976-77—Continued [In thousands of dollars]
1976 T.Q. 1977
OUTLAYS—Continued
Department of Labor—Continued Labor-Management Services Administration Employment Standards Administration:
Salaries and expenses Special benefits Special workers' compensation expenses
Occupational Safety and Health Administration Bureau of Labor Statistics Departmental management Proprietary receipts from the public Intrabudgetary transactions
Total Department of Labor
Department of State: Administration of foreign affairs:
Intragovemmental funds Salaries and expenses Acquisition, operation, and maintenance of buildings abroad.
Payment to foreign service retirement and disability fund Foreign service retirement and disability fund Other
Total administration of foreign affairs
Intemational organizations and conferences Intemational commissions Educational exchange Other Proprietary receipts from the public Intrabudgetary transactions: Foreign service retirement and disability fund:
Receipts transferred to civil service retirement and disability fund
General fund contributions Other
Total Department of State
Department of Transportation: Office of the Secretary Coast Guard: Trust revolving fund Intragovemmental funds Operating expenses Acquisition, constmction, and improvements Retired pay Other
Total Coast Guard
Federal Aviation Administration: Aviation war risk insurance revolving fund Operations Other
Airport and airway tmst fund: Grants-in-aid for airports Facilities and equipment Research, engineering and development Interest on refunds of taxes Operations
Total airport and airway tmst fund
Total Federal Aviation Administration.
37,065 10,297 47,207
83,843 241,219 4,082
109,328 57,338 34,234
-1,090 -7.878.231
25.742.379
181 366.556
40,614 38.355 66,903 4,155
516,764
291,097 20,498 65,116
249,717 —25,962
— 4 3 6 —54,455
— 5 1 9
1.061.820
53,492
200 953
706,631 120,334 121,645 64,137
1.013.902
- 5 4 9 1.551,894
34.504
268.766 204,004 73,733
15 500
547,018
2.132.868
20.673 70,609 1.101
30.730 16,753 14,232 - 3 4 0
-625.000
5,905.346
- 1 9 78.731
3,002 1,590
18,234 1.287
102.825
174,079 5,638
21,321 26,486
—11,731
— 4 9 —2,170 — 2 5 5
316.144
25.040
- 5 1 2 1,881
195,119 33,259 32,612 25.221
287.580
- 3 0 2 381,679
8.344
25,503 48,364 18,092
26 16
92.001
481.722
97.937 297,695
3,581 127,400 75,843 48,845 — 4 1 4
-3.442.095
22.374.056
"""543^353
39,471 93,649 83,843 4,672
764,988
367,698 16,005 66,256 50,782
—18,243
— 2 4 8 —114,899
— 5 1 9
1,131,820
61,038
""827^675 131,581 139,516 60,016
1,158,788
— 8 9 7 1,475,819
41.325
334.823 197,109 70,487
15 250.230
852.664
2.368.912
Digitized for FRASER http://fraser.stlouisfed.org/ Federal Reserve Bank of St. Louis
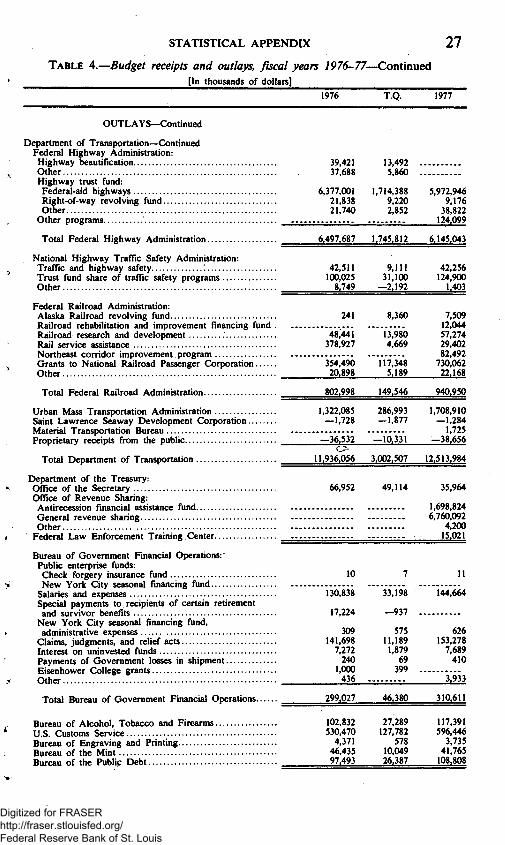
STATISTICAL APPENDIX 2 7
TABLE A.—Budget receipts and outlays, fiscal years 797(^77—Continued ^ [In thousands of dollars]
1976 T.Q. 1977
OUTLAYS—Continued
Department of Transportation—Continued Federal Highway Administration:
Highway beautification Other Highway tmst fund: Federal-aid highways Right-of-way revolving fund Other
Other programs
Total Federal Highway Administration
National Highway Traffic Safety Administration: Traffic and highway safety Trust fund share of traffic safety programs Other
Federal Railroad Administration: Alaska Railroad revolving fund Railroad rehabilitation and improvement financing fund . Railroad research and development Rail service assistance Northeast corridor improvement program Grants to National Railroad Passenger Corporation Other
Total Federal Railroad Administration
Urban Mass Transportation Administration Saint Lawrence Seaway Development Corporation Material Transportation Bureau Proprietary receipts from the public
Total Department of Transportation
Department of the Treasury: Office of the Secretary Office of Revenue Sharing:
Antirecession financial assistance fund General revenue sharing Other
Federal Law Enforcement Training Center
Bureau of Govemment Financial Operations: Public enterprise funds: Check forgery insurance fund New York City seasonal financing fund
Salaries and expenses Special payments to recipients of certain retirement and survivor benefits
New York City seasonal financing fund, administrative expenses
Claims, judgments, and relief acts Interest on uninvested funds Payments of Govemment losses in shipment Eisenhower College grants Other
Total Bureau of Govemment Financial Operations
Bureau of Alcohol, Tobacco and Firearms U.S. Customs Service Bureau of Engraving and Printing Bureau of the Mint Bureau of the Publip Debt
39,421 37,688
6,377,001 21,838 21,740
6.497.687
42,511 100,025 8.749
241
48.441 378.927
354,490 20,898
802,998
1,322,085 -1,728
-36.532
11.936.056
66,952
10
130,838
17,224
309 141,698 7,272 240
1,000 436
299.027
102,832 530.470 4,371
46.435 97.493
13,492 5,860
1,714,388 9,220 2,852
1.745,812
9,111 31,100
—2.192
8.360
13,980 4,669
117,348 5,189
149.546
286.993 —1,877
-10.331
3.002.507
49,114
7
33,198
- 9 3 7
575 11,189 1,879
69 399
46.380
27.289 127,782
578 10.049 26.387
5.972,946 9,176 38.822 124.099
6.145.043
42.256 124.900
1.403
7.509 12,044 57,274 29.402 82,492
730,062 22.168
940.950
1,708.910 -1,284
1,725 -38.656
12.513.984
35,964
1,698,824 6,760,092
4,200 15.021
11
144,664
626 153,278 7,689 410
"3I933
310.611
117,391 596,446
3.735 41,765 108.808
Digitized for FRASER http://fraser.stlouisfed.org/ Federal Reserve Bank of St. Louis

- 1 0 8 43,995
783,886 854,021 808,425 295,135 139,035
16 10,535
173,220 200,264 85,773 102,090 28,907
295,135 139,035
2,924,389
105,440 4,239
29,217,642 7,845,569
37.063,211
6.242,926 —601,579 —937,635
— 1.613,102
44.335,468
102,090 28,907
600,805
30,017 —22.096
7.798,145 303.416
8.101,561
1.587,642 —99,222
—374,601 —412.594
9.699.089
318,048 157.089
2.265.183
123.358 • —4.182
c
33,264,604 8,635.115
41,899.720'
—486,886 —2,241,185 —1.681.212*
49.560.182
28 1977 REPORT OF THE SECRETARY OF THE TREASURY
TABLE 4.—Budget receipts and outlays, fiscal years 1976-77—Continued ^ ^ [In thousands of dollars]
1976 T.Q. 1977
OUTLAYS—Continued
Department of the Treasury—Continued Intemal Revenue Service: Federal tax lien revolving fund Salaries and expenses Accounts, collection and taxpayer service Compliance. Payment where credit exceeds liability for tax Interest on refund of taxes Intemal revenue collections for Puerto Rico
Total Intemal Revenue Service
U.S. Secret Service Comptroller of the Currency
Interest on the public debt: Public issues Special issues'
Total interest on the public debt
General revenue sharing Proprietary receipts from the public Receipts from off-budget Federal agencies Intrabudgetary transactions
Total Department of the Treasury
Energy Research and Development Administration: Operating expenses 2,970,786 864,273 4,059,144 Plant and capital equipment 788,248 186,909 961,014 Other 349 127 880r Proprietary receipts froffPthe public —358 —99 —561 ^
Total Energy Research and Development Administration 3.759.025 1.051,211 5,020,477 i
Environmental Protection Agency: Revolving fund for certification and other services.... Agency and regional management Research and development: Energy research and development Pollution control and abatement Research and development -. Energy ,
Abatement and control Enforcement r Construction grants Other Proprietary receipts from the public
Total Environmental Protection Agency 3,117,746 1,108,362 4,364,808
General Services Administratipn: Real property activities Personal property activities:
Intragovemmental funds Federal Supply Service, operating expenses
Records activities Automated data and telecommunications activities Property management and disposal activities Preparedness activities General activities Proprietary receipts from the public:
Stockpile receipts Other
Intrabudgetary transactions
Total General Services Administration —92,142 3,202
See footnotes at end of table
— 2 1 4 65,498
65,687
170,196
31^672 51,264
2,428,569 25,259 - 1 8 5
— 2 5 16,193
24,749
43,585
*'"8'5',2'9'l 12,820
919,463 6,320 — 3 5
—100,013
—87,636 163,157 59,621
—5,087 752
15,001 69,090
—159,519 —43,669 —3,839
—9,872
—6,021 40,146 14,875 10,696 28,007 3,519 16,794
—63,451 — 3 1 4 4 2
— 3 4 9
— 122,467
—54,731 157,345. 65,773 12,658
345 17,161 83,525j
—148,413 -41,295
— 9 9 9
Digitized for FRASER http://fraser.stlouisfed.org/ Federal Reserve Bank of St. Louis
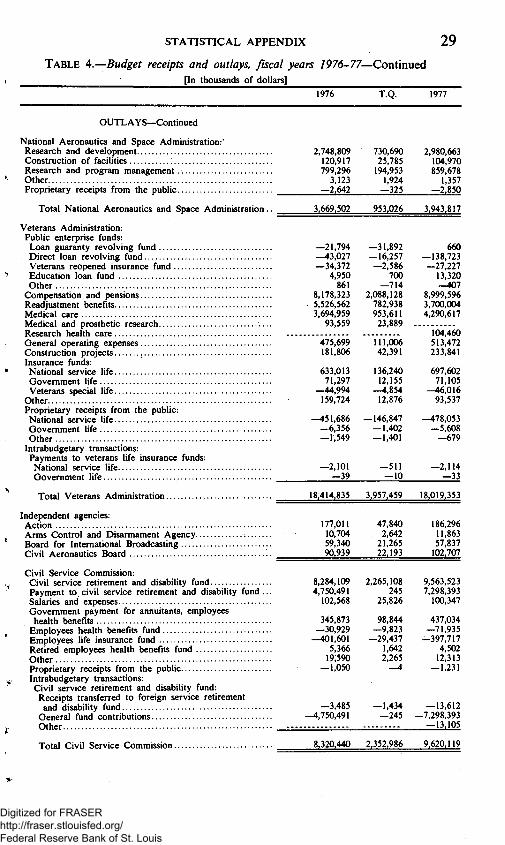
STATISTICAL APPENDIX 29 TABLE 4.—Budget receipts and outlays, fiscal years 1976-77—Continned
^ _ ^ [In thousands of dollars]
1976 T.Q. 1977
OUTLAYS—Continued
National Aeronautics and Space Administration:' Research and development Construction of facilities Research and program management Other Proprietary receipts from the public
Total National Aeronautics and Space Administration
Veterans Administration: Public enterprise funds:
Loan guaranty revolving fund Direct loan revolving fund Veterans reopened insurance fund Education loan fund Other
Compensation and pensions Readjustment benefits Medical care Medical and prosthetic research Research health care General operating expenses Constmction projects Insurance funds: National service life Govemment life Veterans special life
Other Proprietary receipts from the public: National service life Govemment life Other
Intrabudgetary transactions: Payments to veterans life insurance funds: National service life Govemment life
Total Veterans Administration
Independent agencies: Action Arms Control and Disarmament Agency Board for Intemational Broadcasting Civil Aeronautics Board
Civil Service Commission: Civil service retirement and disability fund Payment to. civil service retirement and disability fund . Salaries and expenses Govemment payment for annuitants, employees
health benefits Employees health benefits fund Employees life insurance fund Retired employees health benefits fund Other Proprietary receipts from the public Intrabudgetary transactions: Civil service retirement and disability fund:
Receipts transferred to foreign service retirement and disability fund
General fund contributions Other
Total Civil Service Commission
2,748,809 120,917 799,296
3,123 —2.642
3.669.502
—21,794 —43,027 —34,372
4,950 861
8,178,323 • 5,526,562 3,694,959
93,559
475,699 181,806
633.013 71,297
—44.994 159,724
—451,686 —6,356 — 1,549
—2,101 —39
18.414.835
177,011 10,704 59,340 90,939
8,284,109 4,750,491 102,568
345,873 —30,929
—401,601 5,366 19,590
—1,050
—3,485 —4,750,491
8.320.440
730.690 25,785 194,953
1,924 - 3 2 5
953,026
—31,892 —16,257 —2,586
700 — 7 1 4
2,088,128 782,938 953,611 23,889
111,006 42,391
136,240 12,155
—4,854 12,876
—146,847 —1,402 —1,401
—511 —10
3.957,459
47,840 2,642
21,265 22,193
2,265,108 245
25,826
98,844 —9,823
—29,437 1,642 2,265 —4
—1,434 — 2 4 5
2,352,986
2,980,663 104,970 859,678
1.357 —2,850
3,943,817
660 —138,723 —27,227
13,320 — 4 0 7
8,999,596 3,700,004 4,290,617
104 460 513,472 233,841
697,602 71,105
-46,016 93,537
-478,053 —5,608 — 6 7 9
—2,114 —33
18,019,353
186,296 11,863 57,837 102.707
9,563,523 7,298,393 100,347
437,034 —71.935
—397.717 4,502 12,313
-1,231
-13,612 -7,298,393
—13,105
9.620.119
Digitized for FRASER http://fraser.stlouisfed.org/ Federal Reserve Bank of St. Louis

30 1977 REPORT OF THE SECRETARY OF THE TREASURY
TABLE 4.—Budget receipts and outlays, fiscal years 797(^77—Continued [In thousands of dollars]
1976 T.Q. 1977
OUTLAYS—Continued
Independent agencies—Continued Commission on Civil Rights Commodity Futures Trading Commission Community Services Administration Consumer Product Safety Commission Corporation for Public Broadcasting District of Columbia:
Federal payment Loans and repayable advances
Emergency Loan Guarantee Board Equal Employment Opportunity Commission Export-Import Bank of the United States Federal Communications Commission Federal Deposit Insurance Corporation Federal Energy Administration Federal Home Loan Bank Board:
Public enterprise funds: Federal Home Loan Bank Board revolving fund Federal Savings and Loan Insurance Corporation fund
Interest adjustment payments % Federal Maritime Commission Federal Mediation and Conciliation Service Federal Power Commission Federal Trade Commission Historical and Memorial Commission Intergovemmental agencies: Washington Metropolitan Area Transit Authority Other
Intemational Trade Commission Interstate Commerce Commission Legal Services Corporation National Credit Union Administration National Foundation on the Arts and the Humanities.... National Labor Relations Board National Science Foundation Nuclear Regulatory Commission Postal Service Postal Service: Payment to the postal service fund
Railroad Retirement Board: Regional rail transportation protective account Payments to railroad retirement trust fund Ridlroad retirement account:
Benefit payments and claims Benefit payments, etc Advances to the railroad retirement account from
the FOASI tmst fund Advances to the railroad retirement account from the FDI trust fund
Disbursements for the payment of FOASI benefits Disbursements for the payment of FDI benefits Administrative expenses Interest on refunds of taxes
Proprietary receipts from the public Intrabudgetary transactions: Railroad retirement account:
Payments to railroad retirement trust funds Interest transferred to Federal hospital insurance trust fund
Total Railroad Retirement Board
Securities and Exchange Commission Selective Service System
7,863
448,733 38,351 70,000
231.800 115,832 —6,957 59,143
* 872,744 52,486
—478,330 140,603
286,620 —367,757
2,284 7,784 17,908 35.704 43,729 12,788
169,808 4,291 9,715
47.440 84.634
—19.896 151,860 67,466
731,905 179,956
1,719,650
1,873
123,700 10,189 26,000
90,396 82,714
-3,872 16.204
* 282,882 12,756
133,280 -26.593
-43,439 -135,216
488 1.892 4,335 8,639 11,117 5,839
51.678 1.011 2,472 12,582 51,769 3,532
43,895 15,717
206,475 45,819
937,742
9,476 13,489
639.363 39,867 ' 103,000
279,357 36,360
—5,014 ^ 71,729 .
339,977 , 55,776
—851.645 148,607 ^
—1,490.915 —423.511
1,071 1 8,449 19.570 „ 40,932 51,703 7,850 -
289,804 3,599 10.806 60,602 125,004
—19,282 , 192,753 • 80,546
752,035 i 230,547
<
250,000
"3',447'.792
27,524 14
—1
-250,000
9.284
913,267
7,359 3
(•)
2.267.449
3,768,376
-80,700
-12,900 81,024 12,614 31,200
8 1
—250,000
6.776
3.482.102
50,618 37.493
6.879
936.792
11.568 3.993
- 7 5 7
3.858.848
53.635 9.587
See footnotes at end of table.
Digitized for FRASER http://fraser.stlouisfed.org/ Federal Reserve Bank of St. Louis

STATISTICAL APPENDIX 31 TABLE 4.—Budget receipts and outlays, fiscal years 1976-77—ContinMed
[In thousands of dollars]
1976 T.Q. 1977
OUTLAYS—Continued
Independent agencies—Continued Small Business Administration:
Public enterprise funds: Busings loan and investment fund Disaster loan fund Lease guarantees revolving fund Surety bond guarantees revolving fund Other
Salaries and expenses Proprietary receipts from the public Intrabudgetary transactions
Total Small Business Administration
Smithsonian Institution Temporary study commissions
Tennessee Valley Authority: Tennessee Valley Authority fund Proprietary receipts from the public
Total Tennessee Valley Authority
U.S. Information Agency: Salaries and expenses. Special intemational exhibitions Other Proprietary receipts from the public
Total U.S. Information Agency
United States Railway Asspciation: Administrative expenses Purchase of Conrail securities
U.S. Railway Association Water Resources Council Other independent agencies
Total independent agencies
Undistributed offsetting receipts: Federal employer contributions to retirement and social
insurance funds: Legislative branch:
U.S. Tax Court: Tax Court judges survivors annuity fund
The judiciary: Judicial survivors annuity fund
Department of Health. Education, and Welfare: Federal old-age and survivors insurance tmst fund.... Federal disability insurance trust fund Federal hospital insurance tmst fund...
Department of State: Foreign service retirement and disability fund
Independent agencies: Civil Service Commission:
Civil service retirement and disability fund Receipts from off-budget Federal agencies:
Independent agencies: Civil Service Commission:
Civil service retirement and disability fund
Subtotal
See footnotes at end of table.
252,796 129,303 2.992 17,230
33,863 - 2 0
436.164
112.772 13.602
980,345 - 2 7
980.318
247.069 7,899 2.427 — 3 6 0
257.034
329,020 10,943 52,031
M9.158.691
63,454 5,826 614
2,293
5,961 - 3
78.144
30,423 3.153
232,137 . — 7
232.130
70,176 2,063 680 115
73.035
3,150 2,026 12.710
* 5.809.928
463,534 184,200
19^567 3,806
28,942 — 1 5
699.974
114,988 15.147
1,099,595 - 3 6
1.099.559
251,867 6.218 3.525 — 3 9 0
261.220
12.320 723.180
12^238 85,569
20,014,438
—30
— 7 7 4
-852,000 111.000 -175.000
—8
— 1 9 4
—220.000 —29.000 —45.000
—30
—1.197
—863.000 —114.000 —175.000
-13,942
—2,080,183
-3,539 -16,879
-592,247 —2.191.994
-1.008.927 —95.138 —1.185.973
4.241.856 —985.125 1,548.073
Digitized for FRASER http://fraser.stlouisfed.org/ Federal Reserve Bank of St. Louis
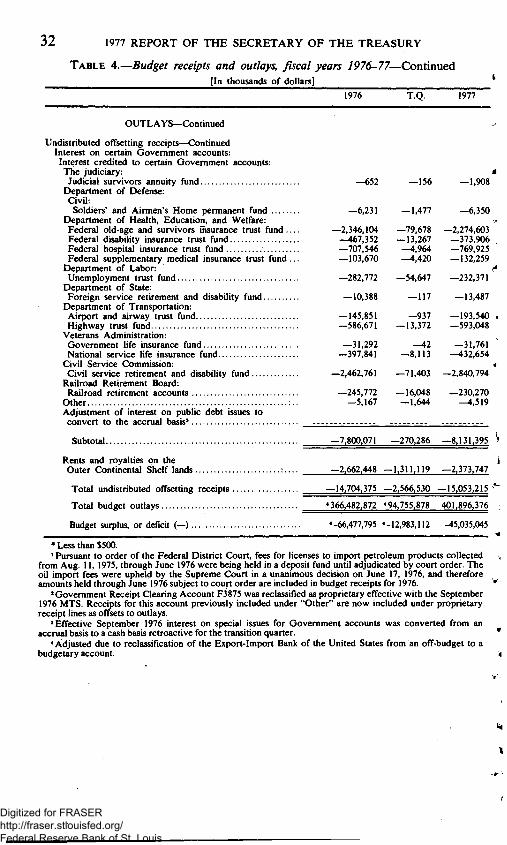
32 1977 REPORT OF THE SECRETARY OF THE TREASURY
TABLE 4.—Budget receipts and outlays, fiscal years 1976-77—Continned [In thousands of dollars]
1976 T.Q. 1977
OUTLAYS—Continued
Undistributed offsetting receipts—Continued Interest on certain Govemment accounts:
Interest credited to certain Govemment accounts: The judiciary: ;• Judicial survivors annuity fund —652 —156 —1,908
Department of Defense: Civil:
Soldiers' and Airmen's Home permanent fund —6,231 —1,477 —6,350 Department of Health, Education, and Welfare:
Federal old-age and survivors insurance tmst fund . . . . —2,346,104 —79,678 —2,274,603 Federal disability insurance tmst fund —467,352 —13,267 —373,906 Federal hospital insurance tmst fund —707,546 —4,964 —769,925 Federal supplementary medical insurance trust fund... —103,670 —4,420 —132,259
Department of Labor: ^ Unemployment trust fund —282,772 —54,647 —232,371
Department of State: Foreign service retirement and disability fund —10,388 —117 —13,487
Department of Transportation: Airport and airway tmst fund —145,851 —937 —193,540 < Highway tmst fund —586,671 —13,372 —593.048
Veterans Administration: Govemment life insurance fund —31.292 —42 —31.761 National service life insurance fund —397.841 —8,113 —432,654
Civil Service Commission: .4 Civil service retirement and disability fund —2,462.761 —71,403 —2,840,794
Railroad Retirement Board: Railroad retirement accounts —245,772 — 16,048 —230.270
Other —5.167 —1.644 —4,519 Adjustment of interest on public debt issues to convert to the accrual basis'
Subtotal —7,800,071 —270,286 —8,131,395 "«
Rents and royalties on the i Outer Continental Shelf lands : . . . . —2,662,448 —1,311,119 —2.373.747
Total undistributed offsetting receipts —14,704,375 —2,566.530 —15,053,215 '^
Total budget outlays «366,482,872 «94,755.878 401,896.376
Budget surplus, or deficit (—) «-66,477,795 *-12,983,112 -45,035,045
• Less than $500. »Pursuant to order of the Federal District Court, fees for licenses to import petroleum products collected \
from Aug. 11, 1975. through June 1976 were being held in a deposit fund until adjudicated by court order. The oil import fees were upheld by the Supreme Court in a unanimous decision on June 17, 1976, and therefore amounts held through June 1976 subject to court order are included in budget receipts for 1976. *"
'Govemment Receipt Clearing Account F3875 was reclassified as proprietary effective with the September 1976 MTS. Receipts for this account previously included under "Other" are now included under proprietary receipt lines as offsets to putlays.
'Effective September 1976 interest on special issues for Govemment accounts.was converted from an accmal basis to a cash basis retroactive for the transition quarter. *
* Adjusted due to reclassification of the Export-Import Bank of the United States from an off-budget to a budgetary account. \
Digitized for FRASER http://fraser.stlouisfed.org/ Federal Reserve Bank of St. Louis

TABLE 5.—Means of financing June 30, 1976, and Sept. 30, 1976 and 1977 [In thousands of dollars. On basis of Monthly Treasury Statement of Receipts and Outlays of the United States Govemment]
Classification (Assets and liabilities
directly related to the budget)
June 30. 1976
Net Closing transactions balances
Sept. 30. 1976
Net Closing transactions balances
Sept. 30. 1977
Net Closing transactions balances
LIABILITY ACCOUNTS
Borrowing from the public: Public debt securities, issued under general financing authorities:
Obligations of the United States, issued by: U.S. Treasury 87,252,919 620,432,182 14,268,983 634,701,165 64.138.743 698.839,908 Federal Financing Bank —8.925 75 75 ^^^55 20 ^
H Total public debt securities 87.243.994 620,432.257 14.268.983 634.701.240 64,138.688 698.839.928 >
HH
Agency securities: ^ Obligations of the United States, issued by: Id
Export-Import Bank* 580.563 3.173.678 417,486 3,591.164 —732.990 2.858,174 O Obligations guaranteed by the United States, issued by: ^
Department of Defense: " Family housing mortgages —103,878 1,168,914 —35,128 1,133,786 —120,195 1,013,591 >
Department of Housing and Urban Development: 2 Federal Housing Administration 94,134 581,069 —2,951 578,118 1,011 579,129 g
Department of Transportation: 2^ Coast Guard: O
Family housing mortgages - 1 8 7 2,090 - 4 8 2,042 - 1 9 7 1,844 tt Obligations not guaranteed by the United States, issued by: "^
Department of Defense: Homeowners assistance mortgages —430 2,582 18 2,601 —514 2,086
Department of Housing and Urban Development: Govemment National Mortgage Association —80,000 4,180.000 —35.000 4.145.000 —377.000 3,768.000
Independent agencies: Postal Service Tennessee Valley Authority
Total agency securities *
Total Federal securities *
See footnotes at end of table. t>J t>J
490.202
87.734.196
250.000 2,075.000
11,433^33
631.865.590
•"llVoo.666
244,377
14.513.360
250.000 1.975,000
11.677.710
646.378.950
""—iso^ooo
— 1.379.886
62.758.803
250,000 1.825.000
10.297.825
709.137,753
Digitized for FRASER http://fraser.stlouisfed.org/ Federal Reserve Bank of St. Louis

TABLE 5.—Means of financing, June 30, 1976, and Sept 30, 1976 and 1977—Coniinued [In thousands of dollars]
t>J 4^
Classification (Assets and liabilities
directly related to the budget)
June 30, 1976
Net Closing
Sept. 30, 1976
Net Closing transactions balances
Sept. 30, 1977
Net Closing transactions balances
LIABILITY ACCOUNTS—Continued
Deduct: Federal securities held as investments of Govemment accounts'
Total borrowing from the public *
Accmed interest payable on public securities Deduct:
Accmed interest receivable on public debt securities held as investments of Govemment accounts
Total accrued interest payable to the public
Deposit funds: Allocations of special drawing rights Other
Miscellaneous liability accounts (includes checks outstanding, etc.)
Total liability accounts *
ASSET ACCOUNTS (Deduct)
Cash and monetary assets: U.S. Treasury operating cash
Special drawing rights: Total holdings SDR certificates issued to Federal Reserve banks
Balance
4.340.794
83.393.402
915.030
—19.111
934.141
151.565.894
480.299.696
4,2H274
311.922
3.922.351
—3.513.684
18.027.045
143.523
—311.922
455.446
148,052.209
498.326.741
4,377.797
4.377.797
9.242.952
53.515.851
257,038
257.038
157.295.161
551.842.592
4,712.426
» 4.712.426
—207,188 —817,185
2,629,119 3,050,678
25.225 9.273
2,654.344 3,059,951
14,787 229,884
2,669.132 3,289.835
-1.802.637
81.500.532
7.245.600
—101.763 —200.000
-301.763
5.644.863
495.546.708
14.834.741
2.315,900 —700.000
1.615.900
92.319
18.609.307
2.579.478
40,734 —100.000
-59.266
5.737.182
514.156.015
17.414.219
2,356,633 —800.000
1.556.633
2.240.920
56.258.480
1.689.554
132.642 -400.000
-267.358
7.900.510
570.414.495
19.103.773
2,489,275 —1.200.000
1.289.275
w s o *I1
m (fi
O
H X w H
t/i C
Digitized for FRASER http://fraser.stlouisfed.org/ Federal Reserve Bank of St. Louis

Gold tranche drawing rights: U.S. subscription to Intemational Monetary Fund:
Direct quota payments 6.700.000 6.700.000 6.700.000 Maintenance of value adjustments —605.133 978.837 73.675 1.052.512 43.189 1.095.701
Other demand liabilities issued to IMF 1.452.953 —4.466.289 725.000 —3.741.289 81.438 —3.659.852 Receivable/payable (—) for U.S. currency valuation adjustment 176.060 22,420 —34,773 —12,352 7,454 -^ ,899
Balance 1,023,880
—172.159
7.795.557
63.106
7.858.664
-h73.641.868
—6.875.691
3.234.968
4.023.558
23.709.166
2.849.716
26.558.882
-1-468.987.825
—6.875.691
763.903
—385.395
2.898.720
781,347
3.680,067
-1-14,929,241
— 1.547,876
3.998.870
3.638.164
26.607.886
3.631.063
30.238.949
-1-483.917.066
— 1.547.876
132.081
669.376 14.230
2.237.882
738.275
2.976.157
-1-53.282.323
—8.247.278
4.130.951
669.376 3.652.393
28.845.768
4.369.338
33.215.106
-H 537.199.389
—8.247.278
Loans to Intemational Monetary Fund
Other cash and monetary assets
Total cash and monetary assets
Miscellaneous asset accounts
Total asset accounts 7.858.664 26.558.882 3.680.067 30.238.949 2,976.157 33.215.106 ^
Excess ofliabilities (-I-) or assets (—)» -H73.641.868 -H468.987.825 -t-14.929.241 -1-483.917.066 -h 53.282.323 -H537.199.389 H
Transactions not applied to current year's surplus or deficit* —6.875.691 —6.875.691 —1.547.876 —1.547,876 —8.247.278 —8.247.278 H O
Total budget financing [financing of deficit(-I-)or disposition of surplus(—)]*. -f 66.766.177 -1-462.112.134 -1-13.381.365 -1-482.369.190 +45.035.045 -1-528.952.111 > ._.._______,_.__^__..___._._._._.^___..««__.^.^-«-____-_---.--—_-_---^-—^—^——-^^ ^ »Adjusted due to reclassification of certain Export-Import Bank transactions from net ' See tables 6 and 20. <
outlays to security transactions. ' Difference of $77.591.000 is due to reclassification of 20A8045. hfl
z 2
Digitized for FRASER http://fraser.stlouisfed.org/ Federal Reserve Bank of St. Louis

—6,000 ---22.832
117,719 — 16
19,928
—3,033
10,146 1.714
4,715
27,683 — 3
—2,120
—423
5,800 —901
-6.000 32,240
190.531 — 183
—904
-3,657
18,329 3.184
36 1977 REPORT OF THE SECRETARY OF THE TREASURY
TABLE 6.—Investments of Government accounts in Federal securities (net), June 30, 1976, and Sept. 30, 1976 and 1977
[Amounts represent public debt securities unless stated otherwise. Par value. In thousands of dollars. Basis: Monthly Treasury Statement of Receipts and Outlays of the United States Govemment]
Agency June 30. 1976 Sept. 30, 1976 Sept. 30, 1977
Federal funds: Department of Agriculture:
Agency securities Department of Commerce Department of Housing and Urban Development:
Federal Housing Administration: Federal Housing Administration fund:
Public debt securities Agency securities
Govemment National Mortgage Association: Special assistance functions fund: Agency securities
Management and liquidating functions fund: Agency securities
Guarantees of mortgage-backed securities: Public debt securities Agency securities
Participation sales fund: Public debt securities 260,887 26.794 —95,274 Agency securities
Housing management: Community disposal operations fund:
Agency securities Rental housing assistance fund 12,401 —46,710
New Communities Administration: New communities fund —5,478
Federal Insurance Administration: National insurance development fund 12,190 1,521 —3,465
Department of the Interior: Bonneville Power Administration 23,330 5,200 —39,345
Department of Transportation 14,100 315 940 Department of the Treasury 60,162 17,766 520,228 Veterans Administration:
Veterans reopened insurance fund 33,018 3,512 28,163 Independent agencies: Emergency Loan Guarantee Board 6,978 2,650 5,580 Export-Import Bank of the United States 12,600 Federal Energy Administration 1,712,430 —1,712,430 Federal Savings and Loan Insurance
Corporation: Public debt securities 367,753 135,230 433,323 Agency securities —9,812
National Credit Union Administration Other
Total public debt securities Total agency securities
Total Federal funds
Tmst funds: Legislative branch:
U.S. Tax Court 75 22 34
18,310 50,755
2,717,533 12.594
2.730,126
—2,928 6,650
-1,524,232 -3,448
-1,527,679
19,559 49,760
1,173,169 — 17.371
1,155.798
Library of Congress., The judiciary:
Judicial survivors annuity fund Department of Agriculture Department of Commerce: Department of Defense Department of Health, Education, and Welfare: Federal old-age and survivors insurance
trust fund: Public debt securities Agency securities
Federal disability insurance trust fund
735 99
— 7 6 . 17
— 1,924,813
— 1,227,028
230 — 6 5
— 166
-912,763
—477,491
30,548 1,833
10 1,485
-1,645,020
-2,211,337
Digitized for FRASER http://fraser.stlouisfed.org/ Federal Reserve Bank of St. Louis
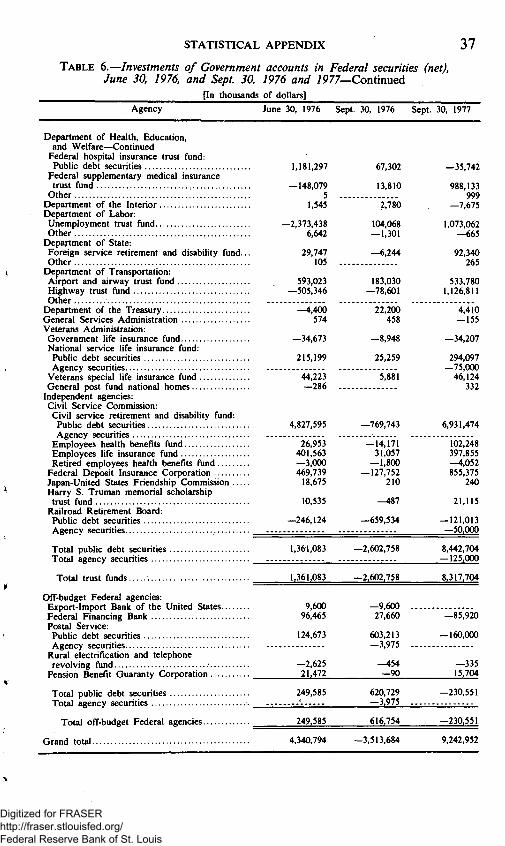
STATISTICAL APPENDIX 37 TABLE 6.—Investments of Government accounts in Federal securities (net),
June 30, 1976, and Sept. 30, 1976 and 7977—Continued [In thousands of dollars]
Agency June 30, 1976 Sept. 30, 1976 Sept. 30, 1977
Department of Health, Education, and Welfare—Continued
Federal hospital insurance tmst fund: Public debt securities
Federal supplementary medical insurance tmst fund
Other Department of the Interior Department of Labor: Unemployment tmst fund Other
Department of State: Foreign service retirement and disability fund. Other
Department of Transportation: Airport and airway tmst fund Highway tmst fund Other
Department of the Treasury General Services Administration Veterans Administration: Govemment life insurance fund National service life insurance fund: Public debt securities Agency securities
Veterans special life insurance fund General post fund national homes
Independent agencies: Civil Service Commission: Civil service retirement and disability fund:
Public debt securities Agency securities
Employees health benefits fund Employees life insurance fund Retired employees health benefits fund
Federal Deposit Insurance Corporation Japan-United States Friendship Commission ... Harry S. Truman memorial scholarship
trust fund Railroad Retirement Board:
Public debt securities Agency securities
Totial public debt securities
Total agency securities
Total tmst funds
Off-budget Federal agencies: Export-Import Bank of the United States Federal Financing Bank Postal Service: Public debt securities Agency securities
Rural electrification and telephone revolving fund •
Pension Benefit Guaranty Corporation Total public debt securities
Total agency securities
Total off-budget Federal agencies
Grand total
1,181,297
—148,079 5 .
1,545
-2,373.438 6.642
29.747 105 .
593.023 —505.346
—4.400 574
—34,673
215,199
44,223 — 2 8 6 .
67,302
13,810
2,78b
104,068 —1,301
—6,244
183,030 —78,601
22,200 458
—8,948
25,259
5,881
—35,742
988,133 999
—7,675
1,073,062 —665
92,340 265
533,780 1,126,811
4,410 —155
—34,207
294,097 —75.000
46.124 332
4.827.595 -769.743 6.931,474
26,953 401,563 —3,000 469,739 18,675
10,535
—246,124
1,361,083
1,361.083
9,600 96,465
124,673
-2,625 21.472
249,585
249.585
4,340,794
—14,171 31,057
-1,800 —127,752
210
- 4 8 7
—659,534
—2,602,758
—2.602.758
—9.600 ... 27,660
603,213 —3.975 ...
— 4 5 4 — 9 0
620.729 —3,975 ...
616,754
—3,513,684
102,248 397,855 —4,052 855,375
240
21,115
—121,013 —50.000
8.442.704 — 125,000
8.317,704
—85,920
—160,000
—335 15,704
—230,551
—230,551
9,242,952
Digitized for FRASER http://fraser.stlouisfed.org/ Federal Reserve Bank of St. Louis

TABLE 7.—Receipts by department and agency, fiscal year 1977 [Basis: Combined Statement of Receipts, Expenditures and Balances of the United States Govemment]
OO
Department or agency Budget receipts
Proprietary receipts from
the public
Intrabudgetary
Interfund. deducted
by agency
Interfund, not deducted
by agency
Receipts from off-budget
Federal agencies
Total receipts offset against
outlays
Legislative branch $5,003,733 The judiciary 60,051,348 Funds appropriated to the President:
Intemational security assistance Intemational development assistance 9,087 Other 901
Agriculture Department 2,554,453 Commerce Department 38,749,463 Defense Department:
Military 6,390,695 Civil 10,402,664
Health, Education, and Welfare Department 92,495,227,363 Housing and Urban Development Department 365,793 Interior Department 50,820,388 Justice Department 26,758,593 Labor Department 11,321,208,740 State Department 63,311,033 Transportation Department 7,914,047,492 Treasury Department 239,923,712,137 Energy Research and Development Administration . . . 148 Environmental Protection Agency 2,375,866 General Services Administration —47,404 National Aeronautics and Space Administration 5,259 Veterans Administration 5,459,080 Other independent agencies 4,934,924,544 Rents and royalties on the Outer Continental
Shelf lands
Total 356,861,331,378
$17,279,660 $448,392 3,468,122
9,680,750,020 483,528,191 379,509.862 899.006,903 9,121,421
54,837,116 42,685,367
173,471,203 9,091,780 98,162,203 17,771,464 32.0^4.235 7.928.686.192
1.503,483 1,169,154,370 61,908,107
5,292,165 414,073 3,442,095,000
18.243.163 115.666.198 38.656,314
486.885.935 6,672.297.091 561.406 316.707
189.707,941 999,360 2,850,429
484,339,906 2.147.613 96.220.585 7.582,162.860
$466,924
3,105,111
1 843 ]]]!!!"!"I]!]]
149,688 6,349,826
4,702,704,932
"""2.756^63 !]"]!]!!]"!!]!
'"2'32',765 864 !!]!!!!"]"]"]! 30,377,517
786,588,142 24,980 $2,241,184,960
" ' " " 2 4 ^ 2 4 5 ! ! ! ] ] ! ] ] ] ! ! ! ; ; "
464,566^826 "]!^]!"]!]!]]^ 6,449,711,936
2,373.746.530
$23, 66.
9,680, 483, 379, 910, 136,
189, 132,
105,158, 1,
1,284, 32,
14,996, 227,
8,739, 249,324,
2. 190,
2, 956,
19,063,
198,709 624,581
750,020 ,537.278 ,510.763 ,682.777 ,273.789
2.373.746.530
?0
o ?« H O H X
,103.366 W ,686.157 w ,642.722 W ,869.276 Q ,639.568 g ,050.758 ,423.677 ,597.911 291,948 105,103 561.554 692,573 ,684,142 ,855.688 .447.425 ,019.925
14.316.183.991 25.885.080.847 15.053.215.066 2.241.184,960 414,356,996,242
>
O
W H W > C ><
Digitized for FRASER http://fraser.stlouisfed.org/ Federal Reserve Bank of St. Louis

TABLE 8.—Budget receipts and outlays monthly and totals for fiscal years 1976-77 [In millions of dollars. Basis: Monthly Treasury Statement of Receipts and Outlays of the United States Govemment]
Total
Receipts and outlays 1976 T.Q. 1977 Oct. Nov. Dec. Jan. Feb. Mar. Apr. May June July Aug. Sept.
RECEIPTS
Individual income taxes 131,603 38,801156,725 11,095 12,531 12,662 18,085 8,370 5,777 18,476 9,290 17,949 12,438 12,725 17,327 Corporation income taxes 41,409 8,460 54,892 1,027 699 7,633 1,694 948 8.719 7.974 1.096 14.379 1.538 809 8.376 Social insurance taxes and contributions:
Employment taxes and contributions 79.909 21.803 92,210 5,308 7,775 5,826 6,511 9,357 6,858 8,998 10,160 7,044 6,725 10,347 7,299 Unemployment insurance 8,054 2,698 11,312 503 1,205 —26 347 997 126 1,296 3,582 228 800 2,161 94 Contributions for other insurance and retirement 4,752 1,258 5,162 388 451 407 462 410 428 409 461 424 437 450 434
Excise taxes 16,963 4,473 17,548 1,408 1,517 1,513 1,447 1,294 1,283 1,392 1,485 1,530 1,567 1,523 1,589 Estate and gift taxes 5,216 1,455 7,327 417 570 502 504 1,890 625 376 501 437 505 547 454 Customs duties 4,074 1,212 5,150 345 392 412 381 347 466 393 427 504 446 543 494 Miscellaneous 8,026 1,613 6.536 527 553 542 521 568 534 517 548 581 498 572 575
Total receipts this year . - . . 356.861 21.018 25.694 29,471 29,954 24,182 24,817 39,832 27,549 43,075 24,952
Total receipts prior year 300,005 81.773 19,316 21.867 25,997 25,533 20,825 20,086 33.146 22.535 37,617 22,589
OUTLAYS
Legislative branch 779 225 976 53 99 77 60 101 70 87 98 81 82 Thejudiciary 325 85 392 1 39 26 61 25 35 46 29 27 40 Executive Office of the President 79 16 73 5 6 6 6 5 9 6 6 9 6 Funds appropriated to the President:
Intemational security assistance 1,101 468 347 350 - 4 1 0 - 8 4 2 —925 157 350 233 477 - 2 1 - 3 2 1 517 782 Intemational development assistance 1,669 609 1.632 102 156 242 20 149 121 128 166 149 116 146 136 Other 754 144 518 41 31 26 14 31 39 22 28 58 19 4 205
Department of Agriculture: Foreign assistance, special export programs and
Commodity Credit Corporation 1,805 832 4,670 254 569 554 461 103 239 406 203 333 448 653 447 Other 10,991 3,018 12,068 727 1,306 611 910 1,184 1,466 1,419 899 983 517 1,021 1,024
Department of Commerce 2,020 534 2.607 131 191 201 145 135 167 186 262 285 258 300 346
C/5 H > H GO H
29.676 36.642 ^
> r 27,349 31,748
55 31
4
116 31
5
> s z a
Digitized for FRASER http://fraser.stlouisfed.org/ Federal Reserve Bank of St. Louis
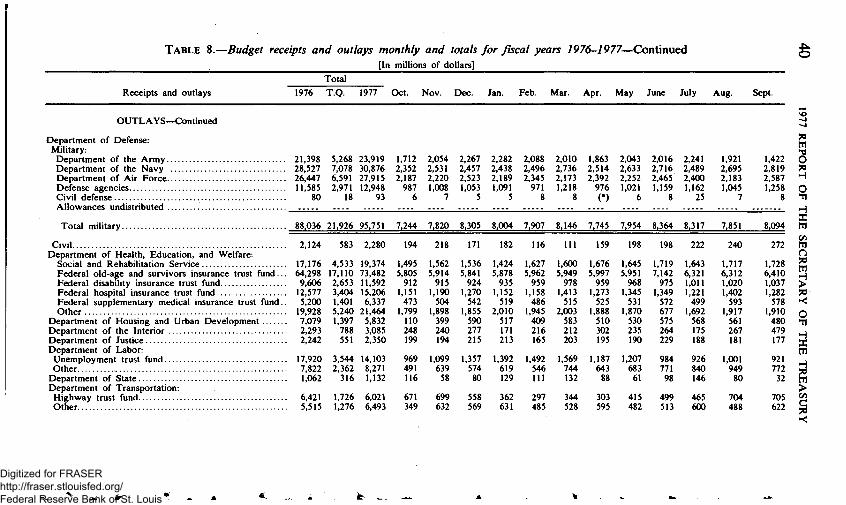
TABLE 8.—Budget receipts and outlays monthly and totals for fiscal years 1976-1977—Continued [In millions of dollars]
Total
Receipts and outlays 1976 T.Q. 1977 Oct. Nov. Dec. Jan. Feb. Mar. Apr. May June July Aug. Sept.
^
OUTLAYS—Continued
Department of Defense: Military:
Department of the Army 21.398 5.268 23.919 1.712 2.054 2.267 2.282 2.088 2.010 1.863 2.043 2.016 2,241 Department of the Navy 28,527 7,078 30,876 2,352 2,531 2,457 2,438 2,496 2,736 2,514 2,633 2,716 2,489 Department of Air Force 26,447 6,59127,915 2,187 2,220 2,523 2,189 2,345 2,173 2,392 2,252 2,465 2,400 Defense agencies 11,585 2,971 12,948 987 1,008 1,053 1,091 971 1,218 976 1,021 1,159 1,162 Civil defense 80 18 93 6 7 5 5 8 8 (•) 6 8 25 Allowances undistributed
Total military 88,036 21,926 95,751 7,244 7,820 8,305 8,004 7,907 8,146 7,745 7.954 8.364 8.317
Civil 2.124 583 2.280 194 218 171 182 116 111 159 198 198 222 Department of Health. Education, and Welfare:
Social and Rehabilitation Service 17.176 4.533 19.374 1.495 1.562 1.536 1.424 1.627 1.600 1.676 1.645 1.719 1,643 Federal old-age and survivors insurance tmst fund... 64,298 17,110 73,482 5,805 5,914 5,841 5,878 5,962 5.949 5.997 5.951 7.142 6,321 Federal disability insurance tmst fund 9,606 2,653 11,592 912 915 924 935 959 978 959 968 975 1,011 Federal hospital insurance tmst fund 12,577 3,404 15,206 1,151 1,190 1,270 1,152 1,158 1,413 1,273 1,345 1.349 1,221 Federal supplementary medical insurance tmst fund.. 5.200 1.401 6.337 473 504 542 519 486 515 525 531 572 499 Other 19.928 5.240 21.464 1.799 1.898 1.855 2.010 1.945 2.003 1.888 1.870 677 1.692
Department of Housing and Urban Development 7.079 1.397 5.832 110 399 590 517 409 583 510 530 575 568 Department of the Interior 2.293 788 3,085 248 240 277 171 216 212 302 235 264 175 Department of Justice 2,242 551 2,350 199 194 215 213 165 203 195 190 229 188 Department of Labor:
Unemployment trust fund 17,920 3,544 14,103 969 1,099 1,357 1,392 1,492 1,569 1,187 1,207 984 926 Other 7,822 2,362 8,271 491 639 574 619 546 744 643 683 771 840
Department of State 1,062 316 1,132 116 58 80 129 111 132 88 61 98 146 Department of Transportation:
Highway trust fund 6,421 1,726 6,021 671 699 558 362 297 344 303 415 499 465 Other 5,515 1,276 6,493 349 632 569 631 485 528 595 482 513 600
1,921 2,695 2,183 1,045
7
1,422 2,819 2,587 1,258
8
7,851
240
8,094
272
m o H O
m c/5 tn o
1,717 6,312 1,020 1,402 593
1,917 561 267 181
1,001 949 80
704 488
1,728 6,410 1,037 1,282 578
1,910 480 479 177
921 772 32
705 622
H > ?« < O Hi H X m H
> c/5
a <
y ^ it ^ ^ .^.
Digitized for FRASER http://fraser.stlouisfed.org/ Federal Reserve Bank of St. Louis

Department of the Treasury: Interest on public debt 37,063 8,102 41,900 2,870 3,065 6.421 2.881 2.774 2.754 2.878 2.997 6.384 2,909 2,989 2,978 Interest on refunds, etc 302 104 326 33 30 21 15 23 24 23 26 28 33 35 35 Antirecession financial assistance fund 1,699 - . . . 532 9 329 (•) (•) 313 (•) (•) 517 (*) («) General revenue sharing 6,243 1,588 6.760 1.672 17 10 1.693 1 (•) 1.671 6 (•) 1.689 (•) 1 Other 727 -94 -1.124 42 -357 -206 -252 91 ^ 1 127 24 -382 -218 89 ^ 3
Energy Research and Development Administration 3.759 1.051 5.020 267 342 422 326 366 380 409 458 459 442 479 670 Environmental Protection Agency 3.118 1.108 4.365 274 412 353 312 284 458 286 339 416 368 484 379 General Services Administration -92 3 -31 -101 74 102 -181 -3 83 -201 103 70 -103 92 34 National Aeronautics and Space Administration 3.670 953 3.944 368 359 345 275 321 352 322 309 314 299 355 324 Veterans Administration:
Compensation and pensions 8.178 2.088 9.000 687 731 736 802 748 758 761 750 758 753 772 744 National service life 179 -11 217 - 1 - 2 9 9 17 33 144 9 -3 5 -2 (•) Govemment service life 65 11 65 4 3 6 ^ 4 5 7 17 4 4 4 3 4 Other 9.992 1.870 8.737 692 991 708 825 804 812 761 886 460 572 644 582
Indei>endent agencies: r-. Civil Service Commission 8,320 2,353 9,620 793 711 841 745 763 785 848 746 850 871 804 864 ^ Postal Service 1,720 938 2.267 1.766 • - - . - 500 1 > Small Business Administration 436 78 700 27 352 20 1 47 37 17 18 49 3 39 91 H Tennessee Valley Authority 980 232 1,100 122 103 61 58 45 58 97 94 136 126 96 103 c^ Other independent agencies »7,702 »2,209 6,327 1,030 409 675 343 -729 724 787 498 716 697 460 715 H
Undistributed offsetting receipts: O Federal employer contributions to retirement fund -4,242 -985 -4,548 -292 -352 -308 -378 -323 -340 -330 -375 -332 -340 -346 -831 > Interest credited to certain accounts -7,800 -270-8,131 -74 -187-3,546 -20 -196 -37 -88 -130-3,559 -15 -197 -83 ^ Rents and royalties on Outer Continental Shelf lands. -2,662 -1,311 -2,374 -71 -120 -353 -61 -70 -82 -57 -104 -320 -983 -93 -59 >
Total outlays this year 401.896 34,000 33.079 31.890 32.617 30,735 34.292 35.363 33.592 32,881 33.630 34,720 35,097 [g
Total outlays prior year. '366,483 '94.756 32.493 29.596 31.925 30.647 29.787 28.847 32.355 28,267 30.658 33.881 29.594 31.184 §
Surplus, or deficit (-) this year -45.035 -12.981 -7.385 -2.419 -2.664 -6.554 -9,475 4,469 -6,043 10,194 -8.678 -5,044 1.545 ^
Surplus, or deficit (-) prior year. '-66.478'-12.983 -13.177 -7.730 -5.928 -5.110 -8.959 -8.767 791 -5.732 6,959-11.292 -2.245 564
*Less than $500,000. ~ ~~"^ * Adjusted due to reclassification of the Export-Import Bank of the United States from an off-budget to a budgetary account.
Digitized for FRASER http://fraser.stlouisfed.org/ Federal Reserve Bank of St. Louis

TABLE 9.—Budget receipts by source and outlays by function, fiscal year 1968 to date J^ [In millions of dollars. Basis: 1978 Budget of the U.S. Govemment, released Jan. 17. 1977]
Receipts and outlays 1968 1969 1970 1971 1972 1973 1974 1975 1976 T.Q. 1977»
RECEIPTS H-
Individual income taxes 68.726 87.249 90,412 86,230 94,737 103,246 118,952 122,386 131,603 38,801 156,725 ^ Corporation income taxes 28,665 36.678 32,829 26,785 32.166 36.153 38,620 40.621 41,409 8.460 54.892 Jd
tn Social insurance taxes and contributions (trust funds): ^
Employment taxes and contributions: ^ Old-age and survivors insurance 22,265 25,484 29,396 31,354 35,132 40,703 47,778 55,207 58,703 15,886 68,032 H DisabUity insurance 2,651 3,469 4,063 4,490 4,775 5.381 6.147 7.250 7,686 2,130 8,786 Hospital insurance 3,493 4,398 4,755 4,874 5,205 7,603 10,556 11,258 11,995 3,459 13,484 Railroad retirement 814 885 919 980 1,008 1,189 1,411 1,489 1,525 328 1.908
Total employment taxes and contributions , 29.224 34.236 39.133 41.699 46.120 54.876 65.892 75.204 79.909 21.803 92.210
O ^ H X tn
Unemployment insurance 3.346 3.328 3.464 3.674 4.357 6.051 6.837 6.771 8.054 2.698 11.312 g
Contributions for other insurance and retirement: ^ Supplementary medical insurance 698 903 936 1,253 1,340 1,427 1,704 1,901 1.937 539 2.193 W Employees retirement—employee contributions 1,334 1,426 1,735 1,916 2,058 2,146 2,302 2.513 2,760 707 2,910 H Other retirement contributions 20 24 29 37 39 41 45 52 54 13 59 ^
O
H X tn
Total contributions for other insurance and retirement 2,052 2,353 2,701 3.205 3.437 3.614 4.051 4.466 4.752 1.259 5.162
Total social insurance taxes and contributions 34.622 39.918 45.298 48.578 53.914 64.542 76.780 86.441 92,714 25.760 108.683
Excise taxes: Federal funds:
Alcohol 4.189 4,482 4,610 4,696 5,004 5,040 5,248 5,238 5,318 1,279 5,407 H Tobacco 2,121 2,136 2,093 2,205 2,205 2,274 2,435 2,312 2,484 622 2,399 g Other 3,390 3,967 3,649 3.609 2.297 2.522 2.060 1.850 2.810 620 1.842 P
Total Federal excise taxes 9.700 10,585 10.352 10,510 9.506 9.836 9.743 9,400 10.612 2.520 9.648 C
^ - % - . i / 9 ^' M. ^ Sk ^ A . U- . ^ . ^ .
Digitized for FRASER http://fraser.stlouisfed.org/ Federal Reserve Bank of St. Louis

T m s t funds: H i g h w a y 4.379 4.637 5.354 5,542 5,322 5,665 6,260 6,188 5.413 1.676 6.709 A i r p o r t and a i r w a y 563 649 758 840 962 938 277 1.191
T o t a l t m s t excise taxes 4.379 4.637 5.354 6.104 5.971 6.424 7.100 7.151 6.351 1.953 7.900
T o t a l excise taxes 14.079 15.222 15.705 16,614 15.477 16.260 16.844 16.551 16,963 4.473 17.548
Es t a t e and gift taxes 3.051 3,491 3,644 3,735 5,436 4,917 5,035 4.611 5.216 1.455 7,327 C u s t o m s dut ies 2.038 2.319 2.430 2.591 3.287 3.188 3.334 3.676 4,074 1.212 5.150
Misce l laneous receipts : Depos i t of e a m i n g s by Fede ra l Rese rve Sys tem 2.091 2.662 3.266 3,533 3,252 3.495 4,845 5.777 5.451 1.500 5.908 O t h e r miscel laneous r e c e i p t s ' 400 247 158 325 381 426 524 934 2.575 112 628
T o t a l miscel laneous receipts 2.491 2.908 3.424 3.858 3.633 3.921 5.369 6.711 8.026 1.612 6.536
T o t a l b u d g e t rece ip t s 153.671 187.784 193.743 188.392 208.649 232.225 264.932 280.997 300.005 81.773 356.861
O U T L A Y S
Nat iona l defense: D e p a r t m e n t of Defense—mil i ta ry :
Mil i tary personnel 19,859 21,374 23,031 22,633 23,036 23,246 23,728 24,968 25,064 6,358 25,715 Re t i red mil i tary personnel 2,095 2,444 2,849 3,386 3,885 4,390 5,128 6.242 7.296 1.947 8.216 Ope ra t i on and m a i n t e n a n c e . . . . 20,578 22,227 21,609 20,941 21,675 21,069 22.478 26.330 27.902 7,261 30,689 P r o c u r e m e n t 23,283 23,988 21,584 18,858 17,131 15,654 15,241 16,042 15,964 3,766 18,178 Resea rch and d e v e l o p m e n t 7,747 7,457 7,166 7,303 7,881 8,157 8,582 8,866 8,923 2.206 9.795 Mil i tary c o n s t m c t i o n and o t h e r 3.975 525 1,059 1,552 1,655 895 2,627 2,754 3,043 383 3,514
D e d u c t i o n s for offsetting receipts —164 —143 —148 —126 —113 —113 —159 —182 —155 5 —173
Subtota l 77,373 77.872 77.150 74.546 75.151 73.297 77,625 85,020 88,036 21,926 95,934 Mil i tary assistance 654 789 731 999 806 531 819 999 501 183 9,015 A t o m i c ene rgy defense activit ies 1,336 1,389 1,415 1,385 1,373 1.409 1,486 1,509 1,565 435 1,721 Defense-re la ted act ivi t ies 51 162 —8 —120 29 —162 —1,349 —936 —103 —27 65
D e d u c t i o n s for offsetting receipts —4 —5 —3 —3 —2 —4 —13 —4 —3 1 —10.014
T o t a l nat ional defense 79.409 80.207 79,284 76.807 77.356 75.072 78.569 86.585 89,996 22.518 96.721
See footnotes at end of table.
c/5 H
c/5
H
9 r >
s z g
Digitized for FRASER http://fraser.stlouisfed.org/ Federal Reserve Bank of St. Louis
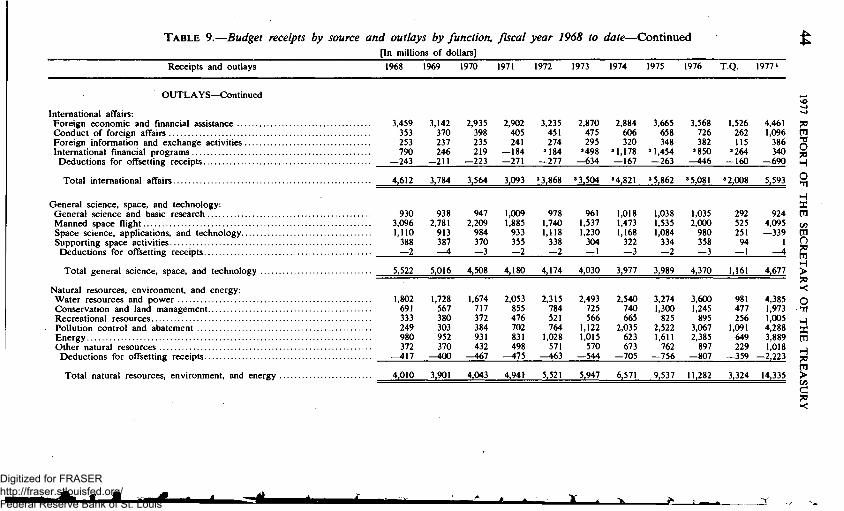
TABLE 9.—Budget receipts by source and outlays by function, fiscal year 1968 to date—Continued [In millions of dollars]
Receipts and outlays 1968 1969 1970 1971 1972 1973 1974 T975 1976 T.Q. 1977»
^
OUTLAYS—Continued
Intemational affairs: Foreign economic and financial assistance 3.459 Conduct of foreign affairs 353 Foreign information and exchange activities 253 Intemational financial programs 790
Deductions for offsetting receipts —243
Total intemational affairs
General science, space, and technology: General science and basic research Manned space flight Space science, applications, and technology Supporting space activities
Deductions for offsetting receipts
Total general science, space, and technology
Natural resources, environment, and energy: Water resources and power Conservation and land management Recreational resources Pollution control and abatement Energy Other natural resources
Deductions for offsetting receipts
Total natural resources, environment, and energy
3,142 370 237 246
—211
2,935 398 235 219
—223
2,902 405 241
—184 —271
3,235 451 274 M84 —277
2,870 475 295 »498 —634
2,884 3,665 3.568 1.526 4.461 606 658 726 262 1.096 320 348 382 115 386
M.178 M.454 »850 »264 340 —167 —263 -.446 —160 —690
4.612
930 3.096 1.110 388 —2
5.522
1.802 691 333 249 980 372
—417
4,010
3,784
938 2,781 913 387 —4
5.016
1,728 567 380 303 952 370
—400
3,901
3.564
947 2,209 984 370 —3
4,508
1,674 717 372 384 931 432
-467
4,043
3.093
1.009 1,885 933 355 —2
4,180
2,053 855 476 702 831 498
—475
4,941
'3.868
978 1.740 1.118 338 —2
4^174
2.315 784 521 764
1.028 571
—463
5.521
'3.504
961 1,537 1,230 304 — 1
4,030
2,493 725 566
1,122 1,015 570
—544
5,947
'4,821
1,018 1,473 1,168 322 —3
3.977
2,540 740 665
2.035 623 673
—705
6,571
'5.862
1.038 1,535 1,084 334 —2
3,989
3,274 1,300 825
2,522 1,611 762
—756
9.537
'5.081
1,035 2,000 980 358 —3
4,370
3,600 1,245 895
3.067 2,385 897
—807
11.282
'2,008
292 525 251 94 -1
1,161
981 477 256
1,091 649 229
—359
3,324
5.593
924 4.095 —339
1 -4
4.677
4,385 1.973 1.005 4,288 3,889 1,018
—2,223
14.335
O Tl
tn (fi
tn ()
5«
n Tl
^. m ^ tn >
a
A f i j r
Digitized for FRASER http://fraser.stlouisfed.org/ Federal Reserve Bank of St. Louis
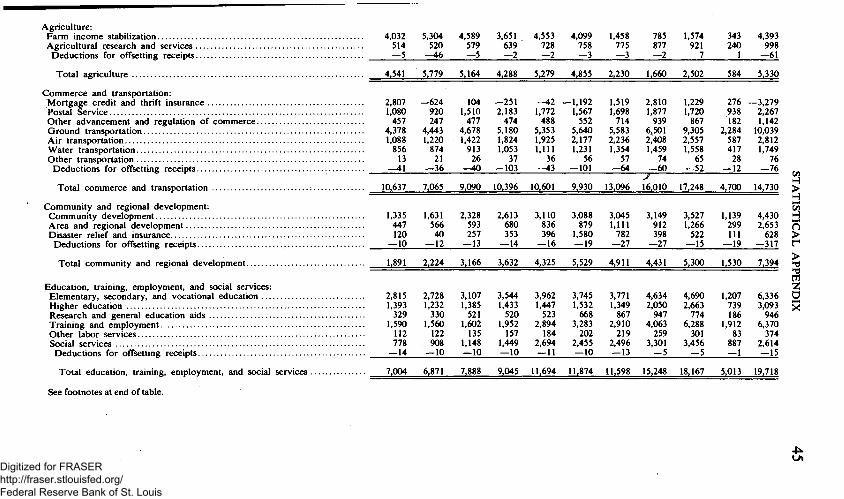
Agriculture: Farm income stabilization 4.032 Agricultural research and services 514
Deductions for offsetting receipts —5
5.304 520 -^^6
4.589 579 —5
3.651 639 —2
4.553 728 —2
4.099 758 —3
1.458 775 —3
785 877 —2
1.574 921 7
343 240 1
4.393 998 —61
Total agriculture 4.541 5.779 5.164 4.288 5.279 4.855 2,230 1,660 2,502 584 5,330
Commerce and transportation: Mortgage credit and thrift insurance 2,807 —624 104 —251 —42 —1,192 1,519 2,810 1,229 276 —3,279 Postal Service 1,080 920 1,510 2,183 1,772 1,567 1,698 1,877 1,720 938 2,267 Other advancement and regulation of commerce 457 247 477 474 488 552 714 939 867 182 1.142 Ground transportation 4.378 4,443 4,678 5,180 5,353 5,640 5,583 6.501 9.305 2.284 10.039 Air transportation 1.088 1,220 1,422 1.824 1.925 2.177 2.236 2.408 2.557 587 2.812 Water transportation 856 874 913 1.053 1.111 1.231 1.354 1.459 1.558 417 1,749 Other transportation 13 21 26 37 36 56 57 74 65 28 , 76
Deductions for offsetting receipts —4\ —36 —40 —103 —43 —101 —64 —60 —52 —12 —76 ^
Total commerce and transportation 10,637 7,065 9,090 10,396 10.601 9.930 13.096 16.010 17.248 4.700 14.730 > • H
Community and regional development: GO Community development 1,335 1.631 2.328 2.613 3.110 3.088 3.045 3.149 3.527 1.139 4,430 H Area and regional development 447 566 593 680 836 879 1,111 912 1,266 299 2,653 o Disaster relief and insurance 120 40 257 353 396 1,580 782 398 522 111 628 >
Deductions for offsetting receipts —10 —12 —13 —14 —16 —19 —27 —27 —15 —19 —317 T
> Total community and regional development 1,891 2,224 3,166 3,632 4,325 5,529 4,911 4,431 5,300 1,530 7,394 ^
1 ^
tn Education, training, employment, and social services: Z
Elementary, secondary, and vocational education 2.815 2,728 3,107 3,544 3,962 3,745 3,771 4,634 4,690 1,207 6,336 O Higher education 1,393 1,232 1.385 1.433 1.447 1.532 1.349 2.050 2.663 739 3.093 x Research and general education aids 329 330 521 520 523 668 867 947 774 186 946 Training and employment 1,590 1,560 1,602 1,952 2,894 3,283 2,910 4,063 6,288 1,912 6,370 Other labor services 112 122 135 157 184 202 219 259 301 83 374 Social services 778 908 1.148 1,449 2.694 2.455 2.496 3.301 3.456 887 2.614 Deductions for offsetting receipts —14 —10 —10 —10 —11 —10 —13 —5 —5 —1 —15
Total education, training, employment, and social services 7,004 6,871 7.888 9,045 11,694 11.874 11.598 15.248 18,167 5.013 19,718
See footnotes at end of table.
4^ Digitized for FRASER http://fraser.stlouisfed.org/ Federal Reserve Bank of St. Louis

TABLE 9.—Budget receipts by source and outlays by function, fiscal year 1968 to date—Continued [In millions of dollars] ^ ^ ^ ^ ^
Receipts and outlays 1968 1969 1970 1971 1972 1973 1974 1975 1976 T.Q. 1977»
4 ^ OS
OUTLAYS—Continued
Health: Health care services 7,593 Health research and education 1,405 Prevention and control of health problems 318 Health planning and construction 393 General health financing assistance
Deductions for offsetting receipts
Total health
Income security: General retirement and disability insurance 24,552 Federal employee retirement and disability 2,660 Unemployment insurance 2,412 Public assistance and other income supplements 4.059
Deduction for offsetting receipts —2
Total income security 33.680
Veterans benefits and services: Income security for veterans 4,506 Veterans education, training, and rehabilitation 478 Hospital and medical care for veterans 1,469 Veterans housing 210 Other veterans benefits and services 220
Deduction for offsetting receipts —2
Total veterans benefits and services 6,882
Law enforcement and'justice: Federal law enforcement and prosecution 483 Federal judicial activities 98 Federal correctional and rehabilitative activities 69 Law enforcement assistance 8
Deductions for offsetting receipts —8
Total law enforcement and justice 650
9,537 1,459 348 415
10,648 1,577 362 469
12,107 1,687 459 465
14,538 1,952 541 443
15,476 2,272 638 449
18,502 2,334 750 494
23,405 2,677 883 687
28,655 3.086 963 752
7,556 934 251 —20
39.983 3.480 1.094 294
—2
9.708
—2
11.758
-6
13.051
—2
14.716
—3
17.471
-3
18.832
-6
22.074
—5
27.647
—8
33.448
— 1 —6.013
8.720 38.838
28,288 1.732 2,583 4,679
—1
31,303 2,688 3,364 5,712
—2
37,485 3,191 6,169 8,580
—2
41,966 3,789 7.076 11,081
— 2
51,684 4,500 5,356 11,419
— 2
58,613 5.645 6.065 14.108 -<*)
69.383 77.173 6.980 8.174 13.459 19,452 18.783 22.609
— 1 — 1
20,930 90,583 2,319 9,552 3,994 19,207 5,553 23,453
37,281 43.066 55.423 63.911 72.958 84,431 108.605 127,406 32,796 137.151
5,036 701
1,564 102 239 —2
5,546 1,015 1,800 54 263 —2
5,966 1,659 2,036 —179 296 —2
6,344 1.960 2,425 - 3 1 7 320 —2
6,533 2,801 2,711 —381 350 —2
6,789 3,249 3,006 —15 359 —2
7,860 4,593 3,665 24 458 —2
8,350 5,531 4,046 —72 578 —2
2,082 784
1,039 —50 110 —1
9.701 3,710 4,705 —143 554
-488
7,640 8.677 9,776 10.730 12.013 13.386 16.597 18.432 3.962 18.039
553 112 71 29
— 3
672 134 88 65
— 6
821 146 104 233 — 6
971 172 128 380 — 2
1,168 1,291 1,593 1,852 188 158 624 — 7
204 202 770 — 5
279 226 853 -9
313 238 921
529 2,088 83 64
213 — 3 1
378 281 847
s H O
H X tn c/5
I O Tl H X tn
c/5
c
761 952 1.299 1,650 2,131 2,462 2.942 3.320 859 3,590 Digitized for FRASER http://fraser.stlouisfed.org/ Federal Reserve Bank of St. Louis
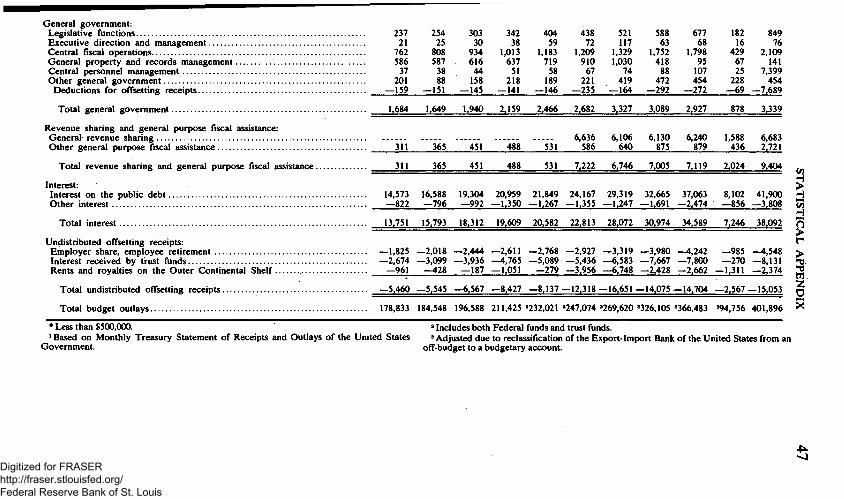
General govemment: Legislative functions 237 254 303 342 404 438 521 588 677 182 849 Executive direction and management 21 25 30 38 59 72 117 63 68 16 76 Central fiscal operations 762 808 934 1.013 1.183 1.209 1.329 1.752 1.798 429 2,109 General property and records management 586 587 616 637 719 910 1.030 418 95 67 141 Central personnel management 37 38 44 51 58 67 74 88 107 25 7,399 Other general govemment 201 88 158 218 189 221 419 472 454 228 454
Deductions for offsetting receipts —159 —151 —145 —141 —146 —235 —164 —292 —272 —69 —7.689
Total general govemment 1.684 1.649 1.940 2.159 2.466 2,682 3.327 3,089 2.927 878 3.339
Revenue sharing and general purpose fiscal assistance: General revenue sharing 6,636 6,106 6.130 6.240 1.588 6.683 Other general purpose fiscal assistance 311 365 451 488 531 586 640 875 879 436 2.721
Total revenue sharing and general purpose fiscal assistance 311 365 451 488 531 7.222 6,746 7.005 7.119 2.024 9.404 ^ H
Interest: > Interest on the public debt 14.573 16.588 19.304 20.959 21,849 24,167 29,319 32,665 37,063 8,102 41,900 H Other interest —822 —796 —992 —1,350 —1,267 —1,355 —1,247 —1,691 —2.474 —856 —3,808 55
. ^ Total interest 13.751 15.793 18.312 19.609 20.582 22.813 28.072 30.974 34.589 7.246 38.092 O
> Undistributed offsetting receipts: t^
Employer share, employee retirement —1.825 —2.018 —2.444 —2.611 —2,768 —2,927 —3,319 —3,980 —4,242 —985 —4,548 > Interest received by trust funds —2,674 —3,099 —3,936 —4,765 —5,089 —5,436 —6,583 —7,667 —7,800 —270 —8,131 ^ . Rents and royalties on the Outer Continental Shelf —961 —428 —187 —1,051 —279 —3,956 —6.748 —2,428 ^2.662 —1,311 —2,374 g
Total undistributed offsetting receipts —5.460 —5.545 —6.567 —8.427 —8.137—12.318—16.651—14.075—14.704 —2.567—15.053 §
Total budget outlays 178.833 184.548 196.588 211.425 '232.021 '247.074 '269,620 '326,105 '366,483 '94,756 401,896 ^
• Less than $500,000. ' »Includes both Federal funds and trust funds. »Based on Monthly Treasury Statement of Receipts and Outlays of the United States 'Adjusted due to reclassification ofthe Export-Import Bank ofthe United States from an
Govemment. off-budget to a budgetary account.
4^
Digitized for FRASER http://fraser.stlouisfed.org/ Federal Reserve Bank of St. Louis

TABLE 10.—Internal revenue collections by tax source, fiscal year 1946 to date^ [In thousands of dollars. As reported by Intemal Revenue Service; see "Bases of Tables" and Note]
OO
Income and profits taxes' Employment taxes
Individual income taxes'
Fiscal year Withheld by
employers Other
Total individual in
come taxes
Corporation income and profits
taxes'
Total income
and profits taxes'
Old-age and disability insurance
taxes*
Unemployment
insurance taxes
Railroad retirement taxes
Total employ
ment taxes'
Estate taxes
Gift taxes
1946 9,857,589 8,846,947 18,704,536 12,553,602 31,258,138 1,237,825 178,745 284,258 1,700,828 1947 9,842,282 9,501,015 19,343,297 9,676.459 29,019,756 1,458,934 185,876 379,555 2,024,365 1948 11,533,577 9,464,204 20,997,781 10,174,410 31,172,191 1,612,721 208,508 560,113 2,381,342 1949 10,055,502 7,996.320 18.051.822 11.553.669 29.605.491 1.687.151 226.228 562.734 2,476,113 1950 9,888,976 7,264,332 17,153,308 10,854,351 28,007,659 1,873,401 223,135 548,038 2,644,575 1951 13,089,770 9,907,539 22,997,308 14,387,569 37,384,878 2,810,749 236,952 579,778 3,627,480 1952 17,929,047 11,345,060 29,274,107 21,466,910 50,741,017 3,584,025 259,616 620.622 4.464.264 1953 21.132.275 11.403.942 32.536,217 21,594,515 54.130.732 3.816.252 273.182 628.969 4.718.403 1954 22.077.113 10.736.578 32.813.691 21.546.322 54.360.014 4.218.520 283.882 605.221 5.107.623 1955 21.253.625 10.396.480 31.650.106 18.264.720 49.914.826 5,339.573 279.986 600.106 6.219.665 1956 24.015.676 11,321,966 35,337,642 21,298,522 56,636,164 6,336,805 324,656 634,323 7,295,784 1957 26,727,543 12,302,229 39,029,772 21,530,653 60,560,425 6,634,467 330,034 616,020 7,580,522 1958 27,040,911 11,527,648 38,568,559 20,533,316 59,101,874 7,733,223 335,880 575,282 8,644,386 1959 29,001,375 11,733,369 40,734,744 18,091,509 58,826,254 8,004,355 324,020 525,369 8,853,744 1960 31,674,588 13,271,124 44,945,711 22,179,414 67,125,126 10,210,550 341,108 606,931 11,158,589 1961 32,977,654 13,175,346 46,153,001 21,764,940 67,917,941 11,586,283 345,356 570,812 12,502,451 1962 36,246,109 14.403.485 50.649.594 21.295.711 71.945.305 11.686.231 457.629 564.311 12.708.171 1963 38.718.702 14.268.878 52.987.581 22.336.134 75.323.714 13.484.379 948.464 571.644 15,004,486 1964 39,258,881 15,331,473 54,590,354 24,300,863 78,891,218 15,557,783 850,858 593,864 17,002.504 1965 36.840.394 16.820.288 53.660.683 26.131.334 79.792.016 15.846.073 622.499 635.734 17.104.306 1966 42.811.381 18.486.170 61.297.552 30.834.243 92.131.795 19.005.488 567.014 683,631 20,256,133 1967 50,520,874 18,849,721 69,370,595 34.917.825 104.288.420 25,562.638 602,745 792,858 26,958,241 1968 57,300,546 20,951,499 78,252,045 29,896,520 108,148,565 26,620,648 606,802 858,448 28,085,898 1969 70,182,175 27,258,231 97,440,406 38,337,646 135,778,052 31,489,943 640,030 938.684 33,068,657 1970 77,416,070 26,235,515 103,651,585 35,036,983 138,688,568 35,692,198 776,139 980,851 37,449,188 1971 76,490,128 24,262,293 100,752,421 30,319,953 131,072,374 37,902,403 972,409 1,043,878 39,918,690 1972 83,200,366 25,678,820 108,879,186 34,925,546 143,804,732 41,617,156 1,024,069 1,072,776 43,714,001 1973 98,092,726 27,019,280 125,112,006 39,045,309 164,157,315 49,514,852 1,315,997 1,250,859 52,081,709 1974 112,091,799 30,811,851 142,903,650 41,744,444 184,648,094 59,105,066 1,480,574 1,507,993 62,093,632 1975 122,103,137 34,296,301 156,399,437 45,746,660 202,146.097 67,136,584 1,388,082 1,616.143 70,140,809 1976 123,440,963 35,527,834 158,968,797 46.782.956 205.751.753 70.983.718 1,562,752 1,656,384 74,202,853 T.Q 32,949,859 6,808,720 39,758,579 9,808,905 49,567,484 19,050,456 377,378 464,207 19.892,041 1977 144.672.331 42.082,932 186,755,263 60,049,804 246,805,067 82,257,211 1,910,302 1,908,803 86.076,316
629,601 708,794 822,380 735,781 657,441 638,523 750,591 784,590 863,344 848,492
1,053,867 1,253,071 1,277,052 1,236,823 1,439,259 1,745,480 1,796,227 1,971,614 2,110,992 2,454,332 2,646,968 2,728,580 2,710,254 3,136,691 3,241,321 3,352.641 5.126.522 4.338,924 4,659,825 4,312,657 4.875,735 1,367,935 5.649,460
47,232 70.497 76.965 60.757 48.785 91.207 82.556 106,694 71,778 87,775 117,370 124.928 133.873 117.160 187.089 170,912 238.960 215.843 305.312 291.201 446,954 285,826 371,725 393,373 438,755 431,642 363,447 636,938 440,849 375,421 431,730 117,312
1,775,866
tn TJ O ?o H O
H X tn c/5 tn o JO tn H >
O
H X tn H
tn > c/5 C
Digitized for FRASER http://fraser.stlouisfed.org/ Federal Reserve Bank of St. Louis

• • y »
1946... 1947... 1948... 1949... 1950.., 1951.. 1952.. 1953.. 1954.. 1955.. 1956.. 1957.. 1958.. 1959.. I960.. 1961.. 1962.. 1963.. 1964.. 1965.. 1966.. 1967.. 1968.. 1969.. 1970.. 1971.. 1972.. 1973.. 1974.. 1975.. 1976.. T.Q. . . 1977..
* H / — r
Fiscal year
See footnotes at end of table.
" - *
Distilled spirits'
1,746,580 1,685,369 1,436,233 1,397,954 1,421,900 1,746,834 1,589,730 1,846,727 1,873.630 1.870.599 2.023.334 2.080,104 2,054,184 2,098,496 2,255.761 2.276.543 2.386,487 2,467,521 2,535,596 2,710,603 2,767,400 2,966,967 3,085,313 3.345.601 3,463.259 3.479.332 3.720,886 3,708,036 3,882,910 3,829,677 3,882,084
848,281 3,793,226
, _ - y
Alcohol taxes*
Beer*
650,824 661,418 697,097 686,368 667,411 665,009 727,604 762,983 769,774 737,233 765.441 760.520 757.597 767.205 796,233 795,427 813,482 825,412 887,560 905.730 887.319 940.622 959.570
1.003.354 1.077.499 1.104.240 1.164.283 1.197.983 1.262.908 1.305.035 1.329.986
391.371 1.395.564
Wines
60.844 57,196 60,962 65,782 72,601 67,254 72,374 80,535 78.678 81.824 86.580 87.428 90.303 90,918 98,850 96,073 98.033
101.871 107.779 110.153 110.284 121.489 125.340 154.756 160.761 174,529 177,697 187,703 169,658 172.440 171.822 34.620
179.908
Other, including occupational taxes
67.917 70.779 61.035 60.504 57.291 67.711
159.412 90.681 60.928 53.183 45.219 45.143 44.377 45,477 42,870 44,757 43,281 46,853 46,564 46,147 49,376 46,645
117,014 51,849 44,862 42,381 47,134 55,791 43,000 43,707 43,830 31,570 37,934
V ' i
Excise taxes
Total alcohol
taxes
2,526,165 2,474.762 2.255.327 2.210.607 2,219.202 2.546.808 2.549.120 2.780.925 2.783.012 2.742.840 2.920.574 2.973.195 2.946.461 3.002.096 3.193.714 3.212,801 3,341,282 3,441,656 3,577,499 3,772,638 3,814,378 4,075,723 4,287,237 4,555,560 4,746,382 4,800,482 5,110,001 5,149,513 5,358,477 5.350.858 5.427.722 1.305.841 5.406,633
Cigarettes
1,072,971 1,145,268 1,208,204 1,232,735 1,242,851 1,293,973 1,474,072 1,586,782 1,513,740 1,504,197 1,549,045 1,610,908 1,668,208 1,738,050 1,863,562 1,923,540 1,956,527 2,010,524 1,976,675 2,069,695 2,006,499 2,023,090 2,066,159 2,082,106 2,036,101 2,149,527 2,151,158 2,221,019 2,383,038 2,261,116 2,434,831
610,169 2,357,519
•
Tobacco
Cigars
41,454 48,354 46,752 45,590 42,170 44,275 44,810 46,326 45,618 46,246 45,040 44.858 47.247 51.101 50.117 49.604 49.726 50.232 56.309 60.923 57.662 55.736 54.937 54.220 56.834 54.775 54.173 53.794 51.581 51.226 49.812 11,735 37.128
.8 y
taxes*
Other
51.094 44.146 45.325 43.550 43.443 42.148 46.281 21,803 20,871 20,770 19.412 18.283 18.566 17.665 17.825 17.974 19.483 18.481 19.561 17.976 9.796 1.043 1.181 1.259 1.277 2.282 1.942 2.137 2.387 2.748 3.252
916 3.854
4 - -
Documents, Total other instm-
^ . ments. and U ^ ^ t l f c . P'aying cards.
1.165.519 1.237.768 1.300.280 1.321.875 1.328.464 1.380.396 1.565.162 1.654.911 1.580.229 1.571.213 1.613,497 1,674,050 1,734,021 1,806,816 1,931,504 1,991.117 2.025.736 2.079.237 2,052.545 2.148.594 2.073.956 2.079.869 2.122.277 2.137.585 2.094.212 2.206.585 2.207.273 2,276,951 2,437,005 2,315,090 2,487,894
622,821 2,398,501
87,676 79,978 79,466 72,828 84,648 93,107 84,995 90,319 90,000
112,049 114,927 107,546 109,452 133,817 139,231 149,350 159,319 149,069 171,614 186,289 146,457 68,260 48,721
1,455 220
68 259 44
287 113 C) C) C)
c/5 H > H
2 d o p >
f > ^
i n x
^ Digitized for FRASER http://fraser.stlouisfed.org/ Federal Reserve Bank of St. Louis

TABLE 10.—Internal revenue collections by tax source, fiscal year 1946 to date-[In thousands of dollars]
-Continued O
Excise taxes—Continued
Manufacturers excise taxes"
Fiscal year
Gasoline Lubricating oils
Passenger automobiles and
motorcycles'
AutomobUes, tmcks
and buses"
Parts and acces
sories for auto
mobiles*
Tires, tubes,
and tread mbber
Business and store
machines"^
Refrigerators,
freezers, air-con
ditioners, e t c . "
Radio and television re
ceiving sets and phonographs, pa r t s "
Electric, gas, and oil ap
pliances "
All other*
Total manufacturers excise taxes S
2? 1946 405,695 1947 433,676 1948 478,638 1949 503,647 1950 534,270 1951 588,647 1952 734,715 1953 890,679 1954 836,893 1955 954,678 1956 1.030,397 1957 1,458,217 1958 1,636,629 1959 1,700.253 1960 2.015.863 1961 2,370.303 1962 2,412,714 1963 2,497.316 1964 2,618.370 1965 2,687,135 1966 2,824,189 1967 2,932,894 1968 3,030,792 1969 3,186,239 1970 3,430,076 1971 3,547,678 1972 3,741,160 1973 3,927,535 1974 4,087,669 1975 3,980,412 1976 4,125,674 T.Q 1,091,428 1977.... 4,322,077
A i - ^
74,602 82,015 80,887 81,760 70,072 77,639 73,746 73,321 68,029 69,818 74,584 73,601 69,996 73,685 81,679 74,296 73,012 74,410 76,316 76,095 90,776 92,573 92,311 97,476 87,510 88,185 95,474 103,094 105,723 91.053 92,851 26,035 100,929
25,893 204,680 270,958 332.812 452.066 653.363 578.149 785.716 867,482
1,047,813 1,376,372 1,144,233 1,170,003 1.039,272 1,331,292 1,228,629 1,300,440 1,559,510 1,745,969 1,887,691 1,492,225 1,413,833 1,530,777 1,863,956 1,753,327 1,695,112 563,223
—83,241 6,049 3,343
17 79
—2,637
37,144 62,099 91,963 136,797 123,630 121,285 147,445 210,032 149,914 134,805 189,434 199,298 206,104 215,279 271,938 236,659 257,200 303,144 350,945 425,361 460,069 468,910 447,743 589,304 659,986 625,290 497,138 461,351^ 519,699 534,158 321,848 138,750 598.084
68.871 99.932 122,951 120,138 88,733 119.475 164.135 177.924 134.759 136.709 145.797 157.291 166,720 166,234 189,476 188,819 198,077 224,507 228,762 252,874 196,546 34.640 76.226 81.387 84.069 84,078 94.099 107.489 120,604 125,052 124,045 41,720 159,287
118,092 15,792 174,927 25,183 159,284 32,707 150,899 33,344 151,795 30,012 198,383 44,491 161,328 48,515 180.047 50.259 152.567 48,992 164,316 57,281 177,872 70.146 251.454 83,175 259,820 90,658 278,911 93,894 304.466 99,370 279,572 98,305 361,562 81,719 398,860 74,845 411,483 71.867 440.467 74.426 481,803 6,745 503,753 —461 489,139 10 631,527 — 2 5 614,795 — 1 593,377 — 1 2 681,320 814,042 — 6 6 827,256 697,660 730,117 C) 218,038 C) 792,957 C)
9,229 37,352 58.473 77,833 64,316 96,319 57,970 87.424 75.059 38.004 49,078 46.894 39.379 40.593 50.034 55.920 54.638 61.498 62.799 75,987
137 —2,650
436 31
— 3 0 — 1 0
231
C) O C)
13,385 63,856 67,267 49,160 42.085 128.187 118,244 159,383 135,535 136,849 161,098 149,192 146,422 152,566 169,451 148,989 173,024 184,220 197,595 221,769 —3,761 —1,329
597 — 1 2 9
— 5 129 8 1
C) (')
25,492 65,608 87,858 80,935 80,406 121,996 89,544 113,390 97,415 50.859 71.064 75.196 61.400 62,373 69,276 64,483 66.435 68.171 77.576 80.983 5,367 —758
236 12
— 9 4 — 7
— 4 1
40
O C) C)
128,477 176,066 198.249 204.207 198.670 233.890 175,153 134,613 122,488 93.883
110.171 123.374 127,004 135,728 152,285 150,826 154,129 163,827 178,861 195,356 59,773 36,941 45,706 51,367 53,427 50,979 56,276 65,311 75,112 84,934 91,554 27,288 97,985
922,671 1,425.395 1.649.234 1.771,533 1.836.053 2.383.677 2,348,943 2,862,788 2,689,133 2,885,016 3,456,013 3,761,925 3,974,135 3,958,789 4,735,129 4,896,802 5,132,949 5.610,309 6,020.543 6.418,145 5,613.869 5.478.347 5.713.973 6.501.146 6.683,061 6,684.799 5.728.657 5.395.750 5,742.154 5.516.611 5.486,106 1,543,339 6.068.682
^
S m tfi
m G ?o
's !« H -
? tn
S ^ C/5
i
:£ • i t ^ ' -
Digitized for FRASER http://fraser.stlouisfed.org/ Federal Reserve Bank of St. Louis

^ ' •
Excise taxes—Continued
Retailers excise taxes
Fiscal year
Jewelry " Furs '* Toilet
preparations "
Luggage, handbags,
wallets"
Diesel and
special motor fuels"
Noncommercial aviation gasoline
Noncommercial aviation
fuel, other than
gasoline
All other'*
Total retailers excise taxes
Toll telephone, telegraph, radio and
cable services "
Miscellaneous excise taxes
General telephone
service
Transportation of persons "
Transportation of property (including coal)"
Admissions"
General admissions Cabarets
1946.. 1947.. 1948.. 1949.. 1950... 1951... 1952... 1953... 1954... 1955... 1956... 1957... 1958... 1959... 1960... 1961... 1962... 1963... 1964... 1965... 1966... 1967... 1968... 1969... 1970... 1971... 1972... 1973... 1974... 1975... 1976... T.Q.... 1977...
223.342 236.615 217.899 210.688 190,820 210,239 220,339 234,659 209,256 142.366 152,340 156,604 156,134 156,382 165.699 168.498 176.023 181.902 189.437 204.572 43,264 1,643 442 34 26 154 6 9
(•) C) C) C)
91,706 97.481 79.539 61.946 45.781 57.604 51.436 49.923 39.036 27.053 28,261 29,494 28,544 29,909 30,207 29.226 31.163 29.287 30.016 31.390 3.179 204 287 10 1
(•) 4
(•)
C) C) C)
95.576 95.542 91.852 93.969 94.995 106.339 112.892 115.676 110.149 71.829 83.776 92.868 98.158 107.968 120.211 131.743 144.594 158.351 176.857 195.833 40.898 1.218 131 — 9 — 1
— 6 9
(•")
2 — 2 C) (') C)
81,423 84,588 80,632 82,607 77,532 82,831 90,799 7,138 95,750 15.091 79.891 17.969 50,896 22,692 57.519 24.464 57.116 39.454 58.785 46.061 61.468 52.528 62.573 71.869 68,182 88,856 69.384 105.178 74,019 113,012 78,704 128,079 81,386 152,188 20,814 159.326
555 182,147 5 201,918
(•) 224,657 82 257.712 (•) 266.388
298.608 26 334.473
— 2 373,414 370,489
(') 379.125 (') 104,381 C) 440,190
4,753 8,838 10.246 10.877 11.127 10.295 2,965 10.390
10.918 19.381 43,460 31,955 22,573 27,814 7,706
30.014
15 (•) 8
492.046 514.227 469.923 449.211 409.128 457.013 482.604 511.100 456.301 314.837 346.360 375.535 387.682 408.256 450.559 486,505 526.341 556.570 603,092 665,369 267.481 185.766 202,784 224.693 257.820 282.144 326.833 388.218 416.244 404.187 417.250 115.052 480.602
234.393 252.746 275.255 311.380 312.339 354.660 395.434 417.940 412.508 230.251 241,543 266,186 279.375 292.412 312.055 343.894 350.566 364.618 379.608 458.057 907.917
1.101.853 1.105.478 1,316.378 1.469.562 1.624.533 1.650.499 1.885.228 1.892,731 2,023,744 1,837,362 543,472
1,708,778
145,689 164.944 193.521 224.531 247.281 290.320 310.337 357.933 359.473 290.198 315.690 347.024 370.810 398.023 426,242 483,408 492,912 515,987 530,588 620,880
(") (") (") (") (xe)
(") (") (") (")
n
226,750 244,003 246,323 251,389 228,738 237,617 275,174 287,408 247,415 200,465 214,903 222,158 225,809 227,044 255,459 264,262 262,760 233,928 106,062 125,890 139,624 170,323 199,274 223,687 250,802 423,082 515,269 579,167 659,177 750,641 793,597 230,864 957,251
220,121 275.701 317.203 337.030 321.193 381.342 388.589 419.604 395,554 398,039 450,579 467,978 462.989 143.250 3.140 1,306 568 451 277 215 115 51 30
21,585 29,455 37,214 41,931 47,332 45,400 11,408 55,147
343,191 392,873 385,101 385,844 371,244 346,492 330,816 312,831 271,952 106,086 104,018 75,847 54,683 49,977 34,494 36,679 39,169 42,789 47,053 51,968 45,668
358 76
— 2 2 — 3 5 — 2 1 - 1 8 -120 — 3 6
11 C) C) C)
72,077 63,350 53,527 48,857 41,453 42,646 45,489 46,691 38,312 39,271 42,255 43,241 42,919 45,117 49,605 33,603 35,606 39,794 41.026 43.623 35.736 3,041 1,074
33 — 3 6 • 83 —8 1 — 2 9 — 1 7 120 (') C) O
I u O > r >
i
See footnotes at end of table.
Digitized for FRASER http://fraser.stlouisfed.org/ Federal Reserve Bank of St. Louis

TABLE 10.—Internal revenue collections by tax source, fiscal year 1946 to date—Continued [In thousands of dollars]
Excise taxes—Continued
Miscellaneous excise taxes—Continued
Fiscal year Club dues and initiation fees"
Sugar*
Use tax on highway
motor vehicles
weighing over
26,000 lbs ."
All other'* Total miscellaneous
excise taxes
Unclassified excise taxes"
Total excise taxes
Taxes not otherwise classified
Grand total
?0
tn
O
H
O H X tn c/5 tn o ?o
>
O
H X tn H
tn > c/5 C
1946. 1947. 1948. 1949. 1950. 1951 . 1952. 1953. 1954. 1955. 1956. 1957. 1958. 1959. 1960. 1961 . 1962. 1963. 1964. 1965. 1966. 1967. 1968. 1969. 1970. 1971. 1972. 1973. 1974. 1975. 1976.
-i-M
18,899 56,732 23,299 59,152 25,499 71,247 27.790 76.174 28.740 71,188 30,120 80,192 33,592 78,473 36,829 78,130 31,978 74,477 41,963 78,512 47,171 82,894 54,236 86,091 27,163 60,338 85,911 33,117 64,813 86,378 32,532 67,187 89,856 38,333 64,357 91,818 45,575 69,452 96,636 79,761 71,097 99,903 99,481 75,120 95,411 100,199 79,671 97,109 102,038 52,571 102,932 104,240 1,825 104.203 108.178 1,536 102,270 108,918 1,040 108,191 124,273 206 113.309 135.086 22 113.556 145.058
— 3 7 115.752 157.279 — 6 0 113.616 188.517
2 120.006 198.462 (*) 103,769 207,663 C) 28,820 212,793
^ C ) W , 126,699 -*"~ '—-• ^ — i n n '
172,249 1,490,101 75,176 1,551,245 88,035 1,655,711 89,799 1,752,792 98,732 1,720,908 79,210 1,842,598 82,430 1,940,334 88,708 2,046,073 86,889 1,918,558 85,156 1,469,941 114,687 84,981 1,584,033 —31,209 89,132 1.679,055 66,237 79,316 1,695,266 —32,749 43,879 1,383,425 66,351 38,588 1,314,960 99,644 43,767 1,408,670 —80,943 37,651 1,465,080 101,468 38,596 1,506,644 66,251 43,206 1,418,552 106,387 54,412 1,633,868 —32,119 55,236 1,444,038 37,933 60,083 1,549,915 675,867 138,269 1,656,925 288,480 149,309 1,922,890 159.458 115.615 2.084.510 38,059 159,876 2,487,773 410,000 226.564 2.694.682 779.330 237,974 3,041,506 320,336 241.781 3,154.037 1.648 172.683 3.305,964 -45,082 175.922 3.093.895 344.853 42,825 955,278 , —24,324
-^Mfni—c: 1 f.A<; n j ^ - la n «
6,684,178 "352,121 40,672,097 7,283,376 "1,597 39,108,386 7,409,941 "1,723 41,864,542 7,578,846 "6,138 40,463,125 7.598.405 "266 38.957.132 8.703.599 50.445.686 8.971.158 65.009.586 9.946.116 69,686,535 9,517,233 69,919,991 9,210,582 '* 7,352 66,288,692 10,004.195 '* 5.269 75.112,649 10,637,544 '* 15.482 80.171.971 10.814.268 '* 7,024 79.978,476 10,759,549 '* 5,444 79,797,973 11,864,741 91,774.803 12.064.302 94.401.086 12.752.176 99.440.839 13.409.737 105.925.395 13.950.232 112,260.257 14.792.779 114.434.634 13.398,112 128,879,961 14,113,748 .-• 148,374.815 14,320,396 153,636,838 15,542,787 187,919.560 15.904.264 195.722.096 16,871.851 191.647.198 16.847.036 209.855.737 16.572,318 237,787,204 17,109,853 268,952.254 16.847,741 293,822,726 17,257,720 302,519,792 4,518,008 75,462,780 17.832.«07 X V358,139,417
Digitized for FRASER http://fraser.stlouisfed.org/ Federal Reserve Bank of St. Louis
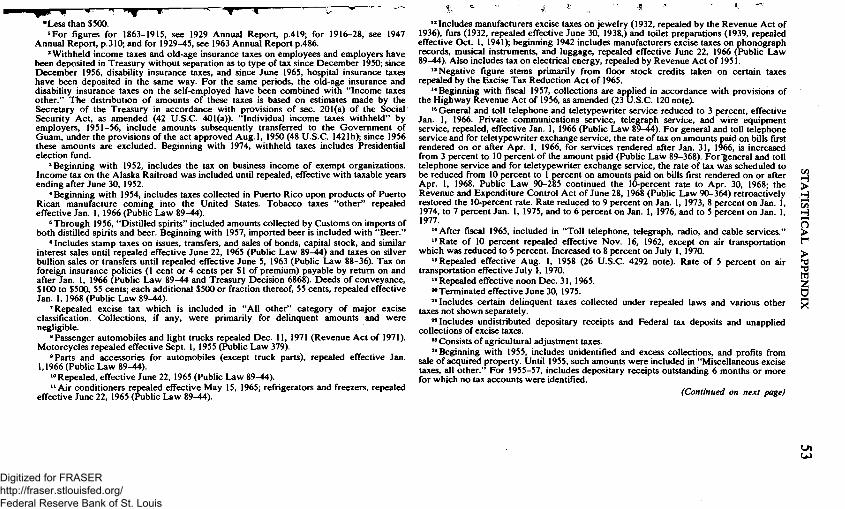
-^F^—M ' ^ 1. ' ^^ ^ " 4 ' \:-•Less than $500.
»For figures for 1863-1915, see 1929 Annual Report, p.419; for 1916-28, see 1947 Annual Report, p.310; and for 1929-45, see 1963 Annual Report p.486.
' Withheld income taxes and old-age insurance taxes on employees and employers have been deposited in Treasury without separation as to type of tax since December 1950; since December 1956, disability insurance taxes, and since June 1965, hospital insurance taxes have been deposited in the same way. For the same periods, the old-age insurance and disability insurance taxes on the self-employed have been combined with "Income taxes other." The distribution of amounts of these taxes is based on estimates made by the Secretary of the Treasury in accordance with provisions of sec. 201(a) of the Social Security Act, as amended (42 U.S.C. 401(a)). "Individual income taxes withheld" by employers, 1951-56, include amounts subsequently transferred to the Govemment of Guam, under the provisions ofthe act approved Aug.l, 1950 (48 U.S.C. 1421h); since 1956 these amounts are excluded. Beginning with 1974, withheld taxes includes Presidential election fund.
'Beginning with 1952, includes the tax on business income of exempt organizations. Income tax on the Alaska Railroad was included until repealed, effective with taxable years ending after June 30, 1952.
* Beginning with 1954, includes taxes collected in Puerto Rico upon products of Puerto Rican manufacture coming into the United States. Tobacco taxes "other" repealed effective Jan. 1, 1966 (Public Law 89-44).
'Through 1956, "Distilled spirits" included amounts collected by Customs on imports of both distilled spirits and beer. Beginning with 1957, imported beer is included with "Beer."
^ Includes stamp taxes on issues, transfers, and sales of bonds, capital stock, and similar interest sales until repealed effective June 22. 1965 (Public Law 89-44) and taxes on silver bullion sales or transfers until repealed effective June 5. 1963 (Public Law 88-36). Tax on foreign insurance policies (1 cent or 4 cents per $1 of premium) payable by retum on and after Jan. 1. 1966 (Public Law 89-44 and Treasury Decision 6868). Deeds of conveyance. $100 to $500, 55 cents; each additional $500 or fraction thereof, 55 cents, repealed effective Jan. 1, 1968 (Public Law 89-44).
'Repealed excise tax which is included in "All other" category of major excise classification. Collections, if any, were primarily for delinquent amounts and were negligible.
8 Passenger automobiles and light tmcks repealed Dec. 11, 1971 (Revenue Act of 1971). Motorcycles repealed effective Sept. 1, 1955 (Public Law 379).
'Parts and accessories for automobiles (except truck parts), repealed effective Jan. 1,1966 (Public Law 89-44).
"Repealed, effective June 22, 1965 (Public Law 89-44). "Ai r conditioners repealed effective May 15, 1965; refrigerators and freezers, repealed
effective June 22, 1965 (Public Law 89-44).
*'Includes manufacturers excise taxes on jewelry (1932, repealed by the Revenue Act of 1936), furs (1932, repealed effective June 30, 1938,) and toilet preparations (1939, repealed effective Oct. 1, 1941); beginning 1942 includes manufacturers excise taxes on phonograph records, musical instmments, and luggage, repealed effective June 22, 1966 (Public Law 89-44). Also includes tax on electrical energy, repealed by Revenue Act of 1951.
*'Negative figure stems primarily from floor stock credits taken on certain taxes repealed by the Excise Tax Reduction Act of 1965.
"Beginning with fiscal 1957. collections are applied in accordance with provisions of the Highway Revenue Act of 1956. as amended (23 U.S.C. 120 note),
*'General and toll telephone and teletypewriter service reduced to 3 percent, effective Jan. 1. 1966. Private communications service, telegraph service, and wire equipment service, repealed, effective Jan. 1, 1966 (Public Law 89-44). For general and toll telephone service and for teletypewriter exchange service, the rate of tax on amounts paid on bills first rendered on or after Apr. 1, 1966, for services rendered after Jan. 31, 1966, is increased from 3 percent to 10 percent of the amount paid (Public Law 89-368). For'general and toll telephone service and for teletypewriter exchange service, the rate of tax was scheduled to be reduced from 10 percent to 1 percent on amounts paid on bills first rendered on or after Apr. 1, 1968. Public Law 90-285 continued the 10-percent rate to Apr. 30, 1968; the Revenue and Expenditure Control Act of June 28, 1968 (Public Law 90-364) retroactively restored the 10-percent rate. Rate reduced to 9 percent on Jan, 1, 1973, 8 percent on Jan. 1, 1974, to 7 percent Jan. 1, 1975, and to 6 percent on Jan. 1, 1976, and to 5 percent on Jan. 1, 1977.
*• After fiscal 1965, included in "Toll telephone, telegraph, radio, and cable services." "Rate of 10 percent repealed effective Nov. 16. 1962, except on air transp>ortation
which was reduced to 5 percent. Increased to 8 percent on July 1, 1970. *'Repealed effective Aug. 1, 1958 (26 U.S.C. 4292 note). Rate of 5 percent on air
transportation effective July 1, 1970. "Repealed effective noon Dec. 31, 1965. '^ Terminated effective June 30, 1975. '* Includes certain delinquent taxes collected under repealed laws and various other
taxes not shown separately. "Includes undistributed depositary receipts and Federal tax deposits and unapplied
collections of excise taxes. "Consists of agricultural adjustment taxes. '•Beginning with 1955, includes unidentified and excess collections, and profits from
sale of acquired property. Until 1955, such amounts were included in "Miscellaneous excise taxes, all other." For 1955-57, includes depositary receipts outstanding 6 months or more for which no tax accounts were identified.
(Continued on next page)
C/5
H 00
H n > r > Id tn z o
Digitized for FRASER http://fraser.stlouisfed.org/ Federal Reserve Bank of St. Louis
•NOTE.—These figures are from Intemal Revenue reports of collections. For years prior to 1955, they are not directly comparable to gross budget receipts from intemal revenue; the differences in amounts occur because of differences in the time when payments are included in the respective reports. Through 1954, the payments were included in Intemal Revenue Service collection reports after the retums to which they applied had been received in intemal revenue offices. Beginning with 1955, tax payments are included in budget receipts when reported in the account ofthe U.S Treasury.
Under arrangements begun in 1950. for withheld income tax and old-age insurance taxes and later extended to railroad retirement taxes and many excises, these taxes are paid currently into Treasury depositaries and the depositary receipts, as evidence of such payments, are attached to quarterly retums to the Intemal Revenue Service. Beginning in 1967 for corporations, and later extended to many other taxes, the Federal tax deposit system (FTD) replaced the depositary receipt method. Under this procedure, the payments are included in budget receipts in the month in which the depositary receipts are issued to taxpayers, or F T D were purchased.
Revised accounting procedures, effective July 1, 1954. extended this practice to to Intemal Revenue Service collection reports, so that these reports include depositary receipts in the month in which they are issued instead of the month in which tax retums supported by the receipts are received in the directors* offices. It is not possible to make a complete classification of excise taxes paid into depositaries until the retums are received. Accordingly, the item "Unclassified excise taxes" includes the amount of "undistributed depositary receipts." i.e.. the amount of depositary receipts issued, less the amount of depositary receipts received with retums and distributed by classes of tax, and beginning Jan. 1, 1968, amounts of Federal tax deposit forms purchased and not yet applied to taxpayers' liabilities.
4^
5« tn
s
tn c/5
o Tl H X tn H
c/5 CJ
Digitized for FRASER http://fraser.stlouisfed.org/ Federal Reserve Bank of St. Louis

STATISTICAL APPENDIX 55 TABLE 11.—Internal revenue collections and refunds by State, fiscal year 1977
[In thousands of dollars]
States, etc.
Individual income
and employ
ment taxes
Corporation
income taxes
Excise taxes
Estate and Total gift taxes collections
Refunds-excluding interest,
including tax
rebates *
Alabama Alaska Arizona Arkansas Califomia Colorado Connecticut Delaware Florida Georgia Hawaii Idaho Illinois Indiana I6wa Kansas Kentucky Louisiana Maine Maryland' Massachusetts Michigan Minnesota Mississippi Missouri Montana Nebraska Nevada New Hampshire New Jersey New Mexico New York. . . , North Carolina North Dakota Ohio Oklahoma Oregon Pennsylvania Rhode Island South Carolina South Dakota Tennessee Texas. Utah Vermont, Virginia Washington West Virginia Wisconsin Wyoming Intemational' Undistributed:
Federal tax deposits* Transferred to Govemment of
Guam Withheld taxes of Federal employees'
Gasoline, lubricating oil, and excess FICA credits®
Presidential election fund Adjustment to Presidential election
fund" Unclassified Clearing account for excise taxes—
aviation fuel and oil—Air Force and Navy
Eamed income credits _
Total
See footnotes at end of table.
2,504,146 735,291
1,787,471 1,247,782
29,956,440 2,682,879 7,308,049 1,154,220 8,921,990 4,002,690
930,670 798,654
26,268,545 4,931,977 2,617,746 2,058,834 2,425,984 3,075,277 755,839
8,108,800 6,950,413 10,994,089 5,911,030 1,115,105 6,270,141 558,717
1,676,083 783,966 719,272
16,995,961 739,533
26,821,353 4,457,365 538,013
15,523,059 2,486,714, 3,883,445 14,114,164 1,022,600 1,818,358 464,100
7,876,730 16,318,652
959,618 333,034
4,207,762 4,119,901 1,190,401 4,775,641 347,773
1,028,840
335,270 52,599 180,700 207.095
5.535,421 377,147
1,878,317 301,238
1,329,553 725,989 134,840 139,939
6,561,285 714,303 514,262 333,810 487,494 703,493 101,430
1,549,878 1,252,760 2,614,899 1,067,707 161,372
1,296,087 50,263
308,204 106,096 106,863
8,566,185 63.715
7.501.359 1,248.570
54,802 2,977,437 996.176
1,101,133 2,155,399 169,241 281,869 45,849
1,276,123 4,135,046 162,172 32,570
616,565 607,888 197,278
1,234,458 46,050 43,236
96,790 11,864 18,465 23,420
1,613,928 ^ 226,889 553,213 68,755
303,058 279,838 16,953 8,759
1,173,309 380,285 51,355 65,352
1,203,882 86,165 12,923
690,894 303,927 775,031 188,962 23,186
403,449 8,695
83,118 14,176 25,880
1,026,457 14,227
758,453 1,345,405
11,196 997,917 334,078 314,797 907,818 13,263 29,812 11,370
673,297 1,324,989
14,736 3,584
832,772 224,648 23,436
339,602 28,103 166,816
63,464 3,695
64,061 37,007
891,254 70.215 169,867 29,427
469,827 109,704 24,224 18,259
566,469 155,222 127,620 100,997 62,600 93,469 27,582 198,958 194,611 258,460 105,607 37,833 180,687 21,028 74,227 28,595 26,944 194,651 30,691
826,103 108,102 20,975
310,088 90,238 64,475
329,238 25,880 49,777 21,388 86,178
605,607 23,248 9,028
124,521 112,821 30,797 112,519 20,722 16,368
2,999,670 803,449
2,050,697 1,515,305
37,997,043 3,357,130 9,909,446 1,553,639
11,024,427 5,118,221 1,106,687 965,611
34,569,609 6,181,787 3,310,983 2.558,992 4,179.960 3,958,403 897,773
10,548,530 8,701,712 14,642,479 7,273,307 1,337,497 8,150,364 638,703
2,141,631 932,833 878,959
26,783.254 848,167
35,907,268 7,159,442 624,985
19,808,501 3,907,206 5.363.850 17.506.618 1,230.984 2.179.816 542,707
9,912,327 22,384,295 1,159,774 378,216
5,781,620 5,065,257 1,441,913 6,462,220 442,647
1,255.260
-4,841.822—2,628,429 —276,619 —7.746.870
—19.690 —19.690
—121.096 —121.096
494.649 36.529
111
7,782
36.800
26
531.450 36,529
111
26 7,782
451,875 165,030 365,804 234,692
4,478,857 456,811 632,515 107,063
1,290,668 712,597 175,901 124,086
2,072,004 799,535 378,387 322,297 437,674 551,767 134,327 928,420 917,653
1,631.311 606,077 230,211 765,077 111,546 222,731 127,474 123,728
1,336,323 159,069
^,034,342 647,144 78,017
1,954,195 400,809 422,655
2,097,784 146,296 326,789 77,114
616,281 1,936,248 191,822 54,939
725,799 635,006 245,147 671,737 69,979
208,336
539,232
41,216
"272.831,580 60.049.804 "17.832.707 7.425.325 358.139.417 "36.178.997 Digitized for FRASER http://fraser.stlouisfed.org/ Federal Reserve Bank of St. Louis
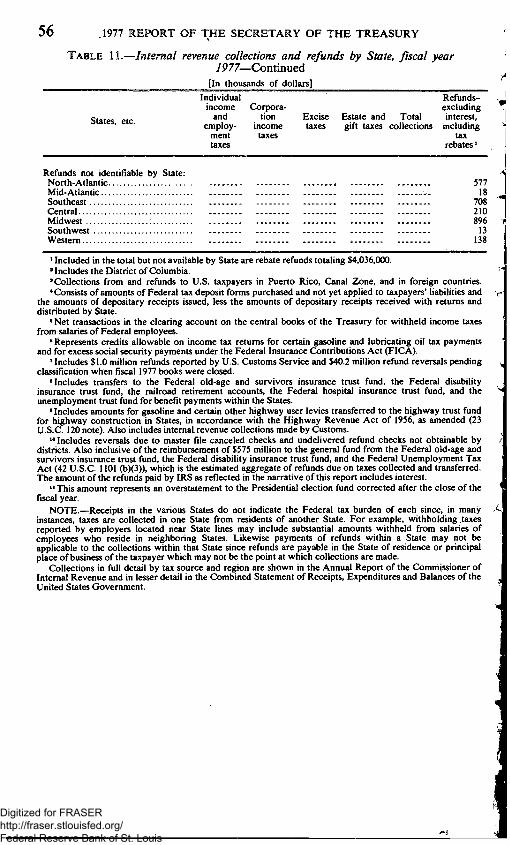
56 .1977 REPORT OF THE SECRETARY OF THE TREASURY
TABLE 11.—Internal revenue collections and refunds by State, fiscal year 1977—Continned
[In thousands of dollars] Individual
income
S"t«- " - empty, ment taxes
Refunds not identifiable by State: North-Atlantic Mid-Atlantic Southeast Central Midwest Southwest Westem
Corporation Excise Estate and Total
income taxes gift taxes collections taxes
Refunds-excluding interest,
including tax
rebates*
577 18
708 210 896
13 138
* Included in the total but not available by State are rebate refunds totaling $4,036,000. 'Includes the District ofColumbia. 'Collections from and refunds to U.S. taxpayers in Puerto Rico, Canal Zone, and in foreign countries. * Consists of amounts of Federal tax deposit forms purchased and not yet applied to taxpayers' liabilities and
the amounts of depositary receipts issued, less the amounts of depositary receipts received with retums and distributed by State.
»Net transactions in the clearing account on the central books of the Treasury for withheld income taxes from salaries of Federal employees.
"Represents credits allowable on income tax retums for certain gasoline and lubricating oil tax payments and for excess social security payments under the Federal Insurance Contributions Act (FICA).
'Includes $1.0 million refunds reported by U.S. Customs Service and $40.2 million refund reversals pending classification when fiscal 1977 books were closed.
"Includes transfers to the Federal old-age and survivors insurance trust fund, the Federal disability insurance tmst fund, the railroad retirement accounts, the Federal hospital insurance tmst fund, and the unemployment trust fund for benefit payments within the States.
•Includes amounts for gasoline and certain other highway user levies transferred to the highway tmst fund for highway constmction in States, in accordance with the Highway Revenue Act of 1956, as amended (23 U.S.C. 120 note). Also includes intemal revenue collections made by Customs.
*" Includes reversals due to master file canceled checks and undelivered refund checks not obtainable by districts. Also inclusive of the reimbursement of $575 million to the general fund from the Federal old-age and survivors insurance tmst fund, the Federal disability insurance tmst fund, and the Federal Unemployment Tax Act (42 U.S.C. 1101 (b)(3)), which is the estimated aggregate of refunds due on taxes collected and transferred. The amount ofthe refunds paid by IRS as reflected in the narrative of this report includes interest.
**This amount represents an overstatement to the Presidential election fund corrected after the close ofthe fiscal year.
NOTE.—Receipts in the various States do not indicate the Federal tax burden of each since, in many instances, taxes are collected in one State from residents of another State. For example, withholding taxes reported by employers located near State lines may include substantial amounts withheld from salaries of employees who reside in neighboring States. Likewise payments bf refunds within a State may not be applicable to the collections within that State since refunds are payable in the State of residence or principal place of business ofthe taxpayer which may not be the point at which collections are made.
Collections in full detail by tax source and region are shown in the Annual Report of the Commissioner of Intemal Revenue and in lesser detail in the Combined Statement of Receipts, Expenditures and Balances of the United States Govemment.
Digitized for FRASER http://fraser.stlouisfed.org/ Federal Reserve Bank of St. Louis

STATISTICAL APPENDIX 57
TABLE 12.—Deposits of earnings by Federal Reserve banks, fiscal year 1947 to date^
[In thousands of dollars]
1947-74 1975 1976 T Q . 1977 Cumulative
through Sept. 30,
1977
Boston 1,778,554 240,794 236,383 63.556 258,485 2,577,772 New York 9,439,248 1,589,644 1,470,633 387,494 1,503,407 14,390,426 Philadelphia 1,967,584 308,386 312,725 83,015 323,050 2,994,760 Cleveland 2,867,433 449,651 423,535 121,340 488,901 4,350,860 Richmond 2,521,996 426,596 432,807 117,129 468,134 3,966,662 Atlanta 1,806,273 284,673 241,677 72,067 274,048 2,678,738 Chicago 6,057,795 904,591 814,059 237,293 944,380 8,958,118 St. Louis 1,285,542 198,979 191,897 56,202 233,791 1,966,411 Minneapolis 675,434 107,016 97,827 30,266 122,087 1,032,630 Kansas City 1,377,604 206,616 202,123 56,002 215,366 2,057,567 Dallas 1,475,836 246,782 265,121 67,128 275,618 2,330,485 San Francisco 4,881,614 812.821 762,035 208.968 800,948 7.466.386
Total 36,134.769 5,776.549 5.450,822 1,500,460 5,908,215 54,770,815
'Through 1959, consists of approximately 90 percent of eamings of the Federal Reserve banks after )ayment of necessary expenses and statutory dividends, and after provisions for restoring the surplus of each >ank to 100 percent of subscribed capital where it fell below that amount. Beginning in 1960, pursuant to lecision by the Board of Governors of the Federal Reserve System, consists of all net eamings after dividends md after provisions for building up surplus to 100 percent of subscribed capital at those banks where surplus is •elow that amount and also of the amounts by which surplus at the other banks exceeds subscribed capital, beginning in 1965, the surplus is maintained at the level of the paid-in capital instead of subscribed capital.
Digitized for FRASER http://fraser.stlouisfed.org/ Federal Reserve Bank of St. Louis

58 1977 REPORT OF THE SECRETARY OF THE TREASURY
TABLE 13.—Customs collections and payments by region and district, fiscal year 1977
I. C U S T O M S C O L L E C T I O N S
Region and district Dut ies Miscel laneous
cus toms collect ions
In t ema l Revenue Service
Tota l
Boston region: Distr ic t offices:
Boston $186,919,550 Br idgepor t 31,852.172 Buffalo 83,559,782 O g d e n s b u r g 48.970.043 Por t land . Maine 10.349,030 Prov idence 13,368,875 St. Albans 9,936.745
To ta l Boston region 384.956.197
N e w York region: Distr ict offices:
N e w York 1,049,345,804 N e w a r k 118,185,408 J F K Ai rpor t 468,186,784
To ta l N e w York region 1,635,717,996
Bal t imore region: Distr ic t offices:
Bal t imore 151,470,692 Norfolk 97,847,396 Philadelphia 236,093,880 Washington , D . C 9,906,664
To ta l Bal t imore region 495,318,632
Miami region: Distr ic t offices:
Char les ton 83,871,959 Miami 63,604,007 San Juan St. T h o m a s Savannah 81.259,092 T a m p a 60,727,392 Wilmington 59,955,390
To ta l Miami region
N e w Or leans region: Distr ic t offices:
Mobi le N e w Orleans
To ta l N e w Orleans region
Hous ton region: Distr ic t offices:
E l Paso 35,276,474 Galves ton 49,457,133 Hous ton 168,206,743 L a r e d o 60,861,965 Por t A r t h u r 35,851,250
To ta l Hous ton region 349,653,565
L o s Angeles region: Dis t r ic t offices:
Los Ange les 704,072,113 Noga les 42,548,880 San D i e g o 26,994,344
To ta l L o s Angeles region 773,615,337
See footnotes at end of table.
$438,545 81,247
439,531 403,981 338,853 81,821
340,707
$29,724,453 10.202.524 10.993.043 31.380.623
120.604 1.986.601 2.341.403
2.124.685 86.749.251
2.017.048 481.459
1.116.105
116.549.821 36.570.967
2.103.365
3.614.612 155.224.153
597.430 758,539
1,303,915 50,594
26,093,845 6,102,081
23,879,959 7.324,238
2,710,478 63,400.123
156.207 898,182 611,097
221,989 501,375 103.951
4.300,227 22,310,187
217,717
""7',"629,9"8'4 15,689,429 2,289.785
349.417.840
20.193.657 236.788.341
256.98U998
2.492.801
385,042 2,548,968
2.934.010
52.437.329
3,635,467 13,337,327
16,972,794
404,347.9:
24.214,1( 252.674.6:
276.888.8(
469.408 694.375
1,345.948 1.060.561 920.173
6.378.114 743.663
21,389.367 1.112.260
631
4.490,465 29,624,035
2,967,436 614,909 547,363
37,755,172 1,575,045 1,224.824
4.129.708 40.555.041
Digitized for FRASER http://fraser.stlouisfed.org/ Federal Reserve Bank of St. Louis

STATISTICAL APPENDIX 59 TABLE 13.—Customs collections and payments by region and district,
fiscal year 1977—Continued I. CUSTOMS COLLECTIONS-Continued
Region and district Duties Miscellaneous
customs collections
Intemal Revenue Service
Total
San Francises region: District offices: Anchorage Great Falls Honolulu Portland, Oreg San Francisco Seattle
Total San Francisco region .
Chicago region: District offices:
$5,304,029 7,800,545
28,460,079 70,406,255
253,972,043 177,238,582
$306,707 80,953
457,638 661,440 898,179
1.382,597
$8,440 8,139
2,701,858 1,393,561
29,191,492 9,715,541
543,181,533 3,787,514 43,019.031
$5,619,176 7.889.637
31.619.575 72,461.256
284.061,714 188,336,720
589,988,078
Chicago Cleveland Detroit Duluth Milwaukee Minneapolis Pembina St. Louis
Total Chicago rej
Total all regions.
gion _
185,012,615 64,604,171
159,837,875 13,703,164 13,633,713 14,800,242 12,675,513 34.368.713
498.636.006
553,407 275,256 889,147 107,234 36,440 18,079
102,033 42.342
2.023,938
5,287.479.104 28.308,211
37,587,997 32,849,725
166,904,402 6,119
4,207,516 3,683,881
25,184 9,267.021
254.531.845
742.513.602
223,154,019 97,729,152
327.631.424 13.816.517 17,877,669 18,502,202 12,802,730 43,678,076
755,191,789
6,058,300,917
II. CUSTOMS PAYMENTS
Region
Boston ^ew York . . . . : Baltimore Vliami Vew Orleans Houston Los Aneeles San Francisco Chicago
Grand total
Collections totals
$473,830,133 1,794,556,761
561,429,233 404,347,970 276,888,802 383,768,065 818,300,086 589,988,078 755.191.789
6,058.300.917
Excess duty and j
similar refunds
$7,314,939 17,774,806 6,469,900 2,497,433. 3,640,013 4,473,119 6,714,365 5,201,962
10,015,892
64,102,429
Payments
Drawback
$5,420,163 17,925,813 6,899,689
11,166,521 1,308,844 1,835.454 4,891,579 4,955,765
14,524,956
68,928,784
Total
$12,735,102 35,700,619 13,369,589 13,663,954 4,948,857 6,308,573
11,605,944 10,157,727 24,540,848
133,031,213
Collections (net)
$461,095,031 1,758,856,142
548,059,644 390,684.016 271.939.945 377.459,492 806,694,142 579,830,351 730,650.941
5,925,269,704
W a gations) jjQQ
$38,721,447 8.40 79,804,971 4.54 25,450,618 4.64 28,938,586 7.41 14,937,135 5.49 40,640,099 10.77 47,991,861 5.95 41,773,006 7.20 37.524.025 5.14
355,781,748 6.00
•U.S. Customs Service collected $170,122,059 for the Virgin Islands special fund 20X5692 (AR) for fiscal >77.
Digitized for FRASER http://fraser.stlouisfed.org/ Federal Reserve Bank of St. Louis

60 1977 REPORT OF THE SECRETARY OF THE TREASURY
TABLE 14.—Summary of customs collections and payments, fiscal years 1976-77
I. COLLECTIONS BY CUSTOMS
1976 T.Q. \911
Duties: Consumption entries Warehouse withdrawals Mail entries Passenger baggage entries Crewmember baggage entries Military baggage entries Informal entries Appraisement entries Vessel repair entries Other duties
Total duties
Miscellaneous: Violations of customs laws Marine inspection and navigation services Testing, inspecting, and grading Miscellaneous taxes Fees Unclaimed funjds Recoveries All other customs receipts
Total miscellaneous Intemal revenue taxes
Total collections
$3,902,318,266 251,394,411 19,138.529 9.871,286 684,721 266,216
12,829,602 214,424
2,017,637 9,791,664
4,208,526,756
13,876,004 126
70,126 11,283,713
150,912 1,088,392
37,698 128,972
26,635,943 722,647.690
4,957,810,389
$1,163,204,017 66,641,968 4,312.777 2,656,226 185,345 58,591
4,142,228 33,405
237,237 1.300.260
1.242.772.054
3.405.790 356
18,047 4,327,660
1,826 257,483 13,649 51.906
8,076,717 160,948,461
1,411,797,232
$4,942,241,5 286,615,9 20,903,1 12,128,3
761,0 274,9
16,369,5 196,3
1,929,4 6,058.8
5,287.479.1
13,618,5 1
111,-; 13,522,1
4,f 802,5 47,9
200,1
28,308.2 742.513.(
6,058,300,S
II. SOURCE AND APPLICATION OF OPERATING FUNDS
Source of funds: Appropriation realized Reimbursements from: Agriculture—quarantine program Commerce—export control program Secret Service—Executive Protective detail State—foreign customs assistance programs. Reimbursable services—Acts of 1911 and
1936 All other sources
Total funds provided
Application of funds by program: Processing of arriving persons and cargo. . . . Investigations—law enforcement Intemal affairs Executive direction
Total funds applied
Withdrawn appropriation balance
Refunds: Excessive duties and similar refunds Drawback payments
Total
$320,742,522
3,460,000 384,000 241,460
1,396,441
29,052,935 10,364,335
365,641,693
286,739,853 25,009.047 5.385.245
48.507,548
365,641.693
49,117,039 85.233.667
134,350,706
$92,622,478
883,000 100,000 79,844 .
360,901
8,538,425 2.992.258
105.576.906
80,785,739 7,011,271 1,445,430
15,989,198
105.231.638
345,268
11,110,351 19,489.039
30.599.390
$359,190,(
3.686.( 409,( 19,!
1,267,<
31,171,( 11,917,!
407,660,*
323,315,: 27,328,' 5,806,'
47,801,!
404,252,'
3,408,:
64,102,' 68,928,
133,031,
Digitized for FRASER http://fraser.stlouisfed.org/ Federal Reserve Bank of St. Louis
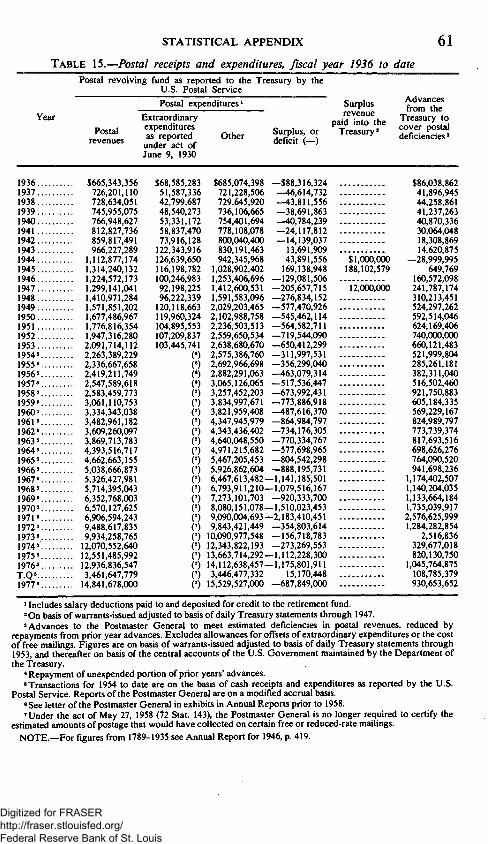
STATISTICAL APPENDIX
TABLE 15.—Postal receipts and expenditures, fiscal year 1936 to date
61
Postal revolving fund as reported to the Treasury by the U.S. Postal Service
Year
Postal revenues
Postal expenditures* Extraordinary expenditures as reported Other under act of June 9, 1930
Surplus, or deficit (—)
Surplus revenue
paid into the Treasury'
Advances from the
Treasury to cover postal deficiencies'
1936 $665, 1937 726, 1938 728, 1939 745, 1940 766, 1941 812, 1942 859, 1943 966, 1944 1,112, 1945 1,314, 1946 1,224, 1947 1,299, 1948 1,410, 1949 1,571, 1950 1,677, 1951 1,776, 1952 1,947, 1953 2,091, 1954' 2,263, 1955' 2,336, 1956" 2,419, 1957' 2,547, 1958' 2,583, 1959' 3,061, 1960" 3,334, 1961' 3,482, 1962' 3,609, 1963' 3,869, 1964» 4.393, 1965' 4,662, 1966' 5,038, 1967' 5,326, 1968' 5,714, 1969' 6,352, 1970' 6,570, 1971' 6,906, 1972' 9,488, 1973' 9,934, 1974' 12,070, 1975' 12,551, 1976' 12,936, T.Q' 3,461, 1977' 14,841,
343,356 $68,585,283 $685,074,398 —$88,316,324 $86,038,862 201,110 51,587,336 721,228,506 —46.614,732 41,896,945 634,051 42,799,687 729,645,920 —43,811,556 44,258,861 955,075 48,540,273 736,106,665 —38,691,863 41,237,263 948,627 53,331,172 754,401,694 —40,784,239 40,870,336 827,736 58,837,470 778,108,078 —24,117,812 30,064,048 817,491 73,916,128 800,040,400 —14,139,037 18,308,869 227,289 122,343,916 830,191,463 13,691,909 -.... 14,620,875 877,174 126,639,650 942,345,968 43,891,556 $1,000,000 —28,999,995 240.132 116.198.782 1,028,902,402 169,138,948 188,102,579 649,769 572,173 100,246,983 1,253,406,696 —129,081,506 160,572,098 141,041 92,198,225 1,412,600,531 —205,657,715 12,000,000 241,787,174 971,284 96,222,339 1,591,583,096 —276,834,152 310,213,451 851,202 120,118,663 2,029,203,465 —577,470,926 524,297,262 ,486,967 119,960,324 2,102,988,758 —545,462,114 592,514,046 ,816,354 104,895,553 2,236,503,513 —564,582,711 624,169,406 ,316,280 107,209,837 2.559,650.534 —719.544.090 740,000,000 714,112 103,445,741 2,638,680,670 —650,412,299 660,121,483 ,389,229 («) 2,575,386,760 —311,997,531 521,999,804 ,667,658 («) 2,692,966,698 —356,299,040 285,261,181 ,211,749 («) 2,882,291,063 —463,079,314 382,311,040 ,589,618 («) 3,065,126,065 —517,536,447 516,502,460 ,459,773 C) 3,257,452,203 —673,992,431 921,750,883 ,110,753 C) 3,834,997,671 —773,886,918 605,184,335 ,343,038 C) 3,821.959.408 -487.616.370 569,229,167 ,961,182 C) 4,347,945,979 —864,984,797 824,989,797 ,260,097 C) 4,343,436,402 —734,176,305 773,739,374 ,713,783 C) 4,640,048,550 —770,334,767 817,693,516 ,516,717 C) 4,971,215,682 —577,698,965 698,626,276 ,663,155 C) 5,467,205,453 —804,542,298 764,090,520 ,666,873 C) 5,926,862,604 —888,195,731 941,698,236 ,427,981 C) 6,467,613,482—1,141,185,501 1,174,402,507 ,395,043 C) 6,793,911,210—1,079,516,167 1,140,204,035 ,768,003 C) 7,273,101,703 —920,333,700 1,133,664,184 ,127,625 C) 8,080,151.078—1.510.023.453 1,735,039,917 ,594,243 C) 9,090,004,693—2,183.410.451 2.576.625.999 ,617.835 C) 9.843.421.449 —354.803.614 1,284,282,854 ,258,765 C) 10,090,977,548 —156,718,783 2,516,836 ,552,640 {') 12,343,822,193 —273,269,553 329,677,018 ,485,992 C) 13,663,714,292—1,112,228,300 820,130,750 ,836,547 (') 14,112,638,457—1,175,801,911 1,045,764,875 ,647,779 {') 3,446,477,332 15,170,448 108,785,379 ,678,000 C) 15,529,527,000 —687,849,000 930,653,652
* Includes salary deductions paid to and deposited for credit to the retirement fund. ' On basis of warrants-issued adjusted to basis of daily Treasury statements through 1947. 'Advances to the Postmaster General to meet estimated deficiencies in postal revenues, reduced by
repayments from prior year advances. Excludes allowances for offsets of extraordinary expenditures or the cost of free mailings. Figures are on basis of warrants-issued adjusted to basis of daily Treasury statements through 1953, and thereafter on basis of the central accounts of the U.S. Govemment maintained by the Department of the Treasury.
* Repayment of unexpended portion of prior years' advances. 'Transactions for 1954 to date are on the basis of cash receipts and expenditures as reported by the U.S.
Postal Service. Reports ofthe Postmaster General are on a modified accmal basis. «See letter ofthe Postmaster General in exhibits in Annual Reports prior to 1958. 'Under the act of May 27, 1958 (72 Stat. 143), the Postmaster General is no longer required to certify the
estimated amounts of postage that would have collected on certain free or reduced-rate mailings. NOTE.—For figures from 1789-1935 see Annual Report for 1946, p. 419.
Digitized for FRASER http://fraser.stlouisfed.org/ Federal Reserve Bank of St. Louis
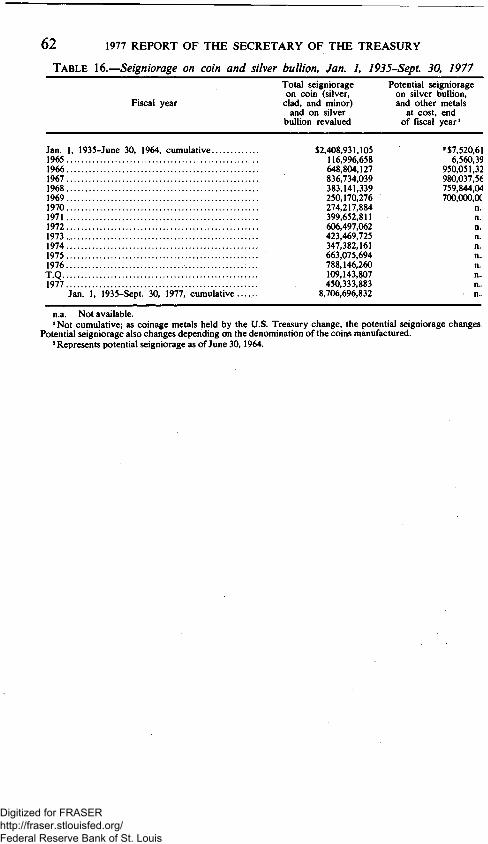
6 2 1977 REPORT OF THE SECRETARY OF THE TREASURY
TABLE 16.—Seigniorage on coin and silver bullion, Jan. 1, 1935-Sept. 30, 1977
Fiscal year
Jan. 1, 1935-June 30, 1964, cumulative 1965 1966 1967 1968 1969 1970 1971 1972 1973 1974 1975 1976 T Q 1977
Jan. 1, 1935-Sept. 30, 1977, cumulative.......
n.a. Not available. * Not cumulative; as coinage metals held by the U.S. Treasury change, the potential seigniorage changes
Potential seigniorage also changes depending on the denomination ofthe coins manufactured. 'Represents potential seigniorage as of June 30, 1964.
Total seigniorage on coin (silver.
clad, and minor) and on silver
bullion revalued
$2,408,931,105 116,996,658 648,804,127 836,734,039 383,141,339 250,170,276 274,217,884 399,652,811 606,497,062 423,469,725 347,382,161 663,075,694 788,146,260 109,143,807 450,333,883
8,706,696,832
Potential seigniorage on silver bullion. and other metals
at cost. of fiscal
end year*
'$7,520,61 6,560,39
950,051,32 980,037,56 759.844.04 700.000.0C
n.; n.i
n.; n. n. n. n. n. n. n.
Digitized for FRASER http://fraser.stlouisfed.org/ Federal Reserve Bank of St. Louis

STATISTICAL APPENDIX
Federal Debt
I.—OUTSTANDING
TABLE 17.—Federal securities outstanding, fiscal year 1962 to date [Public debt securities on basis of Daily Treasury Statement through 1974;
Monthly Statement of the Public Debt of the United States thereafter. Agency securities on basis of administrative accounts and reports]
Fiscal year
63
Public debt securities *
Agency securities'
Total Federal securities
1962. 1963. 1964. 1965. 1966. 1967. 1968. 1969. 1970. 1971. 1972. 1973. 1974. 1975. 1976. T.Q.. 1977.
$295,363,518,321 302.683.676.396 308.131,638.257 313.818.898.984 316.097.587.795 322.892.937,795 345,369,406,426 352,895,253,841 370,093,706,950 397,304,744.455 426,435.460,940 457,316,605,312 474,234,815,732 533,188,262,501 620,432,256,995 634,701,240,052 698,839,928,356
$7,927,356,819 8,123,100,192 8,631,287,094 9,335,416,039 13,376,757,266 18,455,326,671 24,399,459,289 14,249.052.696 12,509.702.555 12.162.732,155 10,893.562.236 11.109,062.824 12.012,272.195 10.943,130.937 10.852,769.871 11.046.861.047 10,297.824.835
$303,290,875,140 310.806,776,588 316,762.925.351 323.154.315,023 329,474.345.061 341,348.264.466 369.768.865,715 367,144,306,537 382,603,409,505 409,467,476,611 437,329,023,176 468,425.668,136 486,247,087,927 544,131,393,438 631,285,026,866 645.748,101,099 709,137.753,191
* Includes certain securities subject to statutory limitation. For amounts subject to limitation, see table 21. ' For content, see table 24.
TABLE 18.—Federal securities held by the public, fiscal year 1962 to date [On basis of Monthly Treasury Statement of Receipts and Outlays of the
U.S. Govemment]
Fiscal year
Deduct Held by the public
Federal securities *
$303,290,875,140 310,806,776,588 316,762,925,351 323,154,315,023 329,474,345,061 341,348,264,466 369,768,865,715 367,144,306.537 382,603.409.505 409.467,476,611 437,329,023,176 468,425,668,136 486,247,087,927 544,131,393,438 631,285,026,866 645,748,101,099 709,137,753,191
Investments of G o v e m m e n t accounts
$54,917,698,638 56,345,474,329 59,209,859,460 61,540,352,558 64,783,929,484 73,819,395,745 79,139,566,850 87,661,296,652 97,723,153,576 105,139,699,043 113,559,439,170 125,381,073,208 140,193,921,823 147,225,099,425 151,565,893,583 '148,052,209,242 '157,295,161,036
Total
$248,373,176,502 254,461,302,259 257,553,065,891 261,613,962,465 264,690,415,577 267,528,868,721 290,629,298,865 279,483,009,885 284,880,255,929 304,327,777,567 323,769,584,007 343,044,594,928 346,053,166,104 396,906,294,014 479,719,133,283 497,695,891,857 551,842,592,155
Per capita'
$1,330.65 1,343.39 1,340.58 1,344.42 1,344.24 1,343.60 1,444.82 1,375.30 1,391.01 1,469.83 1,550.31 1,630.47 1,633.14 1,858.70 2,229.78 2,313.34
"2,545.20
1962. 1963. 1964. 1965. 1966. 1967. 1968. 1969. 1970. 1971. 1972. 1973. 1974. 1975. 1976. T.Q.. 1977.
"Preliminary. * For content, see table 17. 'Based on the Bureau ofthe Census estimated population. ' For content, see table 20.
Digitized for FRASER http://fraser.stlouisfed.org/ Federal Reserve Bank of St. Louis
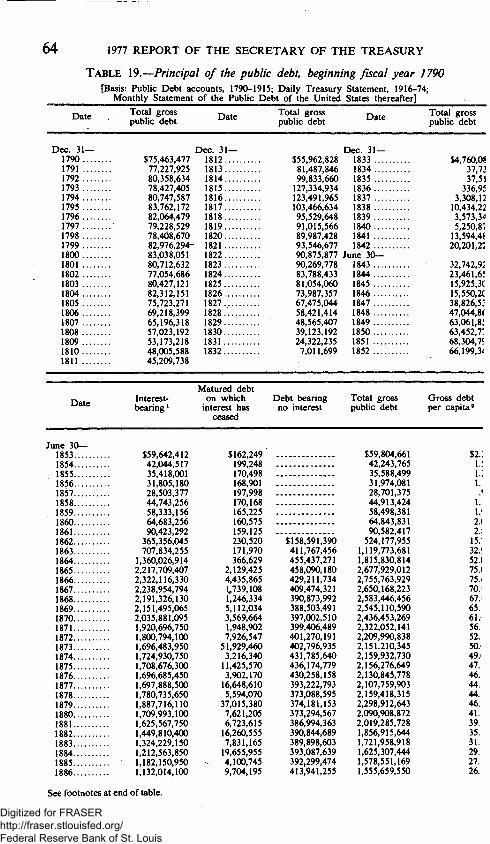
64 1977 REPORT OF THE SECRETARY OF THE TREASURY
TABLE 19.—Principal of the public debt, beginning fiscal year 1790 [Basis: Public Debt accounts, 1790-1915; Daily Treasury Statement, 1916-74;
Monthly Statement of the Public Debt of the United States thereafter]
Date Total gross public debt Date Total gross
public debt Date Total gross public debt
Dec. 3 1 — 1790 1791 1792 1793 1794 1795 1796 1797 1798 1799 1800 1801 1802 1803 1804 1805 1806 1807 1808 1809 1810 1811
] $75,463,477 77,227,925 80,358,634 78,427,405 80,747,587 83,762,172 82,064,479 79,228,529 78,408,670 82,976,294-83,038,051 80,712,632 77,054,686 80,427,121 82,312,151 75,723,271 69,218,399 65,196,318 57,023,192 53,173,218 48,005,588 45,209,738
Dec. 3 1 -1812 1813 1814 1815 1816 1817 1818 1819 1820 1821 1822 1823 1824 1825 1826 1827 1828 1829 1830 1831 1832
$55,962,828 81,487,846 99,833,660 127,334,934 123,491,965 103,466,634 95,529,648 91,015,566 89,987,428 93,546,677
Dec. 3 1 -1833 1834 1835 1836 1837 1838 1839 1840 1841 1842
90,875,877 June 3 0 — 90,269,778 83,788,433 81,054,060 73,987,357 67,475,044 58,421,414 48,565,407 39,123,192 24,322,235 7,011.699
1843 1844 1845 1846 1847 1848 1849 1850 1851 1852
Date Interest-bearing *
Matured debt on which
interest has ceased
Debt bearing no interest
Total gross public debt
Gross debt per capita'
June 3 0 — 1853 1854 1855 1856 1857 1858
, 1859 1860 1861 1862 1863 1864 1865 1866 1867 1868 1869 1870 1871 1872 1873 1874 1875 1876 1877 1878 1879 1880 1881 1882 1883 1884 1885 1886
$59,642,412 42.044,517 35.418.001 31.805.180 28,503,377 44,743,256 58,333,156 64,683,256 90,423,292
365,356,045 707,834,255
1,360,026,914 2,217,709,407 2,322,116,330 2,238,954,794 2,191,326,130 2,151,495,065 2,035,881,095 1,920,696,750 1,800,794,100 1,696,483,950 1,724,930,750 1,708,676,300 1,696,685,450 1,697,888,500 1,780,735,650 1,887,716,110 1,709,993,100 1,625,567,750 1.449,810,400 1,324,229,150 1,212.563.850 1.182,150.950 1,132.014,100
$162,249 $59,804,661 199,248 42,243,765 170,498 35,588,499 168,901 31.974.081 197,998 28,701,375 170,168 44,913,424 165,225 58,498,381 160,575 64,843,831 159,125 90,582,417 230,520 $158,591,390 524,177,955 171,970 411,767,456 1,119,773,681 366,629 455,437,271 1,815,830,814
2,129,425 458,090,180 2,677,929,012 4,435,865 429,211,734 2,755,763,929 1^739.108 409.474.321 2.650,168.223 1.246,334 390,873,992 2,583,446,456 5,112,034 388,503,491 2,545,110,590 3,569,664 397,002,510 2,436,453,269 1,948,902 399,406,489 2,322,052,141 7,926,547 401,270,191 2,209,990,838
51,929,460 402,796,935 2,151,210,345 3,216,340 431,785,640 2,159,932,730
11,425,570 436,174,779 2,156,276,649 3,902,170 430,258,158 2,130,845,778 16,648,610 393,222,793 2,107,759,903 5,594,070 373,088,595 2,159,418,315
37,015,380 374,181,153 2,298,912,643 7,621,205 373,294,567 2,090,908,872 6,723,615 386,994,363 2.019,285,728 16,260,555 390,844,689 1,856,915,644 7,831,165 389,898,603 1,721,958,918
19,655,955 393,087,639 1,625,307,444 4,100,745 392,299,474 1,578,551,169 9,704,195 413,941,255 1,555,659,550
See footnotes at end of table.
Digitized for FRASER http://fraser.stlouisfed.org/ Federal Reserve Bank of St. Louis

STATISTICAL APPENDIX 6 5
TABLE 19.—Principal of the public debt, beginning fiscal year 1790—Continued
Date Interest-bearing *
Matured debt on which
interest has ceased
Debt bearing no interest
Total gross public debt
Gross debt per capita'
June 3 0 — 1887 $1,007,692,350 $6,114,915 $451,678,029 $1,465,485,294 1888 936,522,500 2,495,845 445,613,311 1,384,631,656 1889 815,853,990 1,911,235 431,705,286 1,249,470,511 1890 711,313,110 1,815,555 409,267,919 1,122,396,584 1891. 610,529,120 1,614,705 393,662,736 1,005,806,561 1892 585,029,330 2,785,875 380.403.636 968.218,841 1893 585.037.100 2.094,060 374,300,606 961,431,766 1894 635,041,890 1,851,240 380,004,687 1,016,897,817 1895 716.202.060 1.721.590 378.989.470 1.096.913,120 1896 847,363,890 1,636,890 373.728.570 1.222.729,350 1897 847,365.130 1,346,880 378,081,703 1,226,793,713 1898 847,367,470 1,262,680 384,112,913 1;232,743,063 1899 1,046,048,750 1,218,300 389,433,654 1,436,700,704 1900 1,023,478,860 1,176,320 238,761,733 1,263,416,913 1901 987,141,040 1,415,620 233,015,585 1,221,572,245 1902 931,070,340 1,280,860 245,680,157 1,178.031,357 1903 914.541,410 1,205,090 243,659,413 1,159,405,913 1904 895,157,440 1,970,920 239,130,656 1,136,259,016 1905 895,158,340 1,370,245 235,828,510 1,132,357,095 1906 895,159,140 1,128,135 246,235,695 1,142,522,970 1907 894,834,280 1,086,815 251,257,098 1,147,178,193 1908 897,503,990 4,130,015 276,056,398 1,177,690,403 1909 913,317,490 2,883,855 232,114,027 1,148,315,372 1910 913,317,490 2,124,895 231,497,584 1,146,939,969 1911 915,353,190 1,879,830 236,751,917 1,153,984,937 1912 963,776,770 1,760,450 228,301,285 1,193,838,505 1913 965,706,610 1,659,550 225,681,585 1,193,047,745 1914 967,953,310 1,552,560 218,729,530 1,188,235,400 1915 969,759,090 1,507,260 219,997,718 1,191,264,068 1916 971,562,590 1,473,100 252,109,877 1,225,145,568 1917 2,712,549,477 14,232,230 248,836,878 2,975,618,585 1918 12,197,507,642 20,242,550 237,475,173 12,455,225,365 1919 25,236,947,172 11,176,250 236,382,738 25,484,506,160 1920 24,062,500,285 6,745,237 230,075,945 24,299,321,467 1921 23,738,900,085 10,688,160 227,862,308 23,977,450,553 1922 22,710,338,105 25,250,880 227,792,723 22,963,381,708 1923 22,007,043,612 98,738,910 243,924,844 22,349,707,365 1924 20,981,242,042 30,278,200 239,292,747 21,250,812,989 1925 . 20,210,906,915 30,258,980 275,027,993 20,516,193,888 1926 19,383,770,860 13,359,900 246,085,555 19,643,216,315 1927 18,252,664,666 14,718,585 244,523,681 18.511.906.932 1928 17.317,694.182 45.335,060 241,263,959 17.604.293.201 1929 16.638.941.379 50.749,199 241,397,905 16,931,088,484 1930 15,921,892,350 31,716,870 231,700,611 16,185,309,831 1931 16,519,588,640 51,819,095 229,873,756 16,801,281,492 1932 19,161,273,540 60,079,385 265,649,519 19,487,002,444 1933 22,157,643,120 65,911,170 315,118,270 22,538,672,560 1934 26,480,487,870 54,266,830 518,386,714 27,053,141,414 1935 27,645,241,089 230,662,155 824,989,381 28,700,892,625 1936 32,988,790,135 169,363,395 620,389,964 33,778,543,494 1937 35,800,109,418 118,529,815 505,974,499 36,424,613,732 1938 36,575,925,880 141,362,460 447,451.975 37,164.740.315 1939 39.885.969,732 142,283,140 411,279.539 40.439.532.411 1940 42.376.495,928 204,591,190 386,443.919 42.967.531,038 1941 48,387,399,539 204,999,860 369,044,137 48,961,443,536 1942 . . 71,968,418,098 98,299,730 355,727,288 72,422,445,116 1943 . . 135,380,305,795 140,500,090 1,175,284,445 136,696,090,330 1944 199,543,355,301 200,851,160 1,259,180,760 201,003,387,221 1945 256,356,615,818 268,667,135 2,056,904,457 258,682,187,410 1946 268,110,872,218 376,406,860 934,820,095 269,422,099,173 1 9 4 7 " 255,113,412,039 230,913,536 1,218,057,534 256,562,383,109 1948 250,063,348,379 279,751,730 788,146,403 251,131,246,513 1949 250,761,636,723 244,757,458 700,965,680 251,707,359,860 1950" ... 255,209,353,372 264,770,705 613,228,274 256,087,352,351 195l' " 252,851,765,497 512,046,600 575,164,718 253,938,976,815 1952""' 256,862,861,128 418,692,165 549,625,492 257,831,178,785 1 9 5 3 " 263,946,017,740 298,420,570 524,623.328 264,769,061,639 1 9 5 4 " 268,909,766,654 437,184,655 501,647,799 269,848,599,108
$24.75 22.89 20.23 17.80 15.63 14.74 14.36 14.89 15.76 17.25 16.99 16.77 19.21 16.60 15.74 14.88 14.38 13.83 13.51 13.39 13.17 13.28 12.69 12.41 12.29 12.52 12.27 11.99 11.85 12.02 28.77 119.13 242.56 228.23 220.91 208.65 199.64 186.23 177.12 167.32 155.51 146.09 139.04 131.51 135.45 156.10 179.48 214.07 ^25.55 263.79 282.75 286.27 308.98 325.23 367.09 537.13 999.83
1,452.44 1,848.60 1,905.42 1,780.09 1,712.79 1,687.62 1,688.30 1,645.88 1,642.73 1,659.32 1,661.72
See footnotes at end of table. Digitized for FRASER http://fraser.stlouisfed.org/ Federal Reserve Bank of St. Louis
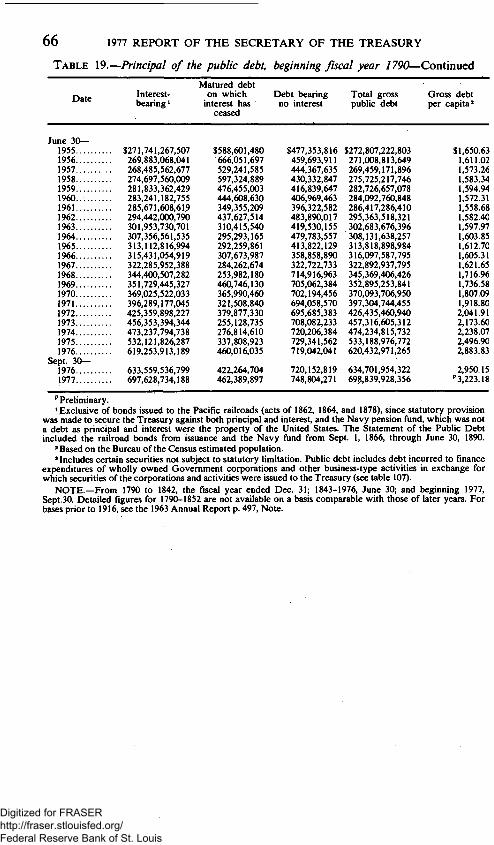
6 6 1977 REPORT OF THE SECRETARY OF THE TREASURY
TABLE 19.—Principal of the public debt, beginning fiscal year 1790—Continued
Date
June 3 0 — 1955 1956 1957 1958 1959 1960... 1961 1962 1963 1964 1965 1966 1967 1968 1969 1970 1971 1972 1973 1974 1975 1976
Sept. 3 0 — 1976 1977
Interest-bearing *
. $271,741,267,507 269,883,068,041 268,485,562,677 274,697,560,009 281,833,362,429 283,241,182,755 285,671,608,619 294,442,000,790 301,953,730,701 307,356,561,535 313,112,816,994 315,431,054,919 322,285,952,388 344,400,507,282 351,729,445,327 369,025,522,033 396,289,177,045 425,359,898,227 456,353,394,344 473,237,794,738 532,121,826,287 619,253,913,189
633,559,536,799 697,628,734,188
Matured debt on which interest has
ceased
$588,601,480 666,051,697 529,241,585 597,324,889 476,455,003 444,608,630 349,355,209 437,627,514 310,415,540 295,293,165 292,259,861 307,673,987 284,262,674 253,982,180 460,746,130 365,990,460 321,508,840 379,877,330 255,128,735 276,814,610 337,808,923 460,016,035
422,264,704 462,389,897
Debt bearing no interest
$477,353,816 459,693,911 444,367,635 430,332,847 416,839,647 406,969,463 396,322,582 483,890,017 419,530,155 479,783,557 413,822,129 358.858,890 322.722.733 714.916.963 705.062.384 702,194,456 694,058,570 695,685,383 708,082,233 720,206,384 729,341,562 719,042,041
720,152,819 748,804,271
Total gross public debt
$272,807,222,803 271,008,813,649 269,459,171.896 275,725.217.746 282.726.657.078 284.092,760.848 286.417,286,410 295.363.518.321 302.683,676.396 308.131.638.257 313.818,898.984 316,097,587,795 322,892,937,795 345,369,406,426 352,895,253,841 370,093,706,950 397,304,744,455 426,435,460,940 457,316,605,312 474,234,815,732 533,188,976,772 620,432,971,265
634,701,954,322 698,839,928,356
Gross debt per capita'
$1,650.63 1,611.02 1,573.26 1,583.34 1,59494 1,572.31 1,558.68 1,582.40 1,597.97 1,603.85 1,612.70 1,605.31 1,621.65 1,716.96 1,736.58 1,807.09 1,918.8C 2,041.91 2,173.6C 2,238.07 2,496.9C 2,883.83
2,950.15 "3,223.18
" Preliminary. * Exclusive ofbonds issued to the Pacific railroads (acts of 1862, 1864, and 1878), since statutory provision
was made to secure the Treasury against both principal and interest, and the Navy pension fund, which was not a debt as principal and interest were the property of the United States. The Statement of the Public Debt included the railroad bonds from issuance and the Navy fund from Sept. 1, 1866, through June 30, 1890.
' Based on the Bureau of the Census estimated population. ' Includes certain securities not subject to statutory limitation. Public debt includes debt incurred to finance
expenditures of wholly owned Govemment corporations and other business-type activities in exchange for which securities ofthe corporations and activities were issued to the Treasury (see table 107).
NOTE.—From 1790 to 1842, the fiscal year ended Dec. 31; 1843-1976, June 30; and beginning 1977. Sept.30. Detailed figures for 1790-1852 are not available on a basis comparable with those of later years. For bases prior to 1916, see the 1963 Annual Report p. 497, Note.
Digitized for FRASER http://fraser.stlouisfed.org/ Federal Reserve Bank of St. Louis

STATISTICAL APPENDIX 67 TABLE 20.—Investment holdings of Government accounts in Federal securities,
Sept. 30, 1976 and 1977 [Amounts represent public debt securities unless stated otherwise. Par value. In thousands of dollars. On basis of Monthly Treasury Statement of Receipts and Outlays of the United States Govemment]
Agency Sept. 30, 1976
Sept. 30, 1977
Legislative branch: Library of Congress:
Library of Congress tmst fund, investment account 1,340 United States Tax Court: Tax Court judges survivors annuity fund 565
The judiciary: Judicial survivors annuity • fund 10,921
Funds appropriated to the President: Overseas Private Investment Corporation 262,755
Agriculture Department: Commodity Credit Corporation: Agency securities:
Defense family housing mortgages 35,215 Agricultural Marketing Service:
Milk market orders assessment fund 542 Rural Electrification Administration:
Rural Telephone Bank 4,401 Commerce Department:
Federal ship financing fund, fishing vessels 1,500 Federal ship financing fund, revolving fund 98,174 War-risk insurance revolving fund 6,796 Gifts and bequests 35
Defense Department: Army Department:
Bequest of Maj. Gen. Fred C. Ainsworth 11 General gift fund 129
Navy Department: Office of Naval Records and History fund 348 U.S. Naval Academy museum fund 404 U.S. Naval Academy general gift fund 108 Navy general gift fund 102
Air Force Department: General gift fund 6
Health, Education, and Welfare Department: Federal old-age and survivors insurance trust fund 36,499,847 Agency securities 555,000
Federal disability insurance trust fund 6,453,247 Federal hospital insurance tmst fund 10,959,482 Agency securities 50,000
Federal supplementary medical insurance tmst fund 1,243,945 Northem Mariana Islands social security retirement fund Public Health Service unconditional gift fund 105 Public Health Service conditional gift fund 30 St. Elizabeths Hospital unconditional gift fund 48 Patients' benefit fund. Public Health Service hospitals 4
Housing and Urban Development Department: Federal Housing Administration:
Revolving fund 1,511,496 Agency securities * 191,203
Community disposal operations fund: Agency securities ' 388
Govemment National Mortgage Association: Participation sales fund 1,605,008 Agency securities 86,745
Guarantees of mortgage-backed securities fund 39,249 Agency securities '3,191
Management and liquidating functions: Agency securities * 39,456
Special assistance functions: Agency securities * 109,083
Federal Insurance Administration: National insurance development fund 91,697 Low-rent public housing fund 40,390
1,340
599
41,469
312,515
29,215
2,375
4,066
1,435 129,969
7,306 45
11 98
346
226 102
34,854,827 555,000
4,241,910 10,923,740
50,000 2,232,078
929 105 100 48
4
1,712,806 '191,020
'388
1,509,734 86,745 57,578 '6,376
'35,799
'108,179
88,232 29,610
See footnotes at end of table.
Digitized for FRASER http://fraser.stlouisfed.org/ Federal Reserve Bank of St. Louis

68 1977 REPORT OF THE SECRETARY OF THE TREASURY
TABLE 20.—Investment holdings of Government accounts in Federal securities, Sept. 30, 1976 and 7977—Continued
[In thousands of dollars,]
Agency
Interior Department: Bonneville Power Administration Indian moneys, proceeds of labor, agencies, schools, etc Indian tribal funds Preservation of birthplace of Abraham Lincoln Bequest of George C. Edgeter, relief of indigent American Indians. Funds contributed for the advancement of the Indian race.
Bureau of Indian Affairs Labor Department: Pension Benefit Guaranty Corporation Unemployment trust fund Relief and rehabilitation, Longshoremen's and Harbor Workers' Compensation Act, as amended
Relief and rehabilitation, Workmen's Compensation Act within the District of Columbia
State Department: Foreign service retirement and disability fund Conditional gift fund
Transportation Department: Airport and airway trust fund Aviation war risk insurance revolving fund Federal Railroad Administration fund Highway trust fund Coast Guard general gift fund
Treasury Department: Exchange Stabilization Fund Pershing Hall Memorial fund Office of the Comptroller of the Currency Esther Cattell Schmitt gift fund
General Services Administration: National Archives gift fund National Archives trust fund
Veterans Administration: Veterans reopened insurance fund Veterans special life insurance fund Natidnal service life insurance fund Agency securities
Govemment life insurance fund General post fund, national homes .•
Civil Service Commission: Civil service retirement and disability fund
Agency securities Employees health benefits fund Employees life insurance fund Retired employees health benefits fund
Emergency Loan Guarantee Board: Emergency loan guarantee fund
Export-Import Bank of the United States Federal Deposit Insurance Corporation Federal Financing Bank Federal Home Loan Bank Board:
Federal Savings and Loan Insurance Corporation Agency securities
Japan-United States Friendship Commission: Japan-United States friendship fund
Harry S. Truman Scholarship Foundation: Harry S. Truman memorial scholarship trust fund
National Credit Union Administration: National credit union share insurance fund
United States Postal Service Railroad Retirement Board:
Railroad retirement account Agency securities
Railroad retirement supplemental account
Total '.
Sept. 30, 1976
39,345 1,600
12,555 64 31
20
55,761 4,914,103
4,503
869
175,608 215
2,712,201 14,415
8 95i,'8"7"6 10
1,529,337 211
47,835 414
290 3,695
353,643 482,265
6,956,192 310,000 560,079
1.143
42,289,894 375,000 321,914
2,131,947 17,281
25,930
6[66'7,o"8'3 124,125
4,102,837 "141.977
18.885
10,048
69,725 1,431,200
3,275,124 50,000 27,997
148,052,209
Sept. 30. 1977
46c 6.08C
64 31
2C
71.465 5,987.165
3,838
869
267,948 48C
3,245,981 15,195
16C 10,078,68'3
IC
2,049,565 211
52,245
42C 3,41C
381,80( 528,38«
7,250,28« 235,00( 525,87:
l,47f
49,221,36i 375,00( 424,16:
2,529,80: 13,22<
31,51( 12,60(
7,462,45j 38,20!
4,536,16( M32,16!
19,12!
31,16:
89,28^ 1,271,20(
3,146,351
"35J5(
157,295,16
See footnotes at end of table.
Digitized for FRASER http://fraser.stlouisfed.org/ Federal Reserve Bank of St. Louis

STATISTICAL APPENDIX 6 9
TABLE 20.—Investment holdings of Government accounts in Federal securities, Sept. 30, 1976 and 7977—Continued
^ [In thousands of dollars.]
Aeencv ^^P^' ^° ' ^^P^' ^° ' Agency ^^^^ j ^ ^ ^
MEMORANDUM
Investments in securities of privately owned Govemment-sponsored enterprises:
Milk market orders assessment fund 200
Total 200
* Represents Defense family housing mortgages. Federal Housing Administration debentures, and participation certificates amounting to $198,978, $51,969,100, and $139,035,000, respectively.
'Represents Defense family housing mortgages. Federal Housing Administration debentures, and participation certificates amounting to $184,814, $51,820,100, and $139,015,000, respectively.
'Represents Federal Housing Administration debentures. •Represents Defense family housing mortgages, and Federal Housing Administration debentures amounting
to $39,080,675 and $375,100, respectively. 'Represents Defense family housing mortgages, and Federal Housing Administration debentures amounting
to $35,424,034 and $375,100, respectively. * Represents Defense family housing mortgages, and Federal Housing Administration debentures amounting
to $66,611,915 and $42,470,700, respectively. ' Represents Defense family housing mortgages, and Federal Housing Administration debentures amounting
to $58,766,020 and $49,413,000, respectively. ' Represents Federal Housing Administration debentures, and participation certificates amounting to $26,700
and $141,950,000. respectively. 'Represents Federal Housing Administration debentures, and participation certificates amounting to $214,700
and $131,950,000 respectively.
Digitized for FRASER http://fraser.stlouisfed.org/ Federal Reserve Bank of St. Louis

70 1977 REPORT OF THE SECRETARY OF THE TREASURY
TABLE 21.—Debt subject to statutory limitation, outstanding June 30, 1940-76, and Sept 30, 1976-77
[Basis: Daily Treasury Statement through 1974; Monthly Statement of the Public Debt of the United States thereafter]
June 3 0 — 1940 1941 1942 1943 1944 1945 1946 1947 1948 1949 1950 1951 1952 1953 1954 1955 1956 1957...... 1958 1959 1960 1961 1962 1963 1964 1965 1966 1967 1968 1969 1970 1971 1972 1973 1974 1975 1976
Sept. 3 0 -1976 1977
Public debt subject to limitation *
$37,690,052,720 43,123,336,151 69,586,197,977 136,369,140,696 206,454,185,750 268,237,605,076 268,455,970,443 255,677,895,875 250,307,110,567 250,937,437,177 255,362,630,395 253,254,402,501 257,187,032,792 264,167,663,620 269,297,863,230 272,303,706,735 270,545,327,974 269,013,184,136 275,294,219,021 282,308,204,940 283,687,122,549 286.067.994,880 294,930,243,938 302,315,933,069 307,769,920,709 313,535,533,998 315,831,173,677 322,630,925,138 344,715,571,182 352,259,483,788 369,462,837,088 396,677,982,770 425,812,528,424 456,696,848,411 473^617,575,574 532,564,729,409 619,819,501,028
634,088,788,810 698,228,803,546
Debt of U.S. G o v e m m e n t agencies and District of Columbia subject to limitation'
Interest-bearing
$5,497,556,555 6,359,619,105 4,548,529,255 4,091,686,621 1,515,638,626 409,091,867 466,671,984 83,212,285 68,768,043 23,862,383 17,077,809 27,364,069 44,092,646 50,881,686 80,415,386 43,257,786 73,100,900 106.434,150 100,565,250 110,429,100 139,305,000 239,694,000 443,688,500 605,489,600 812,272,200 588,900,500 460,474,100 511,788,700
3,818,220,100 3,846,687,850 3,136,645,950 1,971,312,250 1,938,561,750 1,566,445,000 1,562,826,950 1,641,719,900 1,735,847,900
1,732,947,600 1,733,952,900
Matured
$31,514,100 10,633,475 19,730,375 8,256,425
107,430,675 24,066,525 9,712,875 6,307,900 4,692,775 3,413,025 2,425,225 1,863,100 1,472,700 1,191,075 1,026,000 885,175 787,575 703,800 655,350 590,050 536,775 521.450 530,425
1,120,775 719,725
1,425,550 1,073,175 407,375 365,800 352,150 343,625 304,525 291,100 264,800 278,275 412,064 326,675
374,956 403,405
Total
$5,529,070,655 6,370,252,580 4,568,259,630 4,099,943.046 1,623,069,301 433,158,392 476,384,859 89,520,185 73,460,818 27,275,408 19,503,034 29,227,169 45,565,346 52,072,761 81,441,386 44,142,961 73,888,475 107,137,950 101,220.600 111.019.150 139,841,775 240,215,450 444,218,925 606,610,375 812,991,925 590,326,050 461,547,275 512,196,075
3,818,585,900 3,847,040,000 3,136,989,575 1,971,616,775 1,938,852,850 1,566,709,800 1,563,105,225 1,642,131,964 1,736,174,575
1,733,322,556 1,734,356,305
Debt subject to limitation'
$43,219,123,375 49,493,588,731 74,154,457,607 140,469,083,742 208,077,255,051 268,670,763,468 268,932,355,302 255,767.416,060 250.380,571,385 250,964,712,585 255,382,133,429 253,283,629,670 257,232,598,138 264,219,736,381 269,379,304,616 272,347,849,696 270,619,216,449 269,120,322,086 275,395,439,621 282,419,224,090 283,826,964,324 286,308,210,330 295,374,462,863 302,922,543,444 308,582,912,634 314,125,860,048 316,292,720,952 323,143,121,213 348,534,157,082 356,106,523,789 372,599,826,663 398,649,599,545 427,751,381,274 458,263,558,211 475,180,680,799 534,206,861,373 621,555,675,603
635,822,111,366 699,963,159,851
* Includes debt incurred to finance expenditures of Govemment corporations and other agencies in exchange for which securities of the corporations and activities were issued to the Treasury (see table 107).
'Held outside the Treasury. ' A summary of legislation on debt limitation under the Second Liberty Bond Act, as amended, from Sept.
24, 1917, through June 30, 1976, is shown in table 32. Securities held outside the Treasury are included in the limitation beginning Apr. 3, 1945. In computing statutory debt limitation, savings bonds are carried at maturity value from their origin in 1935 until June 26,1946; from that date they are carried at current redemption value.
Digitized for FRASER http://fraser.stlouisfed.org/ Federal Reserve Bank of St. Louis

TABLE 11.—Public debt outstanding by classification, June 30, 1968-76, and Sept. 30, 1976-77 [In millions of dollars. Basis: Daily Treasury Statement through 1974; Monthly Statement of the Public Debt of the United States thereafter]
Class 1968 1969 1970 1971 1972 1973 1974 1975 1976 T Q ! 1977
Interest-bearing: Marketable:
Treasury bills: Regular weekly.. Tax anticipation . Other
Treasury notes Treasury bonds . . .
Total marketable issues.
Nonmarketable: Certificates of indebtedness:
Foreign currency series Foreign series: Foreign govemment series:
Dollar denominated Foreign currency denominated
Federal Reserve special certificates Treasury certificates Depositary bonds Treasury certificates of indebtedness— Treasury bonds:
Foreign series Investment series REA series
Treasury bonds Treasury notes:
Foreign currency series Foreign series
Treasury notes U.S. savings notes U.S. retirement plan bonds U.S. individual retirement bonds U.S. savings bonds Certificates of indebtedness—State and
local govemment series Treasury notes—State and local
govemment series Treasury bonds—State and local
govemment series
49.432
15.008 71.073 91.079
226.592
*217 893
30 30
114 2.516
23
*o 1.523 994
203 27
'"ixj'n
68.356
""7'8'.94is 78.805
226.107
'390 287
6 28
84 2.459
21
** 1.978 1,332
505 33
""51V7V1
74,396 1,758
"'9'3,489 62,956
232.599
'150 961,
785 25
54 2.387
15 75
*'1.216 2.374
742 39
""5"l.2'81
86.677
104.807 53.989
245.473
*899 2.126
"'»2,46'5 23
24 2.347
8 250
*'765 5.457
6T9 47
'53.(X)3
94.648
"113.419 49.135
257.202
'166 6.225
446 22
""2.310 10
250
** 1,906 10.688
'56I 55
""ss.Vii
100,061
"ii7^8'40 45,071
262.971
M 8 7 12.148
3*74 19
""2^2*75 7
250
*'1.556 14.633
55 519 64
""59^418
3
59
76
105.019
"i2Mi9 33.137
266.575
'127 8.757
563 16 15
" " ^ 2 7 1 8
250
*«1.472 14.655
60 477 75
"61^921
12
211
331
128.569
"150.257 36.779
315.606
21.617 '1.599
16
""2.267 11
435 98 1
65.482
8
287
521
161,198
"iVlJSS 39,626
392,581
19,901 '1,599
9
""2",263 (•)
413 121 12
69,733
44
615
1,406
161,505
"i66M9 39.839
407.663
19.215 «1.599
"9
""2".262 • (•)
"4b'7 121 14
70.752
80
927
1.871
156.091
241.692 45.724
443.508
20,510 1,289 2,500
7
2,247 9
394 140 30
75,411
254
8,145
3,072
C/)
>
H 0
> r >
2 X
^
See footnotes at end of table. Digitized for FRASER http://fraser.stlouisfed.org/ Federal Reserve Bank of St. Louis

TABLE 11.—Public debt outstanding by classification, June 30, 1968-76, and Sept. 30, 1976-77—Continued f j [In millions of dollars]
Class 1968 1969 1970 1971 1972 1973 1974 1975 1976 T J Q . 1977
Interest-bearing—Continued H-Govemment account series: S
Airport and airway tmst fund... Aviation, war-risk insurance, revolving fund.. Bonneville Power Administration:
Bills Notes
Civil service retirement fund: Certificates Notes Bonds
Comptroller of the Currency, assessments fund:
Bills Notes
Comptroller of the Currency, trustee fund Department of the Navy general gift fund . . . Department of the Navy, U.S Office of
Naval Records and History Department of State, conditional gift
fund, general Emergency loan guarantee fund bills Employees health benefits fund:
Bills Certificates Notes Bonds
Employees life insurance fund: Certificates Bills Notes Bonds
Exchange Stabilization Fund certificates Export-Import Bank of the United States certificates
Federal Deposit Insurance Corporation: Bills..; Certificates Notes
""5",45"7 10,169
-----
722
174
""8,V92 9,115
50
""T20
"li,033 7,847
60
74
"i5,d83 6,509
46
56
" " 1,242
l'56
"19,092 5,540
74
25
""i,4'2'4
"2'7'4
"23^667 4,822
23
77
' 2,9*34
263
878
"i^249 9,848
80
124
""2^364
436
1,936
2 9
"V9J62C) 15,753
"(•")
5
142 41
426
35 1,451
76 1,291
2,529 14
13 21
"16,711 23,490
8
(•)
(•)
(•)
(•) 23
132
83
53 142 734
1,512
10
221
2',471
2,712 14
10 -29 .
409 16,501 22,522
30
(•") (•) (*)
(•) 26
116
'96
54 223
1,088 1,529
18 3,411
3,246 15
9,107 12,233 25,023
34 7
(•) (•) (*)
(*) 32
176
96 43
55 224
1,555 2,050
13
350 353
4,126
H X W C/)
s >
0
X W
ifi
c ><
Digitized for FRASER http://fraser.stlouisfed.org/ Federal Reserve Bank of St. Louis
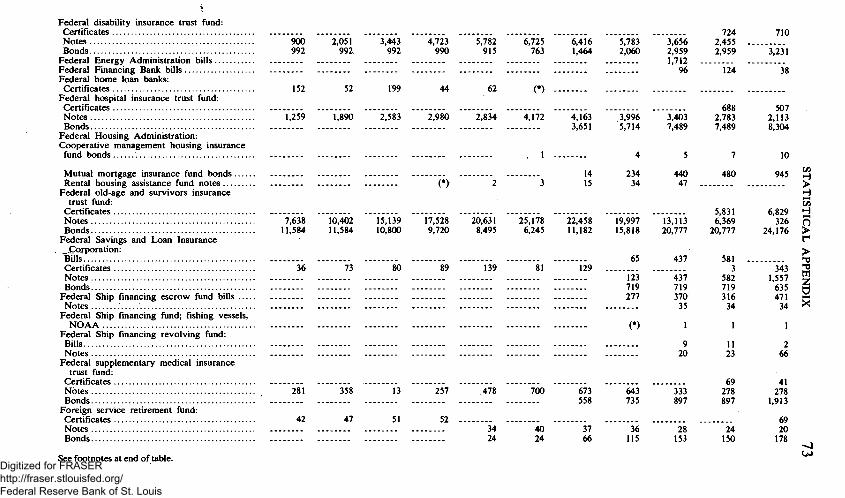
Federal disability insurance trust fiind: Certificates — Notes Bonds
Federal Energy Administration bills Federal Financing Bank bills Federal home loan banks:
Certificates Federal hospital insurance trust fund: Certificates Notes Bonds
Federal Housing Administration: Cooperative management housing insurance
ftind bonds
Mutual mortgage insurance fund bonds Rental housing assistance fund notes
Federal old-age and survivors insurance trust fund:
Certificates Notes Bonds
Federal Savings and Loan Insurance . _.Corporation:
Bills Certificates Notes Bonds
Federal Ship financing escrow fund bills — Notes
Federal Ship financing fund; fishing vessels. NOAA
Federal Ship financing revolving fund: Bills Notes
Federal supplementary medical insurance trust ftmd:
Certificates Notes Bonds
Foreign service retirement fund: Certificates Notes Bonds
See footnotes at end of table.
900 992
152
" T.2'59
""7'.638 11.584
36
"28"l
42
""2V05I 992
52
""l.8'9b
"To'.402 11.584
73
358
47
""3V443 992
199
""2.5V3
"'l5".V39 10.800
Vo
Y3
51
""4.72"3 990
44
""2.9"80
"(*)
""i7.52"8 9.720
89
2V7
52
""5."7'8'2 915
62
2.834
2
""26.6'31 8.495
l'39
4"78
3"4 24
6.725 763
(*)
4.172
. 1
3
""is'Sn 6.245
81
700
" 40 24
" ' 6 A \ 6 1.464
""4^163 3.651
14 15
""22^458 11.182
129
673 558
37 66
""5".783 2.060
" " 3 . 9 % 5,714
4
234 34
"19,997 15,818
65
123 719 277
(•)
643 735
36 115
3.656 2,959 1,712
96
""3",4b3 7,489
5
440 47
"'r3,ii3 20,777
437
437 719 370 35
1
9 20
333 897
28 153
724 2,455 2,959
124
688 2,783 7,489
7
480
5,831 6,369
20,777
581 3
582 719 316 34
1
23
69 278 897
24 150
710
3,23'l
38
507 2,113 8.304
10
945
6.829 326
24.176
343 1.557 635 471 34
1
2 66
41 278
1.913
69 20 178
i ifi
0 > r >
I ><
Digitized for FRASER http://fraser.stlouisfed.org/ Federal Reserve Bank of St. Louis
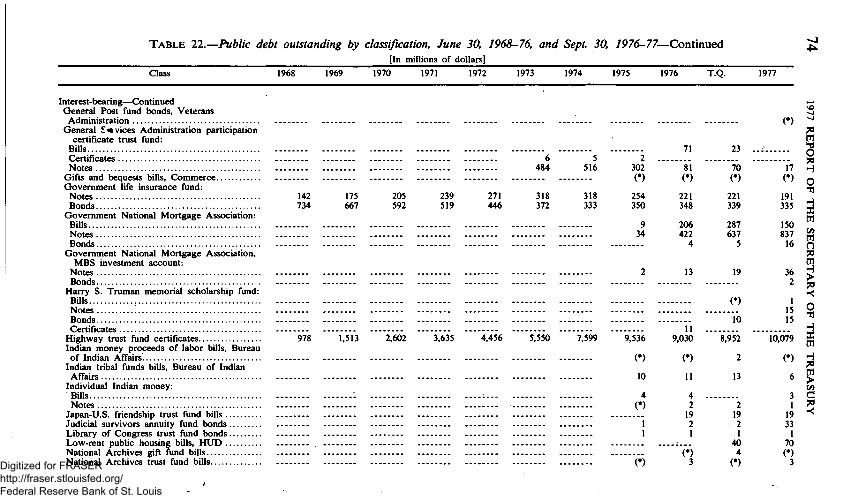
TABLE 11.—Public debt outstanding by classification, June 30, 1968-76, and Sept. 30, 1976-77—Continned [In millions of dollars]
Class 1968 1969 1970 1971 1972 1973 1974 1975 1976 T Q . 1977
Interest-bearing—Continued H-General Post fund bonds. Veterans 5
Administration (•) "^ General Seivices Administration participation ^
certificate trust fund: W Bills 71 23 - ^ g Certificates 6 5 2 M Notes 484 516 302 81 70 17 H
Gifts and bequests bills. Commerce (•) (•) (*) (•) Q Govemment life insurance fund: • A
Notes 142 175 205 239 271 318 318 254 221 221 191 , Bonds 734 667 592 519 446 372 333 350 348 339 335 3
Govemment National Mortgage Association: M Bills - 9 206 287 150 Notes 34 422 637 837 fg Bonds 4 5 16 O
Govemment National Mortgage Association. ^ MBS investment account: W
Notes 2 13 19 36 g Bonds 2 ^
Harry S. Tmman memorial scholarship fund: ^ Bills (•) 1 -. Notes 15 2 Bonds 10 15 ^ Certificates - 11 H
Highway tmst fund certificates 978 1.513 2.602 3.635 4.456 5.550 7.599 9,536 9,030 8,952 10,079 * Indian money proceeds of labor bills. Bureau of Indian Affairs. (•) (*) 2 (•) H
Indian tribal funds bills. Bureau of Indian S Affairs 10 11 13 6 ^
Individual Indian money: C/3 Bills 1 - 4 4 3 C Notes • (•) 2 2 1 2
Japan-U.S. friendship trust fund bUls 19 19 19 *^ Judicial survivors annuity fund bonds 1 2 2 33 Library of Congress tmst fund bonds I l l 1 Low-rent public housing bills, HUD - . - . 40 70 National Archives gift fund bills (•) 4 (•) National Archives tmst fund bills (*) 3 (•) 3 Digitized for FRASER
http://fraser.stlouisfed.org/ Federal Reserve Bank of St. Louis

National Credit Union share insurance fund. NCUA:
Bills. Notes Bonds
National insurance development fund notes. HUD
Bills National service life insurance fund:
Certificates Notes Bonds
Northem Mariana Islands certificates Obligation guarantee fund notes. Transporta
tion Overseas Private Investment Corporation:
Bills Notes
Pension Benefit Guaranty Corporation: Bills Notes Bonds
Postal Service fund: Bills Certificates Notes
Public Health Service, conditional gift fund. HEW
Public Health Service, unconditional gift fund bills
Railroad retirement account: Certificates Notes Bonds
Railroad retirement holding account certificates
Railroad retirement supplementary account certificates
Relief and rehabilitation, D .C , Labor: Bills Notes
Relief and rehabilitation, longshoremen and harbor workers. Labor:
Bills Notes
See footnotes at end of table.
918 4,937
1,220 2,063
5
15
l",2'03 4,551
l',553 1,874
2
5
i,752 4,164
2,387 1,344
2
18
2,298 3,770
3,207 620 -
3
22
2,779 3,376
96*3
11 .
3,7l"7
3
22
3,445 2,982
820
3,724
4
39
3,445 3,160
385
3,659
4
44
3
1
3,ii2 3,603
44 57
24 10
53
( • )
3,423
4
39
58 4
24 . 8
2,807 4,123
104 130
15 41
200 77
(*) ( • )
3,344
31
(•) -1
2 4
50 -14
31 8
26 2,807 4,123
71 173
1 43 12 -,
700 71
(•)
(•) 12
2,677
28
1
1 -. 4
74 12
68 5
10 2,238 5,002
1
( • )
77 230
48 23
555 378 45
(•)
(•) 460
2,188
36
1
4
S" H i / i H
> r >
1 z 0 X
•^ V/I
Digitized for FRASER http://fraser.stlouisfed.org/ Federal Reserve Bank of St. Louis

TABLE 11.—Public debt outstanding by classification, June 30, 1968-76, and Sept, 30, 1976-77—Continued Q^ [In millions of dollars]
Class 1968 1969 1970 1971 1972 1973 1974 1975 1976 TQ^ 1977
Interest-bearing—Continued Govemment account series—Continued Relief for indigent American Indians, BIA. . Tax Court judges survivors annuity
fund bonds Notes
Special investment account bonds Treasury deposit funds:
Bills Certificates of indebtedness Notes Bonds
Unemployment tmst fund certificates U.S. Army general gift fund notes
Bonds U.S. Naval Academy general gift fund U.S. Naval Academy museum fund Veterans special term insurance
fund certificates Notes Bonds
Veterans reopened insurance fund Notes Bonds
War-risk insurance revolving fund bills
Total Govemment account series
Total nonmarketable
Total jnterest-bearing debt _
Matured debt on which interest has ceased...
Debt bearing no interest: Mortgage Guaranty Insurance Company
tax and loss bonds U S savings stamps *' Excess profits tax refund bonds
""8V807
214
87
59,526
117,808
344,400
254
4 59
1
""9,"9'57
243
V22
66,790
125.623
351.729
461
9 62
1
" 'l6.'520
267
'156
76.323
136.426
369.026
366
15 58
1
" " 8 . 5 T 4
293
" l"89
82.784
150.816
396,289
322
19 49
1
" " 7 , T 8 ' 6
321
'2"2"o
89,598
168,158
425,360
380
27 47
1
" " M 3 0
353
2*53
101.738
193.382
456.353
255
41 49
1
" " M 9 5
302 88
217 67
115.442
206.663
473.238
277
56 48
1
(•)
4 519
63 250
4.557 (•)
" " 2 5 2 180
181 136 (•)
124.173
216.516
532.122
338
68 47
(•)
(•) (•)
2 81
393 66
250 2.203
(*) (•) (•)
1
202 275
144 205 (•)
130,557
226,673
619,254
460
60 47
1
(•)
(•) (•)
6 93
370 66
250 2,347
(•) (•) ('*)
5 202 275
4 144 205
1
128,640
225.897
633.560
422
62 47
1
(•)
(•)
35
71 347
70 250
3.603 (•) (•) (•)
2
4 151 373
1 109 272
1
140.113
254.121
697.629
462
93 47
1
y.
i / i
>
c
Digitized for FRASER http://fraser.stlouisfed.org/ Federal Reserve Bank of St. Louis

U.S. notes (less gold reserve through 1967)*' 323 323 323
Deposits for retirement of national bank and Federal Reserve bank notes
Other debt bearing no interest
Total debt bearing no interest *'
Total gross public debt"* 345.369 352.895 370.094
•Less than $500,000. * Dollar equivalent of certificates issued and payable in the amount of 440.000.000 Swiss
francs. 'Dollar equivalent of certificates issued and payable in the amount of 1.685.000.000
Swiss francs. ' Dollar equivalent of certificates issued and payable in the amount of 645.000.000 Swiss
francs. * Dollar equivalent of certificates issued and payable in the amount of 3.682.000.000
Swiss francs. ' Dollar equivalent of certificates issued and payable in the amount of 645.000.000 Swiss
francs. ' Dollar equivalent of certificates issued and payable in the amount of 645.000.000 Swiss
francs. 'Dollar equivalent of Treasury certificates issued and payable in the amount of
430.000.000 Swiss francs. ' Dollar equivalent of Treasury notes issued and payable in the amount of 5.403.000.000
Swiss francs. »Includes $2,008,488,000 Eurodollar series. *" Dollar equivalent of Treasury notes issued and payable in the amount of 1,217,000,000
Swiss francs, 700,000,000 deutsche marks, 650,000,000 Austrian schillings, 3.000.000.000 Belgian francs, and 78,000,000,000 Italian lire.
** Dollar equivalent of Treasury notes issued and payable in the amount of 1,627,000,000 Swiss francs, 5,300,000,000 deutsche marks, 1,300,000,000 Austrian schillings, and 140,500,000,000 Italian lire.
*'Dollar equivalent of Treasury notes issued and payable in the amount of 2,331,000,000 Swiss francs, and 2,500,000,000 deutsche marks.
323 323 323 323 323 323 323 323
80 249
715
78 234
705
76 231
702
74 228
694
73 226
696
72 224
708
71 222
720
70 221
729
69 219
719
69 219
720
69 218
749
397,305 426,435 457,317 474,235 533,189 620,433 634,702 698.840
*'Dollar equivalent of Treasury notes issued and payable in the amount of 369,000.000 Swiss francs, and 2.500.000,000 deutsche marks.
** Dollar equivalent of Treasury notes issued and payable in the amount of 4,757,980,000 Swiss francs, and 2,250,000,000 deutsche marks.
*'Dollar equivalent of Treasury notes issued and payable in the amount of 4,757,980.000 Swiss francs, and 500.000.000 deutsche marks.
*« Dollar equivalent of Treasury notes issued and payable in the amount of 4,972,980.000 Swiss francs.
*'On Oct. 1. 1942, they replaced postal savings stamps which had been Postal Savings System's obligations.
*' Gold reserves requirements eliminated pursuant to Public Law 90-269, approved Mar. 18, 1968.
*» Adjusted to exclude issues to the Intemational Monetary Fund and other intemational institutions to conform to the budget presentation.
'*> Includes certain securities not subject to statutory limitation. Includes public debt incurred to finance expenditures of wholly owned Govemment corporations and other business-type activities in exchange for which securities of the corporations and activities were issued to the Treasury; see table 107.
NOTE.—For comparable data for 1931-43, see the 1943 Annual Report, p. 564; for 1944-54 see 1954 Annual Report, p. 472; for 1955-65, see 1965 Annual Report, p. 557; and for 1966-67, see 1975 Statistical Appendix, p. 67. Composition ofthe public debt 1916-45 is shown in the 1947 Annual Report, p. 361. For r.econciliation with public debt accounts of 1977, see table 26.
^ ^
Digitized for FRASER http://fraser.stlouisfed.org/ Federal Reserve Bank of St. Louis

TABLE 23.—Securities issued by Government agencies subject to statutory debt limitation, June 30, 1968-76, and Sept. 30, 1976-77 ^o [Face amount, in thousands of dollars. Basis: Daily Treasury Statement through 1974; Monthly Statement of the Public Debt of the United States thereafter]
Issuing agency 1968 1969 1970 1971 1972 1973 1974 1975 1976 TQ^ 1977
UNMATURED DEBT --vo - J
District of Columbia Armory Board "^ stadium bonds 19,800 19,800 19,800 19,800 19,800 19,800 19,800 19,800 19,800 19,800 19.800 ?0
Federal Housing Administration debentures: W Mutual mortgage insurance fund 43.643 26.154 14.753 10,405 8,906 7,814 6,693 6,030 5,617 5,562 5,157 g Cooperative management housing insurance ^
fund 15,496 15,523 15,641 16,243 16,123 13,379 15,137 19,498 19,673 19,475 16,664 H General insurance fund: /-s
General insurance 369,715 424,615 388,770 371,374 351,110 320,278 323,984 404,958 499,767 497.150 504.602 ng Armed services housing mortgage ,
insurance fund 291 288 286 264 41 33 33 22 22 22 22 fl Housing insurance fund 43,552 40,570 34.165 29.803 25.926 22,739 18,763 14,253 13,978 13,968 11,407 ffl National defense housing insurance fund 27,272 24,228 21,048 17,848 12,788 10,137 6,928 6,825 6,825 6,825 6,676 ^^ Section 220 housing insurance fund 19,672 19,672 19,672 19,672 19,672 19,672 19,672 19,672 19,672 19.672 19,672 fg Section 221 housing insurance fund 12,118 11,635 11,568 11,506 11,494 11,486 11,450 11,439 11,430 11,430 11,406 O Servicemen's mortgage insurance fund 12,709 11,110 9,884 8,638 6,956 5,444 4,742 4,143 3,996 3,977 3,496 J« Title I housing insurance fund 163 155 152 151 140 100 92 80 67 66 51 W War housing insurance fund 3,788 2,938 908 608 606 564 534 ^
Total unmatured debt 568.220 596.688 536.646 506.312 473.562 431.445 427.827 506.720 600.848 597.948 598.953 ^
MATURED DEBT* O
Federal Farm Mortgage Corporation 109 107 105 85 84 65 61 60 58 58 48 H Federal Housing Administration 7 8 7 5 8 5 26 15 21 53 86 Home Owners' Loan Corporation 249 237 232 . 214 199 194 191 154 162 150 149
X cn H
Total matured debt ' 366 352 344 305 291 265 278 230 241 260 284 g
Tota l ' 568.586 597.040 536,990 506,617 473,853 431,710 428,105 506,949 601,088 598,208 599,237 ^ \ , a
* Funds are on deposit with the U.S. Treasury for payment of these securities. NOTE.—For figures for 1946-58 see 1958 Annual Report, p. 474; and for 1959-67 see 5 'Consists ofprincipal only. 1969 Statistical Appendix, pp. 70 and 71. For securities held by the Treasury, see table 107. ^
Digitized for FRASER http://fraser.stlouisfed.org/ Federal Reserve Bank of St. Louis

TABLE 24.—Interest-bearing securities issued by Federal agencies, fiscal year 1963 to date [In thousands of dollars. On basis of Monthly Treasury Statement of Receipts and Outlays of the United States Govemment]
Fiscal year or month Total
Defense Department
Family housing
mortgages and
homeowners assistance mortgages
Housing and Urban Development Department Other independent agencies
Federal Housing Adminis
tration
Govemment Federal National National
Mortgage Mortgage Association* Association'
Participa- Secondary tion sales market
fund operation
Export-Import Bank
of the United States
Farm Credit Administration
Banks for
cooperatives'
Federal intermediate
credit banks'
Federal Home Loan Bank Board
Tennessee Valley
Authority
U.S. Postal Service Other
1963 1964 1965 1966 1967 1968 1969 1970 1971 1972.. 1973 1974 1975 1976 T.Q 1977 1976-October....
November . December..
1977-January — Febmary. . . March April May June July August September .
8,123,100 8,631,287 9,335,416
13,376,757 18,455,327 24,399,459 14,249,053 12,509,703 12,162,732 10,893,562 11,109,063 12,012,272 10,943,131
* 11,677,710 * 11,433,333 10,297,825 11,672,826 11,643,099 11,250,356 10,945,091 10,932,031 10,933,706 10,882,907 10,855,794 10,824,065 10,728,171 10,311,538 10,297,825
2,268,448 2,238,252 2,182,620 2,111,939 2,035,591 1,951,453 1,863,238 1,775,242 1,682,626 1,588,145 1,483,549 1,381,584 1,275,804 1,171,496 1,136,387 1,015,677 1,127,655 1,117,330 1,112,727 1,095,086 1,085,933 1,077,034 1,067,927 1,059,006 1,043,614 1,034,626 1,024,329 1,015,677
586,358 792,771 570,087 441,357 492,024 548,427 576,896 516,853 486.518 453,770 411,650 408,053 486,935 581,069 578,118 579,129 588,607 585,320 575,103 579,371 580,832 592,499 598,003 593,916 588.050 583.150 578.954 579.129
300.000 2.110,000 4,830,000 7.900.000 8.600.000 7.320.000 6.005.000 4.920.000 4.480,000 4,370,000 4,260,000 4,180,000 4.145,000 3,768,000 4,145,000 4,145,000 4,120,000 3,845,000 3,845,000 3,845.000 3.803.000 3.803.000 3.803.000 3,768.000 3,768,000 3,768,000
1,960,612 1,698,902 1,797,494 3,269,379 4,079,103 5,887,062
520,000 826,786
1,022,263 1,385,006 2,163,616 2,570,533 2,472,098 1,892,799 2,624,896 1,818,655 2,221,056 2,893.735 2,593,115
*3,591,164 * 3,173,678 2,858,174 3,584,523 3,568,456 3,365,550 3,348,674 3,343,322 3,342,229 3,337.066 3,322,977 3,312,506 3,265,534 2,863,412 2,858,174
469,425 2,172,790 524,825 2,369,315 708,960 2,528,580 880,850 2.892.825
1.071.628 3,362,575 1,229,515 3,778,580
306 291 279 277 263
5,693 6,098 5,876 5,616 5,359 5,114 10,383
145, 180, 225, 285, 417 525, 727, 996,
1,355, 1,855 2,255, 2,696, 2,075, 2,075, 1,975, 1,825, 1,975, 1.975, 1,825, 1,825, 1,825, 1,825, 1,825, 1,825, 1,825, 1,825, 1,825, 1,825,
,000 ,000 ,000 ,000 ,200 ,000 ,655 ,000 ,300 ,000 ,000 ,000 ,000 ,000 ,000 ,000 ,000 ,000 ,000 ,000 ,000 ,000 ,000 ,000 ,000 ,000 ,000 ,000
250,000 250,000 250,000
"250,000 250,000 250,000 250,000 250,000 250,000 250,000 250,000 250,000 250,000 250,000 250,000 250,000 250,000 250,000
161 144 133 125
3,328 3,196 3,068 2,934 2,777 2,633 2,694 2,517 2,277 2,090 2,042 1,844 2,042 1,993 1,977 1,960 1,944 1,944 1,911 1,894 1,894 1,861 1,844 1,844
i/i H > H GO
H O > r > w z a X
See footnotes at end of table.
VO
Digitized for FRASER http://fraser.stlouisfed.org/ Federal Reserve Bank of St. Louis

TABLE 24.—Interest-bearing securities issued by Federal agencies, fiscal year 1963 to date—Continued [In thousands of dollars]
Memorandum
OO O
Fiscal year or month Banks for
cooperatives'
Farm Credit Administration
Discount notes
Consolidated bonds
Federal home loan banks
Federal intermediate
credit banks'
Federal land banks
Federal National
Mortgage Association '
District of Columbia
stadium fund
1963 1964 1965 1966 1967 1968 1969 1970 1971 1972 1973 1974 1975 1976 T.Q 1977 1976-October....
November . December..
1977-January — February.. . March April May June July August September .
1,410,815 1,528,740 1,789,785 1,805,210 2,338,500 2,475,020 2,895,970 3,694,420 3,900,920 4,061,100 4,022,980 4,206,965 4,330,315 4,424,800 4,694,795 4,898,800 5,254,245 5,113,225 4.948.105 4.604.105 4.356.105 4,061.100
278,350 958,000 700,900
1,046,000 970,250 801,550 728,150 843,400 927,250
1,378,150 990,000
1,070,050 1,019,600 1,278,200 1,167,550 1,046,000
962,056
962,056
2,770,150 4,201,320 4.757.135 6,309,805 4,587,900 4,701,750 5,524,080 4,240,085 9,913,506 4,942.340 7.897.136 5.704,350 7,077,356 6,188,205
12,148,919 6,673,430 18,622,339 7,994,690 21,248,709 9,497,415 19,390,224 10,298,430 19,111,009 10,791.385 19.205.939 11,693,200 19,172,109 10,712,425 18,855,839 10,669.125 18.861.039 10.494.080 19.054,739 10,631,290 18,432,154 10.555.620 18.482.209 10.670.185 18.535.049 10.989.865 18.908.049 11.173.645 18.976.999 11,417,980 18.907.589 11.653.985 19,239,689 11,786.350 19.205,939 11.693.200
2.725,204 19,800 2,973,526 19,800 3,532,441 19,800 4,105.926 19.8(X) 4.611.970 19.800 5.319M21 19.800 5.719.697 8.076.480 19.800 6.191.803 13.165.225 19.800 6.651.336 14.996.005 19.800 7.392.652 18.559.931 19.800 9,057,759 20,366,036 19.800
11.066.932 25.231.527 19.8(K) 14.191,967 28.236.678 19.800 16,059.830 29.863.385 19.800 16.566,255 30,685.265 19.800 18.718.764 31.491.240 '19.800 17.124.175 30.656.017 '19.800 17,127.175 30.413,432 19,800 17,127,175 30,565,429 19,800 17,304,288 30,394,203 19,800 17,304,288 30,143,128 19.800 17.304.288 30.391.824 19.800 18.136.568 30.684.569 19.800 18.136.568 30.843.106 19.800 18.136.568 31.377.546 19.800 18.718.729 31.565.679 19,800 18,718,729 31,300,376 19,800 18,718.764 31.491.240 19,800
tfl
S H O
H X tfl
" tfl
>! >< O
H X tfl H
^ ifi
C < ' Revised.
NOTE.—Includes unredeemed matured securities outstanding on which interest has ceased.
*This association was created effective Sept. 30. 1968. by an act approved Aug. 1. 1968 (12 U.S.C. 1716b). It assumed the assets and liabilities ofthe participation sales fund, the management and liquidating functions fund, and the special assistance functions fund frn-mf>rlv nf the Federal National Mortgage Association and continues to operate these
'Effective Sept. 30. 1968. Federal National Mortgage Association was converted to private ownership pursuant to an act approved Aug. 1. 1968 (12 U.S.C. 1716b).
'Effective Dec. 31. 1968. banks for cooperatives and Federal intermediate credit banks were converted to private ownership pursuant to an act approved Oct. 17. 1968 (12 U.S.C. 1061(aKl)).
* Adjusted due to reclassification of certain Export-Import Bank transactions from net outlays to security transactions.
Digitized for FRASER http://fraser.stlouisfed.org/ Federal Reserve Bank of St. Louis

STATISTICAL APPENDIX 81 TABLE 25.—Maturity distribution and average length of marketable interest-
bearing public debt^ June 30, 1946-76, and Sept. 30, 1976-77 [Dollar amounts in millions]
Date Within 1 year
1 to 5 years
5 to 10 years
10 to 15 years
15 to 20 years
20 years and
over Total
Average length
Years Months
By call classes (due or first becoming callable)
June 3 0 — 1946 1947 1948 1949 1950 1951 1952 1953 1954 1955 1956 1957 1958 1959 1960 1961 1962 1963 1964 1965 1966 1967 1968 1969 1970 1971 1972 1973 1974 1975 1976
Sept. 3 0 — 1976 1977
See footnotes at end of table.
$62,091 52,442 49,870 52,302 42,448 60,860 70,944 76,017 63,291 51,152 64,910 76,697 73,050 81,678 79,182 84,855 89,905 91,202 92,272 99,792 100,951 105,837 118,220 110,921 111,293 117,284 121,944 122,803 141,142 165,086 205,354
207,133 220,238
$35,057 42,522 46,124 39,175 51,802 31,022 29,434 30,162 38,407 46,399 36,942 41,497 39,401 58,256 81,295 70,760 67,759 68,980 66,954 51,377 55,010 59,824 52,657 55,759 85,065 85,773 90,212 90,919 78,670 103,422 128,433
132,446 148,428
$32,847 18,932 10,464 15,067 15,926 16,012 13,321 13,018 27,113 42,755 40,363 26,673 45,705 28,075 14,173 18,391 18,655 20,522 22,580 33,053 28,922 21,006 33,538 37,610 17,428 26,037 28,368 29,619 25,486 24,187 32,957
41,614 46,489
$16,012 13,326 12,407 13,715 19,281 21,226 20,114 26,546 19,937 11,371 8,387 6,488 657
1,276 1.123 1,123 1,641 4,304 5,048 4,192 6,097 6,087 4,509 4,505 2,985 1,055 2,230 8,511 11,710 13,162 12,693
11,955 8,860
$21,227 27,076 41,481 34,888 25,853 8,797 6,594
2,258 2,256 2,484 3,125 4,956 4,525 4,524 3,040 1,125 1,121 5,180 6,720 10,395 10,255 9,938 6,948 5,773 5,355 8,427
9,983 10,922
$22,372 $189,606 14,405
i,59'2 1,606 3,530 4,351 4,349 5,604 6,485 5,588 8,893 13,157 13,975 15,111 17,241 17,023 16,797 12,487 10,594 5,433 5,069 4,510 4,172 3,794 4,394 4,716
4,532 8,571
168,702 160,346 155,147 155,310 137,917 140,407 147,335 150,354 155,206 154,953 155,705 166,675 178,027 183,845 187.148 196.072 203,508 206,489 208,695 209,127 210,672 226,592 226,107 232,599 245,473 257,202 262,971 266,575 315,606 392,581
407,663 443,508
4 5 1 7 2 10 1 11 3 7 2 7 2 8 5 9 4 7 6 9 5 1 9 9 5 3 0 0 9 0 8
10 11
Digitized for FRASER http://fraser.stlouisfed.org/ Federal Reserve Bank of St. Louis

82 1977 REPORT OF THE SECRETARY OF THE TREASURY
TABLE 25.—Maturity distribution and average length of marketable interest-bearing public debt^ June 30, 1946-76, and Sept. 30, 1976-77—Continned
[Dollar amounts in millions]
Date Within 1 to 5 5 to 10 10 to 15 15 to 20 ^° l ^ 1 year years years years *• years Total
Average length
Years Months
By maturity classes'
June 30— 1946... $61,974 $24,763 $41,807 $8,707 $8,754 $43,599 $189,606 9 1947 51.211 21,851 35,562 13,009 5,588 41,481 168,702 9 1948 48,742 21,630 32,264 14,111 2,118 41,481 160,346 9 1949 48,130 32,562 16,746 14,111 8,710 34,888 155,147 8 1950 42,338 51,292 7,792 10,289 17,746 25,853 155,310 8 1951 43,908 46,526 8,707 8,754 21,226 8,797 137,917 6 1952 46,367 47,814 13,933 5,586 20,114 6,594 140,407 5 1953 65,270 36,161 15,651 2,117 26,546 1,592 147,335 5 1954 62,734 29,866 27,515 8,696 19,937 1,606 150,354 5 1955 49,703 39,107 34,253 17,242 11,371 3,530 155,206 5 1956 58,714 34,401 28,908 20,192 8,387 4,351 154,953 5 1957 71,952 40,669 12,328 19,919 6,488 4,349 155,705 4 1958 67,782 42,557 21,476 26,999 654 7,208 166,675 5 1959 72,958 58,304 17,052 20,971 654 8,088 178,027 4 1960 70,467 72,844 20,246 11,746 884 7,658 183,845 4 1961 81,120 58,400 26,435 8,706 1,527 10,960 187,148 4 1962 88,442 57,041 26,049 5,957 3,362 15,221 196,072 4 1963 85,294 58,026 37,385 2,244 6,115 14,444 203,508 5 1964 81,424 65,453 34,929 2,244 6,110 16,328 206,489 5 1965 87,637 56,198 39,169 2,609 5,841 17,241 208,695 5 1966 89,136 60,933 33,596 4,518 3,922 17,023 209,127 4 1967 89,648 71,424 24,378 4,514 3,912 16,797 210,672 4 1968 106,407 64,470 30,754 6,078 2,330 16,553 226,592 4 1969 103,910 62,770 34,837 6,063 2,311 16,217 226,107 4 1970 105,530 89,615 15,882 5,745 4,780 11,048 232,599 3 1971 112,772 89,074 24,503 3,802 4,653 10,670 245,473 3 1972 121,944 89,004 26,852 4,955 4,388 10,059 257,202 3 1973 122,803 88,223 31,111 5,747 8,730 6,357 262,971 3 1974 139,942 77,199 26,957 5,701 11,701 5,074 266,575 3 1975 163,891 101,973 26,830 6,120 8,389 8,403 315,606 3 1976 204,167 127,017 35,561 5,889 8,091 11,857 392,581 2
Sept. 3 0 — 1976 206,062 131,102 44,029 5,614 7,607 13,249 407,663 3 1977 217,917 148,428 45,873 8,600 4,401 18,289 443,508 3
1 5 2 9 2 7 8 4 6 -
10 4 9 3 7 -4 6
11 1 0 4 4
11 7 2 0 ^ 8 6 3 2 0 0
11 .
1 2
* Includes public debt incurred to finance expenditures of wholly owned Govemment corporations and other business-type activities in exchange for which securities of the corporations and activities were issued to the Treasury.
'All issues are classified to final maturity except partially tax-exempt bonds which have been classified to earliest call date. The last of these bonds were called on Aug. 14, 1962, for redemption on Dec. 15, 1962.
Digitized for FRASER http://fraser.stlouisfed.org/ Federal Reserve Bank of St. Louis
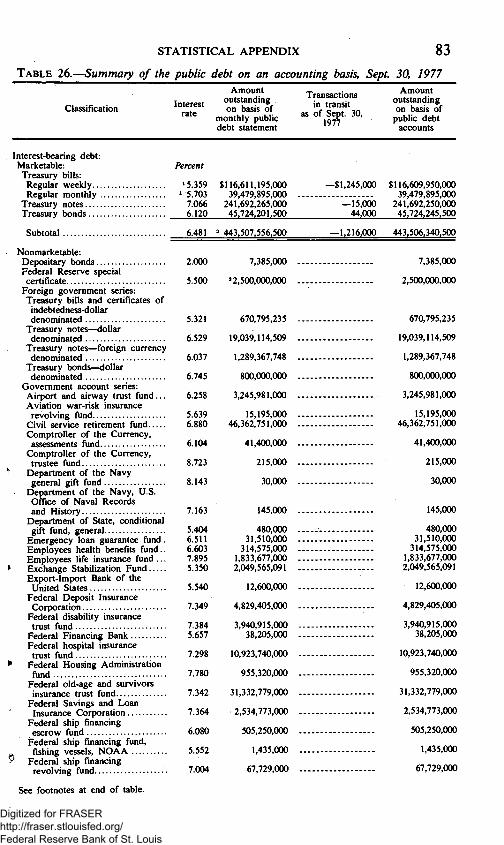
STATISTICAL APPENDIX 8 3
TABLE 26.—Summary of the public debt on an accounting basis, Sept. 30, 1977
Classification Interest rate
Amount outstanding on basis of
monthly public debt statement
Transactions in transit
as of Sept. 30, 1977
Amount outstanding on basis of
public debt accounts
Interest-bearing debt: Marketable: Treasury bills:
Regular weekly... Regular monthly .
Treasury notes Treasury bonds . . . .
Percent
* 5.359 * 5.703
7.066 6.120
Subtotal
Nonmarketable: Depositary bonds Federal Reserve special certificate
Foreign govemment series: Treasury bills and certificates of
indebtedness-dollar denominated
Treasury notes—dollar denominated
Treasury notes—foreign currency denominated
Treasury bonds—dollar denominated
Govemment account series: Airport and airway tmst fund... Aviation war-risk insurance
revolving fund Civil service retirement fund Comptroller of the Currency,
assessments fund Comptroller of the Currency,
trustee fund Department of the Navy
general gift fund Department of the Navy, U.S.
Office of Naval Records and History
Department of State, conditional gift fund, general
Emergency loan guarantee fund. Employees health benefits fund.. Employees life insurance fund ... Exchange Stabilization Fund Export-Import Bank of the
United States Federal Deposit Insurance
Corporation Federal disability insurance
trust fund Federal Financing Bank Federal hospital insurance trust fund
Federal Housing Administration fund
Federal old-age and survivors insurance trust fund
Federal Savings and Loan Insurance Corporation
Federal ship financing escrow fund
Federal ship financing fund, , fishing vessels, NOAA ^ Federal ship financing
revolving fund
See footnotes at end of table.
$116,611,195,000 39,479,895,000
241,692,265,000 45,724,201,500
-$1,245,000
6.481 ' 443,507,556,500
2.000
5.500
5.321
6.529
6.037
6.745
6.258
5.639 6.880
6.104
8.723
8.143
7,385,000
'2,500,000,000
670,795,235
19,039,114,509
1,289,367,748
800,000,000
3,245,981,000
15,195,000 46,362,751,000
41,400,000
215,000
30,000
7.163 145,000
5.404 6.511 6.603 7.895 5.350
5.540
7.349
7.384 5.657
7.298
7.780
7.342
7.364
6.080
5.552
7.004
480,000 31,510,000
314,575,000 1,833,677,000 2,049,565,091
12,600,000
4,829,405,000
3,940,915,000 38,205,000
10,923,740,000
955,320,000
31,332,779,000
2,534,773,000
505,250,000
1,435,000
67,729,000
—15,000 44.000
$116,609,950,000 39,479,895,000
241,692,250,000 45,724,245,500
-1,216,000 443.506.340.500
7.385.000
2,500,000,000
670,795,235
19,039,114,509
1,289,367,748
800,000,000
3,245,981,000
15,195,000 46,362,751,000
41,400,000
215,000
30,000
145,000
480,000 31,510,000
314,575,000 1,833,677,000 2,049,565,091
12,600,000
4,829,405,000
3,940,915,000 38,205,000
10,923,740,000
955,320,000
31,332,779,000
2,534,773,000
505,250,000
1,435,000
67,729,000
Digitized for FRASER http://fraser.stlouisfed.org/ Federal Reserve Bank of St. Louis

84 1977 REPORT OF THE SECRETARY OF THE TREASURY
TABLE 26.—Summary of the public debt on an accounting basis, Sept. 30, 7977—Continued
Classification Interest rate
Amount outstanding on basis of
monthly public debt statement
Transactions in transit
as of Sept. 30, 1977
Amount outstanding on basis of
public debt accounts
Interest-bearing debt—Continued Nonmarketable—Continued Govemment account series—Con. Percent
Federal supplementary medical insurance trust fund 7.235
Foreign service retirement fund . 7.035 General Post fund. Veterans
Administration 7.808 GSA participation certificate
trust 7.126 Gifts and bequests. Commerce... 5.211 Govemment life insurance fund . 6.024 Govemment National Mortgage
Association 6.672 Govemment National Mortgage
Association, MBS investment account 7.305
Harry S. Tmman memorial scholarship fund... 7.413
Highway trust fund 6.267 Indian money proceeds of labor. Bureau of Indian Affairs 5.880
Indian tribal funds. Bureau of Indian Affairs 5.904
Individual Indian money 6.375 Japan-U.S. friendship trust fund . 5.669 Judicial survivors annuity fund.. 7.811 Library of Congress tmst fund.. 8.115 Low-rent public housing, HUD . 5.856 National Archives gift fund 5.686 National Archives trust fund 5,812 National Credit Union share insurance fund, NCUA 6.752
National insurance development fund, HUD 7.075
National service life insurance fund 6.050
Northem Mariana Islands 7.063 Obligation guarantee fund.
Department of Transportation 6.320
Overseas Private Investment Corporation 6.881
Pension Benefit Guaranty Corporation 6.630
Postal service fund 6.049 Public Health Service, conditional gift fund, HEW 7.486
Public Health Service, unconditional gift fund, HEW 6.013
Railroad retirement account 7.554 Railroad retirement supplemental account 6.983
Relief and rehabilitation, D.C. Department of Labor 6.659
Relief and rehabilitation, longshoremen and harbor workers. Department of Labor 6.654
Relief for indigent American Indians, BIA 7.148
Special investment account 7.720 Tax Court judges survivors
annuity fund 7.495 Treasury deposit funds 3.966 Unemployment tmst fund 6.254 U.S. Army general gift fund 7.186 U.S. Naval Academy general gift fund 6.151
U.S. Naval Academy museum fund.. 6.651
$2,232,078,000 267,948,000
332,000
16,513,815 45,000
525,872,000
1,003,207,000
37,615,000
31,163,000 10,078,687,000
400,000
6,080,000 3,550,000
19,125,000 33,101,000
1,340,000 70,000,000
420,000 3,310,000
86,430,000
72,815,000
7,250,289,000 929,000
160,000
307,495,000
71,465,000 978,200,000
100,000
105,000 2,647,602,000
35,750,000
845,000
3,838,000
31,000 35,214,000
258.000 736.406,280
3.603.216.000 26.000
155.000
1.777,000
$2,232,078,000 267,948,000
332,000
16,513,815 45,000.
525,872,000 •
1,003,207,000
37,615,000
31,163,000 10,078,687,000
400,000
6,080,000 3,550,000.
19,125,000 33,101,000
1,340,000 70,000,000
420,000 3,310,000
86,430,000*
72,815,000-
7,250,289,000 929,0001
160,000
307,495,00(^
71,465.(X)0. 978.200.000
100.000,
105,000 2,647,602,000
35,750,00(^
845,000
3,838,000<
31,000. 35,214,000
258,00|!F 736,406,280
3,603,216,000 26,000/
155,000.4
1,777,000 Digitized for FRASER http://fraser.stlouisfed.org/ Federal Reserve Bank of St. Louis

STATISTICAL APPENDIX 85 TABLE 26.—Summary of the public debt on an accounting basis,
Sept. 30, 7977—Continued
Classification Interest rate
Amount outstanding on basis of
monthly public debt statement
Transactions in transit
as of Sept. 30, 1977
Amount outstanding on basis of
public debt accounts
Interest-bearing debt—Continued Nonmarketable—Continued Govemment account series—Con.
Veterans reopened insurance fund
Veterans special life insurance fund, tmst revolving fund
War-risk insurance revolving fund
Treasury bonds, investment series. Treasury certificates of indebted
ness, REA series Treasury bonds, REA series Treasury certificates of
indebtedness—State and local govemment series
Treasury notes—State and local govemment series
Treasury bonds—State and local goviemment series
U.S. individual retirement bonds.. U.S. retirement plan bonds U.S. savings bonds U.S. savings notes
Subtotal
Total interest-bearing debt..
Non-interest-bearing debt: Matured debt Other
Total gross public debt.
Percent
1.061
6.180
5.545 2.750
5.000 2.000
2.811
5.862
7.241 6.000 5.265 5.347 5.655
$381,806,000
528,389,000
1,255,000 2,247,117,000
7,938,000 1,525.000
253.730.360
8.144.517.550
3,071.843.400 29,574.819 140.109.165
75.410.821,856 394,319,861
698,839,928,356
—$1,137,300
1,603,300
—466,000 —6,369,904
—3,789 3,116,249
—2.648.596
$381,806,000
528,389,000
1,255,000 2,247,117,000
7,938,000 1,525,000
252,593,060
8,146,120,850
3.071.377.400 23.204.915
140.105.376 75.413.938.105
391.671.265
6.327
6.424
'254.121.177.689
697.628.734.189
462.389,897 748.804.271
-5.906.040
-7.122.040
-2,657.338 5.729
254.115,271,648
697,621.612.148
459,732,559 748,810.000
—9.773.649 698.830.154.708
* Included in debt outstanding at face amount, but the annual interest rate is computed on the discount value. 'These amounts do not reflect the exchange, on Sept. 30, 1977, of $17 billion of nonmarketable Govemment ;count series securities held by certain funds for a like amount of marketable Treasury bills and notes. Such ills and notes correspond in their maturity dates with those bills and notes which the Treasury has announced r will have announced for settlement through Oct. 18, 1977. This action was taken to ensure the normal iction and delivery of such securities to the public, which might otherwise not have been possible due to the [piration ofthe temporary statutory debt limit on Sept. 30, 1977. 'Represents a security issued directly to the Federal Reserve, as authorized by section 14(b) ofthe Federal eserve Act, to maximize the Treasury's operating funds prior to the expiration of the temporary statutory ;bt limit on Sept. 30, 1977.
Digitized for FRASER http://fraser.stlouisfed.org/ Federal Reserve Bank of St. Louis
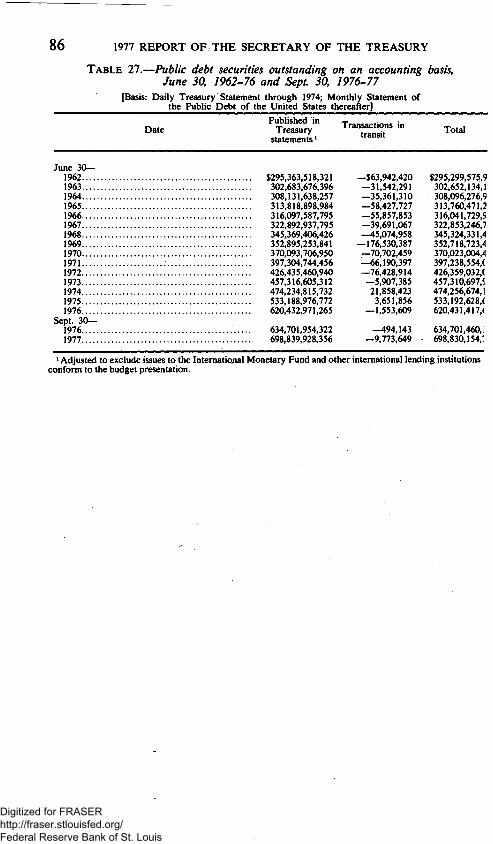
86 1977 REPORT OF THE SECRETARY OF THE TREASURY
TABLE 27.—Public debt securities outstanding on an accounting basis, June 30, 1962-76 and Sept. 30, 1976-77
[Basis: Daily Treasury Statement through 1974; Monthly Statement of the Public Debt of the United States thereafter]
Published in Date Treasury
statements *
June 3 0 — 1962 $295,363,518,321 1963 302,683,676,396 1964 308,131.638,257 1965 313,818,898,984 1966 316,097,587,795 1967 322,892,937,795 1968 345,369,406,426 1969 352,895,253,841 1970 370,093,706,950 1971 397,304,744,456 1972 426,435,460,940 1973 457,316,605,312 1974 474,234,815,732 1975 533,188,976,772 1976 620,432,971,265
Sept. 30— 1976 634,701,954,322 1977 698,839,928,356
* Adjusted to exclude issues to the Intemational Monetary Fund and other intemational lending institutions conform to the budget presentation.
Transactions in transit
-$63,942,420 -31,542,291 —35,361,310 -58,427,727 —55,857,853 —39,691,067 —45,074,958
—176,530,387 —70,702,459 —66,190,397 —76,428,914 —5,907,385
21,858,423 3,651,856
—1,553,609
-494,143 —9,773,649
Total
$295,299,575,9 302,652,134,1 308,096,276,9 313,760,471,2 316,041,729,9 322,853,246,7 345,324,331,4 352,718,723,4 370,023,004,4 397,238,554,C 426,359,032.C 457,310,697,S 474,256,674,1 533,192,628,( 620,431,417,(
634,701,460,1 698,830,154,'
Digitized for FRASER http://fraser.stlouisfed.org/ Federal Reserve Bank of St. Louis

TABLE 28.—Description of public debt issues outstanding. Sept, 30, 1977 [On basis of Public Debt accounts; See "Bases of Tables"]
Description When redeemable
or payable' Interest payment
date
Average price received
(per $100) Amount retired
Amount outstanding
Sept. 30, 1977»
INTEREST-BEARING' Marketable: Treasury bills: Series maturing and
approximate yield to maturity (%):*^ Regular weekly:
Oct. 6, 1977. . . .
Oct. 13, 1977...
Fifty-two week: Oct. 18. 1977...
Regular weekly:
Oct. 20, 1977...
Oct. 27, 1977...
Nov. 3, 1977. . .
Nov. 10, 1977..
Fifty-two week: Nov. 15, 1977..
Regular weekly:
Nov. 17, 1977..
Nov. 25, 1977..
Dec. 1, 1977 . . .
Dec. 8, 1977 . . .
Fifty-two week: Dec. 13, 1977. .
Regular weekly:
Dec. 15, 1977 . .
Dec. 22, 1977 . .
Dec. 29, 1977 . .
Jan. 5, 1978 . . . .
( 4.846 • • \ 5.045
, 4.767 ••{ 5.162
. . 5.126
, 4.708 • 1 5 . 2 1 4
, 4.839 • [ 5.162
, 5.052 •{ 5.424
, 5.131 •\ 5.353
. . 5.201
, 5.234 •1 5.670
, 5.353 •{ 5.552
. 5.192 ••{ 5.575
, 5.234 • \ 5.554
. . 4.708
, 5.166 ••{ 5.887
/ 5.222 • • \ 5.851
, 5.172 ••{ 5.981 . . 5.246
•Apr. 7. 1977 l ^ . , .^^^ .July 7. 1977 z"^^ ' *' • ^ " • • •Apr. 14. 1977 ) Q ^ ,3 j ^ ^ ^ . July 14, 1977 i ^ ^ '^ ' ' ^ ' ' •
.Oct . 19, 1976 Oct. 18, 1977..
•Apr. 21, 1977 I Oct 20 1977
.July 21, 1977 /"'- ^ ' ' " • •Apr. 28, 1977 1 Q ^ ^7 1977 .July 28, 1977 i ^^ ' ^'' ^^" • -May 5, 1977 ij, , .. ^ .Aug. 4, 1977 )^°^- ' ' "•• .May 12, 1977 .Aug. 11, 1977...,
iNov. 10, 1977..
.Nov. 15, 1976 Nov. 15, 1977.
[Nov. 17, 1977.
Nov. 25, 1977.
.May 19, 1977
.Aug. 18, 1977....
. May 26, 1977
.Aug. 25, 1977....
.June 2, 1977 1-. , ,«„
.Sept. 1, 1977 1*^- '• '''^ •
.June 9, 1977 ij. 8 1977
.Sept. 8, 1977 /" - *' ' ^••
.Dec. 14. 1976 Dec. 13, 1977.
.June 16, 1977 1 j ^ ,, .^...
.Sept. 15, 1977 I ^ " '' ''' '
. June 23, 1977 1 j ^ ,, ,g„
.Sept.22, 1977 | Dec. 22, 1977.
.June 30, 1977 ij. „ ,9..
.Sept. 29. 1977 ^Dec. 29, 1977.
.July 7, 1977 Jan. 5, 1978...
Sold at a discount; payable at par
on maturity.
$97,550 cash.. 98.725 cash.. 97.590 cash.. 98.695 cash..
94.817 cash..
97.620 cash.. 98.682 cash.. 97.554 cash.. 98.695 cash.. 97.446 cash.. 98.629 cash.. 97.406 cash.. 98.647 cash..
94.727 cash..
97.354 cash.. 98.567 cash.. 97.279 cash.. 98.581 cash.. 97.375 cash.. 98.591 cash.. 97.354 cash.. 98.596 cash..
95.240 cash..
97.388 cash.. 98.512 cash.. 97.360 cash.. 98.521 cash.. 97.385 cash.. 98.488 cash.. 97.348 cash..
$3,503,035,000 , 2.303,085,000 } 3,503,065,000 1 2,203,^5.000 /
3,095,140,000
3,406,480.000 > 2.300,995,000/-3,299,620,000» 2,403,115,000 r 3,307,200,000 j 2,402,695,000;-3,302,820,000 i 2,403,185,000/-
3,401,740,000 .
3,202,880,000 . 2,307,345,000/-3,201,400,000 I 2,303,355,000/-3,101,770,000, 2,300,675,000/-3,002,035,000 . 2,208,060,000 / '
3,504,600,000 .
3.001,265,000 I 2,514.885,000 / -3,001.285,000 . 2,506,985,000/-3,200,905,000 ^ 2.202.315.000/-3,305,460,000 .
$5,806,120,000
5.706.340,000
3,095,140.000
5.707.475,000
5,702.735.000
5,709.895.000
5,706.005.000
3,401.740.000
5.510.225.000
5.504.755.000
5.402.445.000
5,210,095,000
3,504.600.000
5,516,150,000
5,508.270.000
5.403,220,000
3.305,460,000
ifi
I > r >
o
See footnotes at end of table. 0 0
Digitized for FRASER http://fraser.stlouisfed.org/ Federal Reserve Bank of St. Louis

TABLE 28.—Description of public debt issues outstanding. Sept, 30, 1977—Continued oo oo
Description When redeemable
or payable* Interest payment
date
Average price received
(per $100)
Amount outstanding
Sept. 30. 1977»
INTEREST-BEARING ' -Cont inued Marketable—Continued Treasury bills—Continued
Jan. 10. 1978 4.728 Regular weekly:
Jan. 12. 1978 5.357 Jan. 19. 1978 5.436 Jan. 26. 1978 5.364 Feb. 2, 1978 5.690
Fifty-two week: Feb. 7, 1978 5.344
Regular weekly: Feb. 9, 1978 5.679 Feb. 16, 1978 5.977 Feb. 23, 1978 5.891 Mar. 2, 1978 5.849
Fifty-two week: Mar. 7, 1978 5.226
Regular weekly: Mar. 9. 1978 5.845 Mar. 16, 1978 6.098 Mar. 23, 1978 5.976 Mar. 30, 1978 6.185
Fifty-two week: Apr. 4, 1978 5.158 May 2, 1978 5.160 May 30, 1978 5.403 June 27, 1978 5.408 July 25, 1978 5.648 Aug. 22, 1978 6.105 Sept. 19, 1978 6.156
.Jan. 11. 1977 Jan. 10, 1978.,
.July 14, 1977 Jan. 12, 1978.
.July 21, 1977 Jan. 19, 1978.
.July 28. 1977 Jan. 26. 1978.
. Aug. 4. 1977 Feb. 2, 1978..
.Feb . 8. 1977... Feb. 7. 1978..
.Aug . 11, 1977 Feb. 9, 1978...
. Aug. 18, 1977 Feb. 16. 1978 .
.Aug . 25. 1977 Feb. 23, 1978.
.Sept. 1, 1977 . . . . Mar. 2, 1978. .
. Mar. 8, 1977 Mar. 7, 1978 . .
.Sept. 8. 1977 Mar. 9, 1978 . . .
.Sept. 15, 1977 Mar. 16, 1978..
. Sept. 22, 1977 Mar. 23, 1978 . .
.Sept. 29, 1977 Mar. 30, 1978..
. Apr. 5. 1977 Apr. 4. 1978 . . .
.May 3. 1977 May 2, 1978 . . .
.May 31, 1977 May 30, 1978. .
. June 28, 1977 June 27, 1978. .
.July 26, 1977 July 25, 1978...
. Aug. 23, 1977 Aug. 22, 1978.,
.Sept. 20. 1977 Sept. 19. 1978.,
Total Treasury bills
Treasury notes: 7y«% Series E-1977 (eff'ective
rate 7.8477%). . Nov. 15. 1977 May 15-Nov.l5 .
Subtotal .
$95,219 cash..
97.292 cash.. 97.252 cash.. 97.288 cash.. 97.123 cash..
94.596 cash..
97.129 cash.. 96.978 cash.. 97.022 cash.. 97.043 cash..
94.716 cash..
97.045 cash.. 96.917 cash.. 96.979 cash.. 96.873 cash..
94.785 cash.. 94.783 cash.. 94.537 cash.. 94.532 cash.. 94.290 cash.. 93.827 cash.. 93.776 cash..
99.737 Exchanged at 99.737
7y,% Series N-1977 (effective rate 7.5526%).
7y«% Series F-1977 (effective rate 7.5176%).
Subtotal
Oct. 31. 1975 Oct. 31, 1977 Apr. 30-Oct.31. . .
Dec. 31, 1975 Dec. 31. 1977 June 30-Dec. 31 . 99.945 Exchanged at 99.945 _
$3,070,660,000
.3.403.830.000 3.407,515,000 3,500,995.000 3,599,195.000
3.105,470,000
3,503,930,000 3,402,640,000 3,403,675,000 3,304,365,000
3,208,270,000
3,203,120.000 3.376,735,000 3,502,050,000 3,302,710,000
3,342.455.000 2,966.135,000 2,454,330,000 2,252,925,000 3,037,575,000 3,004,675,000 3,035,920.000
156,089,845.000
2.570,310,000 1.059,350.000
3.155,615,000
2,552,615,000
212,450.000 .....
$3,070,660,000
3,403,830,000 3,407,515,000 3,500,995,000 3,599,195,000
3.105.470,000
3.503.930.000 3.402.640.000 3.403.675,000 3,304,365,000
3,208,270,000
3.203.120.000 3,376.735.000 3.502,050,000 3,302.710.000
3,342.455.000 2,966,135,000 2,454,330,000 2.252.925.000 3,037,575,000 3.004.675,000 3.035,920.000
156.089.845,000
3.629.660.000
3,155.615.000
?0 tfl
O :« H o H X tfl ifi tfl O ?0 tfl H > >< O *fl H X tfl H J« tfl > ifi C
2.765.065.000 2.765.065.000
Digitized for FRASER http://fraser.stlouisfed.org/ Federal Reserve Bank of St. Louis

6%% Series Q-1977 (effective rate 6.6181%).
6y«% Series A-1978 (effective rate 6.3762%).
6% Series B-1978 (effective rate 6.0452%).
8y.% Series C-1978 (effective rate 8.7305%).
Subtotal
7y.% Series D-1978 (effective rate 7.2118%).
7%% Series E-1978 (effective rate 7.6993%).
TU% Series F-1978 (effective rate 7.9396%).
Subtotal .
8% Series G-1978 (effective rate 8.1010%).
8/,% Series H-1978 (effective rate 8.1384%).
6y,% Series J-1978 (effective rate 6.4863%).
6y«% Series K-1978 (effective rate 6.7597%).
Subtotal.
6y,% Series L-1978 (effective rate 6.6127%).
7y,% Series M-1978 (effective rate 7.1577%).
6'/,% Series N-1978 (effective rate 6.9
Subtotal
See footnotes at end of table.
Mar. 3. 1976 Nov. 30, 1977 May 31-Nov. 30 99.957
Feb. 15, 1971 Feb. 15. 1978 Feb. 15-Aug. 15 Exchange at par . . . .
Nov. 15. 1971 Nov. 15, 1978 May 15-Nov. 15 Exchange at 99.75...
May 15. 1974 Aug. 15. 1978 Feb. 15-Aug. 15 100.07 Exchange at 100.07.. _
Feb. 18. 1975 May 15, 1978 May 15-Nov. 15 99.700 Exchange at 99.700..
May 15, 1975 Aug. 15, 1978. . Feb. 15-Aug. 15 99.717 Exchange at 99.717..
Aug. 15, 1975 May 15, 1978 May 15-Nov. 15 99.768 Exchange at 99.768..
Oct. 7, 1975 Feb. 28, 1978 Feb. 28-Aug. 31 99.786
Oct. 22, 1975 Dec. 31, 1978 June 30-Dec. 31 99.899
Feb. 2, 1976 Jan. 31, 1978 Jan. 31-July 31 99.788
Mar. 31, 1976 Mar. 31, 1978 Mar. 31-Sept. 30 99.982 Exchange at 99.9
May 17, 1976.. . Apr. 30, 1978 Apr. 30-Oct. 31. 99.801 Exchange at 99.8
June 1, 1976 May 31, 1978 May 31-Nov. 30 99.936 Exchange at 99.936.
June 30, 1976.. . June 30, 1978 June 30-Dec. 31 . 99.789 Exchange at 99.789.
2,627.685.000
8.388.504,000
8,207,497,000
1,879,620,000
S82.64O.000
2.462,260,000
3,263,291,000
696,635,000
3,959.926,000
2.855,070.000
2.300,000.000
5.155.070.000
3,050,930.000
1.372.140.000
4.423.070.000
2.114.975.000
2.516,625.000
2,510,760,000
3.065.560.000 96.500.000
2.627.685.000
8.388.504.000
8.207.497.000
2.462.260.000
3.959,926,000
5.155.070.000 H
> H
. ^ ^^^^^^^^ GO H 4.423.070.000 H H 2,114,975.000 >
r 2,516,625,000 ^
2,510,760,000 I §
tfl z a >< 3,162,060,000 3.162.060.000
2,274.245,000 300.000,000
2,574,245.000 2.574.245.000
2 485 260 000 81.900,000
2,567,160,000 2,567,160,000
2,638,385,000 692.450.000
3.330.835.000 3,330,835,000
0 0
Digitized for FRASER http://fraser.stlouisfed.org/ Federal Reserve Bank of St. Louis

TABLE 28.—Description of public debt issues outstanding. Sept, 30, 7977—Continued vo
o Description
When redeemable or payable"
Interest payment date
Average price received
(per $100)
Amount retired Amount
outstanding Sept. 30, 1977*
INTEREST-BEARING ' -Cont inued Marketable—Continued
Treasury notes *—Continued 6%% Series P-1978 (effective
rate 6.9473%). 6%% Series Q-1978 (effective
rate 6.6692%).
Subtotal.
6y«% Series R-1978 (effective rate 6.3017%).
5'/,% Series S-1978 (effective rate 5.9525%).
Subtotal
5y«% Series T-1978 (effective rate 5.8608%).
5y«% Series U-1978 (effective rate 5.3663%).
Subtotal.
6^4% Series A-1979 (effective rate 6.2069%).
6y8% Series B-1979 (effective rate 6.7296%).
Subtotal
7% Series C-1979 (effective rate 6.8193%).
7%% Series D-1979 (effective rate 7.5234%). - . .
July 30, 1976 . Ju ly 31, 1978 Jan. 31-July 31 $99.861
Aug. 31. 1976 Aug. 31. 1978 Feb. 28-Aug. 31 99.917 Exchange at 99.917..
Sept. 30. 1976. . Sept. 30. 1978 Mar. 31-Sept. 30. 99.907 Exchange at 99.907..
Nov. 1. 1976 : . Oct. 31. 1978 Apr. 30-Oct. 31 99.842 Exchange at 99.842..
. Nov. 30, 1978 May 31-Nov. 30 . 99.795 Exchange at 99.795..
Dec. 31. 1976 . . Dec. 31. 1978 June 30-Dec. 31 . 99.775 Exchange at 99.775..
Aug. 15. 1972 Aug. 15. 1979 Feb. 15-Aug. 15 Exchange at par . . .
Feb. 15. 1973 Nov. 15. 1979 May 15-Nov. 15 . . ' 99.70 / Exchange at 99.70..
Nov. 15. 1973. . Nov. 15. 1979 May 15-Nov. 15. 100.88 Exchange at 100.88..
Nov. 6. 1974 May 15. 1979 May 15-Nov. 15 99.937., 101.95.
$2,855,225,000
2,895,270,000 54,050,000
2.949,320.000 . . . .
2.868.260.000 326.350.000
2.822,330.000 98.370.000
2.920.700.000
2.805.140.000 136.000.000
2.941.140.000
3.124.075.000 252.250.000
3.376.325.000
4.558.922.000
1.009,055,000 594.683,000
1.603.738.000
2.020.566.000 220.000.000
2.240.566.000
1.016.338.000 1.252.729.000
2.269.067.000
$2,855,225,000
3.194.610.000
2.920.700.000
2.941.140.000
3.376.325.000
4.558.922.000
1.603.738.000
2.240.566.000
2.269.067.000
?0 tfl ^ O
H o *fl
tfl ifi
>
O ^ H X tfl H J« tfl > ifi C ?0
Digitized for FRASER http://fraser.stlouisfed.org/ Federal Reserve Bank of St. Louis

7y«% Series E-1979 (effective rate 7.8299%).
8y,% Series F-1979 (effective rate 8.5420%).
7y,% Series G-1979 (effective rate 7.5064%).
7% Series H-1979 (effective rate 7.0415%).
Subtotal.
67.% Series J-1979 (effective rate 6.9077%).
Subtotal.
6/4% Series K-1979 (effective rate 6.3579%).
Subtotal.
5%% Series L-1979 (effective rate 5.9734%).
5%% Series M-1979 (effective rate 5.9767%).
Subtotal.
6% Series N-1979 (effective rate 6.0184%).
Subtotal.
5%% Series P-1979 (effective rate 5.8694%).
6/8% Series Q-1979 (effective rate 6.2310%).
Subtotal.
6%% Series R-l979 (effective rate 6.1374%).
6^4% Series S-1979 (effective rate 6.3382%).
Subtotal
See footnotes at end of table.
July 9. 1975 June 30. 1979 June 30-Dec. 31 99.731
Sept. 4, 1975 Sept. 30, 1979 Mar. 31-Sept. 30 99.840
Jan. 6, 1976 Dec. 31, 1979 June 30-Dec. 31 100.00
Feb. 17, 1976 Feb. 15, 1979 Feb. 15-Aug. 15 99.867 Exchange at 99.867..
Aug. 16, 1976 Aug. 15, 1979 Feb. 15-Aug. 15 99.907 Exchange at 99.907..
Nov. 15, 1976 Nov. 15, 1979 May 15-Nov. 15 99.704 Exchange at 99.704..
Feb. 3, 1977., . Jan. 31, 1979 Jan. 31-July 31 . . 99.824.
Feb. 28, 1977 Feb. 28, 1979 Feb. 28-Aug. 31 99.805 Exchange at 99.805..
. Mar. 31. 1979 Mar. 31-Sept. 30. ,
May 2. 1977 Apr. 30. 1979 Apr. 30-Oct. 31 .
May 31, 1977 May 31, 1979 May 31-Nov. 30 .
June 30. 1977 June 30, 1979 June 3a-Dec. 31 .
Aug. 1. 1977 July 31, 1979 Jan. 31-July 31.,
99.963 Exchange at 99.963..
100.009 Exchange at 100.009
99.805 Exchange at 99.805..
99.972 Exchange at 99.972..
99.834 Exchange at 99.834..
1,781,565,000
2,080,568,000
2,005,913,000
3,091,680,000 1.600,000,000
4,691,680.000
2.288.610.000 700.000,000
2,988,610.000
3.305.620.000 69.900.000
3.375,520.000
2.854.555.000
2.694,815,000 150,375,000
2.845.190.000
2.995.335.000 523.290.000
3.518.625.000
1.881.815.000 109.850.000
1.991.665.000
1.897,755.000 189,525.000
2,087.280.000
2,043.500.000 264,420.000
2.307.920.000
3.115.360,000 65.000.000
3.180.360.000 . .
1.781.565.000
2.080.568.000
2.005.913.000
4.691.680.000
2.988.610.000
ifi 3.375.520.000 H
2.854.555.000 H
C/3
H ^ ^ ^ " ^ n
2.845.190.000 '>
>
3.518.625.000 tfl
z a
' ^^^^^^^ X
1.991.665.000
2.087.280,000
2.307.920.000
3.180.360.000
VO
Digitized for FRASER http://fraser.stlouisfed.org/ Federal Reserve Bank of St. Louis

TABLE 28.—Description of public debt issues outstanding, Sept. 30,. 1977^Continued VO to
Description When redeemable
or payable'
Interest payment date
Average price received
(per $100) Amount retired
Amount outstanding
Sept. 30. 1977*
INTEREST-BEARING ' -Cont inued Marketable—Continued Treasury notes *—Continued
6%% Series T-1979 (effective rate 6.6770%).
Subtotal.
6%% Series U-1979 (effective rate 6.7370%).
6%% Series A-1980 (effective rate 7.0049%).
Subtotal.
9% Series B-1980 (effective rate 8.7498%).
Subtotal.
7/ ,% Series C-1980 (effective rate 7.5386%).
7y8% Series D-1980 (effective rate 7.7100%).
67.% Series E-1980 (effective rate 6.9278%).
578% Series F-1980 (effective rate 5.9105%).
6y,% Series G-1980 (effective rate 6.6213%).
Subtotal.
6y4% Series H-1980 (effective rate 6.8411%).
7% Series A-1981 (effective rate 6.9487%).
Aug. 31, 1977 Aug. 31. 1979 Feb. 28-Aug. 31 $99.899 Exchange at 99.899..
Sept. 30. 1977 Sept. 30. 1979 Mar. 31-Sept. 30 99.788 Exchange at 99.788.
May 15. 1973.. .May 15. 1980 May 15-Nov. 15 .
Aug. 15, 1974 Aug. 15, 1980 Feb. 15-Aug. 15 .
99.29 Exchange at 99.29..
101.15 Exchange at 101.15.
Mar. 17, 1976 Mar. 31, 1980 Mar. 31-Sept. 30 99.853..
June 10, 1976 June 30, 1980 June 30-Dec. 31 99.693..
Sept. 14, 1976 Sept. 30, 1980 Mar. 31-Sept. 30 99.799.,
Dec. 7, 1976 Dec. 31, 1980 .' June 30-Dec. 31 99.867.,
Feb. 15, 1977 Feb. 15, 1980 Feb. 15-Aug. 15 99.678 Exchange at 99.678.
Aug. 15, 1977 Aug. 15, 1980 Feb. 15-Aug. 15 ".. . . 99.760 Exchange at 99.760..
Feb. 15, 1974 Feb. 15, 1981 Feb. 15-Aug. 15 . 100.28 Exchange at 100.28..
$3,358,685,000
122,580,000
3,481,265.000 $3,481,265,000
3,770.000,000 89,710.000
3.859.710.000 3.859.710.000
2,043,210,000 5,221.343,000
7.264,553.000 7.264.553.000
1,835.033,000
2.461.069.000
4,296,102,000 4,296,102,000
2,069.280,000 2,069,280.000
2,185,082,000 2.185,082,000
2.140,584,000 2,140,584,000
2,692.020,000 2,692.020,000
3,308,050,000
1.300,000,000
4,608,050,000 4,608,050,000
3,708,350,000
425,000,000
1,514,601,000 327,000,000
1,601,000
?3 tfl
o H O
H X tfl ifi tfl n ?« tfl H >
O ^ H X tfl H
tfl > c/5
G
1.841,601,000 Digitized for FRASER http://fraser.stlouisfed.org/ Federal Reserve Bank of St. Louis

774% Series B-1981 (effective rate 7.5097%).
7y,% Series C-1981 (effective rate 7.4946%).
Subtotal.
7y,% Series D-1981 (effective rate 7.3995%).
77,% Series F-1981 (effective rate 7.6335%).
7% Series G-1981 (effective rate 7.0773%).
6%% Series H-1981 (effective rate 6.8800%).
6y4% Series J-1981 (effective rate 6.8021%).
674% Series K-1981 (effective rate 6.8426%).
8% Series A-1982 (effective rate 8.0029%).
8^8% Series B-1982 (effective rate 8.1414%).
778% Series C-1982 (effective rate 7.9206%).
Subtotal .
6^8% Series D-1982 (effective rate 6.1898%).
7% Series E-1982 (effective rate 7.0184%).
8% Series A-1983
Nov. 15, 1974 Nov. 15, 1981 May 15-Nov. 15 99.628 Exchange at 99.628.. 101.21
Feb. 18, 1975 Feb. 15, . Feb. 15-Aug. 15 99.453 Exchange at 99.453. 99.980
Jan. 26, 1976 May 15, 1981 May 15-Nov. 15 99.892
July 9, 1976 Aug. 15, 1981 Feb. 15-Aug. 15 99.951
Oct. 12, 1976 Nov. 15, 1981 May 15-Nov. 15 99.641
Mar. 8, 1977 Mar. 31, 1981 Mar. 31-Sept. 30 99.968
June 3, 1977 June 30, 1981 June 30-Dec. 31 99.808
Sept. 7, 1977 Sept. 30, 1981 Mar. 31-Sept. 30 99.671
May 15, 1975 May 15, 1982 May 15-Nov. 1 5 . . . . , 100.00 Exchange at 100.00.
Aug. 15. 1975 Aug. 15. 1982 Feb. 15-Aug. 15 . 99.921 Exchange at 99.921.
Nov. 17. 1975 Nov. 15. 1982 May 15-Nov. 15. 99.762 Exchange at 99.762.
June 6. 1977 Feb. 15, 1982 Feb. 15-Aug. 15 .
Apr. 4, 1977 May 15, 1982 May 15-Nov. 15 .
. Feb. 17, 1976 Feb. 15, 1983
99.699.,
99.889.,
. Feb. 15-Aug. 15 Par Exchange at par .
Subtotal
See footnotes at end of table.
1.765.741.000
949.018000 . 1,761,962.000
4,476.721.000 4,476,721,000
1,767,551,000 400,000,000
2.628.227,000
2.019.817,000 2,019,817.000
2.585.917.000 2.585,917,000
2,542,877.000 2.542.877.000
2.809.481.000 2.809.481.000
2.513.700,000 2.513,700,000
2,968,222.000 2.968,222.000
1.514,240.000
1.232.561.000
„^^ ,^ ^,^,„,,^ 2,016.520.000 901.700.000
2.918,220,000 2,918.220,000
2,518,088,000
384,175,000
2,902,263,000 2,902.263.000
2,697,410,000 2,697,410,000
2.612.883.000 2.612.883.000
6.019,257.000
1,938,764,000
7.958.021.000
C/3
H > H 00
H O > r > tfl z a ><
7.958.021.000
VO
Digitized for FRASER http://fraser.stlouisfed.org/ Federal Reserve Bank of St. Louis
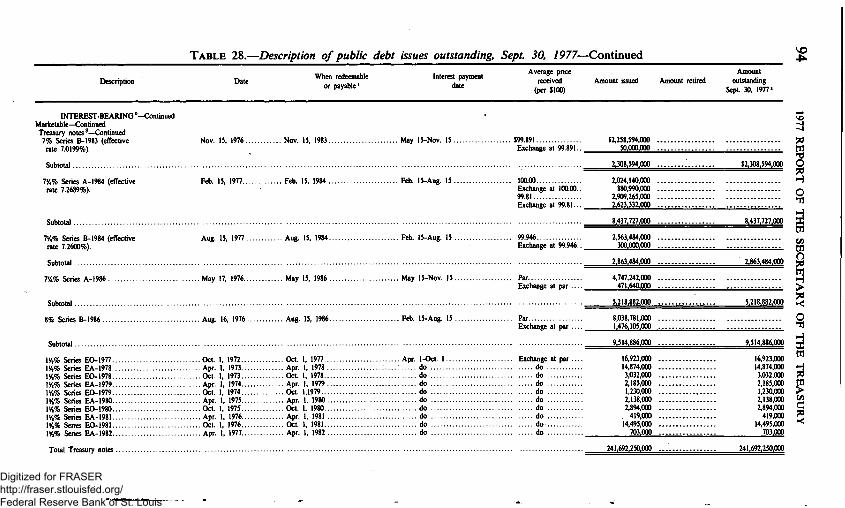
TABLE 28.—Description of public debt issues outstanding, Sept. 30, 7977—Continued vo
Description Date When redeemable
or payable*
Interest payment date
Average price received
(per $100)
Amount retired Amount
outstanding Sept. 30. 1977»
INTEREST-BEARING ' -Cont inued Marketable—Continued Treasury notes *—Continued
7% Series B-1983 (effective rate 7.0199%).
Nov. 15. 1976 Nov. 15. 1983. . May 15-Nov. 15 $99.891 Exchange at 99.891.
Subtotal.
774% Series A-1984 (effective rate 7.2689%).
Feb. 15. 1977 Feb. 15, 1984 Feb. 15-Aug. 1 5 . 100.00 Exchange at 100.00.. 99.81 Exchange at 99.81. . .
Subtotal.
7y«% Series B-1984 (effective rate 7.2600%).
Subtotal
Aug. 15, 1977 Aug. 15, 1984 Feb. 15-Aug. 15 99.946 Exchange at 99.946..
77.% Series A-1986 May 17, 1976 May 15, . May 15-Nov. 15 Par Exchange at par .
Subtotal.
, Series B-1986 Aug. 16, 1976 Aug. 15. 1986 Feb. 15-Aug. 15 Par Exchange at par .
Subtotal.
17,% Series EO-1977 Oct. 1, 1972 Oct. 1, 1977 17,% Series EA-1978 Apr. 1, 1973 Apr. 1, 1978 do 17,% Series EO-1978 Oct. 1. 1973 Oct. 1. 1978 do 17,% Series EA-1979 Apr. 1. 1974 Apr. 1. 1979 do 17,% Series EO-1979 Oct. 1. 1974 Oct. 1,1979 - do 17,% Series EA-1980 Apr. 1, 1975 Apr. 1, 1980 do 17,% Series EO-1980 Oct. 1, 1975 Oct. 1, 1980 do 17,% Series EA-1981 Apr. 1, 1976 Apr. 1, 1981 do 17,% Series EO-1981 Oct. 1, 1976 Oct. 1, 1981 do 17,% Series EA-1982 Apr. 1, 1977 Apr. 1, 1982 do
Total Treasury notes
Apr. 1-Oct. 1 Exchange at par . do do do do
. do .
. do .
. do .
. do .
. do .
$2,258,594,000 50.000.000
2.308.594.000 . .
2,024,140,000 880,990,000
2.909.265.000 2.623.332.000
8.437.727.000
2.563,484,000 300.000,000
2.863.484.000
4,747.242,000 471.640.000
5.218.882,000
8,038,781.000 1.476.105.000
$2.308.594.000
8.437.727.000
2.863.484.000
5.218.882.000
9.514.886.000 9.514.886.000
16.923.000 14.874.000 3,032.000 2,185,000 1.230,000 2,138.000 2,8H000
. 419,000 14,495.000
703.000
16,923,000 14,874,000 3.032,000 2,185,000 1,230,000 2,138,000 2,894,000
419,000 14,495,000
703.000
ES o ? o *fl
tfl c/3
tfl
>
o H X tfl
ifi
241.692.250.000 241.692.250.000
Digitized for FRASER http://fraser.stlouisfed.org/ Federal Reserve Bank of St. Louis

Treasury bonds:' 474% of 1975-85 (effective rate 4.2651%).''
Subtotal
374% of 1978-83..
4% of 1980 (effective rate 4.0443%).'
Subtotal.
37,% of 1980 (effective rate 3.3714%).*'
7% of 1981 (effective rate 7.1132%).
Subtotal.
67.% of 1982 (effective rate 6.3439%).'
Subtotal.
67.% of 1984 (effective rate 6.4978%).
Subtotal
See footnotes at end of table.
Apr. 5, I960.. . On and after May 15. 1978; on May 15. 1985.*
May and Nov. 15. Par Exchange at 101.15.. Exchange at 99.95... Exchange at 99.25... Exchange at 99.10... Exchange at 99.05...
. May 1. 1953.. . On and after June 15. 1978; on June 15. 1983.*
June and Dec. 15 .
Jan. 23. 1959 On Feb. 15, 1 . Feb. and Aug. 15.
Par Exchange at par . . .
99 99.50 Exchange at 99 Exchange at 99.10... Exchange at 99.30... Exchange at 99.50... Exchange at 99.60... Exchange at 98.80... Exchange at 100.25.. Exchange at 100.55..
Oct. 3, 1960 On Nov. 15, 1980* . May and Nov. 15.
Aug. 15, 1971 On Aug. 15. 1981 Feb. and Aug. 15..
Exchange at par . . . . Exchange at 102.25.. Exchange at 103.50..
Exchange at 99.20.. 99.20
Feb. 15. 1972 OnFeb. 15, 1982 Feb. and Aug. 15.. Par Exchange at par . 100.60
Aug. 15, 1972.. . On Aug. 15, 1984 Feb. and Aug. 15.. Exchange at 99.40.. 99.40
469.533,000 52,853,500
397.057,000 105,792,000 75.642.000
116.733.000
1.217.610.500 $164.541.000 1.053.069.500
1.188,769,175 417,314,825
1.606.084,000 338.425.000 1.267.659.000
884,115,500 M02,000 c/5
195,465,000 H 17,346,000 > 2,113.000 H
107,341,500 « 212.994,500 J j 420,040,000 g 562,595,500 Q 209.580.500 ^
2.611.693.500 111.164.000 2.500.529.500 >^
643,406.000 h§ 1.034.722,000 , tfl
237.815.000 Z
1.915.943.000 159.898.500 1.756.044.500 J-j
612.071,500
194.862.500
806.934.000 806.934.000
571.668.500 1.625.156.500
505.372.000
2.702.197.000 2.702.197.000
2.311.879.000 40.851.000
2.352.730.000 2.352.730,000
VO
Digitized for FRASER http://fraser.stlouisfed.org/ Federal Reserve Bank of St. Louis
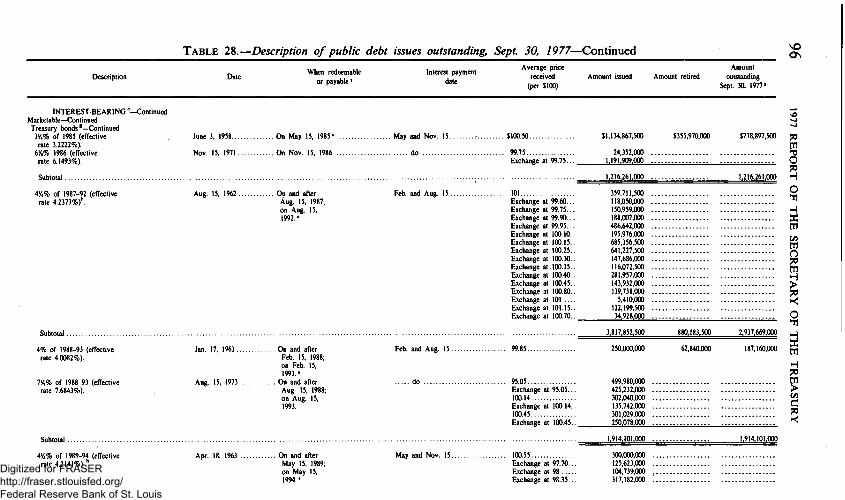
TABLE 28.—Description of public debt issues outstanding, Sept. 30, 1977—Continued vo ON
Description When redeemable
or payable' Interest payment
date
Average price received
(per $100) Amount retired
Amount outstanding
Sept. 30, 1977»
INTEREST-BEARING ' -Cont inued Marketable—Continued
Treasury bonds *—Continued 374% of 1985 (effective
rate 3.2222%). 67,% 1986 (effective
rate 6.1493%).
June 3, 1958 On May 15, 1985*
Nov. 15, 1971 O n N o v . 15, 1986
. May and Nov. 15.
do
Subtotal .
474% of 1987-92 (effective rate 4.2373%)^
Aug. 15, 1%2. . On and after Aug. 15, 1987; on Aug. 15, 1992.*
4% of 1988-93 (effective rate 4.0082%).
77,% of 1988-93 (effective rate 7.6843%).
Jan. 17, 1963
Aug. 15. 1973
On and after Feb. 15, 1988; on Feb. 15, 1993.*
On and after Aug. 15, 1988; on Aug. 15, 1993.
47.% of 1989-94 (effective rate 4.2141%).''
Apr. 18, 1963 . . On and after May 15, 1989; on May 15, 1994.«
Feb. and Aug. 15 .
Feb. and Aug. 15.
May and Nov. 15.
;ioo.5o
99.75 Exchange at 99.75.. .
101 Exchange at 99.60... Exchange at 99.75... Exchange at 99.90... Exchange at 99.95.. . Exchange at 100.10.. Exchange at 100.15.. Exchange at 100.25.. Exchange at 100.30.. Exchange at. 100.35.. Exchange at 100.40.. Exchange at 100.45.. Exchange at 100.80.. Exchange at 101 . . . . Exchange at 101.15.. Exchange at 100.70..
99 85
95.05 Exchange at 95.05.. . 100.14 Exchange at 100.14.. 100.45 Exchange at 100.45..
100.55 Exchange at 97.70... Exchange at 98 Exchange at 98.35...
$1,134,867,500
24,352,000 . . . 1.191.909.000 . . .
1.216,261.000 . . .
359,711,500 . . . 118,050,000 . . . 150,959.000 . . . 188.007.000 . . . 486.642.000 . . 195.976.000 . . . 685.356.500 . . . 641.227.500 . . . 147.686.000 . . . 116.072.500 . . . 281.957.000 . . 143,932.000 . . . 139,738,000 . . .
5,410,000 . . . 122,199,500 . . . 34.928.000 . . .
3.817.852.500
250.000.000
499,980.000 . . 425.232,000 . . 302,040,000 . . 135 742,000 -301,029,000 . . 250.078.000 . .
1.914.101.000 - .
300.000.000 . . 125.623.000 . . 104.739.000 . . 317,182,000 . .
$355,970,000
880,183,500
62,840,000
$778,897,500
1,216,261,000
2,937.669,000
187,160,000
1,914,101.000
S • o ^ 2 "fl H X tfl
c/3
O
tfl
tfl > c/3
c po ^
Digitized for FRASER http://fraser.stlouisfed.org/ Federal Reserve Bank of St. Louis

37,% of 1990 (effective rate 3.4844%)."
Subtotal .
874% of 1990 (effective rate 8.3125%).
774% of 1992 (effective rate 7.2870%).
674% of 1993 (effective rate 6.7940%).
7% of 1993-98 (effective rate 7.1076%).
87,% of 1994-99 (effective rate 8.3627%).
Subto ta l . . . .
3% of 1995..
Subtotal.
77,% of 1995-00 (effective rate 7.7971%).
Subtotal
See footnotes at end of table.
Exchange at 98.65.. Exchange at 99.10.. Exchange at 99.40..
Feb. 14. 1958 On Feb. 15. 1990.* Feb. and Aug. 15 Exchange at par Exchange at 99 Exchange at 100.25.. Exchange at 101.25.. Exchange at 101.50.. Exchange at 101.75..
Apr. 7, 1975 On May 15. 1990 May and Nov. 15 99.982.
July 8. 1977 On Aug. 15, 1992 Feb. and Aug. 15 99.611.
Jan. 10, 1973 On Feb. 15, 1993 do 99.50..
May 15, 1973 On and after May 15. 1993; on May 15. 1998.
May and Nov. 15 Exchange at * 98.75
May 15, 1974 On and after May 15, 1994; on May 15, 1999.
May and Nov. 15.! 102.85 Exchange at 102.85.. 98.70 Exchange at 98.70... Exchange at 103.04.. 103.04
.Feb. 15, 1955 O n F e b . 15, 1995.* Feb. and Aug. 15 Par Exchange at par . . . .
Feb. 18, 1975 On and after Feb. 15, 1995; on Feb. 15, 2000
Feb. and Aug. 15 Exchange at 99.191.. 99.191 Exchange at 96.73... 96.73 100.79
489,896,000 131.877,000 91.149,000
1.560.466.000 464.843,500
2,719,730,000 721,728,000 575,798,500 233,236,000 344,644.000 322,275,000
4.917.411.500 2.006,441.500
1,247.342,000
1,504,394,000
627.201.000
40.000.000 651.756.000
691.756.000 2.000
308.993.000 279.272.000 399.573,000 485,682,000 338,450,000 602.523.000
2.414.493.000
821.474.500
1.923.642.500
2.745.117.000 2.168.144,500
150,000,000 752,261,000 117,180,000 750,424,000
1.001.289.000 2.771.154,000
1.095.622.500
2.910.970.000
1,247.342.000
1.504.394,000 C/3
627,201,000 H > H ijn
H O
691,754.000 > f-l > 13 ^ tfl
z
2,414,493,000 X
576,972.500
2.771.154.000
VO
Digitized for FRASER http://fraser.stlouisfed.org/ Federal Reserve Bank of St. Louis

TABLE 28.—Description of public debt issues outstanding Sept. 30, 1977—Continued vo O O
Description Date When redeemable
or payable' Interest payment
date
Average price received
(per $100) Amount retired
Amount outstanding
Sept. 30. 1977«
INTEREST-BEARING ' -Cont inued Marketable—Continued
Treasury bonds*—Continued 87,% of 1995-00 (effective
rate 8.3325%.)
Subtotal
8% of 1996-01 (effective rate 8.0192%).
Subtotal
37,% of 1998 (effective rate 3.5315%).''
Subtotal.
87«% of 2000-05 (effective rate 8.2389%).
Subtotal.
77,% of 2002-07 (effective rate 7.7182%).
Subtotal
Total Treasury bonds. . .
Total marketable issues.
Aug. 15, 1975 On and after Aug. 15, 1995; on Aug. 15, 2000
Aug. 16, 1976 On and after Aug. 15, 1996; on Aug. 15, 2001.
Oct. 3. 1960 On Nov. 15, 1998.*
May 15, 1975 On and after May 15, 2000; on May 15, 2005.
Feb. 15, 1977 On and after Feb. 15, 2002; on Feb. 15, 2007.
Feb. and Aug. 15 Exchange at 99.327.. 99.327 Exchange at 101.50.. 101.50
Feb. and Aug. 15 Exchange at 99.893.. 99.893
May and Nov. 15 Exchange at par . . . Exchange at 98 Exchange at 99 Exchange at 100.25. Exchange at 100.50.
May and Nov. 15 Exchange at 99.450.. 99.450 Exchange at 101.75.. 101.75
Feb. and Aug. 15 Exchange at 99.941..
99.941 Exchange at 98.25.. 98.25 Exchange at 98.94.. 98.94
$313,000,000 801,392.000 150,000.000
1.000.784.000
2.265.176.000
592.200.000 983.206.000
1,575,406,000
2.523,039,000 494,804,500 692,076,500 419,513.000 333.406.000
4.462.839.000 $2,362,774,500 . 2,100.064.500
849,950,000 754,111,000 . . . 215,000,000 402.341.000
2,221,402,000 . . 2.221.402.000
390.600.000 752,859.000 900.000,000
1,003.431.000 198.839,000
1.003.313.000
tfl
:;:::::::::: S J«
$2.265.176.000 H O ^ H X tfl
1.575.406.000 ^
tfl -. O
J* tfl H > >< O •Tl H X tfl ^ tfl > c/3 C po
4.249.042.000 . .
54.799.473.500
452.581.568.500
9.075.228.000
9.075.228.000
4,249,042,000
45,724,245,500
• 443.506.340.500
Digitized for FRASER http://fraser.stlouisfed.org/ Federal Reserve Bank of St. Louis

Nonmarketable: Depositary series:*
2% first series Various dates from Oct. 1965.
At option of U.S. or owner upon 30 to 60 days' notice 12 yrs. from issue date.
June and Dec. 1 Par..
Federal Reserve special certificate:' 57,% 1977 Sept. 30, 1977 Redeemable at
any time prior to maturity.
Foreign govemment series:* Dollar denominated:
BUls: 10/13/77 Apr. 14, 1977 Oct. 13, 1977 Oct. 11/10/77 May 12, 1977 Nov. 10, 1977 Nov. 12/01/77 June 2, 1977 Dec. 1, 1977 Dec. 02/02/78 Aug. 4. 1977 Feb. 2. 1978 Feb. 03/09/78 Sept. 8. 1977 Mar. 9, 1978 Mar.
5.50% Treasury certificates of indebtedness Oct. 29, 1976 On 2 days'
Oct. 31, 1977 do .
13, 1977 Various. . 10. 1977 do . 1, 1977 do .
2. 1978 do . 9. 1978 do .
Oct. 28. 1977 Par.. notice; Oct. 28. 1977.
. On Oct. 31. 1977 • . do ,
. Apr. 7.50% Treasury notes Nov. 28. 1975 Do Jan. 29. 1976.
7.75% Treasury notes Dec. 29. 1974 On Nov. 15. 1977» May 7.30% Treasury notes Dec. 16. 1975 On Dec. 16. 1977* June 2.50% Treasury notes June 29. 1973 On Dec. 29. 1977« June 5.70% Treasury notes Oct. 29. 1976 On 2 days' notice; Jan.
on Jan. 30. 1978 6.375% Treasury notes Apr. 1. 1976 On Jan. 31. 1978* Jan. 6.25% Treasury notes Jan. 9. 1975 On Feb. 15, 1978' Feb.
Do Jan. 23, 1975 do 5.95% Treasury notes July 19. 1972 On Mar. 22, 1978" Mar. 6.75% Treasury notes June 28, 1976 On Mar. 31, 1978» Mar. 6.20% Treasury notes Apr. 7, 1972 On Apr. 7, 1978'» Apr. 5.80% Treasury notes Oct. 29, 1976 On 2 days' notice; Apr.
on Apr. 28, 1978. 7.125% Treasury notes Dec. 18, 1975 On May 15, 1978« May 6.20% Treasury notes Apr. 7, 1972 On July 7, 1978" Jan. 5.95% Treasury notes Oct. 29, 1976 On 2 days' notice; Jan.
on July 28, 1978. •7.625% Treasury notes Dec. 18, 1975 On Aug. 15, 1978" Feb.
• Do Jan. 29, 1976 do >' 6.00% Treasury ndtes July 19, 1972 On Sept. 22, 1978"> Mar.
6.25% Treasury notes Oct. 1, 1976 On 2 days' notice; Mar. on Sept. 30, 1978.
6.20% Treasury notes Apr. 7, 1972 On Oct. 6, 1978 " Apr. 6.00% Treasury notes Oct. 29, 1976 On 2 days' notice; Apr.
on Oct. 30, 1978. Do Jan. 29, 1976 On Nov. 15, 1978* May
See footnotes at end of table.
30-Oct. 31 do . do do . and Nov. 15 do . and Dec. 16 do . and Dec. 29 do .
and July 30 do .
and July 31 do . and Aug. 15 do . do do . and Sept. 22 do . 31-Sept. 30 do . and Oct. 7 do . and Oct. 28 do .
and Nov. 15 do . and July 7 do . and July 28 do .
and Aug. 15 d o . . do do . and Sept. 22 do . 31-Sept. 30 do .
and Oct. 6 do . and Oct. 30 do .
and Nov. 15 do .
55,55.500
2.500,000,000
242,040,000 256,300,000 47,425,000 40,000,000 42,700,000
143,567,580
100,000,000 50,000,000 100,000,000 200,000,000 198.886.237 95.613.048
100.000,000 100,000,000 100,000,000 500,000,000 100,000.000 400,000,000 95,613,048
150,000,000 400,000,000 95,613,048
100,000,000 50,000,000
500,000,000 400,000,000
450,000,000 95,613,048
150,000,000
101,237,345
7,385,000
2,500,000,000
242,040,000 256,300,000 47.425.000 40.000.000 42.700.000
42.330.235
100.000.000 50.000.000
100.000.000 200.000.000 198.886.237 95.613.048
100,000,000 100,000,000 100.000,000 500,000,000 100,000,000 400,000,000 95,613,048
150,000,000 400,000,000 95,613,048
100,000.000 50,000,000
500,000,000 400,000,000
450,000,000 95,613,048
150,000,000
I > r > tfl z
vo vo
Digitized for FRASER http://fraser.stlouisfed.org/ Federal Reserve Bank of St. Louis

TABLE 28.—Description of public debt issues outstanding, Sept. 30, 1977—Continued
Description Date When redeemable
or payable'
Interest payment
date
Average price received
(per $100)
Amount outstanding
Sept. 30, 1977*
INTEREST-BEARING ' - C o n . Nonmarketable—Continued
Foreign govemment series *—Continued Dollar denominated—Continued
6.05% Treasury notes
5.875% Treasury notes .,
6.25% Treasury notes . . . Do Do
6.15% Treasury notes . .
5.875% Treasury notes . 6.05% Treasury notes . . 6.125% Treasury notes .
6.10% Treasury notes . . 6.20% Treasury notes ..
6.875% Treasury notes .
6.25% Treasury notes . .
7.00% Treasury notes . .
6.25% Treasury notes . . 7.50% Treasury notes . .
6.50% Treasury notes . .
7.50% Treasury notes ..
Do Do
6.875% Treasury notes .
6.95% Treasury notes . . 7:20% Treasury notes . . 7.30% Treasury notes . . 9.00% Treasury notes . .
5.875% Treasury notes .
7.375% Treasury notes .
. Oct. 29, 1976 On 2 days' notice; on Jan. 29, 1979.
. May 16, 1977 On 2 days' notice; on Jan. 31, 1979.
I Feb. 7, 1979
Jan. and July 29 Par
Jan. and July 31 do ,
. Apr. 7, 1972 On do On do On
.Oct . 29, 1976 On
. June 30, 1977
.July 19, 1972 On
. Aug. 1. 1977 On on
.July 19, 1972 On
.Oct . 29, 1976 On on
. Sept. 6, 1977 On on
.Oct . 29, 1976 On on
. Mar. 25, 1977 On
. June 30. 1977
.July 18. 1977 On
.Aug. 1. 1977 On on
. Mar. 10. 1977 On
.Mar . 15, 1977
. Sept. 7. 1977
. Sept. 7, 1977 On on
. June 25. 1973 On
. July 9. 1973 On
. July 16. 1973 On
.Feb . 28, 1977 On on
.Mar. 31, 1977 On on
.Sept. 15, 1976 On
Feb. and Aug. 7 do . Mar. 7, 1979 «• Mar. and Sept. 7 do . Apr. 6, 1979 '• Apr. and Oct. 6 do . 2 days' notice; Apr. 30-Oct. 31 do . Apr. 30, 1979. . do do do . May 15. 1979" May and Nov. 15 do . 2 days' notice; May 31-Nov. 30 do . May 31. 1979.
July 16. 1979 «• Jan. and July 16 do . 2 days' notice; Jan. and July 30 do . July 30, 1979. 2 days' notice; Feb. and Aug. 15 do . Aug. 15, 1979.
2 days' notice; Apr. and Oct. 29 do . Oct. 29. 1979. 2 days' notice; May and Nov. 15 do . Nov. 15, 1979.
. do do do . 2 days' notice; June 30-Dec. 31 do . Dec. 31, 1979.
2 days' notice; Feb. and Aug. 15 do . Feb. 15, 1980. 2 days' notice; Mar. 31-Sept. 30 do . Mar. 31. 1980. . do do do . . do do do . 2 days' notice; May and Nov. 15 do . May 15. 1980.
June 23, 1980'" June and Dec. 23 do . July 8, 1980 '• Jan. and July 8 do . July 15, 1980'" Jan. and July 15 do . 2 days' notice; Feb. and Aug. 15 do . Aug. 15, 1980. 2 days' notice; June 30-Dec. 31 do . Dec. 31, 1980. 2 days' notice; Feb. and Aug. 15 do . Feb. 15, 1981.
$47,658,516
100,000.000
400.000.000 400.000.000 450,000.000 47,658,516
50,000,000 500,000,000 50,000,000
500,000,000 47.658.516
200.000,000
47,658,516
260.000,000
50,000,000 400,000,000
50,000,000
200,000,000
100,000,000 300,000,000 200,000,000
600,000.000 200.000.000 200,000.000 300,000,000
500,000,000
160,000,000
$47,658,516
100,000,000
400.000,000 400.000.000 450.000.000 47.658,516
50,000,000 500,000,000 50,000,000
500,000,000 47,658,516
200,000.000
47,658.516
260.000.000
50.000,000 400,000,000
50,000,000
200,000,000
100,000.000 300,000,000 200.000,000
600,000,000 200.000,000 200,000,000 300,000,000
500,000,000
160,000,000
J« tfl Id
O 1 H O
H X tfl c/3 UJ
n p
> po >< o *fl
tfl
^ tfl > ifi
c ?0
Digitized for FRASER http://fraser.stlouisfed.org/ Federal Reserve Bank of St. Louis
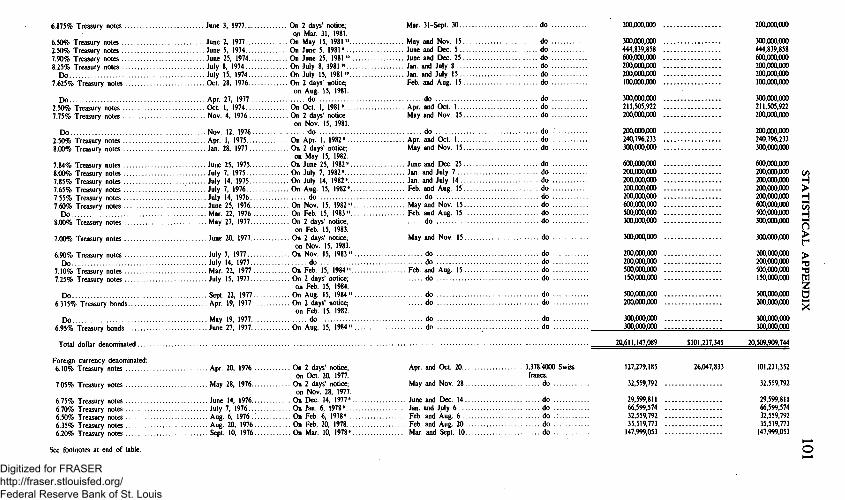
6.875% Treasury notes June 3, 1977 On 2 days' notice; Mar. 31-Sept. 30 . . on Mar. 31, 1981.
6.50% Treasury notes June 2, 1977 On May 15, 1981" May 2.50% Treasury notes June 5, 1974 On June 5, 1981 • June 7.90% Treasury notes June 25, 1974 On June 25, 1981"» June 8.25% Treasury notes July 8, 1974 On July 8, 1981'" Jan.
Do July 15, 1974 On July 15, 1981'" Jan. 7.625% Treasury notes Oct. 28, 1976 On 2 days' notice; Feb.
on Aug. 15, 1981. Do Apr. 27, 1977 do
2.50% Treasury notes Oct. 1, 1974 On Oct. 1, 1981 • Apr. 7.75% Treasury notes Nov. 4, 1976 On 2 days' notice May
on Nov. 15, 1981. Do Nov. 12, 1976 do
2.50% Treasury notes Apr. 1, 1975 On Apr. 1, 1982' Apr. 8.00% Treasury notes Jan. 28, 1977 On 2 days' notice; May
on May 15, 1982. 7.84% Treasury notes June 25, 1975 On June 25, 1982'' June 8.00% Treasury notes July 7, 1975 On July 7, 1982* Jan. 7.85% Treasury notes July 14, 1975 On July 14, 1982» Jan. 7.65% Treasury notes July 7, 1976 On Aug. 15, 1982» Feb. 7.55% Treasury notes July 14, 1976 do do . 7.60% Treasury notes June 25, 1976 On Nov. 15, 1982 " May
Do Mar. 22, 1976 On Feb. 15, 1983" Feb. 8.00% Treasury notes May 27. 1977 On 2 days' notice;
on Feb. 15. 1983. 7.00% Treasury notes June 20. 1977 On 2 days' notice; May
on Nov. 15. 1983. 6.90% Treasury notes July 7. 1977 On Nov. 15. 1983 "
Do July 14. 1977 do 7.10% Treasury notes Mar. 22. 1977 On Feb. 15. 1984" Feb. 7.25% Treasury notes July 15. 1977 On 2 days' notice;
on Feb. 15. 1984. Do Sept. 22. 1977 On Aug. 15. 1984" do .
6.375% Treasury bonds Apr. 19, 1977 On 2 days' notice; do . on Feb. 15, 1982.
Do May 19, 1977 . . . . d o do . 6.95% Treasury bonds June 27, 1977 On Aug. 15, 1984" do .
. do .
and Nov. 15 do . and Dec. 5 do . and Dec. 25 do .
and July 8 do . and July 15 do . and Aug. 15 do .
do do . and Oct. 1 do . and Nov. 15 do .
do do . and Oct. 1 do . and Nov. 15 do .
and Dec. 25 do . and July 7 do . and July 14 do . and Aug. 15 do .
d o . and Nov. 15 do . and Aug. 15 do . do do .
and Nov. 15 do .
do do . and Aug. 15 do . do do .
. do .
. do .
. do .
. do .
200,000,000
300.000.000 444.839.858 600.000,000 200,000,000 200,000,000 100,000,000
300,000.000 211.505.922 200.000.000
200.000,000 240,796,233 300,000,000
600,000,000 200,000,000 200,000,000 200,000,000 200,000,000 600,000,000 500,000,000 300,000,000
300,000,000
200,000,000 200,000,000 500,000,000 150.000,000
500,000,000 200,000,000
300,000,000 300.000.000
200,000,000
300,000,000 444.839.858 600.000.000 200.000,000 200,000,000 100,000.000
300.000.000 211.505.922 200.000.000
200,000.000 240.796.233 300,000,000
600,000,000 200,000,000 200,000,000 200,000.000 200.000.000 600,000.000 500.000.000 300.000.000
300.000.000
200.000.000 200.000,000 500,000,000 150,000,000
500.000,000 200.000.000
300.000.000 300.000.000
ifi
H
H O > r > tfl z a
Total dollar denominated. 20.611.147.089 $101.237.345 20.509.909.744
Apr. and Oct. 20 3.378.4000 Swiss francs.
May and Nov. 28 do
Foreign currency denominated: 6.10% Treasury notes Apr. 20. 1976 On 2 days' notice;
on Oct. 20. 1977. 7.05% Treasury notes May 28. 1976 On 2 days' notice;
on Nov. 28. 1977. 6.75% Treasury notes June 14, 1976 On Dec. 14, 1977' June and Dec. 14 do 6.70% Treasury notes July 7, 1976 On Jan. 6, 1978' Jan. and July 6 do 6.50% Treasury nbtes Aug. 6, 1976 On Feb. 6, 1978' Feb. and Aug. 6 do 6.35% Treasury notes Aug. 20, 1976 On Feb. 20, 1978 Feb. and Aug. 20 do 6.20% Treasury notes Sept. 10, 1976 On Mar. 10, 1978 • Mar. and Sept. 10 do
See footnotes at end of table.
127,279,185
32,559,792 ...
29,599,811 ... 66,599,574 ... 32,559,792 ... 35,519,773 ... 147,999,053 ...
26,047,833 101,231,352
32,559,792
29,599,811 66,599,574 32,559,792 35,519,773 147,999,053
Digitized for FRASER http://fraser.stlouisfed.org/ Federal Reserve Bank of St. Louis

TABLE 28.—Description of public debt issues outstanding, Sept. 30, /977—Continued O to
Description When redeemable
or payable' Interest payment
date
Average price received
(per $100) Amount retired
Amount outstanding
Sept. 30, 1977*
INTEREST-BEARING' -Con . Nonmarketable—Continued
Foreign govemment series *—Continued Foreign currency denominated—Continued
5.95% Treasury notes Oct. 8, 1976 On Apr. 7, 1978 . . . 5.80% Treasury notes Oct. 29, 1976 On 2 days' notice;
on Apr. 28, 1978. 5.25% Treasury notes Dec. 10, 1976 On June 9, 1 9 7 8 ' . . 5.90% Treasury notes Mar. 8, 1977 On 2 days' notice;
on Sept. 8, 1978. 5.60% Treasury notes Apr. 18, 1977 On 2 days' notice;
on Oct. 18, 1978. 6.10% Treasury notes May 26, 1977 On 2 days' notice;
on Nov. 27. 1978. 6.60% Treasury notes Aug. 19. 1977 On 2 days' notice;
on Feb. 20. 1979. 6.40% Treasury notes Sept. 1. 1977 On 2 days' notice;
on Mar. 1. 1979.
Total foreign currency denominated
Govemment account series:-' , Airport and airway trust fund: Certificates:
67,% Series 1978 Various dates: From Aug. 9, 1977.
674% Series 1978 From June 30, 1977.
Aviation war-risk insurance revolving fund:
BUls 4/4/78 Various dates . . . BUls 5/30/78 do Bills 7/25/78 do
CivU service retirement fund: Certificates:
77.% Series 1978 Various dates: From Aug. 1, 1977.
7% Series 1978 From July 1, 1977.
On demand; on June 30:
1978
. Apr. 4, 1978 . . . .
. May 30, 1978 . . .
. July 25, 1978.. . . On demand; on June 30:
1978
. Apr. and Oct. 7 3,378.4000 Swiss francs. Apr. and Oct. 28 do
. June and Dec. 9 do .
Mar. and Sept. 8 do .
Apr. and Oct. 18 do .
May and Nov. 27 do .
Feb. and Aug. 20 do .
Mar. and Sept. 1 do .
. June 30-Dec. 31 Par
do do .
. Apr. 4, 1978 Various . .
. May 30, 1978 do .
. July 25, 1978 do .
. June 30-Dec. 31 Par
do do ..
$38,479,754 50,319,678
137,047,123 49,733.602
159,838,977
359,927,776
22,495,856
25,455,837
$38,479,754 50,319,678
137,047.123 49,733.602
159.838,977
359,927 776
22,495.856
25.455.837
1.315.415.581
220,576,000
3,485,246,000
6,750.000 8.015.000
430.000
568.158,000
8.539,358.000
$26.047.833 1.289.367.748
12.000
220,576,000
3,025,405,000
6,750,000 8,015,000
430,000
568.158,000
8,539,346,000
tfl
s o H X tfl c/3
>
o
tfl H
tfl > c/3
Digitized for FRASER http://fraser.stlouisfed.org/ Federal Reserve Bank of St. Louis

Notes: 67,% Series 1980 June 67,% Series 1978 June 574% Series 1979 June
Bonds: 77,% Series 1981 June 77.% Series 1982! 77.% Series 1983 77,% Series 1984 77.% Series 1985 77.% Series 1986 77.% Series 1987 77.% Series 1988 77.% Series 1989 77,% Series 1981 June 77,% Series 1982 77,% Series 1983 77,% Series 1984 77,% Series 1985 77,% Series 1986 77,% Series 1987 77,% Series 1988 77,% Series 1989 77,% Series 1990 77,% Series 1991 77,% Series 1981 June 77.% Series 1982 77.% Series 1983 77.% Series 1984 77.% Series 1985 77.% Series 1986 77.% Series 1987 77.% Series 1988 77.% Series 1989 77.% Series 1990 77.% Series 1981 June 77.% Series 1982 77.% Series 1983 77.% Series 1984 77.% Series 1985 77.% Series 1986. 77.% Series 1987 77.% Series 1988 77.% Series 1989 77.% Series 1990
Redeemable after 1 year from issue date and payable on June 30:
30, 1973 1980 do 30. 1971 1978 do 30. 1972 1979 do
On demand; on June 30:
30, 1974 1981 do do 1982 do do 1983 do do 1984 do do 1985 do do 1986 do do 1987 do do 1988 do do 1989 do 30, 1976 1981 do do 1982 do do 1983 do do 1984 do do 1985 do do 1986 do do 1987 do do 1988 do do 1989 do do 1990 do do 1991 do 30, 1975 1981 do do 1982 ;. do do 1983 do do 1984 do do 1985 do do 1986 do do 1987 do do 1988 do do 1989 do do 1990 do 30, 1977 1981 do do 1982 do do 1983 do do 1984 do do 1985 do do 1986 do do 1987 do do 1988 do do 1989 do do 1990 do
do . do . do .
do . do . do . do . do . do . do . do . do . do . do . do . do . do . do . do . do . do . do . do . do . do . do . do . do . do . do . do . do . do . do . do . do . do . do . do . do . do . do . do .
3,951.273,000 5,835.123.000 4,009,870.000
597,744.000 597.744,000 597,744,000 597,744.000 597.743,000 597,743,000 597,743,000 597,743,000 597,743,000 623,755,000 623,755,000 623,755,000 623.755,000 623,754,000 623,754,000 623,754,000 623,754,000 623,754,000 623,755,000
1.782,984,000 561,486,000 561.486,000 561,486,000 561,486,000 561,487,000 561,487,000 561,487,000 561,487,000 561,487,000
1.159.229,000 140.755.000 140.755,000 140,755,000 140,755,000 140,756,000 140,756,000 140,756,000 140,756,000 140,755,000 140,755,000
1,533,376,000 29,637,000
16,000
3,951,273,000 4,301.747,000 3.980,233,000
597,744,000 597,744,000 597,744,000 597.744,000 597.743.000 597,743.000 597,743.000 597.743.000 597,743.000 623,755,000 623,755,000 623,755,000 623,755,000 623,754,000 623,754,000 623,754,000 623,754,000 623,754.000 623.755,000
1,782,984,000 561.486.000 561.486.000 561.486,000 561.486,000 561,487,000 561,487.000 561.487.000 561.487.000 561.487.000
1.159,229.000 139.639.000 140.755.000 140.755.000 140.755.000 140.756.000 140.756.000 140.756.000 140.756,000 140,755,000 140,755,000
C/3
H > H 00
H O > r > tfl z o
See footnotes at end of table.
o Digitized for FRASER http://fraser.stlouisfed.org/ Federal Reserve Bank of St. Louis

TABLE 28.—Description of public debt issues outstanding, Sept. 30, 1977—Continued 2 Description
When redeemable or payable'
Interest payment date
Average price received
(per $100) Amount retired
Amount
outstanding Sept. 30, 1977»
INTEREST-BEARING ' - C o n . Nonmarketable—Continued Govemment account series^—Continued
Civil service retirement fund—Continued Bonds—Continued
77.% Series 1991 77.% Series 1992 47,% Series 1979
47,% Series 1980 Comptroller of the Currency, assessments fund:
Bills 1/12/78 8% 1982 notes 774% 1984 no t e s . . . . .
Comptroller of the Currency, trustee fund:
874% 1978 notes 678% 1984 bonds
Department of the Navy general gift fund:
77,% 1995-00 bonds Departmerit of the Navy. U.S. Office of Naval Records and History:
77.% 1979 notes 77,% 1986 notes
Department of State, conditional gift fund, general:
Bills 11/15/77 Bills 2/7/78 Bills 4/4/78
Emergency loan guarantee fund: Bills 8 /22/78 . .
Employees health benefits fund: Bills 10/13/77 Bills 10/27/77 Bills 12/08/77 Bills 12/22/77 8% 1983 notes 8% 1986 notes 778% 1982 notes 77.% 1986 notes 778% 1978 notes 874% 2000-05 bonds 778% 2002-07 bonds
. June 30.1977 1991 June 30-Dec. 31 Par do 1992 do do .
. Various dates 1979 do do . from June 30. 1964.
do 1980 do do .
. Various dates Jan. 12. 1978 Jan. 12. 1978 Various ..
.Feb . 15. 1977 May 15, 1982 May 15-Nov. 15 do .
.Aug . 15, 1977 Aug. 15, 1984 Feb. 15-Aug. 15 do .
.Aug . 18, 1975 Aug. 15, 1978 Feb. 15-Aug. 15 .
.Aug. 19, 1975 Aug. 15, 1984 do
.May 17, 1976 Feb. 15, 1995 .
. do ,
. do .
. Various dates May 15, 1979 .
. May 16, 1977 May 15, 1986. . May 15-Nov. 15 do .
do do .
.Various dates Nov. 15, 1977 Nov. 15. 1977 do . do Feb. 7. 1978 Feb. 7. 1978 do . do Apr. 4. 1978 Apr. 4, 1978 do .
. do
. do
. do
. do
. do
. do
. Aug. 22. 1978 Aug. 22. 1978. . do ,
Oct. 13, 1977 Oct. 13, 1977 do . Oct. 27, 1977 Oct. 27, 1977 do . Dec. 8, 1977 Dec. 8, 1977 do . Dec. 22, 1977 Dec. 22, 1977 do . Feb. 15, 1983 Feb. 15-Aug. 15 do .
.Aug . 16, 1976 Aug. 15, 1986 do do .
.Nov. 17, 1975 Nov. 15, 1982 May 15-Nov. 15 do .
. Various dates May 15, 1986 do do .
.May 15, 1975 Aug. 15, 1978 Feb. 15-Aug. 15 do .
. Various dates May 15, 2000 May 15-Nov. 15 do . do Feb. 15, 2002 : Feb. 15-Aug. 15 do .
$140,755,000 1,923,739,000 969,117,000
42,500,000 5,000.000 1.900.000
210.000 5.000
30.000
127.000 18.000
130.000 225.000 125.000
79.655.000 38.160.000 3.340.000
56.690.000 32.029.000 4.466.000 6.942,000 11,595,000 41,200,000 25,183.000 17,070,000
$8,000,000
1.755.000
$140,755,000 1.923,739,000
969,117,000
%9,117,000
34.500,000, 5.000.000 1.900,000
210,000 5,000
30,000
127,000 18,000
130,000 225,000 125,000
31,510,000
77,900,000 38,160,000
3,340,000 56,690,000 32,029,000 4.466.000 6.942.000
11.595.000 41.200.000 25,183.000 17,070,000
po ffl ^ O po H
% H X tfl c/3 tfl n po tfl H > po < o ^ H X m ri }«3 tfl ifi C po ><
Digitized for FRASER http://fraser.stlouisfed.org/ Federal Reserve Bank of St. Louis

Federal Financing Bank: BUls 10/13/77 Various dates Oct. 13, 1977 Oct. BUls 10/20/77 do Oct. 20, 1977 Oct. BUls 11/17/77 do Nov. 17, 1977 Nov. Bills 12/15/77 do
Federal hospital insurance trust fund:
Certificates: 7% Series 1978 Various dates:
From July 13, 1977.
13, 1977 Various. . 20, 1977 do .
17, 1977 do . Dec. 15. 1977 Dec. 15. 1977 do .
Notes: 67.% Series 1 . June 30. 1973..
Bonds: 77.% Series 1981 June 30. 1974.. 77.% Series 1982 do 77.% Series 1983 do 77.% Series 1984 do 77.% Series 1985 do 77.% Series, 1986 do 77.% Series" 1987 do 77.% Series 1988 do 77.% Series 1989 do 77,% Series 1981 June 30. 1976.. 77,% Series 1982 do 77,% Series 1983 do 77,% Series 1984 do 77,% Series 1985 do 77,% Series 1986 do 77,% Series 1987 do 77,% Series 1988 do 77,% Series 1989 do 77,% Series 1990 do 77,% Series 1991 do 77.% Series 1981 June 30. 1975.. 77.% Series 1982 do 77.% Series 1983 do 77.% Series 1984 do 77.% Series 1985 do 77.% Series 1986 do 77.% Series 1987 do 77.% Series 1988 do 77.% Series 1989 do 77o% Series 1990 do 77.% Series 1979 June 30. 77.% Series 1992 do
1977..
On demand; on June 30:
1978 . June 30-Dec. 31 Par..
Redeemable after 1 year from issue date; payable on June 30:
On demand; on June 30:
. 1981
. 1982
. 1983
. 1984
. 1985
. 1986
. 1987
. 1988
. 1989
. 1981
. 1982
. 1983
. 1984
. 1985
. 1986
. 1987
. 1988
. 1989
. 1990
. 1991
. 1981
. 1982
. 1983
. 1984
. 1985
1987.. 1988.. 1989.. 1990.. 1979.. 1992..
. do .
. do .
. do .
. do .
. do .
. do .
. do .
. do .
. do .
. do .
. do .
. do .
. do .
. do .
. do .
. do .
. do .
. do .
. do .
. do .
. do .
. do .
. do .
. do .
. do .
. do .
. do .
. do .
. do .
. do .
. do .
. do .
. do .
. do .
. do .
. do .
. do .
. do .
. do .
. do .
. do .
. do .
. do .
. do .
. do .
. do .
. do .
. do .
. do .
. do .
. do .
. do .
. do .
. do .
. do .
. do .
. do .
. do .
. do .
. do .
. do .
. do .
. do .
. do .
9.005.000 305.000
12,975.000 15,920,000
2,355,111,000
9,005,000 305,000
12,975,000 15,920,000
506,993,000
See footnotes at end of table.
2,159,064,000 45.891.000 2.113.173.000
405.685.000 405.685.000 405.685.000 405.685.000 405.685.000 405.685.000 405.685,000 405,684.000 405.684.000 109.372.000 109.372.000 109.372,000 109,372,000 109,373,000 109,373,000 109,373,000 109.372.000 109.372.000 109,372,000 680,816,000 165,760,000 165,760,000 165,760,000 165,760,000 165,759,000 165,759,000 165,759,000 165,760,000 165,760,000 571,444,000
405,685,000 405,685,000 405,685,000 405,685,000 405,685,000 405,685,000 405,685,000 405,684,000 405,684,000 109,372,000 109,372,000 109,372,000 109,372,000
...... 109,373,000 109,373,000 109,373,000 109,372,000 109,372,000 109.372,000 680.816.000 165.760.000 165.760.000 165.760.000 165.760.000 165.759.000 165.759.000 165.759.000 165.760.000 165.760.000 571.444.000
680,817,000 390,705,000 290,112,000 524,479,000 524.479.000
^ > H ifi
H
> I ' >
? tfl Z a X
3 Digitized for FRASER http://fraser.stlouisfed.org/ Federal Reserve Bank of St. Louis
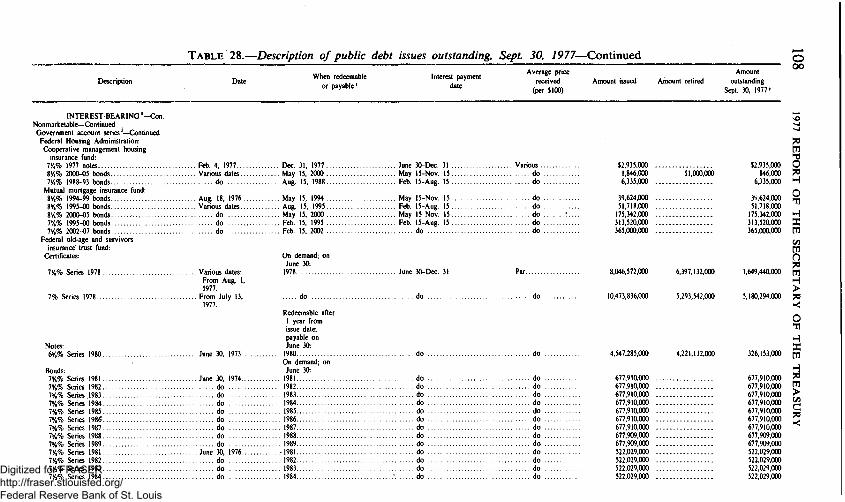
TABLE 28.—Description of public debt issues outstanding Sept. 30, 1977—Continued O oo
Description When redeemable
or payable' Interest payment
date
Average price received
(per $100) Amount retired
Amount outstanding
Sept. 30. 1977*
INTEREST-BEARING ' - C o n . Nonmarketable—Continued
Govemment account series^—Continued Federal Housing Administration:
Cooperative management housing insurance fund:
774% 1977 notes 874% 2000-05 bonds 77,% 1988-93 bonds
Mutual mortgage insurance fund: 87,% 1994-99 bonds 87,% 1995-00 bonds 874% 2000-05 bonds 77,% 1995-00 bonds 77.% 2002-07 bonds
Federal old-age and survivors insurance trust fund:
Certificates:
77.% Series 1978
.Feb . 4. 1977...
. Various dates.. do
. . . . Dec. 31, 1977 June 30-Dec. 31 Various ..
. . . . May 15, 2000 May 15-Nov. 15 do .
. . . . Aug. 15, 1988 Feb. 15-Aug. 15 do .
. Aug. 18, 1976 May 15, 1994 May 15-Nov. 15 do .
. Various dates Aug. 15, 1995 Feb.- 15-Aug. 15 do . do May 15, 2000 May 15-Nov. 15 do . do Feb. 15. 1995 Feb. 15-Aug. 15 do . do Feb. 15. 2002 do do .
On demand; on June 30:
1978
7% Series 1978.. . do
Notes: 67,% Series 1980.
Bonds: 77.% 778% 778% 77,% 778% 77,% 77.% 77.% 77,% 77,% 77,% 77,%
Series 1981.. Series 1982.. Series ,1983.. Series 1984.. Series 1985., Series 1986., Series 1987.. Series 1988., Series 1989.. Series 1981.. Series 1982.. Series 1983.. Series 1984..
. Various dates: From Aug. 1, 1977.
. From July 13. 1977.
Redeemable after 1 year from issue date; payable on June 30:
.June 30. 1973 1980 On demand; on June 30:
.June 30. 1974 1981..
. June 30-Dec. 31
. do
. do
. do
. do
. do
. do
. do
. do
, 1982.. . 1983.. . 1984.. . 1985.. . 1986.. , 1987.. , 1988.. . 1989..
.June 30, 1976 -1981.. do 1982.. do 1983.. do 198-t..
. do .
. do .
. do .
. do ,
. do ,
. do ,
. do ,
. do ,
. do ,
. do ,
. do .
. do ,
. do .
. do .
. do .
. do .
. do .
. do .
. do .
. do .
. do .
. do .
. do .
. do .
. do .
. do .
$2,935,000 1,846,000 6,335,000
39,624,000 51,718,000 175,342,000 313,520,000 365,000,000
8,046,572,000
10,473,836,000
4,547,285,000
677,910,000 677,910,000 677,910,000 677,910,000 677,910,000 677,910,000 677,910,000 677,909,000 677,909,000 522,029,000 522,029,000 522,029,000 522,029,000
$1,000,000
6,397,132,000
5,293,542,000
4,221,132,000
$2,935,000 846,000
6,335,000
39.624,000 51,718,000 175,342,000 313.520.000 365.000.000
1,649.440.000
5,180,294.000
677,910,000 677,910.000 677,910,000 677,910,000 677,910,000 677,910,000 677,910,000 677.909,000 677,909,000 522,029,000 522,029,000 522,029,000 522,029,000
tfl
o H O
H X tfl c/3 tfl O po 21 > po
O ^ H X tfl H po tfl > c/3
G
<
Digitized for FRASER http://fraser.stlouisfed.org/ Federal Reserve Bank of St. Louis

77,% Series 1985 do 1985.. 77,% Series 1986 do 1986.. 77,% Series 1987 do 1987.. 77,% Series 1988 do 1988.. 77,% Series 1989 do 77,% Series 1990 do 77,% Series "l991 ^ . . do 77,% Series 1981 June 30, 1975 77.% Series 1982 do 77.% Series 1983 do 77,% Series 1984 do 77,% Series 1985 do 77.% Series 1986 do 77.% Series 1987 do 778% Series 1988 do 778% Series 1989 do 77,% Series 1990 do 77.% Series 1981 June 30, 1977 77.% Series 1982 do 778% Series 1983 do 778% Series 1984 do 778% Series 1985 do 77.% Series 1986 do 778% Series 1987 do 778% Series 1988 do 77.% Series 1989 do 77.% Series 1990 do 778% Series 1991 do 778% Series 1992 do
Federal Savings and Loan Insurance Corporation: Certificates:
6.12% Series 1977 Sept. 30, 1977.. . 87,% 1979 notes Sept. 4, 1975 Sept. 30, 1979 Mar. 8% 1982 notes May 15, 1975 May J5, 1982 May 8% 1983 notes Feb. 17. 1976 Feb. 15, 1983 Feb. 8% 1986 notes Various dates Aug. 15, 1986 77,% 1978 notes Aug. 15. 1975 May 15, 1978 May 77.% 1986 notes May 17, 1976 May 15, 1986 774% 1984 notes Various dates Feb. 15, 1984 Feb. 774% 1984 notes do Aug. 15, 1984 7% 1981 notes Oct. 12, 1976 Nov. 15, 1981 May 7% 1982 notes Various dates May 15, 1982 67,% 1980 notes Feb. 15, 1977 Feb. 15, 1980 Feb. 578% 1980 notes Various dates Dec. 31, 1980 June 87,% 1994-99 bonds do May 15, 1994 May 87«% 1990 bonds do May 15, 1990 778% 1995-00 bonds Feb. 18, 1975 Feb. 15, 1995 Feb.. 7% 1993-98 bonds Jan. 4. 1977 May 15, 1993 May
. 1989..
. 1990..
. 1991..
. 1981..
. 1982..
. 1983..
. 1984..
. 1985..
. 1986..
. 1987..
. 1988..
. 1989..
. 1990..
. 1981..
. 1982..
. 1983..
. 1984..
. 1985..
. 1986..
. 1987..
. 1988..
. 1989..
. 1990..
. 1991..
. 1992..
. Oct. 3, 1977 Oct.
do do . do do . do do . do do . do do . do do . do do . do do . do do . do do . do do . do do . do do . do do . do do . do do . do do . do do . do do . do do . do do . do do . do do . do do . do do . do do . do do . do do . do do .
3, 1977 do . 31-Sept. 30 Various . . 15-Nov. 15 do . 15-Aug. 15 do . do do . 15-Nov. 15 do . do do . 15-Aug. 15 do . do do . 15-Nov. 15 do . do do . 15-Aug. 15 do . 30-Dec. 31 do . 15-Nov. 15 do . do do . 15-Aug. 15 do . 15-Nov. 15 do .
522, 522, 522, 522, 522, 522,
1,888, 688,
688, 688,
1,366, 125, 125, 125, 125, 125, 125, 125, 125, 125, 125, 125,
2,014,
,029,000 ,028,000 ,029,000 ,029,000 ,029,000 ,029,000 ,893,000 ,956,000 ,956,000 ,956,000 ,956,000 ,956,000 ,956,000 ,955,000 ,956,000 ,956,000 865,000 ,846,000 ,846,000 ,846,000 ,846,000 ,846,000 847,000 847,000 847,000
1,847,000 847,000 ,848,000
i,741,000
343,213,000 25,000,000 60,000,000
213,800,000 250,000,000 25,000,000 48,000,000
180,000,000 75,000,000
200,000,000 140,000,000 100,000,000 250,000,000 311,550,000
82,210,000 325,000,000
16,000,000
522,029,000 522,028,000 522,029,000 522,029,000 522,029,000 522,029.000
1,888.893.000 688.956,000 688,956,000 688.956.000 688.956.000 688,956,000 688,956,000 688,955,000 688,956,000 688,956,000
1,366,865,000 125,846,000 125,846,000 c/) 125,846,000 125,846,000 125,846,000
10,000,000
'i'oo,666,"obb
125,847,000 125,847,000 125,847,000 125.847.000 125.848.000
2.014.741.000
343.213,000 25.000.000 60.000.000
213.800.000 250,000,000
25,000,000 48,000,000
180.000,000 75,000,000
200,000,000 130,000,000 100,000,000 250,000,000 211,550,000
82,210,000 325,000,000
16,000,000
> 125,847,000 55
o
See footnotes at end of table. .
o vo
Digitized for FRASER http://fraser.stlouisfed.org/ Federal Reserve Bank of St. Louis

TABLE 28.—Description of public debt issues outstianding, Sept. 30, 1977—Continued
Description When redeemable
or payable' Interest payment
date
Average price received
(per $100) Amount retired
Amount outstanding
" Sept. 30, 1977*
INTEREST-BEARING ' - C o n . Nonmarketable—Continued
Govemment account series^—Continued Federal ship financing escrow fund:
BUls 10/6/77 BUls 10/13/77 BUls 10/18/77 BUls 10/20/77 BUls 10/27/77 BUls 11/3/77. . BUls 11/15/77 BUls 11/25/77 BUls 12/1/77 BUls 12/8/77 BUls 12/13/77 BUls 12/15/77 BUls 12/22/77 BUls 12/29/77 Bills 1/5/78 Bills 1/10/78 BUls 1/12/78 BUls 1/19/78 Bills 1/26/78 BUk 2/7/78 BUls 2/9/78 BUls 3/7/78 BUls 4/4/78 BUls 5/2/78 Bills 7/25/78 Bills 9/19/78 778% 1978 notes
Federal ship financing fund, fishing vessels, NOAA:
BUls 10/18/77 Federal ship financing revolving
fund: Bills 10/18/77 BUls 5/30/78 8% 1982 notes 8% 1983 notes 77.% 1982 notes 774% 1981 notes 7% 1981 notes 6% 1978 notes
. Various dates Oct. 6, 1977 Oct. 6. 1977 Various . . do Oct. 13. 1977 Oct. 13. 1977 do . do Oct. 18. 1977 O c t 18. 1977 do . do Oct. 20, 1977 Oct. 20. 1977 do . do Oct. 27, 1977 Oct. 27, 1977 do . do . . . . ; Nov. 3, 1977 Nov. 3, 1977 do . do Nov. 15, 1977 Nov. 15. 1977 do . do Nov. 25, 1977 Nov. 25. 1977 do . do Dec. 1, 1977 Dec. 1, 1977 do . do Dec. 8, 1977 Dec. 8, 1977 do . do .; Dec. 13, 1977 Dec. 13, 1977 . ' . . . do . do Dec. 15, 1977 Dec. 15, 1977 do . do Dec. 22, 1977 Dec. 22, 1977 do . do Dec. 29, 1977 Dec. 29, 1977 do . do Jan. 5. 1978 Jan. 5. 1978 do . do Jan. 10, 1978 Jan. 10. 1978 do . do Jan. 12. 1978 Jan. 12. 1978 do . do Jan. 19. 1978 Jan. 19. 1978 do . do Jan. 26. 1978 Jan. 26, 1978 do . do Feb. 7, 1978 Feb. 7, 1978 do . do Feb. 9, 1978 Feb. 9, 1978 do . do Mar. 7, 1978 Mar. 7, 1978 do . do Apr. 4, 1978 Apr. 4, 1978 do . do May 2, 1978 May 2, 1978 do . do July 25, 1978 July 25. 1978 do . do Sept. 19, 1978 Sept. 19, 1978 do .
.Mar . 3, 1976 May 15, 1978 May 15-Nov. 15 do .
. Oct. 18, 1977 Oct. 18, 1977..
. do
. d o
. do
. do
. do
. do
. do Feb. 15, 1981 Feb. 15-Aug. 15 do .
. do Nov. 15, 1978 May 15-Nov. 15 do .
. . . . . . do do
. May 30, 1978 May 30. 1 9 7 8 . . . .
. May 15. 1982 May 15-Nov. 15.
. Feb. 15. 1983 Feb. 15-Aug. 15 .
. Nov. 15. 1982 May 15-Nov. 15 .
. Nov. 15. 1981 do .
. d o . .
. d ^ .
. (To .
. do .
. do .
. do .
$30,595,000 800,000
4,970,000 3,205.000
21.955.000 14.075.000 47.750,000 3,500.000 ... 13.585.000 5.305.000 12.740.000
585.000 ... 7,830.000 3.400,000 ... 2,610,000 ...
117,620,000 780,000 ... 265,000 ...
2.015.000 ... 4.040.000 ... 8.550.000 ... 3.780.000 ... 11,100,000 ... 90.535.000 ... 96,345,000 ... 14,760,000 ... 33,520,000 ...
$12,270,000 20.000
3,235,000 180.000
3.485,000 195,000
11,050,000
i45,b(X) 165,000
8,140.000
70.000
12,010,000
$18,325,000 780,000
1,735,000 3,025.000 18,470.000 13.880.000 36.700.000 3.500.000 13.440.000 5.140.000 4.600.000 585.000
7.760.000 3.400,000 2.610.000
105.610.000 780.000 265.000
2,015.000 4,040.000 8,550.000 3.780.000 11.100.000 90.535.000 96.345.000 14.760.000 33.520.000
1,435,000
1,065,000 585,000
7,700,000 3,175,000
34,900,000 6.585,000 8.500,000 5.919.000
1.065.000 585,000
7,000,000 3,175,000
34,900,000 6.585,000 8,500,000 5,919,000
?0 tfl
s
o
tfl
ifi
[
o
H X tfl
tfl > c/3
po
Digitized for FRASER http://fraser.stlouisfed.org/ Federal Reserve Bank of St. Louis

Federal supplementary medical insurance trust fund: On demand; on
Certificates: June 30: 77.% Series 1978 Various dates: 1978
From Aug. 1, 1977.
. June 30-Dec. 31 Par.. 690,867,000
Notes: 67,% Series 1980 June 30, 1973..
1974.. Bonds:
77.% Series 1981 June 30, 77.% Series 1982 do 77.% Series 1983 do 77.% Series 1984 do 77,% Series 1985 do 77.% Series 1986 do 77.% Series 1987 do 77.% Series 1988 do 77.% Series 1989 do 77,% Series 1981 June 30, 1976.. 77,% Series 1982 do . . . . . . .77,% Series 1983 do 77,% Series 1984 do . . . . . . 77,% Series 1985 do 77,% Series 1986 do 77,% Series 1987 do 77,% Series 1988 do 77,% Series 1989 do 77,% Series 1990 do 77,% Series 1991 do 77.% Series 1981 June 30, 77.% Series 1982 do 77,% Series 1983 do 77,% Series 1984 do 77.% Series 1985 do 77.% Series 1986 do 77.% Series 1987 do 77.% Series 1988 do 77.% Series 1989 do 77.% Series 1990 do 77.% Series 1978 June 30, 1977.. 77.% Series 1979 do 77.% Series 1981 do 77.% Series 1982 do 77.% Series 1983 do 77.% Series 1984 do 77.% Series 1985 do
1975..
Redeemable after 1 year from date of issue and payable on June 30:
. 1980 do On demand; on
June 30: . 1981 do . 1982 do . 1983 do . 1984 do . 1985 do . 1986 do . 1987 do . 1988 do . 1989 do . 1981 do . 1982 do . 1983 do . 1984 do . 1985 do . 1986 do . 1987 do . 1988 .* do . 1989 do . 1990 do . 1991 do . 1981 do . 1982 do . 1983 do . 1984 do . 1985 do . 1986 do . 1987 do . 1988 do . 1989 do . 1990 do . 1978 do . 1979 do . 1981 do . 1982 do . 1983 do . 1984 do . 1985 do
do .
do . do . do . do . do . do . do . do . do . do . do . do . do . do . do . do . do . do . do . do . do . do . do . do . do . do . do . do . do . do . do . do . do . do . do . do . do .
281,762,000
61,964,000 61,964,000 61,964,000 61,964,000 61,964,000 61,963,000 61,963,000 61,963,000 61,963,000
8,060,000. 8,060.000 8,061.000 8,061.000 8.061.000 8.061.000 8.061.000 8.061.000 8.061,000 8,060,000
81,570.000 11,547,000 11,547,000 11.546,000 11,546.000 11,546,000 11,547,000 11,547,000 11,547,000 11,547.000 73,510,000
137,817,000 137,817,000 56,246,000 56,245.000 56.245.000 56,245.000 56.245.000
649.632,000
3,940,000
41,235,000
277,822,000
61,964.000 61.964.000 61.964.000 61.964,000 61,964,000 61.963,000 61,963,000 61,963,000 61,963,000
8,060,000 8,060,000 8,061.000 8.061.000 8.061.000 8,061,000 8,061.000 8,061,000 8.061,000 8,060,000
81,570,000 11,547,000 11,547,000 11,546,000 11,546,000 11,546,000 11,547.000 11.547.000 11.547.000 11.547.000 73.510.000
121,411.000 137.817,000 56,246,000 56.245,000 56,245.000 56,245.000 56,245.000
C/3
H GO
H O
> r > tfl z o
See footnotes at end of table.
Digitized for FRASER http://fraser.stlouisfed.org/ Federal Reserve Bank of St. Louis

TABLE 28.—Description of public debt issues outstanding. Sept, 30, 1977—Continued t o
Description When redeemable
or payable' Interest payment
date
Average price received
(per $100) Amount retired
Amount
outstanding Sept. 30. 1977*
INTEREST-BEARING ' - C o n . Nonmarketable—Continued . Govemment account series^—Continued
Federal supplementary medical insurance trust fund—Continued
Bonds—Continued 77.% Series 1986 77.% Series 1987 77,% Series 1988 77,% Series 1989 77.% Series 1990 77.% Series 1991 77.% Series 1992
Foreign service retirement fund: Certificates:
77.% Series 1978
7% Series 1978....-
Notes: 67.% Series 1980 574% Series 1979
Bonds: 77,% Series 1984 77.% Series 1985 77,% Series 1986 77,% Series 1987 77,% Series 1988 778% Series 1989 77 ,% Series 1981 77,% Series 1982 77,% Series 1983 77,% Series 1984 77,% Series 1985.-77,% Series 1986 77,% Series 1987 77,% Series 1988 77,% Series 1989 77,% Series 1990
June 30. 1977 do do do do do do
Various dates: From Aug. 1. 1977.
From July 1. 1977.
June 30. 1973 June 30. 1972
June 30. 1974 do do do do do
June 30. 1976 do do do do do do do do do
1986 •. 1987
1988 1989 1990 1991 1992
1978
do
Redeemable after 1 year from date of issue and payable on June 30:
1980 1979 On demand; on
June 30: 1984 1985 1986 1987 1988 1989 1981 1982 1983 1984 1985 1986 1987 1988 1989 1990
June 30-do do do do do do
do
do
do do
do do do do do do do do do do do do do do do do
June 30-Dec. 31 Par..
. do .
. do .
. do .
. do .
. do .
. do ,
. do ,
. do .
. do .
. do .
. do .
. do .
. do .
. do .
. do .
. do .
. do .
. do .
. do .
. do .
. do .
. do .
. do .
$56,245,000 56,245.000 56,245,000 56,245,000 56,246,000 56,246,000
137,816.000
4.000.000
8P,986,000
$1,418,000
15,764,000
$56,245,000 56,245,000 56,245,000 56,245,000 56,246,000 56,246,000
137,816,000
2,582,000
66,222,000
?e tfl
s 5 H
§ H
GO
po
11,192,000 9,125.000
6,992,000 6,992,000 6,992,000 6,992,000 6,992,000 6,991,000 2,792,000 2,792,000 2,792,000 2,792,000 2,793,000 2,792,000 2,792,000 2,792,000 2,792,000 2,792,000
11,192,000 9,125,000
6,992,000 6,992,000 6,992,000 6,992,000 6,992,000 6,991,000 2,792,000 2,792,000 2,792,000 2,792,000 2,793,000 2,792,000 2,792,000 2,792,000 2,792,000 2,792,000
21 >
po
O H X tfl H po tfl > c/3 C po
Digitized for FRASER http://fraser.stlouisfed.org/ Federal Reserve Bank of St. Louis

1975.. 77,% Series 1991 do 77,% Series 1981 June 30, 77,% Series 1982 do 77.% Series 1983 do 77.% Series 1984 do 77.% Series 1985 do 77.% Series 1986 do 77,% Series 1987 do 77,% Series 1988 do 778% Series 1989 do 77.% Series 1990 do 77.% Series 1978 June 30, 1977.. 77.% Series 1979 do 77.% Series 1981 do 77,% Series 1982 do 77.% Series 1983 do 77.% Series 1984 do 778% Series 1985 do 778% Series 1986 do 77.% Series 1987 do 77.% Series 1988 do 77.% Series 1989 do 77.% Series 1990 do 77.% Series 1991 do 77.% Series 1992 do
. do .
. do .
. do ,
. do .
. do .
. do .
. do .
. do ,
. do ,
. do ,
. do .
. do ,
. do ,
. do ,
Aug. 15, 1995 Feb. 15-Aug. 15 Various .
4% Series 1980 do 1980.. 4% Series 1981 do 1981.. 4% Series 1982 do 1982.. 4% Series 1983 do 1983..
General post fund. Veterans Administration:
87.% 1995-00 bonds May 3, 1977 GSA participation certificate
trust: 7.125% 1978 notes Various dates May 15, 1978 May 6.875% 1978 notes do July 31, 1978 Jan.
Notes: 8.30% Series 1979 July 22, 1974 On July 22, 1979 '• Jan.
Gifts and bequests. Commerce: Bills 11/15/77 Various dates Nov. 15, 1977 Nov.
Redeemable after 1 year from issue date and
Govemment life insurance fund: payable on Notes: " June 30:
674% Series 1980 June 30, 1973 1980 June 57,% Series 1978 June 30, 1971 1978 574% Series 1979 June 30, 1972 1979
. do .
. do ,
. do ,
. do .
. do ,
. do ,
. do ,
. do ,
. do .
. do .
. do .
. do .
. do ,
. do .
. do .
. do .
. do .
. do .
. do .
. do .
. do .
. do .
. do .
. do .
. do .
. do .
. do .
. do .
. do .
. do .
. do .
. do .
. do .
. do .
. do .
. do .
. do .
. do .
. do .
. do .
. do .
. do .
. do .
. do .
15-Nov. 15 do . 31-July 31 do .
22-July 22 Par
15, 1977 Various.
30-Dec. 31 Par. do do
13,131,000 7,323,000 7,323,000 7,323,000 3,348,000 3,347,000 3,347,000 3,347,000 3,347,000 3,348,000
10.339.000 9.398.000 2.067.000
312.000 312.000 312.000 312.000 312.000 313.000 313.000 313.000 313.000 313.000 313.000
13.444.000 3.017.000 3.017,000 3,017.000 3.017,000 3,017,000
332,000
1,827,000 25,100,000
45,000,000
45,000
46,875,000 111,949,000 32,152,000
1,796,000 13,180,000
40,437,185
13,131,000 7,323,000 7,323,000 7,323,000 3,348,000 3,347,000 3,347,000 3,347,000 3,347,000 3,348,000
10,339,000 9,398,000 2,067,000
312,000 312,000 312,000 312,000 312,000 313,000 313,000 313,000 313,000 313,000 313,000
13,444,000 3.017,000 3.017.000 3.017,000 3,017.000 3.017.000
332.000
31.000 11.920.000
4.562.815
45.000
46.875.000 111.949.000 32.152.000
C/3
H
H
9 r > tfl z g
See footnotes at end of table.
U>
Digitized for FRASER http://fraser.stlouisfed.org/ Federal Reserve Bank of St. Louis

TABLE 28.—Description of public debt issues outstanding. Sept, 30, 1977—Continued
Description When redeemable
or payable' Interest payment
date
Average price received
(per $100) Amount retired
Amount outstanding
Sept. 30. 1977»
INTEREST-BEARING ' - C o n . Nonmarketable—Continued .
Govemment account series^—Continued Govemment life insurance fund—Continued
Bonds: 774% Series 1981 774% Series 1982 774% Series 1983 774% Series 1984 774% Series 1985 774% Series 1986 774% Series 1987 774% Series 1988 774% Series 1989 7% Series 1981 7% Series 1982 7% Series 1983 7% Series 1984 7% Series 1985 7% Series 1986 7% Series 1987 7% Series 1988 7% Series 1989 7% Series 1990 7% Series 1991 67«% Series 1981 674% Series 1982 674% Series 1983 674% Series 1984 674% Series 1985 674% Series 1986 674% Series 1987 674% Series 1988 67,% Series 1989 674% Series 1990 67,% Series 1 9 8 1 . . . . .
• 67,% Series 1982 67,% Series 1983 67,% Series 1984 67,% Series 1985 67,% Series 1986 67,% Series 1987 67,% Series 1988
On demand; on June 30:
. June 30, 1974 1981.. do 1982.. do 1983.. do 1984.. do 1985.. do 1986.. do 1987.. do 1988.. do 1989..
.June 30, 1976 1981.. do 1982.. do 1983.. do 1984.. do 1985.. do 1986.. do 1987.. do 1988.. do 1989.. do 1990.. do 1991..
. June 30. 1975 1981.. do 1982.. do 1983.. do 1984.. do 1985.. do 1986.. do 1987.. do 1988.. do 1989.. do 1990..
. June 30, 1977 1981.. . do , . do . do . do . do . do . do
. June 30-Dec. 31 Par..
1982.. 1983.. 1984.. 1985..
. do .
. do .
. do .
. do .
. do .
. do .
. do .
. do .
. do .
. do .
. do .
. do .
. do .
. do .
. do .
. do .
. do .
. do .
. do .
. do .
. do .
. do .
. do .
. do .
. do .
. do .
. do .
. do .
. do .
. do .
. do .
. do .
. do .
. do .
. do .
. do .
. do .
. do .
. do .
. do .
. do .
. do .
. d o .
. do .
. do .
. do .
. do .
. do .
. do .
. do .
. do .
. do .
. do .
. do .
. do .
. do .
. do .
. do .
. do .
. do .
. do .
. do .
. do .
. do .
. do .
. do .
. do .
. do .
. do .
. do .
. do .
. do .
. do .
. do .
$3,879,000 3,879.000 3.879.000 3,879.000 3.879,000 3,879,000 3,879,000 3,879.000 3,878.000 5,377.000 5,377,000 5,377,000 5,377.000 5,377.000 5,377,000 5,377,000 5.377,000 5,377,000 5,376,000
17.966.000 8.711.000 8.711.000 8.711.000 8.711.000 8.711.000 8.711.000 8,711.000 8.711.000 8.712,000
12.590.000 4.463.000 4.463,000 4,463,000 4,463,000 4,463,000 4,463,000 4,463,000 4,462,000
$3,879,000 3.879,000 3.879,000 3,879,000 3,879,000 3,879,000 3,879,000 3,879,000 3,878.000 5.377,000 5,377.000 5.377.000 5.377.000 5.377.000 5.377.000 5.377.000 5,377.000 5.377.000 5.376.000 •
17.966.000 8.711.000 8.711.000 8.711.000 8.711,000 8.711.000 8.711.000 8,711.000 8,711.000 8.712.000
12,590.000 4.463.000 4,463,000 4,463,000 4,463,000 4,463,000 4,463,000 4.463.000 4.462.000
"70 tfl
O
o
tfl c/3
po
21 > o
tfl H 7i tfl > c/3 c 70
Digitized for FRASER http://fraser.stlouisfed.org/ Federal Reserve Bank of St. Louis

67,% Series 1989 do 67,% Series 1990 do 67,% Series 1991 do 67,% Series 1992 do 474% Series 1978 June 30, 1967.... 474% Series 1979 do 37,% Series 1978 Various dates:
From June 30, 1964.
Govemment National Mortgage Association:
BUls 10/3/77 Various dates . . . , Bills 10/6/77 do Bills 10/10/77 do BUls 10/11/77 do BUls 10/18/77 do Bills 12/1/77 do Bills 12/12/77 do Bills 12/23/77 do Bills 1/19/78 do Bills 2/1/78 do Bills 2/14/78 do Bills 4/3/78 do Bills 4/6/78 do Bills 4/8/78 do BUls 6/1/78 do Bills 6/27/78 do Bills 7/3/78 do Bills 7/19/78 do Bills 8/14/78 do 87.% 1982 notes do 8% 1982 notes do 77.% 1982 notes do 77.% 1986 notes do 77«% 1981 notes do 77.% 1981 notes do 77.% 1981 notes do 774% 1984 notes do 774% 1984 notes do 77,% 1978 notes do 7% 1981 notes do 7% 1981 notes do 7% 1983 notes do 67.% 1978 notes do 67.% 1978 notes do 67.% 1980 notes do 67.% 1980 notes do 674% 1978 notes do 67.% 1977 notes do 67.% 1979 notes do
. 1989..
. 1990..
. 1991..
. 1992..
. 1978..
. 1979.. 1978..
.Oc t . 3, 1977 Oct.
. Oct. 6, 1977 Oct.
. Oct. 10. 1977 Oct.
.Oc t . 11. 1977 Oct.
. Oct. 18. 1977 Oct.
. Dec. 1. 1977 Dec.
. Dec. 12. 1977 Dec.
. Dec. 23. 1977 I>ec.
. Jan . 19. 1978 Jan.
. Feb. 1. 1978 Feb.
. Feb. 14. 1978 Feb.
. Apr. 3. 1978 Apr.
. Apr. 6. 1978 Apr.
. Apr. 8. 1978 Apr.
. June 1. 1978 June
. June 27. 1978 June
. Ju ly 3. 1978 July
. Ju ly 19. 1978 July
. Aug. 14. 1978 Aug.
. A u g . 15. 1982 Feb.
. May 15. 1982 May
. Nov. 15. 1982
. May 15. 1986
. Nov. 15. 1981
. Feb. 15, 1981 Feb.
. May 15, 1981 May
. Feb. 15, 1984 Feb.
. Aug. 15, 1984
. May 15, 1978 May
. Feb. 15, 1981 Feb.
. Nov. 15, 1981 May
. Nov. 15, 1983
. June 30, 1978 June
. Ju ly 31, 1978 Jan.
. May 15, 1980 May
. Sept. 30, 1980 Mar.
. Mar. 31, 1978
. Nov. 30, 1977 May
. Aug. 31, 1979 Feb.
. do .
. do .
. do .
. do .
. do .
. do .
. do .
. do .
. do .
. do .
. do .
. do .
. do .
. do ,
3, 1977 Various . . 6, 1977 do . 10, 1977 do . 11, 1977 do . 18, 1977 do . 1, 1977 do . 12, 1977 do . 23, 1977 do .
19, 1978 do . 1, 1978 do . 14, 1978 do . 3, 1978 do . 6, 1978 do . 8, 1978 do . 1, 1978 do . 27, 1978 do . 3, 1978 do . 19, 1978 do . 14, 1978 do . 15-Aug. 15 do . 15-Nov. 15 do . do do . do do . do do . 15-Aug. 15 do . 15-Nov. 15 do . 15-Aug. 15 do . do do . 15-Nov. 15 do . 15-Aug. 15 do . 15-Nov. 15 do . do do . 30-Dec. 31 do . 31-July 31 do . 15-Nov. 15 do . 31-Sept. 30 do . do do . 31-Nov. 30 do . 28-Aug. 31 do .
4,462,000 4,463,000 4.463,000
22,429,000 25,556,000
2,912,000 48,214.000 $10,941,000
4.462.000 4.463.000 4.463.000
22.429.000 25.556.000
2,912.000 37.273.000
4,835.000 5.100,000 2,555,000 8,250,000
10,580,000 12,335,000 11,200,000 5,020,000
14,290,000 5,270,000
15,935,000 6.360.000
145.000 120,000
1,765,000 1,805,000 6,620,000 4,155,000
32.680,000 24.261,000 26,299,000 15,677,000 18,553,000 41,787,000
4,835.000 5,100.000 2,555,000 8,250.000
10,580.000 12.335.000 11.200.000 5.020.000
14.290.000 5.270,000
15,935,000 6,360,000
145,000 120,000
1,765,000 1,805.000 6.620.000 4.155.000
32.680.000 24.261.000 26.299.000 15.677.000 18,553,000 41,787.000
29.875.000 493.000 29.382.000 33.648.000 23.527.000 9,232,000
13,468,000 38,493,000 66.487.000
33.648.000 23.527.000 9.232.000
13.468.000 38.493.000 66,487.000
49.776.000 2.079.000 47.697.000 30.210.000 77,025.000 12.777.000 12.222,000 16.250.000 11.788,000 13,410,000
30.210.000 177.025.000 12.777.000 12.222.000 16.250.000 11.788.000 13.410.000
r/3 H > H , j
P I ' > T l ^ tfl
z 0 X
See footnotes at end of table.
KJ\
Digitized for FRASER http://fraser.stlouisfed.org/ Federal Reserve Bank of St. Louis

TABLE 28.—Description of public debt issues outstanding. Sept, 30, 1977—Continued o\
Description When redeemable
or payable'
Interest payment date
Average price received
(per $100) Amount retired
Amount
outstanding Sept. 30. 1977»
INTEREST-BEARING ' - C o n . Nonmarketable—Continued
Govemment account series^—Continued Govemment National Mortgage
Association—Continued 67,% 1979 notes 67,% 1978 notes 67,% 1980 notes 67,% 1978 notes 674% 1978 notes 674% 1978 notes 674% 1979 notes 674% 1979 notes 67.% 1979 notes 57.% 1979 notes 57.% 1980 notes 7% 1981 bonds ^ . % 1982 bonds 67,% 1984 bonds 67,% 1986 bonds
Govemment National Mortgage Association. MBS investment account:
8% 1982 notes 77,% 1982 notes 77,% 1986 notes 774% 1981 notes 77,% 1981 notes 77,% 1981 notes 774% 1984 notes 774% 1984 notes 7% 1979 notes 7% 1981 notes 7% 1981 notes 7% 1983 notes 67,% 1980 notes 67,% 1980 notes 67,% 1984 bonds
Harry S. Truman memorial scholarship fund:
Bills 10/6/77 8% 1983 notes 77,% 1986 notes 774% 1981 notes 874% 1990 bonds 77,% 1988-93 bonds
.Mar. 14. 1977 Nov. 15, 1979 May 15-Nov. 15 Var ious . .
.Various dates Apr. 30, 1978 Apr. 30-Oct. 31 do .
. Aug. 1, 1977 Feb. 15, 1980 Feb. 15-Aug. 15 do .
. Nov. 12, 1976 Jan. 31, 1978 Jan. 31-July 31 do .
. Various dates Feb. 15, 1978 Feb. 15-Aug. 15 do .
. June 1, 1977 Sept. 30, 1978 Mar. 31-Sept. 30 do .
. Various dates Aug. 15, 1979 Feb. 15-Aug. 15 do .
.Dec . 1, 1976 Nov. 15, 1979 May 15-Nov. 15 do .
.Various dates May 31, 1979 May 31-Nov. 30 do .
. May 2, 1977 Apr. 30, 1979 Apr. 30-Oct. 31 do .
. Various dates Dec. 31, 1980 June 30-Dec. 31 do . do Aug. 15, 1981 Feb. 15-Aug. 15 do . do Feb. 15, 1982 do do . do Aug. 15, 1984 do do .
.Jan. 3, 1977 Nov. 15, 1986 May 15-Nov. 15 do .
.July 22, 1975 May 15, 1982 do ,
. Various dates Nov. 15. 1982 do ,
.May 18. 1976 May 15. 1986 do .
. Nov. 20. 1975 Nov. 15. 1981 do .
. do .
. do .
. do .
. do . . July 27. 1976 Aug. 15. 1981 Feb. 15-Aug. 15 do . . Various dates Feb. 15. 1981 do do . . May 11. 1977 Feb. 15. 1984 do do . . Sept. 22. 1977 Aug. 15, 1984 do do , . Jan. 19, 1976 Nov. 15, 1979 May 15-Nov. 15 do , . Various dates Feb. 15, 1981 Feb. 15-Aug. 15 do . .July 21, 1977 Nov. 15, 1981 May 15-Nov. 15 do , . Various dates Nov. 15, 1983 do do , . Sept. 17, 1976 Sept. 30, 1980 Mar. 31-Sept. 30 do , . Feb. 28, 1977 Feb. 15, 1980 Feb. 15-Aug. 15 do , . Oct. 29, 1976 Aug. 15, 1984 do do
. Various dates Oct. 6, 1977 Oct. 6, 1977 do . do Feb. 15, 1983 Feb. 15-Aug. 15 do . do May 15, 1986 May 15-Nov. 15 do . do Nov. 15, 1981 do do .
. Aug. 6, 1976 May 15, 1990 do do .
. Various dates Aug. 15, 1988 Feb. 15-Aug. 15 do .
$8,702,000 94,145,000
3.115,000 5,320,000
37,062,000 3.155.000 4.145,000 4.170,000
12.970.000 3,150.000 1.302.000 1.541.000 3,812,000 7,689,000 1,716,000
986,000 4,331,000 2.407,000 1,107.000 1,238,000 5,440,000 2,367,000 2,178,000
993,000 1,878,000 2,692,000 7,293,000 2,289,000 3,505,000 1,934,000
1,540,000 5,000,000 5,000,000 5,000,000 9,673,000 5,000,000
$3,023,000
$8,702,000 94,145,000
3,115,000 5,320,000
37,062,000 3,155,000 4,145,000 4,170,000
12,970,000 3,150,000 1,302,000 1,541,000 3,812,000 7,689,000 1,716,000
986,000 4,331,000 2,407,000 1,107,000 1,238,000 2,417,000 2,367.000 2.178.000
993.000 1.878.000 2.692.000 7.293.000 2.289.000 3.505.000 1.934.000
1.490,000 5,000,000 5,000,000 5,000,000 9,673,000 5,000,000
po tfl • O J« H O
H X tfl c/3 tfl O
O ^ H X tfl H 70 tfl" > c/3 C 70
Digitized for FRASER http://fraser.stlouisfed.org/ Federal Reserve Bank of St. Louis

Highway trust fiind: On demand; on Certificates: June 30:
67.% Series 1978 Various dates: 1978 From Aug. 11, 1977.
674% Series 1978 From June 30, do 1977.
Indian money proceeds of labor. Bureau of Indian Affairs:
BUls 10/20/77 Various dates Oct. 20, 1977 Oct. Indian tribal funds. Bureau of
Indian Affairs: Bills 10/6/77 do Oct. 6, 1977 Oct. Bills 10/13/77 do Oct. 13, 1977 Oct.
Individual Indian money: BUls 10/6/77 do Oct. 6, 1977 Oct. BUls 10/13/77 do Oct. 13, 1977 , . . . . ' Oct. 8% 1986 notes Aug. 16, 1976 Aug. 15, 1986 Feb. 67«% 1980 notes Various dates May 15, 1980 May
Japan-U.S. friendship trust fund: Bills 10/18/77 do Oct. 18, 1977 Oct. BUls"12/8/77 do Dec. 8, 1977 Dec. Bills 3/9/78 do Mar. 9, 1978 Mar. Bills 3 /16 /78 . . . do Mar. 16, 1978 Mar.
Judicial survivors annuity fund: 87,% 1994-99 bonds do May 15. 1994 May 87,% 1995-00 bonds do Aug. 15. 1995 Feb. 874% 2000-05 bonds do May 15, 2000 May 8% 1996-01 bonds do Aug. 15, 1996 Feb. 778% 2002-07 bonds , . . . do Feb. 15, 2002
Library of Congress tmst fund: 87,% 1994-99 bonds Jan. 7, 1975 May 15, 1994 May
Low-rent public housing, HUD: BUls 10/6/77 Various dates Oct.. 6, 1977 Oct. BUls 10/13/77 do Oct. 13, 1977 Oct. Bills 10/20/77 do Oct. 20, 1977 Oct.
National Archives gift fund: Bills 10/18/77 do Oct. 18, 1977 Oct. Bills 11/15/77. do Nov. 15, 1977 Nov. Bills 12/13/77 do Dec. 13, 1977 Dec. Bills 12/22/77 do Dec. 22, 1977 Dec. Bills 7/25/78 do July 25, 1978 July
National Archives trust fund: Bills 10/18/77 do Oct. 18, 1977 Oct. BUls 12/22/77 . d o Dec. 22, 1977 Dec. BUls 1/19/78 do Jan. 19, 1978 Jan. BUls 7/25/78 do July 25, 1978 July BiUs 9/19/78 do Sept. 19, 1978 Sept.
See footnotes at end of table.
June 30-Dec. 31 Par..
20, 1977 Various.
6, 1977 do . 13, 1977 do .
6, 1977 do . 13, 1977 do . 15-Aug. 15 do . 15-Nov. 15 do .
18, 1977 do . 8, 19.77 do . 9, 1978 do . 16, 1978 do .
15-Nov. 15 do . 15-Aug. 15 do . 15-Nov. 15 do . 15-Aug. 15 do . do do .
15-Nov. 15 do .
6, 1977 do . 13, 1977 do . 20, 1977 do .
18, 1977 do . 15, 1977 do . 13, 1977 do . 22, 1977 do .
25, 1978 do .
18, 1977 do . 22, 1977 do .
19, 1978 do . 25, 1978 do .
19, 1978 do .
1.407.331.000
10.488.286.000
400.000
3.530,000 2.55O.0O0
2.525.000 1.635.000
300.000 1.000.000
6.355.000 4.030.000 3.250.000 5.490.000
2.157.000 29.174.000
998.000 222.000 550.000
1.340.000
25.000,000 15,000,000 30,000,000
10,000 50,000
100,000 105,000 155,000
1,050,000 590,000
1,070,000 300,000 500,000
1,816,930,000
1,160,000
""756,'obb
200,000
1,407,331,000
8,671,356,000
400,000
3,530,000 2,550,000
1,365,000 1,635,000 300,000 250,000
6,355,000 4,030,000 3,250,000 5,490,000
2,157,000 29,174,000
998,000 222,000 550,000
1,340,000
25,000,000 15,000.000 30.000.000
10.000 50.000 100.000 105,000 155,000
850,000 590,000
1,070,000 300,000 500,000
if)
H > H c/3 H 0 > I ' >
^ rfl
^ X
Digitized for FRASER http://fraser.stlouisfed.org/ Federal Reserve Bank of St. Louis

TABLE 28.—Description of public debt issues outstanding. Sept, 30, 1977—Continued
Description Date When redeemable
or payable'
Interest payment date
Average price received
(per $100) Amount retired
Amount outstanding
Sept. 30, 1977»
0 0
INTEREST-BEARING ' - C o n . Nonmarketable—Continued
Govemment account series^—Continued National Credit Union share insurance ftmd, NCUA:
8y«% 1978 notes 87.% 1978 notes 87.% 1982 notes 8% 1982 notes 8% 1983 notes 8% 1986 notes 77,% 1982 notes 77.% 1986 notes 77.% 1981 notes 7Vi% 1977 notes 77,% 1979 notes 77,% 1977 notes. 77.% 1978 notes 7% 1979 notes 7% 1983 notes 67.% 1978 notes 67.% 1978 notes 67.% 1978 notes 67,% 1977 notes 67,% 1978 notes 67«% 1978 notes 57.% 1978 notes 57.% 1980 notes 574% 1978 notes 57«% 1978 notes 77«% 1992 bonds 37,% 1980 bonds
National insurance development fund, HUD:
BUls 11/15/77 8% 1986 notes 77,% 1978 notes 77.% 1978 notes , 77,% 1977 notes 7% 1979 notes 67.% 1978 notes 674% 1978 notes
.May 3, 1977 Aug. 15, 1978..
. Jan . 18, 1977 D e c . 3 1 , 1978..
. Jan . 11, 1977 Aug. 15, 1982.. do May 15, 1982..
. Various dates Feb. 15, 1983 . . do Aug. 15, 1986..
. Jan . 19. 1977 Nov. 15. 1982..
. Various dates May 15, 1986 . .
. F e b . 3, 1977 Nov. 15, 1981..
.Sept. 21, 1976 Oct. 31, 1977...
. F e b . 1, 1977 Dec. 31, 1979..
. D e c . 14, 1976 Dec. 31, 1977..
.Apr . 5. 1977 May 15. 1978. .
.Feb . 1. 1977 Nov. 15, 1979..
. Various dates Nov. 15, 1983..
. M a y 3, 1977 June 30, 1978. . do July 31, 1978...
.Mar . 2, 1977 Mar. 31, 1978..
.Various dates Nov. 30, 1977..
.Mar . 8, 1977 Apr. 30, 1978..
.May 3. 1977 Sept. 30, 1978..
. Jan. 27. 1977 Oct. 31. 1978...
. Various dates Dec, 31. 1980..
. Jan . 24. 1977 Nov. 30, 1978.. . . Jan . 27, 1977 Dec. 31, 1978.. .. Various dates Aug. 15, 1992.. .. Feb. 7, 1977 Nov. 15, 1980..
. Feb. 15-Aug. 15 Various . .
. June 30-Dec. 31 do .
. Feb. 15-Aug. 15 do .
. May 15-Nov. 15 do .
..Feb. 15-Aug. 15 do .
. May . do . . do .
. Apr.
. June
. May
15-N6V.. 15' db . do do . do do . 30-Oct. 31 do . 30-Dec. 31 do . do do . 15-Nov. 15 do . do do .
. June
. Jan.
. Mar.
. May
. Apr.
. Mar.
. Apr.
. June
. May
. June
. Feb.
. May
. do , . do . 30-Dec. 31 do . 31-July 31 do . 31-Sept. 30 do . 31-Nov. 30 do . 30-Oct. 31 do . 31-Sept. 30 do . 30-Oct. 31 do . 30-Dec. 31 do . 31-Nov. 30 do . 30-Dec. 31 do . 15-Aug. 15 do . 15-Nov. 15 do .
.Various dates Nov. 15, 1977 Nov. 15, 1977 do .. do Aug. 15, 1986 Feb. 15-Aug. 15 do . .
.May 2, 1977 May 15, 1978 May 15-Nov. 15 do . .
.Various dates Aug. 15, 1978 Feb. 15-Aug. 15 do . .
.N ov . 1, 1976 Oct. 31, 1977 Apr. 30-Oct. 31 do . .
. F e b . 15, 1977 Feb. 15, 1979 Feb. 15-Aug. 15 do . .
.Apr . 1, 1977 Mar. 31, 1978 Mar. 31-Sept. 30 do ..
.Feb . 15, 1977 Feb. 15, 1978 Feb. 15-Aug. 15 , do ..
$1,000,000 1,000,000 5,000,000 5,000,000 5.700.000
11,000,000 2,000,000
10;980,000 1.000,000 2,000.000 2,000,000 2,000,000 1,000,000 1,000,000
10.900.000 1,000.000 1.000.000 1,000,000 2,500.000 1,250.000 1.000.000 1,000.000 2.000.000 1,000,000 1.000,000
11,100,000 1,000,000
$1,000,000 1,000,000 5,000.000 5.000.000 5.700,000
11.000.000 2,000.000
10,980.000 1,000,000 2,000,000 2,000.000 2,000.000 1,000.000 1.000,000
10.900,000 1.000.000 1.000.000 1,000.000 2,500.000 1.250.000 1.000.000 1.000.000 2,000.000 1,000,000 1,000,000
11,100,000 1.000.000
7,000,000 $1,600,000 5.400.000 31.620,000
1,500,000 18,295,000 4.000,000 5,000,000 2,000,000 5,000,000
31,620.000 1,500,000
18,295,000 4,000,000 5,000,000 2,000,000 5.000.000
rfl ^ 0 70 H
% H X rfl
n w m H > po H?
y ^ H^
X tfl
tfl > i f i
Digitized for FRASER http://fraser.stlouisfed.org/ Federal Reserve Bank of St. Louis
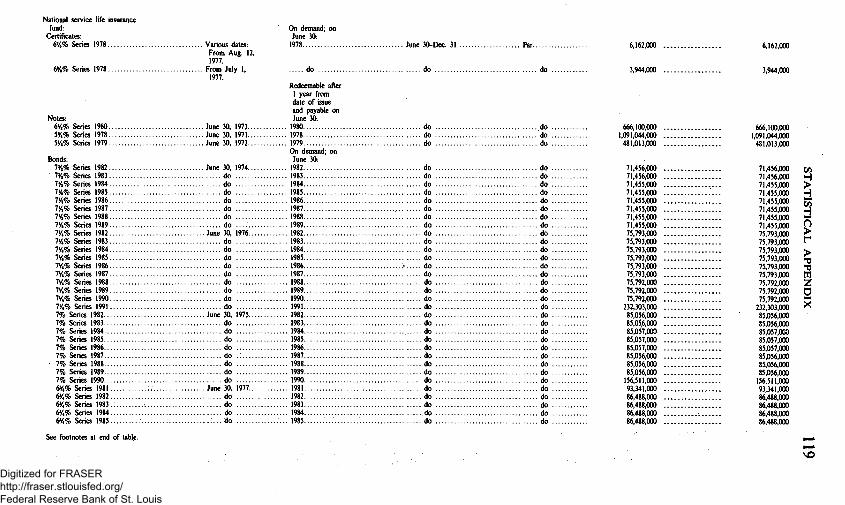
National service life insurance fund:
Certificates: 67.% Series 1978 Various dates:
From Aug. 12. 1977.
67.% Series 1978 From July 1. 1977.
Notes: 67,% Series 1980 June 30. 1973.. 574% Series 1978 June 30, 1971.. 57,% Series 1979 June 30, 1972..
, 1976..
Bonds: 77,% Series 1982 June 30, 1974.. 77,% Series 1983 do 77,% Series 1984 do 77,% Series 1985 do 77,% Series 1986 do 77,% Series 1987 do 77,% Series 1988 do 77,% Series 1989 do 774% Series 1982 June 30, 774% Series 1983 do 774% Series 1984 do 774% Series 1985 do 774% Series 1986 do 774% Series 1987 do 774% Series 1988 do 774% Series 1989 do 774% Series 1990 do 774% Series 1991 do 7% Series 1982 June 30, 7% Series 1983 do , 7% Series 1984 do , 7% Series 1985 do , 7% Series 1986... do , 7% Series 1987 do , 7% Series 1988 do , 7% Series 1989 do , 7% Series 1990..; do , 674% Series 1981 June 30, 674% Series 1982 do , 674% Series 1983.: do , 674% Series 1984 do 674% Series 1985. . . ; . . . do
1975..
, 1977..
On demand; on June 30:
1978
do
Redeemable after 1 year from date of issue and payable on June 30:
1980 1978 . 1979 On demand; on
June 30: 1982 1983 1984
1985 1986 1987 1988 1989 . . . 1982 1983 1984 1985 1986 . . . 1987 1988 1989 1990 1991
1982 1983 1984 1985 1986 1987 1988 1989 1990 . . . 1981 1982 1983 1984 1985
June 30-
do
do do
. . . do
do do
. d o do do do do do do do do do
• . do do do do do do do do do do do do do do do do do do do do
30-Dec. 31 Par
do .
do . do . do .
do . do . do . do . do . do . do . do . do . do . do . do . do . do . do . do . do . do . do . do . do . do . do . do . do . do . do . do . do . do . do . do .
6,162,000
3,944,000
666.100,000 1,091,044,000
481,013,000
71.456,000 71,456.000 71.455.000 71.455.000 71.455.000 71.455,000 71,455,000 71,455,000 75,793,000 75.793.000 75.793.000 75.793.000 75.793.000 75.793.000 75.792,000 75,792,000 75,792,000
232,303,000 85,056,000 85,0516,000 85,057.000 85.057,000 85,057,000 85,056,000 85,056,000 85,056,000
156,511,000 93,341,000 86,488.000 86.488,000 86.488.000 86.488,000
6,162,000
3,944,000
666.100,000 1.091.044.000
481.013.000
71.456.000 71.456.000 71.455.000 71.455.000 71.455.000 71.455.000 71.455.000 71.455.000 75.793.000 75.793,000 75,793.000 75.793,000 75,793,000 75.793.000 75.792.000 75,792,000 75.792.000
232.303.000 85,056.000 85.056,000 85,057,000 85,057,000 85.057.000 85,056,000 85,056,000 85,056.000
156.511.000 93.341,000 86,488,000 86.488.000 86.488,000 86,488,000
ifi H > H C/3 H
r > T) ^ tfl
z 0 X
See footnotes at end of table.
VO
Digitized for FRASER http://fraser.stlouisfed.org/ Federal Reserve Bank of St. Louis
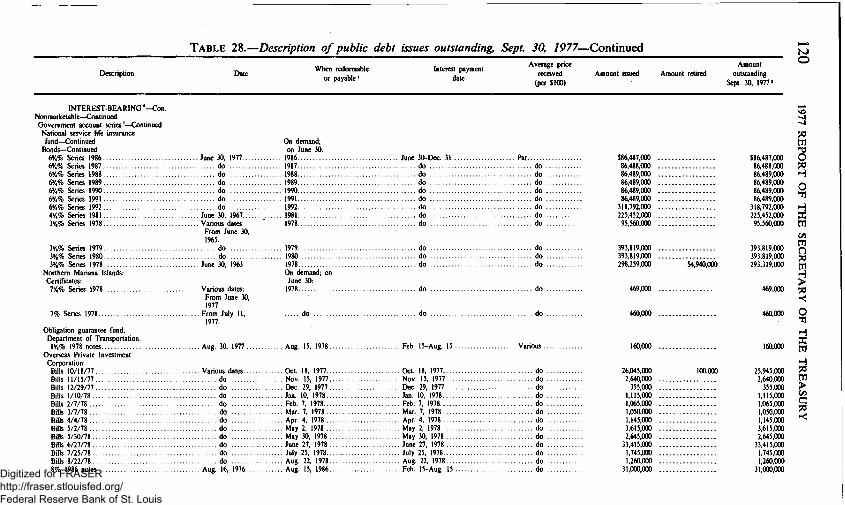
TABLE 28.—Description of public debt issues outstanding Sept, 30, 1977—Continued o
Description When redeemable
or payable'
Interest payment date
Average price received
(per $100) Amount retired
Amount outstanding
Sept. 30, 1977»
INTEREST-BEARING ' - C o n . Nonmarketable—Continued
Govemment account series^—Continued National service life insurance
fund—Continued Bonds—Continued
674% Series 1986 674% Series 1987 674% Series 1988 674% Series 1989 674% Series 1990 674% Series 1991 674% Series 1992 474% Series 1981 37,% Series 1978
37,% Series 1979 37,% Series 1980 378% Series 1978
Northem Mariana Islands: Certificates:
778% Series 1978
. June 30, 1977.... do do do do do do
.June 30, 1967....
. Various dates From June 30, 1%5.
do do
. June 30, 1%3
7% Series 1978
Obligation guarantee fund. Department of Transportation:
874% 1978 notes Overseas Private Investment
Corporation: Bills 10/18/77 Bills 11/15/77 Bills 12/29/77 Bills 1/10/78 Bills 2/7/78 Bills 3/7/78 Bills 4/4/78 Bills 5/2/78 BUls 5/30/78 Bills 6/27/78 Bills 7/25/78 Bills 8/22/78 8% 1986 notes
On demand; on June 30:
. 1986
. 1987
. 1988
. 1989
. 1990
. 1991
.1992
. 1981 1978
. 1979
. 1980 1978 On demand; on June 30:
1978
. June 30-Dec. 31 Par. do
. do .
. do .
. do .
. do .
. do .
. do .
. do .
. do .
. do .
. do .
. do .
. do .
. do .
. Various dates: From June 30, 1977.
. From July 11, 1977.
. Aug. 30, 1977 Aug. 15, 1978 Feb. 15-Aug. 15 Various . .
. Various dates Oct. 18, 1977 Oct. 18, 1977 do . do Nov. 15, 1977 Nov. 15, 1977 do . do Dec. 29, 1977 Dec. 29, 1977 do .
Jan. 10, 1978 Jan. 10, 1978 do . Feb. 7, 1978 Feb. 7, 1978 do . Mar. 7, 1978 Mar. 7, 1978 do . Apr. 4, 1978 Apr. 4, 1978 do .
• Aug.
. d o
. d o
. d o
. d o
. d o
. d o
. d o June 27, 1978 June 27, 1978 do .
. d o July 25, 1978 July 25, 1978 do , do Aug. 22, 1978 Aug. 22, 1978 do . 16, 1976 Aug. 15, 1986 Feb. 15-Aug. 15 do .
. May 2, 1978 .
. May 30, 1978 May 30, 1978 . . May 2, 1978 do .
d o .
$86,487,000 86.488.000 86.489.000 86.489.000 86.489.000 86.489,000
318,792,000 225,452,000
95,560,000
393,819,000 393,819,000 298,259,000
469,000
460,000
160,000
26,045,000 2,640,000 355,000
1,115,000 1,065,000 1,050,000 1,145,000 3,615,000 2,645,000
33,415,000 1,745,000 1,260,000
31,000,000
$86,487,000 86,488,000 86,489.000 86.489.000 86.489.000 86.489.000
318.792.000 225.452,000
95,560,000
393,819,000 393,819,000 293,319,000
469,000
460.000
160.000
25,945,000 2,640,000
355,000 1,115,000 1,065,000 1,050,000 1 usnnn
tfl
7 H O
H X tfl c/3
o po m H > 70 < o ^ H X tfl
ri 7 tfl > ifi C 70
3,615,000 2,645,000 33,415,000 1,745,000 1,260,000
31,000,000 Digitized for FRASER http://fraser.stlouisfed.org/ Federal Reserve Bank of St. Louis

77,% 1980 notes June 10, 1976.. 77.% 1981 notes Various dates.. 77«% 1984 notes do 774% 1984 notes Aug. 15, 1977.
. June
. May
. Feb. • Aug.
77.% 1978 notes Feb. 18, 1975 May 7% 1979 notes Various dates Nov. 7% 1981 notes Jan. 11, 1977 Feb. 7% 1981 notes Oct. 12, 1976 Nov. 7% 1982 notes Apr. 4, 1977 May 7% 1983 notes Various dates Nov. 674% 1978 notes Mar. 31, 1976 War. 674% 1978 notes Sept. 30, 1976 Sept. 674% 1979 notes Aug. 1, 1977 July 67,% 1979 notes June 30, 1977 June 67,% 1982 notes Jan. 18, 1977 Feb. 57,% 1978 notes. Nov. 1, 1976 Oct. 57,% 1979 notes May 2, 1977 Apr.
Pension Benefit Guaranty Ck)rporation:
Bills 10/27/77 Various dates Oct. BUls 12/29/77 do Dec. Bills 2/9/78 do Feb. 8% 1986 notes do Aug. 77«% 1978 notes do Aug. 778% 1981 notes do . . . : Feb. 678% 1978 notes Aug. 31, 1976 Aug.
Postal service fund: Certificates:
6.12% Series 1977 Sept. 30, 1977 Oct.
1980.. 1981 .. 1984 ., 1984., 1978 ., 1979.
1981 ., 1981., 1982 ., 1983., 1978., 1978.
1979.. 1979 . 1982 . 1978.. 1979 .
. June 30-Dec. 31 do .
. May 15-Nov. 15 do .
. Feb. 15-Aug. 15 do . do do .
. May 15-Nov. 15 do . do do .
. Feb. 15-Aug. 15 do .
. May 15-Nov. 15 do . do do . do do .
. Mar. 31-Sept. 30 do . do do .
. Jan. 31-July 31 do .
. June 30-Dec. 31 do .
. Feb. 15-Aug. 15 do .
. Apr. 30-Oct. 31 do . do do .
27, 1977 Oct. 27, 1977 do . 29, 1977 Dec. 29, 1977 do . 9, 1978 Feb. 9, 1978 do . 15, 1986 Feb. 15-Aug. 15 do . 15, 1978 do do . 15, 1981 do do . 31, 1978 Feb. 28-Aug. 31 do .
Bills 10/6/77 Various dates.. BUls 10/20/77 do Bills 1/26/78 do Bills 2/2/78 do BUls 2/16/78 do BUls 2/23/78 do Bills 3/9/78 do BUls 3/16/78 do Bills 3/23/78 do BUls 8/22/78 do 674% 1981 notes do
O c t . . Oct. . Jan. . Feb. . Feb. . Feb. . Mar. . Mar. . Mar. • Aug. . Sept.
. Sept. 30, 1977 Sept.
3, 1977 Oct. 3, 1977 Par 6, 1977 Oct. 6, 1977 Various .. 20, 1977 Oct. 20, 1977 do . 26, 1978 Jan. 26, 1978 do . 2, 1978 Feb. 2, 1978 do . 16, 1978 Feb. 16, 1978 do . 23, 1978 Feb. 23, 1978 do . 9, 1978 Mar. 9, 1978 do . 16, 1978 Mar. 16, 1978 do . 23, 1978 Mar. 23, 1978 do . 22, 1978 Aug. 22, 1978 do . 30, 1981 Mar. 31-Sept. 30 do . 30, 1979 do do . 67.% 1979 notes
Public Health Service, conditional gift fund, HEW:
Bills 9/19/78 Various dates Sept. 87,% 1995-00 bonds Sept. 26, 1977 Aug.
Public Health Service, unconditional gift fund, HEW:
BUls 5/2/78 Various dates May 2, 1978 May 2, 1978
See footnotes at end of table.
19, 1978 Sept. 19, 1978. . . . 15, 1995 Feb. 15-Aug. 15 .
. do .
. do .
10,735,000 24,170,000 37,700,000
3,000,000 1,000,000
55,370,000 3,100,000 6,200,000 4,300,000
19,795,000 6,200,000 4,700,000
15,855,000 2,735,000 2,400,000 1,000,000 2,240,000
3,500,000 27,725.000 18.340.000 12,000.000 2.060,000
10.000.000 4.000.000
378.200.000 100,000,000 100,000,000 10,000,000 20,000,000
135,000,000 10,000,000 50,000,000 30,000,000
100,000,000 70,000,000 60,000,000 50,000,000
30,000 70,000
1,160,000
30,000,000 30,000,000 35,000,000 30,000,000
10,735,000 24,170,000 37,700,000 3,000,000 1,000.000
55.370.000 3,100.000 6.200.000 4.300.000 19.795.000 6.200,000 4,700,000 15,855,000 2,735,000 2,400,000 1,000,000 2,240,000
2,340,000 27,725,000 18,340,000 12,000,000 2,060,000 5,000,000 4,000,000
378,200,000 100,000,000 100,000,000 10,000,000 20,000,000 125,000,000 10,000,000 50,000,000 30,000,000 70,000,000 40,000,000 25,000,000 20,000,000
30,000 70,000
ifi H > H ^ ifi H ^ O > r > tfl
z X
t o
Digitized for FRASER http://fraser.stlouisfed.org/ Federal Reserve Bank of St. Louis

TABLE 28.—Description of public debt issues outstanding, Sept. 30, 1977—Continued to to
Description When redeemable
or payable'
Interest payment date
Average price received
(per $100) Amount retired
Amount outstanding
Sept. 30, 1977»
INTEREST-BEARING ' - C o n . Nonmarketable—Continued .
Govemment account series^—Continued RaUroad retirement account:
Certificates: 7% Series 1978 . Various dates:
From Aug. 1, 1977.
On demand; on June 30:
1978 . June 30-Dec. 31 Par..
Notes: 8% Series 1981 774% Series 1983 67.% Series 1984
Railroad retirement supplemental account: Certificates:
7% Series 1978
67.% Series 1978
Relief and rehabilitation, D.C. Department of Labor:
774% 1984 notes 77,% 1978 notes
Relief and rehabUitation, longshoremen and harbor workers, IDepartment of Labor:
77.% 1978 notes Relief for indigent American
Indians, BIA: 8% 1986 notes 67,% 1978 notes
Special investment account: 87,% 1994-99 bonds 874% 1990 bonds 77.% 2002-07 bonds 77,% 1988-93 bonds
Tax Court judges survivors annuity fund:
87,% 1994-99 bonds 77.% 1995-00 bonds
June 30, 1974.. June 30, 1976.. June 30, 1977..
Redeemable after 1 year from date of issue and payable on June 30:
. 1981
. 1983
. 1984
. do .
. do .
. do .
. do .
. do .
. do .
Various dates: From Aug. 1, 1977.
From June 30, 1977.
Aug. 15, 1977. Various dates..
On demand; on June 30:
1978 . do .
. do .
. do .
. do .
. Aug. 15, 1984 Feb. 15-Aug. 15 Various ..
. May 15, 1978 May 15-Nov. 15 do .
May 3, 1976. May 15, 1978.
Aug. 16, 1976 Aug. 15, 1986 Feb. 15-Aug. 15 do . May 17, 1976 Apr. 30, 1978 Apr. 30-Oct. 31 do .
Various dates May 15, 1994 May 15-Nov. 15 do . Mar. 3, 1977 May 15, 1990 do do . Aug. 15, 1977 Feb. 15, 2002 Feb. 15-Aug. 15 do . Various dates Aug. 15, 1988 do do .
Feb. 13, 1975 May 15, 1994.. May 15-Nov. 15 do . Various dates Feb. 15, 1995 Feb. 15-Aug. 15 do .
$460,182,000
1,434.758.000 2.200.153.000 1.429.130,000
30.916.000
31.841.000
7.000 959.000
12.000 19.000
17.020.000 2.176.000 11.226.000 4.792.000
18.000 62,000
$290,937,000 1,680,826,000 904,858,000
27,007,000
460,182,000
143,821,000 519,327,000 524,272,000
30,916,000
4,834,000
7,000 838,000
3,838,000
12,000 19,000
17,020,000 -i n/innn
7 tfl ^ O 7i H O ^ 1 ^
X tfl r/) rfl o tfl
70 >< O ^ H X tfl
i > Ui
lAi
11,226,000 4,792,000
18,000 62,000 Digitized for FRASER
http://fraser.stlouisfed.org/ Federal Reserve Bank of St. Louis

774% 1992 bonds Aug. 16, 1977 Aug. 15, 1992 do do , 7% 1993-98 bonds Various dates May 15, 1993 May 15-Nov. 15 do ,
Treasury deposit funds: Bills 10/6/77 do Oct. 6, 1977 Oct. 6, 1977 do , Bills 11/25/77 do Nov. 25, 1977 Nov. 25, 1977 do ,
Various dates: On demand; on Oct. 1, 1977 Par
Oct. 1, 1977. 5.57% certificates of From Sept. 1, indebtedness 1977.
3.50% certificates of indebtedness June 30, 1977 June 30, 1978 do ,
. Oct. 1, 1977 do . Jan. 21 do ,
Dec. 29 do .
June 29 do ,
On demand; on June 30, 1978
Various dates: 3.50% certificates of From June 30, do do do , indebtedness 1977.
6.00% certificates of indebtedness Sept. 29, 1977 do
674% notes Jan. 21, 1977 At maturity; on Jan. 21, 1980.
Various dates: 4% notes From Dec. 29,
1972. 4% notes From June 29,
1973. 4% notes From June 30,
1973. 4% notes From Nov. 16,
1974. 37,% bonds Dec. 23, 1969 . 37,% bonds July I, 1970... 37,% bonds Apr. 1, 1971...
Unemployment trust fund: Certificates:
67,% Series 1978 Various dates: From Sept. 7, 1977.
674% Series 1978 From June 30, do do do . 1977.
U.S. Army general gift fund: 77,% 1981 notes Aug. 26, 1977 Aug. 15, 1981 Feb. 15-Aug. 15 Various .. 77,% 1978 notes Apr. 7, 1977 May 15, 1978 May 15-Nov. 15 do 674% 1978 notes Various dates Feb. 15, 1978 Feb. 15-Aug. 15 do 87.% 1995-00 bonds July 12, 1976 Aug. 15, 1995 do do
At maturity; on Dec. 29, 1978.
At maturity; on June 29, 1979.
At maturity; on June 30, 1979.
At maturity; on Nov. 16, 1980.
. On Dec. 23, 1979'» Jan. and Dec. 23 . .
June 30 do ,
Nov. 16 do ,
. On July 1, 1980"
. On Apr. 1, 1981' On demand; on June 30:
1978
do , . Jan. and July 1 do . . Apr. and CX;t. 1 do ,
. June 30-Dec. 31 do ,
8/4% 2000-05 bonds Various dates May 15, 2000 May 15-Nov. 15 . U.S. Naval Academy general gift fund:
77.% 1978 notes May 27, 1977 May 15, 1978 May 15-Nov. 15 . 7% 1982 notes do May 15, 1982 do
. do .
674% 1980 notes.. .Aug. 15, 1977 Aug. 15, 1980.,
. do ,
. do . . Feb. 15-Aug. 15 do .
47,000 . . . . 151,000
17,720,000 . . . . 54,615,000
4,598,611 . . . .
5,054,210 . . . .
356,220,116
60,000,000 . . . . 2,988,746 . . . .
26,129,665 . . . .
6,677,215 . . . .
31,745,141 . . . .
1,535,872 . . . . 75,000,000 . . . . 75,000,000 . . . .
100,000,000 . . . .
125,167,000 . . . .
351,106,000
1,000 . . . . 1,000 . . . . 4,000 . . . . 9,000 . . . .
11,000 . . . .
90,000 . . . . 55,000 . . . . 10,000 . . . .
20,000
'imjooo
78,878,296
2,873,057,000
47,000 131,000
17,720,000 52,615,000
4,598,611
5,054,210
277,341,820
60,000,000 2,988,746
26,129,665
6,677,215
31 745 141
1,535,872 75,000,000 75,000,000
100,000,000
125,167,000
3,478,049,000
1,000 1,000 4,000 9,000
11,000
90,000 55,000 10,000
c/3
H n > r
>
z 0 X
See footnotes at end of table.
to Digitized for FRASER http://fraser.stlouisfed.org/ Federal Reserve Bank of St. Louis

TABLE 28.—Description of public debt issues outstanding, Sept. 30, 1977—Continued t o 4^
Description When redeemable
or payable' Interest payment
date
Average price received
(per $100) Amount retired
Amount
outstanding Sept. 30, 1977*
INTEREST-BEARING ' - C o n . Nonmarketable—Continued
Govemment account series^—Continued U.S. Naval Academy museum fund:
77,% 1986 notes 774% 1979 notes 67,% 1980 notes 67.% 1977 notes 678% 1979 notes 67.% 1979 notes 578% 1978 notes 7% 1981 bonds 678% 1982 bonds 67,% 1984 bonds
Veterans reopened insurance fund: Certificates:
778%. Series 1978
. Nov. 4, 1976 May 15, 1986 May 15-Nov. 15 Various ..
.May 27, 1977 June 30. 1979. . June 30-Dec. 31 do .
. Nov. 4. 1976 Sept. 30. 1980 Mar. 31-Sept. 30 dd .
.May 27, 1977 Nov. 30, 1977 May 31-Nov. 30 do .
.July 16, 1976 Nov. 15, 1979 May 15-Nov. 15 do .
. Nov. 4, 1976 Aug. 15, 1979 Feb. 15-Aug. 15 do . do Oct. 31, 1978. Apr. 30-Oct. 31 do .
.July 16, 1976 Aug. 15, 1981 Feb. 15-Aug. 15 do .
.Nov. 4, 1976 Feb. 15. 1982 do do . do Aug. 15, 1984 do do ,
On demand; on June 30:
1978
7% Series 1978.. . do ,
Notes: 67.% Series 1978.. 678% Series 1979., 67,% Series 1980. 67,% Series 1978. 57.% Series 1978. 57.% Series 1979.
. Various dates: From Aug. 5, 1977.
. From July 8, 1977.
Redeemable after 1 year from date of issue and payable on June 30:
.June 30, 1973 1978 do 1979 do 1980
.June 30, 1971 1978..
. June 30, 1972.... do
Bonds: 77,% 77.% 77,% 778% 77,% 77,% 77,% 778% 778% 77,%
Series 1981. Series 1982. Series 1983. Series 1584. Series 1985. Series 1986. Series 1987. Series 1988. Series 1989. Series 1981.
. June 30, 1974.. do do do do do do do do
. June 30, 1976..
, 1978 . 1979
On demand; on June 30:
. 1981
. 1982
. 1983
. 1984
. 1985
. 1986
. 1987
. 1988
. 1989
. 1981
. do .
. do .
. do .
. do .
. do .
. do .
. do .
. do .
. do .
. do .
. do .
. do .
. do .
. do .
. do .
. do .
. June 30-Dec. 31 Par..
$130,000 10,000
250,000 15,000
250,000 250,000 200,000 127,000 270,000 -275,000
363,000
$130,000 10,000
250,000 15,000
250,000 250,000 200,000 127,000 270,000 275,000
do do do do do do
do do do do do do do do do do
4.684,000 4,684,000 36,141,000 27,000,000 4,458,000 31,458,000
7,496,000 7,496,000 7,496,000 7,496,000 7,496,000 7.496,000 7,496.000 7,496,000 7,496,000 5,047,000
4.684,000 4,684,000 36,141,000 27.000,000 4,458,000 31,458,000
7,496,000 7,496.000 7,496,000 7,496,000 7,496,000 7,4%,000 7,496,000 7,496,000 7,496,000 5,047,000
70 tfl
S 7 H O
H X tfl c/3
-tfl
o 21 > 7 < O ^ H X tfl H 70 tfl > c/3
a 70
Digitized for FRASER http://fraser.stlouisfed.org/ Federal Reserve Bank of St. Louis
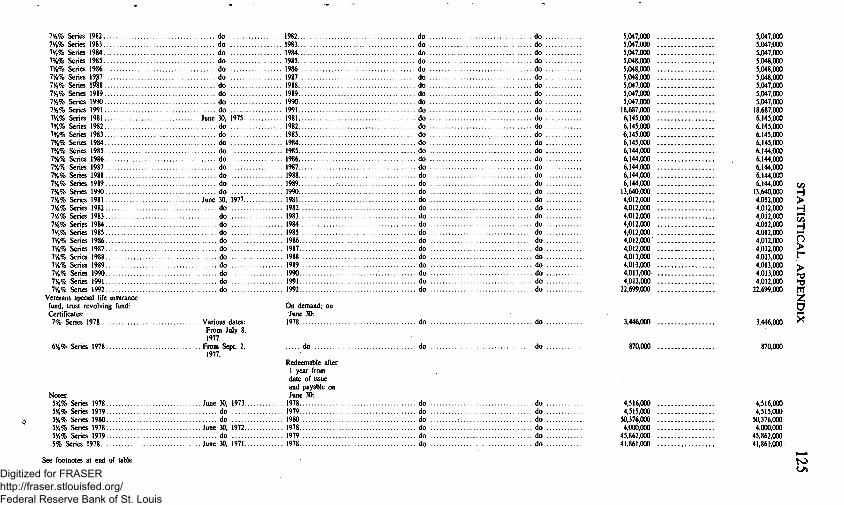
1975..
7%% Series 1982 do , 77,% Series 1983 do , 77,% Series 1984 do 77,% Series 1985 do 77,% Series 1986 do 77,% Series 19^7 do 77,% Series 1988 do 77,% Series 1989 do 77,% Series 1990 do 77,% Series 1991 do 77,% Series 1981 June 30, 77,% Series 1982 do 778% Series 1983 do 77,% Series 1984 do 778% Series 1985 do 77,% Series 1986 do 77.% Series 1987 do 77,% Series 1988 do 77.% Series 1989 do 77,% Series 1990 do 778% Series 1981 June 30, 1977.. 778% Series 1982 do 77.% Series 1983 do 77.% Series 1984 do 77,% Series 1985 do 77,% Series 1986 do 77.% Series 1987 do 778% Series 1988 do 77,% Series 1989 do 77.% Series 1990 do 77.% Series 1991 do 778% Series 1992 do
Veterans special life insurance fund, trust revolving fund: Certificates:
7% Series 1978 Various dates: From July 8, 1977.
67.% Series 1978 From Sept. 2, 1977.
Notes: 57.% Series 1978 June 30, 57.% Series 1979 do 57.% Series 1980 . . . . . do 57.% Series 1978 June 30, : 574% Series 1979 do 5% Series 1978 June 30, :
1982 do . 1983 do . 1984 do . 1985 do . 1986 do . 1987 do . 1988 do . 1989 do . 1990 do . 1991 do . 1981 do . 1982 do . 1983 do . 1984 do . 1985 do . 1986 do . 1987 do . 1988 do . 1989 do .1990 do . 1981 do . 1982 do . 1983 do . 1984 do . 1985 do . 1986 do . 1987 do . 1988 do . 1989 do . 1990 do . 1991 do . 1992 do
On demand; on June 30:
1978 do
. . . . . do do
Redeeraable after 1 year from date of issue and payable on June 30:
. 1978 do
. 1979 do
.1980 do
. 1978 do
. 1979 do
. 1978 do
do . do . do . do . do . do . do . do . do . do . do . do . do . do . do . do . do . do . do . do . do . do . do . do . do . do . do . do . do . do . do . do .
do .
do .
5,047,000 5,047,000 5,047,000 5,048,000 5,048,000 5,048,000 5,047,000 5,047,000 5,047,000
18,687.000 6.145.000 6,145,000 6,145,000 6,145,000 6,144,000 6,144,000 6,144,000 6,144,000 6,144,000
13,640,000 4,012,000 4,012,000 4,012,000 4,012,000 4,012,000 4,012,000' 4,012,000 4,013,000 4,013,000 4.013.000 4.012,000
22,699,000
3,446,000
870,000
5,047.000 5.047,000 5,047,000 5,048,000 5,048,000 5,048,000 5,047,000 5,047,000 5,047,000
18,687,000 6,145,000 6,145,000 6,145,000 6,145,000 6,144,000 6,144,000 6,144,000 6,144,000 6,144,000
13.640,000 4,012,000 4,012,000 4,012,000 4,012,000 4,012.000 4.012.000 4.012,000 4,013,000 4,013,000 4,013,000 4,012,000
22,699,000
C/3
>? H GO
H n > r > tfl z o
See footnotes at end of table.
do do
. . . . . . . : . : do do do do
4,516,000 . . . . 4,515,000 . . . .
50,376,000 . . . . 4.000.000 . . . .
45.862,000 . . . . 41,861,000 . . . .
4,516,000 4,515.000
50,376.000 4.000.000
45.862.000 41.861.000
Digitized for FRASER http://fraser.stlouisfed.org/ Federal Reserve Bank of St. Louis

TABLE 28.—Description of public debt issues outstanding, Sept, 30, 1977—Continued to ON
Description When redeemable
or payable' Interest payment
date
Average price received
(per $100) Amount issued Amount retired
Amount outstanding
Sept. 30. 1977*
INTEREST-BEARING ' - C o n . Nonmarketable—Continued .
Govemment account series^—Continued Veterans special lUe insurance
fund, trust revolving fund—Continued Bonds:
7% Series 1981 June 30, 1977 7% Series 1982 do 7% Series 1983 do 7% Series 1984 do 7% Series 1985 do 7% Series 1986 do 7% Series 1987 do 7% Series 1988 do 7% Series 1989 do 7% Series 1990 do 7% Series 1991 do 7% Series 1992 do 674% Series 1981 June 30, 1976 674% Series 1982 do 674% Series 1983 do 674% Series 1984 do 674% Series 1985 do 674% Series 1986 do 674% Series 1987 do 674% Series 1988 do 674% Series 1989 do 674% Series 1990 do 674% Series 1991 do 67.% Series 1981 June 30, 1975 67.% Series 1982 do 67.% Series 1983 do 67.% Series 1984 do 67.% Series 1985 do 67.% Series 1986 do 67.% Series 1987 do 678% Series 1988 do 678% Series 1989 do 678% Series 1990 do 57.% Series 1981 June 30, 1974 1981. 57.% Series 1982 do 1982. 57.% Series 1983 do 1983. 57.% Series 1984 do 1984.
On demand; on June 30:
1981 1982 1983 1984 1985 1986 1987 1988 1989 1990 1991 1992 1981 1982 1983 1984 1985 1986 1987 1988 1989 1990 1991 1981 1982 1983. 1984 1985 1986 1987 1988 1989 1990
. June 30-Dec.31 Par.. . do . . do . . do . . do . . do . . do . . do . . do . . do . . do . . do . '. do . . do . . do . . do . . do . . do . . do . . do . . do . . do . . do . . do . . do . . do . . do . . do . . do . . do . . do . . do . . do . . do . . do . . do . . do .
. do .
. do .
. do .
. do .
. do .
. do .
. do .
. do .
. 'do .
. do .
. do .
. do .
. do .
. do .
. do .
. do .
. do .
. do .
. do .
. do .
. do .
. do .
. do .
. do .
. do .
. do .
. do .
. do .
. do .
. do .
. do .
. do .
. do .
. do .
. do .
. do .
$6,090,000 6,090,000 6,090,000 6,090.000 6.090.000 6.090.000 6,090.000 6.089.000 6.089.000 6.090.000 6.090.000
31.078.000 6.961.000 6,961,000 6,961,000 6,961,000 6,961,000 6,961,000 6,961,000 6,962,000 6,962,000 6,961,000
24,988,000 8,215,000 8,215,000 8,215,000 8,215,000 8,215,000 8,215,000 8,216,000 8,215,000 8,215,000 18,027,000 9,813,000 9,813,000 9,813,000 9,813,000
$6,090,000 6.090.000 6.090.000 6,090,000 6,090,000 6,090,000 6,090,000 6,089,000 6,089,000 6,090,000 6,090,000
31,078,000 6,961,000 6,961,000 6,961,000 6,961,000 6,961,000 6,961,000 6,961,000 6,962,000 6,962,000 6.961.000
24.988.000 8.215.000 8.215.000 8.215.000 8,215.000 8.215.000 8,215,000 8,216,000 8,215,000 8,215,000
18,027,000 9,813,000 9,813,000 9,813,000 9,813,000
70 tfl • T 3 O
o *r\ H X tfl c/3 tfl
o tfl
O ^ H X tfl
^ tfl > ifi
c 70
Digitized for FRASER http://fraser.stlouisfed.org/ Federal Reserve Bank of St. Louis

57.% Series 1985 do 57.% Series 1986 do 57.% Series 1987 do 57.% Series 1988 do 57.% Series 1989 do
War-risk insurance revolving fund: BUls 10/18/77 Various dates.. Bills 4/4/78 do
. 1985..
. 1986..
. 1987..
. 1988..
. 1989..
. do .
. do .
. do .
. do .
. do .
. do .
. do .
. do .
. do .
. do .
.Oct . 18, 1977 Oct. 18, 1977 Various. .
. Apr. 4, 1978 Apr. 4, 1978 do ,
Total Govemment account series
Investment series:* 274% Treasury bonds B-1975-1 .Apr . 1, 1951.. . Apr. 1, 1978, ex
changeable at any time at option of owner for marketable Treasury notes; payable on Apr. 1, 1980. • ' •
Apr. 1 and Oct. 1 Par Exchange at p a r .
Subtotal.
Total investment series .
REA series: 5% Treasury certificates of in- Various dates: debtedness From Feb. 1977.
2% Treasury bonds* From Oct. 1965. After 1 mo At option of
U.S. or owner upon 30 to 60 days' notice; 12 yrs. from issue date.
1 yr. from issue . date.
Jan. and July 1 ., Semiannually.
. P a r
Total REA series..
State and local govemment series: Treasury certificates of in
debtedness (various interest rates).
Treasury notes (various interest rates).
Treasury bonds (various interest rates).
Various dates After 1 mo From 3 to 12 mos .
. After 1 yr 17, to 7 yrs. at half-yearly periods.
do 77, to 10 yrs. at half-yearly periods.
9,813,000 9,813,000 9,812,000 9,812,000 9,812,000
430,000 825,000
451,397,500 14,879.956,500
15.331.3HOOO
15.331.354.000 "13.084.237.000
14.672.000 6,734,000 29,463,000 27,938,000
44,135,000 34.672,000
9.813.000 9.813.000 9.812.000 9.812.000 9.812.000
430.000 825.000
169.988.576.089 $29.875.557.904 140.113.018.185
7.938.000 1.525.000
252.593.060 252.593.060
8.146.120.850 8,146.120.850
3.071.377.400 3.071.377.400
C/3
2.247.117.000 C/3
O > r > tfl
z 9.463.000 ^
Total State and local govemment series
See footnotes at end of table.
11.470.091.310 11.470.091.310
ro Digitized for FRASER http://fraser.stlouisfed.org/ Federal Reserve Bank of St. Louis

TABLE 28.—Description of public debt issues outstanding, Sept. 30, 1977^Continued to 00
[)escription Date When redeemable
or payable'
Interest payment
date
Average price received
(per $100) Amount retired
Amount outstanding
Sept. 30. 1977'
INTEREST-BEARING ' - C o n . Nonmarketable—Continued
U.S. individual retirement bonds (compounded semiannually):'**
6.00%
6.00% 6.00% Unclassified
Total U.S. individual retirement bonds
First day of each month from:
. Jan. 1, 1975 At option of owner ."
. Jan. 1. 1976 do
.Jan. 1. 1977 do
U.S. retirement plan bonds (compounded semiannually): '• *
3.75%
First day of each month:
. Jan. 1963 to May 1966.
4.15%
5.00% 5.00% 5.00% 5.00% 5.00% 6.00% 6.00% 6.00% 6.00%
. Unclassified..
. June 1966 to Dec. 1969.
Not redeemable until owner attains age 59 Vi except in case of death or disabUity.
do
Jan. 1. 1970 Jan. 1. 1971 Jan. 1, 1972 Jan. 1, 1973 Jan. 1, 1974 Feb. 1, 1974 do . Jan. 1, 1975 do . Jan. 1, 1976 do , Jan. 1, 1977 do .
. do .
. do .
. do .
. do .
. do .
Total U.S. retirement plan bonds
U.S. savings bonds, series and approximate yield to maturity (%) :"*
E-1941 3.989"
First day of each month:
. May to Dec. 1941
On demand at . option of owner;
10 years from issue date but may be held for additional period. '•
Indeterminate Par..
. do .
. do . . do . . do .
Indeterminate Par..
. do .
. do .
. do .
. do .
. do .
. do .
. do .
. do .
. do .
. do .
. do .
. do .
. do .
. do .
. do .
. do .
. do .
. do .
Sold at discount payable at par on maturity.
$11,147,246
10,598,939 3,134,584
-132.750
24.748.020
22.582.560
30.711,659
9.451.291 10,029.128 11,020.389 12.809.648
743.378 24.560.380 19.873.538 19.005.425 10.000.932
-90.740
170.697.588
1,966.061,887
$968,964
459.399 48.550 66.192
1.543.105
10.309.639
10.225.519
2.091,848 1.840.281 1,648,240 1,391,415
85,185 1,703,670
976,221 406,614
68,505 -154,926
30,592.211
1,798.438.344
10.139.540 3.086.034 -198.942
12.272.921
20.486.140
7.359.443 8,188.847 9.372.149
11,418,234 658,192
22,856,710 18,897,316 18,598,811 9,932,428
64.186
140.105.376
P^ tfl
s 7 H O
H X tfl c/3
po
21 > 7i >< O
H X tfl H 70 tfl > c/3 G 70 ><
Digitized for FRASER http://fraser.stlouisfed.org/ Federal Reserve Bank of St. Louis

E-1942 4.048» Jan. to Dec. do 1942
E-1943 4.120« Jan. to Dec. 1943 do E-1944 4.189" Jan. to Dec. 1944 do E-1945 4.255*' Jan. to Dec. 1945 do E-1946 4.342» Jan. to Dec. 1946 do E-1947 4.358» Jan. to Dec. 1947 do E-1948 3.978» Jan. to Dec. 1948 do E-1949 4.117" Jan. to Dec. 1949 do E-1950 4.234" Jan. to Dec. 1950 do E-1951 4 .317" Jan. to Dec. 1951 do E-1952 4.370 (Jan. to Apr.) Jan. to Apr. 1952 do E-1952 4.428" (May to Dec.) May to Dec. 1952 On demand at
option of owner; 9 years. 8 months from issue date but may be'held for additional per iod"
E-1953 4.496" Jan. to Dec. 1953 do E-1954 4 .585" Jan. to Dec. 1954 do E-1955 4 .675" Jan. to Dec. 1955 do E-1956 4 .798" Jan. at Dec. 1956 do E-1957 4.870 (Jan.) Jan. 1957 do E-1957 4 .971" (Feb. to Dec.) Feb. to Dec. 1957 On demand at
option of owner; 8 years, 11 months from issue date but may be held for additional period."
E-1958 5.017" Jan. to Dec. 1958 do E-1959 4.680 (Jan. to May) Jan. to May 1959 do E-1959 4.857 » (June to Dec.) June to Dec. 1959 On demand at
option of owner; 7 years, 9 months from issue date but may be held for additional period. '•
E-1960 4.759" Jan. to Dec. 1960 do E-1961 4.890" Jan. to Dec. 1961 do E-1962 4.992" Jan. to Dec. 1962 do E-1963 5.086" Jan. to Dec. 1963 do E-1964 5.192" Jan. to Dec. 1964 do E-1965 5.284" (Jan. to Nov.) Jan. to Nov. 1965 do
See footnotes at end of table.
. do do .
. do do .
. do do .
. do do .
. do do .
. do do .
. do do .
. do do .
. do do .
. do do .
. do do .
. do do .
. do do .
. do do .
. do do .
. do do .
. do do .
. do do .
. do do .
. do do .
. do do .
. do do .
. do do .
. do do .
. do do .
. do do .
. do do .
8,682,950,735
13,959,241,791 16,319,676,835 12,889,324,074 5,918,334,467 5,674,270,863 5,892,956,873 5,863,673,562 5,158,504,492 5,018,595,126 1,535,398,722 3,150,951,746
7,918,997,057
12,747,556,584 14,831,375,933 11,580,325,074 5,177,379,250 4,840,538,619 4,958,218,182 4,861,489,701 4,228,564,598 4,212,677,495 1,253,171,369 2,560,361,664
763,953,678
1,211,685,208 1,488,300,902 1,308,999,000
740,955,217 833,732,243 934,738,691
1.002,183,860 929,939,894 805,917,631 282,227,353 590,590,081
5,386,427,404 5,515.968,038 5,765,721,723 5,584,391,414
470,031,480 4,810,452,153
5,187,610,350 2,087,188,320 2,790,181,407
4,312,432,510 4.361,182,276 4,517,402,990 4.342.466,824
358,402.041 3.706,832.040
3.910,026.691 1.564.376,092 2,082,445.605
1.073.994,894 1.154,785,762 1,248,318.733 1,241,924,590
111,629,439 1.103,620,113
1,277,583,659 522,812,228 707,735,802
if) H > H Cf) H
r > ^ ^ tfl z n X
4,915,865,139 5,035,957,521 4,917,757,344 5,570,549,426 5,425,134,864 4,803,935,698
3,597,650,487 3.584,733,158 3,431,663,513 3.726,459,501 3,659,753,906 3,246,236,410
1,318,214,653 1,451,224,364 1,486,093,831 1,844,089,925 1,765,380,958 1,557,699,288
to vo Digitized for FRASER
http://fraser.stlouisfed.org/ Federal Reserve Bank of St. Louis

TABLE 28.—Description of public debt issues outstanding, Sept. 30, 1977—Continued O
Description When redeemable
or payable'
Interest payment date
Average price received
(per $100)
Amount
outstanding Sept. 30, 1977*
INTEREST-BEARING ' - C o n . Nonmarketable—Continued
U.S. savings bonds, series and approximate Fint day of yield to maturity ( % ) ' *—Continued each month:
E-1965 5.390 (Dec.) Dec. 1965 . . . .
E-1966 5.424 Jan. to Dec. E-1967 5.524 Jan. to Dec. E-1968 5.600 (Jan. to May) Jan. to May E-1968 5.670 (June to Dec.) June to Dec. E-1969 5.730 (Jan. to May) Jan. to May E-1969 5.835 (June to Dec.) June to Dec.
1966.. 1967 .. 1968... 1968..
1969... 1969..
E-1970 5.860 (Jan. to May) . . E-1970 5.892 (June to Dec.).. E-1971 5.903 E-1972 5.856 E-1973 5.929 (Jan. to Nov.) . . E-1973 6.000 (Dec.)
. Jan. to May
. June to Dec.
. Jan. to Dec.
. Jan. to Dec.
. Jan. to Nov.
.Dec . 1973. . .
1970... 1970..
1971 .. 1972 .. 1973..
E-1974 6.000 E-1975 6.000 E-1976 6.000 E-1977 6.000 Unclassified sales and
redemptions
Total series E .
. Jan. to Dec.
. Jan. to Dec.
. Jan. to Dec.
. Sept. to Dec.
1974 . . 1975 . . 1976..
1977.
. On demand at option of owner; 7 years from issue date but may be held for additional period.'»
do do do do
. . . . . . do
. On demand at option of owner; 5 years, 10 months from issue date but may be held for additional period.'»
do do do do do
. On demand at option of owner; 5 years from issue date but may be held for additional period. '•
do do do do
Sold at discount payable at par on maturity.
. do do .
. do do .
. do do .
. do do .
. do do .
. do do .
. do .
.do ,
. do ,
. do ,
. do .
. do .
. do ,
. do ,
. do ,
. do .
. do .
. do .
. do .
. do .
. do .
. do .
. do .
. do .
..do .
. do .
$505,657,411
5,778,704,890 5,734,355,656 2,335,621,004 3,128,814,305 2,209,425,578
$332,690,378
3,788,695,529 3,7H 178,835 1,489,369,932 2,042.383.901 1.384.748.147
$172,967,033
1.990.009.361 1.990.176.821
846.251.073 1.086.430.404
824.677.431
70 tfl •TS O 7 H O
H X tfl
2.962.642.210
2.244.707.168 3.234.410.732 6.375.863.229 6.972.698.440 6.313.201.358
572.323.524
6.980.233.386 7.151,589.693 7,532,707,994 5,236,777,194
27.985,215
235,594,832,441
1,866,546,481
1,326,730,840 1,914,614,137 3,430,827,245 3,439,597,078 3,042,618,828
275,324,924
3,041,544.868 2.763.060.628 2.403.203.508
855.770.547
»' 6.034.117
168.519.097.835
1.096.095.730
917.976.328 1.319.796.595 2.945.035.984 3.533.101.361 3.270.582.530
296.998.600
3.938.688.518 4.388.529.065 5.129.504.486 4.381.006.648
21.951.098
67.075.734.605
C/) tfl
7i
70 ><
O
tfl
>
po
Digitized for FRASER http://fraser.stlouisfed.org/ Federal Reserve Bank of St. Louis

First day of each month.
H-1952 4 .053" June to Dec. 1952.. . On demand at option of owner; 9 years. 8 months from issue date.**
H-1953 4 .119" Jan. to Dec. 1953 do H-1954 4.199" Jan. to Dec. 1954 do H-1955 4 .273" Jan. to Dec. 1955 do H-1956 4.379" Jan. to Dec. 1956 do H-1957 4.450 (Jan.) Jan. 1957 do H-1957 4 .585" (Feb. to Dec.) Feb. to Dec. 1957 On demand at
option of owner; 10 years from issue date.**
H-1958 4.420" Jan. to Dec. 1958 do H-1959 4.510 (Jan. to May) Jan. to May 1959 do H-1959 4.586" (June to Dec.) .: June to Dec. 1959 do H-1960 4 .627" Jan. to Dec. 1960 do H-1961 4.711» Jan. to Dec. 1961 do H-1962 4 .801" Jan. to Dec. 1962 do H-1963 4 . 9 0 1 " Jan. to Dec. 1963 do H-1964 5.002" Jan. to Dec. 1964 do H-1965 5.106" (Jan. to Nov.) Jan. to Nov. 1965 do H-1965 5.290 (Dec.) Dec. 1965 do H-1966 5.327 Jan. to Dec. 1966 do H-1967 5.417 Jan. to Dec. 1967 do H-1968 5.240 (Jan. to May) Jan. to May 1968 do . . . . H-1968 5.346 (June to Dec.) June to Dec. 1968 do H-1969 5.450 (Jan. to May) Jan. to May 1969 do H-1969 5.679 (June to Dec.) June to Dec. 1969 do H-1970 5.730 (Jan. to May) Jan. to May 1970 do H-1970 5.794 (June to Dec.) June to Dec. 1970 do H-1971 5.834 Jan. to Dec. 1971 do H-1972 5.889 Jan. to Dec. 1972 do H-1973 5.949 (Jan. to Nov.) Jan. to Nov. 1973 do H-1973 6.000 (Dec.) Dec. 1973 do H-1974 6.000 Jan. to Dec. 1974 do H-1975 6.000 Jan. to Dec. 1975 do H-1976 6.000. Jan. to Dec. 1976 do H-1977 6.000 Sept. to Dec. 1977 do Unclassified sales and
redemptions
Semiannually Par.. 27.763.000
. do .
. do .
. do .
. do .
. do .
. do .
. do .
. do .
. do .
. do .
. do .
. do .
. do .
. do .
. do .
. do .
. do .
. do .
. do .
. do .
. do .
. do .
. do .
. do .
. do .
. do .
. do .
. do .
. do .
. do .
. do .
. do .
. do .
. do .
. do .
. do .
. do .
. do .
. do .
. do .
. do .
. do .
. do .
. do .
. do .
. do .
. do .
. do .
. do .
. do .
. do .
. do .
. do .
. do .
. do .
. do .
. do .
. do .
. do .
. do .
. do .
. do .
. (lo .
. do .
Total series H .
Total U.S. savings bonds . .
See footnotes at end of table.
470.502,000 877.689.500
1.173.087.000 893.176.000
64.506.000 567,683,000
890,254,500 356,320,500 362,413.000
1.006.767.500 1,041,579.500
856,760.000 772.969.000 671.586.500 540.209.000 45.682.000
635.272,000 525,966,500 198,966,000 231,939,000 164,594,500 192,529,000 175,537,000 212,772,500 513,917,500 649,800,500 572,064,000 39,410,500
626,632,000 639,128,000 642,620,000 445,477,500
12,538,500
17,261,830,500
252.856.662.941
392,819.000 733.355.500 969.112.000 710.295.000 49.310.500
429.214.000
683.937,500 261,154,000 253.183,500 660,546,000 657,150,000 516,431,000 445,342,000 361,824,500 275,569,500
21,557,500 300,435,000 224,981,000 73,394,000 81,454,000 54,578,000 54,276,500 43,302,500 47,648,500
110,948,000 117,150,000 83,395,000 5,299,500
69,135,500 45,986,500 24,222,000 3,270,500
-368,500
8.923,627,000
177,442,724,835
77,683,000 144,3H000 203,975,000 182,881,000
15,195,500 138.469,000
206.317.000 95.166,500
109,229,500 346,221,500 384,429,500 340,329,000 327,627,000 309,762,000 264,639,500
24,124,500 334,837,000 300,985,500 125,572,000 150,485,000 110,016,500 138,252,500 132,234,500 165,124,000 402,969,500 532,650,500 488,669,000
34,111,000 557.496,500 593,141,500 618,398,000 442,207,000
12.907.000
8.338.203.500
75.413.938.105
C/3 H > H GO
H O > r > tfl Z a X
U )
Digitized for FRASER http://fraser.stlouisfed.org/ Federal Reserve Bank of St. Louis

TABLE 28.—Description of public debt issues outstanding, Sept. 30, 1977—Continued t o
Description When redeemable
or payable' Interest payment
date
Average price received
(per $100)
Amount outstanding
Sept. 30. 1977'
INTEREST-BEARING ' - C o n . Nonmarketable—Continued
U.S. savings notes, series and yield to maturity: '"*
S-1967 5.544% S-1968 5.560% (Jan. to May) S-1968 5.662% (June to Dec) S-1969 5.684% S-1970 5.711% Unclassified
Total U.S. savings notes
Total nonmarketable
Total interest-bearing debt outstanding
First day of each month.
May to Dec. 1967 After 1 yr. ** After 47, yrs.» Jan. to May 1968 do do June to Dec. 1968 do do Jan. to Dec. 1969 do do Jan. to June 1970 do do
. do .
. do .
. do .
. do .
$142,614,882 127,637,376 237,720,453 464,040,439 135,194,123
- 2 0
$99,878,271 86,795,476 155,319,068 292,481,896 81,061,123
" 155
$42,736,611 40,841,901 82,401,384 171.558,544 54,133,000
- 1 7 5
1,107.207.253 715.535.988 391,671.265
475.475.586.371 221.360.314.723 « 254.115,271.648
928,057.154,871 230,435,542,723 697,621,612,148
Amount outstanding
Sept. 30, 1977
MATURED DEBT ON WHICH INTEREST HAS CEASED
Old debt matured (issued prior to April 1, 1917)»»" 27,% postal savings bonds ^ First-Liberty-bonds, at various interest rates Other Liberty bonds and Victory notes, at various interest rates ' Treasury bonds, at various interest rates ' Adjusted service bonds of 1945' Treasury notes, at various interest rates ' Treasury savings notes ' Treasury notes, tax series' Certificates of indebtedness, at various interest rates ' Treasury bil ls ' Federal Financing Bank bills ' Treasury savings certificates' U.S. savings bonds ' Armed Forces leave bonds '
Total matured debt on which interest has ceased
* $1,371,940.26 » 93,420.00
" 457,400.00 4,091,500.00
34,327,650.00 537,900.00
355.106,400.00 158,500.00 53,075.00 90.650.00
39,099,00000 " 20,00000 " 64,150.00
20,906,324.05 3,354,650.00
tfl
^ O 70 H O H X tfl c/3
tfl O 7i tfl H > 7^
O
H X tfl H 7i tfl > c/3 G 7^ ><
459,732.559.31
Digitized for FRASER http://fraser.stlouisfed.org/ Federal Reserve Bank of St. Louis

DEBT BEARING NO INTEREST
Mortgage Guaranty Insurance Company Tax and Loss Bonds (issued pursuant to Sec. 832(e). Intemal Revenue Code of 1954). These securities are exempt from all taxation now or hereafter imposed on the principal by any State or any possession of the United States or of any local taxing authority
U.S. savings stamps (Public Debt Act of 1942 (31 U.S.C 757c)) 92.588.511.09 46.535.312.09
Excess profits tax refund bonds were issued under authority of and subject to the provisions of the Second Liberty Bond Act. as amended, and sections 780 to 783. inclusive, of the Intemal Revenue Code of 1939, as amended. These bonds did not bear interest and were payable at the option of the owner after Jan. 1, 1946. The first series matured on Dec. 31, 1948, and the second series on Dec. 31, 1949:
First Series Second Series
Total excess profits tax refund bonds Old demand notes (acts of July 17. 1861 (12 Stat. 259); Aug. 5. 1861 (12 Stat. 313); Feb. 12. 1862 (12 Stat. 338)). (The $60,030,000 issued
includes $60,000,000 authorized to be outstanding and amounts issued on deposits including reissues.) Fractional currency (acts of July 17, 1862 (12 Stat. 592); Mar. 3, 1863 (12 Stat.711); June 30, 1864 (13 Stat. 220)). (The $368,724,080
issued includes $50,000,000 authorized to be outstanding and amounts issued on deposits including reissues.) Legal tender notes (acts of Feb. 25, 1862 (12 Stat. 345); July 11, 1862 (12 Stat. 532); Mar. 3, 1863 (12 Stat. 719); May 31, 1878 (31 U.S.C. 404); Mar. 14, 1900 (31 U.S.C. 408); Mar. 4, 1907 (31 U.S.C 403)). (Greatest amount ever authorized to be outstanding $450,000,000)
Old series currency (31 U.S.C. 912-916) Silver certificates (act of June 24, 1967) National bank notes, redemption account (act of July 14, 1890 (31 U.S.C. 408)) Federal Reserve bank notes, redemption account (act of Dec. 23, 1913 (12 U.S.C.467)) Thrift and Treasury savings stamps
Total debt bearing no interest
335,079.08 232,348.06
567,427.14
" 52,917.50
" " 1,964,945.32
*• 322,539,016.00
» 4.327.340.50 »* ' 208.012,528.00
**" 19,613,836.00 *•*' 48,911,790.00
" 3.696,376.75
748.810.000.39
SUMMARY
Gross debt Debt of U.S. Govemment agencies
Total gross public debt and debt of U.S. Govemment agencies Deduct debt not subject to statutory limitation ** Add participation certificates (12 U.S.C. 1717(c))
Total debt subject to limitation **
698,830,154,707.69 599,356.305.35
699.429.511,013.04 611,125,660.33
1.135.000.000.00
C/3
H GO
H
9 r > tfl z a X
699,953,385,352.71
' Payable on date indicated except where otherwise noted. Where two dates are shown for Treasury bonds, the first is earliest call date and the second is maturity date.
^ Reconciliation by classification to the basis of the Monthly Statement of the Public Debt of the United States is shown in table 26.
' Treasury bills are shown at maturity value and are sold on a discount basis with competitive bids for each issue. The average sale price of these series gives an approximate yield on a bank discount basis (360 days a year) as indicated opposite each issue. This yield differs slightly from the yield on a true discount basis (365 or 366 days) a year which is shown in the summary table 26.
* Redeemable at par and accrued interest to date of piayment. at any time upon the death of the owner at the option of the duly constituted representative of the deceased owner's estate, provided entire proceeds of redemption are applied to payment of Federal estate taxes on such estate.
''Of this amount. $33,834,500 face amount was issued in exhange for Series F and G savings bonds maturing in the calendar years 1963 and 1964. and $102,000 face amount was issued for cash.
* These amounts do not reflect the exchange, on Sept. 30. 1977. of $17 billion of nonmarketable Govemment account series securities held by certain funds for a like amount of marketable Treasury bills and notes. Such bills and notes correspond in their maturity dates with those bills and notes which the Treasury has announced or will have announced for settlement through Oct. 18, 1977. This action was taken to ensure the normal auction and delivery of such securities to the public, which might otherwise not have been possible due to the expiration of temporary statutory debt limit on Sept. 30. 1977.
'Represents a security issued directly to the Federal Reserve, as authorized by section 14(b) of Federal Reserve Act. to maximize the Treasury's operating funds prior to the expiration ofthe temporary statutory debt limit on Sept. 30. 1977. Digitized for FRASER
http://fraser.stlouisfed.org/ Federal Reserve Bank of St. Louis
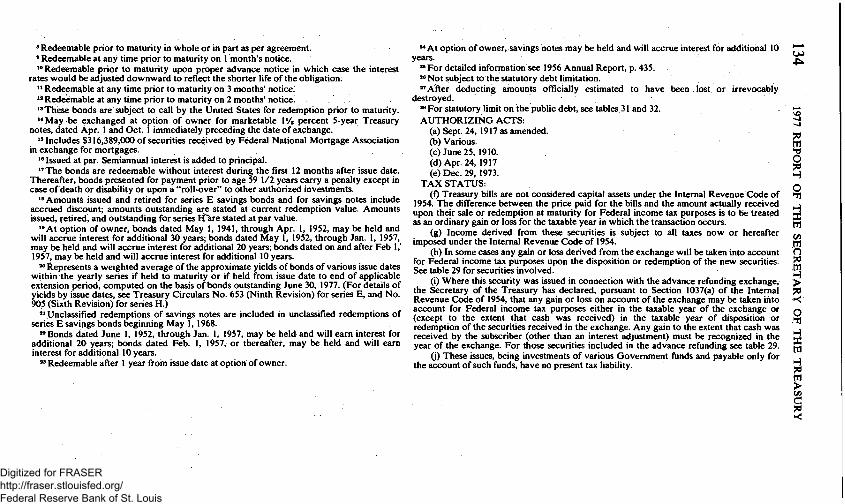
* Redeemable prior to maturity in whole or in part as per agreement. ' Redeemable at any time prior to maturity on 1 month's notice. *** Redeemable prior to maturity upon proper advance notice in which case the interest
rates would be adjusted downward to reflect the shorter life of the obligation. " Redeemable at any time prior to maturity on 3 months' notice. " Redeemable at any time prior to maturity on 2 months' notice. "These bonds are subject to call by the United States for redemption prior to maturity. "May be exchanged at option of owner for marketable IV2 percent 5-year Treasury
notes, dated Apr. 1 and Oct. 1 immediately preceding the date of exchange. "Includes $316,389,000 of securities received by Federal National Mortgage Association
in exchange for mortgages. " Issued at par. Semiannual interest is added to principal. " T h e bonds are redeemable without interest during the first 12 months after issue date.
Thereafter, bonds presented for payment prior to age 59 1/2 years carry a penalty except in case of death or disability or upon a "roll-over" to other authorized investments.
"Amounts issued and retired for series E savings bonds and for savings notes include accrued discount; amounts outstanding are stated at current redemption value. Amounts issued, retired, and outstanding for series rf^re stated at par value.
" A t option of owner, bonds dated May 1, 1941, through Apr. 1, 1952, may be held and will accrue interest for additional 30 years; bonds dated May 1, 1952, through Jan. 1. 1957. may be held and will accrue interest for additional 20 years; bonds dated on and after Feb 1.' 1957. may be held and will accrue interest for additional 10 years.
*** Represents a weighted average ofthe approximate yields ofbonds of various issue dates within the yearly series if held to maturity or if held from issue date to end of applicable extension period, computed on the basis ofbonds outstanding June 30. 1977. (For details of yields by issue dates, see Treasury Circulars No. 653 (Ninth Revision) for series E, and No. 905 (Sixth Revision) for series H.)
'VUnclassified redemptions of savings notes are included in unclassified redemptions of series E savings bonds beginning May 1. 1968.
"Bonds dated June 1. 1952, through Jan. 1, 1957. may be held and will eam interest for additional 20 years; bonds dated Feb. 1. 1957. or thereafter, may be held and will eam interest for additional 10 years.
*' Redeemable after 1 year from issue date at option of owner.
" A t option of owner, savings notes may be held and will accrue interest for additional 10 years.
" F o r detailed information see 1956 Annual Report, p. 435. " Not subject to the statutory debt limitation. "After deducting amounts officially estimated to have been lost or irrevocably
destroyed. ^ For statutory limit on the public debt, see tables 31 and 32. AUTHORIZING ACTS:
(a) Sept. 24. 1917 as amended. (b) Various. (e) June 25. 1910. (d) Apr. 24. 1917 (e) Dec. 29. 1973.
TAX STATUS: (f) Treasury bills are not considered capital assets under the Intemal Revenue Code of
1954. The difference between the price paid for the bills and the amount actually received upon their sale or redemption at maturity for Federal income tax purposes is to be treated as an ordinary gain or loss for the taxable year in which the transaction occurs.
(g) Income derived from these securities is subject to all taxes now or hereafter imposed under the Intemal Revenue Code of 1954.
(h) In some cases any gain or loss derived from the exchange will be taken into account for Federal income tax purposes upon the disposition or redemption of the new securities. See table 29 for securities involved,
(i) Where this security was issued in connection with the advance refunding exchange, the Secretary of the Treasury has declared, pursuant to Section 1037(a) of the Intemal Revenue Code of 1954, that any gain or loss on account of the exchange may be taken into account for Federal income tax purposes either in the taxable year of the exchange or (except to the extent that cash was received) in the taxable year of disposition or redemption of the securities received in the exchange. Any gain to the extent that cash was received by the subscriber (other than an interest adjustment) must be recognized in the year of the exchange. For those securities included in the advance refunding see table 29.
(j) These issues, being investments of various Govemment funds and payable only for the account of such funds, have no present tax liability.
7i tfl
S
o H X tfl ifi tfl
> 70 < O
tfl H 7i tfl > c/3 d 7i
Digitized for FRASER http://fraser.stlouisfed.org/ Federal Reserve Bank of St. Louis

STATISTICAL APPENDIX
TABLE 29.—Securities issued in advance refunding operations
135
Date of exchange and description of securities
issued
Amount issued
(in mil
lions)
Securities exchanged
Price per Effec- Invest-
$100 tive ment face yield * y ie ld '
value
June 23. 1960: 3^/4% note, May 15. 1964-D . . . . '$3,893.3 2'A% bond, Nov. 15. 1961 . . . . 3y8% bond. May 15, 1968 '320.3 2^2% bond. Nov. 15. 1961 . . . .
Oct. 3, 1960: 3 % % bond, Nov. 15. 1980 '643.4 2 % % bond, June 15, 1962-67. 3 % % bond, Feb. 15, 1990* '992.7 2 % % bond, Dec. 15, 1963-68. ix/of K«„H M«„ i< loofl i '1.094.8 2 % % bond, June 15, 1964-69. 3 % % bond, Nov. 15. 1998 j 3i^247.7 I ' M bond, Dec. 15, 1964-69.
Mar. 30, 1961: 3'/8% bond. Nov. 15. 1966.
3V8% bond. Nov. 15. 1967.
Sept. 29, 1961:
3 % % bond, Nov. 15, 1980*
l ' /2% bond, Mar. 15, 1990*
3 % % bond, Nov. 15, 1998V,
3 ' / , % bond, Nov. 15, 1998*
Sept. 20. 1962:
3'/4% note, Aug. 15, 1967-A .
See footnotes at end of table.
2,342.5
'2,437.6 2 % % bond, Aug. 15, 1963 . . . . '1,131.3 2y8% note, Feb. 15, 1963-A.. . '1,295.5 2»/«% bond, June 15, 1959-62. '1.176.7 2'A% bond. Dec. 15, 1959-62.
Mar. 9. 1962:
4 % bond, Aug. 15, 1971 {
4 % bond, Feb. 15, 1980*
3 % % bond, Feb. 15, 1990* I
3,603.5
' 1.034.7 '237.8
1.272.5
'721.7 '575.8
1.297.5
'494.8 '692.1
1.186.9
l ' /2% bond. Mar. 15. 1965-70. l ' /2% bond. Mar. 15, 1966-71.
2 % % bond, Mar. 15. 1965-70. 2 % % bond. Mar. 15. 1966-71.
l ' /2% bond, Mar. 15, 1965-70. 2 % % bond. Mar. 15, 1966-71.
'1,154.3 3 % bond, Feb. 15, 1964
'1.651.4 2V8% bond. Feb. 15, 1965
2.805.7
'562.6 2V8% bond. Feb. 15. 1965
'233.2 2 % % bond. June 15. 1967-72.
'344.6 2 % % bond, Sept. 15, 1967-72.
'322.3 2 % % bond, Dec. 15, 1967-72. 900.1
'180.5 '419.5 '333.4
933.4
'772.4 '1,093.5
'981.4 '952.6
'1,300.9 '180.9
2 % % bond, June 15, 1967-72 . 2 % % bond. Sept. 15. 1967-72. 2 % % bond. Dec. 15. 1967-72.
3y,% ctf. Feb.. 15, 1963-A. . . 2y8% note. Feb. 15, 1963-A.. 3y«% note. Feb. 15. 1963-E.. 3 % % ctf. May 15. 1963-B. . . 3y4% note, May 15. 1963-D . 4 % note. May 15, 1963-B. . . .
5.281.7
Percent Percent $100.00 3.75 4.24
100.00 3.88 4.14
100.00 3.50 3.92 100.00 3.50 3.96 100.00 3.50 3.97 100.00 3.50 3.99
100.00 3.38 3.63 100.00 3.62 3.75 100.00 3.62 3.75 100.30 3.57 3.75
102.25 103.50
99.00 100.25
98.00 99.00
3.34 3.25
3.56 3.49
3.60 3.55
4.16 4.15
4.23 4.21
4.19 4.19
100.00 102.00
100.25 101.25 101.50 101.75
100.00 100.25 100.50
- l o o 3.75
3.98 3.43
.3.42 3.40
3.50 3.49 3.48
4.11 4.10
4.20 4.21 4.21 4.19
4.19 4.19 4.17
99.50 99.90 99.60 99.60 99.60 99.00
3.86 3.77 3.84 3.84 3.85 3.98
3.81 3.80 3.81 3.81 3.81 3.83
Digitized for FRASER http://fraser.stlouisfed.org/ Federal Reserve Bank of St. Louis

136 1977 REPORT OF THE SECRETARY OF THE TREASURY
TABLE 29.—Securities issued in advance refunding operations—Continued
Date of exchange and description of securities
issued
Amount issued
(in mil
lions)
Securities exchanged
Price per
$100 face
value
$99.30 99.70 99.40 99.40 99.40 98.80
Effective
yield'
Percent 4.09 4.04 4.07 4.07 4.08 4.15
Investment yield'
Percent 4.06 4.05 4.06 4.06 4.06 4.07
Sept. 20, 1962—Continued
4% bond, Aug. 15, 1972.
Mar 15. 1963:
3y8% note, Feb. 15, 1967-B .
3y8% bond. Nov. 15, 1971*.
3y8% bond, Nov. 15, 1974*
4% bond, Feb. 15, 1980*
Sept. 18, 1963:
3y9% bond, Nov. 15, 1968.
4% bond, Aug. 15. 1973.
4y8% bond, May 15, 1989-94*.
See footnotes at end of table.
'$370.3 '259.0 '402.0 '448.7 '719.7 '378.8
3%% ctf, Feb. 15, 1963-A.. 2y8% note, Feb. 15, 1963-A. 3y4% note, Feb. 15, 1963-E. 3y4% ctf, May 15, 1963-B.. 3y4% note, May 15, 1963-D 4% note, May 15, 1963-B...
2^578.5
'960.0 3%% ctf, Aug. 15, 1963-C . '205.0 3y8% ctf, Nov. 15, 1963-D.
'2,275.4 2'A% bond, Aug. 15, 1963 .. '845.3 3% bond, Feb. 15, 1964
4,286.6
'693.5 3%% ctf. Aug. 15, 1963-C. '93.6 3y8% ctf, Nov., 15, 1963-D.
'531.8 2y3% bond, Aue. 15, 1963 .. ' 196.0 3% bond, Feb. M5, 1964
1,514.9
'136.2 '313.8 '250.3 '373.2
3%% note, Nov. 15, 1965-B . 3y8% note, Feb. 15, 1966-B.. 3% bond, Aug. 15, 1966 3'/8% bond, Nov. 15, 1966...
1,073.5
'17.3 '49.1 '2.1
'24.4 ' 195.5 '420.0 '209.6 '213.0
y/2% ctf, Aug. 15, 1963-C. l'/2% bond. Aug. 15, 1963 .. 3y8% ctf, Nov. 15, 1963-D. 3% bond, Feb. 15, 1964 3y2% note, Nov. 15, 1965-B 3y8% note, Feb. 15, 1966-B. 3% bond, Aug. 15, 1966 3'/8% bond, Nov. 15, 1966..
1,131.0
'619.5' 3y4% ctf. May 15, 1964-B... '194.4 4»/4% note, May 15, 1964-A . '777.5 3'/4% note. May 15, 1964-D .
1,591.4
'500.0 '213.5 '782.4 '621.0 '340.1 '720.5 '716.4
3y4% ctf. May 15, 1964-B.. 4'/4% note. May 15, 1964-A 3'/*% note. May 15, 1964-D 3'/,% bond, May 15, 1966... 4% note, Aug. 15, 1966-A.. 3y8% note, Feb. 15, 1967-B. 3'/4% note, Aug. 15, 1967-A
3,893.9
'375.4 '125.6 '317.2 '114.5 '104.7 '91.1
'131.9
3y4% ctf, May 15, 1964-B.. 4'/4% note. May 15, 1964-A 3'/4% note, May 15, 1964-D 3'/,% bond. May 15, 1966... 4% note, Aug. 15, 1966-A.. 3y8% note, Feb. 15, 1967-B. 3'/4% note, Aug. 15, 1967-A
1,260.4
99.50 99.70 99.90 99.90
98.90 99.10 99.30 99.30
98.50 98.30
100.00 99.10
99.10 99.50 99.30 99.50 99.00 98.80
100.50 99.60
3.76 3.71 3.65 3.65
4.03 4.00 3.97 3.97
4.04 4.08 3.88 3.97
4.07 4.04 4.06 4.04 4.08 4.11 3.96 4.03
99.35 98.40 99.05
98.85 97.90 98.55 98.85 98.20 99.60 99.30
98.65 97.70 98.35 98.65 98.00 99.40 99.10
4.01 4.23 4.08
4.14 426 4.18 4.16 4.22 4.07 4.12
4.20 4.26 4.22 421 4.24 4.17 4.20
Digitized for FRASER http://fraser.stlouisfed.org/ Federal Reserve Bank of St. Louis

STATISTICAL APPENDIX 137
TABLE 29.—Securities issued in advance refunding operations—Continued
Date of exchange and description of securities
issued
Amount issued
(in mil
lions)
Securities exchanged
Price per $100 face
value
$99.05 98.35 99.05 98.15
100.25 98.20
99.95 99.25 99.95 99.05
101.15 99.10
Effective
yield'
Percent 4.17 429 4.17 433 3.96 4.32
4.25 430 4.25 4.32 4.17 4.31
Investment yield»
Percent 4.16 4.15 416 4.15 4.15 416
425 4.25 4.25 4.25 4.25 425
Jan. 29, 1964:
4% bond. Aug. 15, 1970*
4y4% bond. May 15, 1975-85.
July 24, 1964:
bond, Oct. 1, 1969*
4y8% bond, Nov. 15, 1973.
4y4% bond, Aug. 15, 1987-92*
Jan. 19, 1965:
4% bond, Feb. 15, 1970 .
'$695.4 '164.5 '276.5 '210.8 '655.4 '221.4
2,224.0
'238.4 ' 105.5 '158.4 '116.5 '52.8 '75.6
747.3
3'/4% note, Aug. 15, 1964-E. 5% note, Aug. 15, 1964-B... 3'/*% note, Nov. 15, 1964-F . 4y8% note, Nov. 15, 1964-C. 2y8% bond, Feb. 15, 1965.... 4y8% note, May 15, 1965-A .
3'/4% note, Aug. 15, 1964-E. 5% note, Aug. 15, 1964-B... 3'/4% note, Nov. 15, 1964-F. 4y8% note, Nov. 15, 1964-C. 2y8% bond, Feb. 15, 1965.... 4y8% note, May 15, 1965-A .
637.3 287.6 162.0 249.7
'400.0 '942.3 '295.0 '178.9 '578.2
3,730.9
342.7 362.7 212.9 232.4
'769:5 ' 1,302.7
'300.8 '334.5 '501.6
4,359.4
196.0 196.9 145.0 118.2
'188.0 ' 146.7
'17.7 '151.0 '34.9
1,194.3
674.1 '639.9 '175.6 '587.4 '379.3 '302.3 '902.2 '723.4
3'/4% note, Aug. 15, 1964-E. 5% note, Aug. 15, 1964-B... 3'/4% note, Nov. 15, 1964-F . 4y9% note, Nov. 15, 1964-C. 3y8% note, May 15. 1965-C.. 3y8% note, Feb. 15, 1966-B.. 3'/4% bond, May 15, 1966.... 4% note, Aug. 15, 1966-A... 3y8% note, Feb. 15, 1967-B..
3'/4% note, Aug. 15. 1964-E. 5% note, Aug. 15, 1964-B... 3'/4% note. Nov. 15, 1964-F. 4y8% note, Nov. 15. 1964-C. 3y8% note, May 15, 1965-C.. 3y8% note, Feb. 15, 1966-B.. 3'/4% bond, May 15, 1966.... 4% note, Aug. 15, 1966-A... 3y8% note, Feb. 15, 1967-B..
3'/4% note, Aug. 15, 1964-E. 5% note, Aug. 15, 1964-B... 3'/*% note, Nov. 15, 1964-F. 4y8% note, Nov. 15, 1964-C. 3y8% note, May 15, 1965-C.. 3y8% note, Feb. 15. 1966-B.. 3'/4% bond, May 15, 1966.... 4% note, Aug. 15, 1966-A... 3y8% note, Feb. 15, 1967-B..
2y8% bond, Feb. 15, 1965 3y2% note, Nov. 15, 1965-B . 4% note, Nov. 15, 1965-E... 3y8% note, Feb. 15, 1966-B.. 3y8% note, Feb. 15, 1966-C.. 3'/*% bond, May 15, 1966.... 3'/*% note, Aug. 15, 1967-A. 3y8% bond, Nov. 15, 1967...
99.70 99.55 99.55 99.20 99.50 99.90 99.75 99.35
100.30
99.25 99.10 99.10 98.75 99.05 99.45 99.30 98.90 99.85
100.10 99.95 99.95 99.60 99.90
100.30 100.15 99.75
100.70
4.06 4.10 4.10 4.18 4.11 4.03 4.07 414 3.96
4.22 4.24 4.24 429 4.25 4.20 4.23 4.27 4.16
4.24 4.25 4.25 428 4.26 4.23 4.24 4.27 4.22
4.06 406 4.06 406 4.08 4.09 4.08 4.08 4.08
422 4.22 4.22 4.22 4.23 4.24 4.23 423 4.23
4.24 4.24 4.24 4.24 4.25 425 4.25 4.25 4.25
99.40 99.55 99.10 99.60 99.30 99.50 99.95 00.30
4.13 4.10 4.21 4.09 4.15 4.12 4.05 3.93
4.16 4.18 418 4.18 4.18 4.18 4.18 4.17
4,384.3
See footnote at end of table.
Digitized for FRASER http://fraser.stlouisfed.org/ Federal Reserve Bank of St. Louis

138 1977 REPORT OF THE SECRETARY OF THE TREASURY
TABLE 29.—Securities issued in advance refunding operations—Continued
Date of exchange and description of securities
issued
Amount issued
(in mil
lions)
Securities exchanged
Price per
$100 face
value
Effec- Invest-tive ment
yield • yield'
Jan. 19, 1965—Continued
4y8% bond, Feb. 15. 1974 .
4y4% bond, Aug. 15. 1987-92*.
Feb. 15. 1972:
6'/8% bond, Feb. 15, 1982 .
Aug. 15, 1972:
6y4% note, Aug. 15, 1979.,
6'/8% bond, Aug. 15, 1984.
$489.3 '415.7 '140.4 '332.8 '400.7 '136.9 '459.1 '727.8
3.102.6
642.0 '283.0 '144.9 '144.2 '660.3 '126.1 '140.0 '124.0
2.264.5
4 j
r '179.2 '656.9 '171.7
I '720.8
1.728.7
r 181.5 196.6 222.7
'1.234.6 '755.9 '676.9
y '555.3
3.823.5
r 221.2 133.2 164.4
'534.9 '265.3 '457.0
^ '268.3
2y8% bond. Feb. 15. 1965.... 3y2% note. Nov. 15, 1965-B. 4% note, Nov. 15. 1965-E... 3y8% note, Feb. 15, 1966-B.. 3y8% note, Feb. 15, 1966-C.. 3'/4% bond, May 15. 1966.... 3'/.% note, Aug. 15, 1967-A. 3y8% bond, Nov. 15. 1967...
2y8% bond, Feb. 15, 1965.... 3y2% note. Nov. 15, 1965-B. 4% note, Nov. 15, 1965-E... 3y8% note, Feb. 15, 1966-B.. 3y8% note, Feb. 15, 1966-C.. 3'/,% bond, May 15, 1966.... 3'/4% note, Aug. 15, 1967-A. 3y8% bond. Nov. 15, 1967...
7'/4% note, Feb. 15, 1974-C.. 4y8% bond, Feb. 15, 1974.... 7y4% note, May 15, 1974-D . 4y4% bond, May 15, 1974....
2,044.4
Percent Percent $99.35 4.21 4.23 99.50 4.19 4.24 99.05 4.26 4.24 99.55 4.19 4.24 99.25 4.22 4.24 99.45 4.20 4.24 99.90 4.16 424
100.25 4.09 4.24
100.25 100.40 99.95
100.45 100.15 100.35 100.80 101.15
2ya% bond, Sept. 15, 1967-72. 6% note, Nov. 15, 1972-F.... 2y2% bond, Dec. 15, 1967-72. 5'/4% note, Nov. 15, 1974-A.. 3y8% bond, Nov. 15, 1974.... 5'/,% note, Feb. 15, 1975-A... 5y8% note, Feb. 15, 1975-E...
2y2% bond, Sept. 15, 1967-72 6% note, Nov. 15, 1972-F... 2y2% bond, Dec. 15, 1967-72 5'/4% note, Nov. 15, 1974-A. 3y8% bond, Nov. 15, 1974... 5'/4% note, Feb. 15, 1975-A.. 5y8% note, Feb. 15, 1975-E..
4.23 4.23 4.26 4.22 4.24 4.23 4.21 4.18
4.24 . 4.25 4.25 4.25 4.25 4.25 4.25 4.25
94.678417 101.440167 95.243772 101.504946
100.112220 99.579162 100.600915 99.389120 103.023856 99.693864 99.418341
99.512220 98.979162 100.000915 98.789120 102.423856 99.093864 98.818341
7.13 6.22 7.05 6.17
6.34 6.37 6.35 6.37
' The effective rate of interest on the new issue is the coupon rate adjusted for the amount paid by or paid to the Treasury as discount or premium on the new security exchanged for eligible securities originally issued at par. For eligible securities originally issued at prices other than par, the payment by or to the Treasury is applied to the price adjusted for the pro rata amortization ofthe original discount or premium to the date ofthe advance refunding.
'Based on the mean of bid and asked prices of securities eligible for exchange (adjusted for payments on account of purchase price of securities issued) at noon on the day before announcement by the Treasury.
' Gain or loss on exchange deferred in accordance with sec. 1037a of the Intemal Revenue Code. •Additional issue.
Digitized for FRASER http://fraser.stlouisfed.org/ Federal Reserve Bank of St. Louis
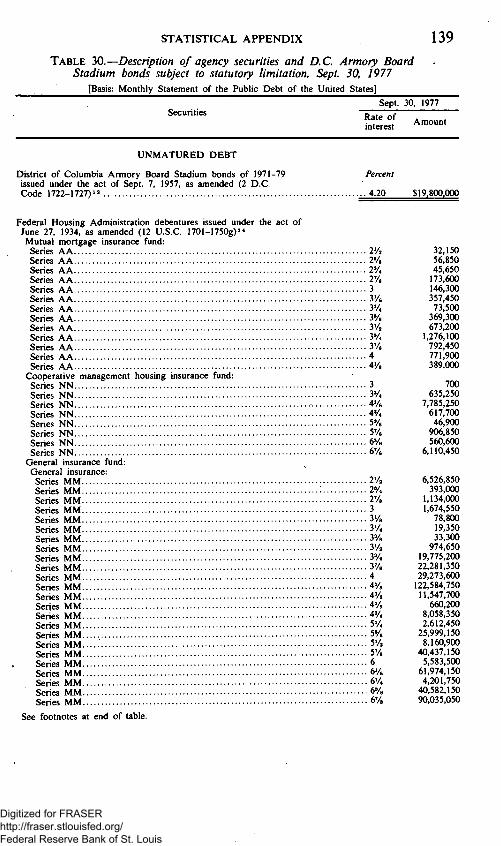
STATISTICAL APPENDIX 139 TABLE 30.—Description of agency securities and D.C. Armory Board
Stadium bonds subject to statutory limitation, Sept. 30, 1977 [Basis: Monthly Statement of the Public Debt of the United States]
Securities Sept. 30, 1977
Rate of interest Amount
UNMATURED DEBT
District of Columbia Armory Board Stadium bonds of 1971-79 issued under the act of Sept. 7, 1957, as amended (2 D.C. Code 1722-1727)»»
Percent
.. 4.20 $19,800,000
Federal Housing Administration debentures issued under the act of June 27, 1934, as amended (12 U.S.C. 1701-1750g)'*
Mutual mortgage insurance fund: Series AA 2^, Series AA 2y8 Series AA 2% Series AA 2% Series AA 3 Series AA 3y8 Series AA 3y4 Series AA 3'/8 Series AA 3y2 Series AA 3% Series AA 3y8 Series AA 4 Series AA 4y8
Cooperative management housing insurance fund: Series NN. 3 Series NN 3y, Series NN . 4 % Series NN 4% Series NN 5% Series NN 5% Series NN : 6% Series NN 6%
General insurance fund: General insurance:
Series MM 2y2 Series MM : 2 A Series MM 2y8 Series MM 3 Series MM.. . 3y8 Series MM 3y4 Series MM 3y8 Series MM 3y2 Series MM 3'/4 Series MM 3y8 Series MM 4 Series MM 4y8 Series MM 4y8 Series MM 4y8 Series MM 4y4 Series MM 5y4 Series MM 5y8 Series MM Syj Series MM 5y8 Series MM 6 Series MM ^ys Series MM 6y4 Series MM 6'/8 Series MM ^ys
See footnotes at end of table.
32,150 56,850 45,650
173,600 146,300 357,450
73,500 369,300 673,200
1,276.100 792.450 771.900 389.000
700 635.250
7.785.250 617.700 46.900
906.850 560,600
6,110,450
6.526.850 393.000
1.134.000 1.674.550
78.800 19.350 33.300
974.650 19,775,200 22.281.350 29.273,600
122,584.750 11.547.700
660,200 8,058.350 2,612,450
25,999,150 8.160.900
40.437.150 5,583,500
61,974,150 4.201.750
40,582,150 90,035,050
Digitized for FRASER http://fraser.stlouisfed.org/ Federal Reserve Bank of St. Louis
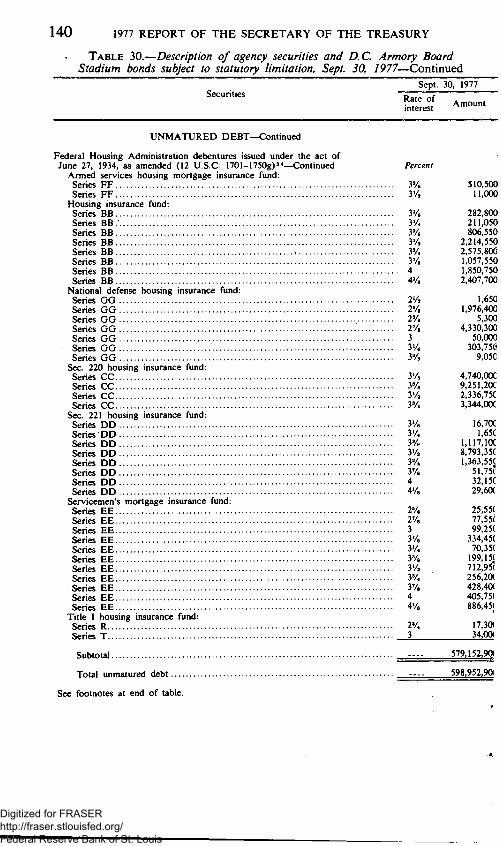
140 1977 REPORT OF THE SECRETARY OF THE TREASURY
TABLE 30.—Description of agency securities and D.C. Armory Board Stadium bonds subject to statutory limitation, Sept. 30, 1977—Continued
Securities Sept. 30, 1977
Rate of interest Amount
UNMATURED DEBT—Continued
Federal Housing Administration debentures issued under the act of June 27, 1934, as amended (12 U.S.C. 1701-1750g)'*—Continued Percent
Armed services housing mortgage insurance fund: Series FF 3% Series FF 3%
Housing insurance fund: Series BB 3y8 Series BB .' 3y, Series BB 3'/8 Series BB 3% Series BB 3% Series BB 3y8 Series BB 4 Series BB 4y8
National defense housing insurance fund: Series GG 2y2 Series GG 2% Series GG 2% Series GG 2y8 Series GG 3 Series GG 3y4 Series GG 3'/8
Sec. 220 housing insurance fund: Series CC 3y8 Series CC 3'/8 Series CC 3% Series CC 3%
Sec. 221 housing insurance fund: Series DD 3y8 Series DD 3% Series DD 3% Series D D 3y2 Series DD 3'/4 Series DD 3y8 Series DD 4 Series DD 4y8
Servicemen's mortgage insurance fund: Series EE 2y8 Series EE 2y8 Series EE 3 Series EE 3y8 Series EE 3y4 Series EE 3'/8 Series EE 3y2 Series EE 3% Series EE 3y8 Series EE 4 Series EE 4y8
Title I housing insurance fund: Series R 2y, Series T 3
Subtotal
Total unmatured debt
See footnotes at end of table.
Digitized for FRASER http://fraser.stlouisfed.org/ Federal Reserve Bank of St. Louis
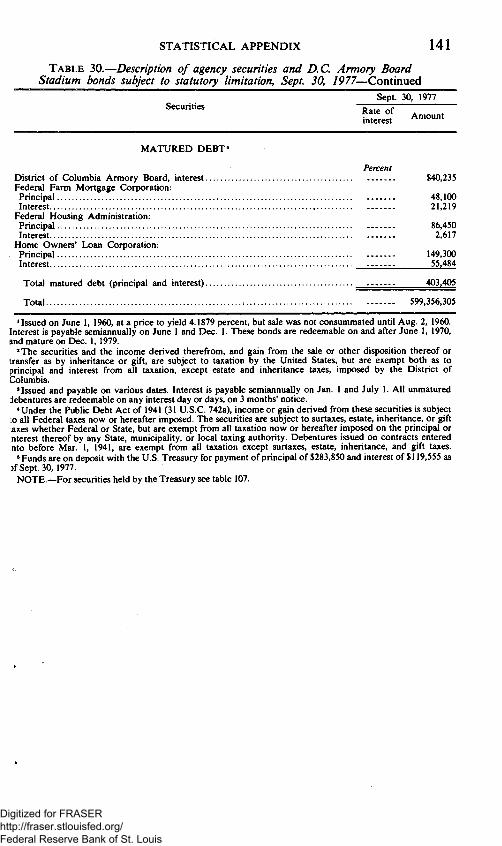
STATISTICAL APPENDIX 141
TABLE 30.—Description of agency securities and D.C. Armory Board Stadium bonds subject to statutory limitation, Sept. 30, 1977—Continned
" " ^ ' ^ Sept. 30, 1977 Securities
fntre^' A - -
MATURED DEBT»
Percent District of Columbia Armory Board, interest $40,235 Federal Farm Mortgage Corporation:
Principal 48.100 Interest 21.219
Federal Housing Administration: Principal 86.450 Interest 2,617
Home Owners' Loan Corporation: Principal 149.300 Interest 55,484
Total matured debt (principal and interest) 403,405
Total - 599,356,305
^Issued on June 1. 1960. at a price to yield 4.1879 percent, but sale was not consummated until Aug. 2, 1960. Interest is payable semiannually on June 1 and Dec. 1. These bonds are redeemable on and after June 1, 1970, and mature on Dec. 1, 1979.
'The securities and the income derived therefrom, and gain from the sale or other disposition thereof or transfer as by inheritance or gift, are subject to taxation by the United States, but are exempt both as to principal and interest from all taxation, except estate and inheritance taxes, imposed by the District of Columbia.
'Issued and payable on various dates. Interest is payable semiannually on Jan. 1 and July 1. All unmatured debentures are redeemable on any interest day or days, on 3 months' notice.
* Under the Public Debt Act of 1941 (31 U.S.C. 742a), income or gain derived from these securities is subject :o all Federal taxes now or hereafter imposed. The securities are subject to surtaxes, estate, inheritance, or gift :axes whether Federal or State, but are exempt from all taxation now or hereafter imposed on the principal or nterest thereof by any State, municipality, or local taxing authority. Debentures issued on contracts entered nto before Mar. 1, 1941, are exempt from all taxation except surtaxes, estate, inheritance, and gift taxes.
"Funds are on deposit with the U.S. Treasury for payment ofprincipal of $283,850 and interest of $119,555 as )fSept. 30, 1977.
NOTE.—For securities held by the Treasury see table 107.
Digitized for FRASER http://fraser.stlouisfed.org/ Federal Reserve Bank of St. Louis
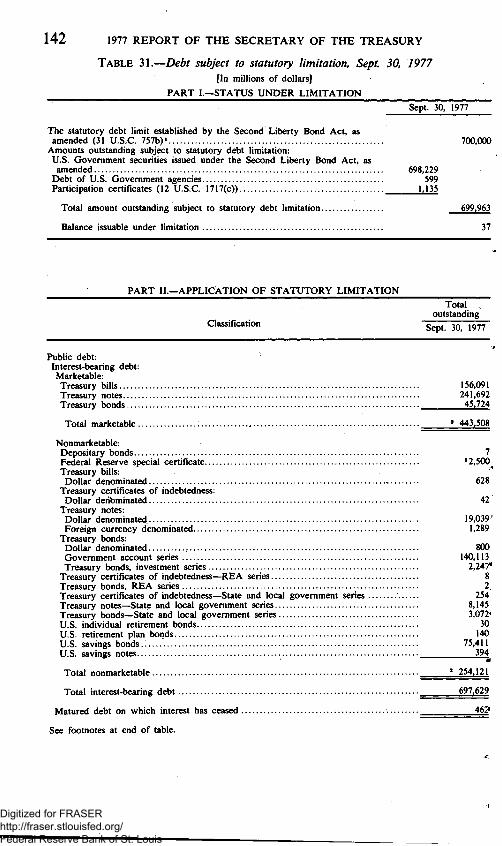
142 1977 REPORT OF THE SECRETARY OF THE TREASURY
TABLE 31.—Debt subject to statutory limitation, Sept. 30, 1977 [In millions of dollars]
PART I.—STATUS UNDER LIMITATION
Sept. 30. 1977
The statutory debt limit established by the Second Liberty Bond Act. as amended (31 U.S.C. 757b)' 700.000
Amounts outstanding subject to statutory debt limitation: U.S. Govemment securities issued under the Second Liberty Bond Act, as amended 698.229
Debt of U.S. Govemment agencies 599 Participation certificates (12 U.S.C. 1717(c)) 1.135
Total amount outstanding subject to statutory debt limitation 699.963
Balance issuable under limitation 37
PART II.--APPLICATION OF STATUTORY LIMITATION
Classification
Total outstanding
Sept. 30, 1977
Public debt: Interest-bearing debt: Marketable: Treasury bills 156.091 Treasury notes 241.692 Treasury bonds 45.724
Total marketable ' 443.508
Nonmarketable: Depositary bonds 7 Federal Reserve special certificate ' 2,500 Treasury bills:
Dollar denominated - 628 Treasury certificates of indebtedness:
Dollar denbminated 42 Treasury notes:
Dollar denominated 19.039' Foreign currency denominated 1.289
Treasury bonds: Dollar denominated 800 Govemment account series 140,113 Treasury bonds, investment series 2,247*
Treasury certificates of indebtedness—REA series 8 Treasury bonds, REA series 2 Treasury certificates of indebtedness—State and local govemment series 254 Treasury notes—State and local govemment series 8.145 Treasury bonds—State and local govemment series 3,072^ U.S. individual retirement bonds 30 U.S. retirement plan bonds 140 U.S. savings bonds 75,411 U.S. savings notes • 394
Total nonmarketable " 254,121
Total interest-bearing debt 697,629
Matured debt on which interest has ceased 46/^
See footnotes at end of table.
Digitized for FRASER http://fraser.stlouisfed.org/ Federal Reserve Bank of St. Louis

STATISTICAL APPENDIX 143
TABLE 3\.—Debt subject to statutory limitation, Sept. 30, 1977—Continned [In millions of dollars]
PART II—APPLICATION OF STATUTORY LIMITATION—Continued
Total outstanding
Classification Sept. 30, 1977
Public debt—Continued Debt bearing no interest:
Mortgage Guaranty Insurance Company tax and loss bonds 93 U.S. savings stamps 47 Excess profits tax refund bonds ° 1 U.S. notes 323 Deposits for retirement of national bank and Federal Reserve bank notes 69 Silver certificates 208 Other debt bearing no interest 10
Total debt bearing no interest 749
Total public debt* 698.840
Debt of U.S. Govemment agencies: Interest-bearing debt 599
Matured debt on which interest has ceased (*)
Total debt of U.S. Govemment agencies 599
Total public debt and debt of U.S. Govemment agencies 699.439
Deduct debt not subject to limitation: Treasury 611 Federal Financing Bank (*)
Add participation certificates 1.135 Total subject to limitation 699.963
* Less than $500,000 ' The following table details amendments to the act. 'These amounts do not reflect the exchange, on Sept. 30, 1977, of $17 billion of nonmarketable Govemment
account series securities held by certain funds for a like amount of marketable Treasury bills and notes. Such bills and notes correspond in their maturity dates with those bills and notes which the Treasury has announced or will have announced for settlement through Oct. 18, 1977. This action was taken to ensure the normal auction and delivery of such securities to the public, which might otherwise not have been possible due to the expiration ofthe temporary statutory debt limit on Sept. 30, 1977.
'Represents a security issued directly to the Federal Reserve, as authorized by section 14(b) of the Federal Reserve Act, to maximize the Treasury's operating funds prior to the expiration of the temporary statutory debt limit on Sept. 30. 1977.
* Includes public debt incurred to finance expenditures of wholly owned Govemment corporations and other activities in exchange for which securities of the corporations and activities were issued to the Treasury. See table 107.
Digitized for FRASER http://fraser.stlouisfed.org/ Federal Reserve Bank of St. Louis
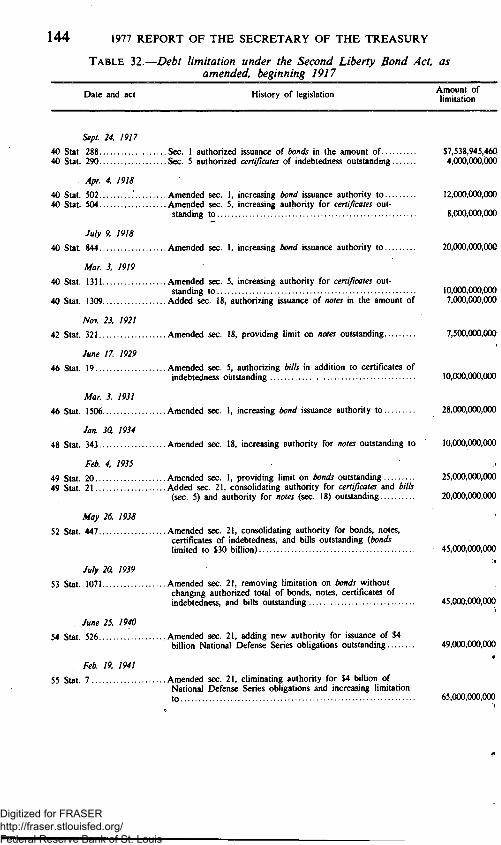
144 1977 REPORT OF THE SECRETARY OF THE TREASURY
TABLE 32.—Debt limitation under the Second Liberty Bond Act, as amended, beginning 1917
Date and act History of legislation
Apr. 4. 1918
40 Stat. 502 .' Amended sec. 1, increasing bond issuance authority to . . . 40 Stat. 504 Amended sec. 5, increasing authority for certificates out
standing to
July 9. 1918
40 Stat. 844 Amended sec. 1, increasing bond issuance authority to
Mar. 3. 1919
40 Stat. 1311 Amended sec. 5, increasing authority for certificates outstanding to
40 Stat. 1309 Added sec. 18, authorizing issuance of notes in the amount of
Nov. 23. 1921
42 Stat. 321 Amended sec. 18, providing limit on notes outstanding
June 17. 1929
46 Stat. 19 Amended sec. 5, authorizing bills in addition to certificates of indebtedness outstanding
Mar. 3. 1931
46 Stat. 1506 Amended sec. 1, increasing bond issuance authority to
Jan. 30. 1934
48 Stat. 343 Amended sec. 18, increasing authority for notes outstanding to
Feb 4. 1935
49 Stat. 20 Amended sec. 1, providing limit on bonds outstanding 49 Stat. 21 Added sec. 21, consolidating authority for certificates and bills
(sec. 5) and authority for notes (sec. 18) outstanding
May 26. 1938
52 Stat. 447 Amended sec. 21, consolidating authority for bonds, notes, certificates of indebtedness, and bills outstanding {bonds limited to $30 billion)
July 20, 1939
53 Stat. 1071 Amended sec. 21, removing limitation on bonds without changing authorized total of bonds, notes, certificates of indebtedness, and bills outstanding
June 25. 1940
54 Stat. 526 ., Amended sec. 21, adding new authority for issuance of $4 billion National Defense Series obligations outstanding
Feb 19. 1941
55 Stat. 7 Amended sec. 21, eliminating authority for $4 billion of National Defense Series obligations and increasing limitation to
Amount of limitation
Sept. 24. 1917
40 Stat. 288 Sec. 1 authorized issuance of bonds in the amount of.... 40 Stat. 290 Sec. 5 authorized certificates of indebtedness outstanding.
Digitized for FRASER http://fraser.stlouisfed.org/ Federal Reserve Bank of St. Louis

STATISTICAL APPENDIX 145 TABLE 32.—Debt limitation under the Second Liberty Bond Act, as
amended, beginning 1917—Continued
Date and act History of legislation Amount of limitation
Mar. 28, 1942
56 Stat. 189 Amended sec. 21, increasing limitation to .
Apr. 11. 1943
57 Stat. 63 . . . . Amended sec. 21, increasing limitation t o .
June 9. 1944
58 Stat. 272 Amended sec. 21, increasing limitation to .
Apr. 3, 1945
59 Stat. 47 Amended sec. 21, including obligations guaranteed as to principal and interest by the United States and increasing limitation to
June 26. 1946
60 Stat. 316 Amended sec. 21, defining face amount of savings bonds to be current redemption value and decreasing limitation to . . . .
Aug. 28. 1954
68 Stat. 895 Increased sec. 21 limitation by $6 billion during period beginning Aug. 28, 1954, and ending June 30, 1955....
June 30. 1955
69 Stat. 241 Amended act of Aug. 28, 1954, extending increase in limitation until June 30, 1956
July 9. 1956
70 Stat. 519 Increased sec. 21 limitation by $3 billion during period beginning July 1, 1956, and ending June 30, 1957
Temporary increase terminated July 1, 1957, and limitation reverted to
Feb 26. 1958
72 Stat. 27 Increased sec. 21 limitation by $5 billion during period beginning Feb. 26, 1958, and ending June 30, 1959
Sept. 2. 1958
72 Stat. 1758 Amended sec. 21, increasing limitation to $283 billion which, with temporary increase of Feb. 26, 1958, made limitation ...
June 30. 1959
73 Stat. 156 Amended sec. 21, increasing limitation to $285 billion, and increased sec. 21 limitation by $10 billion during period beginning July I, 1959, and ending June 30, 1960
June 30. 1960
74 Stat. 290 Increased sec. 21 limitation by $8 billion during period beginning July 1, 1960, and ending June 30, 1961
June 30. 1961
75 Stat. 148 Increased sec. 21 limitation by $13 billion during period beginning July 1, 1961, and ending June 30, 1962
$125,000,000,000
210,000,000,000
260,000,000,000
300,000,000,000
275,000,000,000
281,000,000,000
281,000,000,000
' 278,000,000,000
275,000,000,000
280,000,000,000
288,000,000,000
295,000,000,000
293,000,000,000
298,000,000,000
Digitized for FRASER http://fraser.stlouisfed.org/ Federal Reserve Bank of St. Louis

146 1977 REPORT OF THE SECRETARY OF THE TREASURY
TABLE 32.—Debt limitation under the Second Liberty Bond Act, as amended, beginning 1917—Continued
Date and act History of legislation Amount of limitation
Mar. 13. 1962
76 Stat. 23 Increased sec. 21 limitation by $2 billion (in addition to temporary increase of $13 billion in act of June 30, 1961) during period beginning Mar. 13, 1962, and ending June 30, 1962 $300,000,000,000
July 1. 1962
76 Stat. 124 Increased sec. 21 limitation during the periods: (1) beginning July 1, 1962, and ending Mar. 31, 1963, to . . 308,000,000,000 (2) beginning Apr. 1, 1963, and ending June 24, 1963, to. . 305,000,000,000 (3) beginning June 25, 1963, and ending June 30, 1963. to. 300.000.000,000>
May 29. 1963
11 Stat. 50 Increased sec. 21 limitation during the periods: (1) beginning May 29, 1963, and ending June 30, 1963, to. 307,000,000,000 (2) beginning July 1, 1963, and ending Aug. 31, 1963, to. . 309,000,000,000
Aug. 27. 1963
11 Stat. 131 Increased sec. 21 limitation during the period beginning Sept. 1, 1963, and ending Nov. 30, 1963, to 309,000,000,000
Nov. 26. 1963
11 Stat. 342 Increased sec. 21 limitation during the periods: (1) beginning Dec. 1, 1963, and ending June 29, 1964, to.. 315,000,000,000 (2) ending June 30, 1964, to 309,000,000,000
June 29. 1964
78 Stat. 225 Increased sec. 21 limitation during the period beginning June 29, 1964, and ending June 30, 1965, to 324,000,000,000
June 24. 1965
79 Stat. 172 Increased sec. 21 limitation during the period beginning July 1, 1965, and ending June 30, 1966, to 328,000,000.000
June 24. 1966
80 Stat. 221 Increased sec. 21 limitation during the period beginning July 1, 1966, and ending June 30, 1967, to 330,000,000,000
Mar. 2, 1967
81 Stat. 4 Increased sec. 21 limitation during the period beginning Mar. .< 2, 1967, and ending June 30, 1967, to 336,000,000,000
June 30, 1967
81 Stat. 99. Sec. 21 amended to increase limitation on aggregate outstanding at any time to 358,000,000,000
Sec. 21 amendeid also to increase the limitation temporarily, beginning July 1, 1968, and each July 1 thereafter for the period beginning July 1 and ending June 29 of each succeeding calendar year by $7 billion, providing an operating limitation of 365,000,000,000*
April 7, 1969
83 Stat. 7 Amended sec. 21, increasing limitation to $365 billion, and increased sec. 21 limitation by $12 billion during period begin- i ning Apr. 7, 1969, and ending June 30, 1970 377,000,000,000
Digitized for FRASER http://fraser.stlouisfed.org/ Federal Reserve Bank of St. Louis

STATISTICAL APPENDIX 147
TABLE 32.—Debt limitation under the Second Liberty Bond Act, as amended, beginning 7977—Continued
Date and act History of legislation Amount of limitation
June 30. 1970
84 Stat. 368 Amended sec. 21, increasing limitation to $380 billion, and increased sec. 21 limitation by $15 billion during period beginning July 1, 1970, and ending June 30, 1971 $395,000,000,000
Mar. 17. 1971
85 Stat. 5 Amended sec. 21, increasing limitation to $400 billion, and increased sec. 21 limitation by $30 billion during period beginning Mar. 17, 1971, and ending June 30, 1972 430,000,000.000
Mar 15. 1972
86 Stat. 63 Amended sec. 21. to further increase the limitation temporarily by $20 billion during period beginning Mar. 15, 1972, and ending June 30, 1972 450.000,000,000
July 1. 1972
86 Stat. 406 Amended act of Mar. 15, 1972, striking out June 30, 1972, and inserting in lieu thereof Oct. 31, 1972 450.000,000.000
Oct. 27. 1972
86 Stat. 1324 Increased sec. 21 limitation during the period beginning Nov. 1. 1972, and ending June 30, 1973 465,000,000,000
July 1. 1973 ^
86 Stat. 1324 Amended act of Oct. 27, 1972, striking out June 30, 1973, and inserting in lieu thereof Nov. 30, 1973 465,000,000,000
Dec 3. 1973
87 Stat. 691 Increased sec. 21 limitation during the period beginning Dec. 3, 1973, and ending June 30, 1974 475,700,000,000
June 30. 1974
88 Stat. 285 Increased sec. 21 limitation during the period beginning June 30, 1974, and ending Mar. 31, 1975 495,000,000,000
Feb 19, 1975
89 Stat. 5 Increased sec. 21 limitation during the period beginning Feb. 19, 1975, and ending June 30, 1975 531,000,000,000
June 30. 1975
89 Stat. 246 Increased sec. 21 limitation during the period beginning June 30, 1975, and ending Nov. 15. 1975 577,000,000.000
Nov. 14, 1975
89 Stat. 693 Increased sec. 21 limitation during the period beginning Nov. 14, 1975, and ending Mar. 15, 1976 595,000,000,000
Mar. 15. 1976
90 Stat. 217 Increased sec. 21 limitation during the period beginning Mar. 15, 1976, and ending June 30, 1976 627,000,000,000
June 30. 1976
90 Stat. 793 Increased sec. 21 limitation during the periods: (1) beginning July 1, 1976, and ending Sept. 30, 1976, to . . . 636,000,000,000 (2) beginning Oct. 1, 1976, and ending Mar. 31. 1977, t o . . . 682,000,000,000 (3) beginning Apr. 1, 1977, and ending Sept. 30, 1977, to... 700,000,000.000
Digitized for FRASER http://fraser.stlouisfed.org/ Federal Reserve Bank of St. Louis

II.—OPERATIONS TO
TABLE 33.—Public debt receipts and expenditures by class, monthly for fiscal 1977 [In thousands of dollars. On basis of intemal Public Debt reports]
Receipts (issues) fisS^1977 ^^^ ^^^^ ^ ° ^ - ^^^^ ^ ^ ^^^^ ^^ - ^^^^ ^^^ ^^^^ 3
Marketable: g Treasury bills 348.273.085 26.834.335 28.228.695 33.464.570 27.020.555 28.118,835 g Treasury notes 72.276.533 2.541.940 11.191,411 5.709,805 2,804,315 10,878,812 JO Treasury bonds 5,265.296 1.001.279 20 753.011 H
Subtotal 425.814.914 29.376,275 40,421,385 39,174.395 29.824,870 39.750.658 §
Exchanges: HH Treasury notes 7,669.867 4.004 354.327 252.293 30 2.331.365 ffl Treasury bonds 1,489.439 390.600 ^
tfl Subtotal 9.159.306 4.004 . 354.327 252.293 30 2.721.965 O
J* Total marketable 434,974.220 29.380.279 40.775.712 39,426.688 29,824,900 42,472.623 W
> Nonmarketable : ^
Deposi tary bonds 796 K^ Federa l Reserve special certificate 2.50C.OOO -^ Treasury bills and certificates of indebtedness: ^
Foreignseries 2.984.492 1,182,994 . 289,500 642,284 42,700 70.360 Treasury notes: U
Foreign series 7.483,086 1,073,086 400,000 300,000 300,000 = Foreign currency series 843,299 88,799 137,047
Treasury bonds, dollar denominated 800,000 Hj Govemment account series: ^
Airport and airway trust fund ^,629,294 92,890 110,652 149,843 96,995 91,390 5> Aviat ion war-risk insurance revolving fund 22,985 7,790 C/3 Bonneville Power Administration 566.240 30.510 54,625 46,475 37.535 24.235 C Civil service retirement fund 18.624,280 418,245 541,171 1,779,537 541,595 539,324 2 Comptroller of the Currency, assessments fund 88,400 15,000 29.000 Contributed funds, Bureau of Indian Affairs 270 Department of the Navy, U.S. Office of Naval Records and
History 18 Department of State, conditional gift fund, general 480 . . - 130 225 Emergency loan guarantee fund 35,170 1,285 965 Employees health benefits fund 3,010,124 203,185 232,245 262,949 239,650 232.525
^
Digitized for FRASER http://fraser.stlouisfed.org/ Federal Reserve Bank of St. Louis
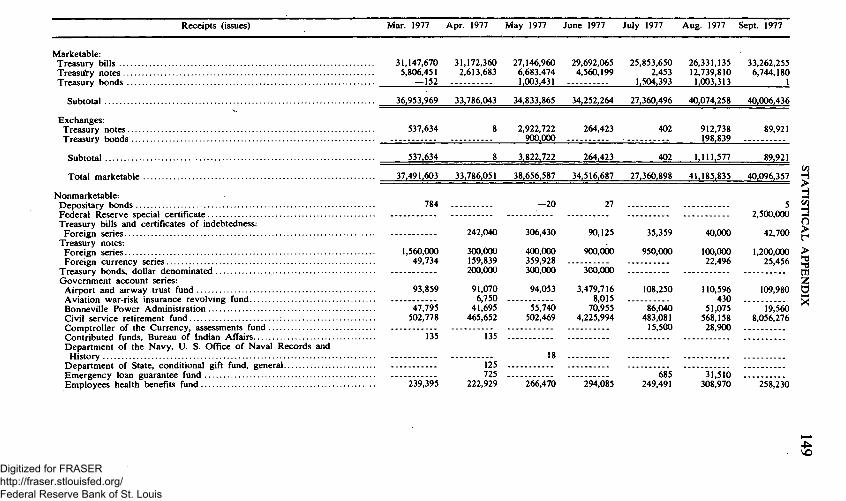
Receipts (issues) Mar. 1977 Apr. 1977 May 1977 June 1977 July 1977 Aug. 1977 Sept. 1977
Marketable: Treasury bills 31.147.670 31.172.360 27.146.960 29.692,065 25,853,650 26,331,135 33,262,255 Treasu'ry notes 5,806,451 2.613.683 6.683.474 4.560.199 2.453 12.739,810 6,744,180 Treasury bonds —152 1.003.431 1.504.393 l.CK)3.313 {_
Subtotal
Exchanges: Treasury notes Treasury bonds
Subtotal
Total marketable
36.953.969
537.634
537.634
37.491.603
33.786.043
8
8
33.786.051
34.833.865
2.922.722 900.000
3.822.722
38.656.587
34.252,264
264.423
264.423
34.516.687
27.360.496
402
402
27.360.898
40.074.258
912.738 198.839
1.111.577
41.185.835
40.006.436
89.921
89.921
40.096.357
Nonmarketable: 3 Depositary bonds 784 —20 27 5 2 Federal Reserve special certificate 2,500.000 ^ Treasury bills and certificates of indebtedness: Q
Foreign series 242,040 306,430 90.125 35.359 40.000 42.700 p Treasury notes:
Foreign series 1.560,000 300.000 400.000 900.000 950.000 100.000 1.200.000 > Foreign currency series 49.734 159.839 359.928 22.496 25.456 2
Treasury bonds, dollar denominated 200.000 300.000 300.000 tfl Govemment account series: Z
Airport and airway trust fund 93.859 91.070 94.053 3.479.716 108.250 110.596 109.980 O Aviation war-risk insurance revolving fund - 6.750 8.015 430 s3 Bonneville Power Administration 47.795 41.695 55.740 70.955 86.040 51.075 19.560 Civil service retirement fund 502.778 465.652 502.469 4.225.994 483.081 568.158 8.056.276 Comptroller of the Currency, assessments fund 15,500 28,900 Contributed funds. Bureau of Indian Affairs 135 135 Department of the Navy, U. S. Office of Naval Records and
History 18 Department of State, conditional gift fund, general 125 Emergency loan guarantee fund 725 685 31,510 Employees health benefits fund 239.395 222.929 266.470 294.085 249.491 308.970 258.230
VO
Digitized for FRASER http://fraser.stlouisfed.org/ Federal Reserve Bank of St. Louis

TABLE 33.—Public debt receipts and expenditures by class, monthly for fiscal 1977—Continued 5^ [In thousands of dollars] O
Receipts (issues) fisS^1977 ^^^ ^^^^ ^ ° ^ - ^^^^ ^^^ ^^''^ ^^"- ^ " ^ ^^^' ^^^^
Nonmarketable—Continued 5 Govemment account series—Continued "^
Employees life insurance fund 1.135.755 65,435 108.233 73.432 76.467 142.948 ?d Exchange Stabilization Fund 24,603.373 1.535.429 1,915.435 2.360.573 2.117.100 2.059.896 tfl Export-Import Bank of the United States 260.000 40.600 71.900 38,700 JS Federal Deposit Insurance Corporation 34.316.000 548.000 2.607.000 2.325.000 2.699.000 5.649.000 g Federal disability insurance trust fund 9.974.943 530.131 565,018 963.653 776,353 723.222 H Federal Financing Bank 503.040 29.045 80.580 32.510 33.075 82.705 ^ Federal hospital insurance trust fund 16.555.235 831.726 879,593 1.592.832 1.019.126 1.080,574 ^ Federal Housing Administration fund 473.448 265.207 Federal old-age and survivors insurance trust fund 78,586.251 4.058.173 5.730,061 6.217.815 4.832,470 5.920.999 H Federal Savings and Loan Insurance Corporation 33.182.065 ' 369.003 1.669,076 1,047,979 823.584 3.605.776 £ Federal ship financing escrow fund 1.260,445 139,775 54,960 117,465 51,640 200.265 ^ Federal ship financing fund, fishing vessels. NOAA 2.755 1.320 ^ Federal ship financing revolving fund 47.425 2,615 3,550 2,700 7,070 4.460 J^ Federal supplementary medical insurance trust fund 8.387.137 550.493 573.719 961.122 568,918 574.417 7i Foreign service retirement fund 197.406 10.187 20.170 10,486 3,255 4,869 tfl General Post fund. VA 1.232 900 ^ Gifts and bequests. Commerce 80 35 ^ GSA participation certificate trust 25,595 9.674 735 12.388 1.689 3 ^ Govemment life insurance fund 87.227 15.707 Govemment National Mortgage Association 886.608 27.292 207.799 60.907 49.029 92,781 g Govemment National Mortgage Association. MBS investment account 19.969 1.934 3.333 555 —555 3.505 ^ Harry S. Truman memorial scholarship fund 30,170 19,609 1,113 328 290 630 H Highway trust fund 16,748,110 320,900 603,161 631,316 582.611 514.800 X Indian money proceeds of labor, B.I.A 19.535 2,055 3.150 1.200 400 ^ Indian tribal funds 493,275 117,025 58,060 12,420 16,840 8.210 H Individual Indian money 241.875 4.700 6.165 23.895 9.460 13.155 g Japan-U.S. friendship trust fund 31.815 4.175 ^ Judicial survivors annuity fund 31.098 23 395 c/3 Library of Congress trust fund 310 150 C Low-rent public housing. H U D 574.000 16.000 40.000 48.000 PO National Archives gift fund 545 10 100 75 *^ National Archives trust fund 3.510 1.050 National Credit Union share insurance fund, NCUA 84.430 2.000 5,100 2,500 39,330 11.000 National insurance development fund. HUD 50.664 11.000 34,469 National service life insurance fund 1.591.307 6.629 4.806 204.425 76.950 6.162 Northem Mariana Islands 1.386 100 50 52 Obligation guarantee fund. Department of Transportation 160 Digitized for FRASER
http://fraser.stlouisfed.org/ Federal Reserve Bank of St. Louis

Receipts (issues) Mar. 1977 Apr. 1977 May 1977 June 1977 July 1977 Aug. 1977 Sept. 1977
Nonmarketable—Continued Govemment account series—Continued
Employees life insurance fund Exchange Stabilization Fund Export-Import Bank of the United States Federal Deposit Insurance Corporation Federal disability insurance tmst fund Federal Financing Bank Federal hospital insurance trust fund Federal Housing Administration fund Federal old-age and survivors insurance trust fund Federal Savings and Loan Insurance Corporation Federal ship financing escrow fund Federal ship financing fund, fishing vessels. NOAA Federal ship financing revolving fund Federal supplementary medical insurance trust fund Foreign service retirement fund General Post fund. VA Gifts and bequests. Commerce GSA participation certificate trust Govemment life insurance fund Government National Mortgage Association Govemment National Mortgage Association, MBS investment
account Harry S. Truman memorial scholarship fund Highway trust fund Indian money proceeds of labor, B.I.A Indian tribal funds Individual Indian money — Japan-U.S. friendship trust fund Judicial survivors annuity fund Library of Congress trust fund Low-rent public housing, HUD National Archives gift fund National Archives trust fund National Credit Union share insurance fund, NCUA National insurance development fiind, HUD National service life insurance fund Northem Mariana Islands Obligation guarantee fund, Department of Transportation
78,039 2,025,078
12 700 2,033.000 881,057 36,085
2,146,497
6,492.290 2.711.620
29.780
4.500 615.234
3.4(K)
3
57.256
635 504.000
800 9.785
22.920 8.515
30.000 50
2.250
255
74.356 2.136.885
1.298.000 919,891 35.345
1.333,793 61,843 .
6,804,561 566,458 107,075
2,0(X) 568,200 4,421
43,285
585 534,000 4,200
49,235 31,995 6,355
160 65,000
2,200 2.000 5.128 .
113.794 2.188.503
1.792.000 819.320 93.075
1,269.166
7.675.623 2.841.210
64.285
9.800 583.966 20.834
332 45 4
84.710
4.364 1.380
595.905 1.2(X)
106.080 14.325
28.692
Vs.CKX) 50
7.200 1.500
80.349 2.075.698
36.600 1.154.000 1.499.306
41.645 2.811.215
13.955 12.333.851 2.779.442
46.510
2,785 1,616.555
33.798
71.520 81.593
1.963 1.285
10,479.986 800
54.625 12.275 4.030 251
80.000 105 590
1,277.101 469
80.150 2.064.343
19.800 1.360.000 683.376 9.775
1.069.914
5.046,227 3,122,663 208,105
3,400 656,350
8,305
688
37,420
2,692 1,240
574,100 1,280
12.655 34.255
250
60.000
1.070 3.850
3.944 460
162.905 2.065.857
5.650.000 793.153 12.975
1,235.602 123,288
8,046,572 6,542.669 153.250
1.435 3,025
690,867 4,000
409
107,978
1,535 740,331
800 24,125 49.080
1.487
75.(KX) 155 3(X)
6.750 1,695 6,162
160
79,647 2,058.575
39.700 7,201.000 820.463 16,225
1,285.197 9,155
5,427,609 7,102,585
87,335
1,520 427,296 73,681
2
36,558
2,178 1,540
667,000 3,650
24,215 19,650 8,740
115,0(X)
500 2,250
^
3 if
0 > 1 >
i
us. Digitized for FRASER http://fraser.stlouisfed.org/ Federal Reserve Bank of St. Louis

TABLE 33.—Public debt receipts and expenditures by class, monthly for fiscal 1977—Continued ^ [In thousands of dollars] N>
Subtotal
Exchanges:
Series H savings bonds for series E savings bonds
Total nonmarketable 643,188,724
Total public debt receipts 1,078,162,944
642,873,848
314,875
643,188,724
1^78J62,944
47,195,979
26,242
47,222,222
76,602,501
51,193.726
26.294
51.220.020
91.995.732
55.055.750
26.728
55.082.478
94.509.166
43.179.899
31.448
43.211.347
73.036.247
44.242,282
26,564
44^268,846
86^1,469
Receipts (issues) fisJaM977 ^^^ ^^^^ ^^^- ^ " ^ ^ ^ ^^^^ ^^"- ^^^^ ^^^- ^^^^
Nonmarketable—Continued 5 Govemment account series—Continued ^
Overseas Private Investment Corporation 209,505 9,200 10,940 15,690 24,690 11,180 Ti Pension Benefit Guaranty Corporation 122,410 6,350 1,300 2,775 3,725 16,450 W Postal service fund 327,928,600 33,019.300 30.626.500 33,168.000 26.017.000 18.826.000 g Public Health Service conditional gift fund, HEW 100 ^ ^ Public Health Service unconditional gift fund 105 H^ Railroad retirement account 5,050,285 126,924 527,017 236.905 100.677 333.991 ^ Railroad retirement supplemental account 166.652 8.893 19,183 11,347 926 19,394 Jg Relief and rehabilitation, D.C. Department of Labor 7 Special investment account 47,199 1,100 1,810 1,505 2,010 13,744 g Tax Court judges survivors annuity fund 156 f*3 Treasury deposit funds 744,069 17,925 18,984 97,432 16,067 7,649 Unemployment trust fund 15,685,114 602,205 1,361,683 314,877 336,294 1,189,436 g U.S. 'Army general gift fund 50 10 (^ U . S . N a v a l A c a d e m y genera l gift fund 155 pO U . S . N a v a l A c a d e m y museum fund 1,400 1,375 W V e t e r a n s r eopened insurance fund 83.277 541 13.077 646 360 J V e t e r a n s special life insurance fund, t rust r evo lv ing fund 131.618 1,400 1,045 14,855 3,130 1,955 ^ War- r i sk insurance r evo lv ing fund 1,255 125 120 85 100 ^
Treasury certificates of indebtedness—REA series 14,672 7,172 Treasury bonds—REAseries 1,341 ^ Treasury certificates of indebtedness—State and local government
series 368,761 5,165 41,335 8,910 14,609 16,917 H Treasury notes—State and local government series 7,296,265 102,115 689,595 395,945 428,279 460,287 * Treasury bonds—State and local govemment series 1,208,732 109,490 211,009 74,605 23,560 33,479 ^ U. S. individual retirement bonds 16,674 —23 —461 4,206 1.642 193 H U. S. retirement plan bonds 25.241 1.096 1.460 5.053 3.195 1,878 J2 U.S. savings bonds 11,719,560 892,716 896,131 947,943 1,021,984 972,962 ^ U. S. savings notes 22,968 1,955 3,819 129 1,937 1,890 t^ Other 30,563 - 534 634 C
^
Digitized for FRASER http://fraser.stlouisfed.org/ Federal Reserve Bank of St. Louis

Receipts (issues) Mar. 1977 Apr. 1977 May 1977 June 1977 July 1977 Aug. 1977 Sept. 1977
Nonmarketable—Continued Govemment account series—Continued
Overseas Private Investment Corporation Pension Benefit Guaranty Corporation Postal service fund Public Health Service conditional gift fund, HEW Public Health Service unconditional gift fund Railroad retirement account Railroad retirement supplemental account Relief and rehabilitation, D.C. Department of Labor Special investment account Tax Court judges survivors annuity fund Treasury deposit funds Unemployment trust fund U.S. Army general gift fund U.S. Naval Academy general gift fund U.S. Naval Academy museum fund Veterans reopened insurance fund Veterans special life insurance fund, trust revolving fund War-risk insurance revolving fund
Treasury certificates of indebtedness—REA series Treasury bonds—REA series Treasury certificates of indebtedness—State and local govemment
series Treasury notes—State and local goverament series Treasury bonds—State and local govemment series U. S. individual retirement bonds U. S. retirement plan bonds U. S. savings bonds U. S. savings notes Other
Subtotal
Exchanges: Series H savings bonds for series E savings bonds
Total nonmarketable
Total public debt receipts
2,910 15,950
28,132,800
145,907 10,441
2,176 109
5,770 143,315
34
226 1.101
4 500
55.042 1.173.042
89.423 1.052 3.136
1.018.162 1.891 5.142
51.012.358
28.558
51.040.916
88.532.519
6.250 15.225
27.837.000
20.733 1.492
4.792
18.060 1.162.606
1
420 2.735 565
25.085 482.447 65.381
633 3.996
1.010,828 1,879 4,729
47.052.788
24.701
47.077.490
80.863.541
39.660 8.625
31.565.400
105 276.758 19,287
2,694
56,524 3,864,630
145 25 100
2,140 105
1,341
26,624 606,210 42,692 1,633 419
1,014,220 1,961
58,178.750
24.099
58.202.849
96.859.436
25.000 1.995
26.146.400
2.787.594 42,446
4,295
312,687 3,401,073
2
66,923 98,941
50 3,000
42,029 578,119 142,263
878 2,602
992,767 1,918 12,312
80.624.514
24.680
80.649.194
115.165.881
17.285 3.050
24.083.600
33.597 2.327
39.582 816.334
551 2,260
40,611 645,690 241,631
383 1,048
997,056 1,907
43,921,629
24,816
43,946.445
71.307.343
21.345 19.065
25.107.800
320.158 21.416
7 11.726
47 69.768
2.367.494 1
10
363 1.186
85
58.549 731.503 58.417 6.179 558
1.016.327 1.831 2.650
57.580.185
27.652
57.607.837
98.793.672
25.355 27.900
23.398.800 100
140.024 9.500
1.347
83.620 125.167
2
70 870 20
33.886 1.003.032 116.782
360 800
938.466 1,850 4.561
63.635.990
23.091
63.659.081
103.755.438
ifi
H ' H
> r >
D ><
Digitized for FRASER http://fraser.stlouisfed.org/ Federal Reserve Bank of St. Louis
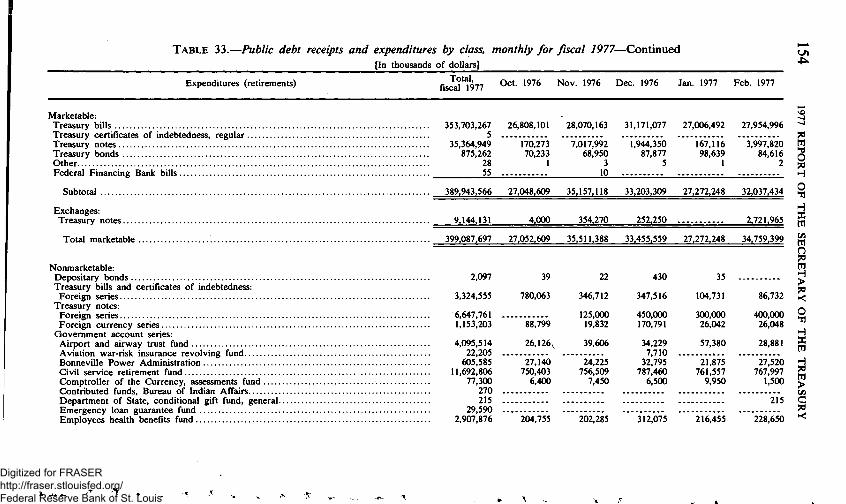
TABLE 33.—Public debt receipts and expenditures by class, monthly for fiscal 1977—Continued ^ [In thousands of dollars] -^
Expenditures (retirements) fisS^1977 ^^^ ^^^^ ^ ° ^ ' ^^^^ ^ ^ ^^^^ ^^"- ^^^^ ^^^- ^^^^
Marketable: ^ Treasury bills 353.703,267 26,808,101 28,070,163 31.171.077 27,006.492 27,954,996 ^ Treasury certificates of indebtedness, regular 5 ?0 Treasury notes 35,364,949 170,273 7,017,992 1,944,350 167,116 3,997,820 tfl Treasury bonds 875,262 70,233 68,950 87,877 98.639 84.616 JS Other 28 1 3 5 1 2 ^ Federal Financing Bank bills 55 10 ^
Subtotal 389.943.566 27.048,609 35,157,118 33.203,309 27,272.248 32.037,434 §
Exchanges: M Treasury notes 9.144.131 4.000 354.270 252.250 2.721.965 g
Total marketable 399.087.697 27.052,609 35.511.388 33,455,559 27.272.248 34.759.399 g
n 70
Nonmarketable: tfl Depositary bonds 2.097 39 22 430 35 P Treasury bills and certificates of indebtedness: M
Foreign series 3,324.555 780,063 346.712 347.516 104.731 86,732 ^ Treasury notes: -.
Foreign series 6,647,761 125,000 450,000 300,000 400,000 g Foreign currency series 1,153,203 88,799 19.832 170,791 26,042 26,048 ^
Govemment account series: ^ Airport and airway trust fund 4,095,514 26,126\ 39,606 34,229 57,380 28,881 g Aviation war-risk insurance revolving fund 22,205 7,710 Bonneville Power Administration 605.585 27.140 24.225 32.795 21.875 27.520 H Civil service retirement fund 11.692.806 750,403 756.509 787.460 761.557 767.997 g Comptroller of the Currency, assessments fund 77,300 6.400 7.450 6.500 9,950 1,500 ^ Contributed funds. Bureau of Indian Affairs 270 C/3 Department of State, conditional gift fund, general 215 215 C Emergency loan guarantee fund 29,590 5 Employees health benefits fund 2,907,876 204,755 202,285 312.075 216.455 228.650 "<
Digitized for FRASER http://fraser.stlouisfed.org/ Federal Reserve Bank of St. Louis

Expenditures (retirements) Mar. 1977 Apr. 1977 May 1977 June 1977 July 1977 Aug. 1977 Sept. 1977
Marketable: Treasury bills 31,046,241 33,472,148 31,178,233 32,563,815 26,696,510 26,290,195 31,445,296 Treasury certificates of indebtedness, regular 5 Treasurynotes 2,104,741 53,355 7,584,374 2,027,502 67.316 7.199.901 3.030.209 Treasury bonds 86.097 57.642 51,047 86,294 55,290 73.896 54.681 Other 4 1 5 1 2 2 1 Federal Financing Bank bills 20 25 50 —50
Subtotal
Exchanges: Treasury notes
Total marketable
33.237.103
523.290
33.760.393
33.583,171
33.583.171
38.813.660
3.822.707
42.636.367
34.677.617
264.420
34.942.037
26.819.168
26.819.168
33.563.944
1.111.519
34.675.463
34.530.187
89.710
34.619.897
Nonmarketable: f Depositary bonds 42 7 661 73 60 200 528 ^ Treasury bills and certificates of indebtedness: HH
Foreignseries 601.243 286.580 352.854 156.498 42.330 131.602 87.694 Q Treasury notes: f-i
Foreign series 916.858 602.800 700.000 1.200.000 1,003.104 250.000 700.000 ^ Foreign currency series 82.293 187.071 385.976 32,560 27,232 55,056 51,504 >
Government account series: S Airport and airway trust fund 32,408 44,286 34,716 3,338,041 56,821 161,051 241,969 tfl Aviation war-risk insurance revolving fund 6.705 7.790 Z Bonneville Power Administration 44,695 35,140 50,005 74,725 91,405 61.660 114.400 O Civil service retirement fund 775.761 808,246 811,446 2,976,440 826,986 834,862 835,139 5 Comptroller of the Currency, assessments fund 6,000 6,500 8,000 6,250 2,500 11,000 5,250 Contributed funds. Bureau of Indian Affairs 270 Department of State, conditional gift fund, general Emergency loan guarantee fund 29,590 Employees health benefits fund 218,645 226,030 246,-^95 267,985 270,881 287,330 225,990
Digitized for FRASER http://fraser.stlouisfed.org/ Federal Reserve Bank of St. Louis

TABLE 33.—Public debt receipts and expenditures by class, monthly for fiscal 1977—-Continued ^ [In thousands of dollars] 0 ^
Expenditures (retirements) fisS^1977 ^ ' - *^^^ ^ ° ^ - ^^^^ ^ ^ ^^^^ ^^"- ^^^^ ^^^- ^^^^
Nonmarketable—Continued Govemment account series—Continued
Employees life insurance fund 669,305 Exchange Stabilization Fund 24,083,145 Export-Import Bank of the United States 247,400 Federal Deposit Insurance Corporation 32,916,000 Federal disablity insurance trust fund 12,172,280 Federal Financing Bank 588,960 Federal hospital insurance trust fund 16^90,977 Federal Housing Administration fund 4,205 Federal old-age and survivors insurance trust fund 80,231,271 Federal Savings and Loan Insurance Corporation 32,532,692 Federal ship financing escrow fund 1,105,495 Federal ship financing fund, fishing vessels, NOAA 2,820 Federal ship financing revolving fund 14,630 Federal supplementary medical insurance trust fund 7,399,004 Foreign service retirement fund 105,066 General Post fund, VA 900 Gifts and bequests. Commerce 70
, GSA participation certificate trust 101,988 Government life insurance fund 121,434 Government National Mortgage Association 816,169 Govemment National Mortgage Association, MBS investment account 1,283 Harry S. Truman memorial scholarship fund 9,055 Highway trust fund 15,621,299 Indian money proceeds of labor, B.I.A.. 20,735 Indian tribal funds 499,750 Individual Indian money 240,625 Japan-U.S. friendship trust fund 31,575 Library of Congress trust fund 310 Low-rent public housing, HUD 544,390 National Archives gift fund 365 National Archives trust fund 3,795 National Credit Union share insurance fund, NCUA 61,950 National insurance development fund, HUD 18,300 Natipnal service life insurance fund 1,297,210 Northem Mariana Islands 457 Overseas Private Investment Corporation 146,695 Pension Benefit Guaranty Corporation 106,706 Postal service fund 327,721,700 Public Mealth* ' Service conditicjnal gjft fund, HEW ,. 30
53,795 1,530,433
524,000 910,070 21,780
1.224,892
5,851,765 356,547 112,140
1 010 470,818
6,313
35 32,037 3,957
32,365
375 448,951
3,380 101,830 3,100
10,000 50 935
2,175 4,500
8,090 6,310
31,502,500
-
49,185 1,848.629
2.402,000 913.647 73.105
1.170.224
5.900,412 1,557.906 101.450
500.542 6.429
5.428 3.943
60.605
380 696,235
3,425 41,395 2,625
46,390
4,400 8,200
3.935 1,175
30.796,600
58,660 1,911,744
40 600 2,424,000 935,956 29,275
1,227,841 3,205
5,961,242 1,017,538 136,430
105
510,148 6,359
29,113 5,901
52,775
380 476,576
800 49,565 26,995 4,180
40.000 --»
3'.250
9,845
10,245 3,040
32,989,900
r-
52,010 2,118,232
71,900 2,601,000 960,184 29,045
1,281,473
5,957,828 787,004 74,925
4,825 562,675 6,507
6,716 3,987
306.425
340 412.738
800 12.510 10.075
5.000
200 28.330
15,924
18,390 215
26,249,800
61,470 2,115,667
38,700 5,153,000 963,682 81,585
1,088,707
5,885,745 3,497,784 113,480
1,395
471,637 7,789
2,617 4,978 79,415
240 363,090
16,715 16,295
13,000
200 1,070
15,923
8,970 200
18,980,800
2 tfl
§ H O
H X tfl
w
7i
^ > po
% H X tfl
H 70
ifi C 70 ><
Digitized for FRASER http://fraser.stlouisfed.org/ Federal Reserve Bank of St. Louis

Expenditures (retirements) Mar. 1977 Apr. 1977 May 1977 June 1977 July 1977 Aug. 1977 Sept. 1977
Nonmarketable—Continued Govemment account series—Continued
Employee? life insurance fund Exchange Stabilization Fund Export-Import Bank of the United States Federal Deposit Insurance Corporation Federal disability insurance trust fund Federal Financing Bank Federal hospital insurance trust fund Federal Housing Administration fund Federal old-age and survivors insurance tmst fund Federal Savings and Loan Insurance Corporation Federal ship financing escrow fund Federal ship financing fund, fishing vessels, NOAA Federal ship financing revolving fund Federal supplementary medical insurance trust fund Foreign service retirement fund General Post fund, VA Gifts and bequests, Commerce GSA participation certificate trust Govemment life insurance fund Govemment National Mortgage Association Govemment National Mortgage Association, MBS investment
account Harry S. Truman memorial scholarship fund Highway trust fund Indian money proceeds of labor, B.I.A Indian tribal funds — Individual Indian money Japan-U.S. friendship trust fund Library of Congress trust fund Low-rent public housing, HUD National Archives gift fund National Archives trust fund National Credit Union share insurance fund, NCUA National insurance development fund, HUD National service life insurance fund Northern Mariana Islands Overseas Private Investment Corporation Pension Benefit Guaranty Corporation Postal service fund Public Health Service conditional gift fund, HEW Public Health Service unconditional gift fund, HEW
55.005 2.039.967
12,700 2.015,000 984,160 31,470
1,301,072
6,242,624 2,694,290
90,455
565,708 6,966
8,573 5,953
25,510
680 330,959
800 10,875 16,480 8,395 150
35,000 85
1,025 2,500
23,786
7,650 15,741
27,851,100
58,085 1.985,245
1.280.000 948.763 33.305
1,514.409
5.964,007 548,722 127,320
780 557,252 6,858
2,706 17,829 74,175
1,283 585
404,358 2,800
33,650 36,295 6,310
40,000
2,100 1,500
151,915
2,000 16,445
27,768,300
52,540 2,259,779
1,654,000 980,376 82,660
1,169,552
5.982.984 2,859.285
49.010
5.195 522.087 6.924
35 2,546 2.957 7.490-
685 462,202
2,200 95,035 9,650
50,000
6,350
3,948
17,900 10,575
32,058,900
105
54,045 2,086,085
36,600 1,150,000 1,490,966 199,705
2,457,565
13,424,768 2,754,981
69,270
1,488,453 28,928
2,631 60,988 61,255
1,330 10,209,260
800 78,010 18,375 4,175
80.000 105 590
2,000
1,070.929 457
17.410 3.145
25.989.100
62,705 2,090,130
19,800 1,341,000 1,017,326
" 1,4067826
6,298,113 3,100,734
99,150
790 570,893
7,487 900
2,923 2,992
58,029
1,235 383,798
1,280 14,050 20,875
60,000
1,070 4,250
999
27.880 4.275
24.245.100
54.730 2.039.153
5.175.000 1,006.879
15 1.242.085
l.OOO 6.314.822 6.269.254
41.965 1.320 660
514.586 7.047
3.278 4.974 58.125
1,240 709,495
800 19,330 52,185
60,000 75
350 4,0Q0
1,961
' ""17^475 25,205,900
57,075 2,058,081
27,1(X) 7,197.000 1,060.271
7.015 1.506.331
6.446.961 7.088.647
89.900
1.370 664.205
7.459
3.420 2.975
1.585 723.637
3.650 26,785 27,675 8,515 160
105,000 50
450 3,000 1,6(K) 1,980
24,225 28.110
24.083.700 30
^ > ifi H
n > r >
i a > <
> — ^
Digitized for FRASER http://fraser.stlouisfed.org/ Federal Reserve Bank of St. Louis

TABLE 33.—Public debt receipts and expenditures by class, monthly for fiscal 1977—Continued ^ [In thousands of dollars] ' ^®
Expenditures (retirements) fisS^1977 ^^^ ^ " ^ ^ ^ ^ ' ^^^^ ^ ^ ^^^^ ^ ^ ' ^^^^ ^^^- ^^^^
Nonmarketable—Continued 5 Govemment account series—Continued "^
Railroad retirement account 5.089,830 317,692 315,868 299,847 304.370 310.020 ^ Railroad retirement supplemental account 158,920 10,450 10,237 9.664 9,695 23,496 W Relief and rehabilitation, longshoremen and harbor workers, g
Department of Labor 665 665 M Special investment account 17.545 2.510 1,100 3.050 3,315 ^ Tax Court judges survivors annuity fund 75 - . Treasury deposit funds 787,552 11,290 66,649 19,825 49,284 47.931 Sd Unemployment tmst fund 14.426.802 634.499 796.218 1,021,568 1,262,979 996,032 J U. S. Army general gift fund 80 33 H Veterans reopened insurance fund 55,114 50 100 g Veterans special life insurance fund, revolving trust fund 85,494 War-risk insurance revolving fund.. 745 120 85 ^
Treasury certificates of indebtedness—REA series 6,734 ^ Treasury bonds—REA series 74 55 'pi Treasury bonds—investment series 151 12 55 —22 27 tfl Treasury certificates of indebtedness—State and local govemment P
Subtotal .
Subtotal
Total nonmarketable
Other
Total public debt expenditures 1,014,024,971
Excess <of receipts, or expenditures I—) 64,137,974 2,901,553 7,035,867 8,904.690 363.183 9.441.510
614.605.621
15,175 314.875
330.050
614.935.671
1.601
1.014.024.971
46.622.005
4 26.242
26.246
46.648.251
88
73.700.948
49.421.967
57 26.294
26.351
49.448.318
159
84.959.865
52.122.058
43 26.728
26.771
52.148.829
89
85.604.477
45.369.245
30 31.448
31.478
45.400.723
93
72.673.064
42.513.906
26.5'64
26.564
42.540.470
90
77.299.959
series 194.706 1.245 3,010 40,715 10,120 7,245 Treasury notes—State and local govemment series 78,343 1,415 1,735 3,395 13,100 2,695 C , Treasury bonds—State and local govemment series 8,025 1,060 U.S. individual retirement bonds 977 2 80 55 105 98 g U.S. retirement plan bonds 6,225 318 205 528 1,013 3,629 ^ U.S. savings bonds 7,064,039 531,985 503,948 605,053 636,258 566,750 H U.S. savings notes 33,897 777 2,917 3,166 1,641 4.192 X Other 505 37 39 40 41 61 "^
H 7i tfl >
Exchanges: C/3 Treasury bonds—investment series 15,175 4 57 43 30 C Series H savings bonds for series E savings bonds 314,875 26.242 26.294 26.728 31,448 26.564 PO
tfl
Digitized for FRASER http://fraser.stlouisfed.org/ Federal Reserve Bank of St. Louis

Expenditures (retirements) Mar. 1977 Apr. 1977 May 1977 June 1977 July 1977 Aug. 1977 Sept. 1977
Nonmarketable—Continued Govemment account series—Continued
Railroad retirement account Railroad retirement supplemental account Relief and rehabilitation, longshoremen and harbor workers.
Department of Labor Special investment account Tax Court judges survivors annuity fund Treasury deposit funds Unemployment trust fund U. S. Army general gift fund Veterans reopened insurance fund Veterans special life insurance fund, revolving trust fund War-risk insurance revolving fund
Treasury certificates of indebtedness—REA series Treasury bonds—REA series Treasury bonds—investment series Treasury certificates of indebtedness—State and local govemment
series Treasury notes—State and local govemment series Treasury bonds—State and local govemment series U. S. individual retirement bonds U. S. retirement plan bonds U. S. savings bonds U. S. savings notes Other
Subtotal
Exchanges: Treasury bonds—investment series Series H savings bonds for series E savings bonds
Subtotal
Total nonmarketable
Other
Total public debt expenditures
Excess of receipts, or expenditures (—)
309.644 10,215
2,010 75
33,671 810,427
50
35
10,935 3,140 5,055
96 —2,264 621.210
3,016 50
316,155 10,314
320,152 4,178
2.520
6.715 702.322
527 2,470 540
65,259 1,184.938
13 486
—3.000
7
12.310 1.500
7.840 17.670
1,657,627 41,337
2.540
336^990 4.144.762
" "53^901 83.024
6.246
" 9
23.120 8.900
308.421 9.799
315,742 9,750
6,558 896,447
136,796 1,004,736
4
1,608 19 23
43,602 9,860
15,375 4,165
116 635
591,273 2,768
41
60 2.159
563.969 3.342
36
134 —1.330 619,074
3,956 47
2,986 489
576,662 1,710
32
100 556
660,343 2,841
45
5,859,146 1.814.623 1.086,229
314.292 9.785
" V o o
6.'5"83 971,874
30
ifi
g 1.880 g
• GO
H 19,188 Q 10,768 p 1.910 ^
—2.855 > 287 5
587.514 Cfl 3,570 Z
35 O
— . 48.869.991
14.344 28.558
42.902
48.912.894
86
82.673.373
45.440.838
8 24.701
24.709
45.465.547
200
79.048.918
53.112.534
15 24.099
24.114
53.136.648
192
95.773.207
77.882.625
3 24.680
24.683
77.907.308
216
112.849.560
45.024.143
402 24.816
25.218
45.049.361
100
71.868.630
52.780.514
58 27.652
27.710
52.808.224
79
87.483.765
55.445.797
211 23.091
23.302
55.469.099
209
90.089.205
2,316,320 —561,287 11,309,907 13,666,233
Digitized for FRASER http://fraser.stlouisfed.org/ Federal Reserve Bank of St. Louis

160 1977 REPORT OF THE SECRETARY OF THE TREASURY
TABLE 34.—Changes in public debt issues, fiscal year 1977 [On basis of Publ ic D e b t accounts ]
Issues Outstanding
Sept. 30, 1976
Issues during
year
Redemptions during
year
Transferred to matured
debt
Outstanding Sept. 30,
1977'
INTEREST-BEARING DEBT
Marketable: Treasury bills, series maturing:'
Regular weekly: Oct. 7, 1976 $6,006,725,000 Oct. 14, 1976 5,916,405,000
Fifty-two weeks: Oct. 19, 1976
Regular weekly: Oct. 21, 1976 5,805,065,000 Oct. 28, 1976 6,003,760,000 Nov. 4, 1976 6,301,905,000 Nov. 12, 1976 6,304,240,000
Fifty-two weeks: Nov. 15, 1976
Regular weekly: Nov. 18, 1976 6,006,150,000 Nov. 26, 1976 6,205,510,000 Dec. 2, 1976 6,004,715,000 Dec. 9, 1976 5,705,775,000
Fifty-two weeks: Dec. 14, 1976
Regular weekly: Dec. 16, 1976 5,306,665.000 Dec. 23, 1976 5,206,795.000 Dec. 30, 1976 5,706,540.000 Jan. 6, 1977 3,506,530,000
Fifty-two weeks: Jan. 11, 1977
Regular weekly: Jan. 13, 1977 3,
$6,006,725,000 5,916,385,000
$400,000
3,253,145,000 3,252,995,000
5,306,665,000 5,206,760,000 5,706,440,000
2,507,345,000 6,013,875,000
3,068,750,000 3,068,635,000
Jan. 20, 1977 Jan. 27, 1977 Feb. 3, 1977...
Fifty-two weeks: Feb. 8, 1977...
Regular weekly: Feb. 10, 1977.. Feb 17, 1977.. Feb. 24, 1977.. Mar. 3, 1977...
Fifty-two weeks: Mar. 8, 1977...
Regular weekly: Mar. 10, 1977.. Mar. 17, 1977.. Mar. 24, 1977.. Mar. 31, 1977..
Fifty-two weeks: Apr. 5, 1977...
Regular weekly: Apr. 7. 1977... Apr. 14, 1977.. Apr. 21, 1977.. Apr. 28, 1977..
Fifty-two weeks: May 3, 1977...
Regular weekly: May 5, 1977 May 12, 1977 May 19, 1977 May 26, 1977
Fifty-two weeks: May 31, 1977 2,
Regular weekly: June 2, 1977 June 9, 1977 -June 16, 1977 June 23, 1977
See footnotes at end of table.
,503,335,000 ,501,470,000 ,606,325.000 ,698,610,000
2,407,860,000 2,402.915,000 2,503,850,000 2,604,625,000
5,911,170.000 5,904.005.000 6,109,565,000 6,303,100,000
2,930,390,000 2,930,230,000
,802,665,000 ,603,485,000 ,602,065,000 ,602,115,000
2,603,915,000 2,500,720,000 2,602,050,000 2,507,490,000
6,406,535,000 6,104,185,000 6,203,995,000 6,109,545,000
3,104,915,000 3,104,820,000
,405,430,000 ,102,515,000 ,104,595,000 ,4O4,0ia000
2,305,715,000 2,104,170,000 2,110,380,000 2,306,940,000
5,711,105,000 5,206.590,000 5,214,955.000 5,710,905.000
3,202,725,000 3,202,615,000
6,012.665,000 5,920,455,000
12,315,630.000 6,008,140,000
6,012,510,000 5,920,105,000
12,315,570,000 6,007,945,000
3,335,470,000 3,335,460,000
6,312,930,000 6,405,365,000 6,007,605,000 6,210,150,000
6,312,740,000 6,405,300,000 6,007,575,000 6,210,040,000
,921,370,000 2,920,960,000
6,009,370,000 5,706,160,000 7,314,670,000 5,209,695,000
6,009,235.000 5,706,020,000 7,314,520,000 5,209,415,000
3,061,880,000 3,061,790,000
5,805,050,000 6,003,740,000 6,302,285,000 6,304,240,000
3,244,555,000 3,244,500,000
6,006,120,000 6,205,490,000 6,004,680,000 5,705,715,000
$20,000
90,000
15,000 20,000 20,000
55.000
30,000 20,000 35,000 60,000
150,000
35,000 100,000
115,000
25,000 380,000 610,000 135,000
160,000
45,000 20,000 120,000 60,000
95.000
40,000 95,000 20,000 45,000
110,000
155,000 350,000 60,000 195,000
10,000
190,000 65,000 30,000 110,000
410,000
135,000 140,000 150,000 280,000
Digitized for FRASER http://fraser.stlouisfed.org/ Federal Reserve Bank of St. Louis
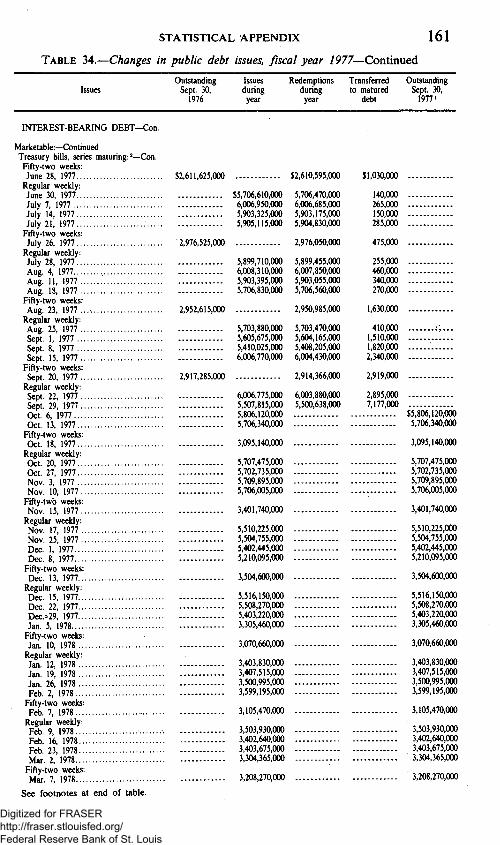
STATISTICAL APPENDIX 161
TABLE 34.—Changes in public debt issues, fiscal year 1977—Continued
Issues Outstanding
Sept. 30, 1976
Issues during
year
Redemptions during
year
Transferred to matured
debt
Outstanding Sept. 30,
1977 >
INTEREST-BEARING DEBT-Con .
Marketable:—Continued Treasury bills, series maturing:'—Con.
Fifty-two weeks: June 28, 1977
Regular weekly: June 30, 1977 July 7, 1977 July 14, 1977 July 21, 1977
Fifty-two weeks: July 26, 1977
Regular weekly: July 28, 1977 Aug. 4, 1977 Aug. 11, 1977 Aug. 18, 1977
Fifty-two weeks: Aug. 23, 1977. . . .
Regular weekly: Aug. 25, 1977 Sept. 1, 1977 Sept. 8. 1977 Sept. 15, 1977
Fifty-two weeks: Sept. 20, 1977
Regular weekly: Sept. 22, 1977 Sept. 29, 1977 Oct. 6. 1977 Oct. 13, 1977
Fifty-two weeks: Oct. 18, 1977
Regular weekly: Oct. 20, 1977 Oct. 27, 1977 Nov. 3, 1977 Nov. 10, 1977
Fifty-two weeks: Nov. 15, 1977
Regular weekly: Nov. 17, 1977 Nov. 25, 1977 •. Dec. 1, 1977 Dec. 8, 1977
Fifty-two weeks: Dec. 13, 1977
Regular weekly: Dec. 15, 1977 Dec. 22, 1977.. Dec.«29, 1977 Jan. 5, 1978
Fifty-two weeks: Jan. 10, 1978
Regular weekly: Jan. 12, 1978 Jan. 19, 1978 Jan. 26, 1978 Feb. 2, 1978
Fifty-two weeks: Feb 7, 1978
Regular weekly: Feb 9. 1978 Feb 16, 1978 Feb 23, 1978 Mar. 2, 1978
Fifty-two weeks: Mar. 7, 1978
$2,611,625,000 $2,610,595,000
$5,706,610,000 5,706,470,000 6,006,950,000 6,006.685,000 5,903,325,000 5,903,175,000 5,905,115,000 5,904,830,000
2,976,525,000 2,976,050,000
2,952,615,000
5,899,710,000 6,008,310,000 5,903,395,000 5,706,830,000
5,703,880,000 5,605,675,000 5,410,025,000 6,006,770,000
5,899,455,000 6,007,850,000 5,903,055,000 5,706,560,000
2,950,985,000
5,703,470,000 5,604,165,000 5,408,205,000 6,004.430,000
2,917,285,000 2,914,366,000
6,006,775,000 5,507,815,000 5,806,120,000 5,706.340,000
3,095,140,000
5,707,475,000 5.702,735,000 5,709,895,000 5,706,005,000
3,401,740,000
5,510,225,000 5,504,755,000 5,402,445,000 5,210,095,000
3,504,600,000
5,516,150,000 5,508,270,000 5,403,220,000 3,305,460,000
3,070,660,000
3,403,830,000 3,407,515,000 3,500,995,000 3,599,195,000
3,105,470,000
3,503,930,000 3,402,640,000 3,403,675,000 3,304,365,000
3,208,270,000
6,003,880,000 5,500,638,000
$1,030,000
140,000 265,000 150,000 285,000
475,000
255,000 460,000 340,000 270,000
1,630,000
410,000 : . . . . 1,510,000 1,820,000 2,340,000
2,919,000
2,895,000 7,177,000
$5,806,120,000 5,706,340.000
3,095,140,000
5,707,475,000 5,702,735,000 5,709,895,000 5,706,005,000
3,401,740,000
5,510,225,000 , 5,504,755,000 , 5,402,445,000
5,210,095,000
3,504,600,000
5,516,150,000 5,508,270,000 5,403,220,000 3,305,460,000
3,070,660,000
3,403,830,000 3,407,515,000 3,500,995,000 3,599,195,000
3,105,470,000
3,503,930,000 3,402,640,000 3,403,675,000
• 3,304,365,000
3,208,270,000
See footnotes at end of table.
Digitized for FRASER http://fraser.stlouisfed.org/ Federal Reserve Bank of St. Louis

162 1977 REPORT OF THE SECRETARY OF THE TREASURY
TABLE 34.—Changes in public debt issues, fiscal year 1977—Continued
Issues Outstanding
Sept. 30, 1976
Issues during
year
Redemptions during
year
Transferred to matured
debt
Outstanding Sept. 30,
1977»
INTEREST-BEARING D E B T - C o n .
Marketable:—Continued Treasury bills, series maturing:'—Con.
Regular weekly: Mar. 9, 1978 Mar. 16. 1978 Mar. 23, 1978 Mar. 30, 1978
Fifty-two weeks: Apr. 4, 1978 May 2, 1978 May 30, 1978 June 27, 1978 July 25, 1978 Aug. 22, 1978 Sept. 19, 1978
$3,203, 3,376, 3,502, 3.302,
3,342, 2,966, 2,454, 2,252, 3,037, 3,004, 3,035,
,120,000 ,735,000 ,050,000 710,000
455,000 ,135,000 330,000 ,925,000 575,000 675,000 920,000
$3,203,120,000 3,376,735,000 3,502,050,000 3,302,710.000
3,342.455,000 2.966,135.000 2,454,330,000 2,252,925,000 3,037,575,000 3,004,675,000 3,035,920,000
Total Treasury bills $161.504,650.000 348,272,24O.000$353.657.669.O0O $29.376,000 156.089,845,000
Treasury notes: 6V4% Series D-1976 4,324,602,000 1'/^% Series K-1976 2,282,020,000 l'U% Series N-1976 1,507,345,000 6%% Series 0-1976 1,578,950,000 8% Series A-1977 5,162,870,000 7%% Series B-1977 4,918,352,000 678% Series C-1977 2,564,929,000 9% Series D-1977 5,328,809,000 7%% Series E-1977 3,629,685,000 6% Series F-1977 1,664,875,000 (i'/2% Series G-1977 2,575,650,000 1%% Series H-1977 1,578,685,000 6y4% Series 1-1977 2,137,085,000 6%% Series J-1977 2,169,980,000 l'/2% Series K-1977 1,516,165,000 %'/,% Series L-1977 2,021,105,000 8y8% Series M-1977 3,226,155,000 7%% Series N-1977. 3,155,615,000 1'/,% Series P-1977 2,765,065,000 6y8% Series Q-1977 2,627,685,000 6%% Series A-1978 8,388,504,000 6% Series B-1978 8,207,497,000 874% Series C-1978 2,462,250.000 1'/,% Series D-1978 3,959,926,000 778% Series E-1978 5,155.070.000 778% Series F-1978 4,423,070,000 8% Series G-1978 2,114,975,000 878% Series H-1978 2,516,625,000 678% Series J-1978 2,510,760,000 674% Series K-1978 3,162,060,000 67,% Series L-1978 2,574,245,000 778% Series M-1978 2,567,160,000 678% Series N-1978 3,330.835.000 678% Series P-1978 2,855,225.000 678% Series Q-1978 2,949,320,000 674% Series R-1978 3,191,630,000 578% Series S-1978 574% Series T-1978 574% Series U-1978 674% Series A-1979 678% Series B-1979 7% Series C-1979 778% Series D-1979 2, 774% Series E-1979 1, 87a% Series F-1979 2,
See footnotes at end of table.
-25,000
10,000
,558.922,000 ,603.738.000 ,240,566,000 269,067,000 ,781,565,000 ,080.568.000
2.980.000 2,920,700,000 2,941,140,000 3,376.325,000
4,323,104,000 1,498,000 « 2,281,645,000 375,000 1,507,090,000 255,000 1,578,760,000 190,000 5,153,670,000 9,200,000 4.894.241,000 24,111.000 2.562,816,000 2,113,000 5,311,702,000 17,107,000 . —
3,629,660,000 1,664,230,000 645,000 2.575.290.000 360.000 1.577.520.000 1,165.000 2,135,755,000 1,330,000 2,168,615,000 1,365,000 ' 1,513,715.000 2,450.000 2,013,660,000 7,445,000 2,977,923,000 248,232,000
3,155,615,000 2,765,065,000 2,627,685,000 8,388,504,000 8.207,497,000 2,462,260,000 . 3,959,926,000 '* 5,155,070,000 4,423,070,000 2,114,975,000 2,516,625,000 2,510,760,000 3,162,060,000 2,574,245.000 2,5^7.160.000 3,330.835,000 2,855,225,000 ' 2,949,320,000 3,194.610,000 ; 2,920.700,000 2,941,140,000 3,376,325,000 4,558,922,000 1,603,738,000 2,240,566,000 2,269,067,000 1,781,565,000 ^ 2,080,568.000
Digitized for FRASER http://fraser.stlouisfed.org/ Federal Reserve Bank of St. Louis

STATISTICAL APPENDIX 163
TABLE 34.—Changes in public debt issues, fiscal year 7977—Continued Outstanding Issues Redemptions Transferred Outstanding
Issues Sept. 30, during during to matured Sept. 30, 1976 year year debt 1977'
INTEREST-BEARING D E B T - C o n .
Marketable:—Continued Treasury notes—Continued
7'/2% Series G-1979 $2,005,913,000 $2,005,913,000 7% Series H-1979 4,691,680,000 4,691,680,000 678% Series J-1979 2,988,570,000 $40,000 2,988,610,000 6'/4% Series K-1979 3,375,520,000 3,375,520,000 578% Series L-1979 2,854,555,000 2,854,555,000 578% Series M-1979 2,845,190,000 2,845,190,000 6% Series N-1979 3,518,625,000 3,518,625,000 578% Series P-1979 1,991,665,000 1,991,665,000 6'/8% Series Q-1979 2,087,280,000 2,087,280,000 6'/8% Series R-1979 2,307,920,000 2,307,920,000 6'/«% Series S-1979 3,180,360,000 3,180,360,000 679% Series t-1979 3,481,265,000 3,481,265,000 678% Series U-1979 3,859,710,000 3,859,710.000 678% Series A-1980 7,264,553,000 7,264,553,000 9% Series B-1980 4,296,102,000 4,296,102,000 7'/,% Series C-1980 2,069,280,000 2,069,280,000 778% Series D-1980 2,185,082,000 2,185,082,000 678% Series E-1980 2,140,584,000 2,140,584,000 578% Series F-1980 2,692,020,000 2,692,020,000 6'/2% Series G-1980 4,608,050,000 4,608,050,000 67«% Series H-1980 4,133,350,000 4,133,350,000 7% Series A-1981 1,841,601,000 1,841,601,000 77«% Series B-1981 4,476,721,000 4,476,721,000 778% Series C-198P 4,795,778,000 4,795,778,000 778% Series D-1981 2,019,817,000 2,019,817,000 778% Series F-1981 2,585,917,000 2,585,917,000 7% Series G-1981 2,542,877,000 2,542,877,000 678% Series H-1981 2,809,481,000 2,809,481,000 674% Series J-1981 2,513,700,000 2,513,700,000 674% Series K-1981 2,968,222,000 2,968,222,000 8% Series A-1982 2,746,801,000 2,746,801,000 8'/8% Series B-1982 2,918,220,000 2,918,220,000 778% Series C-1982 2,902,263,000 2,902,263,000 6'/8% Series D-1982 2,697,410,000 2,697,410,000 7% Series E-1982 2,612,883,000 2,612,883,000 8% Series A-1983 7,958,021,000 7,958,021,000 7% Series B-1983 2,308,594,000 2,308,594,000 7'/,% Series A-1984 8,437,727,000 8,437,727,000 7'/4% Series B-1984 2,863,484,000 2,863,484,000 778% Series A-1986 5,218,882,000 5,218,882,000 8% Series B-1986 9,514,856,000 30,000 9,514,886,000 1'/,% Series EO-1976 10,557,000 $10,556,000 $1,000 l'/2% Series EA-1977 5,040,000 5,040,000 l'/2% Series EO-1977 16,923,000 16,923,000 l'/a% Series EA-1978 14,874,000 14,874,000 \'/2% Series EO-1978 3,032,000 3,032,000 \'/2% Series EA-1979 2,185,000 2,185,000 l'/a% Series EO-1979 1,230,000 1,230,000 \'/2% Series EA-1980 2,138,000 2,138,000 1'/,% Series EO-1980 2,894.000 2,894,000 1'/,% Series EA-1981 425,000 -6 ,000 419,000 1'/,% Series EO-1981 14,495,000 14,495,000 1'/,% Series EA-1982 703.000 703,000
Total Treasury notes 206.319.144,000 79.946.280,000 44.255.332.000 317.842.000 241.692,250,000
Treasury bonds: 474% of 1975-85 1,070,748,000 17,678,500 1,053,069,500 3'/4% of 1978-83 1,343,563,500 75,904,500 1,267,659,000 4% of 1980 2,509,366,500 8,837,000 2,500,529,500 3%% of 1980 1,759,800,500 3,756,000 1,756,044,500 7% of 1981 806,934,000 806,934,000 678% of 1982 2,702,197,000 2,702,197,000
See footnotes at end of table.
Digitized for FRASER http://fraser.stlouisfed.org/ Federal Reserve Bank of St. Louis

164 1977 REPORT OF THE SECRETARY OF THE TREASURY
TABLE 34.—Changes in public debt issues, fiscal year 1977—Continued Outstanding Issues Redemptions Transferred Outstanding
Issues Sept. 30, during during to matured Sept. 30, 1976 year year debt 1977'
I N T E R E S T - B E A R I N G D E B T - C o n .
Marketable—Continued Treasury bonds—Continued
678% of 1984 $2,352,730,000 $2,352,730,000 3'/4% of 1985 823,592,000 $44,694,500 778,897,500 6'/8% of 1986 1,216,261,000 1,216,261,000 4'/4% of 1987-92 3,068,914,500 131,245,500 2,937,669,000 4% of 1988-93 192,643,500 5,483,500 187,160,000 7'/j% of 1988-93 1,914,101,000 1,914,101,000 4'/,% of 1989-94 1,164,685,000 69,062,500 1,095,622,500 l'/2% of 1990 3,150,647,500 239,677,500 2,910,970,000 8'/4% of 1990 1,247,342,000 1,247,342,000 7'/«% of 1992 $1,504,394,000 1,504,394,000 67«% of 1993 627,201,000 627,201,000 7% of 1993-98 691,756,000 2,000 691,754,000 8'/,% of 1994-99 2,414,493,000 2,414,493,000 3% of 1995 639,116,500 62,144,000 576,972,500 778% of 1995-00 1,769,865,000 1,001,289,000 2,771,154,000 878% of 1995-00 2,265,176,000 2,265,176,000 8% of 1996-01 1,575,396,000 10,000 1,575,406,000 3'/2% of 1998 2,310,921,500 210,857,000 2,100,064,500 8'/4% of 2000-05 2,221,402,000 2,221,402,000 778% of 2002-07 4,249,042,000 4,249,042.000
Total Treasury bonds 39,838,853,000 6,754,735,000 869,342,500 45,724,245,500
Total marketable 407,662,647,000 434.973,255,000 398,782,343,500 $347,218,000 443,506.340,500
Nonmarketable: Depositary bonds:
First series 8,686,000 11,170,500 12,471.500 7,385,000
Federal Reserve special certificate: 5'/2% of 1977 2,500.000,000 2,500,000,000
Foreign govemment series: Dollar denominated:
Bills: 10/7/76 42,700,000 42,700,000 10/14/76 359,135,000 359,135,000 11/4/76 40,000,000 40,000,000 11/12/76 243,190,000 243,190,000 12/2/76 47,425,000 47,425,000 12/14/76 40,000,000 40,000,000 1/6/77 42,700,000 42,700,000
. 1/13/77 168,965,000 168,965,000 2/3/77 40,000,000 40,000,000 3/10/77 240,000,000 240,000,000 3/31/77 300,000,000 300,000,000 .". 4/14/77 237,250,000 237,250,000 5/5/77 40,000,000 40,000,000 5/12/77 249,500,000 249,500,000 5/26/77 30.360,000 30,360,000 6/2/77 47,425,000 47,425,000 6/9/77 42,700,000 42.700,000 8/4/77 40,000,000 40,000,000 8/25/77 10,130,000 10,130,000 9/8/77 42,700,000 42,700,000 10/13/77 242,040,000 242,040,000 11/10/77 256,300,000 256,300,000 12/1/77 47,425,000 47,425,000 2/2/78 40,000,000 40,000,000 3/9/78 42,700,000 42,700,000
See footnotes at end of table.
Digitized for FRASER http://fraser.stlouisfed.org/ Federal Reserve Bank of St. Louis
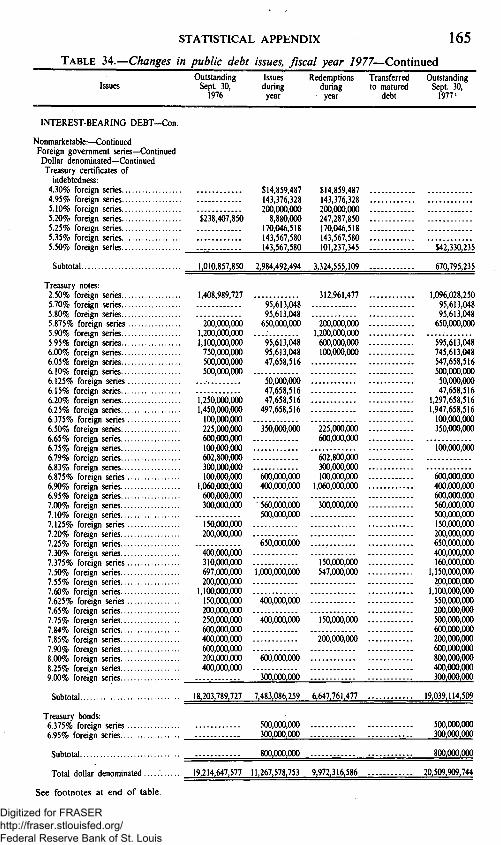
STATISTICAL APPENDIX 165
TABLE 34.—Changes in public debt issues, fiscal year 1977—Continued
Issues Outstanding
Sept. 30, 1976
Issues during
year
Redemptions during
year
Transferred to matured
debt
Outstanding Sept. 30,
1977'
INTEREST-BEARING DEBT-Con .
Nonmarketable:—Continued Foreign govemment series—Continued
Dollar denominated—Continued Treasury certificates of
indebtedness: 4.30% foreign series 4.95% foreign series 5.10% foreign series 5.20% foreign series 5.25% foreign series 5.35% foreign series 5.50% foreign series
$238,407,850
$14,859,487 143,376,328 200,000,000
8,880,000 170,046,518 143,567,580 143,567,580
$14,859,487 143,376,328 200,000,000 247,287,850 170,046,518 143,567,580 101,237,345
Subtotal.. L010,857,850 2,984,492,494 3,324,555,109
Treasury notes: 2.50% foreign series... 5.70% foreign series... 5.80% foreign series... 5.875% foreign series. 5.90% foreign series... 5.95% foreign series... 6.00% foreign series... 6.05% foreign series... 6.10% foreign series... 6.125% foreign series. 6.15% foreign series... 6.20% foreign series... 6.25% foreign series... 6.375% foreign series . 6.50% foreign series... 6.65% foreign series... 6.75% foreign series... 6.79% foreign series... 6.83% foreign series... 6.875% foreign series . 6.90% foreign series... 6.95% foreign series... 7.00% foreign series... 7.10% foreign series... 7.125% foreign series . 7.20% foreign series... 7.25% foreign series... 7.30% foreign series... 7.375% foreign series. 7.50% foreign series... 7.55% foreign series... 7.60% foreign series... 7.625% foreign series. 7.65% foreign series... 7.75% foreign series... 7.84% foreign series... 7.85% foreign series... 7.90% foreign series... 8.00% foreign series... 8.25% foreign series... 9.00% foreign series...
1,408,989,727
200,000,000 1.200,000,000 1,100,000,000 750,000,000 500,000,000 500,000.000
1,250,000.000 1.450,000,000 100,000,000 225,000,000 600,000,000 100,000,000 602,800,000 300,000,000 100.000,000
1,060,000,000 600,000,000 300,000,000
' I50,'(XX),()()b 200,000,000
406,066,000 310,000,000 697,000,000 200,000,000
1,100,000,000 150,000,000 200,000,000 250,000,000 600,000,000 400,000,000 600,000,000 200,000,000 400.000,000
95,613,048 95,613,048
650,000,000
" 95^613,048 95,613,048 47,658,516
" 50,666,000 47,658,516 47,658,516
497,658,516
350^666,000
600,000,000 400,000,000
"566,666,000 500,000,000
650,000,000
'i',666w,'ooo
"466*666,066
"w666,oo6
"660^666,006
312,961,477
200,000,000 1,200,000,000 600,000,000 100,000,000
225,000,000 600,000.000
"'662,806.006 300,000,000 100,000,000
1,060,000,000
"300,666,000
150,000,000 547,000,000
150,000,000
"266,006,060
Subtotal..
Treasury bonds: 6.375% foreign series . 6.95% foreign series...
Subtotal
Total dollar denominated
See footnotes at end of table.
18,203,789,727
19,214,647,577
300,000,000
7.483.086,259
500,000,000 300,000.000
800,000,000
11,267.578,753
6,647,761.477
9,972,316,586
300,000,000
19,039,114,509
500,000,000 300,000,000
800,000,000
20,509,909,744
$42,330,235
670,795,235
1,096,028,250 95,613,048 95,613,048
650,000,000
" 595*613,048 745,613,048 547,658,516 500,000,000
50,000,000 47,658,516
1,297,658,516 1,947,658,516
100,000,000 350,000,000
"*i'o6*,666,"o6o
600,000,000 400,000,000 600,000,000 560,000,000 500,000,000 150,000,000 200,000,000 650,000,000 400,000,000 160,000,000
1,150,000,000 200,000,000
1,100,000,000 550,000,000 200,000,000 500,000,000 600,000,000 200,000,000 600,000,000 800,000,000 400,000,000
Digitized for FRASER http://fraser.stlouisfed.org/ Federal Reserve Bank of St. Louis

166 1977 REPORT OF THE SECRETARY OF THE TREASURY
TABLE 34.—Changes in public debt issues, fiscal year 7977—Continued
Issues
INTEREST-BEARING D E B T - C
Nonmarketable:—Continued Foreign government series—Con.
Foreign currency denominated: Treasury notes:
5.25% foreign currency series. . . 5.60% foreign currency series . . . 5.80% foreign currency series . . . 5.90% foreign currency series. . . 5.95% foreign currency series . . . 6.08% foreign currency series . . . 6.10% foreign currency series. . . 6.20% foreign currency series . . . 6.35% foreign currency series . . . 6.39% foreign currency series . . . 6.40% foreign currency series . . . 6.50% foreign currency series . . . 6.60% foreign currency series. . . 6.70% foreign currency series . . . 6.75% foreign currency series . . . 6.95% foreign currency series . . . 7.05% foreign currency series. . . 7.15% foreign currency series. . . 7.25% foreign currency series . . . 7.35% foreign currency series . . . 7.70% foreign currency series . . . 7.75% foreign currency series . . .
Total foreign currency denominated
Govemment account series: Airport and airway trust fund:
6'/a% certificates 6y«% certificates 6'/*% certificates
Aviation war-risk insurance revolving fund:
Rilk 12/14/76 Bilk 4/5/77 Bills 6/28/77 Bills 4/4/78 Bilk 5/30/78"" Bilk 7/25/78
Bonneville Power Administration: Bilk 10/7/76 Bilk 10/14/76 Bilk 10/19/76 Bilk 10/21/76 Bilk 10/28/76 Bilk 11/4/76 Bilk 11/12/76 BUls 11/15/76 Rilk 11/18/76 Rilk 11/26/76 Rilk 12/2/76 Rilk 12/9/76 Rilk 12/14/76 Rilk 12/16/76 Rilk 12/2V76 Rilk 12/30/76 Rilk 1/6/77 Rilk 1/11/77 Rilk 1/13/77 Rilk 1/20/77 Rilk 1/27/77 Rilk 9/3/77 Bills 2/8/77
Outstanding Sept. 30,
1976
on.
$63,639,593 127,279,185 147,999,053 73,703,528
170,198,911 38,479,754 32,559.792
66,599,574 29,599.811
400.183,519 32,559,792 38,479,754
170,198,911 50,319,678 28,711,816
128,759.176
. . . . 1.599.271.845
2,712,201,000
"
7710000 6 705 000
10,000,000
Issues during
year
$137,047,123 159,838,977 50,319.678 49.733,602 38,479,754
359,927,776
25,455,837
22,495,856
843.298,603
353,385,000 317,571,000
3,958,338,000
7,790,000 6,750,000 8,015,000
430,000
7,000,000 120,000
5,000,000 5,020,000 5,000,000 8,000,000 1,225,000 5,000,000 5,000,000 5,000,000 7,000,000 1,760,000 6,335,000 7,700,000 5,000.000 6,475,000
190,000 7,675.000 2,000,000 5,535,000 5,915,000
265.000
Redemptions Transferred during to matured
year debt
$63 639 593 26 047 833
38.183,756 170,198,911 38,479,754
400183.519
38 479,754 170198.911 . . . 50319,678 28711,816
128.759.176
1.153.202.699
3.065,586,000 96,995,000
932,933,000
7,710,000 6,705,000 7,790,000
10,000,000 7,000,000
120,000 5,000,000 5,020,000 5,000,000 8,000,000 1,225,000 5,000,000 5,000,000 5,000,000 7,000,000 1,760,000 6,335,000 7,700,000 5,000,000 6,475,000
190,000 7.675,000 2,000,000 5,535,000 5,915,000
265,000
Outstanding Sept. 30,
1977'
$137,047,123 159,838,977 50,319,678 49,733,602 38,479,754
461 159,129 147,999,053 35,519,773
25,455,837 32,559,792 22,495,856 66,599,574 29,599.811 ^
32,559,792
1,289,367,748
/ 220,576,000
3,025,405,000
6,750,000 8,015,000
430.000 ^
1
t
See footnotes at end of table.
Digitized for FRASER http://fraser.stlouisfed.org/ Federal Reserve Bank of St. Louis

STATISTICAL APPENDIX 167
TABLE 34.—Changes in public debt issues, fiscal year 1977—Continued
Issues Outstanding
Sept. 30, 1976
Issues during
year
Redemptions during
year
Transferred to matured
debt
Outstanding Sept. 30:
1977'
INTEREST-BEARING D E B T - C o n .
Nonmarketable—Continued Govemment account series—Continued
Bonneville Power Administration—Continued Bills 2/10/77 Bills 2/17/77 Bills 2/24/77 Bills 3/3/77 Bills 3/8/77 Bills 3/10/77 Bills 3/17/77 Bills 3/24/77 Bills 3/31/77 Bills 4/5/77 Bills 4/7/77 Bills 4/14/77 Bills 4/21/77 Bills 4/28/77 Bills 5/3/77 Bills 5/5/77 Bills 5/12/77 Bills 5/19/77 Bills 5/26/77 Bills 5/31/77 Bills 6/2/77 Bills 6/9/77 Bills 6/16/77 Bills 6/23/77 Bills 6/30/77 Bills 7/7/77 Bills 7/14/77 Bills 7/21/77 Bills 7/26/77 Bills 7/28/77 Bills 8/4/77 Bills 8/11/77 Bills 8/18/77 Bills 8/23/77 Bills 8/25/77 Bills 9/1/77 Bills 9/8/77 Bills 9/15/77 Bills 9/20/77 Bills 9/29/77 Bills 1/12/78 5.25% certificates 878% notes $29,345,000 8% notes 6'/2% notes
Civil service retirement fund: 7'/8% certificates 408.870,000 7% certificates 678% certificates 6'/a% certificates 678% certificates 778% notes 2,742,233,000 678% notes 3,951,273,000 6'/8% notes 5,828,489,000 574% notes 3,980,233,000 778% bonds 5,379,691,000 7'/2% bonds 8,020,529,000 778% bonds 6,212,608,000 7'/8% bonds 4'/8% bonds 2,080.708.000
- 378% bonds 826,643,000
See footnotes at end of table.
$6,120,000 6,375,000 8,815,000 7,250.000
310,000 7,000.000
10.085,000 7,475,000
12,525,000 235,000
7,000,000 10,720,000 7,365,000 9,820,000
190,000 6.500.000 5,500.000 7,485,000
18.610.000 11,720,000 6,140,000
10,005,000 15,850,000 19,315,000 21,075,000 16,610,000 17,460,000 18,880,000 3,280,000
13,015,000 14,750,000 14,745,000 12,400,000 2.570,000.
13,395,000 4,310,000 3,815.000 5,635,000 3,290,000
15,420,000 4,085,000
17,180,000 59,620,000
30,000 50,000
3,750,571,000 8,539,358,000
541,171,000 1,779,537,000
541.595,000
$6,120,000 6.375.000 8,815,000 7,250,000
310,000 7,000,000
10,085,000 7,475,000
12,525,000 235,000
7,000,000 10,720,000 7,365,000 9,820,000
190,000 6.500,000 5,500,000 7,485,000
18,610,000 11,720,000 6,140.000
10.005.000 15,850.000 19,315,000 21,075,000 16,610,000 17,460,000 18,880,000 3,280.000
13,015,000 14,750,000 14,745,000 12,400.000 2,570,000
13,395,000 4,310,000 3,815,000 5,635,000 3,290,000
15,420,000 4,085,000
17,180,000 88,965,000
30,000 50,000
3,591,283,000 12,000
541,171,000 1,779,537,000
541.595,000 2.742,233.000
$568,158,000 12,000 8,539,346,000
3,472,048,000
3,951,273,000 1,526,742,000 4,301,747,000
3,980,233,000 5,379,691,000 8,020,529,000 6.212,608,000 3,470,932,000 1,938,234,000
1,116,000 142,474,000 826,643,000
Digitized for FRASER http://fraser.stlouisfed.org/ Federal Reserve Bank of St. Louis

168 1977 REPORT OF THE SECRETARY OF THE TREASURY
TABLE 34.—Changes in public debt issues, fiscal year 1977—Continued Outstanding
Sept. 30, 1976
Issues during
year
Redemptions during
year
Transferred to matured
debt
Outstanding Sept. 30,
1977'
INTEREST-BEARING D E B T - C o n .
Nonmarketable—Continued Govemment account series—Continued
Comptroller of the Currency, assessments fund:
Bills 1/13/77 $30,300,000 Bills 7/14/77 $7,000,000 Bills 7/21/77 8,000,000 Bills 7/28/77 6,000,000 Bills 8/4/77 18,000,000 Bills 1/12/78 42,500,000 8% notes 5,000,000 7'/4% notes 1,900,000
Comptroller of the Currency, trustee fund:
874% notes 210,000 678% notes 5,000
Contributed funds. Bureau of Indian Aft'airs:
Bills 4/7/77 135,000 Bills 4/28/77 135,000
Department of the Navy, general gift fund:
778% bonds 30,000 Department of the Navy, U.S.
Office of Naval Records and History:
778% bonds .- 127,000 18,000 Department of State, conditional
gift fund, general: Bills 2/8/77 215,000 Bills 11/15/77 130,000 Bills 2/7/78 225,000 Bills 4/4/78 125,000
Emergency loan guarantee fund: Bills 8/23/77 25,930,000 3,660,000 Bills 8/22/78 31,510,000
Employees health benefits fund: Bills 10/14/76 79,400,000 Bills 10/28/76 125,355,000 Bills 11/11/76 67,960,000 Bills 11/26/76 133,085,000 Bills 12/2/76 1,240,000 Bills 12/9/76 88,310,000 Bills 12/23/76 36,695,000 147,900,000 Bills 12/30/76 39,170,000 Bills 1/13/77 68,790,000 Bills 1/27/77 147,665,000 Bills 2/10/77 81,075,000 Bills 2/24/77 147,575,000 Bills 3/10/77 76,655,000 Bills 3/24/77 - 141,990,000 Bills 4/14/77 87,630,000 BUls 4/28/77 138.400,000 Bills 5/12/77 77,760,000 Bills 5/26/77 169,035,000 Bills 6/9/77 82,295,000 Bills 6/23/77 185,690,000 BUls 7/14/77 106,075,000 Bills 7/28/77 148,965,000 Bills 8/11/77 76,655,000 Bills 8/25/77 141.160,000 Bills 9/8/77 156,655,000 Bills 9/22/77 137.095,000 Bills 10/13/77 79,655,000 Bills 10/27/77 38.160,000 Bills 12/8/77 3,340,000 BUls 12/22/77 56,690,000
See footnotes at end of table.
$30,300,000 7,000,000 8,000,000 6,000,000
18,000,000 8,000,000
135,000 135,000
215,000
29,590,000
79,400, 125,355, 67,960,
133.085 1,240,
88,310, 184,595, 39,170, 68,790,
147,665, 81,075,
147,575, 76,655
141,990, 87,630,
138,400, 77,760,
169,035, 82,295,
185,690, 106,075, 148,965, 76,655,
141,160, 156,655, 137,095,
1,755,
,000 ,000 ,000 ,000 ,000 000 ,000 ,000 ,000 ,000 ,000 ,000 ,000 ,000 ,000 ,000 ,000 ,000 ,000 ,000 ,000 ,000 ,000 ,000 ,000 ,000 ,000
210,000 5,000
30,000
145,000
31,510,000
Digitized for FRASER http://fraser.stlouisfed.org/ Federal Reserve Bank of St. Louis
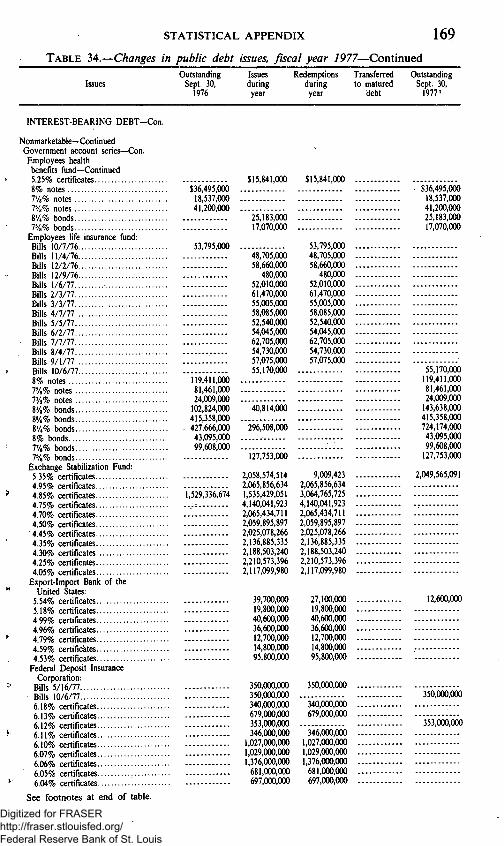
STATISTICAL APPENDIX 169 TABLE 34.—Changes in public debt issues, fiscal year 1977—Continued
Issues Outstanding
Sept. 30, 1976
Issues during year
Redemptions during year
Transferred to matured
debt
Outstanding Sept. 30,
1977'
INTEREST-BEARING DEBT-Con.
Nonmarketable—Continued Goverament account series—Con. Employees health benefits fund—Continued 5.25% certificates 8% notes 77g% notes 778% notes 8'/*% bonds 778% bonds
Employees life insurance fund: Bills 10/7/76 Bills 11/4/76 Bills 12/2/76 Bills 12/9/76 Bills 1/6/77 Bills 2/3/77.. Bills 3/3/77 Bills 4/7/77 Bills 5/5/77 Bills 6/2/77 Bills 7/7/77 Bills 8/4/77 Bills 9/1/77 Bills 10/6/77 8% notes 778% notes 7'/2% notes 8'/2% bonds 878% bonds 8'/4% bonds 8% bonds 778% bonds 778% bonds
Exchange Stabilization Fund: 5.35% certificates 4.95% certificates 4.85% certificates 4.75% certificates 4.70% certificates 4.50% certificates 4.45% certificates 4.35% certificates 4.30% certificates 425% certificates 4.05% certificates
Export-Import Bank of the United States:
5.54% certificates 5.18% certificates 4.99% certificates 4.96% certificates 4.79% certificates 4.59% certificates 4.53% certificates
Federal Deposit Insurance Corporation:
Bills 5/16/77 Bills 10/6/77 6.18% certificates 6.13% certificates 6.12% certificates 6.11% certificates 6.10% certificates 6.07% certificates 6.06% certificates 6.05% certificates 6.04% certificates
See footnotes at end of table.
$36,495,000 18,537,000 41,200,000
53,795,000
$15,841,000 $15,841,000
25,183,000 17,070,000
48,705,000 58,660,000
480,000 52,010,000 61,470,000 55,005,000 58,085,000 52,540,000 54,045.000 62,705,000 54,730,000 57,075,000 55,170,000
119,411,000 81,461,000 24,009,000 102,824,000 40,814,000 415,358,000
• 427,666,000 296,508,000 43,095,000 99,608,000
127,753,000
2,058.574,514 2,065,856,634
1,529,336,674 1,535,429,051 4,140,041,923 2,065,434,711 2,059,895,897 2,025,078,266 2,136,885,335 2,188,503,240 2,210,573,396 2,117,099,980
39,700,000 19,800,000 40,600,000 36,600,000 12,700,000 14,800,000 95,800.000
35O,0(X),0O0 350,000,000 340,000,000 679,000,000 353,000,000 346,000,000
1,027.000,000 1,029,000,000 1,376,000,000 681,000,000 697,000,000
53,795,000 48,705,000 58,660,000
480,000 52,010,000 61,470,000 55,005,000 58,085,000 52,540,000 54,045,000 62,705,000 54,730,000 57,075,000
$36,495,000 18,537,000 41,200,000 25,183,000 17,070,000
9,1 2,065, 3,064, 4,140, 2,065, 2,059, 2,025, 2,136, 2,188, 2,210, 2,117,
55,170,000 119,411,000 81,461,000 24,009,000 143,638,000 415,358,000 724,174,000 43,095,000 99,608,000 127,753,000
,009,423 2,049,565,091 856,634 765,725 ,041,923 ,434,711 ,895,897 ,078,266 ,885,335 ,503,240 573,396 ,099,980
27,100,000 19,800,000 40,600,000 36,600,000 12,700,000 14,800,000 95,800,000
350,000,000
"346^666,060 679,000,000
* *34'6;666,"ooo 1,027,000,000 1,029,000,000 1,376,000,000 681,000,000 697,000,000
12,600,000
350,000,000
353,000,000
Digitized for FRASER http://fraser.stlouisfed.org/ Federal Reserve Bank of St. Louis
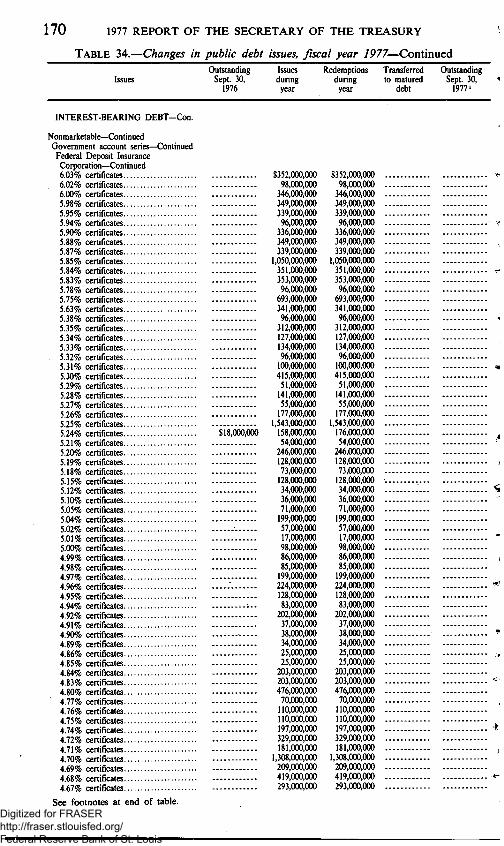
170 1977 REPORT OF THE SECRETARY OF THE TREASURY
TABLE 34.—Changes in public debt issues, fiscal year 7977—Continued
Issues Outstanding
Sept. 30, 1976
Issues during year
Redemptions during year
Transferred to matured
debt
Outstanding Sept. 30,
1977'
INTEREST-BEARING DEBT-Con.
Nonmarketable—Continued Govemment account series—Continued Federal Deposit Insurance Corporation—Continued 6.03% certificates 6.02% certificates 6.00% certificates 5.98% certificates 5.95% certificates 5.94% certificates 5.90% certificates 5.88% certificates 5.87% certificates 5.85% certificates 5.84% certificates 5.83% certificates 5.78% certificates 5.75% certificates 5.63% certificates 5.38% certificates 5.35% certificates 5.34% certificates 5.33% certificates 5.32% certificates 5.31% certificates 5.30% certificates 5.29% certificates 5.28% certificates 5.27% certificates 5.26% certificates 5.25% certificates 5.24% certificates 5.21% certificates 5.20% certificates 5.19% certificates 5.18% certificates 5.15% certificates 5.12% certificates 5.10% certificates 5.05% certificates 5.04% certificates 5.02% certificates 5.01% certificates 5.00% certificates 4.99% certificates 4.98% certificates 4.97% certificates 4.96% certificates 4.95% certificates 4.94% certificates 492% certificates 491% certificates 4.90% certificates 4.89% certificates 4.86% certificates 4.85% certificates 4.84% certificates 4.83% certificates 4.80% certificates 4.77% certificates 4.76% certificates 4.75% certificates 4.74% certificates 4.72% certificates 4.71% certificates 4.70% certificates 4.69% certificates 4.68% certificates 4.67% certificates
See footnotes at end of table.
$352,000,000 98,000,000
346,000,000 349,000,000 339,000,000 96,000,000
336,000,000 349,000,000 339,000,000
1,050,000,000 351,000,000 353,000,000 96,000.000
693,000,000 341,000,000 96,000.000
312.000,000 127,000,000 134,000,000 96,000,000 100,000,000 415,000,000 51,000,000 141,000,000 55,000,000 177,000,000
1,543,000,000 $18,000,000 158,000,000
54,000,000 246,000,000 128,000,000 73,000,000 128,000,000 34,000,000 36,000,000 71,000,000 199,000,000
, •- 57,000,000 17,000,000
, 98,000,000 , 86,000,000
85,000,000 , 199,000,000
224,000,000 , 128,000,000 , ..:.. 83,000,000 , 202,000.000
37,000,000 , 38,000,000 , 34,000,000
25,000,000 , 25,000,000
203,000,000 , 203,000,000
476,000,000 70.000,000 110,000,000 110,000,000 197,000,000
, 329,000,000 , 181,000,000
1,308,000,000 209,000,000 419,000,000 293,000,000
$352,000,000 98,000,000 346,000.000 349,000,000 339,000,000 96,000,000
336,000,000 349,000,000 339,000,000
1,050,000.000 351,000,000 353,000,000 96,000,000
693,000,000 341,000,000 96,000,000
312,000,000 127,000,000 134,000,000 96,000,000 100,000,000 415,000,000 51,000,000 141,000,000 55,000,000 177,000,000
1,543,000,000 176,000,000 54,000,000
246,000,000 128,000,000 73,000,000 128,000,000 34,000,000 36,000,000 71,000,000 199,000,000 57,000,000 17,000,000 98,000,000 86,000,000 85,000,000 199,000.000 224,000,000 128,000,000 83,000,000
202,000.000 37,000,000 38,000,000 34,000,000 25,000,000 25,000,000
203,000,000 203,000,000 476,000,000 70,000,000 110,000.000 110.000,000 197,000,000 329,000,000 181.000,000
1,308.000.000 209,000,000 419,000,000 293,000,000
Digitized for FRASER http://fraser.stlouisfed.org/ Federal Reserve Bank of St. Louis

STATISTICAL APPENDIX 171 TABLE 34.—Changes in public debt issues, fiscal year 1977—Continued
Issues Outstanding
Sept. 30, 1976
Issues during
year
Redemptions during
year
Transferred to matured
debt
Outstanding Sept. 30,
1977'
INTEREST-BEARING D E B T - C o n .
Nonmarketable—Continued Govemment account series—Con.
Federal Deposit Insurance Corporation—Continued 4.66% certificates 4.65% certificates 4.64% certificates 4.63% certificates 4.62% certificates 4.61% certificates 4.60% certificates 4.59% certificates 4.58% certificates 4.57% certificates 4.56% certificates 4.55% certificates 4.53% certificates 4.51% certificates 4.49% certificates 4.42% certificates 4.40% certificates 8'/8% notes $268,833,000 8% notes 1,427,500,000 778% notes 429,566,000 774% notes 250,000,000 778% notes 238,000,000 7'/2% notes 100,000,000 778% notes 457,506,000 7'/4% notes 7% notes -6% notes 240,000,000
Federal disability insurance trust fund:
7'/8% certificates 724,491,000 7% certificates 678% certificates 6'/a% certificates 678% certificates 678% notes 943,266,000 6'/8% notes 452,652,000 574% notes 1,058,617,000 778% bonds 1,094,967,000 7'/2% bonds 899,219,000 778% bonds 965,040,000 7'/8% bonds
Federal Financing Bank: Bills 10/14/76 21,780,000 Bills 11/18/76 73,105,000 Bills 12/16/76 29,240,000 Bills 1/13/77 -BUls 2/17/77 Bills 3/17/77 Bills4/21/77 -Bills 5/19/77 ^ BUls 6/16/77 Bills 7/21/77 Bills 8/18/77 Bills 9/15/77 Bills 10/13/77 Bills 10/20/77 Bills 11/7/77 Bills 12/15/77
Federal hospital insurance trust fund:
7'/8% certificates 687,920,000 7% certificates 678% certificates 6'/2% certificates
See footnotes at end of table.
$782,000,000 1,090,000,000 1,330,000,000 1,574,000,000 329,000,000 745,000,000
2,802,000,000 546,000,000 269,000,000 70,000,000
337,000,000 546,000,000 133,000,000 68,000,000 68,000,000 68,000,000 68,000,000
155,000,000
750,000,000 50,000,000
5,277,389,000 1,503,839,000 565,018,000 963,653,000 776,353,000
$782,000,000 1.090,000,000 1,330.000.000 1,574,000,000 329,000,000 745,000,000
2,802,000,000 546,000,000 269,000,000 70,000,000
337,000,000 546,000,000 133,000,000 68,000,000 68,000,000 68,000,000 68,000,000
240,000,000
6,001,880,000 793,807,000 565,018,000 963,653,000 776,353,000 943,266,000 452,652,000
1,058,617,000
888,691,000
29,045,000 80,580,000 32,510,000 33,075,000 82,705,000 36,085,000 35,345.000 93,075,000 42,415,000 9,005,000 305,000
12,975,000 15,920,000
8,822,460,000 2,355,111.000 879.593.000
1.592,832.000
61,499,000 555,535,000
21,780, 73,105, 29,240, 29,045, 80,580, 32,510, 33,075, 82,705, 36,085, 35,345, 93,075, 42,415,
,000 ,000 ,000 ,000 ,000 1,000 ,000 ,000 ,000 ,000 1,000 i.OOO
9,510,380,000 1,848,118,000 879,593,000
1,592,832,000
$268,833,000 1,427,500,000 584,566,000 250,000,000 238,000,000 100,000,000 457,506,000 750,000,000 50,000,000
710,032,000
1,094,967,000 899,219,000 903,541,000 333,156,000
9,005,000 305,000
12,975,000 15,920,000
506,993,000
Digitized for FRASER http://fraser.stlouisfed.org/ Federal Reserve Bank of St. Louis

172 1977 REPORT OF THE SECRETARY OF THE TREASURY
TABLE 34.—Changes in public debt issues, fiscal year 1977—Continued Outstanding Issues Redemptions Transferred Outstanding
Issues Sept. 30, during during to matured Sept. 30, 1976 year year debt 1977'
INTEREST-BEARING DEBT-Con .
Nonmarketable—Continued Govemment account series—Con.
Federal hospital insurance trust fund—Continued 678% certificates $1,019,126,000 $1,019,126,000 678% notes $2,159,064,000 45,891,000 $2,113,173,000 6'/9% notes 85,516,000 85,516,000 574% notes 537,999,000 537,999,000 778% bonds 3,651,163,000 3,651,163,000 7'/,% bonds 1,774,539,000 1,774,539,000 778% bonds 2,063,281,000 2,063,281,000 7'/8% bonds 1,886,113,000 1,071,522,000 814,591,000
Federal Housing Administration: Cooperative management
housing insurance fund: 7'/«% notes 3,205,000 2,935,000 3,205,000 2,935,000 8'/4% bonds 1,846,000 1,000,000 846,000 7'/,% bonds 4,063,000 2,272,000 6,335,000
Mutual mortgage insurance fund:
8'/2% bonds 39,624,000 39,624,000 878% bonds 51,718,000 ^ 51,718,000 8'/4% bonds 73,947,000 101,395,000 175,342,000 77,% bonds 313,520,000 313,520,000 778% bonds 365,000,000 365,000,000
Federal old-age and survivors insurance trust fund: A
7'/4% certificates 1,248,386,000 1.248,386,000 7'/8% certificates 4,582,664,000 43,903,532,000 46,836,756,000 1,649,440,000 7% certificates 10,473,836,000 5,293,542,000 5.180,294,000 678% certificates 5,730,061,000 5,730,061,000 6'/2% certificates - - - - - 6.217,815,000 6,217,815,000 678% certificates 4,832,470,000 4,832,470,000 6%% notes 4,547,285,000 4,221,132,000 326,153,000 574% notes 1,821,626,000 1,821,626,000 778% bonds 6,101,188,000 6,101,188,000 7'/,% bonds 7,109.182,000 7.109,182.000 77,% bonds 7,567,468,000 7,567,468,000 7'/8% bonds 7,428,537,000 4,029,483,000 3,399,054,000
Federal Savings and Loan Insurance Corporation:
BUls 11/15/76 273,470,000 4,255,000 277,725,000 Bills 2/3/77 307,820,000 307,820,000 Bills 8/23/77 100,000,000 100,000,000 6.18% certificates 339,290,000 339,290.000 6.13% certificates 675,934,000 675,934,000 - - - - -6.12% certificates 343,213,000 343,213.000 6.11% certificates 341,497,000 341,497,000 6.10% certificates 1,018,298,000 1,018,298,000 6.07% certificates - 1,019,099,000 1,019,099,000 6.06% certificates 1,453,679,000 1,453,679,000 6.05% certificates 673,142,000 673,142,000 6.04% certificates 728,037,000 728,037,000 6.03% certificates 330,011,000 330,011,000 -6.02% certificates 169,555.000 169,555,000 6.00% certificates 341,225,000 341,225,000 5.98% certificates 329,275,000 329.275,000 5.95% certificates 334.471,000 334,471,000 5 94% certificates 168,606,000 168,606,000 190% certificates 329,976,000 329.976,000 5.88% certificates 386,153,000 386.153,000 5.87% certificates 331.174,000 331,174,000 5.85% certificates 1,045.356,000 1,045,356,000 -5.84% certificates 386,353,000 386.353,000 5.83% certificates 330,255,000 330,255,000 5.78% certificates 167,450,000 167,450,000 5.75% certificates 771,572,000 771 ,572 .^ 5.63% certificates - - - .385.101,000 385,101,000 5.38% certificates 167,913,000 167,913.000 5.35% certificates 611,119,000 611,119,(X)0
See footnotes at end of table. Digitized for FRASER http://fraser.stlouisfed.org/ Federal Reserve Bank of St. Louis

STATISTICAL APPENDIX 173 TABLE 34.—Changes in public debt issues, fiscal year 1977—Continued
Issues Outstanding
Sept. 30, 1976
Issues during year
Redemptions during year
Transferred to matured
debt
Outstanding Sept. 30,
1977'
INTEREST-BEARING DEBT-Con.
Nonmarketable—Continued Govemment account series—Con. Federal Savings and Loan Insurance Corporation—Con. 5.34% certificates 5.33% certificates 5.32% certificates 5.31% certificates ;. 5.30% certificates 5.29% certificates 5.28% certificates 5.27% certificates 5.26% certificates 5.25% certificates 5.24% certificates 5.21% certificates 5.20% certificates 5.19% certificates 5.18% certificates 5.15% certificates 5.12% certificates 5.10% certificates 5.05% certificates 5.04% certificates 5.02% certificates 5.00% certificates 4.99% certificates 4.98% certificates 4.97% certificates 4.96% certificates 4.95% certificates 4.92% certificates 4.91% certificates 489% certificates 4.84% certificates 4.83% certificates 4.80% certificates 4.77% certificates 4.76% certificates 4.75% certificates 4.74% certificates 472% certificates 4.71% certificates 4.70% certificates 4.69% certificates 4.68% certificates 4.67% certificates 4.66% certificates 4.65% certificates 4.64% certificates 4.63% certificates 4.62% certificates 4.61% certificates 460% certificates 4.59% certificates 4.58% certificates. 4.57% certificates 4.56% certificates 455% certificates 4.53% certificates 4.51% certificates 449% certificates 4.42% certificates 4.40% certificates 8'/a% notes 878% notes 8'/4% notes ..". 8% notes 778% notes
See footnotes at end of table.
$3,250,000
25,000,000 30,000,000 35,000,000
419,100,000 73,000,000
$287,861,000 340,268,000 164,341,000 216,892,000 866,301,000 87,831,000
321,447,000 138,631,000 377,988,000
3,611,116,000 339,156,000 129,953,000 551,483,000 360,396,000 198,201,000 375,373,000 13,273,000 4,028,000
195,577,000 120,900,000 73,492,000 31,38.1^^ 98,679,000 29,192,000 123,500,000 123,811,000 110,600,000 124,032,000 15,196,000 1,071,000
125,146,000 125,791,000 442,784,000 23,306,000 31,647,000 32,310,000 126,076,000 85,645,000 37,477,000
817,609,000 55,214,000 134,233,000 161,546,000 464,872,000 975,221,000 650,046,000
1,371,494,000 249,450,000 578,499,000
2,042,973,000 162,570,000 74,075,000 22,262,000 81,413,000
414,174,000 48,508,000 22,245,000 11,740,000 11,858,000 22,202,000
104,700,000
$287,861,000 340,268,000 164,341,000 216,892,000 866,301,000 87,831,000
321,447,000 138,631,000 377,988,000
3,611,116,000 342,406,000 129,953,000 551,483,000 360,396,000 198,201,000 375,373,000 13,273,000 4,028,000
195,577,000 120,900,000 73,492,000 31,381,000 98,679,000 29,192,000 123,500,000 123,811,000 110,600,000 124,032,000 15,196,000 1,071,000
125,146,000 125,791,000 442,784,000 23,306,000 31,647,000 32,310,000 126,076,000 85,645,000 37,477,000
817,609,000 55,214,000 134,233,000 161,546,000 464,872.000 975,221.000 650,046,000
1,371,494,000 249,450,000 578,499,000
2,042,973,000 162,570,000 74,075,000 22,262,000 81,413,000
414,174,000 48,508,000 22,245,000 11,740,000 11,858,000 22,202,000
"36,060,066 35,000,000
$25,000,000
523,800,000 73,000,000
Digitized for FRASER http://fraser.stlouisfed.org/ Federal Reserve Bank of St. Louis
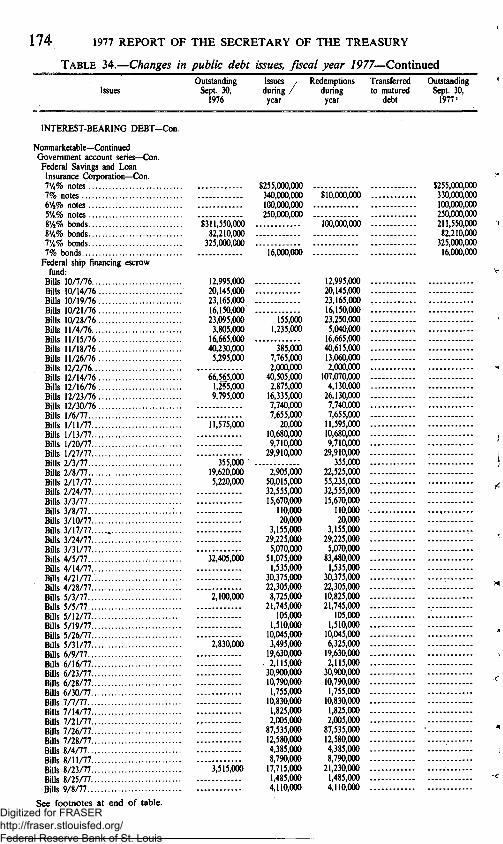
174 1977 REPORT OF THE SECRETARY OF THE TREASURY
TABLE 34.—Changes in public debt issues, fiscal year 1977—Continued
Issues Outstanding
Sept. 30, 1976
Issues during ,
year
Redemptions during
year
Transferred to matured
debt
Outstanding Sept. 30,
1977'
INTEREST-BEARING D E B T - C o n .
Nonmarketable—Continued Govemment account series—Con.
Federal Savings and Loan Insurance Corporation—Con. 7'/4% notes $255,000,000 7% notes 340,000,000 $10,000,000 6'/2% notes 100,000,000 578% notes 250,000,000 8'/,% bonds $311,550,000 100,000,000 8'/4% bonds 82,210.000 778% bonds 325,000,000 7% bonds 16,000,000
Federal ship financing escrow fund:
Bills 10/7/76 12.995,000 12.995,000 BUls 10/14/76 20.145,000 20,145,000 BUls 10/19/76 23,165,000 23,165.000 Bills 10/21/76 16,150,000 16,150,000 BUls 10/28/76 23.095,000 155,000 23,250.000 Bills 11/4/76 3,805.000 1.235.000 5,040.000 Bills 11/15/76 16.665,000 16,665,000 BUls 11/18/76 40,230,000 385,000 40,615.000 Bills 11/26/76 5.295.000 7.765,000 13.060,000 Bills 12/2/76 2,000,000 2,000,000 BUls 12/14/76 66,5^5,000 40,505,000 107.070,000 Bills 12/16/76 1,255,000 2,875,000 4,130,000 Bills 12/23/76 9,795,000 16,335,000 26,130,000 Bills 12/30/76 7,740,000 7,740,000 Bills 1/6/77 7,655,000 7,655,000 Bills 1/11/77 11,575,000 20,000 11,595.000 BUls 1/13/77 10,680,000 10,680,000 Bills 1/20/77 9,710,000 9,710,000 Bills 1/27/77 29,910,000 29,910,000 Bills 2/3/77 355,000- 355,000 Bills 2/8/77 19,620,000 2,905,000 22,525,000 Bills 2/17/77 5,220.000 50,015.000 55,235,000 BUls 2/24/77 32,555,000 32,555,000 Bills 3/3/77 15,670,000 15,670,000 BUls 3/8/77 110,000 110,000 Bills 3/10/77 20,000 20.000 BUls 3/17/77 3,155.000 3,155,000 BUls 3/24/77 29,225,000 29,225,000 Bills 3/31/77 5,070,000 5,070,000 BUls 4/5/77 32,405,000 51,075,000 83,480,000 Bills 4/14/77 1,535,000 1,535,000 Bills 4/21/77. 30,375,000 30,375,000 BUls 4/28/77 22,305,000 22,305,000 Bills 5/3/77 2.100.000 8,725,000 10,825,000 Bills 5/5/77 21,745,000 21,745,000 BUls 5/12/77 105,000 105,000 BUls 5/19/77 1.510,000 1,510,000 Bills 5/26/77 10,045,000 10,045,000 Bills 5/31/77 2,830,000 3,495,000 6,325.000 Bills 6/9/77 19.630,000 19,630,000 BUls 6/16/77 2,115,000 2,115,000 Bills 6/23/77 30,900,000 30,900,000 Bills 6/28/77 10,790,000 10,790,000 Bills 6/30/77 1,755,000 1,755,000 Bills 7/7/77 10,830,000 10,830,000 Bills 7/14/77 1,825,000 1,825,000 Bills 7/21/77 2,005,000 2,005,000 BUls 7/26/77. . . . . 87,535,000 87,535,000 Bills 7/28/77 12,580,000 12,580,000 Bills 8/4/77 4,385,000 4,385,000 Bills 8/11/77 8,790,000 8,790,000 BUls 8/23/77 3,515,000 17,715.000 21.230.000 Bills 8/25/77 1,485,000 1.485.000 Bills 9/8/77 4,110,000 4,110.000
See footnotes at end of table.
$255,000,000 330.000,000 100.000,000 250.000.000 211.550.000
82.210.000 325,000.000
16.000.000
Digitized for FRASER http://fraser.stlouisfed.org/ Federal Reserve Bank of St. Louis

STATISTICAL APPENDIX 175 TABLE 34.—Changes in public debt issues, fiscal year 1977—Continued
Issues Outstanding
Sept. 30. 1976
Issues during
year
Redemptions during
year
Transferred to matured
debt
Outstanding Sept. 30.
1977'
INTEREST-BEARING D E B T - C o n .
Nonmarketable—Continued Govemment account series—Con.
Federal ship financing escrow fund—Continued Bills 9/20/77 Bills 9/22/77 Bills 9/29/77 Bills 10/6/77 Bills 10/13/77 Bills 10/18/77 Bills 10/20/77 Bills 10/27/77 Bills 11/3/77 Bills 11/15/77 Bills 11/25/77 bills 12/1/77 Bills 12/8/77 Bills 12/13/77 Bills 12/15/77 Bills 12/22/77 Bills 12/29/77 Bills 1/5/78 Bills 1/10/78 Bills 1/12/78 Bills 1/19/78 Bills 1/26/78 BUls 2/7/78 Bills 2/9/78 Bills 3/7/78 Bills 4/4/78 Bills 5/2/78 Bills 7/25/78 Bills 9/19/78 5.25% certificates 778% notes
Federal ship financing fund, fishing vessels. NOAA:
Bills 2/8/77 Bills 8/23/77 Bills 10/18/77
Federal ship financing revolving fund:
Bills 10/19/76 Bills 1/11/77 Bills 4/7/77 Bills 5/31/77 Bills 7/7/77 Bills 9/20/77 Bills 10/18/77 Bills 1/10/78 Bills 5/30/78 8% notes 778% notes 774% notes 7% notes 6% notes
Federal supplementary medical insurance trust fund:
778% certificates 7'/8% certificates 7% certificates 678% certificates. 6'/a% certificates 678% certificates 678% notes 778% bonds 7'/,% bonds 778% bonds 7'/8% bonds
See footnotes at end of table.
$48,875,000 38,725,000 6,445,000
30,595,000 800,000
4,970,000 3,205,000
: . . 21,955,000 14,075,000 47,750,000
3,500.000 13,585,000 5,305,000
12,740,000 585,000
7,830,000 3,400,000 2,610,000
117,620,000 780,000 265,000
2,015.000 4,040,000 8,550,000 3,780,000
11,100,000 90,535,000 96,345,000 14,760,000
645,000 $33,520,000
1,500,000
1,010,000 4,825,000
"5,'295,'o66
7,000,000
'2,'385,000 8,500,000 5,919,000
17,311,000 51,533,000
277,822,000 557,672,000 162,177,000 177,430,000
1,320,000 1.435.000
680.000
790.000 660.000
1.065,000 1,370,000 585,000
3,175,000 34,900,000 4,200,000
4,167,584,000 1,083,646,000 573,719,000 961,122,000 568,918,000
1,032,148,000
$48,875,(K)0 38,725,000 6,445,000 12,270.000
20,000 3,235,000 180,000
3,485,000 195,000
11,050,000
145,006 165,000
8,140,000
76,066
12,010,000
645,000
1,500,000 1,320,000
1,010,000 4,825,000 680,000
5,295.000 790,000 660.000
*U376.'o66
17,311,000 4,177,882,000 1,083,646,000 573.719,000 961,122,000 568,918,000
$18,
1, 3,
18, 13, 36, 3,
13, 5, 4,
7, 3, 2,
105,
325,000 780,000 ,735,000 ,025,000 ,470,000 880,000 700,000 500.000 ,440,000 ,140.000 600,000 585.000 ,760,000 ,400,000 ,610,000 ,610,000 780,000 265,000 ,015,000 ,040.000 550,000 ,780,000 100,000 535,000 345,000 760,000
33,520,000
1,435,000
1,065,000
'""585,000 10.175,000 34,900,000 6,585,000 8.500,000 5,919,000
41,235,000
277,822,000 557,672,000 162,177,000 177,430,000
16,406,000 1,015,742,000
Digitized for FRASER http://fraser.stlouisfed.org/ Federal Reserve Bank of St. Louis

176 1977 REPORT OF THE SECRETARY OF THE TREASURY
TABLE 34.—Changes in public debt issues, fiscal year 1977—Continued
Issues Outstanding
Sept. 30, 1976
Issues during
year
Redemptions during
year
Transferred to matured
debt
Outstanding Sept. 30,
1977'
I N T E R E S T - B E A R I N G D E B T - C o n .
Nonmarketable—Continued Govemment account series—Con.
Foreign service retirement fund: 7'/8% certificates 7% certificates 678% certificates 6'/3% certificates 67g% certificates 679% notes $11,192,000 6'/8% notes 4,454,000 57«% notes .T 9,125,000 778% bonds 41,951,000 7'/,% bonds 41,052,000 778% bonds 52,392,000 7'/,% bonds 4% bonds 15,442.000
General Post fund. Veterans Administration:
Bills 7/26/77 878% bonds -
GSA participation certificate trust:
Bills 10/19/76 18,690,000 Bills 11/15/76 1,500,000 Bills 1/11/77 2,040,000 Bills 2/8/77 370,000 Bills 3/8/77 215,000 9% notes 16,279,000 878% notes 8.30% notes 29,214,451 8% notes 33,000 7'/8% notes .-7% notes 67,% notes 24,565,000
Gifts and bequests. Commerce: Bills 10/19/76 35,000 Bills 5/3/77 Bills 11/15/77
Govemment life insurance fund: 578% certificates 7'/4% notes 29,964,000 6'/4% notes 46,875,000 5'/,% notes 111,949,000 5'/4% notes 32,152.000 7'/4% bonds 34,910,000 7% bonds 71,735,000 674% bonds 90,990,000 6'/2% bonds 4'/4% bonds 28.468,000 378% bonds 41,015,000 3'/,% bonds 72,021,000
Govemment National Mortgage Association:
Bills 10/1/76 5,620,000 BUls 10/6/76 5,100.000 BUls 10/8/76 10,805,000 BUls 12/13/76 11,200,000 Bills 12/23/76 4,855,000 Bills 1/3/77 1.300.000 Bills 1/19/77 203.720.000 BUls 2/1/77 9,240,000 BUls 2/14/77 Bills 3/31/77 -Bills 4/1/77 8,735.000 BUls 4/6/77 5.500,000 BUls 4/8/77 BUls 5/3/77 7,490,000
See footnotes at end of table.
$53,162,000 $50,580,000 81,986,000 20,170,000 10,486,000 3,255,000
28,347,000
900,000 332,000
9,405,000
998,000 12,385,000
2*,*o66 1,827,000 578,000 400,000
35,000 45,000
15,707,000
71,520,000
1,925.000 99,480,000 3,650,000
44,480.000 15,490,000
20,250,000
15,764,000 20,170,000 10,486,000 3,255,000
4,454,000
357,000
900,000
18,690,000 1,500,000
11,445,000 370,000 215,000
17.277,000 12.385,000 24,651,637
35,000 1,796,000 578,000
13,045,000
35,000 35,000
15,707,000 29,964,000
3,742,000 72,021,000
5,620,000 5,100,000 10,805,000 11,200,000 4,855,000 3,225,000
303,200,000 12,890,000 44,480,000 15,490,000 8,735,000 5,500,000
20,250,000 7,490,000
$2,582,000 66,222,000
11,192,000
9,125,000 41,951,000 41,052,000 52,392,000 28,347,000 15,085,000
332,000
4,562,815
Vim 11,920.000
45,000
46.875.000 111.949.000 32,152,000 34,910,000 71,735,000 90,990,000 71,520,000 28,468,000 37,273,000
Digitized for FRASER http://fraser.stlouisfed.org/ Federal Reserve Bank of St. Louis

STATISTICAL APPENDIX 177 TABLE 34.—Changes in public debt issues, fiscal year 1977—Continued
Issues Outstanding
Sept. 30, 1976
Issues during
year
Redemptions during
year
Transferred to matured
debt
Outstanding Sept. 30,
1977'
INTEREST-BEARING DEBT-Con .
Nonmarketable—Continued Govemment account series—Con. Government National Mortgage
Association—Continued Bills 6/1/77 Bills 6/13/77 Bills 6/23/77 Bills 7/1/77 Bills 7/19/77 Bills 7/26/77 ; Bills 8/1/77 Bills 8/12/77 Bills 8/15/77 Bills 10/1/77 Bills 10/3/77 Bills 10/6/77 Bills 10/10/77 Bills 10/11/77 Bills 10/18/77 Bills 12/1/77 Bills 12/12/77 Bills 12/23/77 Bills 1/19/78 Bills 2/1/78 Bills 2/14/78 Bills 4/3/78 Bills 4/6/78 BUls 4/8/78. . . Bills 6/1/78 Bills 6/27/78 Bills 7/3/78 Bills 7/19/78 Bills 8/14/78 5.27% certificates 4.70% certificates 4.60% certificates 8'/8% notes 8% notes 778% notes 774% notes 778% notes 7'/4% notes 7'/8% notes 7% notes 678% notes .-674% notes 678% notes 6'/2% notes 678% notes 6'/4% notes 6'/8% notes 6% notes 578% notes 7% bonds 678% bonds 6'/8% bonds
Govemment National Mortgage Association, MBS investment account:
8% notes 778% notes 774% notes 778% notes 778% notes 7'/4% notes ' . . . 7% notes 678% notes 6'/2% notes 678% notes
See footnotes at end of table.
$3,965,000 8,015,000 3,500,000
270,000
24,261,000 26,299,000 34,230,000 38,145,000 63,030,000
8,705,000 68,808,000 38,493,000
174,241,000 16,250,000 6,398,000
105,610,000
* 1^953,000
22,045,000
""**769,000 4,216,000
986,000 6,738,000 1,107,000 1,238,000 3,700,000
"2^871*,"o66 2,289,000
$2,350,000 $2,350,000 11,200,000 11,200,000 4,855,000 4,855,000
3,965,000 6,285,000 14,300,000
3,500,000 17,035,000 17,035,000 25,730,000 25,730,000 15,360,000 15,360,000
970,000 970,000 4,835,000 4,830,000 2,555,000 8,250,000 10,580,000 12,335,000 11,200,000 5,020,000 14,290,000 5,270,000 15,935,000 6,360,000 145,000 120,000
1,765,000 1,805,000 6,620,000 4,155,000 32,680,000 34,185,000 34,185,000 28,015,000 28,015,000 24,200,000 24,200,000
""*3;642,"o6b "'.
"32J59,"o66 8,765,060 55,340,000
116,263,000 2,079,000 57,993,000
'27,502,*(X)0 69,880,000 78,230,000 5,320,000
41,844,000 5,265,000 12,970,000
22,045,000 4,452,000 772,000
7,285,000 1,716,000
!!'.!!".!!!!*. ***u83,o6o 4,545,000 9,985,000
""3*565,*o66 1,934,000
$4,835,000 5,100,000 2,555,000 8,250,000 10,580,000 12,335,000 11,200,000 5,020,000 14,290,000 5,270,000 15,935,000 6,360,000 145,000 120,000
1,765,000 1,805,000 6,620,000 4,155,000 32,680,000
24,261,000 26,299,000 34,230,000 41,787,000 63,030,000 32.759,000 13,468,000
152,677,000 232.234,000 16,250,000 33.900,000 97,260,000 5,320,000
48,532,000 12,970,000
"""4,452,060 1,541,000
11,501,000 1,716,000
986,000 738,000 107,000
,238,000 ,417,000 545,000
,856,000 ,289,000 505,000
,934,000
Digitized for FRASER http://fraser.stlouisfed.org/ Federal Reserve Bank of St. Louis

178 1977 REPORT OF THE SECRETARY OF THE TREASURY
TABLE 34.—Changes in public debt issues, fiscal year 7977—Continued
Issues Outstanding
Sept. 30, 1976
Issues during
year
Redemptions during
year
Transferred to matured
debt
Outstanding Sept. 30,
1977'
INTEREST-BEARING D E B T - C o n .
Nonmarketable—Continued Govemment account series—Con.
Harry S. Truman memorial scholarship fund: Bills 10/7/76 $375,000 Bills 11/4/76 Bills 12/2/76 Bills 1/6/77 Bills 2/8/77 Bills 3/10/77 Bills 4/7/77 Bills 5/5/77 Bills 6/2/77 Bijls 7/7/77 Bills 8/4/77 Bills 9/8/77 Bills 10/6/77 8% notes 778% notes 774% notes '. 8'/4% bonds 9,673,000 7'/2% bonds
Highway trust fund: 6'/2% certificates 678% certificates 6'/4% certificates
Indian money proceeds of labor, Bureau of Indian Affairs:
Bills 10/14/76 1,600,000 Bills 10/21/76 Bills 10/28/76 Bills 11/4/76 Bills 11/18/76 Bills 11/26/76 Bills 12/2/76 Bills 12/30/76 Bills 1/13/77 Bills 1/27/77 Bills 3/24/77 Bills 3/31/77 Bills4/21/77 Bills 4/28/77 Bills 5/5/77 Bills 5/19/77 Bills 5/26/77 Bills 6/9/77 Bills 6/30/77 Bills 7/14/77 Bills 7/28/77 Bills 8/11/77 Bills 8/25/77 Bills 9/8/77 Bills 9/15/77 Bills 9/22/77 Bills 9/29/77 Bills 10/20/77 5.25% certificates
Indian tribal funds. Bureau of Indian Affairs:
Bills 10/7/76 7.245,000 Bills 10/14/76 5,310,000 Bills 10/21/76 Bills 10/28/76 -Bills 11/4/76 Bills 11/12/76 Bills 11/18/76 Bills 11/26/76 Bills 12/2/76 ;
See footnotes at end of table.
%msm 380,000 290,000 290,000 630,000 635,000 585,000
1,380,000 1.285.000 1.240.000 1,535.000 1,540.000 5,000,000 .
$375,000 380,000 380,000 290,000 290,000 630,000 635,000 585,000
1,380,000 1,285,000 1,240,000 1,535.000
50.000
5000000 5000000
5,000,000
$1,490,000 5,000,000 5.000,000 5,000,000 9,673,000 5,000,000
8,951,876,000 1,555,377,000 10,507,253,000 1,989,942,000 582,611,000 1.407,331,000
13,202,791,000 4,531,435,000 8,671,356,000
275,000 1,505,000
275,000 1,125,000 1,025,000 1,000,000
800.000 400,000 400.000 400.000 400.000
1.400.000 1.400.000 1.400.000
400.000 400.000 400.000 400.000 400,000 480.000 400,000 400,000 400,000 575,000
2,275,000 400,000 400,000 400,000
30,240.000 36,970,000 19,605,000 2,460,000
12,335,000 13.890,000 13,145,000 2.025.000 3,135,000
1,600,000 275,000
1,505,000 275,000
1,125,000 1,025.000 1,0(K),000
800,000 400,000 400,000 400,000 400,000
1,400,000 1,400,000 1,400,000
400,000 400,000 400,000 400,000 400,000 480,000 400,000 400,000 400,000 575,000
2,275,000 400,000
400,000
,485,000 ,280,000 ,605,000 ,460,000 335,000 890,000 145,000
,025,000 135,000
400,000
Digitized for FRASER http://fraser.stlouisfed.org/ Federal Reserve Bank of St. Louis

STATISTICAL APPENDIX 179 TABLE 34.—Changes in public debt issues, fiscal year 1977—Continued
Issues Outstanding
Sept. 30, 1976
Issues during
year
Redemptions during
year
Transferred to matured
debt
Outstanding Sept. 30,
1977'
INTEREST-BEARING D E B T - C o n .
Nonmarketable—Continued Government account series—Con.
Indian tribal funds. Bureau of Indian Affairs—Continued Bills 12/9/76 Bills 12/16/76 Bills 12/23/76 Bills 1/6/77 Bills 1/13/77 Bills 1/27/77 Bills 2/3/77 Bills 2/10/77 Bills 2/17/77 Bills 2/24/77 Bills 3/3/77 Bills 3/8/77 Bills 3/17/77 Bills 3/24/77 BUls 3/31/77 Bills 4/7/77 Bills 4/14/77 Bills 4/21/77 Bills 4/28/77 Bills 5/3/77 Bills 5/5/77 Bills 5/12/77 Bills 5/19/77 Bills 5/26/77 Bills 6/2/77 Bills 6/9/77 Bills 6/16/77 Bills 6/23/77 Bills 6/30/77 Bills 7/7/77 Bills 7/14/77 Bills 7/21/77 Bills 7/28/77 Bills 8/4/77 Bills 8/11/77 Bills 8/18/77 Bills 8/25/77 Bills 9/1/77 Bills 9/8/77 Bills 9/15/77 Bills 9/22/77 Bills 9/29/77 Bills 10/6/77 Bills 10/13/77 5.25% certificates
Individual Indian money: Bills 11/18/76 Bills 11/26/76 Bills 12/9/76 Bills 12/16/76 Bills 12/23/76 Bills 12/30/76 Bills 1/6/77 Bills 1/13/77 Bills 1/27/77 Bills 2/3/77 Bills 2/10/77 Bills 2/17/77 Bills 2/24/77 Bills 3/3/77 Bills 3/17/77 Bills 3/24/77 Bills 3/31/77 Bills 4/7/77 Bills 4/14/77
See footnotes at end of table.
$41,275,000 4,220,000
935,000 7,120,000 2,155,000 3,030,000
10,015,000 3,090,000 2,430,000 1,385,000 1,965,000 1,530,000 2.180.000 3,655,000 1,545,000 1,805,000
505,000 15,040,000 16.300.000 2,320,000
14.900,000 17,000,000 40,620,000 20,195,000 15,055,000 29,460,000 15,205,000 14,500,000 3,790,000 5,250,000 1,720,000 4,290,000 1,060,000 2,160,000 9,040,000 6,705,000 1,435,000 3,145,000 8,130,000
11,560,000 2,320.000 1.630,000 3.530,000 2.550.000 1.720.000
350.000 675,000
7,100,000 15,635,000
425,000 3,205,000 630.000
1,055,000 3,345,000 2,480,000 5,280,000 5,250,000 1,065,000 3,940,000 1,855,000
11,505,000 790,000
7,245,000 13,120.000
$41,275,000 4,220,000 935.000
7,120,000 2,155,000 3,030,000 10,015,000 3,090,000 2,430,000 1,385,000 1,965,000 1.530.000 2.180,000 3,655,000 1,545,000 1,805,000 505,000
15,040,000 16,300,000 2,320,000 14,900,000 17,000,000 40,620,000 20,195,000 15,055,000 29.460,000 15,205,000 14,500,000 3,790,000 5,250,000 1,720,000 4,290,000 1,060,000 2,160.000 9,040,000 6,705.000 1.435,000 3,145,000 8,130,000 11,560,000 2,320,000 1,630,000
'"""ij*26,"o6o
350,000 675,000
7,100,000 15,635,000
425,000 3,205,000 630,000
1,055,000 3,345,000 2,480,000 5,280,000 5.250.000 1.065,000 3,940,000 1,855,000
11,505.000 790,000
7.245,000 13,120,000
$3,530,000 2.550.000
Digitized for FRASER http://fraser.stlouisfed.org/ Federal Reserve Bank of St. Louis

180 1977 REPORT OF THE SECRETARY OF THE TREASURY
TABLE 34.—Changes in public debt issues, fiscal year 1977—Continued
Issues Outstanding
Sept. 30, 1976
Issues during
year
Redemptions during
., year
Transferred to matured
debt
Outstanding Sept. 30,
1977'
INTEREST-BEARING D E B T - C o n .
Nonmarketable—Continued Govemment account series—Con.
Individual Indian money—Con. Bills 4/21/77 Bills 4/28/77 Bills 5/5/77 Bills 5/12/77 Bills 5/19/77 Bills 5/26/77 Bills 6/2/77 Bills 6/9/77 Bills 6/16/77 Bills 6/23/77 Bills 6/30/77 Bills 7/14/77 Bills 7/21/77 Bills 8/4/77 Bills 8/11/77 Bills 8/18/77 Bills 8/25/77 Bills 9/1/77 Bills 9/8/77 Bills 9/15/77 Bills 9/20/77 Bills 9/22/77 Bills 9/29/77 Bills 10/6/77 Bills 10/13/77 Bills 11/15/77.. 5.25% certificates 8% notes 778% notes 678% notes 674% notes 579% notes
Japan-U.S. friendship trust fund: Bills 12/14/76 Bills 3/8/77 Bills 3/10/77 Bills 4/5/77 Bills 6/9/77 Bills 9/8/77 Bills 9/20/77 Bills 10/18/77 Bills 12/8/77 Bills 3/9/78 Bills 3/16/78
Judicial survivors annuity fund: 8'/2% bonds 878% bonds 8'/4% bonds 8% bonds 778% bonds
Library of Congress trust fund: Bills 3/31/77 Bills 9/29/77 8'/a% bonds
Low-rent public housing, HUD: Bills 10/28/76 BUls 11/4/76 Bills 11/15/76 Bills 12/2/76 Bills 1/27/77 Bills 2/3/77 Bills 2/17/77 Bills 3/24/77 Bills 3/31/77 Bills 4/7/77
See footnotes at end of table.
$300,000 1,500,000
500,000
4,180,000 5,315,000 3,080,000 6,310,000
324,000 482,000 975,000 222,000
1,340,000
10,000,000
"36,'3*90",666
$14,400,000 900,000
3,575,000 795,000
2,150,000 5,270,000 5,210,000 4,730,000 4,820,000 1,395,000 2,230,000 11,900,000 3,600,000 17,630,000 15.255,000 7,200,000 11,595,000 6,315,000 9,045.000 3,960,000 4,700,000 10,655,000 1,500.000 2,525,000 1,635,000 2,040,000 170,000
1,000,000
725,000
4,175,000 3,155,000 5,360,000 6,355,000 4,030,000 3,250,000 5,490,000
1,833,000 28,692.000
23,000
**"5"5"6,"o66
150,000 160,(X)0
6,000,000 10,000,000 10.000,000 5,000,000 8,000.000
35,000,000 10,000,000 10,000,000 10,000,000
$14,400, 900,
3,575, 795,
2,150, 5,270, 5,210, 4,730, 4,820, 1,395, 2,230, 11,900. 3,600, 17,630, 15,255, 7,200, 11,595, 6,315, 9,045, 3,960, 4,700, 10,655, 1,500, 1,160,
1,000 1,000 ,000 ,000 ,000 ,000 ,000 ,000 ,000 ,000 ,000 ,000 ,000 ,000 ,000 ,000 ,000 ,000 ,000 ,000 ,000 ,000 ,000 ,000
2,040, 170,
,000 ,000
1,500, 750, 500, 725,
,000 ,000 ,000 ,000
4,180,000 5,315,000 3,080,000 6,310,000 4,175,000 3,155,000 5,360,000
150,000 160,000
10,000,000 6,000,000
40,390,000 10,000,000 5,000,000 8,000,000
35,000,000 10,000,000 10,000,000 10,000,000
$1,365,000 1,635,000
300,000
250,000
6,355,000 4,030,000 3,250,000 5,490,000 -
2,157,000 29,174,000
998,000 222.000 ^ 550,000
1,340,000
Digitized for FRASER http://fraser.stlouisfed.org/ Federal Reserve Bank of St. Louis

STATISTICAL APPENDIX 181
TABLE 34.—Changes in public debt issues, fiscal year 1977—Continued
Issues Outstanding
Sept. 30, 1976
Issues during year
Redemptions during year
. Transferred to matured
debt
Outstanding Sept. 30,
1977'
INTEREST-BEARING DEBT-Con .
Nonmarketable—Continued Govemment account series—Con.
Low-rent public housing, HUD—Continued BUls 4/14/77 Bills 4/21/77'. Bills 4/28/77 Bills 5/5/77 Bills 5/12/77 Bills 5/19/77 Bills 5/26/77 BUls 6/2/77 Bills 6/9/77 Bills 6/16/77 Bills 6/23/77 Bills 6/30/77 BUls 7/7/77 Bills 7/14/77 Bills 7/21/77 Bills 7/28/77 Bills 8/4/77 Bills 8/11/77 Bills 8/18/77 Bills 8/25/77 Bills 9/1/77 Bills 9/8/77 Bills 9/15/77 Bills 9/22/77 Bills 9/29/77 Bills 10/6/77 Bills 10/13/77 Bills 10/20/77
National Archives gift fund: Bills 10/19/76 Bills 11/15/76 Bills 3/3/77 Bills 6/28/77 Bills 8/23/77 Bills 9/1/77 BiUs 10/18/77 Bills 11/15/77 Bills 12/13/77 Bills 12/22/77 Bills 7/25/78
National Archives trust fund: • Bills 10/19/76
Bills 6/28/77 Bills 7/26/77 Bills 8/23/77 BUls 9/20/77 Bills 10/18/77 Bills 12/22/77 Bills 1/19/78 Bills 7/25/78 Bills 9/19/78
National Credit Union share insurance fund, NCUA:
Bills 10/19/76 BUls 11/15/76 Bills 12/14/76 Bills 1/11/77 Bills 2/8/77 Bills 3/8/77 Bills 4/5/77 Bills 5/3/77 Bills 5/31/77 Bills 7/26/77.." 9% notes 874% notes
See footnotes at end of table.
$30,000,000 5,000,000 10,000,000 20,000,000 15,000,000 5,000,000 10,000,000 20,000,000 15,000,000 10,000,000 20,000,000 15,000,000 10,000,000 15,000,000 20,000,000 15,000,000 10,000,000 15,000,000 20,000,000 15,000,000 30,000,000 15,000,000 15,000,000 30,000,000 15,000,000 25,000,000 15,000,000 30,000,000
$10,000 15,000
110,000 105,000
935,000 590,000
1,070,000 500,000 500,000
75,000 50,000 -10,000 50,000 100,000 105,000 155,000
1,050,000 590,000
1,070,000 300,000 500,000
2,175,000 4,400,000 3,250,000
28,330,000 1,070,000 1,025,000 1,700.000 5,000,000 m,m
2,750,000 1,000,000
1,000.000
$30,000,000 5,000,000 10,000,000 20,000,000 15,000,000 5,000,000 10,000,000 20,000,000 15,000,000 10,000,000 20,000,000 15,000,000 10,000,000 15,000,000 20,000,000 15,000,000 10,000,000 15,000,000 20,000,000 15,000,000 30,000,000 15,000.000 15,000,000 30,000,000 15,000,000
10,000 15,000
110,000 105,000 75,000 50,000
935,000 590.000
1,070,000 500,000 500,000 200,000
2,175,000 4,400,000 3,250,000
28,330,000 1,070,000 1,025,000 1,700,000 5,000,000 350,000
2,750,000 1,000,000
$25,000,000 15,000,000 30,000,000
10,000 50,000 100,000 105,000 155,000
850,000 590,000
1,070,000 300,000 500,000
1,000,000
Digitized for FRASER http://fraser.stlouisfed.org/ Federal Reserve Bank of St. Louis

Outstanding Sept. 30,
1976
Issues during
year
Redemptions during
year
Transferred to matured
debt
Outstanding Sept. 30, i
1977'
182 1977 REPORT OF THE SECRETARY OF THE TREASURY
TABLE 34.—Changes in public debt issues, fiscal year 7977—Continued
Issues
INTEREST-BEARING D E B T - C o n .
Nonmarketable—Continued Govemment account series—Con.
National Credit Union share insurance fund, NCUA—Con. 878% notes 8'/4% notes 8'/8% notes 8% notes 778% notes 77.% notes 7'/2% notes 778% notes 7'/4% notes 7'/8% notes 7% notes 678% notes 674% notes 678% notes 6'/2% notes 6'/4% notes 578% notes 574% notes 5'/4% notes 7'/4% bonds 3'/,% bonds
National insurance development fund, HUD:
Bills 11/15/76 Bills 11/15/77 8% notes 778% notes 778% notes 7'/2% notes 778% notes 7% notes 674% notes 6'/2% notes 6»/4% notes
National service life insurance fund:
7'/8% certificates 7% certificates.. is 678% certificates 674% certificates 678% certificates 6'/8% certificates 6% certificates 7'/2% notes 672% notes 574% notes 5'/2% notes 7'/2% bonds 7'/4% bonds 7% bonds 674% bonds 474% bonds 378% bonds 378% bonds 3'/4% bonds
Northem Mariana Islands: 7'/8% certificates 7% certificates 678% certificates 6'/2% certificates
Obligation guarantee fund, Department of Transportation:
874% notes
See footnotes at end of table.
$3,000,000 2,000.000
2,000,000 3,500,000
400000
2,000,000
8,200,000
7,151,000
16,600,000
1,500,000
7,000,000
11,957,000 12,791,000
511,000
569,007.000 666,100.000
1.091.044.000 481.013,000 571,642.000 914.437,000 836.962,000
225,452.000 890 710000 298,259.000 386.307.000
$6,000,000 21,700.000 12,980.000 1.000.000 2,000,000
2,000.000 1.000.000
11.900.000 2,000.000 1,000.000 2,500,000 1,250.000 1,000,000 3,000,000 1,000,000 1,000,000
11,100,000 1.000.000
7,000,000 24.469.000
1.500,000 1.695.000 4,000,000
5.000.000 2,000.000
5.000.0(K)
6,162,000 18,004,000 8,750,000
204,425,000 76,950,000
1,277,016,000
824,000 460,000
50,000 52,000
160.000
$3,000,000 2,000,000
2,000.000 1,500.000
400,000
2,000,000
8,200.000 1,600,000
1,500,000
7,000,000
11,957,000 12,791,000
511,000 18,004,000 4.806,000
204,425,000 76,950,000
569,007.(X)0
7,512,000 4,940,000
386,307,000
355,000
50,000 52,000
$6,000,000 21,700,000 12,980,000 1,000,000 4,000.000
'iooo,m 1,000.000
11,900,000 2,000,000 1,000,000 2,500,000 1,250,000 1,000,000 3,000,000 1,000.000 1,000.000
11,100,000 1,000,000
5,400,000 31,620,000 1,500,000
18,295,000 4,000,000
""5l666,"(X)o 2,000,000
"'5,m,m
6,162,000
3,944,000
666,100,000 1,091,044,000 481,013,000 571,642,000 914,437,000 836,962,000
1,277,016,000 225.452,000 883.198.000 293,319,000
469.000 460,000
160,000
Digitized for FRASER http://fraser.stlouisfed.org/ Federal Reserve Bank of St. Louis

STATISTICAL APPENDIX 183 TABLE 34.—Changes in public debt issues, fiscal year 1977^Continued
Issues Outstanding
Sept. 30, 1976
Issues during
year
Redemptions during
year
Transferred to matured
debt
Outstanding Sept. 30.
1977'
INTEREST-BEARING D E B T - C o n .
Nonmarketable—Continued Govemment account series—Con.
Overseas Private Investment Corporation:
Bills 10/19/76 Bills 11/15/76 Bills 12/14/76 Bills 12/30/76 Bills 1/11/77 Bills 2/8/77 Bills 3/8/77 Bills 3/31/77 Bills 4/5/77 Bills 4/28/77 Bills 5/3/77 Bills 5/31/77 Bills 6/28/77 Bills 6/30/77 Bills 7/26/77 Bills 8/23/77 Bills 9/20/77 Bills 9/29/77 Bills 10/18/77 Bills 11/15/77 Bills 12/29/77 Bills 1/10/78 Bills 2/7/78 Bills 3/7/78 Bills 4/4/78 Bills 5/2/78 Bills 5/30/78 Bills 6/27/78. Bills 7/25/78 . . . . , Bills 8/22/78 878% notes 8% notes 778% notes 7'/2% notes 778% notes 7'/4% notes 7'/8% notes 7% notes 674% notes 6'/2% notes 6'/4% notes 6'/8% notes 578% notes
Pension Benefit Guaranty Corporation: Bills 12/2/76 Bills 6/2/77 Bills 7/28/77 Bills 8/23/77 Bills 9/15/77 Bills 10/27/77 Bills 12/29/77
, Bills 2/9/78 8'/4% notes 8% notes 774% notes 778% notes 778% notes 7'/4% notes 7% notes 678% notes 6'/2% notes 8% bonds
See footnotes at end of table.
$7,090,000 3,935,000 7,115,000
520.000 3,305,000
735,000 1.660.000
"4*710.606
""6*1*56.666 14,360,000 13.330.000
""""9"l"o",666 680.000
6,430.000
$2,610,000
3J46.066
*i6^9'5"6.'o66
1,210.000 2,870,000
355,000 7,350,000
26,045,000 2,640,000
355,000 1,115,000 1,065,000 1,050,000 1,145.000 3,615.000
'2,645,000 33.415,000
1.745,000 1.260,000
21,000,000 31,000,000 : 10,735,000 15,280,000 26,170,000
40,700,000 1,000,000
55,370,000 33,395,000 7,500,000 1,000,000 4,700,000 15,855,000
5,135,000 3,240,000
1,465.000 1,650,000 22,775,000
5,400,000 11,820,000 2,200,000
, 3,500,000 , 27,725,000 , 18,340,000
4,590,000 11,750,000 10,000,000 1,065,000 2,060,000 5,000,000 6,160,000
15.000.000 4.000.000 7,671,000
12,000,000 4,000,000
$7,090,000 3,935,000 7,115,000 3,130,000 3,305,000
735,000 1,660,000-3,740.000 4.710,000
16.950,000 6,150,000
14,360.000 14,540,000 2,870,000
910,000 680,000
6,785.000 7.350.000
100,000
21,000,000
15,280,000 2,000,000
1,300,000 1,000,000
3,115,000 22.775,000
5,400,000 11,820,000 2,200,000 1,160.000
4.590.000 9.750.000 1,065,000
6.160,000 15,000,000
" 7,671,"o66 16,000,000
$25,945,000 2,640,000
355,000 1,115,000 1,065,000 1,050,000 1,145,000 3,615,000 2,645,000
33,415,000 1,745,000 1,260.000
31.060,000 10,735,000
24,170,660 40,700,000
1.000,000 88,765,000 6,200,000
"""26^555.000 5,135.000 3,240,000
2,340,000 27,725,000 18,340,000
12^666.660
"2^666.660 5.000.000
4.000.000
Digitized for FRASER http://fraser.stlouisfed.org/ Federal Reserve Bank of St. Louis

184 1977 REPORT OF THE SECRETARY OF THE TREASURY
TABLE 34.—Changes in public debt issues, fiscal year 1977—Continued
Issues Outstanding
Sept. 30, 1976
Issues during year
Redemptions during year
Transferred to matured
debt
Outstanding Sept. 30,
1977'
INTEREST-BEARING DEBT-Con.
Nonmarketable—Con. . Govemment account series—Con. Postal service fund: Bills 12/16/76 Bills 3/31/77 Bills 7/21/77 Bills 8/18/77 Bills 8/23/77 Bills 9/15/77... Bills 9/22/77 Bills 9/29/77 ' Bills 10/6/77 Bills 10/13/77 Bills 10/20/77 Bills 10/27/77 Bills 11/3/77 Bills 12/1/77 Bills 1/12/78 Bills 1/19/78 Bills 1/26/78 Bills 2/2/78 Bills 2/9/78 Bills 2/16/78 Bills 2/23/78 Bills 3/9/78 Bills 3/16/78 Bills 3/23/78
. Bills 5/2/78 Bills 5/30/78 Bills 6/27/78 Bills 7/25/78 Bills 8/22/78 Bills 9/19/78 6.18% certificates 6.13% certificates., 6.12% certificates 6.11% certificates 6.10% certificates 6.07% certificates 6.06% certificates 6.05% certificates 6.04% certificates 6.03% certificates 6.02% certificates 6.00% certificates 5.98% certificates 5.95% certificates 5.94% certificates 5.90% certificates 5.88% certificates 5.87% certificates 5.85% certificates 5.84% certificates 5.83% certificates 5.78% certificates 5.75% certificates 5.63% certificates 5.38% certificates 5.35% certificates 5.34% certificates 5.33% certificates 5.32% certificates 5.31% certificates 5.30% certificates 5.29% certificates 5.28% certificates 5.27% certificates 5.26% certificates
See footnotes at end of table.
$200,000,000 500,000,000
$250,000,000 250,000,000 250,000,000 100,000,000 100,000,000 50,000,000 170,000,000 60,000,000 100,000,000 100,000,000 30,000,000 10,000,000 20,000,000 10,000,000 10,000,000 20,000,000 25,000,000 135,000,000 10,000,000 50,000,000 30,000,000 100,000,000 10,000,000 40,000,000 10,000,000 10,000,000 70,000,000 30,000,000
1,192,400,000 2,230,200,000 378,200,000
1,148,200,000 3,578,100,000 3,532,800,000 4,473,700,000 1,949,700,000 2,376,600,000 1,097,500,000 966,800,000
1,263,700,000 1,153,100,000
...•-.. 1,052,900,000 969,200,000 906,100,000 903,500,000 835,900,000
3,512,700,000 1,123,300.000 1,054,100,000 971,900,000
2,404,900,000 1,054,100,000 951,700,000
4,555,500,000 2,236,500,000 2,637,800,000 991,600,000
2,894,200,000 6,988,000,000 1,608,900,000 2,422,800,000 1,112,700,000 3,718,900,000
$200,000,000 500,000,000 250,000,000 250,000,000 250,000,000 100,000,000 100,000,000 50,000,000 70,000.000 60,000,0(X)
* 160,666,000 30,000,000 10,000,000 20,000,000 10,000,000
25,000,000 10,000,000
30,000,000 10,000,000 40,000,000 10,000,000 10,000,000 30,000,000 30,000,000
1,192,400,0(X) 2,230,200,000
*i',*i48,266,*o66 3,578,100,000 3,532,800,000 4,473,700,000 1,949,700,000 2,376,600,000 1,097,500,000 966,800,000
1,263,700,000 1,153,100,000 1,052,900,000 969,200,000 906,100,000 903,500,000 835,900,000
3,512,700,000 1,123,300,000 1,054,100,000 971,900,000
2,404,900,000 1,054,100,000 951,700,000
4,555,500,000 2,236,500,000 2,637,800,000 991,600,000
2,894,200,000 6,988,000,000 1,608,900,000 2,422,800,000 1,112,700,000 3,718,900,000
Digitized for FRASER http://fraser.stlouisfed.org/ Federal Reserve Bank of St. Louis

STATISTICAL APPENDIX 185
TABLE 34.—Changes in public debt issues, fiscal year 1977—Continued Outstanding Issues Redemptions Transferred Outstanding
Issues Sept. 30, during during to matured Sept. 30, 1976 year year debt 1977'
INTEREST-BEARING DEBT-Con .
Nonmarketable—Continued Govemment account series—Con.
Postal service fund—Continued 5.25% certificates 5.24% certificates $71,300,000 5.21% certificates 5.20% certificates 5.19% certificates 5.18% certificates 5.15% certificates 5.12% certificates 5.10% certificates 5.05% certificates 5.04% certificates 5.02% certificates 5.01% certificates.... 5.00% certificates 4.99% certificates 498% certificates 4.97% certificates 4.96% certificates 4.95% certificates 4.94% certificates 4.92% certificates 4 9 1 % certificates . . . . 490% certificates 4.89% certificates 4.86% certificates 4.85% certificates 4.84% certificates 4.83% certificates 4.80% certificates ". 4.77% certificates 4.76% certificates 4.75% certificates 4.74% certificates 472% certificates 4 7 1 % certificates 4.70% certificates 4.69% certificates 4.68% certificates 4.67% certificates 4.66% certificates 4.65% certificates 4.64% certificates 4.63% certificates 4.62% certificates 4.61% certificates : -4.60% certificates 4.59% certificates 4.58% certificates 4.57% certificates 4.56% certificates 4.55% certificates 4.53% certificates 4.51% certificates 4.49% certificates 4.42% certificates -4.40% certificates 8% notes 7'/4% notes 7% notes 674% notes 678% notes 6'/4% notes 6'/8% notes
See footnotes at end of table.
$32,243,300,000 $32,243,300,000 4,474.500,000 1,006,100,000 6,648,300.000 4,685,200,000 1,532,400,000 3,288,600,000 1,831,800,000 1,782,900,000 1,763,400,000 1,535,300,000 3,665,200,000 1,864,100,000 4,945,300,000 3,399,600,000 3,112,900,000 1,588,900,000 3,612,700,000 5,054,100,000 4,947,000,000 1,623,900,000 1,795,100,000 1,674,200,000 1,709,200,000 1,657,200,000 1,635,000,000 1,656,100,000 1,792,000,000 4,742,400,000 1,401,700,000 1,585.000,000 1,591,900,000 1,462,700.000 4,275,200,000 3,097,500.000
12,359,900.000 3,042,400,000 6,146,000,000 3,406,800,000 6,873,200,000
15,453,900,000 9,026,100,000
13,993,700,000 5,488,800,000 4,762,300,000
26,222,500,000 4,207,300,000 4,373,600,000 1,337,500,000 2,677,900,000 3,625,700,000 1,508,000,000 1,358,900,000 1,553,200,000 1,481,300,000 1,590,700,000
25,000,000 35,000,000 55,000,000
200,000,000 95,000,000
5,000,000 45,000,000
4,545,800,000 1,006,100,000 6,648,300,000 4,685,200,000 1,532,400,000 3,288,600.000 1,831,800,000 1,782,900,000 1,763,400,000 1,535,300,000 3,665,200,000 1,864,100,000 4,945,300,000 3,399,600,000 3,112,900,000 1,588,900,000 3,612,700,000 5,054,100,000 4,947,000,000 1,623,900,000 1,795,100,000 1,674,200,000 1,709.200,000 1,657,200,000 1,635,000,000 1,656,100,000 1,792,000,000 4,742,400,000 1,401,700,000 1,585,000,000 1,591,900,000 1,462,700,000 4,275,200,000 3,097,500,000
12,359,900,000 3,042,400,000 6,146,000,000 3,406,800,000 6,873,200,000
15,453,900,000 9,026,100,000
13,993,700,000 5,488,800,000 4,762,300,000
26,222,500,000 4,207,300,000 4,373,600,000 1,337,500,000 2,677,900,000 3,625,700,000 1,508,000,000 1,358,900,000 1,553,200,000 1,481,300,000 1,590,700,000
25,000,000 35,000,000 55,000,000
175,000,000 75,000,000
5,000,000 45,0(X),000
$25,000,000 20,000,000
Digitized for FRASER http://fraser.stlouisfed.org/ Federal Reserve Bank of St. Louis

186 1977 REPORT OF THE SECRETARY OF THE TREASURY
TABLE 34.—Changes in public debt issues, fiscal year 1977—Continued
Issues Outstanding
Sept. 30. 1976
Issues during
year
Redemptions during
year
Transferred to matured
debt
Outstanding Sept. 30,
1977'
105.000
12,214,000
1,143,821,000 1,531,133.000
12.708.000 5,309.000 9,980,000
INTEREST-BEARING D E B T - C o n .
Nonmarketable—Continued Govemment account series—Con.
Public Health Service, conditional gift fund, HEW:
Bills 9/20/77 $30,000 Bills 9/19/78 878% bonds
Public Health Service, unconditional gift fund, HEW:
Bills 5/3/77 Bills 5/2/78
Railroad retirement account: 7'/8% certificates 7% certificates 678% certificates 674% certificates 6'/4% certificates 8% notes 774% notes 678% notes
Railroad retirement supplemental account:
774% certificates 778% certificates 7'/8% certificates 7% certificates 678% certificates 674% certificates 6'/4% certificates
Relief and rehabilitation, D.C. Department of Labor:
7'/4% notes 7'/8% notes
Relief and rehabUitation, longshoremen and harbor workers:
Bills 10/28/76 7'/8% notes
Relief for indigent American Indians. B.I.A.:
8% notes 6'/2% notes
Special investment account: Bills 10/19/76 Bills 10/21/76 Bills 11/15/76 Bills 12/14/76 Bills 1/13/77 Bills 3/10/77 Bills 4/21/77 Bills 6/28/77 BUls 9/15/77 8'/2% bonds 8'/4% bonds 778% bonds 7'/2% bonds -
Tax Court judges survivors annuity fund:
6'/2% notes 75.000 8'/2% bonds 18.000 778% bonds 62,000 7'/4% bonds 7% bonds 22.000
Treasury deposit funds: BUls 5/31/77 93.090.000 Bills 8/25/77 BUls 10/6/77 BUls 11/25/77 6% certificates
See footnotes at end of table.
$30,000 70.000
$30,000
838,000
665,000 3,838,000
12.000 19,000
1.005.000 1.505.000
'3.o"5*6,"o66
105.000
126,924.000 940,080,000
2,182,951,000 33,597,000
337,582,000
1,429,130,000
8,893,000 60,751,000 82,429,000 2,327,000
12,273,000
105.000
7.000
1,100.000
'"3^3'l"5*.'o66 2,010,000 2,520,000 2,540,000
500,000 17,020,000 2,176,000
11,226,000 4,792,000
47,000 109,000
21,565,000 60,645,000 17,720,000 54,615,000 60,000,000
139,138.000 479,898.000
2,182,951.000 33,597.000
337.582.000
1,6*1*18*66.*066 904.858,000
12,708,000 5,309,000
18,873iOOO 29,835,000 77,595,000
2,327,000 12,273,000
665,000
1,005,000 1,505,000 1,100,000 3,050.000 3.315.000 2,010.000 2,520.000 2.540,000
500,000
75,000
114,655,000 60,645,000
' "'2!66o,'o66
Digitized for FRASER http://fraser.stlouisfed.org/ Federal Reserve Bank of St. Louis
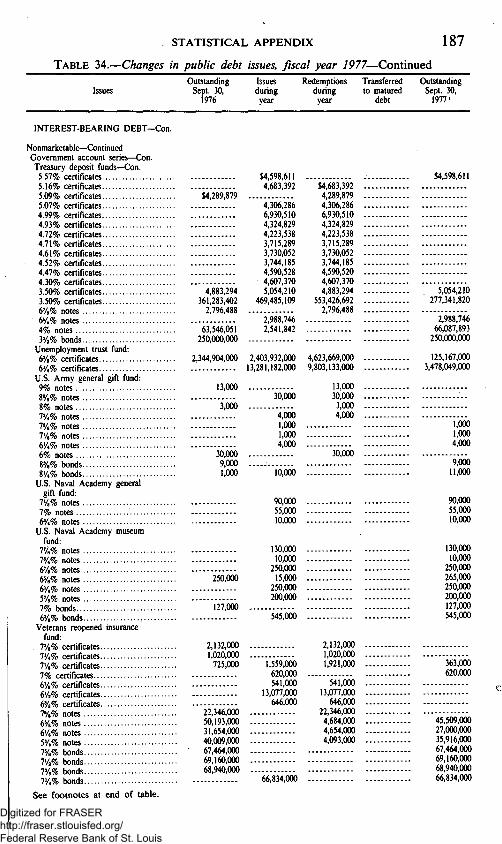
STATISTICAL APPENDIX 187
TABLE 34.—Changes in public debt issues, fiscal year 1977—Continued
Issues Outstanding
Sept. 30, 1976
Issues during
year
Redemptions during
year
Transferred to matured
debt
Outstanding Sept. 30,
1977'
INTEREST-BEARING D E B T - C o n .
Nonmarketable—Continued Govemment account series—Con.
Treasury deposit funds—Con. 5.57% certificates 5.16% certificates 5.09% certificates 5.07% certificates 4.99% certificates 4.93% certificates 4.72% certificates 4 7 1 % certificates 4.61% certificates 4.52% certificates 4.47% certificates 4.30% certificates 3.50% certificates 3.50% certificates 678% notes 6'/4% notes 4% notes 3'/2% bonds
Unemployment trust fund: 678% certificates 6'/4% certificates
U.S. Army general gift fund: 9% notes 878% notes 8% notes 774% notes 778% notes 7'/8% notes 6'/4% notes 6% notes 878% bonds 8'/4% bonds
U.S. Naval Academy general gift fund:
7'/8% notes 7% notes 674% notes
U.S. Naval Academy museum fund:
778% notes 774% notes 678% notes 678% notes 6'/4% notes 578% notes 7% bonds 678% bonds ,
Veterans reopened insurance fund:
778% certificates 7'/4% certificates 7'/8% certificates 7% certificates 678% certificates 6'/2% certificates 678% certificates 778% notes 678% notes 6'/8% notes 574% notes 778% bonds 7'/2% bonds 778% bonds 7'/8% bonds
See footnotes at end of table.
$4,598,611 4,683,392
$4,289,879 4,306,286 6,930,510 4,324,829 4,223,538 3,715,289 3,730,052 3,744,185 4,590.528 4,607,370
4,883,294 5.054.210 361,283,402 469,485,109
2,796,488 2,988,746
63,546,051 2,541,842 250,000,000
2,344,904,000 2,403,932,000 13,281,182,000
13,000
3,000 30,000
4,000 1,000 1,000 4,000
30,000 9,000 1.000
250,000
"l27,'o66
10,000
90,000 55,000 10,000
130,000 10,000
250,000 15,000
250,000 200,000
545,000
$4,683, 4,289, 4,306, 6,930, 4,324, 4,223, 3,715 3,730, 3,744, 4,590, 4,607, 4,883,
553,426, 2,796,
392 ,879 ,286 510 ,829 ,538 ,289 1,052 ,185 1,520 ,370 294 ,692 1,488
$4,598,611
5,054,210 277.341,820
" "2',988,'7"46 66,087,893
250,000,000
4,623,669,000 125.167,000
9,803,133,000 3,478,049,000
13,000 30,000 3,000 4,000
30,000
2,132,000 1,020,000
725,000
22,346,000 50,193,000 31,654,000 40,009,000 67,464,000 69,160.000 68,940,000
1,559,000 620,000 541,000
13,077,000 646,000
66.834.000
2,132,000 1,020,000 1,921,000
541,000 13,077,000
646,000 22,346,000
4,684.000 4,654.000 4,093.000
1.000 1,000 4,000
9,000 11,000
90,000 55,000 10,000
130,000 10.000
250,000 265.000 250.000 200.000 127.000 545.000
363,000 620,000
45,509,000 27,000,000 35,916,000 67,464,000 69,160,000 68,940,000 66,834.000
Digitized for FRASER http://fraser.stlouisfed.org/ Federal Reserve Bank of St. Louis

188 1977 REPORT OF THE SECRETARY OF THE TREASURY
TABLE 34.—Changes in public debt issues, fiscal year 7977—Continued
Issues Outstanding
Sept. 30, 1976
Issues during
year
Redemptions during
year
Transferred to matured
debt
Outstanding Sept. 30,
1977'
INTEREST-BEARING D E B T - C o n .
Nonmarketable—Continued Govemment account series—Con.
Veterans special life insurance fund, tmst revolving fund:
7% certificates 678% certificates 674% certificates 578% notes 5'/4% notes 5% notes 474% notes 7% bonds 67«% bonds 679% bonds 579% bonds
War-risk insurance revolving fund:
Bills 10/19/76 . . . . .. Bills 1/11/77 BUls 4/5/77 . . . . . .. Bills 10/18/77 . .. Bills 4/4/78
$1,435,000 4,446,000
63,923,000 53,862,000 45,598,000 38,124,000
94 600,000 91 963,000 88 314,000
120,000 85,000
540,000
$4,321,000 29,231,000
98,066,000
430,000 825.000
$875,000 29,796,000 4,446,000 4,516,000 4,000,000 3,737,000
38,124,000
120,000 85,000
540,000
$3,446,000 870,000
59,407,000 49,862,000 41,861,000
98,066,000 94,600,000 91,963,000 88,314,000
430,000 825,000
Total Govemment account series.... 128.639,949,239 607,557,397,437 596,084,328.491 140,113,018,185
Treasury bonds, investment series: 274% Series B-1975-80 2,262,443,000 15,326.000 2,247,117,000
Treasury certificates of indebtedness, REA series 14,672,000 6,734,000 7,938,000
Treasury bonds, REA series 258,000 6,064,000 4,797,000 1,525,000
Treasury certificates of indebtedness—State and local govemment series (various interest rates) ; . .
Treasury notes—State and local govemment series (various interest rates)
Treasury bonds—State and local govemment series (various
U.S. individual retirement bonds: 6% Unclassified
Total U.S. individual retirement bonds
79,675,000
926,595,000
1,871,136,000
13,399,983 500.635
13.900,619
368.761,350
7,296,265,350
1,208,732,400
10,961,074 -655,036
10,306,039
195,843,290
76,739.500
8,491,000
957,201 H 542
1,001,742
252,593,060
8,146,120,850
3^7 y 77^400
23,403,857 -198,942
23,204,915
U.S. retirement plan bonds: * 3.75% 13,004,737 495,148 1,226,964 12,272,921 4 1 5 % . . 21,365,092 866,952 1,745,905 20,486,140
36,996,865
13.004,737 21,365,092 37,166,179 48,774,707
786,759
495,148 866,952
1,841,890 23,206,004 -931,603
1,226,964 1,745,905 2,011,204
' 1,695,448 -209.030
6% 48,774,707 23,206,004 - 1,695,448 70,285,264 Unclassified 786,759 -931,603 -209,030 64,186
Total U.S. retirement plan bonds 121,097,474 25,478,393 6,470,490 140,105,376
See footnotes at end of table.
Digitized for FRASER http://fraser.stlouisfed.org/ Federal Reserve Bank of St. Louis

STATISTICAL APPENDIX 189
TABLE 34.—Changes in public debt issues, fiscal year 1977—Continued
Issues Outstanding
Sept. 30, 1976
Issues during
year
Redemptions during year
Transferred to matured
debt
Outstanding Sept. 30,
1977'
INTEREST-BEARING DEBT-Con .
Nonmarketable—Continued U.S. savings bonds:* Series E-1941 $170,908,549 $10,032,479 $13,317,484 $167,623,543 Series E-1942 777,843,827 45,670,036 59,560,185 763,953,678 Series E-1943 1,232,675,606 72,221,817 93,212,215 1,211,685,208 Series E-1944 1,514,505,051 88,814,590 15,018,739 1,488,300,902 Series E-1945 1,332,097,527 78,315,638 101,414,166 1,308,999,000 Series E-1946 753,261,659 46,378,825 58,685,266 740,955,217 SeriesE-1947 840,489,547 58,603,642 65,360,945- 833,732,243 Series E-1948 945,275,268 59,112,049 69,648,626 934,738,691 Series E-1949 1,014,396,175 61,019,502 73,231,817 1,002,183,860 Series E-1950 941.382,998 55,381,782 66,824,886 929,939,894 Series E-1951 815,145,552 47,969,891 57,197,812 805,917,631 Series E-1952 (January to April) 285,400,238 16,746,284 19,919,169 282,227,353
Series E-1952 (May to December) 596,939,819 35,017,130 41,366,867 590,590,081
Series E-1953 1,085,900,901 63,626,930 75,532,936 1,073,994,894 Series E-1954 1,167,096,449 68,595,436 80,906,124 1,154,785,762 Series E-1955 1,262,021,255 74,065,294 87,767,815 1,248,318,733 Series E-1956 1,255,313,361 73,716,756 87,105,526 1,241,924,590 Series E-1957 (January) 113,180,877 6,547,501 8,098,939 111,629,439 Series E-1957 (February to December) 1,115,144,154 68,015,466 79,539,507 1,103,620,113
Series E-1958 1,277,613,116 89,836,594 89,866,051 1,277,583,659 Series E-1959 (January to May) 526,772,035 33,150,461 37,110,268 522,812,228 Series E-1959 (June to December) 706,290,335 51,320,424 49,874,957 707,735,802
Series E-1960 1,325,730,104 83,273,302 90,788,753 1,318,214,653 Series E-1961 1,461,727,207 89,164,602 99,667,445 1,451,224,364 Series E-1962 1,497,763,445 88,296,556 99,966,170 1,486,093,831 Series E-1963 1,859,091,321 109,297,756 124,299,152 1,844,089,925 Series E-1964 1,784,735,327 104,874,407 124,228,777 1,765,380,958 Series E-1965 (January to November) 1,578,183,536 93,194,602 113,678,851 1,557,699,288
Series E-1965 (December) 175,813,606 9,862,813 12,709,386 172,967,033 Series E-1966 2,024.111,317 118,569,854 152,671,810 1,990,009,361 Series E-1967 2,030,067,211 118,967,321 158,857,711 1,990,176,821 Series E-1968 (January to May) 864,112,971 50,257,307 68,119,205 846,251,073 Series E-1968 (June to December) 1,115,160,388 65,439,548 94,169,532 1,086,430,404
Series E-1969 (January to May) 849,234,548 49,260,391 73,817,509 824,677,431 Series E-1969 (June to December) 1,138,798,387 66,145,340 108,847,997 1,096,095,730
Series E-1970 (January to May) 950,018,697 54,978,001 87,020,370 917,976,328 Series E-1970 (June to December) 1,368,520,844 84,240,319 132,964,567 1,319,796,595
Series E-1971 2,956,347,385 264,200,119 275,511,520 2,945,035,984 Series E-1972 3,585,486,309 215,737,t:5 268,121,963 3,533,101,361 Series E-1973 (January to
November) 3,394,598,880 190,516,885 314,533,236 3,270,582,530 Series E-1973 (December) 312,907,483 16,466,708 32,375,591 296,998,600 Series E-1974 4,107,882,632 210,442,163 379,636,277 3,938,688,518 Series E-1975 4,739,398,001 227,606,656 578,475,591 4,388,529,065 Series E-1976... 3,727,730,140 3,122,410,044 1,720,635,698 5,129,504,486 Series E-1977 5,236,777,194 855,770,547 4,381,006,648 Unclassified sales and redemptions 42.736,844 -486,168,409 -465,382,663 ^ 21,951,098
Total series E 62.619.810.881 11,387,969,022 6,932,045,298 67,075,734,605
See footnotes at end of table.
Digitized for FRASER http://fraser.stlouisfed.org/ Federal Reserve Bank of St. Louis

190 1977 REPORT OF THE SECRETARY OF THE TREASURY
TABLE 34.—Changes in public debt issues, fiscal year 1977—Continned
Issues Outstanding
Sept. 30. 1976
Issues during year
Redemptions during
year
Transferred to matured
debt
Outstanding Sept. 30,
1977'
INTEREST-BEARING D E B T - C o n .
Nonmarketable—Continued U.S. savings bonds'—Continued
Series H-1952 Series H-1953 Series H-1954 Series H-1955 Series H-1956 Series H-1957 (January) Series H-1957 (February to December)
Series H-1958 Series H-1959 (January to May).. Series H-1959 (June to December)
Series H-1960 Series H-1961 Series H-1962 Series H-1963 Series H-1964 Series H-1965 (January to
November) Series H-1965 (December) Series H-1966 Series H-1967 Series H-1968 (January to May).. Series H-1968 (June to December)
Series H-1969 (January to May).. Series H-1969 (June to December)
Series H-1970 (January to May).. Series H-1970 (June to December)
Series H-1971 Series H-1972 Series H-1973 (January to November)
Series H-1973 (December).: Series H-1974 Series H-1975 Series H-1976 Series H-1977 Unclassified sales and redemptions
$29,522,500 83,110,500
154,799,000 219,510,500 197,862,000 16,778,500
150,847,500 221,192,500 102,699,500
117,237,000 370,452,000 410,768,500 362,509,500 348,395,000 328,587,000
281,316,000 25,762,000
361,467,500 328,035,000 131,794,000
157,689,500 115,224,000
144,474,500 137.757,000
171.836.500 420.462.000 554.188,500
508,911,000 35,397,500
580.911.500 631,287,000 405,927,500
$1,000
3,000
1,000
1,000 5,000
11.000
1,000 1,000
4,000 -14,520,500
233,807,000 445,477,500
$1,759,500 5,428,500
10,465,000 15,538,500 14,981,000 1,583,000
12,379.500 14.875.500
1,000 7,534.000
8,007,500 24,230,500 26,339,000 22,180,500 20,769,000 18,830,000
16,676,500 1,637,500
26,630,500 27,049,500 6,222,000
7,215,500 5,207,500
6,222,000 5,522,500
6,712,500 17,493,500 21,539,000
20,242,000 1,286,500
23,419,000 23,625,000 21,336.500 3.270,500
25.350,000 -31.599,000 -19,156,000
$27,763,000 77,683,000 144,334,000 203,975,000 182,881.000 15,195.500
138,469.000 206,317,000 95,166,500
109,229,500 346,221,500 384,429,500 340,329,000 327,627,000 309,762,000
264,639,500 24,124,500
334,837,000 300,985,500 125,572,000
150,485,000 110,016,500
138,252,500 132,234,500
165,124,000 402,969,500 532,650,500
488,669,000 34,111,000
557,496,500 593,141,500 618,398,000 442,207,000
12,907,000
Total series H 8.132.062.500 633.194,000 427.053.000 8,338.203.500
Total U.S. savings bonds 70.751.873.381 12,021,163,022 7,359,098,298 75,413.938,105
U.S. savings notes:' Series S-1967 Series S-1968 (January to May). Series S-1968 (June to December)
Series S-1969 Series S-1970 Unclassified
44,028.761 42.124,658
2,509,334 2,378,972
3,801,483 3,661,729
85,130,138 4,833,788 7,562,541 178,688,984 10,071,307 17,201,747 56,653,638 3,190,749 5.711.387
- 6 1 41 155
Total U.S. savings notes
Total nonmarketable
Total interest-bearing debt
See footnotes at end of table.
42.736.611 40,841,901
82,401,384 171,558,544 54,133,000
- 1 7 5
406.626.117 22,984,190 37.939,042
225.896.159.251 643.153,872,037 614,934.759.640
633.558,806,251 1,078,127,127,037 1,013,717,103,140
391.671,265
254,115.271.648
$347,218,000 697,621,612,148
Digitized for FRASER http://fraser.stlouisfed.org/ Federal Reserve Bank of St. Louis

STATISTICAL APPENDIX 191
TABLE 34.—Changes in public debt issues, fiscal year 1977—Continued
Issues Outstanding Sept. 30, 1976
Transferred from
interest-bearing debt
Redemptions during year
Outstanding Sept. 30. 1977'
MATURED DEBT ON WHICH INTEREST HAS CEASED
Old debt—issued prior to Apr. 1, 1917:
6% five-twenties of 1865 $ 19,650 6% compound interest notes 1864-66 155,960 3% loan of 1908-18 98,000 272% postal savings bonds 99.170 2% consols of 1930 9,800 4% funded loan of 1907 342,700 4% loan of 1925 8,450 3% Panama Canal loan 1961 2,200 All other* 735.380
Total old debt—issued prior to Apr. 1, 1917 1,471,310
Liberty loan bonds: First Liberty loan:
First 3y2's 245,450 First 4's 83,750 First 474's 129,600 First-second 474*8 1,400
Total
Second Liberty loan: Second 4's Second 474*8
Total
Third Liberty loan 474*s Fourth Liberty loan 474*8
Total Liberty loan bonds
Victory notes: Victory 3y4'8 Victory 4y4'8
Total Victory notes
Treasury bonds: 3y8% of 1940-43 -8,150 3%% of 1941-43 4,500 374% of 1941 5,400 3y8% of 1943-47 28,200 374% of 1943-45 73,350 374% of 1944-46 117.200 4% of 1944-54.... 32,800 2y4% of 1945-47 59.600 2'/a% of 1945 2,000 3y«% of 1946-56 23.700 3% of 1946-48 22.150 3'/8% of 1946-49 65.400 47*% of 1947-52 65.600 2% of 1947 250 2% of 1948-50 (dated Mar. 15.
1941) 1.650 2y4% of 1948-51 4.150 iy4% of 1948 8.000 272% of 1948 4,000 2% of 1949-51 (dated Jan. 15, 1942). 150 2% of 1949-51 (dated July 15. 1942). 2.000 378% of 1949-52 12.700 27a% of 1949-53 27.650
See footnotes at end of table.
$5,750
200
5.950
300
1.000 1.100 2.400 8.750
2,000 4,200
300
$19,650 155,960 98,000
. 93,420 9,800
342.700 8,450 2,000
735,380
1.465,360
,300 100 ,500 -100
244,150 83,650 128,100
1.500
460.200
326,700 302,550
629.250
1,162,050 1.933.250
4.184.750
700 384.900
385.600
2.800
— 5 0 2.950
2,900
2,000 13,200
20.900
550
550
457.400
326.750 299.600
626.350
1.160.050 1,920.050
4,163.850
700 384.350
385.050
1,100
8,150 4,500 5,100
28,200 72,350 116.100 30,400 50.850 2.000
23,700 20,150 61,200 65,300
250
1,650 4.150 8.000 4.000 150
2.000 12.700 26,550
Digitized for FRASER http://fraser.stlouisfed.org/ Federal Reserve Bank of St. Louis

192 1977 REPORT OF THE SECRETARY OF THE TREASURY
TABLE 34.—Changes in public debt issues, fiscal year 1977—Continued
Issues
Transferred Outstanding from Redemptions Outstanding
Sept. 30, 1976 interest-bearing during year Sept. 30, 1977' debt
MATURED DEBT ON WHICH INTEREST HAS CEASED—Con.
Treasury bonds—Continued l'/2% of 1950 2% of 1950-52 (dated Oct. 19,
1942) 27a% of 1950-52 2% of 1950-52 (dated Apr. 15.
1943) 274% of 1951-53 -2% of 1951-53 2y4% of 1951-54 2% of 1951-55 3% of 1951-55 272% of 1952-54 2% of 1952-54 (dated June 26.
1944) 2% of 1952-54 (dated Dec. 1, 1944). 27«% of 1952-55 2% of 1953-55 2'/,% of 1954-56 2Vn% of 1955-60 2'/a% of 1956-58 2y4% of 1956-59 : 27«% of 1956-59 2y8% of 1957-59 27a% of 1958 2y8% of 1958 2y4% of 1958-63 274% of 1959-62 (dated June 1,
1945) 2'/,% of 1959-62 (dated Nov. 15.
1945). 278% of 1960 2y4% of 1960-65 2y4% of 1961 27a% of 1961 27,% of 1962-67 27a% of 1963 27a% of 1963-68 3% of 1964 27a% of 1964-69 (dated Apr. 15.
1943) 27a% of 1964-69 (dated Sept. 15.
1943) 2y8% of 1965 27a% of 1965-70 3y4% of 1966 3y8% of 1966 3% of 1966 27a% of 1966-71 3ys% of 1967 27a% of 1967-72 (dated June 1,
1945) 3Vs% of 1968 (dated June 23, I960).. 3y8% of 1968 (dated Sept. 15, 1963). 3y4% of 1968 4% of 1969 (dated Aug. 15, 1962) .. . 4% of 1969 (dated Oct. 1, 1957) 4% of 1970 (dated Jan. 15, 1965) 4% of 1970 (dated June 30. 1963).... 4% of 1971 3y8% of 1971 4% of 1972 (dated Nov. 15. 1962)... 4% of 1972 (dated Sept. 15. 1962) ... 27a% of 1967-72 (dated Oct. 20.
1941) 27a% of 1967-72 (dated Nov. 15.
1945)
See footnotes at end of table.
$126,500
4.300 59.200
68,000 19,800
159,000 24,200 8,300
137,900 200
222,000 393,000
5,800 39,750 8,050
411,700 39,950 --58,850
334.000 15,000 14,000 9,950 17,850
656,500
365,000 12,500
177,950 80,500
337.000 272,500 144,000 861.500 65.500
1,425,500
1,630,500 76,500
2,460,550 17,000 15,000 18,000
1.522.500 116.500
4.300.200 352.500 20,500 37.500 150.500
1,261,000 214,500 632,500 286,000 282,500 379,000 519,000
1,811,600
10,390,000
$12,500
1,300 1,000
1,500 4,000 9,500
800 11,450
— 5 0 0 13,000
100 100
25,150 20,000
50 12,500
2.500 — 5 0
70.500
4.500
12.200 6,000 6,500 12,300 2,500
72,000 4,000
125,000
197,500 12,500
313,550
1,000 —25.000 173,500
—18.000
623.900 10.500 15.500 7,000 4,500
218.500 34.500 52.500 74.000 80,000 65,500 97,500
221,050
1,226,500
$114,000
3,000 58,200
66.500 15.800
149.500 24.200 7,500
126,450 200
222,500 380,000
5,800 39,650 7,950
386,550 19,950 58,800
321,500 15,000 11,500 10,000 17,850
586.000
360.500 12,500
165,750 74,500 330,500 260,200 141,500 789,500 61,500
1.300,500
1,433,000 64,000
2.147.000 17.000 14.000 43,000
1,349,000 134,500
3.676.300 342.000
5.000 30.500 146,000
1,042.500 180.000 580.000 212.000 202.500 313,500 421,500
1,590,550
9,163,500
Digitized for FRASER http://fraser.stlouisfed.org/ Federal Reserve Bank of St. Louis
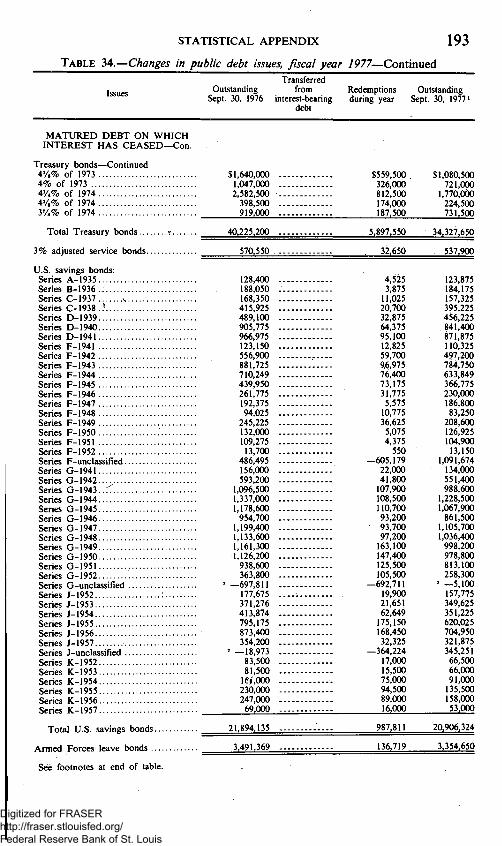
STATISTICAL APPENDIX 193
TABLE 34.—Changes in public debt issues, fiscal year 1977—Continned
Issues Outstanding Sept. 30, 1976
Transferred from
interest-bearing debt
Redemptions during year
Outstanding Sept. 30, 1977'
MATURED DEBT ON WHICH INTEREST HAS CEASED—Con.
Treasury bonds—Continued 478% of 1973 4% of 1973 474% of 1974 478% of 1974 3V8% of 1974
Total Treasury bonds ?
3% adjusted service bonds
U.S. savings bonds: Series A-1935 Series B-1936 ..; Series C-1937 >. Series C-1938..^ Series D-1939 Series D-1940 Series D-1941 Series F-1941 Series F-1942 Series F-1943 Series F-1944 Series F-1945 Series F-1946 Series F-1947 Series F-1948 Series F-1949 Series F-1950 Series F-1951 Series F-1952 Series F-unclassified Series G-1941 Series G-1942...^ Series G-1943..r; Series G-1944 Series G-1945 Series G-1946 Series G-1947 Series G-1948 Series G-1949 Series G-1950 Series G-1951 Series G-1952 Series G-unclassified Series J-1952 Series J-1953 Series J-1954 Series J-1955 Series J-1956 Series J-1957 Series J-unclassified Series K-1952 Series K-1953 Series K-1954 Series K-1955 Series K-1956 Series K-1957
Total U.S. savings bonds
Armed Forces leave bonds
See footnotes at end of table.
$1,640,000 1,047,000 2,582,500
398,500 919,000
40,225.200
570.550
128,400 188,050 168,350 415,925 489,100 905,775 966,975 123,150 556,900 881,725 710,249 439,950 261,775 192,375 94,025
245,225 132,000 109,275 13,700
486,495 156,000 593,200
1,096,500 1,337,000 1,178,600
954,700 1,199,400 1,133.600 1.161.300 1.126.200
938.600 363,800
' —697,811 177,675 371,276 413,874 795,175 873,400 354,200
' —18,973 83,500 81,500
16Y.000 230.000 247.000
69.000
21.894.135
3.491,369
$559,500 326.000 812,500 174,000 187,500
$1,080,500 721,000
1,770,000 224,500 731,500
5,897,550
32,650
987.811
34.327.650
537.900
4,525 3,875 11,025 20,700 32,875 64,375 95,100 12,825 59,700 96,975 76,400 73,175 31,775 5,575 10.775 36.625 5.075 4,375 550
-605,179 22,000 41,800 107,900 108,500 110,700 93,200 93,700 97,200 163,100 147.400 125.500 105.500 -692.711 19.900 21.651 62.649 175,150 168,450 32,325
-364,224 17.000 15.500 75,000 94,500 89,000 16.000
123,875 184.175 157,325 395,225 456,225 841,400 871,875 110,325 497,200 784,750 633,849 366,775 230,000 186,800 83.250
208,600 126,925 104,900 13,150
1,091,674 134,000 551,400 988,600
1,228,500 1,067,900 861,500
1.105.700 1.036.400 998.200 978.800 813.100 258.300
' —5,100 157,775 349,625 351,225 620,025 704,950 321,875 345,251 66,500 66,000 91,000 135,500 158,000 53.000
20,906,324
136,719 3.354.650
Digitized for FRASER http://fraser.stlouisfed.org/ Federal Reserve Bank of St. Louis

194 1977 REPORT OF THE SECRETARY OF THE TREASURY
TABLE 34.—Changes in public debt issues, fiscal year 1977—Continued
Issues
Transferred Outstanding from Redemptions Outstanding
Sept. 30. 1976 interest-bearing during year Sept. 30. 1977' debt
MATURED DEBT ON WHICH INTEREST HAS CEASED—Con.
Treasury notes: Regular series:
5y4% A-1924 4y4% A-1925 4y4% B-1925 47a% C-1925 4y4% A-1926 474% B-1926 47a% A-1927 4y4% B-1927 37a% A-1930-32 37a% B-1930-32 37a% C-1930-32 3% A-1935 2y8% C-1936 374% A-1937 2y8% B-1938 27a% D-1938 278% A-1939 iy8% B-1939 iys% A-1940 178% A-1943 y4% A-1945 174% B-1947 174% C-1947 17a% A-1948 174% G-1951 iy8% B-1954 iy4% B-1955 2y8% A-1957 2y8% A-1958 37a% B-1959 37a% A-1960 374% B-1960 4y4% C-1960 4% A-1961 3y8% B-1961 3y8% A-1962 4% B-1962 3y4% C-1962 4% D-1962 4% E-1962 2y8% A-1963 4% B-1963 4y8% C-1963 4y4% A-1964 5% B-1964 4y8% C-1964 3y4% D-1964 3y4% E-1964 4y8% A-1965 37a% B-1965 3y8% C-1965 4% E-1965 4% A-1966 3y8% B-1966 3y8% C-1966 4% D-1966 4% E-1966 3y4% A-1967 3y8% B-1967 47*% D-1967 4y8% F-1967 5y8% A-1968 574% D-1968 5y8% A-1969
See footnotes at end of table.
$6,200 1,000 6,600 5,700 2,600
600 2,200 9.500
12.700 9.300 6.550 3,000 5,500 2,000 5,000 1,400
10,200 100 150
3,000 100
5,000 27,000 8,000 4,000 1,000 4,000
26.000 24.000
1,000 9.000 1.000
11,000 11,000 16.000
1,000 23,000 19.000 16.000 7.000
22.000 56,000 85,000
278,000 549,000
87,000 10,000 38.000
184.000 1.000
15,000 17.000 25.000 9,000 7.000
• 2.000 15.000 13,000 11,000 13,000 2,000
42,000 13,000 56,000
$4,000 12,000 15.000 59,000
1,000
1,000
8.000
3.000
2,000
20.000
18.000
$6,200 1.000 6,600 5,700 2,600
600 2,200 9,500
12,700 9,300 6,550 3,000 5,500 2,000 5,000 1,400
10,200 100 150
3,000 100
5,000 27.000 8,000 4,000 1,000 4,000
26,000 24,000
1.000 9,000 1.000
11.000 11,000 16,000
1.000 23,000 19,000 16,000 7,000
22,000 52,000 73,000
263,000 490,000
86.000 10.000 37.000
184.000 1.000
15,000 9,000
25,000 9,000 7,000 2,000
15,000 10,000 11,000 11,000 2,000
22.000 13,000 38.000
Digitized for FRASER http://fraser.stlouisfed.org/ Federal Reserve Bank of St. Louis
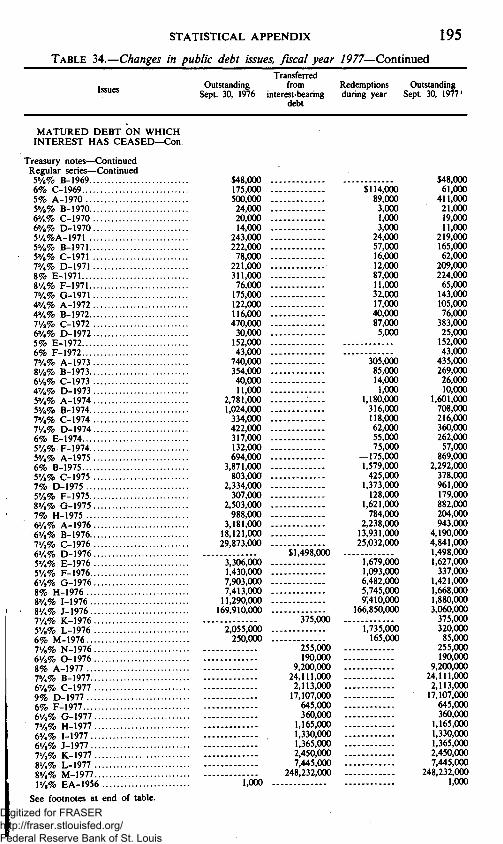
STATISTICAL APPENDIX 195
TABLE 34.—Changes in public debt issues, fiscal year 1977—Continued
Issues Outstanding Sept. 30. 1976
Transferred from
interest-bearing debt
Redemptions during year
Outstanding Sept. 30. 1977'
MATURED DEBT ON WHICH INTEREST HAS CEASED—Con.
Treasury notes—Continued Regular series—Continued
5y8% B-1969 6% C-1969 5% A-1970 5y8% B-1970 6y8% C-1970 6y8% D-1970 574%A-1971 5y8% B-1971 5y8% C-1971 7y4% D-1971 8% E-1971 874% F-1971 7y4% G-1971 4y4% A-1972 4y4% B-1972 77a% C-1972 6y4% D-1972 5% E-1972 6% F-1972 7y4% A-1973 878% B-1973 67a% C-1973 4y8% D-1973 5y4% A-1974 5y8% B-1974 7y4% C-1974 774% D-1974 6% E-1974 5Vs% F-\914 5y4% A-1975 6% B-1975 5y8% C-1975 7% D-1975 5y8% F-1975 8y8% G-1975 7% H-1975 674% A-1976 67a% B-1976 77a% C-1976 67.% D-1976 5y4% E-1976 5y8% F-1976 67a% G-1976 8% H-1976 8y4% 1-1976
• 87*% J-1976 77«% K-1976 5y8% L-1976 6% M-1976 778% N-1976 67a% 0-1976 8% A-1977 7y4% B-1977 6y8% C-1977 9% D-1977 6% F-1977 67a% G-1977 7y8% H-1977 6y4% 1-1977 67a% J-1977 77a% K-1977 874% L-1977 8y8% M-1977 17a% EA-1956
See footnotes at end of table.
$48,000 175,000 500,000 24,000 20,000 14,000
243.000 222,000
78,000 221.000 311,000
76,000 175,000 122,000 116,000 470.000
30,000 152,000 43,000
740,000 354,000 40,000 11,000
2,781,000 1,024.000
334,000 422,000 317,000 132,000 694,000
3,871.000 803,000
2,334,000 307.000
2,503.000 988,000
3,181,000 18,121,000 29,873,000
$1,498,000 3,306,000 1,430,000 7,903,000 7,413.000
11,290,000 169,910,000
375,000 2,055,000
250,000 255,000 190,000
9,200,000 24,111,000
2,113,000 17,107.000
645,000 360,000
1,165,000 1.330,000 1,365,000 2,450,000 7,445,000
248,232,000 1,000
$114,000 89.000 3,000 1,000 3,000
24,000 57,000 16,000 12,000 87,000 11,000 32,000 17,000 40,000 87,000
5,000
305,000 85,000 14,000
1,000 1,180,000
316,000 118,000 62,000 55,000 75,000
—175,000 1,579,000
425,000 1,373,000
128,000 1,621,000
784,000 2,238,000
13,931.000 25,032,000
""r,679;66o 1,093,000 6,482,000 5,745,000 9:410,000
166,850.000
"V.TO^OOO 165,000
$48,000 61,000
411.000 21,000 19.000 11,000
219,000 165,000 62,000
209,000 224.000
65,000 143,000 105,000 76,000
383,000 25,000
152.000 43.000
435.000 269.000
26,000 10,000
1,601,000 708,000 216,000 360,000 262,000
57,000 869,000
2,292,000 378,000 961,000 179,000 882,000 204,000 943,000
4,190,000 4,841.000 1,498,000 1,627.000
337.000 1,421,000 1,668,000 1,880,000 3,060,000
375,000 320,000
85,000 255,000 190,000
9,200,000 24,111,000
2,113,000 17,107.000
645,000 360,000
1,165,000 1,330,000 1,365,000 2,450,000 7,445,000
248,232,000 1,000
Digitized for FRASER http://fraser.stlouisfed.org/ Federal Reserve Bank of St. Louis

196 1977 REPORT OF THE SECRETARY OF THE TREASURY
TABLE 34.—Changes in public debt issues, fiscal year 7977—Continued
Issues
Transferred Outstanding from Redemptions Outstanding
Sept. 30, 1976 interest-bearing during year Sept. 30, 1977' debt
MATURED DEBT ON WHICH INTEREST HAS CEASED—Con.
Treasury notes—Continued Regular series—Continued
l'/a% EA-1962 l'/a% EA-1964 l'/a% EO-1964 l'/a% EO-1965 l'/a% EA-1966 l'/2% EO-1966 l'/a% EA-1967 l'/a% EO-1967 l'/a% EA-1968 l'/a% EO-1968 l'/a% EA-1969 l'/a% EA-1970 l'/a% EA-1971 l'/a% EO-1972 l'/a% EO-1975 l'/a% EA-1976 l'/a% EO-1976
Tax series: A-1943 B-1943 A-1944 B-1944 A-1945
Savings series: C-1946 Crl947 C-1948 C-1949 C-1950 C-1951 D-1951 D-1952 D-1953 A-1954 A-1955 B-1955
Total Treasury notes
Treasury certificates of indebtedness: Tax series:
47a% T-10 4y4% TM-1921 6% TJ-1921 6% TS-1921 6% TD-1921 5'/a% TS2-1921 5y4% TM-1922 4'/a% TS2-1922 47a% TD-1922 474% TM-1923 3y4% TS-1923 47a% TM-1924 4% TM-1925 47a% TJ-1929 578% TM-1930 178% TS-1932 3y4% TM-1933 2% first matured Mar. 15, 1933... . 474% TD2-1933
Regular: 47a% IVA-1918 5'/4% G-1920 57a% H-1921 5'/a% A-1922
See footnotes at end of table.
$10,000 202,000 201,000 200,000 400,000 200,000 400,000 200,000 400,000 602,000 200,000
2,000 1.000 8,000
23,000 '. 46,000
$1,000
4,275 100
4,850 1,000
44.475
11.000 61,200 29,200
7,600 5,800
400 1,400 7,000 2,600
15,700 40,000
200
280,617,200
$10,000 202,000 201,000 200,000 400,000 200,000 400,000 200,000 400,000 602,000 200,000
$2,000 1,000
20,000 46,000
8,000 3,000
125
1,500
2.000 3.100
18,500
1,000
4,150 100
4,850 1,000
42,975
9,000 58,100 10,700 7.600 5.800
400 1,400 7,000 2,600
15,700 40,000
200
317,842,000 243,141,225 355,317,975
1,000 500
1,500 1,500 2,000 1,000 1,000
500 1,000 1,000
500 1,000 1.000 1.100 1.000 3,500 1,000 3,050 1,000
500 1.000
500 1,000
1,000 500
1,500 1,500 2,000 1,000 1,000
500 1,000 1,000
500 1,000 1,000 1,100 1,000 3,500 1,000 3.050 1,000
500 1.000
500 1,000
Digitized for FRASER http://fraser.stlouisfed.org/ Federal Reserve Bank of St. Louis

STATISTICAL APPENDIX 197
TABLE 34.—Changes in public debt issues, fiscal year 1977—Continued Transferred
Outstanding from Redemptions Outstanding Sept. 30, 1976 interest-bearing during year Sept. 30, 1977'
debt
Issues
MATURED DEBT ON WHICH INTEREST HAS CEASED—Con.
Treasury certificates of indebtedness—Continued Regular—Continued
3y4% A-1933 y8% B-1944 y8% E-1944 y8% c-1945 y8% K-1946 Vs% F-1947 y8% C-1948 174% A-1950 3y8% A-1958 4y8% A-1961 3'/4% B-1963 374% B-1964 4y4% A-1966
Total Treasury certificates of indebtedness
Treasury bills, maturity date: July 29, 1954 Apr. 24, 1958 May 15, 1959 Jan. 14, I960.: July 21, 1960 July 28, 1960 Aug. 4, 1960 Aug. 11, 1960 Jan. 15, 1961 Jan. 26, 1961 July 27, 1961 Apr. 15, 1964 Apr. 30, 1965 Mar. 24, 1966 May 19, 1966 June 23, 1966 July 31, 1966 Oct. 20, 1966 Nov. 3, 1966 Feb. 23, 1967 Mar. 30, 1967 Mar. 31, 1967 Apr. 6, 1967 Apr. 20, 1967 Apr. 21, 1967 May 11, 1967 .-June 15. 1967 July 6, 1967 Oct. 26, 1967 Feb. 1, 1968 Feb. 29, 1968 Mar. 28, 1968 Mar. 31, 1968 May 9, 1968 May 31, 1968 June 6, 1968 June 30, 1968 July 11, 1968 July 31, 1968 Aug. 15, 1968 Aug. 29, 1968 Aug. 31, 1968 Oct. 31, 1968 Nov. 21, 1968 Nov. 30, 1968 Dec. 19. 1968
See footnotes at end of table.
$500 6.000
11,000 1,000 4,000 1,000 2,000 3,000
14,000 6,000 9,000 1,000
10,000
95,650
5,000 15,000 1,000 1,000 5,000 6,000
12,000 3,000
18,000 1,000
10,000 12,000 2,000
10,000 1,000 6,000 5,000
15,000 3,000 1,000
11,000 10,000 4,000
.60,000 8,000 1,000 9,000
21,000 50,000 4,000
65,000 5,000 3,000
10,000 3,000 5,000 1,000
500,000 1,000 1.000 5,000 1,000
55,000 60,000 11,000 15,000
$4,000 1.000
5.000
1.000
6.000 12.000 3.000 6.000
20,000
50,000 60,000
$500 6,000
11.000 1.000
2,000 3,000
14,000 6,000 9,000 1,000
10,000
90,650
5,000 15,000
1,000
5,000
12.000 1.000
10.000 12.000 2.000
10,000 1,000 6,000 5,000
15,000 3,000 1,000
11,000 10,000 4,000
60,000 8,000 1,000 9,000 1,000
50,000 4,000
65,000 5,000 3,000
10,000 3,000 5,000 1,000
500,000 1,000 1,000 5,000 1,000 5,000
11,000 15,000
Digitized for FRASER http://fraser.stlouisfed.org/ Federal Reserve Bank of St. Louis

198 1977 REPORT OF THE SECRETARY OF THE TREASURY
TABLE 34.—Changes in public debt issues, fiscal year 1977—Continued
Issues
Transferred Outstanding from Redemptions Outstanding
Sept. 30, 1976 interest-bearing during year Sept. 30, 1977' debt
MATURED DEBT ON WHICH INTEREST HAS CEASED-Con .
Treasury"*ills, maturity date—Continued
Jan. 2, 1969 $10,000 Mar. 6, 1969 20,000 Mar. 20, 1969 18,000 Apr. 10, 1969 57,000 Apr. 17, 1969 3,000 Apr. 24. 1969 1,000 Apr. 30. 1969 1,000 June 19, 1969 33,000 June 23, 1969 50,000 June 26. 1969 10,000 June 30, 1969 50,000 July 3, 1969 20,000 July 10, 1969 1,000 July 17, 1969 90,000 July~24, 1969 10.000 Aug. 28. 1969 200,000 Sept. 4. 1969 5,000 Sept. 11, 1969 10,000 Oct. 2, 1969 5,000 Oct. 30, 1969 5,000 Nov. 13, 1969 8,000 Dec. 11, 1969 35,000 Dec. 31, 1969 15,000 Jan. 8, 1970 60,000 Jan. 15. 1970 93,000 Feb. 5, 1970 10,000 Feb. 13, 1970 19,000 Feb. 19, 1970 5,000 Feb. 26, 1970 119,000 Mar. 5, 1970 9,000 Mar. 12, 1970 72.000 Mar. 23, 1970 99,000 Mar. 26, 1970 10,000 Apr. 16, 1970 1,000 Apr. 22, 1970 10,000 May 7, 1970 26,000 May 14. 1970 52,000 May 28, 1970 18,000 May 31, 1970 3,000 June 11, 1970 11,000 June 18, 1970 15,000 July 2, 1970 1,000 July 23, 1970 1,000 July 30, 1970 5,000 July 31. 1970 15,000 Aug. 6, 1970 3,000 Aug. 13, 1970 17,000 Sept. 3, 1970 10,000 Sept. 10, 1970 10,000 Sept. 30, 1970 8,000 Oct. 8, 1970 10.000 Oct. 31, 1970 14,000 Nov. 30, 1970 20,000 Dec. 10. 1970 40,000 Dec. 17, 1970 10,000 Dec. 24, 1970. 30,000 Jan. 21, 1971 45,000 Feb. 18, 1971 40,000 Feb. 28, 1971 20,000 Mar. 4, 1971 10,000 Mar. 31, 1971 30,000 Apr. 30, 1971 10,000 June 3. 1971 10,000 June 10, 1971 20,000
See footnotes at end of table.
$1,000 31,000
50,000
5,000
—2,000
60,000
3,000
5,000 3,000
5,000
2,000
10,000
$10,000 20,000 18,000 57,000 3,000 1,000
2,000 50,000 10,000
20,000 1,000
90,000 10,000
200,000
10,000 5,000 5,000 10,000 35,000 15,000
93,000 10,000 19,000 5,000
119,000 9,000 72,000 99,000 10,000 1,000 10,000 26,000 52,000 18,000
11,000 15,000 1,000 1,000 5,000 10,000
17.000 10,000 10,000 3,000 10,000 14.000 20,000 40,000 10,000 30.000 45,000 40,000 18,000 10,000 30,000 10,000
20,000
Digitized for FRASER http://fraser.stlouisfed.org/ Federal Reserve Bank of St. Louis
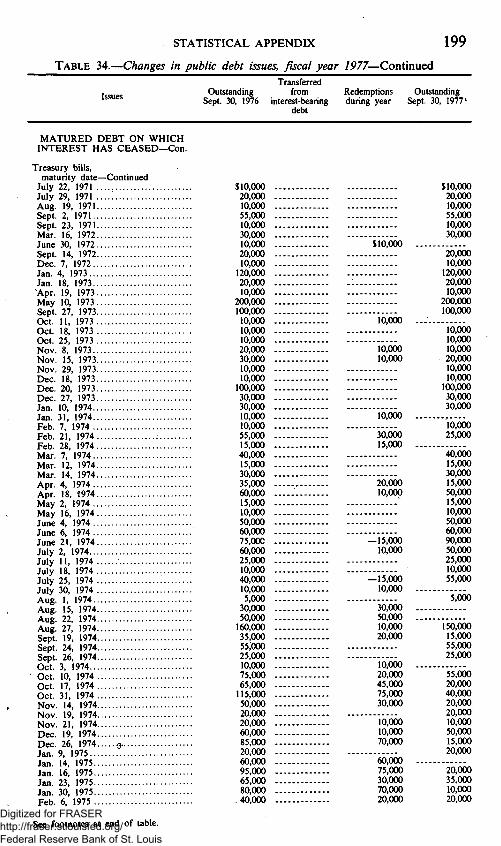
STATISTICAL APPENDIX 199
TABLE 34.—Changes in public debt issues, fiscal year 1977—Continued Transferred
Outstanding from Redemptions Outstanding Sept. 30, 1976 interest-bearing during year Sept. 30, 1977'
debt
Issues
MATURED DEBT ON WHICH INTEREST HAS CEASED-Con .
Treasury bills, maturity date—Continued
July 22, 1971 $10,000 July 29, 1971 . . . . : 20,000 Aug. 19, 1971 10,000 Sept. 2, 1971 55,000 Sept. 23, 1971 10,000 Mar. 16, 1972 30,000 June 30, 1972 10.000 Sept. 14. 1972 20.000 Dec. 7, 1972 10,000 Jan. 4, 1973 120,000 Jan. 18, 1973 20.000 Apr. 19. 1973 10,000 May 10, 1973 200,000 Sept. 27, 1973 100,000 Oct. 11, 1973 10,000 Oct. 18, 1973 10.000 Oct. 25. 1973 10,000 Nov. 8, 1973 20,000 Nov. 15, 1973 30,000 Nov. 29, 1973 10,000 Dec. 18, 1973 10,000 Dec. 20, 1973 100,000 Dec. 27, 1973 30,000 Jan. 10, 1974. 30.000 Jan. 31, 1974 10,000 Feb. 7, 1974 10,000 Feb. 21, 1974 55,000 Feb. 28, 1974 15,000 Mar. 7, 1974 40,000 Mar. 12, 1974 15,000 Mar. 14, 1974 30,000 Apr. 4, 1974 35,000 Apr. 18, 1974 60,000 May 2, 1974 15,000 May 16, 1974 10,000 June 4, 1974 50,000 June 6, 1974 60,000 June 21, 1974 75,000 July 2, 1974 60,000 July 11, 1974 25.000 July 18, 1974 10,000 July 25, 1974 40,000 July 30, 1974.. 10,000 Aug. 1, 1974 5,000 Aug. 15, 1974 30,000 Aug. 22, 1974 50,000 Aug. 27, 1974 160,000 Sept. 19, 1974 35,000 Sept. 24, 1974 55,000 Sept. 26, 1974 25.000 Oct. 3, 1974 10,000 Oct. 10, 1974 75,000 Oct. 17, 1974 65,000 Oct. 31, 1974 115.000 Nov. 14. 1974 50.000 Nov. 19. 1974 20,000 Nov. 21, 1974 20,000 Dec. 19, 1974 60,000 Dec. 26, 1974 -5 85.000 Jan. 9, 1975 20.000 Jan. 14. 1975 60,000 Jan. 16, 1975 95,000 Jan. 23, 1975 65,000 Jan. 30, 1975 80,000 Feb. 6, 1975 -40,000
$10,000
10,000
10,000 10,000
10,000
30,000 15,000
20,000 10,000
—15,000 10,000
— 15,000 10,000
30,000 50,000 10,000 20,000
10,000 20,000 45,000 75,000 30,000
10,000 10,000 70,000
60,000 75,000 30,000 70,000 20,000
$10,000 20,000 10,000 55,000 10,000 30,000
20.000 10,000 120,000 20,000 10,000
200,000 100,000
10,000 10,000 10,000 20,000 10,000 10,000 100,000 30,000 30,000
10,000 25,000
40,000 15,000 30,000 15.000 50.000 15,000 10,000 50,000 60,000 90,000 50,000 25,000 10,000 55,000
5,000
150,000 15,000 55,000 25,000
55,000 20,000 40.000 20,000 20,000 10,000 50,000 15,000 20,000
20,000 35,000 10,000 20,000
See footnotes at end of table. Digitized for FRASER http://fraser.stlouisfed.org/ Federal Reserve Bank of St. Louis
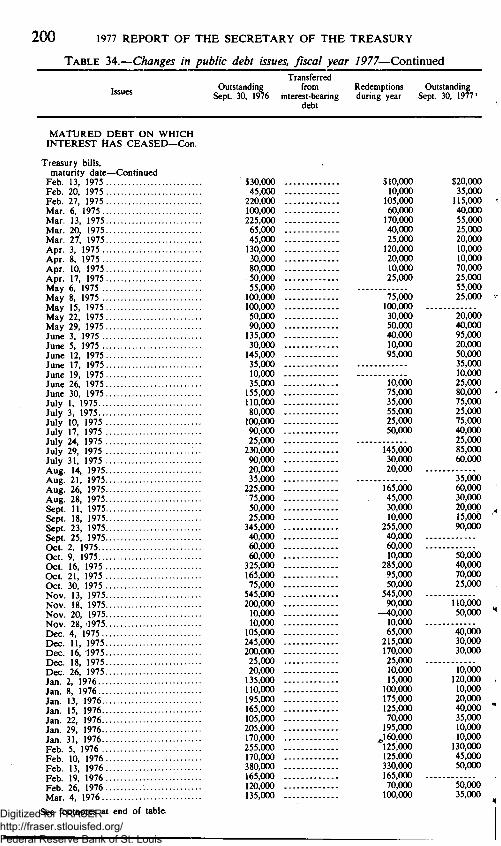
200 1977 REPORT OF THE SECRETARY OF THE TREASURY
TABLE 34.—Changes in public debt issues, fiscal year 1977—Continued
Issues Outstanding Sept. 30, 1976
Transferred from
interest-bearing debt
Redemptions during year
Outstanding Sept. 30, 1977'
MATURED DEBT ON WHICH INTEREST HAS CEASED—Con.
Treasury bills, maturity date—Continued
Feb. 13, 1975 $30,000 Feb. 20, 1975 45,000 Feb. 27, 1975 220.000 Mar. 6, 1975 100.000 Mar. 13, 1975 225,000 Mar. 20, 1975 65,000 Mar. 27, 1975 45,000 Apr. 3, 1975 130,000 Apr. 8. 1975 30,000 Apr. 10, 1975 80.000 Apr. 17. 1975 50,000 May 6. 1975 55,000 May 8. 1975 100.000 May 15. 1975 100.000 May 22. 1975 50,000 May 29, 1975 90,000 June 3, 1975 135,000 June 5, 1975 30,000 June 12, 1975 145,000 June 17, 1975 35,000 June 19, 1975 10,000 June 26, 1975 35,000 June 30. 1975 155.000 July 1. 1975 110.000 July 3. 1975 80.000 July 10. 1975 100.000 July 17. 1975 90.000 July 24. 1975 25.000 July 29. 1975 230.000 July 31, 1975 90,000 Aug. 14, 1975 20,000 Aug. 21, 1975 35,000 Aug. 26. 1975 225.000 Aug. 28. 1975 75.000 Sept. 11, 1975 50,000 Sept. 18, 1975 25,000 Sept. 23, 1975 345,000 Sept. 25, 1975 40,000 Oct. 2, 1975 60,000 Oct. 9. 1975 60.000 Oct. 16, 1975 325,000 Oct. 21, 1975 165,000 Oct. 30, 1975 75,000 Nov. 13, 1975 545,000 Nov. 18, 1975 200,000 Nov. 20, 1975 10,000 Nov. 28,-1975 10,000 Dec. 4, 1975 105,000 Dec. 11, 1975 245.000 Dec. 16.1975 200.000 Dec. 18. 1975 25.000 Dec. 26. 1975 20.000 Jan. 2. 1976 135.000 Jan. 8. 1976 110,000 Jan. 13. 1976 195.000 Jan. 15, 1976 165,000 Jan. 22, 1976 105,000 Jan. 29, 1976 205,000 Jan. 31, 1976 170,000 Feb. 5, 1976 255,000 Feb. 10, 1976 170,000 Feb. 13, 1976 380,000 Feb. 19, 1976 165,000 Feb. 26, 1976 120,000 Mar. 4, 1976 135,000
See footnotes at end of table.
$10,000 10,000 105,000 60,000 170,000 40,000 25,000 120,000 20,000 10,000 25,000
75,000 100,000 30,000 50.000 40.000 10.000 95.000
10.000 75,000 35,000 55,000 25,000 50,000
$20,000 35,000 115,000 40.000 55,000 25.000 20.000 10.000 10.000 70,000 25,000 55,000 25.000
20.000 40.000 95,000 20.000 50,000 35,000 10,000 25,000 80,000 75,000 25,000 75,000 40.000 25.000 85.000 60.000
145,000 30,000 20,000 .
35,000 165.000 60.000 45,000 30,000 30,000 20,000 10,000 15,000
255,000 90,000 40,000 60,000 10,000 50,000
285,000 40,000 95,000 70,000 50,000 25,000 545,000 90,000 110,000
-40,000 50,000 10,000 65,000 40,000 215,000 30,000 170,000 30,000 25,000 10,000 10,000 15,000 120,000 100,000 10,000 175,000 20,000 125,000 40,000 70,000 35,000 195,000 10,000 J60,000 10,000 125,000 130,000 125,000 45,000 330,000 50,000 165,000 70,000 50,000 100,000 35,000
Digitized for FRASER http://fraser.stlouisfed.org/ Federal Reserve Bank of St. Louis

STATISTICAL APPENDIX 201 TABLE 34.—Changes in public debt issues, fiscal year 1977—Continued
Issues Outstanding Sept. 30, 1976
Transferred from
interest-bearing debt
Redemptions during year
Outstanding Sept. 30, 1977'
MATURED DEBT ON WHICH INTEREST HAS CEASED-Con .
Treasury bills, maturity date—Continued Mar. 11, 1976 Mar. 18, 1976.... Mar. 25, 1976 Apr. 1, 1976 Apr. 6, 1976 Apr. 8, 1976 Apr. 15, 1976 Apr. 22, 1976 Apr. 29, 1976.... May 4, 1976 May 6, 1976 May 13, 1976 May 20, 1976 May 27, 1976 June 1, 1976 June 3, 1976 June 10, 1976 June 17, 1976 June 24, 1976 June 29. 1976 July 1. 1976 July 8. 1976 July 15, 1976 July 22, 1976 July 27, 1976 July 29, 1976 Aug. 5, 1976 Aug. 12, 1976 Aug. 19, 1976 Aug. 24, 1976 Aug. 26, 1976 Sept. 9, 1976 Sept. 16, 1976 Sept. 21, 1976 Sept. 23, 1976 Sept. 30, 1976 Oct. 14, 1976 Oct. 19, 1976 Oct. 21, 1976 Oct. 28, 1976 Nov. 4, 1976 Nov. 15, 1976 Nov. 18, 1976 Nov. 26, 1976 Dec. 2, 1976 Dec. 9, 1976 Dec. 14. 1976 Dec. 23, 1976 Dec. 30, 1976 Jan. 11, 1977 Jan. 13. 1977 Jan. 20. 1977 Jan. 27. 1977 Feb. 3, 1977 Feb. 8. 1977 Feb. 10. 1977 Feb. 17. 1977 Feb. 24, 1977 Mar. 3, 1977 Mar. 8, 1977 Mar. 10, 1977 Mar. 17, 1977 Mar. 24, 1977 Mar. 31, 1977 Apr. 5, 1977
See footnotes at end of table.
$275,000 $235,000 $40,000 305,000 265,000 40,000 240,000 220,000 20,000 95,000 60,000 35,000 135,000 100,000 35,000 135.000 90.000 45.000 95.000 20.000 75.000 245.000 145.000 100.000 175.000 175.000 205.000 180.000 25.000 345,000 345,000 60,000 60,000 85,000 65,000 20.000 200.000 135.000 65.000 260,000 250,000 10,000 290,000 290,000 420,000 305,000 115,000 275,000 240,000 35,000 445,000 445,000 745,000 300,000 445,000 230,000 220,000 10,000 105,000 105,000 385,000 385,000 180,000 150,000 30,000
1,295,000 1,210,000 85,000 280,000 280,000 315,000 315,000
1.080.000 1.080.000 680.000 600.000 80.000
2.515.000 2.365.000 150,000 940,000 915,000 25,000
2,595,000 2,235,000 360,000 2,985,000 2,955,000 30,000 9,939,000 9,584,000 355,000 5,135,000 i 4,535,000 600,000
22,433,000 22,433,000 $20,000 20,000 90,000 90,000 15,000 15,000 20,000 20,000 20,000 20,000 55,000 55,000 30,000 30,000 20,000 20,000 35,000 35,000 60,000 60,000 150,000 150,000 35,000 35,000 100,000 100,000 115,000 115,000 25,000 25,000 380,000 380,000 610,000 610,000 135,000 135,000 160,000 160,000 45,000 45,000 20,000 20,000 120,000 120,000 60,000 60,000 95,000 95,000 40,000 40,000 95,000 95,000 20,000 20,000 45,000 45,000 110,000 110,000
Digitized for FRASER http://fraser.stlouisfed.org/ Federal Reserve Bank of St. Louis

202 1977 REPORT OF THE SECRETARY OF THE TREASURY
TABLE 34.—Changes in public debt issues, fiscal year 1977^Continned
Issues
Transferred Outstanding from Redemptions Outstanding
Sept. 30, 1976 interest-bearing during year Sept. 30, 1977' debt.
MATURED DEBT ON WHICH INTEREST HAS CEASED—Con.
Treasury bills, maturity date—Continued
Apr. 7, 1977 Apr. 14, 1977 Apr. 21, 1977 Apr. 28, 1977 May 3, 1977 May 5, 1977 May 12. 1977 May 19. 1977 May 26, 1977 May 31, 1977 June 2, 1977 June 9, 1977 June 16, 1977 June 23, 197.7 June 28. 1977 June 30. 1977 July 7. 1977 July 14, 1977 July 21, 1977 July 26, 1977 July 28, 1977 Aug. 4, 1977 Aug. 11, 1977 Aug. 18, 1977 Aug. 23, 1977 Aug. 25, 1977 Sept. 1, 1977 Sept. 8, 1977 Sept. 15. 1977 Sept. 20, 1977 Sept. 22, 1977 Sept. 29, 1977
Total Treasury bills
Federal Financing Bank bills: Mar. 31, 1975
Treasury savings certificates: Issued Dec. 15, 1921 Issued Sept. 30, 1922 Issued Dec. 1, 1923
Total Treasury savings certificates .
Total matured debt on which interest has ceased
$155,000 $155,000 350,000 350,000 60,000 60,000 195,000 195,000 10,000 10,000
190,000 190,000 65,000 65,000 30,000 30,000 110,000 110.000 410,000 410,000 135,000 135,000 140,000 140,000 150,000 150,000 280,000 280,000
1,030,000 1,030,000 140,000 140,000 265,000 265,000 150,000 150,000 285.000 285,000 475.000 475,000 255,000 255,000 460,000 460,000 340.000 340,000 270,000 270,000
1.630,000 1,630,000 410,000 410,000
1.510,000 1,510,000 1,820,000 1,820,000 2,340,000 2,340,000 2,919,000 2,919,000 2,895,000 2,895,000 7.177.000 7.177.000
$69,426,000
75.000 .
7 350 43.000 . 13.825 .
64.175 .
422.500.939
29.376.000
347.218.000
$59,703,000
55.000
25
25
309.986.380
39.099.000
20.000
7,350 42,975 13.825
64.150
459,732.559
See footnotes at end of table.
Digitized for FRASER http://fraser.stlouisfed.org/ Federal Reserve Bank of St. Louis

STATISTICAL APPENDIX 2 0 3
TABLE 34.—Changes in public debt issues, fiscal year 1977—Continued
Issues Outstanding
Sept. 30, 1976
Issues during year
Transferred from
interest-bearing
debt
Redemptions during year
Outstanding Sept. 30,
1977'
DEBT BEARING NO INTEREST
Mortgage Guaranty Insurance Company tax and loss bonds
U.S. savings stamps Excess profits tax refund bonds: First series Second series
U.S. notes Old demand notes National and Federal Reserve bank notes
Fractional currency Old series currency Silver certificates Thrift and Treasury savings stamps.
Total debt bearing no interest...
$62,025,622 46.838,121
336,709 232,666
322,539,016 52,918
69,003,281 1,964,945 4,359,836
209,103,411 3,696.465
720.152,989
$30,563,114 $225 302,809
1.630 318
477.655
32.495 1.090,883
30,563,114
$92,588,511 46,535,312
335,079 232,348
322,539,016 52,918
68,525,626 1,964,945 4,327,340
208,012,528 3.696.377
1,906,103 748,810.000
Total gross public debt" 634,701,460,179 1,078,157,690,151 1,014,028,995,622 698,830,154,708
' Reconciliation by class to the basis of the Monthly Statement of the Public Debt of the United States is shown in summary table 26.
'Treasury bills are shown at maturity value. 'Treasury notes, 7y8 percent Series C-1981 and 7y8 percent Series E-1981 consolidated, effective Sept. 1,
1976. * Amounts issued, retired, and outstanding for individual retirement bonds and for retirement plan bonds are
stated at par with semiannual interest added when due. 'Amounts issued and retired for series E savings bonds and for savings notes include accrued discount;
amounts outstanding are stated at current redemption values. «Consists of issues in which there have been no transactions since the fiscal year 1956; for amount of each
issue outstanding (unchanged since June 30, 1956) see 1956 Annual Report, p. 435. ' Excess of unclassified redemptions over unclassified sales. 8 Includes public debt incurred to finance expenditures of wholly owned Govemment corporations and other
business-type activities in exchange for which their securities were issued to the Treasury (see table 107).
Digitized for FRASER http://fraser.stlouisfed.org/ Federal Reserve Bank of St. Louis

204 1977 REPORT OF THE SECRETARY OF THE TREASURY
TABLE 35.—Issues, maturities, and redemptions of interest-bearing public debt securities, excluding Government account series,
October 1976-September 1977 [Basis: Monthly Statement of the Public Debt of the U.S.. supplemented by special
statements by the Bureau of the Public Debt on public debt transactions)
Date Securities Rate of interest'
Amount issued'
Amount matured or called or
redeemed prior to maturity'
1976 Oct. 1 Treasury notes, Series EO-1976
Redeemable for cash 1 Treasury certificates of indebtedness,
dollar denominated, maturing Dec. 9. 1976
1 Treasury notes, dollar denominated. maturing Sept. 30. 1978
1 State and local govemment series: Treasury certificates of indebtedness Treasury notes Treasury bonds
5 Treasury certificates of indebtedness 6 Treasury notes
Treasury bonds 7 Treasury notes
Treasury bonds Treasury bills: Regular weekly:
7 Dated Apr. 8, 1976 7 Maturing Jan. 6. 1977 7 Maturing Apr. 7. 1977 7 Maturing Mar. 31, 1977
Adjustments of issues 7 Treasury bills, dollar denominated, maturing
Oct. 7, 1976 Jan. 6, 1977
8 Treasury notes. Series L-1976 Redeemed in exchange for 6y8% Treasury notes, Series Q-1978
8 Treasury notes. Series Q-1978 Issued in exchange for 5y8% Treasury notes. Series L-1976
8 Treasury notes, foreign currency denominated, maturing: Oct. 8, 1976 Apr. 7. 1978
12 Treasury notes, Series G-1981 Issued for cash
12 State and local govemment series: Treasury certificates of indebtedness Treasury notes Treasury bonds
13 Treasury certificates of indebtedness Treasury notes
Treasury bills: Regular weekly:
14 Dated Apr. 15, 1976 14 Maturing Jan. 13. 1977 14 Maturing Apr. 14. 1977 14 Treasury bills, dollar denominated, maturing
Oct. 14, 1976 Oct. 14. 1976 Jan. 13. 1977 Apr. 14. 1977
14 State and local govemment series: Treasury certificates of indebtedness Treasury notes Treasury bonds
15 Treasury certificates of indebtedness Treasury notes Treasury bonds
See footnotes at end of table.
Percent
«5.120 4.905 5.025
,
5 10
6 25
•5.342 5 088 5 266 5 325
y/ i
6V8
7 15 5 95 7.00
$200,000,000.00
400,000,000.00
570,000.00 55,000.00 30,000.00 130,000.00 155,000.00
-935,000.00 -1,315,000.00
2,507.345.000.00 3,506.085.000.00
65,000.00
42.700,000.00
-4,000,000.00
4.000,000.00
38,479,753.73
$10,557.000 00
235,000.00 925.000.00 125,000.00 230,000.00 125.000.00
— 125,000.00
6,006.725,000.00
42,700.000.00
4,000,000.00
—4,000,000.00
38,479,753.73
2,542,877,000.00
1,895,000.00 16,915,000.00
2,407,860,000.00 3,508,300,000.00
168,965,000.00 197,250,000.00
5,000.00 -3.175,000.00 —7,805.000.00
3,160.000.00
270,000.00 4,025,0(X).00 9,825,000.00
35,000.00
5,916,405.000.00
166.880,000.00 192,255,000.00
-3,665,000.00 —8,765,000.00
345,000.00 5,000.00
Digitized for FRASER http://fraser.stlouisfed.org/ Federal Reserve Bank of St. Louis

STATISTICAL APPENDIX 205 TABLE 35.—Issues, maturities, and redemptions of interest-bearing public debt
securities, excluding Government account series, October 1976-September 7977—-Continued
Date Securities Rate of interest'
Amount issued ^
Amount matured or called or
redeemed prior to maturity'
1976 Treasury bills: Fifty-two weeks:
Oct. 19 Dated Oct. 21, 1975 19 Maturing Oct. 18, 1977 20 State and local govemment series:
Treasury certificates of indebtedness Treasury notes
21 Treasury certificates of indebtedness Treasury notes Treasury bonds
Treasury bills: Regular weekly:
21 Dated Apr. 22, 1976 21 Maturing Jan. 20, 1977 21 Maturing Apr. 21, 1977 22 State and local govemment series:
Treasury certificates of indebtedness Treasury bonds
25 Treasury certificates of indebtedness Treasury notes Treasury bonds
27 Treasury certificates of indebtedness Treasury notes
28 Treasury certificates of indebtedness Treasury notes Treasury bonds
Treasury bills: Regular weekly:
28 Dated Apr. 29, 1976 28 Maturing Jan. 27, 1977 28 Maturing Apr. 27, 1977 28 Treasury notes, dollar denominated, maturing
Aug. 15, 1981 29 Jan. 30, 1978
Apr. 28, 1978 July 28, 1978 Oct. 30, 1978 Jan. 29, 1979 Apr. 30, 1979 July 30, 1979 Oct. 29, 1979
29 Treasury notes, foreign currency denominated, maturing: Oct. 29, 1976 Apr. 28, 1978
29 Treasury certificates of indebtedness, dollar denominated, maturing: Nov. 12, 1976 Jan. 28, 1977
29 Apr. 29, 1977 July 29, 1977 Oct. 28. 1977
29 Treasury bills, dollar denominated, maturing Jan. 13. 1977
29 State and local govemment series: Treasury certificates of indebtedness Treasury notes Treasury bonds
31 Treasury notes. Series 0-1976 Redeemable for cash
See footnotes at end of table.
Percent
6.600 $3,061,880,000.00 5.126 $3,095,140,000.00
80,000.00 4,780,000.00
860,000.00 13,115,000.00 6,015,000.00
*5.146 4.799 4.911
•5.215 4.930 5.094
7.625 5.70 5.80 5.95 6.00 6.05 6.15 6.20 6.25
7.35 5.80
5.20 4.95 5.25
'5.35 5.50
2,401.350.000.00 3.403,070,000.00
510.000.00 4.610.000.00
235.000.00 14.435,000.00 64,600.000.00
390,000.00 400.000.00 930.000.00
42.645,000.00 30.415.000.00
2,503,850,000.00 3,501,270,000.00
100.000.000.00 95,613.048.37 95,613,048.37 95,613,048.37 95,613,048.37 47,658,516.37 47,658,516.37 47,658,516.37 47,658,516.37
50,319,677.95
143,376,328.21 143,567,580.37 143,567,580.37 143,567,580.37
230,000.00 8.625,000.00
14.210,000.00
5,805,065.000.00
130.000.00
6,003,760,000.00
6'/,
50,319.677.95
211,000.000.00
167.227,852.06
1,578.950,000.00
Digitized for FRASER http://fraser.stlouisfed.org/ Federal Reserve Bank of St. Louis
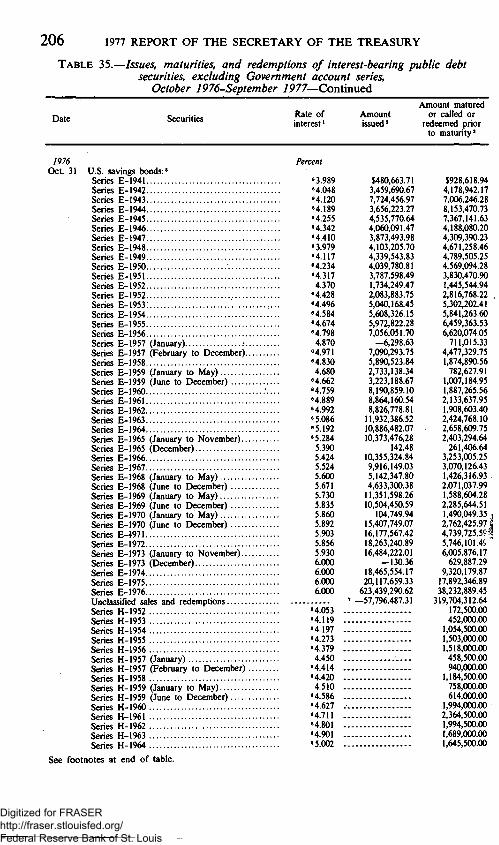
206 1977 REPORT OF THE SECRETARY OF THE TREASURY
TABLE 35.—Issues, maturities, and redemptions of interest-bearing public debt securities, excluding Government account series,
October 1976-September 7977—Continued
Date Securities Rate of interest'
Amount issued'
Amount matured or called or
redeemed prior to maturity'
1976 Oct. 31 U.S. savings bonds:'
Series E-1941 Series E-1942 Series E-1943 Series E-1944 Series E-1945 Series E-1946 Series E-1947 Series E-1948 Series E-1949 Series E-1950 Series E-1951 Series E-1952 Series E-1952 Series E-1953. Series E-1954 Series E-1955 Series E-1956 Series E-1957 (January) r.. Series E-1957 (February to December).. Series E-1958 Series E-1959 (January to May) Series E-1959 (June to December) Series E-1960 Series E-1961 Series E-1962 Series E-1963 Series E-1964 Series E-1965 (January to November)... Series E-1965 (December) Series E-1966 Series E-1967 Series E-1968 (January to May) Series E-1968 (June to December) Series E-1969 (January to May) Series E-1969 (June to December) Series E-1970 (January to May) Series E-1970 (June to December) Series E-i971 Series E-1972 Series E-1973 (January to November)... Series E-1973 (December) Series E-1974 Series E-1975 Series E-1976 Unclassified sales and redemptions Series H-1952 Series H-1953 Series H-1954 Series H-1955 Series H-1956 Series H-1957 (January) Series H-1957 (Febmary to December). Series H-1958 Series H-1959 (January to May) Series H-1959 (June to December) Series H-1960 Series H-1961 Series H-1962 Series H-1963 Series H-1964
See footnotes at end of table.
Percent
«3.989 «4.048 «4.120 H.189 «4.255 «4.342 «4.410 «3.979 M.117 «4.234 «4.317 4.370
•'4.428 «4.496 «4.584 «4.674 •'4.798 4.870
H.971 «4.830 4.680
«4.662 «4;759 «4.889 «4.992 «5.086 «5.192 «5.284 5.390 5.424 5.524 5.600 5.671 5.730 5.835 5.860 5.892 5.903 5.856 5.930 6.000 6.000 6.000 6.000
M.053 H.119 H.197 «4.273 «4.379 4 450
64414 «4.420 4 510
H586 H.627 «4.711 «4.801 «4.901 «5.002
$480,663.71 3,459,690.67 7,724,456.97 3,656,223.27 4,535,770.64 4,060,091.47 3,873,493.98 4,103,205.70 4,339,543.83 4,039,780.81 3,787,598.49 1,734,249.47 2,083,883.75 5,040,168.45 5,608,326.15 5,972,822.28 7,056.051.70
-6.298.63 7.090.293.75 5.890,523.84 2,733,138.34 3,223,188.67 8,190,859.10 8,864,160.54 8,826,778.81
11,932,386.52 10,886,482.07 10,373,476,28
142.48 10,355,324.84 9,916,149.03 5,142,347.80 4,633,300.38
11,351,598.26 10,504,450.59
104,749.94 15,407,749.07 16,177,567.42 18,263,240.89 16,484,222.01
-130.36 18,465,554.17 20,117,659.33
623,439,290.62 ' —57,796,487.31
$928,618.94 4,178.942.17 7.006.246.28 8.153.470.73 7.367.141.63 4,188.080.20 4,309.390.23 4.671,258.46 4,789,505.25 4,569,094.28 3,830,470.90 1,445,544.94 2,816,768.22 5,302,202.41 5,841,263.60 6,459,363.53 6,620,074.05
711,015.33 4,477,329.75 1,874,890.56
782,627.91 1,007,184.95 1,887,265.56 2,133,637.95 1,908,603.40 2,424,768.10 2,658,609.75 2.403,294.64
261,406.64 3,253,005.25 3,070,126.43 1,426,316.93 2,071,037.99 1,588,604.28 2,285,644.51 1,490,049.35 2,762,425.97 4,739,725.59^ 5,746,101.4S 6,005,876.17
629,887.29 9,320,179.87
17,892.346.89 38.232,889.45
319,704,312.64 172,500.00 452.000.00
1,054,500.00 1,503.000.00 1.518.000.00
458,500.00 940,000.00
1,184,500.00 758,000.00 614,000.00
1,994,000.00 2,364,500.00 1,994,500.00 1,689,000.00 1,645,500.00
Digitized for FRASER http://fraser.stlouisfed.org/ Federal Reserve Bank of St. Louis

STATISTICAL APPENDIX 207 TABLE 35.—Issues, maturities, and redemptions of interest-bearing public debt
securities, excluding Government account series, October 1976-September 7977—Continued
Amount matured Rate of Amount or called or interest' . issued" redeemed prior
to maturity'
Date Securities
1976 Oct. 31 U.S. savings bonds:»—Continued .
Series H-1965 (January to November).. Series H-1965 (December) Series H-1966 Series H-1967 Series H-1968 (January to May) Series H-1968 (June to December) Series H-1969 (January to May) Series H-1969 (June to December) Series H-1970 (January to May) Series H-1970 (June to December) Series H-1971 Series H-1972 Series H-1973 (January to November).. Series H-1973 (December) Series H-1974 Series H-1975 Series H-1976 Unclassified sales and redemptions
31 Treasury notes. Series C-1976 Adjustments of issues"
31 Adjustments of redemptions * 31 Treasury notes. Series N-1978
Adjustments of issues" 31 Treasury notes. Series R-1978..
Adjustments of issues" 31 Treasury notes. Series J-1979
Adjustments of issues" 31 Treasury notes. Series B-1976
Adjustments of issues" 31 U.S. savings notes:'
Series S-1967 Series S-1968 Series S-1968 Series S-1969 Series S-1970 Unclassified'°
31 U.S. individual retirement bonds 31 U.S. retirement plan bonds 31 Depositary bonds, First Series 31 Treasury bonds. Investment Series
B-1975-80 Redeemed in exchange for l'/s% Treasury notes. Series EO-1981
31 Treasury notes. Series EO-1981 31 Miscellaneous
Total October
Nov. 1 State and local govemment series: Treasury certificates of indebtedness.... Treasury notes Treasury bonds
1 Treasury notes. Series S-1978 Issued in exchange for 6Va% Treasury notes. Series 0-1976
Issued for cash 1 Treasury notes. Series 0-1976...
Redeemed in exchange for 5%% Treasury notes, Series S-1978
Redeemable for cash
See footnotes at end of table.
Percent
"5.106 5.290 5.327 5.272 5.240 5.346 5.450 5.679 5.730 5.794 5.834 5.889 5.949 6.000 6.000 6.000 6.000
7%
678
6%
dy.
8.00
$9,500.00 56,478,500.00
' —9,656,500.00
42,000.00
-5,000.00
2,980,000.00
40,000.00
6,000.00
$1,586,000.00 181,000.00
3,159.500.00 1.490.500.00
493.000.00 578,500.00 467,500.00 433,500.00 504,500.00 653,000.00
1,310,500.00 2,054,000.00 1,555,000.00
131,000.00 1,809,000.00 1,854,000.00 1,027,000.00
—5,443,000.00
42,000.00
5.54 5.56 5.66 5.68 5.71
6.00 5.13 2.00 ...
2'/« .. .
\ ' /2
206.362.59 240.109.43 372.362.94 876.261.15 259,658.09
60.75 . -22,648.92 1,095,837.53
4,000.00 .
86,732.56 82,460.42
157,826.61 352,484.67 124,040.99
1,602.64 317,746.44 39,000.00
4,000.00
69.556.500.00
32,863,916,003.31 29,884,102,278.53
3,950,000.00 18,235,000.00 3,735,000.00
578
98,370.000.00 2.822.330.000.00
6'/,
1.490.000.00 840,000.00
-185,000.00
98,370,000.00 -98,370,000.00
Digitized for FRASER http://fraser.stlouisfed.org/ Federal Reserve Bank of St. Louis

208 1977 REPORT OF THE SECRETARY OF THE TREASURY
TABLE 35.—Issues, maturities, and redemptions of interest-bearing public debt securities, excluding Government account series,
October 1976-September 7977—Continued
Date Securities Rate of interest'
Amount issued"
Amount matured or called or
redeemed prior to maturity'
1976 Nov. 2 State and local govemment series:
Treasury bonds 3 Treasury certificates of indebtedness
Treasury notes Treasury bonds
4 Treasury certificates of indebtedness Treasury notes Treasury bonds
Treasury bills: Regular weekly:
4 Dated May 6, 1976 4 Maturing Feb. 3, 1977 4 Maturing May 4, 1977 4 Treasury bills, dollar denominated, maturing
Nov. 4, 1976 Feb. 3, 1977
Treasury notes, dollar denominated, maturing Nov. 15, 1981
5 State and local govemment series: Treasury certificates of indebtedness Treasury notes Treasury bonds
9 Treasury certificates of indebtedness Treasury notes Treasury bonds
10 Federal Financing Bank bills: Dated July 30, 1974
10 State and local govemment series: Treasury certificates of indebtedness Treasury notes Treasury bonds
11 Treasury notes Treasury bonds
12 Treasury notes Treasury bonds
Treasury bills: Regular weekly:
12 Dated May 13, 1976 12 Maturing Feb. 10, 1977 12 Maturing May 12, 1977 12 Treasury bills, dollar denominated, maturing
Nov. 12, 1976 May 12, 1977
12 Treasury notes, dollar denominated, maturing Nov. 15, 1981
12 Treasury certificates of indebtedness, dollar denominated, maturing: Nov. 12, 1976
Treasury^ bills: Fifty-two weeks:
15 Dated Nov. 18, 1975 15 Maturing Nov. 15, 1977 15 Treasury notes. Series D-1976
Redeemed in exchange for: 6'/4% Treasury notes, Series K-1979 7% Treasury notes, Series B-1983
Redeemable for cash
See footnotes at end of table.
Percent
•5044 4 862 5 030
7 75
8.049
•5 320 4 892 5044
7.75
-$1,000.00 710,000.00
24,610.000.00 4.680.000.00 1,150,000.00
26,340,000.00 12,800,000.00
2,604,625,000.00 3,710,360.000.00
40,000,000.00
200,000,000.00
505,000.00 13,735,000.00 5,260.000.00 1.555,000.00
39.220.000.00 16.385.000.00
12.860,000.00 157,355,000.00 100.355,000.00 -110,000.00
110.000.00 3,335,000.00 2,125,000.00
2,603,915,000.00 3,702.200,000.00
249.500,000.00
200.000,000.00
$185,000.00
6,302,305,000.00
40,000.000.00
240,000.00 —185,000.00
185,000.00
10,000.00
510,000.00
6,303.840.000.00'
243,190,000.00
5.20 27,407.849.91
6.010 3,244.555,000.00 5.201 3,401,740,000.00
6%
69,900,000.00 50,000,000.00
4,204,702,000.00
Digitized for FRASER http://fraser.stlouisfed.org/ Federal Reserve Bank of St. Louis
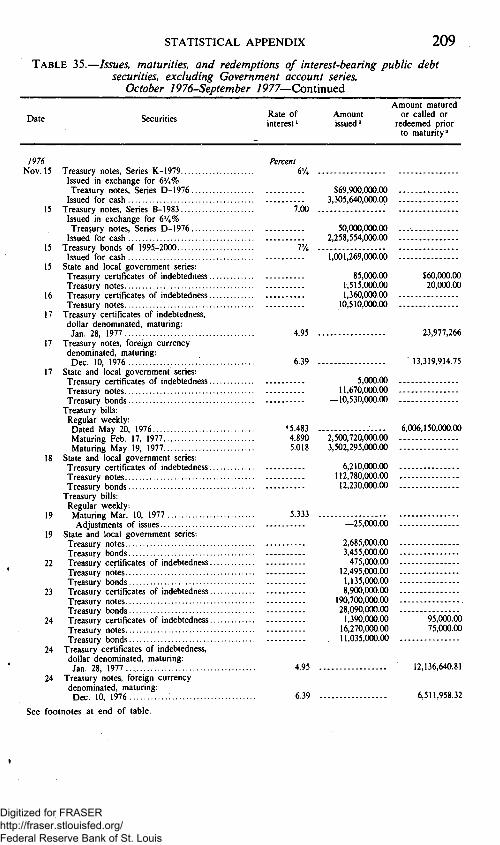
STATISTICAL APPENDIX 209 TABLE 35.-
Date
-Issues, maturities, and redemptions of interest-bearing public debt securities, excluding Government account series,
October 1976-September 1977—Continued
Securities Rate of interest'
Amount issued'
Amount matured or called or
redeemed prior to maturity'
1976 Nov. 15
22
23
24
24
24
Treasury notes. Series K-1979 Issued in exchange for (i'A% Treasury notes. Series D-1976
Issued for cash Treasury notes. Series B-1983
Issued in exchange for 6'/4% Treasury notes. Series D-1976
Issued for cash Treasury bonds of 1995-2000 Issued for cash
State and local government series: Treasury certificates of indebtedness., Treasury notes Treasury certificates of indebtedness., Treasury notes
Treasury certificates of indebtedness. dollar denominated, maturing: Jan. 28, 1977
Treasury notes, foreign currency denominated, maturing: Dec. 10, 1976
State and local govemment series: Treasury certificates of indebtedness. Treasury notes Treasury bonds
Treasury bills: Regular weekly: Dated May 20, 1976 Maturing Feb. 17. 1977 Maturing May 19, 1977
State and local govemment series: Treasury certificates of indebtedness. Treasury notes Treasury bonds
Treasury bills: Regular weekly: Maturing Mar. 10, 1977 Adjustments of issues
State and local govemment series: Treasury notes Treasury bonds Treasury certificates of indebtedness. Treasury notes Treasury bonds Treasury certificates of indebtedness. Treasury notes Treasury bonds Treasury certificates of indebtedness. Treasury notes Treasury bonds
Treasury certificates of indebtedness, dollar denominated, maturing: Jan. 28, 1977.... . . .
Treasury notes, foreign currency denominated, maturing:
Dec. 10, 1976
Percent 6'/4
7.00
VA
$69,900,000.00 3,305,640,000.00
50,000,000.00 2,258,554,000.00
'Y,00"l 269,'(XX).00
85,000.00 1,515.000.00 1,360.000.00
10,510,000.00
4.95
6.39
•5.483 4.890 5.018
5.333
4.95
6.39
5.000.00 11.670.000.00
-10,530,000.00
2,500,720,000.00 3,502,295,000.00
6,210.000.00 112,780,000.00 12,230,000.00
-25,000.00
2,685,000.00 3,455,000.00
475,000.00 12,495,000.00 1,135,000.00 8,900,000.00
190,700,000.00 28,090,000.00
1,390,000.00 16,270.000.00 11,035,000.00
$60,000.00 20,000.00
23,977,266
13,319,914.75
6,006.150,000.00
95,000.00 75,000.00
12,136,640.81
6,511,958.32
See footnotes at end of table.
Digitized for FRASER http://fraser.stlouisfed.org/ Federal Reserve Bank of St. Louis

210 1977 REPORT OF THE SECRETARY OF THE TREASURY
TABLE 35.—Issues, maturities, and redemptions of interest-bearing public debt securities, excluding Government account series,
October 1976-September 7977—Continued
Date Securities Rate of interest'
Amount issued'
Amount matured or called or
redeemed prior to maturity'
1976 Treasury bills:
Regular weekly: Nov.26 Dated May 27, 1976
26 Maturing Feb. 24, 1977 26 Maturing May 26. 1977 26 Maturing Jan. 20. 1977
Adjustments of issues 26 Maturing Apr. 21, 1977
Adjustments of issues 26 State and local govemment series:
Treasury certificates of indebtedness Treasury notes Treasury bonds
29 Treasury certificates of indebtedness Treasury notes Treasury bonds
30 Treasury certificates of indebtedness Treasury bonds
30 Treasury notes, dollar denominated, .maturing, Mar. 31, 1977
30 Treasury notes. Series N-1976 Redeemed in exchange for 5'/*% Treasury notes, Series T-1978
Redeemable for cash 30 Treasury notes. Series T-1978
Issued in exchange for 7'/8% Treasury notes, Series N-1976
Issued for cash 30 U.S. savings bonds:"
Series E-1941 Series E-1942 Series E-1943 Series E-1944 Series E-1945 Series E-1946 Series E-1947 Series E-1948 Series E-1949 Series E-1950 Series E-1951 Series E-1952 (January to April) Series E-1952 (May to December) Series E-1953 Series E-1954 Series E-1955 Series E-1956 Series E-1957 (January) Series E-1957 (February to December)., Series E-1958 Series E-1959 (January to May) Series E-1959 (June to December) Series E-1960 Series E-1961 Series E-1962 Series E-1963 Series E-1964 Series E-1965 (January to November).. Series E-1965 (December) Series E-1966 Series E-1967 Series E-1968 (January to May)
See footnotes at end of table.
Percent
•5.585 4 596 4 682 4 799
4911
6.50 7'/8
5'/4
"3.989 "4.048 "4.120 "4.189 "4.255 "4.342 "4.410 "3.979 "4.117 "4.234 "4.317 4.370 "4.428 "4.496 "4.584 "4.674 "4.798 4.870 "4.971 "4.830 4.680 "4.662 "4.759 "4.889 "4.992 "5.086 "5.192 "5.284 5.390 5.424 5.524 5.600
$2 602.050 000 00 3,600,815,000.00
1,565,000.00
—1,565,000.00
850,000.00 31 770 000 00 14 745 000 00 1,330,000.00 16,480,000.00 5,400,000.00
136000 000 00 2 801 555 000 00
836,214.21 3,591,198.81 4,246,792.01 5,726,765.54 10,419,162.34 3,833,845.15 3,723,844.94 4,132,013.48 4,292,904.98 3,925,946.74 3,591,576.03 -2,025.41
2,099,753.82 5,046,055.96 5,520,945.09 5,867,977.95 4,820,897.93 -2,359.71
7,874,017.96 7,134,776.22
4,101.23 2,708,169.57 6,732.210.55 6.979,386.72 6,622,624,03 8,618,065.56 8,520,550.25 7,944,107.26
233.34 8,940,852.23 9,168,585.26 4,680,475.59
$6,205,510,000.00
225,000.00
330.000.00
60.000.00 800.000.00
125.000.000.00 •
136,000,000 00 1,374 850,00000
853,455.38 3.349.926.32 5,517,969.54 . 6.338.010.03 5,636.668.54 3.352.710.71 3,475,679.04 3,753,137.08 3,931,926.79 3,891,842.68 3,328,441.48 1,173,662.64 2,278,656.27 . 4,131,384.95 4,696.801.00 5.397.151.39 5,143,642.74 479,316.78 1
4,915,312.31 1 6,993,835.35 2,898,318.38 3.804,803.06 6,930,704.69 J 7,730.248.65 1 7.868.717.38 9.809.876.96 9.584.799.15 9,003,368.35 1,006,957.79 12,050,421.18 12,250,881.36 5,563,852.13
Digitized for FRASER http://fraser.stlouisfed.org/ Federal Reserve Bank of St. Louis

STATISTICAL APPENDIX 211 TABLE 35.—Issues, maturities, and redemptions of interest-bearing public debt
securities, excluding Government account series, October 1976-September 7977—Continued
Date Securities Rate of interest'
Amount issued'
Amount matured or called or
redeemed prior to maturity'
1976 Nov. 10 U.S. savings bonds'—Continued
Series E-1968 (June to December) Series E-1969 (January to May) Series E-1969 (June to December) Series E-1970 (January to May) Series E-1970 (June to December) Series E-1971 Series E-1972 Series E-1973 (January to November)... Series E-1973 (December) Series E-1974 Series E-1975 Series E-1976 Unclassified sales and redemptions Series H-1952 Series H-1953 Series H-1954 Series H-1955 Series H-1956 Series H-1957 (January) Series H-1957 (February to December) . Series H-1958 Series H-1959 (January to May) Series H-1959 (June to December) Series H-1960 Series H-1961 Series H-1962 Series H-1963 Series H-1964 Series H-1965 (January to November)... Series H-1965 (December) Series H-1966 Series H-1967 Series H-1968 (January to May) Series H-1968 (June to December) Series H-1969 Series H-1969 Series H-1970 (January to May) Series H-1970 (June to December) Series H-1971 Series H-1972 Series H-1973 (January to November)... ^Series H-1973 (December) Series H-1974 Series H-1975 Series H-1976 Unclassified sales and redemptions
30 Treasury notes. Series N-1976 Adjustments of issues"
30 Treasury notes. Series B-1986 Adjustments of issues"
30 Treasury notes. Series EA-1981 Adjustments of issues"
30 Treasury notes. Series T-1978 Adjustments of redemptions"
30 Treasury bonds of 1996-2001 Adjustments of issues"
See footnotes at end of table.
Percent
5.671 5.730 5.835 5.860 5.892 5.903 5.856 5.930 6.000 6.000 6.000 6.000
"4 053 . "4 119 -"4 197 . "4 273 . "4 379 . 4.450 . "4.414 . "4.420 . 4 510 "4 586 "4 627 "4711 "4 801 "4 901 "5 002 "5 106 5 290 5 327 5 272 5 240 5 346 5.450 . 5.679 -5 730 . 5.794 . 5 834 -5 889 -5 949 . 6000 . 6000 . 6.000 6.000
7%
$4,557,787.01 -1,509,680.18 5,032,915.51 6,277.518.30 7.390.170.24
27.228,317.56 17,275.560.26 16.135.470.89
703.31 16,316.485.41 20,237.522.18 277,438,006.60 318,151,938.49 '
-14,531.500.00 58.148,000.00 6.676,500.00
$7,772,517.56 6.138,733.33 9.036.876.36 6.224,919.29 10,932.505.68 18.329.376.40 21,978,481.57 23,335,051.12 2,684,347.57 37,903,260.63 64,555,351.74 177,738.027.88
-56,683,068.17 208,000.00 539,000.00 892,500.00
1,271,500.00 1,359,000.00 108,000.00 815,500.00
1,191,500.00 564 000 00 565 000 00
1,920,500.00 2,007,500.00 1,722,000.00 1,731,000.00 1,678,000.00 1,375,000.00
34,500.00 2,828,000.00 1,197,500.00 499,000.00 569,000.00 321,500.00 422,500.00 437,500.00 435,500.00
1,294,000.00 1,645,000.00 1,694,500.00
85,500.00 1,775,000.00 1,695,500.00 744,500.00
' —621,000.00
3.505.000.00
800 —im nnn nn
li/j
3500000 53/^
800 10.000.00 .
305,000.00
Digitized for FRASER http://fraser.stlouisfed.org/ Federal Reserve Bank of St. Louis

212 1977 REPORT OF THE SECRETARY OF THE TREASURY
TABLE
Date
35.—Issues, maturities, and redemptions of interest-bearing public debt securities, excluding Government account series,
October 1976-September 7977—Continued
Securities Rate of interest'
Amount issued'
Amount matured or called or
redeemed prior to maturity'
1976 Nov.30 U.S. savings notes:"
Series S-1967 Series S-1968 (January to May) Series S-1968 (June to December) Series S-1969 Series S-1970 Unclassified'"
30 U.S. individual retirement bonds 30 U.S. retirement plan bonds 30 Depositary bonds. First Series 30 Treasury bonds. Investment Series
B-1975-80 Redeemed in exchange for l'/a% Treasury notes. Series EO-1981
30 Treasury notes, Series EO-1981 30 Miscellaneous
Total November
Dec. 1 State and local govemment series: Treasury certificates of indebtedness Treasury notes Treasury bonds
1 Treasury certificates of indebtedness, dollar denominated, maturing Jan. 28, 1977
1 Treasury notes, dollar denominated, maturing Apr. 30, 1977
1 Treasury notes, foreign currency denominated, maturing Dec. 10, 1976
Treasury bills: Regular weekly:
2 Dated June 3, 1976 2 Maturing Mar. 3, 1977 2 Maturing June 2, 1977 2 Treasury bills, dollar denominated, maturing
Dec. 2, 1976 June 2, 1977
2 State and local govemment series: Treasury certificates of indebtedness Treasury notes Treasury bonds
3 Treasury notes 6 Treasury certificates of indebtedness 7 Treasury certificates of indebtedness
Treasury notes Treasury bonds
7 Treasury notes. Series F-1980 Issued for cash
8 Treasury certificates of indebtedness, dollar denominated, maturing: Jan. 28, 1977
8 Treasury notes, foreign currency denominated, maturing Dec. 10, 1976
See footnotes at end of table.
Percent
5.54 5.56 5.66 5.68 5.71
6.00 5.14 2.00 --
2'/« . -
1%
$443,077.54 480,535.17 739,989.44
1,723,467.87 432,007.80
-461,160.95 1,460,121.27
57,000.00 .
$293,050.60 289,009.95 613,027.94
1,441,605.13 484,767.16
79,897.46 205,146.58 22,000.00
57,000.00
68.688.000.00
43,334,394,419.35 34,996,683,995.67
620,000.00 19,280,000.00
315,000.00
4.95
7.375
6.39
'5.594
4.466 2,507,490,000.00 4.568 3,506,370.000.00
47.425,000.00
. . . . . 65,000.00 1,600,000.00 3,580,000.00
290,000.00 2,835,000.00 3,840,000.00
5% 2,692,005,000.00
4.95
6.39
2,555,000.00 310,000.00
12,432,656.44
150,000,000.00
6,807,956.43
6,004,715,000.00
47,425,000.00
20,000.00 245,000.00 (,
585,000.00 390,000.00
12,136,640.81
6,511,958.32
Digitized for FRASER http://fraser.stlouisfed.org/ Federal Reserve Bank of St. Louis

STATISTICAL APPENDIX 213 TABLE 35.-
Date
-Issues, maturities, and redemptions of interest-bearing public debt securities, excluding Government account series,
October 1976-September 7977—Continued
Securities Rate of interest'
Amount issued'
Amount matured or called or
redeemed prior to maturity'
1976 Dec. 8 State and local govemment series:
Treasury certificates of indebtedness Treasury notes Treasury bonds
9 Treasury certificates of indebtedness Treasury notes Treasury bonds
Treasury bills: Regular weekly:
9 Dated June 10, 1976 9 Maturing Mar. 10, 1977 9 Maturing June 9, 1977 9 Treasury bills, dollar denominated,
maturing Mar. 10, 1977 9 Treasury certificates of indebtedness,
dollar denominated, maturing Dec. 9, 1976
10 Treasury bills: Short dated: Maturing Apr. 21, 1977
10 Treasury notes, foreign currency denominated, maturing:
Dec. 10, 1976 June 9, 1978
10 State and local govemment series: Treasury certificates of indebtedness Treasury notes
13 Treasury notes Treasury bonds
Treasury bills: Fifty-two weeks:
13 Dated Dec. 16, 1975 14 Maturing Dec. 13, 1977 14 Treasury bills, dollar denominated, maturing
Dec. 14,'1976 Apr. 14, 1977
14 State and local govemment series: Treasury certificates of indebtedness Treasury notes Treasury bonds
15 Treasury certificates of indebtedness, dollar denominated, maturing Jan. 28, 1977
15 Treasury notes, foreign currency denominated, maturing Mar. 8, 1977
15 State and local govemment series: Treasury certificates of indebtedness Treasury notes Treasury bonds
Treasury bills: Regular weekly:
16 Dated June 17, 1976 16 Maturing Mar. 17, 1977 16 Maturing June 16. 1977 16 State and local govemment series:
Treasury certificates of indebtedness Treasury notes Treasury bonds
See footnotes at end of table.
Percent
•5.471 4.383 4.516
5.10
6.39 5.25
6.440 4.708
4.95
7.75
•5.459 4.360 4.508
$950,000.00 19,865,000.00 $310,000.00 1,540.000.00 185,000.00
1,310,000.00 1,395,000.00
5,705,775,000.00 2,305,740,000.00 3,404,660,000.00
240,000,000.00
200,000,000.00
4.449 2,005,595,000.00
137,047,122.91
2.035,000.00 -2,035,000.00
3,504,600,000.00
40,000,000.00
100,000.00 2,290,000.00 2,425,000.00
137,047,122.91
350,000.00 5,000.00
3,253,145,000.00
40,000,000.00
45,000.00
11,840,625.19
6,807,956.43
1,605,000.00 25,660,000.00 39,940,000.00 12.390,000.00
5,306.665,000.00 2.104,170,000.00 3,202.275,000.00
325,000.00 2,455.000.00 5,420,000.00
Digitized for FRASER http://fraser.stlouisfed.org/ Federal Reserve Bank of St. Louis
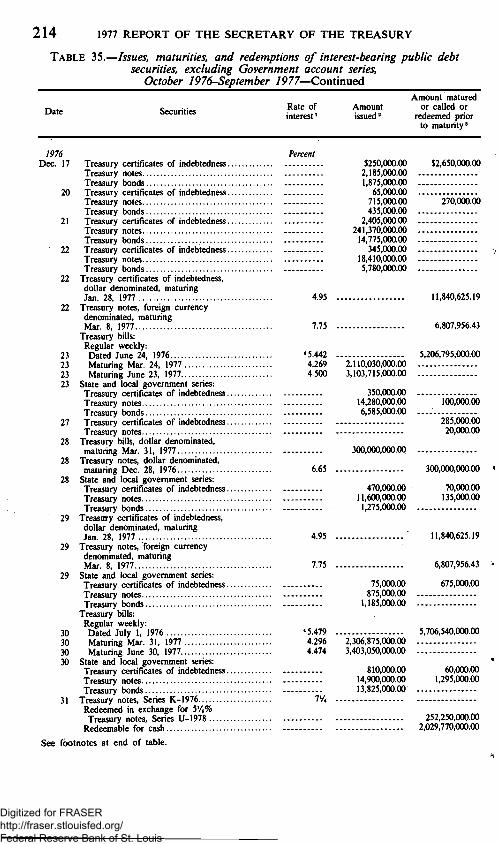
214 1977 REPORT OF THE SECRETARY OF THE TREASURY
TABLE 35.—Issues, maturities, and redemptions of interest-bearing public debt securities, excluding Government account series,
October 1976-September 7977—Continued
Date Securities Rate of interest'
Amount issued'
Amount matured or called or
redeemed prior to maturity'
1976 Dec. 17 Treasury certificates of indebtedness.
Treasury notes Treasury bonds
20 Treasury certificates of indebtedness. Treasury notes Treasury bonds
21 Treasury certificates of indebtedness. Treasury notes Treasury bonds
22 Treasury certificates of indebtedness. Treasury notes Treasury bonds
22 Treasury certificates of indebtedness, dollar denominated, maturing Jan. 28, 1977
22 Treasury notes, foreign currency denominated, maturing Mar. 8, 1977
Treasury bills: Regular weekly:
23 Dated June 24, 1976 23 Maturing Mar. 24, 1977 23 Maturing June 23, 1977 23 State and local govemment series:
Treasury certificates of indebtedness. Treasury notes. Treasury bonds
27 Treasury certificates of indebtedness. Treasury notes
28 Treasury bills, dollar denominated, maturing Mar. 31, 1977
28 Treasury notes, dollar denominated, maturing Dec. 28, 1976
28 State and local govemment series: Treasury certificates pf indebtedness.. Treasury notes Treasury bonds
29 Treasury certifii^ates of indebtedness, dollar denominated, maturing Jan. 28, 1977
29 Treasury notes, foreign currency denominated, maturing Mar. 8, 1977
29 State and local govemment series: Treasury certificates of indebtedness.. Treasury notes Treasury bonds
Treasury bills: Regular weekly:
30 Dated July 1. 1976 30 Maturing Mar. 31, 1977 30 Maturing June 30, 1977 30 State and local govemment series:
Treasury certificates of indebtedness.. Treasury notes Treasury bonds
31 Treasury notes. Series K-1976 Redeemed in exchange for 5'/*% Treasury notes. Series U-1978
Redeemable for cash
See footnotes at end of table.
Percent
4.95
7.75
•5.442 4.269 4.500
6.65
4.95
7.75
•5.479 4.296 4.474
VA
$250,000.00 $2,650,000.00 2.185,000.00 1,875,000.00
65,000.00 715,000.00 270,000.00 435,000.00
2,405,000.00 241,370,000.00 14,775,000.00
345,000.00 18,410,000.00 5,780,000.00
11,840,625.19
6,807,956.43
5,206,795,000.00
2,110,030,000.00 3,103,715,000.00
350,000.00 14,280,000.00 100,000.00 6,585,000.00
285,000.00 20,000.00
300,000,000.00
470,000.00 11,600.000.00 1,275,000.00
75.000.00 875,000.00
1,185,000.00
2,306,875.000.00 3.403.050.000.00
300.000,000.00 *
70,000.00 135,000.00
11,840,625.19
6.807,956.43 >"
675,000.00
5,706,540,000.00
810,000.00 60,000.00 14,900,000.00 1,295,000.00 13,825,000.00
252,250,000.00 2,029.770,000.00
Digitized for FRASER http://fraser.stlouisfed.org/ Federal Reserve Bank of St. Louis
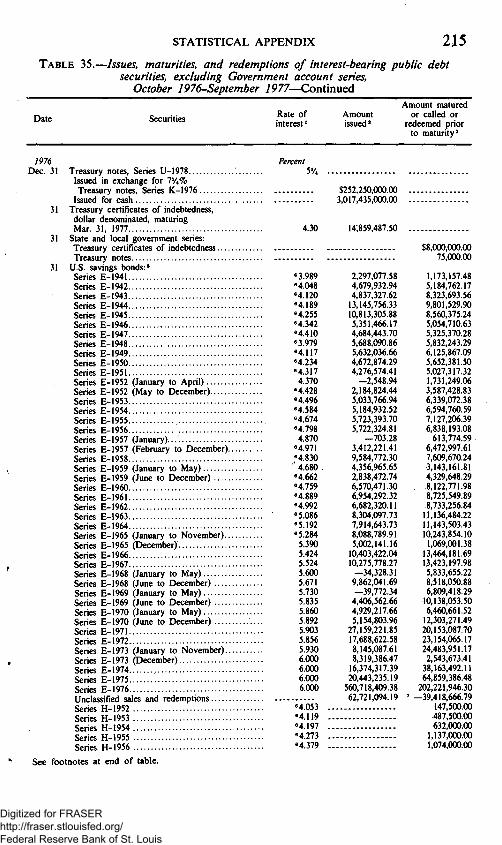
STATISTICAL APPENDIX 215 TABLE 35.-
Date
-Issues, maturities, and redemptions of interest-bearing public debt securities, excluding Government account series,
October 1976-September 7977—Continued
Securities Rate of interest'
Amount issued
Amount matured or called or
redeemed prior to maturity'
1976 Dec. 31 Treasury notes. Series U-1978
Issued in exchange for 7'/4% Treasury notes, Series K-1976
Issued for cash 31 Treasury certificates of indebtedness,
dollar denominated, maturing Mar. 31, 1977
31 State and local govemment series: Treasury certificates of indebtedness Treasury notes
31 U.S. savings bonds:' Series E-1941 Series E-1942 Series E-1943 Series E-1944 Series E-1945 Series E-1946 Series E-1947 Series E-1948 Series E-1949 Series E-1950 Series E-1951 Series E-1952 (January to April) Series E-1952 (May to December) Series E-1953 Series E-1954 Series E-1955 Series E-1956 Series E-1957 (January)... Series E-1957 (February to December).. Series E-1958 Series E-1959 (January to May) Series E-1959 (June to December) Series E-1960 Series E-1961 Series E-1962 Series E-1963 Series E-1964 Series E-1965 (January to November)... Series E-1965 (December) Series E-1966 Series E-1967 Series E-1968 (January to May) Series E-1968 (June to December) Series E-1969 (January to May) Series E-1969 (June to December) Series E-1970 (January to May) Series E-1970 (June to December) Series E-1971 Series E-1972 Series E-1973 (January to November).. Series E-1973 (December) Series E-1974 Series E-1975 Series E-1976 Unclassified sales and redemptions Series H-1952 Series H-1953 Series H-1954 Series H-1955 Series H-1956
See footnotes at end of table.
Percent
«95775nnnnnn 3.017.435.000 00
4.30
"3.989 "4.048 "4.120 "4.189 "4.255 "4.342 "4.410 "3.979 "4.117 "4.234 "4.317 4.370
"4.428 "4.496 "4.584 "4.674 "4.798 4.870
"4.971 "4.830 4.680
"4.662 "4.759 "4.889 "4.992 "5.086 "5.192 "5.284 5.390 5.424 5.524 5.600 5.671 5.730 5.835 5.860 5.892 5.903 5.856 5.930 6.000 6.000 6.000 6.000
"4.053 "4.119 "4.197 "4.273 "4.379
14,859,487.50 .
2,297,077.58 4,679,932.94 4,837,327.62
13,145,756.33 10,813,305.88 5,351,466.17 4,684,443.70 5,688,090.86 5,632,036.66 4,672,874.29 4,276,574.41
-2,548.94 2,184,824.44 5,033,766.94 5,184,932.52 5,723,393.70 5,722,324.81
-703.28 3,412,221.41 9,584,772.30 4.356,965.65 2,838,472.74 6,570,471.30 6,954,292.32 6,682,320.11 8,304,097.73 7,914,643.73 8,088,789.91 5,002,141.16
10,403,422.04 10,275,778.27
-34.328.31 9.862,041.69 -39,772.34
4,406,562.66 4,929,217.66 5,154,803.96
27,159,221.85 17.688.622.58 8,145,087.61 8,319,386.47
16,374,317.39 20,443,235.19
560,718,409.38 62,721,094.19 '
$8,000,000.00 75,00000
1,173,157.48 5,184,762.17 8,323,693.56 9,801,529.90 8,560,375.24 5,054,710.63 5,325,370.28 5,832,243.29 6,125,867.09 5,652,381.50 5,027,317.32 1,731,249.06 3,587,428.83 6,339,072.38 6,594,760.59 7,127,206.39 6,838,193.08
613,774.59 6,472,997.61 7,609,670.24 3,143,161.81 4,329,648.29
. 8,122,771.98 8,725,549.89 8,733,256.84
11,136,484.22 11,143,503.43 10,243,854.10 1,069,001.38
13,464,181.69 13,423,197.98 5,833,655.22 8,518,050.88 6,809,418.29
10,138,053.50 6,460,661.52
12,303,271.49 20,153,087.70 23,154,065.17 24,483,951.17 2,543,673.41
38.163,492.11 64,859,386.48
202,221,946.30 —39,418,666.79
147,500.00 487,500.00 632,000.00
1,137,000.00 1,074,000.00
Digitized for FRASER http://fraser.stlouisfed.org/ Federal Reserve Bank of St. Louis
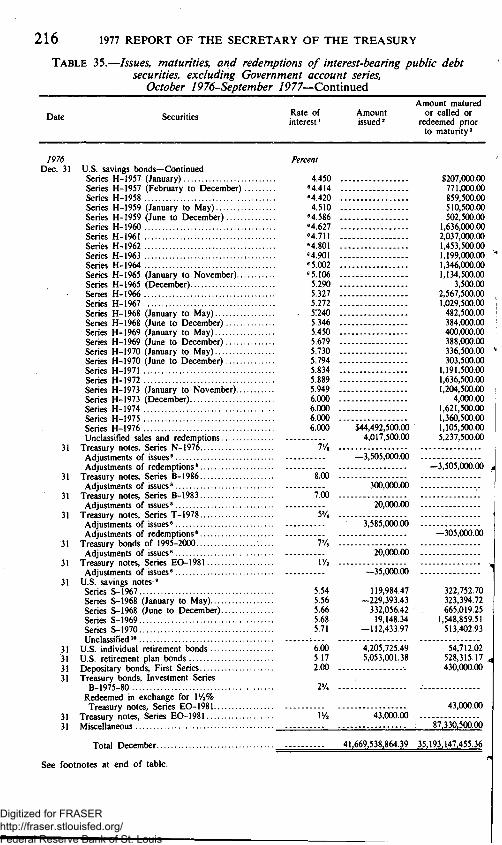
216 1977 REPORT OF THE SECRETARY OF THE TREASURY
TABLE 35.
Date
-Issues, maturities, and redemptions of interest-bearing public debt securities, excluding Government account series,
October 1976-September 7977—Continued
Securities Rate of interest'
Amount issued'
Amount matured or called or
redeemed prior to maturity'
1976 Dec. 31 U.S. savings bonds—Continued
Series H-1957 (January) Series H-1957 (Febmary to December). Series H-1958 Series H-1959 (January to May) Series H-1959 (June to December) Series H-1960 Series H-1961 Series H-1962 Series H-1963 Series H-1964 Series H-1965 (January to November)... Series H-1965 (December) Series H-1966 Series H-1967 Series H-1968 (January to May) Series H-1968 (June to December) Series H-1969 (January to May) Series H-1969 (June to December) Series H-1970 (January to May) Series H-1970 (June to December) Series H-1971 Series H-1972 Series H-1973 (January to November)... Series H-1973 (December) Series H-1974 Series H-1975 Series H-1976 Unclassified sales and redemptions
31 Treasury notes, Series N-1976 Adjustments of issues" Adjustments of redemptions *
31 Treasury notes, Series B-1986 Adjustments of issues"
31 Treasury notes. Series B-1983 Adjustments of issues"
31 Treasury notes. Series T-1978 Adjustments of issues" Adjustments of redemptions"
31 Treasury bonds of 1995-2000 Adjustments of issues"
31 Treasury notes. Series EO-1981 Adjustments of issues"
31 U.S. savings notes:" Series S-1967 Series S-1968 (January to May) Series S-1968 (June to December) Series S-1969 Series S-1970 Unclassified'"
31 U.S. individual retirement bonds 31 U.S. retirement plan bonds 31 Depositary bonds, First Series 31 Treasury bonds, Investment Series
B-1975-80 Redeemed in exchange for l'/a% Treasury notes, Series EO-1981
31 Treasury notes, Series EO-1981 31 Miscellaneous
Total December
See footnotes at end of table.
Percent
4.450 "4.414 "4.420 4.510
"4.586 "4.627 "4.711 "4.801 "4.901 "5.002 "5.106
5.290 5.327 5.272 5!240 5.346 5.450 5.679 5.730 5.794 5.834 5.889 5.949 6.000 6.000 6.000 6.000
7'/8
8.00
IOO
" s ' A
7V8
"vA
$44,492,500.00 4,017,500.00
-3^505,000.00
300,000.00
" " io .oooVob
'3^585,0(X).()b
20,000.00
-35,000.00
$207,000.00 771,000.00 859,500.00 510,500.00 502,500.00
1,636.000.00 2,037.000.00 1,453.500.00 1,199,000.00 1,346,000.00 1,134,500.00
3,500.00 2,567,500.00 1,029,500.00
482,500.00 384,000.00 400,000.00 388,000.00 336,500.00 303,500.00
1,191.500.00 1.636,500.00 1,204,500.00
4,000.00 1,621,500.00 1,360,500.00 1,105,500.00 5,237,500.00
-3,505,000.00 J
-305,000.00
5.54 119,984.47 322,752.70 5.56 -229,393.43 323.394.72 5.66 332.056.42 665,019.25 5.68 19,148.34 1,548,859.51 5.71 -112,433.97 513,402.93
6.00 4,205,725.49 54.712.02 5.17 5,053,001.38 528,315.17 2.00 430,000.00
2% -
43,000.00 \'A 43,(X)0.00
: 87.330,500.00
41.669.538,864.39 35.193,147,455.36
Digitized for FRASER http://fraser.stlouisfed.org/ Federal Reserve Bank of St. Louis

STATISTICAL APPENDIX 217 TABLE 35.—Issues, maturities, and redemptions of interest-bearing public debt
securities, excluding Government account series, October 1976-September 7977—Continued
Date Securities Rate of interest'
Amount issued'
Amount matured or called or
redeemed prior to maturity'
7977 Jan. 3 State and local govemment series:
Treasury certificates of indebtedness Treasury notes Treasury bonds
4 Treasury certificates of indebtedness Treasury notes
5 Treasury certificates of indebtedness Treasury notes
5 Treasury certificates of indebtedness, dollar denominated, maturing Jan. 28, 1977
5 Treasury notes, foreign currency denominated, maturing Mar. 8, 1977
Treasury bills: Regular weekly:
6 Dated July 8, 1976 6 Maturing Apr. 7, 1977 6 Maturing July 7, 1977 6 Treasury notes. Series D-1982
Issued for cash 6 Treasury bills, dollar denominated, maturing
Jan. 6, 1977 June 9, 1977
6 State and local govemment series: Treasury certificates of indebtedness Treasury notes Treasury bonds
7 Treasury certificates of indebtedness 10 Treasury certificates of indebtedness
Treasury notes Treasury bonds
Treasury bills: Fifty-two weeks:
11 Dated Jan. 13, 1976 11 Maturing Jan. 10. 1978 11 State and local govemment series:
Treasury certificates of indebtedness Treasury notes Treasury bonds
12 Treasury certificates of indebtedness Treasury notes Treasury bonds
12 Treasury certificates of indebtedness, dollar denominated, maturing: Jan. 28, 1977 Mar. 31, 1977
12 Treasury notes, foreign currency denominated, maturing: Mar. 8, 1977
Treasury bills: Regular weekly:
12 Maturing Mar. 24, 1977 Adjustments of issues
12 Maturing June 23, 1977 Adjustments of issues
See footnotes at end of table.
Percent
4.95 .
7 75 .
• 5 508 . 4 407 4 555
6'/8
5.578 4 728
4 95 4 30
7.75
4 269
4 500
$20,000.00 160,000.00
1,680,000.00 115,000.00
2,005,000.00 1,310,000.00
18,890,000.00
2,506,580,000.00 3,504,580,000.00
""Y,69'7^4i6,0(X).(X)
42,700,000.00
3,190,000.00 197,315,000.00 14,030.000.00 .
70.000.00 3.050.000.00
-3,120.000.00
3.070,660,000.00
7.435.000.00 151,295.000.00 3,505,000.00 925,000.00
16.200.000.00 5.210.000.00
350,000.00
-350.000.00
$1,740,000.00 8.665.000.00
1,755,000.00
230,000.00
11,840,625.19
6,511,958.32
6,013,875,000.00
42,700,000.00
400,000.00 360,000.00
3,068,750.000.00
11.840,625.19 14,859,487.50
6,511,958.32
Digitized for FRASER http://fraser.stlouisfed.org/ Federal Reserve Bank of St. Louis
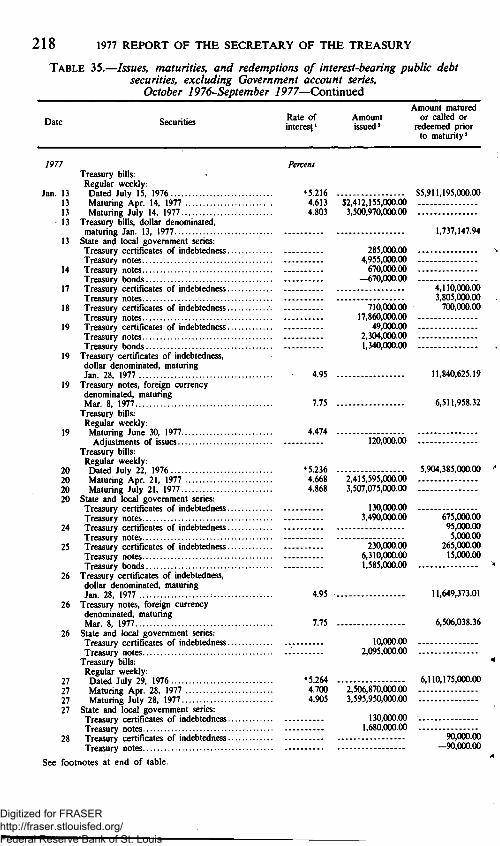
218 1977 REPORT OF THE SECRETARY OF THE TREASURY
TABLE 35.—Issues, maturities, and redemptions of interest-bearing public debt securities, excluding Government account series,
October 1976-September 1977—Continned
Date Securities Rate of interest'
Amount issued'
Amount matured or called or
redeemed prior to maturity'
7977 Treasury bills: Regular weekly:
Jan. 13 Dated July 15, 1976 13 Maturing Apr. 14, 1977 13 Maturing July 14, 1977 13 Treasury bills, dollar denominated,
maturing Jan. 13, 1977 13 State and local govemment series:
Treasury certificates of indebtedness. Treasury notes
14 Treasury notes Treasury bonds
17 Treasury certificates of indebtedness. Treasury notes
18 Treasury certificates of indebtedness. Treasury notes
19 Treasury certificates of indebtedness. Treasury notes Treasury bonds
19 Treasury certificates of indebtedness, dollar denominated, maturing Jan. 28, 1977
19 Treasury notes, foreign currency denominated, maturing Mar. 8, 1977
Treasury bills: Regular weekly:
19 Maturing June 30, 1977 Adjustments of issues
Treasury bills: Regular weekly:
20 Dated July 22, 1976 20 Maturing Apr. 21, 1977 20 Maturing July 21, 1977 20 State and local govemment series:
Treasury certificates of indebtedness. Treasury notes
24 Treasury certificates of indebtedness. Treasury notes
25 Treasury certificates of indebtedness. Treasury notes Treasury bonds
26 Treasury certificates of indebtedness, dollar denominated, maturing Jan. 28, 1977
26 Treasury notes, foreign currency denominated, maturing Mar. 8, 1977
26 State and local govemment series: Treasury certificates of indebtedness. Treasury notes
Treasury bills: Regular weekly:
27 Dated July 29, 1976 27 Maturing Apr. 28, 1977 27 Maturing July 28, 1977 27 State and local govemment series:
Treasury certificates of indebtedness. Treasury notes
28 Treasury certificates of indebtedness. Treasury notes
See footnotes at end of table.
Percent
•5.216 4.613 4.803
4.474
•5.236 4.668 4.868
4.95
7.75
$5,911,195,000.00 $2,412,155,000.00 3,500,970,000.00
1,737,147.94
285,000.00 4,955,000.00 670,000.00
—670,000.00 4,110,000.00 3,805,000.00
710,000.00 700,000.00 17,860,000.00
49,000.00 2,304,000.00 1,340,000.00
4.95
7.75
•5.264 4.700 4.905
120,000.00
2,415,595,000.00 3,507,075,000.00
130,000.00 3,490,000.00
230,000.00 6,310,000.00 1,585,000.00
10,000.00 2,095,000.00
11,840,625.19
6,511,958.32
5,904,385,000.00
675,000.00 95,000.00 5,000.00
265,000.00 15,000.00
11,649,373.01
6,506,038.36
6,110,175,000.00 2,506,870,000.00 3,595,950,000.00
130,000.00 1,680,000.00
90,000.00 -90,000.00
Digitized for FRASER http://fraser.stlouisfed.org/ Federal Reserve Bank of St. Louis

STATISTICAL APPENDIX 219 TABLE 35.—Issues, maturities, and redemptions of interest-bearing public debt
securities, excluding Government account series, October 1976-September 7977—Continued
Date Securities Rate of interest'
Amount issued'
Amount matured or called or
redeemed prior to maturity'
7977 Jan. 28 Treasury notes, dollar denominated,
maturing: Jan. 28. 1977 May 15, 1982
31 State and local govemment series: Treasury certificates of indebtedness Treasury notes
31 U.S. savings bonds:' Series E-1941 Series E-1942 Series E-1943 Series E-1944 Series E-1945 Series E-1946 Series E-1947 Series E-1948 Series E-1949 Series E-1950 Series E-1951 Series E-1952 (January to April) Series E-1952 (May to December) Series E-1953 Series E-1954 Series E-1955 Series E-1956 Series E-1957 (January) Series E-1957 (February to December).. Series E-1958 Series E-1959 (January to May) Series E-1959 (June to December) Series E-1960 Series E-1961 Series E-1962 Series E-1963 Series E-1964 Series E-1965 (January to November)... Series E-1965 (December) Series E-1966 Series E-1967 Series E-1968 (January to May) Series E-1968 (June to December) Series E-1969 (January to May) Series E-1969 (June to December) Series E-1970 (January to May) Series E-1970 (June to December) Series E-1971 Series E-1972 Series E-1973 (January to November)... Series E-1973 (December) Series E-1974 Series E-1975 Series E-1976 Unclassified sales and redemptions Series H-1952 Series H-1953 Series H-1954 Series H-1955 Series H-1956 Series H-1957 (January) Series H-1957 (Febmary to December). Series H-1958
See footnotes at end of table.
Percent
6.65 8.00 $300,000,000.00
$300,000,000.00
375,000.00 25,000.00
"3.989 595,781.28 1,004,978.36 "4.048 4,846,642.99 3,777,313.00 "4.120 5,425,103.47 6,123,594.28 "4.189 10,336,973.63 7,827,151.00 "4.255 5,641,642.42 6.825,571.23 "4.342 4,451,467.77 3,994,622.78 "4.410 7,023,999.80 4,198,958.60 "3.979 6,346,824.25 4,691,122.16 "4.117 6,593,764.76 4,962,847.32 "4.234 6,145,898.95 4,689,332.90 "4.317 4,822,259.58 3,719,212.58 4.370 • 2,739,937.15 1,171,010.12
"4.428 3,967,194.99 2,886,406.13 "4.496 4,696,490.83 4,822,183.76 "4.584 5,067,701.54 5,241,558.59 "4.674 5,487,567.08 5,554,171.38 "4.798 5,530,822.48 5,498,512.68 4.870 —56.87 399,432.51
"4.971 5,749,002.57 4,330,739.96 "4.830 7,466,687.91 4,361.445.62 4.680 3,300,714.77 1,706,078.75
"4.662 3,452,733.01 2,383,366.64 "4.759 6,751,769.60 4,245,992.81 "4.889 7,236,365.24 4,944,806.57 "4.992 7,207,317.59 4,494,090.21 "5.086 9,509,552.01 5,735,352.58 "5.192 8,792,657.47 5,628,518.75 "5.284 8,532,825.09 5,255,495.49
5.390 —23,729.47 543,713.90 5.424 11,026,702.23 7,459,438.13 5.524 11,773,647.29 7,319,241.19 5.600 5,881,577.15 3,222,884.06 5.671 5,357,242.72 4,549,350.45 5.730 5,783,965.40 3,446,262.12 5.835 4,303,846.58 5,336,903.70 5.860 5,251,963.31 3,540,560.38 5.892 5,385,476.88 6,474,171.94 5.903 21,345,917.80 11,188,644.68 5.856 19,548,327.95 12.407.597.27 5.930 20,489,612.88 12,682,987.86 6.000 -47,454.55 1,271,183.27 6.000 19,853,392.75 19,582,039.10 6.000 20.889,179.16 34,152,147.02 6.000 824,615,208.86 113,490,616.57
' 153,340,487.68 269,513,657.65 «4.053 110,000.00 «4.119 437,000.00 «4.197 968,500.00 «4.273 1,551,500.00 «4.379 1,332,500.00 4.450 93,000.00
H.414 1,126,000.00 84.420 1,361.000.00
Digitized for FRASER http://fraser.stlouisfed.org/ Federal Reserve Bank of St. Louis

220 1977 REPORT OF THE SECRETARY OF THE TREASURY
TABLE 35.-
Date
-Issues, maturities, and redemptions of interest-bearing public debt securities, excluding Government account series,
October 1976-September 7977—Continued
Securities Rate of interest'
Amount issued *
Amount matured or called or
redeemed prior to maturity'
1977 Jan. 31
31 31 31 31
31 31 31
U.S. savings bonds "—Continued Series H-1959 (January to May) Series H-1959 (June to December) Series H-1960 Series H-1961 Series H-1962 Series H-1963 Series H-1964 Series H-1965 (January to November).. Series H-1965 (December) Series H-1966 Series H-1967 Series H-1968 (January to May) Series H-1968 (June to December) Series H-1969 (January to May) Series H-1969 (June to December) Series H-1970 (January to May) Series H-1970 (June to December) Series H-1971 Series H-1972 Series H-1973 (January to November).. Series H-1973 (December) Series H-1974 Series H-1975 Series H-1976 Unclassified sales and redemptions
Treasury notes. Series K-1979 Adjustments of issues"
Treasury notes, Series .B-1983 Adjustments of issues"
Treasury notes. Series F-1980 Adjustments of issues*
Treasury notes, Series U-1978 Adjustments of issues"
U.S. savings notes:" Series S-1967 Series S-l968 (January to May) Series S-1968 (June to December) Series S-1969 Series S-1970 Unclassified'"
U.S. individual retirement bonds U.S. retirement plan bonds Depositary bonds. First Series Treasury bonds. Investment Series
B-1975-80 Redeemed in exchange for \'A% Treasury notes, Series EO-1981
Treasury notes. Series EO-1981.. Treasury bonds, REA Series Miscellaneous
Percent
Total January .
Feb. 1 State and local govemment series: Treasury certificates of indebtedness. Treasury notes
2 Treasury certificates of indebtedness. 2 Treasury certificates of indebtedness,
dollar denominated, maturing Apr. 29, 1977
See footnotes at end of table.
4.510 "4.586 "4.627 "4.711 "4.801 "4.901 "5.002 "5.106 5.290 5.327 5.272 5.240 5.346 5.450 5.679 5.730 5.794 5.834 5.889 5.949 6.000 6.000 6.000 6.000
6'/4
7.00
" 5 %
$53,290,000.00 14,328,000.00
-20,000.00
20,000.00
$549,000.00 989.500.00
1.958.000.00 2.179,000.00 1,808,500.00 1,789.500.00 1,625,500.00 1,265,500.00
292.000.00 2,701,000.00 1,256,500.00
343,000.00 679,500.00 , 255,000.00 768,000.00 336,500.00 620,500.00
1,586,000.00 ; 1,030,000.00 1,299.000.00
288.000.00 2,541,000.00 1,914,000.00 1,435,500.00 1,281,500.00
5%
5.54 5.56 5.66 5.68 5.71
6.00 5.19 2.00 .
2'/4 .
IVa 200
15,000.00 .
106.890.000.00
139,476.91 228,069.56 318,860.90 848.223.10 402.345.83
101.25 . 1.641.883.19 3.195.454.61
30,000.00 .
^
162,706.22 157,970.62 333,879.11 834,472.42 270,353.94
105,117.77>i 1,013,161.56
35.000.00
30 000 00
55,000.00 98.191.000.00
31.694.254,445.97 28,239,724,725.03
889,600.00 28,514,600.00
5.25
2,255,000.00 1,130,000.00^ 1,875,000.00
11,248,593.93
Digitized for FRASER http://fraser.stlouisfed.org/ Federal Reserve Bank of St. Louis

STATISTICAL APPENDIX 221 TABLE 35.—Issues, maturities, and redemptions of interest-bearing public debt
securities, excluding Government account series, October 1976-September 7977—Continued
Date Securities Rate of interest '
Amount issued ^
Amount matured or called or
redeemed prior to matur i ty '
7977 Percent Feb. 2 Treasury notes, foreign currency
denominated, maturing Mar. 8, 1977 7.75
Treasury bills: Regular weekly:
3 Dated Aug. 5, 1976 ^5.221 3 Maturing May 5, 1977 4.720 3 Maturing Aug. 4, 1977 5.009 3 Treasury notes, Series L-1979 SVa
Issued for cash 3 Treasury bills, dollar denominated, maturing
Feb. 3, 1977 May 5, 1977
3 State and local govemment series: Treasury certificates of indebtedness Treasury notes Treasury bonds
4 Treasury certificates of indebtedness 7 Treasury certificates of indebtedness
Treasury notes Treasury bills:
Regular weekly: 7 Maturing Apr. 21, 1977 4.668
Adjustments of issues 7 Maturing July 21, 1977 4.868
Adjustments of issues Fifty-two weeks:
8 Dated Feb. 10, 1976 5.572 8 Maturing Feb. 7, 1978 5.344 8 State and local govemment series:
Treasury notes 9 Treasury certificates of indebtedness,
dollar denominated, maturing Apr. 29. 1977 5.25
9 Treasury notes, foreign currency dwiominated, maturing Mar. 8. 1977 7.75
Treasury bills: Regular weekly:
9 Maturing June 9. 1977 4.516 Adjustments of issues
9 State and local govemment series: Treasury certificates of indebtedness Treasury notes
10 Treasury certificates of indebtedness Treasury notes Treasury bonds
Treasury bills: Regular weekly:
10 Dated Aug. 12, 1976 *5.207 10 Maturing May 12. 1977 4.624 10 Matu r ingAug . 11. 1977 4.840 14 State and local govemment series:
Treasury certificates of indebtedness 15 Treasury notes. Series G-1980 6'/2
Issued in exchange for 8% Treasury notes, Series A-1977
Issued for cash
See footnotes at end of table.
$2,602,570.0(K).00 3.704.220,000.00
2 854 555 000 00
40,000,000 00
1,274,100.00 110,146,500.00
18,500.00
—15,000.00
—12,985,000.00
-3,995,000.00
3,105,470,000.00
146,735,600.00
—200.000 00
4 225.000 00 36,525,000.00 5.662,400.00
56.338,200.00 645,000.00
2,703,165,000.00 3.699,270,000.00
1,300,000,000.00 3,308.050,000.00
$6,511,958.32
6.303.235.000.00
40.000,000 00
55,000.00 185.000.00
2,930,390,000.00
11,248,593 93
6^511,958.32
605,000.00
6,406,580,000.00
140,000.00
Digitized for FRASER http://fraser.stlouisfed.org/ Federal Reserve Bank of St. Louis

222 1977 REPORT OF THE SECRETARY OF THE TREASURY
TABLE 35.—Issues, maturities, and redemptions of interest-bearing public debt securities, excluding Government account series,
October 1976-September 1977—Continued
Date Securities Rate of interest»
Percent VA
VA
8.00
4 905
5.25
7.75
•5 185 4 663 4.862
4 555
5.25
7.75
Amount issued»
$880,990,000.00 2.024.125.000.00
390.600.000.00 753,011,000.00
500,000.00
1,687,100.00 26,471,000.00 13,523,900.00
-20,000.00 20,000.00
960,900.00 18,482,000.00 8,871,700.00
2,504.140,000.00 3,604,580.000.00
-^7.600.00 1.974.800.00
330,000 00
-1.700.000.00
62.400.00 1.275.800.00
305,000.00
30,360,000.00
Amount matured or called or
redeemed prior to maturity'
"•< $1,300,000,000.00 880,990,000.00
390,600,000.00 2 591.280.00000
5,000.00
11,248,593.93
6,511,958.32
;;;;;;;;;;;;;:; i 6,104,205,000.00
55,000.00
i
11,248,593.93^
6,511,958.32
7977 Feb. 15 Treasury notes, Series A-1984
Issued in exchange for 8% Treasury notes. Series A-1977
Issued for cash 15 Treasury bonds of 2002-2007
Issued in exchange for 8% Treasury notes. Series A-1977
Issued for cash 15 Treasury notes. Series A-1977
Redeemed in exchange for: 6'A% Treasury notes, Series G-1980. VA% Treasury notes, Series A-1984. 7%% Treasury bonds of 2002-2007 ..
Redeemable for cash Treasury bills: Regular weekly:
15 Maturing July 28, 1977 Adjustments of issues
15 State and local govemment series: Treasury certificates of indebtedness... Treasury notes Treasury bonds
16 Treasury certificates of indebtedness, dollar denominated, maturing Apr. 29, 1977
16 Treasury notes, foreign currency denominated, maturing Mar. 8, 1977
16 State and local govemment series: Treasury certificates of indebtedness... Treasury notes
17 Treasury certificates of indebtedness... Treasury notes Treasury bonds
Treasury bills: Regular weekly:
17 Dated Aug. 19. 1976 17 Matuflng May 19, 1977 17 Maturing Aug. 18, 1977 18 State and local govemment series:
Treasury certificates of indebtedness... Treasury notes Treasury bonds
Treasury bills: Regular weekly:
18 Maturing July 7, 1977 Adjustments of issues
23 State and local govemment series: Treasury certificates of indebtedness... Treasury notes Treasury bonds
23 Treasury certificates of indebtedness, dollar denominated, maturing Apr. 29, 1977
23 Treasury bills, dollar denominated, maturing May 26, 1977
23 Treasury notes, foreign currency denominated, maturing Mar. 8, 1977
See footnotes at end of table.
J Digitized for FRASER http://fraser.stlouisfed.org/ Federal Reserve Bank of St. Louis
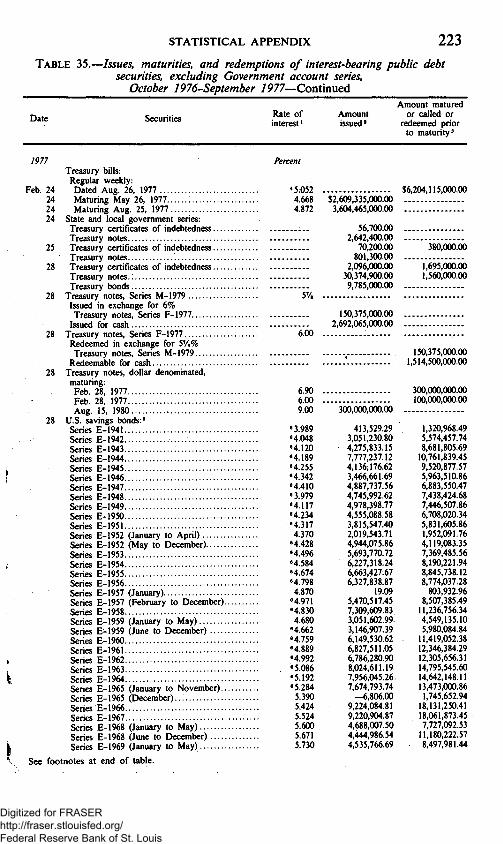
STATISTICAL APPENDIX 223 TABLE 35.-
Date
-Issues, maturities, and redemptions of interest-bearing public debt securities, excluding Government account series,
October 1976-September 7977—Continued
Securities Rate of interest'
Amount issued"
Amount matured or called or
redeemed prior to maturity'
1977 Treasury bills: Regular weekly:
Feb. 24 Dated Aug. 26, 1977 24 Maturing May 26, 1977 24 Maturing Aug. 25, 1977 24 State and local govemment series:
Treasury certificates of indebtedness Treasury notes
25 Treasury certificates of indebtedness Treasury notes
28 Treasury certificates of indebtedness Treasury notes.; Treasury bonds
28 Treasury notes. Series M-1979 Issued in exchange for 6% Treasury notes, Series F-1977
Issued for cash 28 Treasury notes. Series F-1977
Redeemed in exchange for 5%% Treasury notes, Series M-1979
Redeemable for cash 28 Treasury notes, dollar denominated,
maturing: Feb. 28, 1977 Feb. 28, 1977 Aug. 15. 1980
28 U.S. savings bonds:' Series E-1941 Series E-1942 Series E-1943 Series E-1944 Series E-1945 Series E-1946. Series E-1947 Series E-1948 Series E-1949 Series E-1950 Series E-1951 Series E-1952 (January to April) Series E-1952 (May to December) Series E-1953 Series E-1954 Series E-1955 Series E-1956... Series E-1957 (January).... Series E-1957 (February to December).. Series E-1958 Series E-1959 (January to May) Series E-1959 (June to December) Series E-1960 Series E-1961 Series E-1962 Series E-1963 Series E-1964 Series E-1965 (January to November).., Series E-1965 (December)... Series E-1966 Series E-1967 Series E-1968 (January to May) Series E-1968 (June to December) Series E-1969 (January to May)
See footnotes at end of table.
Percent
•5:052 4 668 4 872
SVg
600
6.90 600 9.00
"3.989 "4.048 "4.120 "4.189 "4.255 "4.342 "4.410 "3.979 "4.117 "4.234 "4.317 4.370
"4.428 "4.496 "4.584 "4.674 "4.798 4.870
"4.971 "4.830 4.680
"4.662 "4.759 "4.889 "4.992 "5.086 "5.192 "5.284 5.390 5.424 5.524 5.600 5.671 5.730
$2.6091335 00000 3.604.465.000.00
56 70000 2 642 400 00
70,200.00 801.300.00
2,096,000.00 30,374,900.00 9,785,000.00
150,375,000.00 2,692,065,000.00
0
300,000,000.00
413,529.29 3,051,230.80 4,275.833.15 7,777,237.12 4,136,176.62 3,466,661.69 4,887,737.56 4,745,992.62 4,978,398.77 4,555,088.58 3,815,547.40 2,019,543.71 4,944,075.86 5,693,770.72 6,227,318.24 6,663,427:67 6,327,838.87
19.09 5,470,517.45 7,309,609.83 3,051,602.99 3,146,907.39 6,149,530.62 6,827,511.05 6,786,280.90 8,024,611.19 7,956,045.26. 7,674,793.74 -6,806.00
9,224,084.81 9,220,904.87 4,688,007.50 4,444,986.54 4,535.766.69
$6,204,115,000.00
380,000.00
1,695,000.00 1,560,000.00
150,375,000.00 1,514,500,000.00
300,000,000.00 100,000,000 00
1,320,968.49 5,574,457.74 8,681,805.69 10,761,839.45 9,520,877.57 5,963,510.86 6,883,550.47 7,438,424.68 7,446,507.86 6,708,020.34 5,831,605.86 1,952,091.76 4,119,083.35 7,369,485.56 8,190,221.94 8,845,738.12 8,774,037.28 803,932.96
8,507,385.49 11,236,756.34 4,549,135.10 5,980,084.84 11,419,052.38 12,346,384.29 12,305,656.31 14,795,545.60 14,642,148.11 13,473,000.86 1,745,652.94
18,131,250.41 18,061,873.45 7,727,092.53 11,180,222.57 8,497,981.44
Digitized for FRASER http://fraser.stlouisfed.org/ Federal Reserve Bank of St. Louis

224 1977 REPORT OF THE SECRETARY OF THE TREASURY
TABLE 35.—Issues, maturities, and redemptions of interest-bearing public debt securities, excluding Government account series,
October 1976-September 7977—Continued
Date Securities Rate of interest'
Amount issued'
Amount matured or called or
redeemed prior to maturity'
7977 Feb. 28 U.S. savings bonds'-Continued
Percent
Series E Series E-Series E-Series E-Series E-Series E-Series E-Series E-Series E-Series E-Series E-Unclassified sales and redemptions. Series H Series H-Series H-Series H-Series H-Series H-Series H-Series H-Series H-Series H-Series H Series H Series H Series H Series H Series H-Series H Series H Series H Series H Series H-Series H Series H Series H Series H Series H Series H Series H-Series H-Series H-Series H Series H Series H
969 (June to December) . . . . 970 (January to May) 970 (June to December) . . . . 971 972 973 (January to November). 973 (December) 974 .-975 976 977
952. 953 . 954. 955 . 956 957 (January) 957 (February to December). 958 959 (January to May) 959 (June to December) 960 961 962 963 964
1965 (January to November).. 1965 (December) 1966 1967 1968 (January to May) 1968 (June to December) 1969 (January to May) 1969 (June to December) 1970 (January to May) 1970 (June to December) 1971 1972 1973 (January to November).. 1973 (December) 1974 1975 1976 , 1977
Unclassified sales and redemptions Treasury notes. Series EO-1981 Adjustments of issues"
U.S. savings notes:" Series S-1967 Series S-1968 (January to May) Series S-1968 (June to December) Series S-1969 Series S-1970.... Unclassified'"
U.S. individual retirement bonds U.S. retirement plan bonds Treasury certificates of indebtedness, REA Series
Miscellaneous
Total February
See footnotes at end of table.
5.835 $4,834,345.42 $13,709,588.36 5.860 5.860,889.02 8.875,574.21 5.892 6,086,662.73 15,448,291.37 5.903 21,524.341.45 28,826.550.73 5.856 16.909,470.70 28,383,730.25 5.930 16,108,874.82 29.639.534.31 6.000 -14.191.66 3.206,603.56 6.000 16,781,786.47 42,227,155.94 6.000 17,218,859.82 69,317,804.53 6.000 301,088,602.70 284,110,408.93 6.000 12,506,702.70 768.75
356,313,877.68 ' -256,134,481.88 "4.053 104,500.00 "4.119 336,000.00 "4.197 724,000.00 "4.273 1,307,500.00 "4.379 1,264,500.00 4.450 104,000.00
"4.414 677,000.00 "4.420 1,246,500.00 4.510 681,000.00
"4.586 563,000.00 "4.627 2,255,000.00 "4.711 2,295,500.00 "4.801 1,882,500.00 "4.901 1.813,500.00 "5.002 ^ 1,545,000.00 "5.106 1,615,500.00
5.290 121,000.00 5.327 2,297,000.00 5.272 2,159,000.00 ^ 5.240 430,000.00 5.346 11,000.00 524,500.00 5.450 311,000.00 5.679 412,500.00 5.730 372,000.00 5.794 486,500.00 5.834 1,434,000.00 5.889 1,706,500.00 5.949 1,756,500.00 6.000 142,500.00 ^ 6.000 2,213,000.00 6.000 1,890,500.00 6.000 33,200,000.00 1,235,000.00 6.000 19,961,500.00 1,000.00
' —1,350,500.00 ' —2,116,000.00 1%
5.54 5.56 5.66 5.68 5.71
6.00 5.21
5.00
17,000.00
164,476.03 230,213.60 338,185.09 814,180.20 342,693.45
-121.50 193,052.92
1,878,017.41
7,172,000.00
472,359.77 437,509.44 M 909,628.92 J
2,003,174.49 i 642,232.70 '
98,185.80 3,628,698.72
84,272,000.00
44,364,324,701.64 35,981,904,410.54-
Digitized for FRASER http://fraser.stlouisfed.org/ Federal Reserve Bank of St. Louis

STATISTICAL APPENDIX 225 TABLE 35.—Issues, maturities, and redemptions of interest-bearing public debt
securities, excluding Government account series, October 1976-September 7977—Continued
Date Securities Rate of interest'
Amount issued *
Amount matured or called or
redeemed prior to maturity'
1977 Percent Mar. 1 State and local govemment series:
Treasury certificates of indebtedness Treasury notes Treasury bonds
2 Treasury certificates of indebtedness Treasury notes Treasury bonds
2 Treasury certificates of indebtedness, dollar denominated, maturing Apr. 29, 1977 5.25
2 Treasury notes, foreign currency denominated, maturing Mar. 8, 1977 7.75
Treasury bills: Regular weekly:
3 Dated Sept. 2, 1976 ^5.029 3 Maturing June 2, 1977 4.708 3 MaturingSept. 1. 1977 4.943 3 State and local govemment series:
Treasury certificates of indebtedness Treasury notes
7 Treasury certificates of indebtedness 8 Treasury certificates of indebtedness
Treasury notes Treasury bills:
Fifty-two weeks: 8 Dated Mar. 9. 1976 6.010 8 Maturing Mar. 7, 1978 5.226 8 Treasury notes. Series H-1981 dVa
Issued for cash 8 Treasury notes, foreign currency
denominated, maturing: Mar. 8. 1977 7.75 Sept. 8. 1978 5.90
Treasury bills: Regular weekly:
8 Maturing May 19. 1977 4.663 Adjustments of issues
8 Maturing Aug. 4. 1977 % 5.009 Adjustments of issues
8 MaturingAug. 18. 1977 4.862 Adjustments of issues
8 Federal Financing Bank bills: Dated July 30, 1974 8.049
9 Treasury notes, foreign currency denominated, maturing Apr. 6, 1977 7.70
9 Treasury certificates of indebtedness, dollar denominated, maturing Apr. 29, 1977 5.25
9 State and local govemment series: Treasury certificates of indebtedness Treasury notes '.
10 Treasury certificates of indebtedness Treasury nptes
Treasury bills: Regular weekly:
10 Dated Sept. 9, 1976 *4.932 10 Maturing June 9, 1977 4.653 10 Maturing Sept. 8, 1977 4.965
See footnotes at end of table.
$2,909,600.00 55,679,100.00 26,992,600.00
127,200.00 3,706,000.00 5,220,900.00
$8,280,000.00 1,170,000.00 5,055,000.00
60,000.00
11,248,593.93
6,511,958.32
6,109,605,000.00
2,503,000,000.00 3,601,190.000.00
809,200.00 14,912,400.00
190.000.00 953.700.00
64.566.100.00
3.104.915,000.00 3.208.270,000.00
'2,8b9l48i,(XX).'(K)
49,733,601.73 49,733.601.73
""*1.170.(XX)V(X)
26.(XX).ob
-i.no.ooo'. 'ob
20.000.00
6.511.958.32
11,248,593.93
1,748,200.00 33,058,100.00 14,575,900.00 570,000.00
300,756,000.00
5,711,145,000.00 2,301,700,000.00 3,403,240,000.00
Digitized for FRASER http://fraser.stlouisfed.org/ Federal Reserve Bank of St. Louis

226 1977 REPORT OF THE SECRETARY OF THE TREASURY
TABLE 35.—Issues, maturities, and redemptions of interest-bearing public debt securities, excluding Government account series,
October 1976-September 7977—Continued
Date Securities Ratesof interest'
Amount issued'
Amount matured or called or
redeemed prior to maturity'
7977 Mar. 10 Treasury bills, dollar denominated,
maturing Mar. 10, 1977 10 Treasury notes, dollar denominated,
maturing Mar. 31, 1980 15 Treasury notes, dollar denominated,
maturing: Mar. 15, 1977 Mar. 31, 1980
15 State and local govemment series: Treasury certificates of indebtedness Treasury notes Treasury bonds
16 Treasury certificates of indebtedness Treasury notes
16 Treasury notes, foreign currency denominated, maturing Apr. 6, 1977
16 Treasury certificates of indebtedness, dollar denominated, maturing Apr. 29, 1977
Treasury bills: Regular weekly:
17 Dated Sept. 16, 1976 17 Maturing June 16, 1977 17 Maturing Sept. 15, 1977 17 Treasury bills, dollar denominated,
maturing May 26, 1977 17 State and local govemment series:
Treasury certificates of indebtedness Treasury notes
21 Treasury certificates of indebtedness 22 Treasury notes, dollar denominated, maturing
Mar. 22. 1977 Feb. 15. 1984
22 State and local govemment series: Treasury certificates of indebtedness.'. Treasury notes Treasury bonds
23 Treasury certificates of indebtedness Treasury notes
23 Treasury notes, foreign currency denominated, maturing Apr. 6. 1977
23 Treasury certificates of indebtedness, dollar denominated, maturing Apr. 29, 1977
Treasury bills: Regular weekly:
24 Dated Sept. 23, 1976 24 Maturing June 23, 1977 24 Maturing Sept. 22, 1977 24 State and local govemment series:
Treasury certificates of indebtedness Treasury notes Treasury bonds
25 Treasury certificates of indebtedness Treasury notes
25 Treasury notes, dollar denominated, maturing Mar. 27, 1977 Nov. 15, 1977
See footnotes at end of table.
Percent
$240,000,000.00
7.50
2.50 7 50
7.70
5.25
•4 926 4 546 4 813
5.90 7.10
7.70
5.25
•4.844 4 554 4 826
6.90 7.00
$200,000,000.00
100,000,000.00
1.598,400.00 29,378,200.00 4,583,000.00 289,900.00
7,684,600.00
2,110,145,000.00 3,102,640,000.00
3,223,400.00 23,678.800.00
"""m666,o(X)Vob
1,230,100.00 40,951,100.00 3,818,200.00 4,572,800.00
186,230,400.00
2,106,330,000.00 3,103,890,000.00
45,000.00 2,230,000.00 435,000.00
260,000,000.00
156,857,824.07
205,000.00 -
6,511,958.32
11,248,593.93
5,206,685,000.00
5,000,000.00
85,000.00
500,000,000.00
6,511,958.32 <
11,248,593.93
5,214,975,000.00
^
70,000.00 45,000.00
260,000,000.00
Digitized for FRASER http://fraser.stlouisfed.org/ Federal Reserve Bank of St. Louis
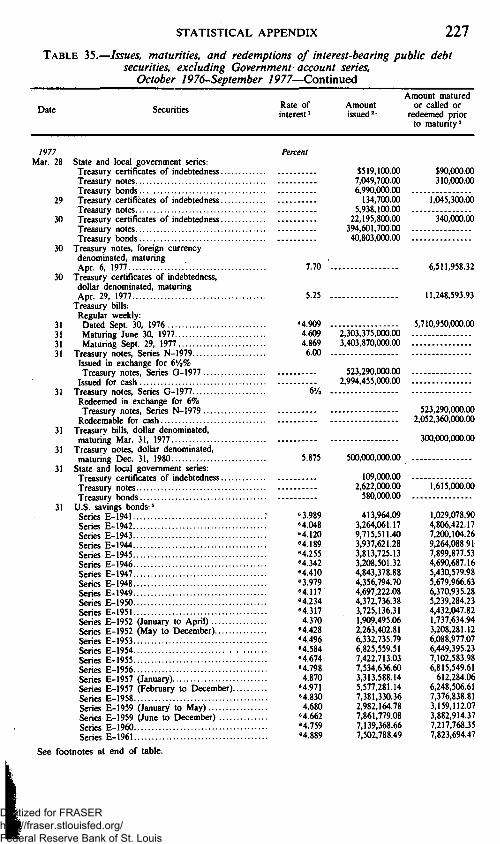
STATISTICAL APPENDIX 227 TABLE 35.—Issues, maturities, and redemptions of interest-bearing public debt
securities, excluding Government account series, October 1976-September 7977—Continued
Date Securities Rate of interest'
Amount issued'
Amount matured or called or
redeemed prior to maturity'
7977 Mar. 28 State and local govemment series:
Treasury certificates of indebtedness Treasury notes Treasury bonds
29 Treasury certificates of indebtedness Treasury notes
30 Treasury certificates of indebtedness Treasury notes Treasury bonds
30 Treasury notes, foreign currency denominated, maturing Apr. 6, 1977
30 Treasury certificates of indebtedness, dollar denominated, maturing Apr. 29, 1977
Treasury bills: Regular weekly:
31 Dated Sept. 30, 1976 31 Maturing June 30, 1977 31 Maturing Sept. 29, 1977 31 Treasury notes, Series N-1979
Issued in exchange for 6'A% Treasury notes. Series G-1977
Issued for cash 31 Treasury notes. Series G-1977
Redeemed in exchange for 6% Treasury notes. Series N-1979
Redeemable for cash 31 Treasury bills, dollar denominated,
maturing Mar. 31, 1977 31 Treasury notes, dollar denominated,
maturing Dec. 31, 1980 31 State and local govemment series:
Treasury certificates of indebtedness Treasury notes Treasury bonds
31 U.S. savings bonds:' Series E-1941 Series E-1942 Series E-1943 Series E-1944 Series E-1945 Series E-1946 Series E-1947 Series E-1948 Series E-1949 Series E-1950 Series E-1951 Series E-1952 (January to April) Series E-1952 (May to December) Series E-1953 Series E-1954 Series E-1955 Series E-1956 Series E-1957 (January) Series E-1957 (Febmary to December).. Series E-1958 Series E-1959 (January to May) Series E-1959 (June to December) Series E-1960 Series E-1961
See footnotes at end of table.
Percent
7.70 '.
5.25 .
•4.909 . 4.609 4 869 600 .
6'A •
5.875
"3.989 "4.048 "4.120 "4.189 "4.255 "4.342 "4.410 "3.979 "4.117 "4.234 "4.317 4.370
"4.428 "4.496 "4.584 "4.674 "4.798 4.870
"4.971 "4.830 4.680
"4.662 "4.759 "4.889
$519,100.00 7,049,700.00 6,990,000.00
134,700.00 5,938,100.00
22,195,800.00 394,601,700.00 40,803,000.00
2",3b3,375,(XX).bb 3,403,870,000.00
523,290,000.00 2,994,455,000.00
500,000,000.00
109,000.00 2,622,000.00
580,000.00
413,964.09 3,264,061.17 9,715,511.40 3,937,621.28 3,813,725.13 3,208,501.32 4,843,378.88 4,356,794.70 4,697,222.08 4,372,736.38 3,725,136.31 1,909,495.06 2,263,402.81 6,332,735.79 6,825,559.51 7,422.713.03 7.534.636.60 3.313.588.14 5,577,281.14 7,381,330.36 2,982,164.78 7,861,779.08 7,139,368.66 7,502,788.49
$90,000.00 310,000.00
1,045,300.00
340,000.00
6,511,958.32
11,248,593.93
5,710,950,000.00
523,290,000.00 2,052,360,000.00
300,000,000.00
1,615,000.00
1,029,078.90 4,806,422.17 7,200,104.26 9,264,088.91 7,899,877.53 4,690,687.16 5,430,579.98 5,679,966.63 6,370,935.28 5,239,284.23 4,432,047.82 1,737,634.94 3,208,281.12 6,088,977.07 6,449,395.23 7.102.583.98 6.815,549.61
612,284.06 6,248,506.61 7,376,838.81 3,159,112.07 3,882,914.37 7,217,768.35 7,823,694.47
Digitized for FRASER http://fraser.stlouisfed.org/ Federal Reserve Bank of St. Louis

228 1977 REPORT OF THE SECRETARY OF THE TREASURY
TABLE 35.—Issues, maturities, and redemptions of interest-bearing public debt securities, excluding Government account series,
October 1976-September 7977—Continued
Date Securities Rate of interest'
Amount issued ^
Amount matured or called or
redeemed prior to maturity'
7977 Mar. 31 U.S. savings bonds'—Continued
Series E-1962 Series E-1963 Series E-1964 Series E-1965 (January to November)... Series E-1965 (December) Series E-1966 Series E-1967 Series E-1968 (January to May) Series E-1968 (June to December) Series E-1969 (January to May) Series E-1969 (June to December) Series E-1970 (January to May) Series E-1970 (June to December) Series E-1971 Series E-1972 Series E-1973 (January to November)... Series E-1973 (December) Series E-1974 Series E-1975 Series E-1976 Series E-1977 Unclassified sales and redemptions Series H-1952 Series H-1953 Series H-1954 Series H-1955 Series H-1956 Series H-1957 (January) Series H-1957 (February to December). Series H-1958 Series H-1959 (January to May) Series H-1959 (June to December) Series H-1960 Series H-1961 Series H-1962 Series H-1963 Series H-1964 Series H-1965 (January to November)... Series H-1965 (December) Series H-1966 Series H-1967 Series H-1968 (January to May) Series H-1968 (June to December) Series H-1969 (January to May) Series H-1969 (June to December) Series H-1970 (January to May) Series H-1970 (June to December) Series H-1971 Series H-1972 Series H-1973 (January to November)... Series H-1973 (December). Series H-1974 Series H-1975 Series H-1976 Series H-1977 Unclassified sales and redemptions
31 Treasury notes. Series A-1984 Adjustments of issues"
31 Treasury notes. Series M-1979 Adjustments of issues"
See footnotes at end of table.
Percent
"4.992 "5.086 "5.192 "5.284 5.390 5.424 5.524 5.600 5.671 5.730 5.835 5.860 5.892 5.903 5.856 5.930 6.000 6.000 6.000 6.000 6.000
"4.053 . "4.119 . "4.197 . "4.273 . "4.379 . 4.450 .
"4.414 . "4.420 . 4.510 .
"4.586 . "4.627 . "4.711 . "4.801 . "4.901 "5 002 . "5 106 5 290 5 327 5 272 5 240 5 346 5.450 . 5.679 . 5 730 5 794 5 834 . 5.889 . 5.949 . 6.000 . 6.000 . 6.000 . 6.000 6.000
7% .
SVg
$7,963,806.31 8,440,999.94 8,803,674.39 4,062,621.89
-356.06 9,605,872.99 9,484,955.40 4,847,553.19 4.219,140.61 4,698.255.52 4,378,429.03 5,395,801.84 5,419,547.60 18,555,980.37 17.533,936.13 16.471,052.38
152.45 16,834,357.07 17,412,005.58
481,873,466.16 329,565,317.91
' — 110,065.863.65
1,000.00
4,630.500.00 38,903,500.00 17,239.000.(X) •
15,000.00 .
2.750,000.00
$8,366,246.60 10,268,626.13 10,092,965.67 9,396,829.18 1,073,589.26
12,201,336.99 12,950,827.85 5,683,245.20 7,745,096.87 6,044,602.08 9,225,332.74 7,066,820.11 10,520,772.58 21,669,472.17 19,920,191.28 49,799,812.50 5,419,481.45
27,916,341.94 41,612,157.31 171,604,405.39
27,618.75 32,108,511.26
75,000.00 292,500.00 521,500.00 768,000.00 806,500.00 23.500.00
604,000.00 773,000.00 398,500.00 445,000.00
1,384.000.00 1,477,500.00 1,361,500.00 1.171,000.00 996,000.00 834,000.00 63,000.00
1,049.000.00 1,655,500.00 371,500.00 352,000.00 307,000.00 430,000.00 274,500.00 536,500.00 878,000.00
1,175,500.00 1,270,000.00
68,000.00 1,678,000.00 1,531,000.00 1,203,000.00
38,500.00 13,937,000.00
Digitized for FRASER http://fraser.stlouisfed.org/ Federal Reserve Bank of St. Louis

STATISTICAL APPENDIX 229 TABLE 35.—Issues, maturities, and redemptions of interest-bearing public debt
securities, excluding Government account series, October 1976-September 7977—Continued
Date Securities Rate of interest'
Amount issued'
Amount matured or called or
redeemed prior to maturity'
7977 Mar. 31 Treasury notes. Series U-1978
Adjustments of issues' 31 Treasury bonds of 2002-2007
Adjustments of issues" 31 U.S. savings notes:"
Series S-1967 Series S-1968 (January to May) Series S-1968 (June to December).... Series S-1969 Series S-1970 Unclassified'"
31 U.S. individual retirement bonds 31 U.S. retirement plan bonds 31 Depositary bonds. First Series 31 Treasury certificates of indebtedness,
REA Series 31 Treasury bonds. Investment Series
B-1975-80 Redeemed in exchange for \'A% Treasury notes, Series EO-1981
31 Treasury notes. Series EO-1981 31 Miscellaneous
Total March
Apr. 1 State and local govemment series: Treasury certificates of indebtedness.. Treasury notes Treasury bonds
1 Treasury notes, Series EA-1977 Redeemable for cash
4 Treasury notes. Series E-1982 Issued for cash
Treasury bills: Regular weekly:
4 Maturing June 30, 1977 Adjustments of issues
4 State and local govemment series: Treasury certificates of indebtedness.. Treasury notes
5 Treasury certificates of indebtedness.. Treasury notes Treasury bonds
Treasury bills: Fifty-two weeks:
5 Dated Apr. 6, 1976 5 Maturing Apr. 4, 1978
Short dated: 6 Maturing Apr. 21, 1977 6 Treasury certificates of indebtedness,
dollar denominated, maturing Apr. 27, 1977
6 Treasury notes, foreign currency denominated, maturing: Apr. 6, 1977 Apr. 18, 1977
6 State and local govemment series: Treasury certificates of indebtedness.. Treasury notes Treasury bonds
See footnotes at end of table.
Percent yA
VA -$250,000.00
'-l'52,'(X)0.00
5.54 5.56 5.66 5.68 5.71
6.00 5.22 2.00
5.00
190,612.26 248.232.55 340.915.26 820.539.23 290,899.73
1,051.515.56 3.135.769.41 784.000.00
4,500,000.00 .
$333,008.35 314,787.88 643,150.42
1.483,666.19 482,338.88
96,456.76 -2,263,632.28
42,000.00
2'/4
1% 14,344,000.00 14,344,000.00
85^74,500.00
VA
7.00
41.476.876.288.97 36.003.550,160.12
2,941.400.00 9,917,300.00 17,451,800.00 1,060,000.00 10,624.200.00
' J ' ""^"""^ . " "V.oib^ooo.oo
2,612,803,000.00
65,000.00
147,800.00 3,375,300.00 15,000.00 1,590,100.00 170,000.00
29,004,500.00 1,124,000.00
3,202,725,000.00 3,342,455,000.00
4,505,920,000.00
4.609
5.781 5.158
4.638
5.25
7.70 7.25
11,248,593.93
2,663,982.96 3,847,975.36
144,400.00 6,516,400.00
782,400.00
Digitized for FRASER http://fraser.stlouisfed.org/ Federal Reserve Bank of St. Louis

230 1977 REPORT OF THE SECRETARY OF THE TREASURY
TABLE 35.—Issues, maturities, and redemptions of interest-bearing public debt securities, excluding Government account series,
October 1976-September 1977—Continned
Date Securities Kate of interest'
Amount issued'
Amount matured or called or
redeemed prior to maturity'
380,700.00 6,021,900.00
57,400.00
8.049 25,000.00
855,000.00 729,600.00
21,127,800.00 3,559,100.00 15,000.00
90,517,800.00 378,700.00
5.25
7.25
•4.857 4.562 4.767
2,402,355,000.00 3,503,065,000.00
11,248,593.93
6,511,958.32
5,920,455.000.00
7977 Percent Treasury bills: Regular weekly:
Apr. 7 Dated Oct. 7. 1976 •4.925 $6,012,665,000.00 7 Maturing July 7, 1977 4.585 $2,504,070,000.00 7 Klaturing Oct. 6, 1977 4.846 3,503,035,000.00 7 State and local govemment series:
Treasury certificates of indebtedness Treasury notes Treasury bonds
8 Federal Financing Bank bills: Dated July 30, 1974
11 State and local govemment series: Treasury certificates of indebtednesis —
12 Treasury certificates of indebtedness Treasury notes
13 Treasury certificates of indebtedness Treasury notes •; Treasury bonds
13 Treasury certificates of indebtedness, dollar denominated, maturing Apr. 27, 1977
13 Treasury notes, foreign currency denominated, maturing Apr. 18, 1977
Treasury bills: Regular weekly:
14 Dated Oct. 14, 1976 14 Maturing July 14, 1977 14 Maturing Oct. 13, 1977.... 14 Treasury bills, dollar denominated, maturing
Apr. 14, 1977 Oct. 13, 1977.
14 State and local govemment series: Treasury certificates of indebtedness Treasury notes
15 Treasury certificates of indebtedness Treasurjr notes Treasury bonds
18 Treasury certificates of indebtedness Treasury notes Treasury bonds
18 Treasury notes, foreign currency denominated, maturing: Apr. 18, 1977 '..
. Oct. 18, 1978 19 Treasury notes, dollar denominated,
maturing Apr. 19, 1977.. 19 Treasury bonds, dollar denominated,
maturing Feb. 15, 1982 19 State and local govemment series:
Treasury certificates of indebtedness Treasury notes Treasury bonds ^
20 Treasury certificates of indebtedness Treasury notes Treasury bonds
20 Treasury certificates of indebtedness, dollar denominated, maturing Apr. 27, 1977 5.25 11.248,593.93
See footnotes at end of table.
237,250,000.00 242,040,000.00
5,000.00 55,000.00
948,200.00 893,000.00 10,983,300.00 145,000.00 9,827,100.00 1,024,500.00
21,436,000.00 1,428,200.00
7.25 5.60
6.79
6.375
159,838,977.05 159,838,977.05
302,800,000.00
200,000.000.00
1,014,800.00 13,392,200.00 5,585,000.00
369,500.00 12,809,400.00 31,372,000.00
Digitized for FRASER http://fraser.stlouisfed.org/ Federal Reserve Bank of St. Louis
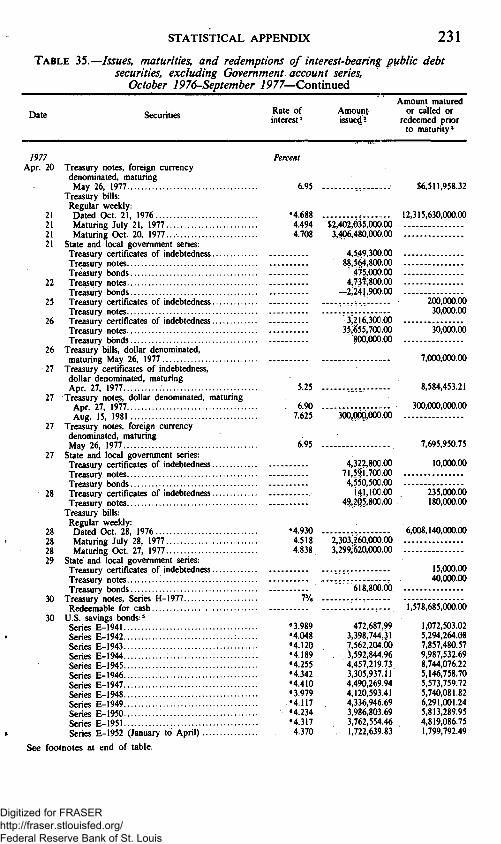
STATISTICAL APPENDIX 231 TABLE 35.—Issues, maturities, and redemptions of interest-bearing public debt
securities, excluding Government account series, October 1976-September 7977—Continued
Date Securities Rate of interest'
Amount issued I
Amount matured or called or
redeemed prior to maturity'
7977 Apr. 20 Treasury notes, foreign currency
denominated, maturing May 26, 1977
Treasury bills: Regular weekly:
21 Dated Oct. 21, 1976 21 Maturing July 21, 1977 21 Maturing Oct. 20, 1977. 21 State and local govemment series:
Treasury certificates of indebtedness Treasury notes Treasury bonds
22 Treasury notes Treasury bonds
25 Treasury certificates of indebtedness Treasury notes
26 Treasury certificates of indebtedness Treasury notes Treasury bbnds ,
26 Treasury bills, dollar denominated, maturing May 26, 1977
27 Treasury certificates of indebtedness, dollar denominated, maturing Apr. 27, 1977
27 Treasury notes, dollar denominated, maturing Apr. 27, 1977 Aug. 15, 1981
27 Treasury notes, foreign currency denominated, maturing May 26, 1977
27 State and local govemment series: Treasury certificates of indebtedness Treasury notes Treasury bonds
28 Treasury certificates of indebtedness Treasury notes
Treasury bills: Regular weekly:
28 Dated Oct. 28, 1976....: 28 Maturing July 28, 1977 28 Maturing Oct. 27, 1977 29 State and local govemment series:
Treasury certificates of indebtedness Treasury notes Treasury bonds
30 Treasury notes, Series H-1977 Redeemable for cash
30 U.S. savings bonds:' Series E-1941 Series E-1942 Series E-1943 Series E-1944 Series E-1945 Series E-1946 Series E-1947 Series E-1948 Series E-1949 Series E-1950 Series E-1951 Series E-1952 (January to April)
See footnotes at end of table.
Percent
6.95
•4.688 4.494 4.708
5.25
. 6.90 7.625
6.95
•4 930 4 518 4 838
VA
"3.989 "4.048 "4.120 "4.189 "4.255 "4.342 "4.410 "3.979 "4.117 "4.234 "4.317 4.370
$2,402,635,000100 3,406,480,0001.00
4,549,300'.00 88,564,800.00
475,000.00 4,737,800.00
-2;241,900'.00
3;216,3O0.OO 35.^55,700.00
800,000.00
4,322,800.00 71,59;i,700.00 4,5.50,500.00
141,100.00 49,2()5,800.00
2,363:260,000.00 3,2991:620,000.00
"""""eiMOO.bb
472,687.99 3.398.744.31 7.562.204.00
. 3.592,844.96 4.457.219.73 3.305,937.11 4,490,269.94 4,120,593.41 4,336,946.69 3,986,803.69 3,762,554.46
. 1,722,639.83
$6,511,958.32
12,315,630,000.00
200,000.00 30,000.00
30,000.00
7,000.000 00
8.584.453.21
300.000.000.00
7.695.950.75
10,000.00
235,000.00 180,000.00
6,008,140,000.00
15,000.00 40,000.00
1.578.685.000.00
1.072,503.02 5,294.264.08 7.857.480.57 9.987,532.69 8.744,076.22 5,146,758.70 5,573,759.72 5,740,081.82 6,291,001.24 5,813,289.95 4,819,086.75 1,799,792.49
Digitized for FRASER http://fraser.stlouisfed.org/ Federal Reserve Bank of St. Louis

232 1977 REPORT OF THE SECRETARY OF THE TREASURY
TABLE 35.—Issues, maturities, and redemptions of interest-bearing public debt securities, excluding Government account series,
October 1976-September 1977—Continned
Date Securities Rate of interest'
Amount issued'
Amount matured or called or
redeemed prior to maturity'
7977 Apr. 30 U.S. savings bonds»—Continued
Series E-1952 (May to December) Series E-1953 Series E-1954 Series E-1955 Series E-1956 Series E-1957 (January) Series E-1957 (February to December).. Series E-1958 Series E-1959 (January to May) Series E-1959 (June to December) Series E-1960 Series E-1961 Series E-1962 Series E-1963 Series E-1964 Series E-1965 (January to November)... Series E-1965 (December) Series E-1966 Series E-1967 Series E-1968 (January to May) Series E-1968 (June to December) Series E-1969 (January to May) Series E-1969 (June to December) Series E-1970 (January to May) Series E-1970 (June to December) Series E-1971 Series E-1972 Series E-1973 (January to November)... Series E-1973 (December) Series E-1974 Series E-1975 Series E-1976 Series E-1977 Unclassified sales and redemptions Series H-1952 Series H-1953 Series H-1954 Series H-1955 Series H-1956 Series H-1957 (January) Series H-1957 (February to December) . Series H-1958 • Series H-1959 (January to May) Series H-1959 (June to December) Series H-1960 Series H-1%1 .'.... Series H-1962 Series H-1963 Series H-1964 Series H-1965 (January to November)... Series H-1965 (December) Series H-1966... Series H-1967 Series H-1968 (January to May) Series H-1968 (June to December) Series H-1969 (January to May) Series H-1969 (June to December) Series H-1970 (January to May) Series H-1970 (June to December) Series H-1971
See footnotes at end of tab'e.
Percent
"4.428 $2,063,969.60 "4.496 4,932,176.62 "4.584 5,528,450.68 "4.674 5,877,672.60 "4.798 6,058,497.27 4.870 -23,177.66
•4.971 5,767,608.63 "4.830 6,820,476.73 4.680 2,758,990.70
•4.662 4,207,085.80 "4.759 8,293,014.59 "4.889 9,081,841.30 "4.992 8,832,485.51 "5.086 11,794,086.91 "5.192 10,687,608.87 "5.284 10,300,590.11 5.390 -700.35 5.424 10,158,424.35 5.524 9,756,403.22 5.600 5,001.722.14 5.671 4,543,523.59 5.730 5,077,104.51 5.835 10,039,422.68 5.860 -52,706.41 5.892 11,866,216.95 5.903 19,640,220.98 5.856 19,195,571.99 5.930 17.027,602.62 6.000 315.74 6.000 18.684,779.91 6.000 19,478,013.14 6.000 73.650.812.44 6.000 871.863.388.39
' —260.152.235.72 "4.053 "4.119 1,000.00 "4.197 "4.273 "4.379 4.450
•4.414 1,000.00 •4.420 4.510 1,000.00
•4.586 •4.627 •4.711 •4.801 "4.901 •5.002 5,000.00 •5.106
5.290 5.327 5.272 5.240 5.346 5.450 5.679 5.730 5.794 5.834
Digitized for FRASER http://fraser.stlouisfed.org/ Federal Reserve Bank of St. Louis

STATISTICAL APPENDIX 233 TABLE 35.-
Date
-Issues, maturities, and redemptions of interest-bearing public debt securities, excluding Government account series,
October 1976-September 7977—Continued
Securities Rate of interest'
Amount issued'
Amount matured or called or
redeemed prior to maturity'
1977 Apr. 30 U.S. savings bonds'—Continued
Series H-1972 Series H-1973 (January to November). Series H-1973 (December) Series H-1974 Series H-1975 Series H-1976 Series H-1977 Unclassified sales and redemptions
30 Treasury notes. Series N-1979 Adjustments of issues"
30 U.S. individual retirement bonds 30 U.S. retirement plan bonds 30 U.S. savings notes:"
Series S-1967 Series S-1968 (January to May) Series S-1968 (June to December) Series S-1969 .<. Series S-1970 Unclassified'" '.
30 Depositary bonds. First Series 30 Treasury bonds. Investment Series
B-1975-80 Redeemed in exchange for \'A% Treasury notes, Series EA-1982
30 Treasury notes. Series EA-1982 30 Miscellaneous
Total April
May 2 Treasury notes. Series P-1979 Issued in exchange for 7'/8% Treasury notes. Series H-1977
Issued for cash 2 Treasury notes, Series H-1977
Redeemed in exchange for yA% Treasury notes. Series P-1979
Redeemable for cash 2 Treasury bills, dollar denominated,
maturing May 26, 1977 2 State and local govemment series:
Treasury certificates of indebtedness.. Treasury notes
3 Treasury certificates of indebtedness.. Treasury notes
Treasury bills: Fifty-two weeks:
3 Dated May 4, 1976 3 Maturing May 2, 1978 4 Treasury certificates of indebtedness,
dollar denominated, maturing July 29, 1977
4 Treasury notes, foreign currency denominated, maturing May 26, 1977
4 State and local govemment series: Treasury certificates of indebtedness.. Treasury notes
See footnotes at end of table.
Percent
5.889 5.949 6.000 6.000 6000 6.000 6.000
600
6.00 5.25
5.54 5.56 5.66 5.68 5.71
200
2'/4
\'A
yA
VA
$1,000,00
2.266,500.00 80.220,000,00
' -30.885.500,00
880,000,00 632.63483
3,996,362,32
200,331,40 229.804,61 356,973,99 846,748,47 245,378,97
40,50
8,000.00
36,302.930,156.69
109,850,000,00 1,881,815,000.00
116,200,00 3,755,900.00 1,386,500,00
19.870,100,00
$2,595,500.00 2,418,500.00
96,500.00 2,155.500.00 2,856,000 00 2,773,500.00
164.500.00 ^ —14,853,000.00
115.574.95 634,732.38
298,491.91 289,514.26 598,095.37
1,362,477.32 449,726.39
7,00000
8,000.00
57,126.500.00
36.809.997.724.53
109,850,000.00 —109,850,000.00
18,360,000.00
4,351,200.00 560,000.00
16,000.00
5.645 3,335,470,000.00
5.163 2,968,135,000,00
5.35 11,248,593.93
6.95 6,511,958.32 665,000.00 26,025,000.00
40,000.00 525,000.00
Digitized for FRASER http://fraser.stlouisfed.org/ Federal Reserve Bank of St. Louis

Date Securities
234 1977 REPORT OF THE SECRETARY OF THE TREASURY
TABLE 35.—Issues, maturities, and redemptions of interest-bearing public debt securities, excluding Government account series,
October 1976-September 7977—Continued Amount matured
Rate of Amount or called or interest' issued' redeemed prior
to maturity'
1977 Percent Treasury bills: Regular weekly:
May 5 Dated Nov. 4, 1976 5 Maturing Aug. 4. 1977 5 Maturing Nov. 3. 1977 5 Treasury bills, dollar denominated, maturing
May 5. 1977 Aug. 4. 1977
5 State and local govemment series: Treasury certificates of indebtedness
9 Treasury certificates of indebtedness Treasury notes Treasury bonds
10 Treasury certificates of indebtedness Treasury notes Treasury bonds
11 Treasury certificates of indebtedness. dollar denominated, maturing July 29, 1977
11 Treasury notes, foreign currency denominated, maturing May 26, 1977
11 State and local govemment series: Treasury certificates of indebtedness Treasury notes
12 Treasury certificates of indebtedness Treasury notes Treasury bonds
Treasury bills: Regular weekly:
12 Dated Nov. 12, 1976.. 12 MaturingAug. 11, 1977 12 Maturing Nov. 10, 1977 12 Treasury bills, dollar denominated, maturing
May 12, 1977 Nov. 10, 1977
13 State and local govemment series: Treasury certificates of indebtedness Treasury notes
16 Treasury certificates of indebtedness Treasury notes
16 Treasury notes, dollar denominated, maturing: May 15, 1977 Jan. 31, 1979
16 Treasury notes. Series A-1984 Issued in exchange for 9% Treasury notes. Series D-1977
Issued for cash 16 Treasury notes. Series D-1977
Redeemed in exchange for: 7'/4% Treasury notes. Series A-1984 7V8% Treasury bonds of 2002-07
Redeemable for cash 16 Treasury bonds of 2002-07
Issued in exchange for: &A% Treasury notes. Series C-1977 9% Treasury notes. Series D-1977
Issued for cash
See footnotes at end of table.
4.807 5.052
5.35
6.95
•4 867 4 823 5.131
6.875 5.875
7'/4
9 00
754
$2,304,070,000.00 3,307,200,000.00
40,000,000.00
912,200.00 11,017,500.00 2,900,100.00 145,500.00
1,464,100.00 1,266,000.00
2,400.00 26,154,700.00
252,800.00 5,360,500.00
19,500.00
2,204,125,000.00 3,302.820.000.00
256.300.000.00
52,000.00 -52,000.00 149.800.00
4.185.500.00
'"""ibbwooo.ob
2.623,332.000.00 2.907,829.000.00
527,100.000.00 372,900,000.00
1.003.431.000.00
40,000,000.00
160,000.00 45,000.00
860,000.00
11,248,593.93
6,511,958.32
6,405,365,000.00
249,500,000.00
210,000.00 235,000.00
100,000,000.00
2,623,332,000.00 372.900.000.00
2.332.577,000.00
Digitized for FRASER http://fraser.stlouisfed.org/ Federal Reserve Bank of St. Louis

STATISTICAL APPENDIX 235 TABLE 35.—Issues, maturities, and redemptions of interest-bearing public debt
securities, excluding Government account series, October 1976-September 7977—Continued
Date Securities Rate of interest'
Amount issued'
Amount matured or called or
redeemed prior to maturity'
7977 May 16 Treasury notes, Series C-1977
Redeemed in exchange for VA% Treasury bonds of 2002-07
Redeemable for cash 17 State and local govemment series:
Treasury certificates of indebtedness. Treasury notes Treasury bonds
18 Treasury certificates of indebtedness, dollar denominated, maturing July 29. 1977
18 Treasury notes, foreign currency denominated, maturing May 26. 1977
18 State and local. govemment series: Treasury certificates of indebtedness. Treasury notes Treasury bonds
19 Treasury certificates of indebtedness. Treasury notes Treasury bonds
Treasury bills: Regular weekly:
19 Dated Nov. 18. 1976 19 MaturingAug. 18, 1977 19 Maturing Nov. 17, 1977 19 Treasury notes, dollar denominated,
maturing May 19, 1977 19 Treasury bonds, dollar denominated,
maturing Feb. 15, 1982 20 State and local govemment series:
Treasury certificates of indebtedness. Treasury notes
23 Treasury certificates of indebtedness. Treasury notes
24 Treasury certificates of indebtedness. Treasury notes
25 Treasury certificates of indebtedness, dollar denominated, maturing July 29, 1977
25 Treasury notes, foreign currency denominated, maturing May 26, 1977
25 State and local govemment series: Treasury certificates of indebtedness. Treasury notes Treasury bonds
26 Treasury certificates of indebtedness. Treasury notes Treasury bonds
Treasury bills: Regular weekly:
26 Dated Nov. 26, 1977 26 Maturing Aug. 25, 1977 26 Maturing Nov. 25, 1977 26 Treasury bills, dollar denominated,
maturing Aug. 25, 1977 26 Treasury notes, foreign currency
denominated, maturing: May 26, 1977 Nov. 27, 1978
See footnotes at end of table.
Percent 678
$5,695,300.00 121,375.800.00
612,700.00
5.35
6.95
•4.857 4.996 5.234
6.79
6.375
5.35
$527,100,000.00 2.037.829.000.00
11.248,593.93
6,511,958.32
6,313,600.00 185,000.00 100,648,300.00 -185,000.00 25,538,700.00
545,900.00 63,119,800.00 1,773,500.00
6,007,605.000.00 2,103,420,000.00 3,202,880,000.00
300,000,000.00
300,000,000.00
350,700.00 325,000.00 13,944,600.00
303,400.00 386,700.00 4,724,800.00 1,327,500.00
42,527,000.00 10,000.00
11,248,593.93
6,511,958.32
•4 676 5 142 5.353
6.95 6.10
4,647,800.00 63,876,600.00 2,367,100.00 3,369,600.00
78,380,900.00 184,300.00
2,099,415,0(X).00 3,201,400,000.00
10,130,000.00
"""^927,776.48
45,000.00
6,210,150,000.00
359,927,776.48
Digitized for FRASER http://fraser.stlouisfed.org/ Federal Reserve Bank of St. Louis

236 1977 REPORT OF THE SECRETARY OF THE TREASURY
TABLE 35.—Issues, maturities, and redemptions of interest-bearing public debt securities, excluding Government account series,
October 1976-September 7977—Continued
Date Securities Rate of interest'
Amount issued'
Amount matured or called or
redeemed prior to maturity'
7977 May 27 Treasury notes, dollar denominated, maturing:
May 27, 1977 Feb. 15, 1983
27 State and local govemment series: Treasury certificates of indebtedness Treasury notes
31 Treasury certificates of indebtedness Treasury notes Treasury bonds
Treasury bills: Fifty-two weeks:
31 Dated June 1, 1976 31 Maturing May 30, 1978 31 Treasury notes. Series Q-1979
Issued in exchange for 6'/4% Treasury notes. Series 1-1977
Issued for cash 31 Treasury notes. Series 1-1977
Redeemed in exchange for 6'/8% Treasury notes, Series Q-1979
Redeemable for cash 31 U.S. savings bonds:'
Series E-1941 Series E-1942 Series E-1943 Series E-1944 Series E-1945 Series E-1946 Series E-1947 Series E-1948 Series E-1949 Series E-1950 Series E-1951 Series E-1952 (January to April) Series E-1952 (May to December) Series E-1953 Series E-1954 Series E-1955 Series E-1956 Series E-1957 (January) Series E-1957 (February to December) Series E-1958 Series E-1959 (January to May) Series E-1959 (June to December) Series E-1960 Series E-1961 Series E-1962 Series E-1963 ." Series E-1964 Series E-1965 (January to November) Series E-1965 (December) Series E-1966 Series E-1967 Series E-1968 (January to May) Series E-1968 (June to December) Series E-1969 (January to May) Series E-1969 (June to December) Series E-1970 (January to May) Series E-1970 (June to December) Series E-1971
See footnotes at end of table.
Percent
7.00 8.00
6 309 5 403
6'/8
6'/4
"3.989 "4.048 "4.120 "4.189 "4.255 "4.342 "4.410 "3.979 "4.117 "4.234 "4.317 4.370
"4.428 "4.496 "4.584 "4.674 "4.798 4.870
•4.971 •4.830 4.680
"4.662 "4.759 "4.889 "4.992 "5.086 "5.192 "5.284 5.390 5.424 5.524 5.600 5.671 5.730 5.835 5.860 5.892 5.903
$300,000,000,00
48,100.00 3,180,400.00 339,800.00
16,650,600.00 8 030 000 00
2,453,495,000 00
189,525,000.00 1,893,750,000.00
828,968.49 3,616,001.76 4,256,514.46 5,708,457.43 10,229,238.77 3,288.110.76 4,169,992.16 4,158,819.91 4,278,681.30 3,907,513.28 3,551,056.41 -2,765.01
2,024,885.76 4,954,929.31 5,380,780.51 5,804.890.90 5,662,309.41 -14,143.32 6,748,108.46 7,858,696.54 -11,284.12 3,531,530.19 6,735,479.48 7,109,181.48 6,669,322.53 8,588,182.00 8,171,250.42 7,880,551.54
-875.15 9,140,826.12 9,142,349.71 4,707,525.79 4,514,174.85 4,627,395.05 5,067,416.83 6,233,237.78 5,866,119.56
28,536,313.55
$300,000,000.00
19,000.00
1,197,600.00 16,525,000.00 ^
2,921,370,000.00
r
189,525,000.00 1,947,560,000.00
807,068.84 3,775,783.01 6,292,319,22 7,625,694.16 6,732,579.79 4,071,317.08 4,515,521.38 4,452,536.49 ^ 4,690,601.50 ' 4,312,229.79 3,474,201.79 i 1,237,562.15 2,427,245.86 4,762,036.56 5,216,995.66 5,344,998.87 5,305,370.00 576,935.61 ^
5,594,687.49 ' 8,071,693.61 3,349,062.92 < 4,476,104.88 8,154,051.04 8,805,197.24 8,911,633.42 11,253,365.01 11,273,992.88 10,042,619.77 , 1,068,139.24 "
13,932,563.04 14,604,549.48 » 6,433,619.24 8,685,167.20 6,976,453.25 9,945,946.65 8,782,040.93 12,031,831.17 26.218,879.04 .
Digitized for FRASER http://fraser.stlouisfed.org/ Federal Reserve Bank of St. Louis

STATISTICAL APPENDIX 237 TABLE 35.—Issues, maturities, and redemptions of interest-bearing public debt
securities, excluding Government account series, October 1976-September 1977—Continued
Date Securities Rate of interest'
Amount issued
Amount matured or called or
redeemed prior to maturity'
7977 May 31 U.S. savings bonds'—Continued
Series E-1972 Series E-1973 (January to November)... Series E-1973 (December) Series E-1974 Series E-1975 Series E-1976 Series E-1977 Unclassified sales and redemptions Series H-1952 Series H-1953 Series H-1954 Series H-1955 Series H-1956 Series H-1957 (January) Series H-1957 (February to December). Series H-1958 Series H-1959 (January to May) Series H-1959 (June to December) Series H-1960 Series H-1961 Series H-1962 Series H-1963 Series H-1964 Series H-1965 (January to November)... Series H-1%5 (December) Series H-1966 Series H-1967 Series H-1968 (January to May) Series H-1968 (June to December) Series H-1969 (January to May) Series H-1969 (June to December) Series H-1970 (January to May) Series H-1970 (June to December) Series H-1971 Series H-1972 Series H-1973 Series H-1973 Series H-1974 Series H-1975 Series H-1976 Series H-1977 Unclassified sales and redemptions
31 Treasury notes, Series E-1982 Adjustments of issues"
31 U.S. savings notes:" Series S-1967 Series S-1968 (January to May) Series S-1968 (June to December) Series S-1969.... Series S-1970 Unclassified'*'
31 U.S. individual retirement bonds 31 U.S. retirement plan bonds 31 Depositary bonds. First Series 31 Treasury certificates of indebtedness.
REA Series 31 Treasury bonds, REA Series
See footnotes at end of table.
Percent
5.856 $16,468,081.89 $24,445,518.29 5.930 16,051,823.21 28.248,288.44 6.000 —113.13 2,759,518.81 6.000 16,502,06:5.65 33,638,098.80 6.000 17,464,765.17 48,759,636.17 6.000 18,901,92<3.51 152,784,490.97 6.000 427,076,101.23 74,328,899.03
257.669.060.60 ' —IdJlXSm.U "4.053 111.500.00 "4.119 272.500.00 "4.197 641,500.00 "4.273 850,000.00 "4.379 994.500.00 4.450 61,000.00
"4.414 884.500.00 "4.420 857,000.00 4.510 567,000.00
"4.586 387,500.00 "4.627 1,421,000.00 "4.711 1,532.500.00 "4.801 1,371,000.00 "4.901 1,483,500.00 "5.002 1,104,000.00 "5.106 1,093,500.00
5.290 59,000.00 5.327 1,395,500.00 5.272 2,025,000.00 5.240 483,500.00 5.346 405,000.00 5.450 479,500.00 5.679 256,000.00 5.730 476,500.00 5.794 428,000.00 5.834 1,019,500.00 5.889 1,443,500.00 5.949 1.319.000.00 6.000 68,500.00 6.000 3,0ai.00 1,489,500.00 6.000 1,755,000.00 6.000 495,5ai.00 1,632,500.00 6.000 35.645.5ai.OO 154,500.00
19.121.5ai.OO 6.446.500.00 7.00
80.000.00
5.54 5.56 5.66 5.68 5.71
6.000 5.252 2.00
500 .. 2.00
233.513.85 253,588.65 393.0341.85 878,704.. 14 201,968.06
-81.00 . l,633,36fi.95 419.422.29
-20.000.00
1,341,000.00 .
348,889.46 340,419.66 701,041.79
1,607,653.80 525,625.00
60.051.59 2,159.354.79 661,000.00
—3.000,000.00
Digitized for FRASER http://fraser.stlouisfed.org/ Federal Reserve Bank of St. Louis

238 1977 REPORT OF THE SECRETARY OF THE TREASURY
TABLE 35.—Issues, maturities, and redemptions of interest-bearing public debt securities, excluding Government account series,
October 1976-September 1977—Continued
Date Securities Rate of interest'
Amount issued'
Amount matured or called or
redeemed prior to maturity'
7977 May 31 Treasury bonds. Investment Series
B-1975-80 Redeemed in exchange for \'A% Treasury notes. Series EA-1982
31 Treasury notes. Series EA-1982 31 Miscellaneous
Total May
June 1 Treasury notes, foreign currency denominated, maturing Aug. 2, 1977........
1 Treasury certificates of indebtedness, dollar denominated, maturing July 29, 1977
1 State and local govemment series: Treasury certificates of indebtedness Treasury notes Treasury bonds
2 Treasury certificates of indebtedness Treasury notes Treasury bonds
Treasury bills: Regular weekly:
2 Dated Dec. 2, 1976 2 Maturing Sept. 1, 1977 2 Maturing Dec. 1, 1977.... 2 Treasury bills, dollar denominated, maturing:
June 2, 1977 Dec. 1, 1977
3 Treasury notes. Series J-1981 Issued for cash
3 Treasury notes, dollar denominated, maturing: June 4. 1977 Mar. 31, 1981
3 State and local govemment series: Treasury certificates of indebtedness Treasury notes... Treasury bonds
Treasury bills: Fifty-two weeks:
6 Maturing May 30, 1978 Adjustments of issues
6 State and local goverament series: Treasury certificates of indebtedness Treasury notes Treasury bonds
7 Treasury certificates of indebtedness Treasury notes Treasury bonds
Treasury bills: Fifty-two weeks:
7 Maturing May 2, 1978 Adjustments of issues
Short dated: 7 Maturing June 16, 1977
See footnotes at end of table.
Percent
2%
I'A %\5,m'6o $15,000.00
"5"o"622'5'66."ob
41.742.124.354.30 43.329.490.026.56
6.08
5.35
6.511.958.32
11,248.593.93
-
•4.612 4.993 5.192
6'/4
6.90 6.875
5.403
5.163
5.222
5.981.300.00 113,151.400.00 16.541.700.00 8.314,500.00
56,006,000.00 942,000.00
2,004,485,000.00 3,101,770,000.00
47.425,000.00
2,513,706,000.00
200,000,000.00
400,000.00 2,254,800.00
140,500.00
820,000.00
84,800.00 796,300.00
1,259,500.00 25,400.00
4,070,600.00 39,900.00
-2,000,000.00
2.002.250.000.00
13,689,700.00 3.145,000.00
295,000.00
6,009,370,000.00
47,425,000.00
200,000,000.00
145,000.00
350,000.00
Digitized for FRASER http://fraser.stlouisfed.org/ Federal Reserve Bank of St. Louis

STATISTICAL APPENDIX 239 TABLE 35.—Issues, maturities, and redemptions of interest-bearing public debt
securities, excluding Government account series, October 1976-September 7977—Continued
Date Securities Rate of interest'
Amount issued'
Amount matured or called or
redeemed prior to maturity'
7977 June 8 Treasury certificates of indebtedness,
dollar denominated, maturing July 29, 1977
8 Treasury notes, foreign currency denominated, maturing Aug. 2, 1977
8 State and local govemment series: Treasury certificates of indebtedness Treasury notes. Treasury bonds
Treasury bills: Regular weekly:
9 Dated Dec. 9, 1976 9 Maturing Sept. 8, 1977 9 Maturing Dec. 8, 1977 9 Treasury bills, dollar denominated, maturing:
June 9, 1977 Sept. 8, 1977
9 State and local govemment series: Treasury certificates of indebtedness Treasury notes Treasury bonds
10 Treasury notes 13 Treasury certificates of indebtedness
Treasury notes 14 Treasury certificates of indebtedness
Treasury notes 15 Treasury certificates of indebtedness,
dollar denominated, maturing July 29, 1977
15 Treasury notes, foreign currency denominated, maturing Aug. 2, 1977.
15 State and local govemment series: Treasury certificates of indebtedness Treasury notes Treasury bonds
16 Treasury certificates of indebtedness Treasury notes Treasury bonds
Treasury bills: Regular weekly:
16 Dated Dec. 16. 1976 16 Maturing Sept. 15, 1977 16 Maturing Dec. 15, 1977 20 Treasury notes, dollar denominated, maturing:
June 20, 1977 Nov. 15. 1983
20 Treasury bills, dollar denominated, maturing Aug. 28, 1977
20 State and local govemment series: Treasury certificates of indebtedness Treasury notes
21 Treasury certificates of indebtedness Treasury notes Treasury bonds
22 Treasury certificates of indebtedness Treasury notes Treasury bonds
See footnotes at end of table.
Percent
5.35
6.08
•4.571 5.047 5 234
5.35
6 08
•4714 5000 5 166
6 83 700
$659,000.00 6,637.400.00 7,324,800.00
""'2' ,6b"6j85,"6bo".bb 3,002,035,000.00
42,700,000.00
2,854,400.00 48,861,500.00
7,781,800.00
3,"96o'."ob 1,166,000.00 1,731,800.00
30,165,300 00
3,928,800.00 94.404,000.00 13,921,400.00 3,681,600.00
29,582,000.00 28,186,700.00
2,009,550,000.00 3,006,640,000.00
300,000,000.00
340,800.00 6,953.200.00
562,400.00 8,304,700.00 6.163,200.00
4,000.00 13,000.00
616,000.00
$11,248,593.93
6,511,958.32
5,706,160,000.00
42,700,000.00
1,683,100.00
5,000.00
3,077,100.00
11,248,593.93
6,511,958.32
132,200.00 3,085,000.00
7,314,670,000.00
300,000,000.00
2,000,000.00
250,000.00 25.000.00 89,000.00
Digitized for FRASER http://fraser.stlouisfed.org/ Federal Reserve Bank of St. Louis
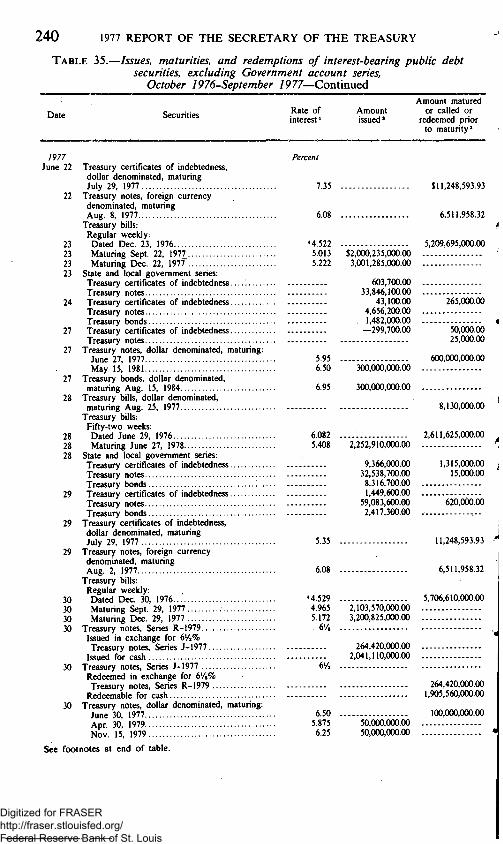
240 1977 REPORT OF THE SECRETARY OF THE TREASURY
TABLE 35.
Date
-Issues, maturities, and redemptions of interest-bearing public debt securities, excluding Government account series,
October 1976-September 7977—Continued
Securities Rate of interest'
Amount issued *
Amount matured or called or
redeemed prior to maturity'
7977 June 22 Treasury certificates of indebtedness,
dollar denominated, maturing July 29, 1977
22 Treasury notes, foreign currency denominated, maturing Aug. 8, 1977
Treasury bills: Regular weekly:
23 Dated Dec. 23, 1976 23 Maturing Sept. 22, 1977 23 Maturing Dec. 22, 1977 23 State and local govemment series:
Treasury certificates of indebtedness Treasury notes
24 Treasury certificates of indebtedness Treasury notes Treasury bonds
27 Treasury certificates of indebtedness Treasury notes
27 Treasury notes, dollar denominated, maturing: June 27, 1977. May 15, 1981
27 Treasury bonds, dollar denominated, maturing Aug. 15, 1984
28 Treasury bills, dollar denominated, maturing Aug. 25, 1977
Treasury bills: Fifty-two weeks:
28 Dated June 29, 1976 28 Maturing June 27, 1978 28 State and local govemment series:
Treasury certificates of indebtedness Treasury notes Treasury bonds
29 Treasury certificates of indebtedness Treasury notes Treasury bonds
29 Treasury certificates of indebtedness, dollar denominated, maturing July 29. 1977
29 Treasury notes, foreign currency denominated, maturing Aug. 2. 1977
Treasury bills: Regular weekly:
30 Dated Dec. 30, 1976 30 Maturing Sept. 29, 1977 30 Maturing Dec. 29, 1977 30 Treasury notes. Series R-1979
Issued in exchange for (i'A% Treasury notes. Series J-1977
Issued for cash 30 Treasury notes. Series J-1977
Redeemed in exchange for (i'A% Treasury notes. Series R-1979
Redeemable for cash 30 Treasury notes, dollar denominated, maturing:
June 30, 1977 Apr. 30. 1979 Nov. 15. 1979
See footnotes at end of table.
Percent
7.35
6.08
•4.522 5.013 5.222
5.95 6.50
6.95
6.082 5.408
5.35
d'A
$2,000,235,000.00 3,001,285,000.00
603,700.00 33,846,100.00
43,100.00 4,656.200.00
. 1,482,000.00 -299,700.00
300,000,000.00
300.000.000.00
$11,248,593.93
6,511,958.32
5,209,695,000.00
265^666.00
50.000.00 25,000.00
600.000,000.00
8.130,000.00
2,611,625,000.00 . 2,252.910.000.00 %
9,366.000.00 1,315.000.00 ; 32,538,700.00 15,000.00 8,316,700.00 1,449,600.00
59!083!600!00 620,600.00 2,417,300.00 -
11.248,593.93
•4.529 4.965 2,103,570,000.00 5.172 3,200,825,000.00
6'/8
264,420,000.00 2,041,110,000.00
6,511.958.32
5,706,610.000.00
6.50 5.875 50,000.000.00 6.25 50,000,000.00
264,420.000.00 1,905,560,000.00
100,000,000.00
Digitized for FRASER http://fraser.stlouisfed.org/ Federal Reserve Bank of St. Louis

STATISTICAL APPENDIX 241 TABLE 35.—Issues, maturities, and redemptions of interest-bearing public debt
securities, excluding Government account series, October 1976-September 7977—Continued
Date Securities Rate of interest'
Amount issued'
Amount matured or called or
redeemed prior to maturity'
7977 June 30 State and local govemment series:
Treasury certificates of indebtedness Treasury notes Treasury bonds
Treasury bills: Regular weekly:
30 Dated Dec. 30, 1976 Adjustments of issues Adjustments of redemptions
30 U.S. savings bonds:' Series E-1941 Series E-1942 Series E-1943 Series E-1944. Series E-1945 Series E-1946 Series E-1947 Series E-1948 Series E-1949 Series E-1950 Series E-1951 Series E-1952 (January to April) Series E-1952 (May to December) Series E-1953 Series E-1954 Series E-1955 Series E-1956 Series E-1957 (January) Series E-1957 (February to December).. Series E-1958 Series E-1959 (January to May) Series E-1959 (June to December) Series E-1960 Series E-1961 Series E-1962 Series E-1963 Series E-1964 Series E-1965 (January to November)... Series E-1965 (December) Series E-1966.! Series E-1967 Series E-1968 (January to May) Series E-1968 (June to December) Series E-1969 (January to May) Series E-1969 (June to December) Series E-1970 (January to May) Series E-1970 (June to December) Series E-1971 Series E-1972 Series E-1973 (January to November).. Series E-1973 (December) Series E-1974 Series E-1975 Series E-1976 Series E-1977 Unclassified sales and redemptions Series H-1952 Series H-1953 Series H-1954 Series H-1955 Series H-1956
See footnotes at end of table.
Percent
5.072
$2,293,9(0.00 $1,778,600.00 45,627,5(0.00 1,980,000.00 47,129,9(0.00
905,0(0.00 905,000.00
"3.989 2,269,2&7.71 •4.048 4,658,492.50 •4.120 4,813,801.61 •4.189 12.965.922.07 •4.255 10.663,100.79 "4.342 4,348.435.32 •4.410 5,321,456.24 •3.979 5,696.147.69 •4.117 5.596,087.57 •4.234 4,668,038.67 •4.317 4,251.042.79 4.370 3,847.77
•4.428 2,186.643.64 "4.496 5,043,942.75 "4.584 5,142,839.40 "4.674 5.689,526.72 "4.798 5,695,046.56 4.870 3,637.11
"4.971 3,442.483.20 "4.830 9,023,179.70 4.680 4.416.838.73
•4.662 3.689,293.42 •4.759 6,562,721.09 •4.889 6.972.491.99 "4.992 6.708,821.33 "5.086 8,200,598.76 "5.192 7,807,186.38 •5.284 8,048.288.02 5.390 4.899,193.61 5.424 10,222,60'3.69 5.524 10,169.538.14 5.600 1.420.99 5.671 9,587.521.87 5.730 —7,027.03 5.835 4,325,673.55 5.860 4,813,055.22 5.892 5,072,916.78 5.903 26,289,475.59 5.856 18,076,744.33 5.930 8,684,129.79 6.000 8,222,036.74 6.000 16,688,479.08 6.000 18,793,658.23 6.000 19,614,952.03 6.000 1,035,219,149.87
' -384,344,54.3.83 ' •4.053 "4.119 -"4.197 "4.273 3,0C0.00 "4.379
1,487,715.01 6,497,817.47 9,965,393.80
11,955,298.69 10,768,694.99 5,944,890.81 6,620,804.10 7,352,280.10 7,600,169.58 6,834,283.38 6,025,419.17 2,103,326.21 4,375,056.98 8,044,183.65 8,400,558.43 9,524,559.60 9,623,435.90
760.769.38 8.932.390.11 9,421,359.48 3,964.147.91 5,483.781.51 9,854,458.21
10,754,197.70 11,031,899.92 13,563,158.22 13,619,267.24 12,316,780.07 1,298,672.77
16,752,366.62 17,444,366.00 7,608.956.11 9,983.376.87 8.192,097.74
11.041.250.76 10,462,361.69 13,605,039.90 32,361,548.46 30,355,755.77 32,192,241.18 3,080,638.29
39,902,171.81 57,561,806.10
145,791,165.01 138,134,376.75
-187,771,171.87 122.000.00 421.000.00 891,500.00
1,301,500.00 1,306,000.00
Digitized for FRASER http://fraser.stlouisfed.org/ Federal Reserve Bank of St. Louis

242 1977 REPORT OF THE SECRETARY OF THE TREASURY
TABLE 35.—Issues, maturities, and redemptions of interest-bearing public debt securities, excluding Government account series,
October 1976-September 7977—Continued
Date Securities Rate of interest»
Amount issued'
Amount matured or called or
redeemed prior to maturity'
7977 June 30 U.S. savings bonds'—Continued
Series H-1957 (January) Series H-1957 (February to December). Series H-1958 Series H-1959 (January to May) Series H-1959 (June to December) Series H-1960 Series H-1961 Series H-1962 Series H-1963 Series H-1964 Series H-1965 (January to November)... Series H-1965 (December) Series H-1966 Series H-1967 Series H-1968 (January to May) Series H-1968 (June to December) Series H-1969 (January to May).... Series H-1969 (June to December) Series H-1970 (January to May) Series H-1970 (June to December) Series H-1971 Series H-1972 Series H-1973 (January to November)... Series H-1973 (December) Series H-1974 Series H-1975 Series H-1976 Series H-1977 Unclassified sales and redemptions
30 Treasury notes. Series Q-1979 Adjustments of issues"
30 Treasury notes. Series A-1984... Adjustments of issues'
30 U.S. savings notes:" Series S-1967 Series S-1968 (January to May) Series S-1968 (June to December) Series S-1969 Series S-1970 Unclassified'"
30 U.S. individual retirement bonds 30 U.S. retirement plan bonds 30 Depositary bonds, First Series 30 Treasury certificates of indebtedness,
REA Series 30 Treasury bonds, Investment Series
B-1975-80 Redeemed in exchange for \'A% Treasury notes. Series EA-1982
30 Treasury notes. Series EA-1982 30 Miscellaneous
Total June
July 1 State and local govemment series: Treasury certificates of indebtedness Treasury notes Treasury bonds
See footnotes at end of table.
Percent
4.450 "4.414 "4.420 4.510
"4.586 "4.627 "4.711 "4.801 "4.901 "5.002 "5.106 5.290 5.327 5.272 5.240 5.346 5.450 5.679 5.730 5.794 5.834 $1,000.00 5.889 5.949 6.000 6.000 6.000 6.000 327,500.00 6.000 65,014,500.00
' —18.117.000.00 6'/8
3.950,000.00 VA
1,433,000.00
5.54 5.56 5.66 5.68 5.71
6.000 5.251 2.00
5.00
2»/4
321,573.43 -344.51
661,509.92 816,242.41 118,987.18
878,100.28 2,601,549.59
27,000.00
3,000,000.00
VA 3,000.00
$79,500.00 1,243,500.00 1,185,500.00
636,000.00 623,000.00
1,831,500.00 2.190,500.00 1,592,500.00 1,817,000.00 1,397,500.00 1,456,000.00
29,000.00 2.061,000.00 2,969,000.00
716,500.00 554,000.00 510,000.00 415,000.00 505,500.00 498,500.00
1,476,500.00 2,242,000.00 2,125,500.00
19,500.00 1,838,500.00 2,212,000.00 2.319,500.00
285,500.00 -5,807,500.00
427,642.26 427,168.76 831,630.09
1,862,626.50 617,307.75
""i33768.'r3 -1,330,168.07
73,000.00
6,246,000.00
3,000.00
""8"5".8i9i5"66."00
37.595.094.796.48 36.889.091.494.25
8,197,800.00 33,400,700.00 10,618,200.00 7,135,000.00
618,000.00
Digitized for FRASER http://fraser.stlouisfed.org/ Federal Reserve Bank of St. Louis

STATISTICAL APPENDIX 243 TABLE 35.—Issues, maturities, and redemptions of interest-bearing public debt
securities, excluding Government account series, October 1976-September 7977—Continued
Date Securities Rate of interest '
Amount issued'
Amount matured or called or
redeemed prior to matur i ty '
7977 Treasury bills:
Fifty-two weeks: July 1 Maturing June ' 27, 1978
Adjustments of issues 5 State and local govemment series,
Treasury notes Treasury bills:
Regular weekly: 5 Maturing Sept. 29, 1977
Adjustments of issues 5 Maturing Dec. 29, 1977
Adjustments of issues 6 Treasury certificates of indebtedness,
dollar denominated, maturing July 29, 1977
6 Treasury notes, foreign currency denominated, maturing
• Aug. 2, 1977 Treasury bills:
Regular weekly: 6 Maturing June 30, 1977.. . ;
Adjustments of issues 6 Maturing Sept. 29, 1977
Adjustments of issues 6 Maturing Dec. 29, 1977
Adjustments of issues Treasury bills:
Fifty-two weeks: 6 Maturing May 30, 1978
Adjustments of issues 6 State and local govemment series:
Treasury certificates of indebtedness Treasury notes
Treasury bills: Regular weekly:
7 Dated Jan. 6, 1977 7 Maturing Oct. 6, 1977 7 Maturing Jan. 5, 1978 7 Treasury notes, dollar denominated, maturing:
July 7, 1977 Nov. 15, 1983
Treasury bills: Regular weekly:
7 Maturing Sept. 15, 1977 Adjustments of issues
7 State and local govemment series: Treasury certificates of indebtedness Treasury notes
8 Treasury certificates of indebtedness Treasury notes
8 Treasury bonds of 1992 Issued for cash
Treasury bills: Regular weekly:
11 Dated Dec. 30, 1976 ' Adjustments of issues Adjustments of redemptions
See footnotes at end of table.
Percent
5 408
4 965
5 172
5.35
6 08
4609
4 965
5 172
5 403
•4 568 5 045 5 246
590 6.90
$15000(0
350,000.(0
90,000.00
-1,780,730,000.00
-1,104,445,000.00
2,885,190,000.00
15 00000
96,600.00 61,033,700.00
2,303,085,000.00 3,305,460.000.00
200.000.000.00
$95,000 00
11.248.593.93
6.511.958 32
—10.000.00 -64.000.00
6.006.950.000.00
200.000.000.00
5.000
7'/4
4.609
lO.OOO.OO
753,500.00 18,842,200.00
1,504,393,000.00
—905,000.00
255,000.00
64,000.00 64,000.00
-905,000.00
Digitized for FRASER http://fraser.stlouisfed.org/ Federal Reserve Bank of St. Louis

244 1977 REPORT OF THE SECRETARY OF THE TREASURY
TABLE 35.—Issues, maturities, and redemptions of interest-bearing public debt securities, excluding Government account series,
October 1976-September 7977—Continued
Date Securities Rate of interest'
Amount issued'
Amount matured or called or
redeemed prior to maturity'
7977 July 11 State and local govemment series:
Treasury notes 12 Treasury certificates of indebtedness
Treasury notes 13 Treasury certificates of indebtedness
Treasury notes Treasury bonds
13 Treasury certificates of indebtedness, dollar denominated, maturing July 29, 1977
13 Treasury notes, foreign currency denominated, maturing Aug. 2, 1977
Treasury bills: Regular weekly:
13 Maturing Sept. 15, 1977 Adjustments of issues
13 Maturing Dec. 15, 1977 Adjustments of issues
14 Dated Jan. 13, 1977 14 Maturing Oct. 13, 1977 14 Maturing Jan. 12, 1978 14 Treasury notes, dollar denominated, maturing:
July 14, 1977 Nov. 15, 1983 .-
14 State and local govemment series: Treasury certificates of indebtedness Treasury notes Treasury bonds
15 Treasury certificates of indebtedness Treasury notes Treasury bonds
15 Treasury notes, dollar denominated, maturing: July 15, 1977 Feb. 15. 1984
18 July 18, 1977 Dec. 31, 1979
18 State and local govemment series: Treasury certificates of indebtedness Treasury notes Treasury bonds
19 Treasury certificates of indebtedness Treasury notes Treasury bonds
20 Treasury certificates of indebtedness, dollar denominated, maturing: July 29, 1977 Oct. 20, 1977
20 Treasury notes, foreign currency denominated, maturing Aug. 2, 1977
20 State and local govemment series: Treasury certificates of indebtedness Treasury notes Treasury bonds
See footnotes at end of table.
Percent
5.35
6.08
5000
5 166
•4.705 5 162 5 357
5.875 6 90
2 50 7 25 7 50 7 50
5 35 5 25
6 08
$182,000.00 3,261,500.00
97.259,000.00 4,187,400.00
34,816,400.00 169,480,000.00
-6,470,000.00
—5,375,000.00
2,203,275,000.00 3,403,830,000.00
200,000,000.00
668,000.00 183,789,400.00 7,271,000.00 2,279,300.00 6,712,100.00 114,700.00
150,000,000.00
400,000,000.00
10.222,800.00 341,900.00
4,069,900.00 19,000.00
2,797,000.00 1,152,000.00
22,062,812.50
2,026,100.00 37,180,800.00 13,604,600.00
$260,000.00 1,000,000.00
/
11,248,593.93
6,511,958.32
i
5,903,325,000.00
200,000,000.00
115,000.00
25,766.'00 \
156,103,652.83 ]
447,666,600."CK)
; ; ; ; ; ; ; ; ; ; ; ; i
11,248,593.93
4
6,511,958.32
250,000.00 2,060,000.00
Digitized for FRASER http://fraser.stlouisfed.org/ Federal Reserve Bank of St. Louis
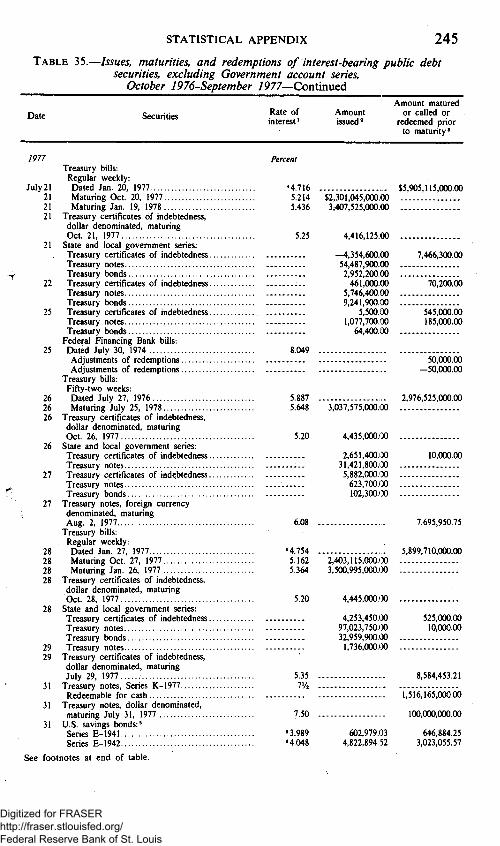
STATISTICAL APPENDIX 245 TABLE 35.—Issues, maturities, and redemptions of interest-bearing public debt
securities, excluding Government account series, October 1976-September 7977—Continued
Date Securities Rate of interest'
Amount issued'
Amount matured or called or
redeemed prior to maturity'
7977 Treasury bills: Regular weekly:
July21 Dated Jan. 20, 1977 21 Maturing Oct. 20, 1977 21 Maturing Jan. 19, 1978 21 Treasury certificates bf indebtedness,
dollar denominated, maturing Oct. 21, 1977
21 State and local govemment series: Treasury certificates of indebtedness... Treasury notes Treasury bonds
22 Treasury certificates of indebtedness... Treasury notes Treasury bonds
25 Treasury certificates of indebtedness... Treasury notes Treasury bonds
Federal Financing Bank bills: 25 Dated July 30, 1974
Adjustments of redemptions Adjustments of redemptions
Treasury bills: Fifty-two weeks:
26 Dated July 27, 1976 26 Maturing July 25, 1978 26 Treasury certificates of indebtedness,
dollar denominated, maturing Oct. 26, 1977
26 State and local govemment series: Treasury certificates of indebtedness... Treasury notes
27 Treasury certificates of indebtedness... Treasury notes Treasury bonds
27 Treasury notes, foreign currency denominated, maturing Aug. 2, 1977
Treasury bills: Regular weekly:
28 Dated Jan. 27, 1977 28 Maturing Oct. 27, 1977 28 Maturing Jan. 26, 1977 28 Treasury certificates of indebtedness,
dollar denominated, maturing Oct. 28, 1977
28 State and local govemment series: Treasury certificates of indebtedness... Treasury notes Treasury bonds
29 Treasury notes 29 Treasury certificates of indebtedness,
dollar denominated, maturing July 29, 1977
31 Treasury notes, Series K-1977 Redeemable for cash
31 Treasury notes, dollar denominated, maturing July 31, 1977
31 U.S. savings bonds:' Series E-1941 Series E-1942
See footnotes at end of table.
Percent
•4.716 5.214 5.436
5.25
8.049
5.887 5.648
5.20
6.08
•4.754 5.162 5.364
5.20
5.35 VA
7 50
"3.989 "4.048
""$"2".36"l!645."0(X)".ii)b 3i407.525.000.'(X)
4,416,125.W
-4.354.600.iOO 54,487.900.(30 2,952.200.(30 461.000.00
5.746,400.130 9,241,900.130
5,500.(30 1,077,700.(30
64,400 (30
3,037,575,000.(30
4,435,000.(30
2,651.400.(30 31,421,800.(30 5,882,(X)0.(30 623.700.(30 102,300.(30
2,403,115,(X)0.(X) 3,500,995,000.(30
4.445,000.(30
4,253.450.(30 97,023.750.(30 32.959,900.(30 1,736,000.130
602.979.133 4,822,894.52
$5,905,115,000.00
7,466.300.00
70,200.00
545.000.00 185.000.00
50.000.00 -50.000.00
2,976,525,000.00
10,000.00
7,695,950.75
5,899,710,000.00
525,(X)0.00 10,000.00
8,584,453.21
1,516,165,000.00
100,000,000.00
646,884.25 3,023,055.57
Digitized for FRASER http://fraser.stlouisfed.org/ Federal Reserve Bank of St. Louis
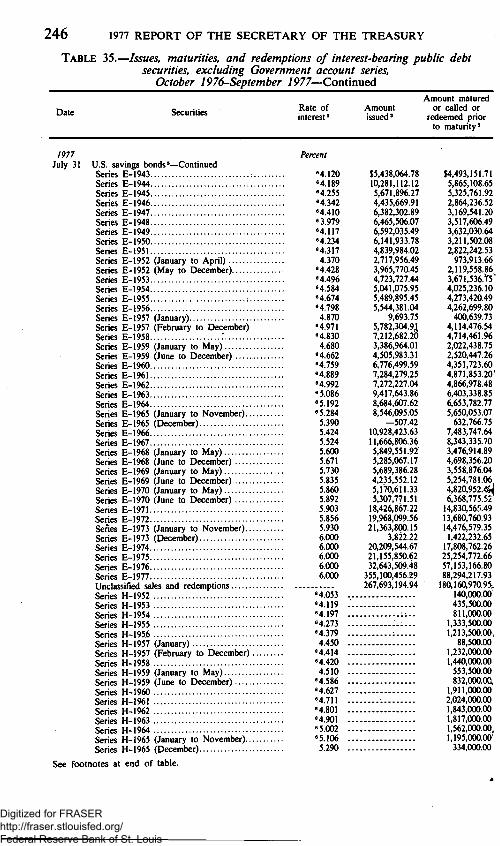
246 1977 REPORT OF THE SECRETARY OF THE TREASURY
TABLE 35.—Issues, maturities, and redemptions of interest-bearing public debt securities, excluding Government account series,
October 1976-September 7977—Continued
Date Securities Rate of interest'
Amount issued'
Amount matured or called or
redeemed prior to maturity'
7977 July 31 U.S. savings bonds'—(Dontinued
Series E-1943 Series E-1944 Series E-1945 Series E-1946 Series E-1947 Series E-1948 Series E-1949 Series E-1950 Series E-1951 Series E-1952 (January to April) Series E-1952 (May to December) Series E-1953 Series E-1954 Series E-1955 Series E-1956 Series E-1957 (January) Series E-1957 (Febmary to December) Series E-1958 : Series E-1959 (January to May) Series E-1959 (June to December) Series E-1960 Series E-1961 Series E-1962 Series E-1963 Series E-1964 Series E-1965 (January to November)... Series E-1965 (December) Series E-1966 Series E-1967 Series E-1968 (January to May) Series E-1968 (June to December) Series E-1969 (January to May) Series E-1969 (June to December) Series E-1970 (January to May) Series E-1970 (June to December) Series E-1971 Series E-1972 Senes E-1973 (January to November)... Series E-1973 (December) Series E-1974 Series E-1975 Series E-1976 Series E-1977 Unclassified sales and redemptions Series H-1952.. Series H-1953 Series H-1954 Series H-1955 Series H-1956 Series H-1957 (January) Series H-1957 (Febmary to December). Series H-1958 Series H-1959 (January to May) Series H-1959 (June to December) Series H-1960 Series H-1961 Series H-1962 Series H-1963 Series H-1964 Series H-1965 (January to November)... Series H-1965 (December)
See footnotes at end of table.
Percent
"4.120 "4.189 "4.255 "4.342 "4.410 "3.979 "4.117 "4.234 "4.317 4.370
"4.428 "4.496 "4.584 "4.674 "4.798 4.870
"4.971 "4.830 4.680
"4.662 "4.759 "4.889 "4.992 "5.086 "5.192 "5.284 5.390 5.424 5.524 5.600 5.671 5.730 5.835 5.860 5.892 5.903 5.856 5.930 6.000 6.000 6.000 6.000 6.000
"4.053 "4.119 "4.197 "4.273 "4.379 4 450
"4.414 "4.420 4.510
"4.586 "4.627 "4.711 "4.801 "4.901 "5.002 "5.106 5.290
$5,438,064.78 10,281,112.12 5,671,896.27 4.435.669.91 6,382,302.89 6,465,506.07 6,592,035.49 6,141,933.78 4,839,984.02 2,717.956.49 3.965,770.45 4.723.727.44 5.041,075.95 5,489,895.45 5,544.381.04
9,693.75 5,782,304.9,1 7,212,682.20 3,386,964.01 4,505,983.31 6,776,499.59 7,284,279.25 7,272,227.04 9,417,643.86 8,684,607.62 8,546,095.05
-507.42 10,928,423.63 11,666,806.36 5,849,551.92 5,285,067.17 5,689,386.28 4.235.552.12 5.170.611.33 5.307,771.51
18,426,867.22 19,968,099.56 21,363,800.15
3,822.22 20,209,544.67 21,155,850.62 32,643,509.48
355.100,456.29 267,693,194.94
Digitized for FRASER http://fraser.stlouisfed.org/ Federal Reserve Bank of St. Louis

STATISTICAL APPENDIX 247 TABLE 35.-
Date
-Issues, maturities, and redemptions of interest-bearing public debt securities, excluding Government account series,
October 1976-September 7977—Continued
Securities Rate of interest'
Amount issued'
Amount matured or called or
redeemed prior to maturity'
7977 July 31 U.S. savings bonds'—Continued
Series H-1966.. Series H-1967 Series H-1968 (January to May) Series H-1968 (June to December) Series H-1969 (January to May) Series H-1969 (June to December) Series H-1970 (January to May) Series H-1970 (June to December) Series H-1971 Series H-1972 Series H-1973 (January to November) Series H-1973 (December). Series H-1974. Series H-1975 Series H-1976 Series H-1977 Unclassified sales and redemptions
31 Treasury notes. Series Q-1979 Adjustments of issues" Adjustments of redemptions"
31 Treasury notes. Series R-1979 Adjustments of issues"
31 Treasury notes. Series A-1984 Adjustments of issues"
31 U.S. individual retirement bonds 31 U.S. retirement plan bonds 31 U.S. savings notes:"
Series S-1967 Series S-1968 (January to May) Series S-1968 (June to December) Series S-1969 Series S-1970 Unclassified'"
31 Depositary bonds. First Series X 31 Treasury certificates of indebtedness,
X REA Series 31 Treasury bonds, REA Series 31 Treasury bonds. Investment Series
B-1975-80 Redeemed in exchange for \'A% Treasury notes. Series EA-1982
31 Treasury notes, Series EA-1982 31 Miscellaneous
Total July
Aug. 1 Treasury notes, Series S-1979 Issued in exchange for l'A% Treasury notes. Series K-1977
Issued for cash 1 Treasury notes, dollar denominated, maturing:
May 31, 1979 Feb. 15, 1980
Treasury bills: Regular weekly:
1 Maturing Oct. 20, 1977 Adjustments of issues
See footnotes at end of table.
Percent
5.327 5.272 5.240 5.346 5.450 5.679 5.730 -5.794 5.834 5.889 5.949 6.000 6.000 6.000 $500.00 6.000 34,000.00 6.000 40,402,000.00
12,701,000.00 6'/8
6y8
'7'/4
6.000 5.258
60,000.00
2,390,000.03
3,000.a) 382,668.93
1,047,956.84
$1,707,500.00 2,498,500.00
354,500.00 693,500.00 302,000.00 707,500.00 390,000.00 793,000.00
1,562,000.00 1,977,000.00 1,603,000.00
185,500.00 1.761,500.00 1,945,500.00 1,883,000.00
320,000.00 1,340,000.00
5,000.00
2,986,359.36 488,809.73
5.54 139,485.00 186,530.38 5.56 225,469.8:1 168,202.23 5.66 316,173.30 373,354.31
5.684 833,329.17 807,581.18 5.711 392,227.46 269,611.37
2*00 60,000.00
5.00 1,608,000.00 2.00 19,000.00
2%
402,000.00 \'A 402,000.001
54,956,000.00
30,299,397.322.40 30.096.320.778.83
d'A
65.100.000.00 3.115.260.000.00
6.125 6.50
5.214
50.000,000.00 50,000,000.00
10,000.00
Digitized for FRASER http://fraser.stlouisfed.org/ Federal Reserve Bank of St. Louis

248 1977 REPORT OF THE SECRETARY OF THE TREASURY
TABLE 35.—Issues, maturities, and redemptions of interest-bearing public debt securities, excluding Government account series,
October 1976-September 1977—Continued
Date Securities Rate of interest'
Amount issued'
Amount matured or called or
redeemed prior to maturity'
7977 Aug. 1 State and local govemment series:
Treasury certificates of indebtedness Treasury notes Treasury bonds
2 Treasury certificates of indebtedness Treasury notes Treasury bonds
2 Treasury certificates of indebtedness, dollar denominated, qjaturing Oct. 28, 1977
2 Treasury notes, foreign currency denominated, maturing: Aug. 2, 1977 Aug. 18, 1977
3 State and local govemment series: Treasury certificates of indebtedness Treasury notes
4 Treasury certificates of indebtedness Treasury notes Treasury bonds
Treasury bills: Regular weekly:
4 Dated Feb. 3. 1977 4 Maturing Nov. 3. 1977 4 Maturing Feb. 2. 1978 4 Treasury bills, dollar denominated, maturing:
Aug. 4, 1977 Feb. 2. 1978
8 Treasury certificates of indebtedness, dollar denominated, maturing: Oct. 20, 1977 Oct. 21, 1977 Oct. 26, 1977 Oct. 28. 1977
8 State and local govemment series: Treasury certificates of indebtedness Treasury notes
9 Treasury certificates of indebtedness Treasury notes Treasury bonds
10 Treasury certificates of indebtedness, dollar denominated, maturing Oct. 28, 1977
10 Treasury notes, foreign currency denominated, maturing Aug. 19, 1977 '.
10 State and local govemment series: Treasury certificates of indebteness Treasury notes Treasury bonds
11 Treasury certificates of indebtedness Treasury bonds
Treasury bills: Regular weekly:
11 Dated Feb. 10, 1977 11 Maturing Nov. 10, 1977 11 Maturing Feb. 9, 1978
See footnotes at end of table.
Percent
5.50
6.08 6 35
•4931 5 424 5 690
5 25 5 25 5 20 5 20
5 50
6 35
•4 834 5 353 5.679
$1,351,200.00 12,889,600.00 10,680,300.00 1,671,700.00
43,194,600.00 475,400.00
1,340.700.00 11,964.100.00 1.603,800.00
15,204,300.00 12,196,100.00
2,402,715,000.00 3,599,195,000.00
40,000,000.00
42,800.00 1,861,800.00
84,200.00 3,752,900.00 149,100.00
1,528,800.00 31,485,700.00
238,400.00 1,294.300.00
42,522.200.00
2,403,185,000.00 3,503,930,000.00
$7,527,390.28 930,000.00
11,248.593.93
3.847,975.^' 2,663,982.92
6,008,310000 00'
40,000,000.00
22,062,812.50 4,416,125.00 4,435,000.00 4,445,000.00
(
11,248,593.93
6,511,958.32
905,000.00
5,903,395,000.00^
Digitized for FRASER http://fraser.stlouisfed.org/ Federal Reserve Bank of St. Louis
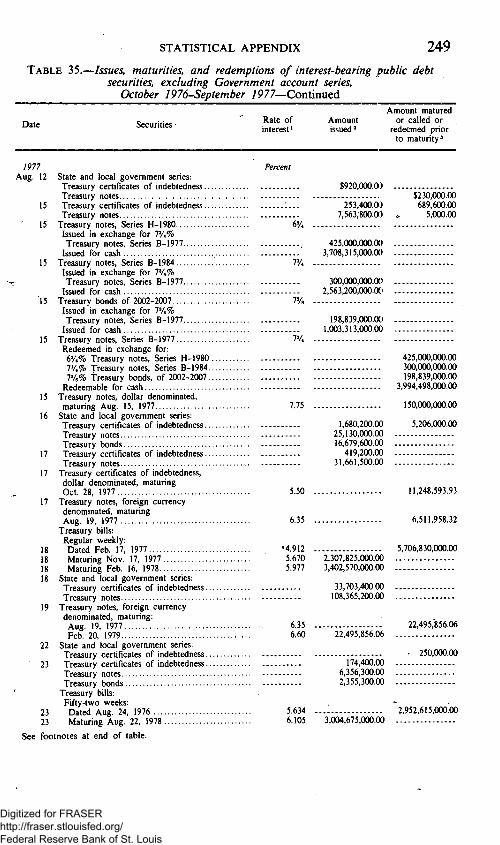
STATISTICAL APPENDIX 249 TABLE 35.-
Date
-Issues, maturities, and redemptions of interest-bearing public debt securities, excluding Government account series,
October 1976-September 7977—Continued
Securities - Rate of interest'
Amount issued'
Amount matured or called or
redeemed prior to maturity'
7977 Aug. 12 State and local govemment series:
Treasury certificates of indebtedness... Treasury notes
15 Treasury certificates of indebtedness... Treasury notes
15 Treasury notes, Series H-1980 Issued in exchange for 7'/4% Treasury notes. Series B-1977
Issued for cash 15 Treasury notes, Series B-1984
Issued in exchange for 7'/4% c Treasury notes. Series B-1977
Issued for cash 15 Treasury bonds of 2002-2007
Issued in exchange for 7'/4% Treasury notes. Series B-1977
Issued for cash 15 Treasury notes. Series B-1977....
Redeemed in exchange for: 6'/4% Treasury notes, Series H-1980 . 7'/4% Ti-easury notes. Series B-1984.. 7V8% treasury bonds, of 2002-2007..
Redeemable for cash 15 Treasury notes, dollar denominated,
maturing Aug. 15, 1977 16 State and local govemment series:
Treasury certificates of indebtedness... Treasury notes Treasury bonds
17 Treasury certificates of indebtedness... Treasury notes
17 Treasury certificates of indebtedness, dollar denominated, maturing Oct. 28, 1977
17 Treasury notes, foreign currency denominated, maturing Aug. 19, 1977
Treasury bills: Regular weekly:
18 Dated Feb. 17, 1977 18 Maturing iSfov. 17, 1977 18 Maturing Feb. 16, 1978 18 State and local government series:
Treasury certificates of indebtedness... Treasury notes
19 Treasury notes, foreign currency denominated, maturing: Aug. 19. 1977 Feb. 20, 1979
22 State and local govemment series: Treasury certificates of indebtedness...
23 Treasury certificates of indebtedness... Treasury notes Treasury bonds
Treasury bills: Fifty-two weeks:
23 Dated Aug. 24, 1976 23 Maturing Aug. 22, 1978
See footnotes at end of table.
Percent
6'/4 .
7%
7%
7'/4 ,
7 75
5.50
6 35
•4912 5 670 5 977
6 35 660
5.634 6.105
$920,000.03
253.400.00 7.563.800.00
425,000.000.00 3,708,315,000.00
300,000,000.0(1 2.563,200,000.00
198,839,000.0(1 1,003,313,000.0(1
1,680,200.00 25,130,000.00 16,679,600.00
419,200.00 31,661,500.00
2,307,825,000.00 3,402,570.000.00
33,703,400.00 108,365,200.00
22,495,856.06
174,400.00 6.356,300.00 2,355,300.00
3.004.675.000.00
$230,000.00 689,600.00
5,000.00
425,000.000.00 300.000,000.00 198,839,000.00
3,994,498.000.00
150,000,000.00
5,206,000.00
11,248,593.93
6.511,958.32
5,706,830,000.00
22,495,*856.06
- 250,000.00
* 2,952.615,000.00
Digitized for FRASER http://fraser.stlouisfed.org/ Federal Reserve Bank of St. Louis
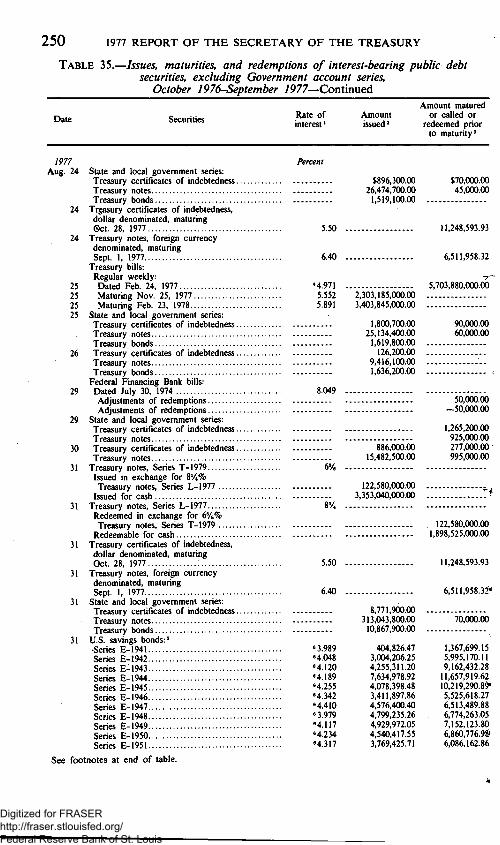
250 1977 REPORT OF THE SECRETARY OF THE TREASURY
TABLE 35.—Issues, maturities, and redemptions of interest-bearing public debt securities, excluding Government account series,
October 1976-September 7977—Continued
Date Securities Rate of interest'
Amount issued'
Amount matured or called or
redeemed prior to maturity'
7977 Percent Aug. 24 State and local govemment series:
Treasury certificates of indebtedness $896,3(X).00 Treasury notes 26,474,700.00 Treasury bonds 1,519,100.00
24 Treasury certificates of indebtedness, dollar denominated, maturing 0ct. 28, 1977 5.50
24 Treasury notes, foreign currency denominated, maturing Sept. 1. 1977 6.40
Treasury bills: Regular weekly:
25 Dated Feb. 24, 1977 «4.971 25 Maturing Nov. 25, 1977 5.552 25 Maturing Feb. 23. 1978 5.891 25 State and local govemment series:
Treasury certificates of indebtedness Treasury notes Treasury bonds
26 Treasury certificates of indebtedness Treasury notes Treasury bonds
Federal Financing Bank bills: 29 Dated July 30, 1974 8.049
Adjustments of redemptions Adjustments of redemptions
29 State and local govemment series: Treasury certificates of indebtedness Treasury notes
30 Treasury certificates of indebtedness Treasury notes
31 Treasury notes. Series T-1979 6»/8 Issued in exchange for 8'/4% Treasury notes. Series L-1977
Issued for cash 31 Treasury notes. Series L-1977 8'/4
Redeemed in exchange for 6'/8% Treasury notes. Series T-1979
Redeemable for cash 31 Treasury certificates of indebtedness,
dollar denominated, maturing Oct. 28, 1977 5.50
31 Treasury notes, foreign currency denominated, maturing Sept. 1, 1977 6.40
31 State and local govemment series: Treasury certificates of indebtedness 8,771,900.00 Treasury notes 313.043.800.00 Treasury bonds 10.867,900.00
31 U.S. savings bonds:' -Series E-1941 "3.989 404,826.47 Series E-1942 H.048 3,004,206.25 Series E-1943 H.120 4,255,311.20 Series E-1944 H.189 7,634,978.92 Series E-1945 M.255 4,078,398.48 Series E-1946 H.342 3,411,897.86 Series E-1947 «4.410 4,576,400.40 Series E-1948 «3.979 4,799,235.26 Series E-1949 H.117 4,929,972.05 Series E-1950 M.234 4,540,417.55 Series E-1951 «4.317 3,769,425.71
See footnotes at end of table.
$70,000.00 45,000.00
11,248,593.93
6,511,958.32
5,703,880,000.00
2,303,185,000.00 3,403,845,000.00
1,800,700.00 90,000.00 25,134,400.00 60,000.00
1,619,800.00 126,200.00
9,416,100.00 1,636,200.00 <
!!]""-!!!!]!] so^iib -50,000.00
1,265,200.00 925,000.00
886,000.00 277,000.00 15,482,500.00 995,000.00
122,580.000.00 . , 3.353.040,000.00 ^
122,580,000.00
1,898,525,000.00
11,248,593.93
6,511.958.32* 70,000.00
1,367,699.15 5,995.170.11 9,162,432.28
11,657,919.62 10,219,290.89" 5,525,618.27 6,513,489.88 6,774,263.05 7,152,123.80 6,860,776.9& 6,086.162.86
Digitized for FRASER http://fraser.stlouisfed.org/ Federal Reserve Bank of St. Louis

STATISTICAL APPENDIX 251 TABLE 35.—Issues, maturities, and redemptions of interest-bearing public debt
securities, excluding Government account series, October 1976-September 7977—Continued
Date Securities Rate of interest'
Amount issued ^
Amount matured or called or
redeemed prior to maturity'
7977 Aug. 31 U.S. savings bonds'—Continued
Series E-1952 (January to April) Series E-1952 (May to December) Series E-1953 Series E-1954 Series E-1955 Series E-1956 Series E-1957 (January) Series E-1957 (February to December).. Series E-1958 Series E-1959 (January to May)
r Series E-1959 (June to December) Series E-1960 Series E-1961 Series E-1962 Series E-1963 Series E-1964 Series E-1965 (January to November)... Series E-1965 (December) Series E-1966 Series E-1967 Series E-1968 (January to May) Series E-1968 (June to December) Series E-1969 (January to May) Series E-1969 (June to December) Series E-1970 (January to May) Series E-1970 (June to December) Series E-1971 Series E-1972 Series E-1973 (January to November)... Series E-1973 (December) Series E-1974 Series E-1975 Series E-1976 Series E-1977 Unclassified sales and redemptions Series H-1952 Series H-1953 Series H-1954 Series H-1955 Series H-1956 Series H-1957 (January) Series H-1957 (February to December) . Series H-1958 Series H-1959 (January to May) Series H-1959 (June to December) Series H-1960 Series H-1961 Series H-1962 Series H-1963 Series H-1964 Series H-1965 (January to November)... Series H-1965 (December) Series H-1966 Series H-1967 Series H-1968 (January to May) Series H-1968 (June to December) Series H-1969 (January to May) Series H-1969 (June to December) Series H-1970 (January to May) Series H-1970 (June to December)
See footnotes at end of table.
Percent
4.370 $1,991,422.37 $1,820,577.90 "4.428 4.920,379.10 3,965.516.47 "4.496 5,697,105.86 7,294.802.33 "4.584 6.198,318.02 8.133.625.00 "4.674 6,583,090.95 8,686.674.86 "4.798 6.223,438.5(3 8,946.525.79 4.870 -205.2(3 791,608.65
"4.971 5,448.012.21} 7,574,246.61 "4.830 6,905,694.43 7,556,811.21 4.680 3,097,538.36 3,070,713.65
"4.662 4,057,547.09 4,289,671.51 "4.759 6,096,224.91! 7,640,840.03 "4.889 6,787,797.4:! 8,472,425.85 "4.992 6,763,051.7{! 8,515,387.69 "5.086 7,872,925.13 10,525,880.00 "5.192 7,769,105.37 10,381,557.00 "5.284 7,593,492.46 9,494,056.61
5.390 -6,607.37 1,106,446.69 5.424 9,011.220.89 12,556,815.58 5.524 8,982,442.36 13,563,406.39 5.600 4,623,555.43 5,270,979.73 5.671 4,286,740.70' 7,754,483.65 5.730 4,406,611.76 5,843,669.70 5.835 4,687,591.18 8,516.886.05 5.860 5,675.474.51 7.866.769.05 5.892 5,912,818.76 11,171,001.25 5.903 20,708,235.05 25,574,725.35 5.856 16,973,007.33 23,274,808.02 5.930 16,397,902.53 24,026,877.44 6.000 -18,007.81 2,417,538.43 6.000 16,618,859.10 29,760,090.31 6.000 16,959,326.51 41,815,133.81 6.000 27,385.283.52 89.467,794.36 6.000 782,993,126.36 145,397.176.90
•> —98,005,885.78 ' —1,028,939.52 «4.053 192,000.00 84.119 566,500.00 «4.197 1,013,000.00 H.273 1,441,000.00 «4.379 1,407,500.00 4.450 101,500.00
"4.414 1,627,500.00 «4.420 1,616,500.00 4.510 745,500.00
«4.586 972,500.00 "4.627 2,771.000.00 «4.711 2.846.000.00 «4.801 2,369,000.00 «4.901 2,067,500.00 «5.002 1,938,500.00 «5.106 1,574,500.00
5.290 251,000.00 5.327 2,849,000.00 5.272 3,514,000.00 5.240 693,000.00 5.346 811,500.00 5.450 754.500.00 5.679 830.500.00 5.730 610.000.00 5.794 771.000.00
Digitized for FRASER http://fraser.stlouisfed.org/ Federal Reserve Bank of St. Louis

252 1977 REPORT OF THE SECRETARY OF THE TREASURY
TABLE 35.—Issues, maturities, and redemptions of interest-bearing public debt securities, excluding Government account series,
October 1976-September 7977—Continued
Date Securities Rate of interest'
Amount issued'
Amount matured or called or
redeemed prior to maturity'
7977 Aug. 31 U.S. savings bonds'—Continued
Series H-1971 Series H-1972 Series H-1973 (January to November) Series H-1973 (December) Series H-1974 Series H-1975 Series H-1976 Series H-1977 Unclassified sales and redemptions
31 Treasury notes. Series Q-1979 Adjustments of issues" .• Adjustments of redemptions"
31 U.S. savings notes:" Series S-1967 Series S-1968 (January to May) Series S-1968 (June to December) Series S-1969 Series S-1970... Unclassified'"
31 U.S. individual retirement bonds 31 U.S. retirement plan bonds 31 Depositary bonds. First Series 31 Treasury bonds. Investment Series
B-1975-80 Redeemed in exchange for \'A% Treasury notes, Series EA-1982
31 Treasury notes. Series EA-1982 31 Miscellaneous
Total August
Treasury bills: Regular weekly:
Sept. 1 Dated Mar. 3, 1977 1 Maturing Dec. 1, 1977 1 Maturing Mar. 2, 1978 1 Treasury notes, foreign currency
denominated, maturing: Sept. 1, 1977 Mar. 1, 1979
1 State and local govemment series: Treasury certificates of indebtedness... Treasury notes Treasury bonds
6 Treasury notes, dollar denominated, maturing: Sept. 5, 1977 Aug. 15. 1979
Treasury bills: Short dated:
6 Maturing Sept. 15, 1977 6 Maturing Sept. 22, 1977 6 State and local govemment series:
Treasury certificates of indebtedness... Treasury notes Treasury bonds
7 Treasury certificates of indebtedness... Treasury notes
7 Treasury notes, Series K-1981 Issued for cash
See footnotes at end of table.
Percent
5.834 . 5.889 -5 949 . 6.000 -6.000 6.000 6.000 6.000
6'/8 .
$1,000.00 1,000.00
41,000.00 73,137,000.00
' —16,202,500 00 '
—5,000.00
$2,024,500.00 2,244,500.00 2,184,000.00 164,000.00
2,458,000.00 2,873,500.00 3,110.000.00 751,500.00
— 11,413,500 00
—5.000.00
5.54 160,664.69 305,520.88 5.56 225,128.24 293,488.83 5.66 326,805.14 597,119.33 5.68 785,211.80 1,332,235.21 5.71 329,515.64 459,826.17
3,629.75 6.000 6,178,571.30 100,061.04 5.261 557,718.32 556,081.79,
200,000.00
2%
58,000.00 \'A 58,000.00
73,384,000.00
•4.961 5 575 5 849
640 640
7 85 6 875
5 764 5 761
6'/,
43,249^347^204.94
2,300,675,000.00 3,304,365,000.00
25,455,837.09
1,409,900.00 14,704,200.00 1,296,400.00
200,000,000.00
901,040,000.00 902,800,000.00
4,548,100.00 86,141,500.00
198,500.00 654,600.00
33,462,600.00
2,968,222,000.00
34,335,513^609.58
5,605,675,OOOrdi
25,455,837.0^
12.278,800.0( 4,615,0OO.(X
200,000,000.0(
'
'a
260,000.0(
1,580.000.0
i
Digitized for FRASER http://fraser.stlouisfed.org/ Federal Reserve Bank of St. Louis

STATISTICAL APPENDIX 253 TABLE 35.-
Date
-Issues, maturities, and redemptions of interest-bearing public debt securities, excluding Government account series,
October 1976-September 7977—Continued
Securities Rate of interest'
Amount issued ^
Amount matured or called or
redeemed prior to maturity'
7977 Sept. 7 Treasury notes, dollar denominated, maturing:
Mar. 31, 1980. May 15, 1980
7 Treasury certificates of indebtedness, dollar denominated, maturing Oct. 28, 1977
7 Treasury notes, foreign currency denominated, maturing Oct. 20, 1977
Treasury bills: Regular weekly:
8 Dated Mar. 10, 1977 8 Maturing Dec. 8, 1977 8 Maturing Mar. 9, 1978 8 Maturing Nov. 17, 1977
Adjustments of issues 8 Maturing Feb. 16, 1978
Adjustments of issues 8 Treasury bills, dollar denominated, maturing:
Sept. 8, 1977 Mar. 9, 1978
8 State and local govemment series: Treasury certificates of indebtedness Treasury notes Treasury bonds
12 Treasury notes Treasury bills: Regular weekly:
13 Maturing Oct. 20. 1977 Adjustments of issues
13 State and local govemment series: Treasury certificates of indebtedness Treasury notes
14 Treasury certificates of indebtedness Treasury notes Treasury bonds
Treasury bills: Regular weekly:
14 Maturing Nov. 17, 1977 Adjustments of issues
14 Treasury certificates of indebtedness, dollar denominated, maturing Oct. 28, 1977
14 Treasury notes, foreign currency denominated, maturing Oct. 20, 1977
Treasury bills: Regular weekly:
15 Dated Mar. 17, 1977 15 Maturing Dec. 15, 1977 15 Maturing Mar. 16, 1978 15 Maturing Sept. 22, 1977
Adjustments of issues Adjustments of redemptions
Short dated: 15 Dated Sept. 6, 1977
See footnotes at end of table.
Percent
7.50 6 875
5 50 .
6.10 .
•4.996 5 554 5 845 5 670
5 977
5 214 .
5 670
5 50
6 10
•4.886 5 887 6 098 5013
5.764
$300,000,000.03 200.000,000.03
2,208,735,000.0(1 3,203.120.000.0(1
-70,000.00
70.000.00
42.700.000.00
6,860.900.00 2.935.200.00 1,627,400.00
-30.000.00
208,700.00 8,592,700.00 779,600.00
66,326,800.00 1,907,400.00
90,000.00
2,514,885,000.00 3,376,745,000.00
-150,000.00
$11,248,593.93
6.511,958.32
5,410,025,000.00
42.700.000.00
865,000.00
11,248 593 93
6,511,958.32
5,105,730,000.00
—150.000.00
901,040,000.00
Digitized for FRASER http://fraser.stlouisfed.org/ Federal Reserve Bank of St. Louis

254 1977 REPORT OF THE SECRETARY OF THE TREASURY
TABLE 35.—Issues, maturities, and redemptions of interest-bearing public debt securities, excluding Government account series,
October 1976-September 7977—Continued
Date Securities Rate of interest'
Amount issued'
Amount matured or called or
redeemed prior to maturity'
7977 Sept. 15 State and local govemment series:
Treasury certificates of indebtedness.. Treasury notes Treasury bonds
19 Treasury certificates of indebtedness.. Treasury notes
20 Treasury certificates of indebtedness.. Treasury notes Treasury bonds
Treasury bills: Fifty-two weeks:
20 Dated Sept. 21. 1976 20 Maturing Sept. 19. 1978 21 Treasury certificates of indebtedness.
dollar denominated, maturing Oct. 28, 1977
21 Treasury notes, foreign currency denominated, maturing Oct. 20, 1977 ^
21 State and local govemment series: Treasury certificates of indebtedness.. Treasury notes Treasury bonds
22 Treasury certificates of indebtedness.. Treasury notes Treasury bonds
Treasury bills: Regular weekly:
22 Dated Mar. 24, 1977 22 Maturing Dec. 22, 1977 22 Maturing Mar. 23, 1978 22 Treasury notes, dollar denominated,
maturing: Sept. 22. 1977 Aug. 15, 1984
Treasury bills: Short dated:
22 Dated Sept. 6, 1977 23 State and local govemment series:
Treasury certificates of indebtedness.. Treasury notes
26 Treasury certificates of indebtedness.. Treasury notes Treasury bonds
Treasury bills: Regular weekly:
27 Maturing Nov. 25, 1977 Adjustments of issues
27 Maturing Feb. 23, 1978 Adjustments of issues
27 State and local govemment series: Treasury certificates of indebtedness.. Treasury notes Treasury bonds
28 Treasury certificates of indebtedness.. Treasury notes Treasury bonds
28 Treasury certificates of indebtedness, dollar denominated, maturing Oct. 28, 1977
See footnotes at end of table.
Percent
5.561 6 156
5.50
6.10
•4 900 5.851 5 976
5.90 7.25
5 761
5 552
5 891
$1,413,700.00 35,755,700.00 5,582,200.00
73,300.00 475,900.00 929,400.00
12,989,400.00 4,052,800.00
3 035,920,000.00
1,017,800.00 26,534,900.00 1,388,000.00 413,300.00
54,970,100.00 8,462,100.00
2,506,985,000.00 3,502,050,000.00
""'""56b^666,"666."ob
355,000.00 211,055,000.00
531,000.00 10,929,000.00 28 484,10000
170,000.00
—170,000.00
1,607,000.00 82,336,100.00 17,608,000.00 2,440,900.00
95,231.000.00 5.826.200.00
$1,894,000.00 275,000.00
140,000.00
2,917,285,OOOJQO^
11,248,593.93
6.511,958.32
1,910,000.00
5,104,125,000 00
500,000,000.0(
902,800,000.0(
345,000.0(
'A
:J
35,400.0( 50.000.0(
3,574.900.Q 1.032.800.0
5.50 11.248.593.^
Digitized for FRASER http://fraser.stlouisfed.org/ Federal Reserve Bank of St. Louis
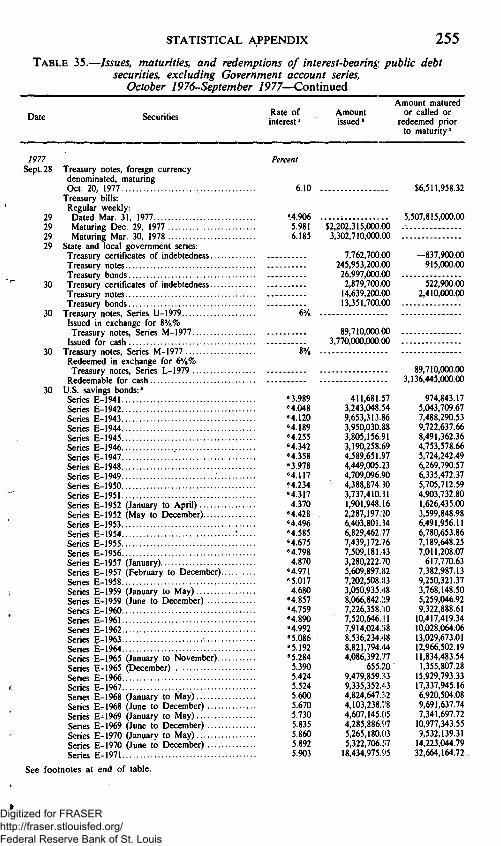
STATISTICAL APPENDIX 255 TABLE 35.—Issues, maturities, and redemptions of interest-bearing public debt
securities, excluding Government account series, October 1976-September 7977—Continued
Date Securities Rate of interest'
Amount issued»
Amount matured or called or
redeemed prior to maturity'
1977 Sept. 28
29 29 29 29
30
30
30
30
Treasury notes, foreign currency denominated, maturing Oct. 20, 1977
Treasury bills: Regular weekly: Dated Mar. 31, 1977 Maturing Dec. 29. 1977 Maturing Mar. 30. 1978
State and local govemment series: Treasury certificates of indebtedness Treasury notes Treasury bonds Treasury certificates of indebtedness Treasury notes Treasury bonds
Treasury notes. Series U-1979 Issued in exchange for 8'/8% Treasury notes. Series M-1977
Issued for cash Treasury notes, Series M-1977 Redeemed in exchange for 6'/8% Treasury notes. Series L-1979
Redeemable for cash U.S. savings bonds:' Series E-1941 Series E-1942 Series E-1943 Series E-1944 Series E-1945 Series E-1946 Series E-1947 Series E-1948 Series E-1949 Series E-1950 Series E-1951 Series E-1952 (January to April) Series E-1952 (May to December) Series E-1953 Series E-1954 Series E-1955 Series E-1956 Series E-1957 (January)
E-1957 (Febmary to December).. E-1958 E-1959 (January to May) E-1959 (June to December) E-1960 E-1961 E-1962 E-1963
Series E-1964 Series E-1965 (January to November)...
E-1965 (December) E-1966 E-1967 E-1968 (January to May) E-1968 (June to December) E-1969 (January to May)
Series E-1969 (June to December) Series E-1970 (January to May) Series E-1970 (June to December) Series E-1971
Percent
Series ' Series '. Series Series Series Series Series Series
Series Series Series Series Series Series
6.10
•4.906 5.981 6.185
6'/8
8'/8
"3.989 "4.048 "4.120 "4.189 "4.255 "4.342 "4.358 "3.978 "4.117 "4.234 "4.317 4.370
"4.428 "4.496 "4.585 "4.675 "4.798 4.870
"4.971 "5.017 4.680
"4.857 "4.759 "4.890 "4.992 "5.086 "5.192 "5.284 5.390 5.424 5.524 5.600 5.670 5.730 5.835 5.860 5.892 5.903
$2,202,315,000.00 3,302,710,000.00
7,762,700.00 245,953,200.00 26,997.000.00 2.879.700.00
14.639.200.00 13.351,700.00
89.710.000.00 3.770.000.000.00
411.681.57 3.243.048.54 9,653.313.86 3,950,030.88 3.805.156.91 3,190.258.69 4,589,651.97 4,449,005.23 4,709.096.90 4,388,874.30 3,737,410.31 1,901,948.16 2,287,197.20 6,403,801.34 6,829,462.77 7,439,172.76 7,509,181.43 3,280,222.70 5,609,897.82 7,202,508.83 3,050,935.48 8,066,842.:i9 7,226,358.10 7,520,646. :il 7,914,024..'i8 8,536,234.48 8,821,794. 14 4,086,392.77
655.:!0 9,479,859.:;3 9,335.352.43 4.824,647.:i2 4.103,238.78 4,607,145.05 4,285,886.97 5,265,180.03 5,322,706.fi7
18,434,975.95
$6,511,958.32
5,507,815,000.00
-837,900.00 915,000.00
""'522^906.00 2,410,000.00
89,710,000.00 3,136,445,000.00
974,843.17 5,043,709.67 7,488,290.53 9,722,637.66 8,491.362.36 4.753,578.66 5,724,242.49 6,269,790.57 6,335,472.37 5,705,712.59 4,903,732.80 1,626,435.00 3,599,848.98 6,491,956.11 6,780,653.86 7,189,648.25 7,011,208.07
617,770.63 7,382,987.13 9,250,321.37 3,768,148.50 5,259,046.92 9,322,888.61
10,417,419.34 10,028,064.06 13,029,673.01 12,966,502.19 11,834.483.54 1,355.807.28
15.929.793.33 17.337.945.16 6.920.504.08 9.691,637.74 7,341,697.72
10,977,343.55 9,532,139.31
14,223,044.79 32,664,164.72 .
See footnotes at end of table.
Digitized for FRASER http://fraser.stlouisfed.org/ Federal Reserve Bank of St. Louis

256 1977 REPORT OF THE SECRETARY OF THE TREASURY
TABLE 35.—Issues, maturities, and redemptions of interest-bearing public debt securities, excluding Government account series,
October 1976-September 7977—Continued
Date Securities Rate of interest'
Amount issued'
Amount matured or called or
redeemed prior to maturity'
7977 Sept.30 U.S. savings bonds'—Continued
Series E-1972 Series E-1973 (January to November)... Series E-1973 (December) Series E-1974 Series E-1975 Series E-1976. -Series E-1977 Unclassified sales and redemptions Series H-1952 Series H-1953 Series H-1954 Series H-1955 Series H-1956 Series H-1957 (January) Series H-1957 (Febmary to December) . Series H-1958 Series H-1959 (January to May) Series H-1959 (June to December) Series H-1960 Series H-1961 Series H-1962 Series H-1963 Series H-1964 Series H-1965 (January to November)... Series H-1965 (December) Series H-1966 Series H-1967 Series H-1968 (January to May) Series H-1968 (June to December) Series H-1969 (January to May) Series H-1969 (June to December) Series H-1970 (January to May) Series H-1976 (June to December) Series H-i971 Series H-1972 Series H-1973 (January to November)... Series H-1973 (December) Series H-1974 Series H-1975 Series H-1976 Series H-1977 Unclassified sales and redemptions
30 Treasury notes. Series J-1981 .! Adjustments of issues"
30 Treasury notes. Series H-1980 Adjustments of issues"
30 Treasury notes, Series B-1984 Adjustments of issues"
30 Treasury notes, Series t-1979 Adjustments of issues"
30 Treasury bonds pf 1992 Adjustments of issues"
30 U.S. savings notes:" Series S-1967 Series S-1968 (January to May) Series S-1968 (June to December) Series S-1969 Series S-1970 Unclassified'"
See footnotes at end of table.
Percent
5.856 5.929 6.000 6.000 6.000 6.000 6.000
"4.053 "4.119 "4.119 "4.273 "4.379 4.450
"4.585 "4.420 4.510
"4.586 "4.627 "4.711 "4.801 "4.901 "5.002 "5.106
5.290 5.327 5.417 5.240 5.346 5.450 5.679 5.730 5.794 5.834 5.889 5.949 6.000 6.000 6.000 6.000 6.000
6'/4
6'/4
'7'/4
"d%
"I'A
$\l,101,dll.l5 17,002,770.08
-219.53 16,952,353.67 17,273,782.51 18,180,875.59
817,584,583.64 -199,784,662.61 '
40,316,000.00 846,500.00
" ""—6,(XX)'.*00
" * 35,'(XX).00
284,000.00
5,645,000.00
1,000.00
$29,827,< 29,649,( 2,900,2
37,277,] 51,709,2
103,132,1 207,222,5
-204,003,3 62,f
284,f 513,( 594,( 596,f
2,5 802,( 753,f 302,( 357,1
1,148,0 1,309.5 1.224,5 1,016,5
935,0 659,(
86,5 982,!
1,678,( 308,5 334,0
. 259,! 231,5 333,0 314,0 776,5 923,5 941,( 45,f
I.141,( 1,043,( 1,221,0
583,( 12,306,!
5.54 5.56 5.66 5.68 5.71
188,517.00 245,614.88 334,097.92 801,552.32 284,217.96
40.50 .
384,944.30 366.936.67 758,988.37
1,716.133.38 591,533.5C
Digitized for FRASER http://fraser.stlouisfed.org/ Federal Reserve Bank of St. Louis

STATISTICAL APPENDIX 257 TABLE 35.-
Date
-Issues, maturities, and redemptions of interest-bearing public debt securities, excluding Government account series,
October 1976-September 7977—Continued
Securities Rate of interest'
Amount issued'
Amount matured or called or
redeemed prior to maturity'
1977 Sept. 30
30 30 30 30
30
30 30
U.S. individual retirement bonds U.S. retirement plan bonds Depositary bonds. First Series Federal Reserve special certificate ... Treasury certificates of indebtedness, REA Series
Treasury bonds, Investment Series B-1975-80
Redeemed in exchange for \'A% Treasury notes. Series EA-1982 ...
Treasury notes. Series EA-1982 Miscellaneous
Total September .
Total fiscal 1977.
6.000 5.265 2.00 yA
$359,817.63 799,935.19
5,000.00 2,500.000.000.(0
-$2,855,211.83 286,610.77 528,000.00
5.00
2'/,
\'A 211.000.(0
1.880.000.00
211.000.00
'54,26i^5'66."ob
45,982.784.989.(4. 36.219,383,864.94
470,574,983.548.08 417,978,910,523.94
I 'For Treasury bills, average rate on bank discount is shown; for savings bonds and savings notes, f approximate yield to maturity is shown.
^ Amounts shown for savings bonds of series E and savings notes represent issue price plus accrued discount. 'Amounts shown for savings bonds of series E and savings notes represent current redemption value (issue
price plus accrued discount). • Average interest rate for combined original and additional issues. 'A t option of owner, series E bonds dated May 1, 1941, through Apr. 1, 1952, may be held and will accrue
interest for additional 30 years; bonds dated May 1, 1952. through Nov. 1, 1965. may be held and will accrue interest for additional 20 years; bonds dated on and after Dec. 1. 1965, may be held and will accrue interest for additional 10 years. At option of owner, series H bonds dated June 1, 1952, through May 1, 1959, may be held and will accrue interest for additional 20 years; bonds dated June 1, 1959, and thereafter, m.iy be held and will accrue interest for additional 10 years.
" Represents a weighted average of the approximate yield of bonds of various issue datej within the yearly series if held to maturity or if held from issue date to end of applicable extension period, coriputed on the basis ofbonds outstanding June 30, 1977. (See Treasury Circulars Nos. 653 (9th Revision) and 905 (6th Revision), as
f revised and amended, for detail of yields by issue date for series E and H savings bonds, resp<;ctively.) 'Amounts transferred from unclassified sales or redemptions to sales or redemptions oif designated series. "Adjustments of amounts originally reported on date of issue or exchange. "Redeemable after 1 year from issue date. At option of owner, savings notes may be held and will accrue
interest for additional 10 years. '0 Unclassified redemptions of savings notes are included in unclassified redemptions of series E savings bonds
beginning May 1, 1968. '»Represents a security issued directly to the Federal Reserve, as authorized by section 14(b) ofthe Federal
Reserve Act, to maximize the Treasury's operating funds prior to the expiration of the t<jmporary statutory debt limit on Sept. 30,1977.
Digitized for FRASER http://fraser.stlouisfed.org/ Federal Reserve Bank of St. Louis

T A B L E 36.—Allotments by investor class on subscriptions for marketable securities, fiscal year 1977 [In millions of dollars. On basis of subscription and allotment reports]
PART I—TREASURY BILLS OTHER THAN REGULAR WEEKLY SERIES
Amount issued Allotments by investor class
Date of financing Date of maturity Average rate (percent) 52-week
series
U.S. Goverament accounts
and Federal Reserve banks
Commercial banks
(Corporations *
Dealers and brokers All other»
t o OO
7i
^ O 7i H O
H X tfl ifi tfl
n
> 7i
O ^ H X tfl H 7i tfl > ifi
c 7i
1976
Oct. 19 Oct. 18, 1977.. Nov. 15 Nov. 15, 1977. Dec. 14 Dec. 13, 1977..
7977 Jan. 11 Jan. 10, 1978.. Feb. 8 Feb. 7, 1978... Mar. 8 Mar. 7. 1978... Apr. 5 Apr. 4. 1978... May 3 May 2, 1978... May 31 May 30, 1978.. June 28 June 27, 1978.. July 26 July 25, 1978.. Aug. 23 Aug. 22, 1978. Sept. 20 Sept. 19, 1978.
5.126 5.201 4.708
4.728 5.344 5.226 5.158 5.160 5.403 5.408 5.648 6.105 6.156
3,095 3,402 3,505
3,071 3,105 3,208 3,342 2.966 2.454 2.253 3,038 3,005 3,036
859 777 881
855 691 984 760 894 544 857 934 679 863
932 545 646
956 899
1,070 486 932 333 424 980 844 860
17 87 54
40 199 9 11 27 7 2 80 83 6
802 1,425 1,010
513 786 739
1,134 555
1,053 423 592 890
1,061
485 568 914
707 530 406 951 558 517 547 452 509 246
Digitized for FRASER http://fraser.stlouisfed.org/ Federal Reserve Bank of St. Louis

PART II—SECURITIES OTHER THAN TREASURY BILLS
Issue
Date of financing Description'
Allotments by investor class
Amount issued U.S. Govemment I ciiiiiiciii C o m - InHi
" " " sec°uri.ies - ' , : ^ - - " - " « ' ' ' '
Insurance companies
Mutual savings banks
Corporations*
Private pension and retirement
funds
State and local govemments®
Pension and retirement
funds
Other funds
Dealers and
brokers
All others '
7976
Oct. 12 7% note, Nov. 15, 1981-G Nov. 1 5'/8% note, Oct. 31, 1978-S . . . .
f d'h% note, Nov. 15, 1979-K... Nov. 15 . . . . j 7% note, Nov. 15, 1983-B
^ 7'/8% bond, Feb. 15, 1995-00" . Nov. 30 . . . . 5y4% note, Nov. 30, 1978-T.. . Dec. 7 5'/8% note, Dec. 31, 1980-F.... Dec. 31 . . . . 5%% note, Dec. 31, 1978-U .. .
7977
Jan. Feb.
Feb.
Feb. Mar. Mar. Apr. May May
May
June July
6 3
15
28 8 31.... 4 2
16....
31 .... 1 J
30.... 8
6y8% note, Feb. 15, 1982-D.... 5'/8% note, Jan. 31, 1979-L . . . . d'A% note, Feb. 15, 1980-G.... l'U% note, Feb. 15, 1984-A.... 7V8% bond, Feb. 15, 2002-07... 5'/8% note, Feb. 28, 1979-M.. . 6'/8% note, Mar. 31, 1981-H.. . 6% note, Mar. 31, 1979-N 7% note, May 15, 1982-E 5'/8% note, Apr. 30, 1979-P... . 7%% note, Feb. 15, 1984-A"... 7V8% bond, Feb. 15, 2002-07" . 6%% note, May 31, 1979-Q....
•JA 10Q1
2,543 2,823 98 3,306 70 2,259 50 1,001 2,805 136 2,692 3,124 252
2,697 2,855 3,308 2,024 752
2,695 2,809 2.996 2.613 1,882 2,910 1.004 1,897
1,300 881 391 150
523
6 % % note, June 30, 1979-R. 7V4% bond, Aug. 15, 1992...
2,044 1,504
110 2,623 900 190
' "264
1,356 98 1,307 70 1,227 50 906
313 136 1,176
1,234 252 1,168
1,385 1,156 1.704 981 138
1.001 1.276 1,249 1,376 707
1,172 140 557
1,300 881 391 150
523
110 2,623 900 190
264 607 589
88 46 67 140 31 34 43 37
54 40 100 128 51 34 70 72 83 29
276 63 58 <n 36 110
24 5 11 22 4 9 3 6
23 8
33 34 23 8 10 5 9 2 16 2 7 ^ 7 12
44 15 13 16 5 15 18 14
74 16 40 13 6 17 18 16 28 9 52 5 9
Ml.
'3 20
44 54 26 58 24 51 33 43
72 29 116 83 43 37 154 71 90 90 183 90 40 62 45 95
21 5 7 16 23 9 3 2
20 13 44 104 35 8
46 9
44 1
18 37 9 1
5 37
14 6 2 5
(•)
9 3 7
(•) (•) 2 3 3 3
98 3 1
i 1
7 23 5 10 4 6 5 3
41 6
44 16 1 4 4 2 1
(*) 11 14 9 1 c
12 5
829 775
1,025 800 589 953 861
1.035
668 899 863 640 440 804 617 562 609 484
1,024 537 661 01^
470 624
116 587 923 286
8 552 491 816
358 687 355 22
8 782 614
1,008 370 557 155
18 544
858 11
i f i H > H 00 H r5 > r >
tfl z a X
See footnotes at end of table.
to VO
Digitized for FRASER http://fraser.stlouisfed.org/ Federal Reserve Bank of St. Louis
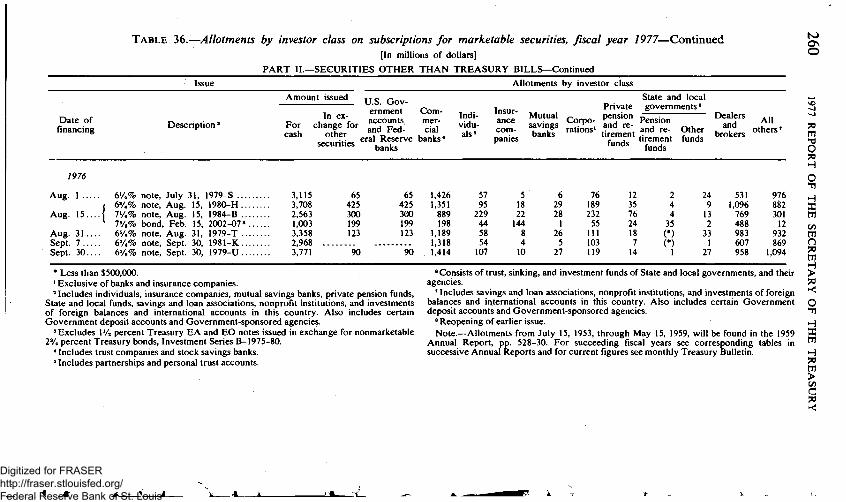
TABLE 36.—Allotments by investor class on subscriptions for marketable securities, fiscal year 1977—Continued [In millions of dollars]
PART II—SECURITIES OTHER THAN TREASURY BILLS—Continued
Issue Allotments by investor class
Amount issued
Date of financing
U.S. Govemment
Description' For cash
Y ci i i i i i&i i i C o m -
^i,o!lot^r«, accounts mer-Z l J and Fed- cial
secunties "" ^ ^ ^ ^ ^ ^ ^^"*^^* secunties ^^^^^
Individuals '
Insurance companies
Mutual savings banks
Private State and local governments"
Corporations'
P«"^'°" Pension and retirement
funds
and retirement
funds
Other funds
Dealers and
brokers
All others'
to
o
7i tfl ^ O 70 H
O
H X tfl ifi tfl O 7^ tfl H > 7i >< O
H X tfl H 73 tfl > ifi
a 70
1976
Aug. 1 6'/4% note, July 31. 1979-S . . . . ( 6'/,% note. Aug. 15. 1980-H.. .
Aug. 15 . . . . { 7V4% note, Aug. 15, 1984-B. . . ^ 7»/8% bond, Feb. 15, 2002-07".
Aug. 3 1 . . . . 6'/8% note, Aug. 31, 1979-T. . . Sept. 7 6V4% note, Sept. 30. 198l-K. . . Sept. 30 . . . . 6y9% note. Sept. 30. 1979-U...
3.115 3.708 2.563 1.003 3.358 2.968 3.771
65 425 300 199 123
65 425 300 199 123
90 90
1.426 1.351 889 198
1.189 1.318 1,414
57 95 229 44 58 54 107
5 18 22 144 8 4 10
6 29 28 1
26 5
27
76 189 232 55 111 103 119
12 35 76 24 18 7 14
2 4 4 35 (•)
(•)
1
24 9 13 2 33 1
27
531 1,096 769 488 983 607 958
976 882 301 12
932 869
1.094
* Less than $500,000. ' Exclusive of banks and insurance companies. ' Includes individuals, insurance companies, mutual savings banks, private pension funds.
State and local funds, savings and loan associations, nonprofit institutions, and investments of foreign balances and international accounts in this country. Also includes certain Goverament deposit accounts and Goverament-sponsored agencies.
' Excludes 1 'A percent Treasury EA and EO notes issued in exchange for nonmarketable 2'/4 percent Treasury bonds. Investment Series B-1975-80.
• Includes trust companies and stock savings banks. ' Includes partnerships and personal trust accounts.
" Consists of tmst, sinking, and investment funds of State and local goveraments, and their agencies.
' Includes savings and loan associations, nonprofit institutions, and investments of foreign balances and interaational accounts in this country. Also includes certain Goverament deposit accounts and Goverament-sponsored agencies.
" Reopening of earlier issue. Note.—Allotments from July 15, 1953, through May 15. 1959. will be found in the 1959
Annual Report, pp. 528-30. For succeeding fiscal years see corresponding tables in successive Annual Reports and for current figures see monthly Treasury Bulletin.
_ ^ 5_
Digitized for FRASER http://fraser.stlouisfed.org/ Federal Reserve Bank of St. Louis
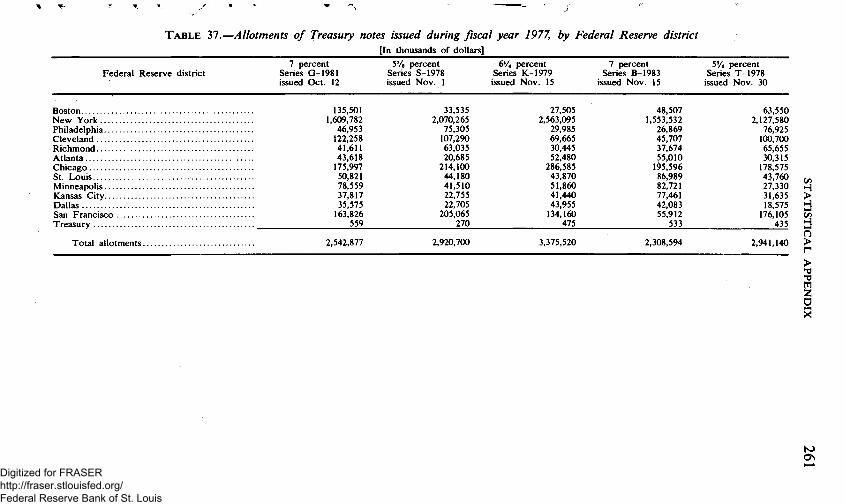
TABLE 37.—Allotments of Treasury notes issued during fiscal year 1977, by Federal Reserve district [In thousands of dollars]
Federal Reserve district 7 percent
Series G-1981 issued Oct. 12
5'/8 percent Series S-1978 issued Nov. 1
6'/4 percent Series K-1979 issued Nov. 15
7 percent Series B-1983
issued Nov. 15
5V4 percent Series T-1978
issued Nov. 30
Boston. New York Philadelphia Cleveland Richmond Atlanta Chicago St. Louis Minneapolis Kansas City Dallas San Francisco Treasury
Total allotments
135.501 1.609.782
46.953 122.258 41.611 43.618 175.997 50.821 78.559 37.817 35.575 163,826
559
2,542.877
33.535 2.070.265
75,305 107,290 63,035 20,685
214,100 44,180 41,510 22,755 22,705
205,065 270
2,920,700
27,505 2,563,095
29,985 69,665 30,445 52,480
286,585 43,870 51,860 41,440 43,955 134,160
475
3,375,520
48,507 1,553,532
26,869 45,707 37,674 55,010 195,596 86,989 82,721 77,461 42,083 55,912 533
2,308,594
63,550 2,127,580
76,925 100,700 65,655 30,315 178,575 43,760 27,330 31,635 18,575
176,105 435
2.941,140
H > H ifi
H
r >
i X
to ON
Digitized for FRASER http://fraser.stlouisfed.org/ Federal Reserve Bank of St. Louis

TABLE 37.—Allotments of the Treasury notes issued during fiscal year 1977, by Federal Reserve district—Continued [In thousands of dollars]
Federal Reserve district S'/s percent
Series F-1980 issued Dec. 7
S'A percent Series U-1978 issued Dec. 31
6V8 percent Series D-1982 issued Jan. 6
5'/8 percent Series L-1979 issued Feb. 3
d'A percent Series G-1980 issued Feb. 15
t o ON t o
Boston New York Philadelphia Cleveland Richmond Atlanta Chicago St. Louis Minneapolis Kansas City Dallas San Francisco Treasury
Total allotments.
42,472 1,694,130 138,156 79,446 50,535 75,975
224,699 66,986 61,619 48,595 49,608 159,570
229
37,165 2,579,100
39,310 64,220 38,425 20,060 308,855 27,420 42,180 36.185 53,235 129,930
240
45,482 1,505,370
39,080 109,532 80,694 160,081 222,728 79,557 81,048 94,985 67,631
211,153 69,
112,995 2,094,875
90,550 144,425 23,220 44,290 105,710 53,380 22,525 31.215 25,490 105,735
145
2,692,020 3,376,325 2,697,410 2,854,555
Federal Reserve district 7'/4 percent
Series A-1984 issued Feb. 15
S'/s percent Series M-1979 issued Feb. 28
6'/8 percent Series H-1981 .issued Mar. 8
6 percent Series N-1979
issued Mar. 31
53,930 3,217,600
71,850 193,820 82,245 81,275
355,980 83,940 82,615 87,390 58,430
238,035 940
4,608,050
7 percent Series E-1982 issued Apr. 4
7i tfl
S 70 H O
tfl ifi
? 70
O ^ H X tfl
^ tfl > ifi G po ><
Boston. New York Philadelphia Cleveland Richmond Atlanta Chicago S t Louis Minneapolis Kansas City Dallas San Francisco Treasury
Total allotments.
99,517 1,997,871
31,367 152,013 65,385 55,125 152,490 75,173 35,450 52,501 24,938 162,237
1.063
28,940 2,113,400
25,090 63,805 48,080 68,820
312,620 34,065 31,085 30,770 36,955 50,935
625
17,527 1,947,941
22,888 339,624 21,874 26,826 162,723 40,710 43,534 44,268 17,349
123,800 417
74,625 2,623,735
43,195 46,020 70.455 62,335
. 177,900 28,930 48.015 38,565 23,545
280,940 365
29,465 1,904,090
21,524 110,645 13,833 28.664
226,815 36,762 52,487 35,506 58,160 94,549
383
2,905,130 2,845,190 2.809,481 3,518,625 2,612,883
' . . i ^ .-m^
Digitized for FRASER http://fraser.stlouisfed.org/ Federal Reserve Bank of St. Louis
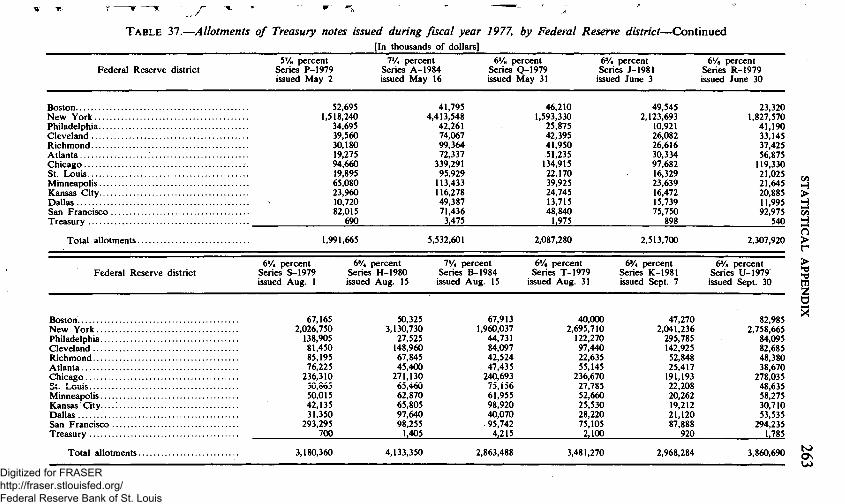
TABLE 37.—Allotments of Treasury notes issued during fiscal year 1977, by Federal Reserve district-[In thousands of dollars]
Federal Reserve district 5'/8 percent
Series P-1979 issued May 2
7V4 percent Series A-1984 issued May 16
d'A percent Series Q-1979 issued May 31
6y4 percent Series J-1981
issued June 3
-Continued
d'A percent Series R-1979 issued June 30
Boston New York Philadelphia Cleveland Richmond Atlanta Chicago St. Louis Minneapolis Kansas City Dallas San Francisco Treasury
Total allotments.
52,695 1.518,240
34,695 39,560 30,180 19,275 94,660 19,895 65,080 23,960 10,720 82,015
690
1,991,665
41,795 4,413,548
42,261 74,067 99,364 72,337
339,291 95,929 113,433 116.278 49,387 71,436 3.475
5,532.601
46,210 1.593,330
25,875 42,395 41,950 51,235 134,915 22,170 39,925 24,745 13,715 48,840 1,975
2,087,280
49,545 2,123,693
10,921 26,082 26,616 30,334 97,682 16,329 23,639 16,472 15.739 75,750
898
2,513,700
Federal Reserve district 6V4 percent
Series S-1979 issued Aug. 1
6'/4 percent Series H-1980 issued Aug. 15
7V4 percent Series B-1984
issued Aug. 15
6y8 percent Series T-1979
issued Aug. 31
6V4 percent Series K-1981 issued Sept. 7
23,320 1,827.570
41.190 33.145 37.425 56.875
119,330 21,025 21,645 20,885 11,995 92,975
540
2,307,920
dPA percent Series U-1979 issued Sept. 30
ifi
H
H Ci > r > tfl z o
Boston New York Philadelphia Cleveland Richmond Atlanta Chicago C i . T : _
01. r^vjuis Minneapolis Kansas Ci ty— Dallas San Francisco Treasury
Total allotments.
67.165 >,026.750 138,905 81,450 85,195 76,225
236,310 50,865 50,015 42,135 31,350
293,295 700
50,325 3,130,730
27,525 148,960 67,845 45,400
271,130 65,460 62,870 65,805 97,640 98,255 1.405
67,913 1,960,037
44,731 84,097 42,524 47,435
240,693 75,156 61,955 98,920 40,070 95,742 4.215
40.000 2.695,710 122,270 97,440 22.635 55.145
236,670 27.785 52.660 25.530 28.220 75,105 2.100
47,270 2.041,236 295,785 142,925 52,848 25,417 191,193 22,208 20,262 19,212 21,120 87,888
920
82,985 2,758,665
84,095 82,685 48,380 38,670
278.035 48,635 58,275 30,710 53,535
294,235 L785
3,180,360 4,133,350 2,863,488 3,481,270 2,968,284 3,860,690 to ON
Digitized for FRASER http://fraser.stlouisfed.org/ Federal Reserve Bank of St. Louis

TABLE 38.-
Federal Reserve district
-Allotments of Treasury bonds issued during fiscal year 1977, by Federal Reserve district [In thousands of dollars]
7'/8 percent of 1995-2000 issued
Nov. 15
7V8 percent of 2002-2007 issued
Feb. 15
VA percent of 2002-2007 issued
May 16
I'A percent of 1992 issued
July 8
7'/8 percent of 2002-2(X)7 issued
Aug. 15
to ON
Boston. New York Philadelphia Cleveland Richmond Atlanta Chicago St. Louis Minneapolis Kansas City Dallas San Francisco Treasury
Total allotments.
39,688 848,666
2,044 8,525 4,744 4,719
29,119 22,632
3.717 8,214 1,376
27,510 335
12,168 1,018,657
2,316 1,970
15,241 9,378
28,958 16,388 3.365 5.333 7.179
22,266 240
3.544 1.786.664
2,578 6.114 5.607 4.906
12.970 12.079 12,730 4.030 3.962
47.445 802
1.001.289 1.143.459 1.903.431
24.439 1.109,948
27.683 21,260 26,523 41.120 71.270 36.534 24,196 21,847 16,285 82,981
308
1,504,394
3,554 1,076,828
4,435 9,680 7,043
28,549 15,948 16,366 15,951 6,854 2.111
13.796 1,037
1,202,152
7i tfl hd O 7i H O
H X tfl ifi tfl O 7i
> Ti
O ^ H X tfl H 7i tfl > ifi C 70
NOTE.—All issues were sold at auction.
. : ^ ^ -
Digitized for FRASER http://fraser.stlouisfed.org/ Federal Reserve Bank of St. Louis

Date of issue
TABLE 39.—Summary of information pertaining to Treasury bills issued during fiscal year 1977 [Dollar amounts in thousands]
Date of maturity
Days to
maturity'
Maturity value
Total applied for
Tenders accepted
Total accepted
On On noncompetitive competitive
basis basis
Prices and rates
Total bids accepted High Low Amount maturing on issue
^A^l^Sr ^wlr!i l"^ Price per Equivalent Price per Equivalent date of new rate hundred rate offering
REGULAR WEEKLY
1976 Oct. 1 ..
7... 14... 14... 21. . . 21. . . 28... 28...
Nov. 4 . . 4...
12... 12... 18... 18... 26... 26...
Dec. 2 .. 2... 9... 9...
16... 16... 23... 23... 30... 30...
7977
Jan.
Jan. 6 . . . Apr. 7 .. Jan. 13.. Apr. 14. Jan. 20.. Apr. 21. Jan. 27.. Apr. 28. Feb. 3. . . May 5 .. Feb. 10. May 12. Feb. 17 . May 19. Feb. 24 . May 26. Mar. 3 .. June 2 .. Mar. 10. June 9 .. Mar. 17. June 16. Mar. 24. June 23. Mar. 31. June 30.
7977
Apr. 7 .. July 7... Apr. 14. July 14.. Apr. 21 .
91 182 91 182 91 182 91 182 91 182 90 181 91 182 90 181 91 182 91 182 91 182 91 182 91 182
91 182 91 182 91
$3,923,070 8.139.795 5.424.920 5.728,945 4.580.640 6,688,070 4,242,230 5.541,050 4.711.075 9.234.005 4.811.880 6,875,730 5,627,770 7,022.255 4,527.015 6.530,575 5,499,405 6.407,260 4.570,125 7.368.270 4.559.895 5.792,535 4,255,445 6.481,555 ±n\f.Q^^ 6,896.515
4.220.580 5.408.805 4.639.100 6.377,365 4.749.685
$2,507,345 3.506.085 2.407,860 3.508.310 2.402,915 3.401.500 2.503.850 3,501,270 2,604.625 3.710.360 2,603,915 3.702.200 2.500.720 3.502,295 2.602.050 3.600,815 2.507,490 3.506.370 2.305.740 3.404,460 2.104,170 3,202,275 2.110,380 3.103.365 T IOA a7<
3.403,170
2.506.580 3,502,880 2,412.155 3,500.970 2.402,610
$2,222,550 3,350,025 2,020,950 3,332,290 2,057,485 3,246,230 2,234,300 3,397,605 2,271,380 3,574,525 2,313,695 3,564,230 2,115,585 3.332.250 2,281.015 3,456.110 2.183.560 3.380.240 1.984.300 3.258.615 1.765.645 3.067.290 1.865.900 2.995,240 0 n77 f.fJ\
3,283,575
2,216,165 3.381.455 2,045.825 3.350.885 2.088.570
$284,795 156.060 386.910 176.020
. 345.430 155.270 269,550 103,665 333,245 135,835 290.220 137.970 385.135 170.045 321,035 144.705 323.930 126.130 321.440 145.845 338.525 134.985 2 H 4 8 0 108.125 269 215 119.595
290.415 121.425 366.330 150.085 314,040
98.714 97.338 98.760 97.460 98.787 97.517 98.754 97.425 98.771 97.457 98.777 97.464 98.764 97.463 98.851 97.646 98.871 97.691 98.892 97.717 98.898 97.721 98.921 97.725 98 914 97.738
98.886 97.697 98.834 97.572 98.820
Percent 5.088 5.266 4.905 5.025 4.799 4.911 4.930 5.094 4.862 5.030 4.892 5.044 4.890 5.018 4.596 4.682 4.466 4.568 4.383 4.516 4.360 4.508 4.269 4.500 4.296 4.474
4.407 4.555 4.613 4.803 4.668
98.719 »97.342 98.765 97.474
»98.795 = 97.524 98.761 97.436 98.776
»97.461 98.783 97.475 98.773 97.473 98.862
»97.658 98.875 97.699 98.899 97.721 98.900 97.733 98.930 97.735
''98.923 »97.745
»98.896 97.711 98.839 97.579
=» 98.828
Percent 5.068 5.258 4.886 4.996 4.767 4.898 4.902 5.072 4.842 5.022 4868 5.022 4.854 4.998 4552 4.658 4.451 4.551 4.356 4508 4.352 4.484 4.233 4.480
4.460
4.367 4.528 4.593 4789 4.636
98.711 97.337 98.757 97.450 98.784 97.513 98.752 97.419 98.770 97.453 98.773 97.458 98.763 97.457 98.845 97.640 98.871 97.687 98.889 97.716 98.895 97.712 98.916 97.718 98.911 97.732
98.881 97.691 98.833 97.568 98.818
Percent 5.099 5.267 4.917 5.044 4.811 4.919 4937 5.105 4866 5.038 4.908 5.056 4.894 5.030 4.620 4.694 4.466 4575 4395 4518 4.371 4526 4288 4514 4.308 4486
4.427 4567 4.617 4.811 4676
$2 50.'.050 3,..01.675 2,513.850 3,402.555 2,400,990 3.404,075 2,502.175 3.501,585 2,701,155 3,601.150 2.701,945 3,601.895 2.503,380 3,502,770 2.603.160 3,602.350 2.502,030 3.502.685 2.306.290 3.399.485 2,104,165 3,202,500 2,104,210 3,102,585 2,304,510 3,402,030
2,507,345 3,506,530 2,407,860 3,503,335 2,402,915
H > H C/) H O > r > ^ tfl
z X
to 0^ KJ\
See footnotes at end of table. Digitized for FRASER http://fraser.stlouisfed.org/ Federal Reserve Bank of St. Louis
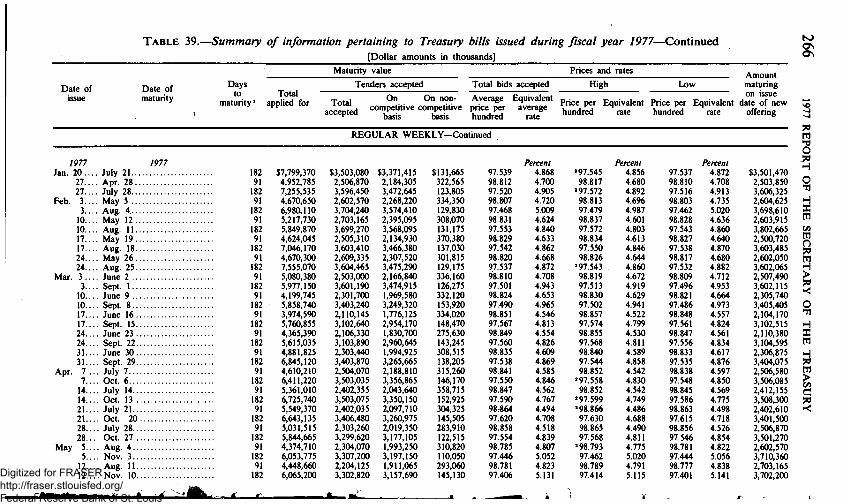
T A B L E 39.—Summary of information pertaining to Treasury bills issued during fiscal year 1977—Continued [Dollar amounts in thousands]
Maturity value Prices and rates
Date of issue
Date of maturity
Days to
maturity' Total
applied for
Tenders accepted High Low
Total accepted
On Chi noncompetitive competitive
basis basis
Total bids accepted
P ^ ^ T r ^ v t r i f Price per Equivalent Price per ^ u ' d r S r a ^ hundred ra.e hundred
Amount maturing on issue
Equivalent date of new rate offering
t o ON 0 \
70 tfl
s .7i H O
H X tfl ifi tfl O 7i
> 7i
O ^ H X tfl
ifi C 70 ><
REGULAR WEEKLY—Continued
Feb.
Mar.
1977 Jan. 20. .
27... 27...
3. . 3..
10.. 10.. 17.. 17.. 24.. 24.. 3 . . 3..
10.. 10.. 17.. 17.. 24.. 24.. 31.. 31..
7 . 7..
14.. 14.. 21.. 21.. 28.. 28..
5.. 5..
12.. 12..
Apr.
May
^JttMte
7977 Percent Percent Percent July 21 182 $7,799,370 $3,503,080 $3,371,415 $131,665 97.539 4.868 »97.545 4.856 97.537 4.872 $3,501,470 Apr. 28 91 4,952,785 2,506,870 2,184,305 322,565 98.812 4.700 98.817 4.680 98.810 4.708 2,503,850 July 28 182 7,255,535 3,596,450 3,472,645 123,805 97.520 4.905 »97.572 4.892 97.516 4.913 3,606,325 M a y 5 91 4,670,650 2,602,570 2,268,220 334,350 98.807 4.720 98.813 4.696 98.803 4.735 2.604.625 Aug. 4 182 6.980.110 3.704.240 3.574,410 129,830 97.468 5.009 97.479 4.987 97.462 5.020 3,698,610 M a y 12 91 5,217,730 2,703,165 2,395,095 308,070 98.831 4.624 98.837 4.601 98.828 4.636 2,603,915 Aug. 11 182 5,849,870 3,699,270 3,568,095 131,175 97.553 4.840 97.572 4.803 97.543 4.860 3,802,665 M a y 19 91 4,624,045 2,505,310 2,134,930 370,380 98.829 4.633 98.834 4.613 98.827 4.640 2,500,720 Aug. 18 182 7,046,170 3,603,410 3,466,380 137,030 97.542 4.862 97.550 4.846 97.538 4.870 3,603,485 M a y 26 91 4,670,300 2,609,335 2,307,520 301,815 98.820 4.668 98.826 4.644 98.817 4.680 2,602,050 Aug. 25 182 7,555,070 3,604,465 3,475,290 129,175 97.537 4.872 »97.543 4.860 97.532 4.882 3,602,065 June 2 91 5,080,380 2,503,000 2,166,840 336,160 98.810 4.708 98.819 4.672 98.809 4.712 2,507,490 Sept. 1 182 5,977.150 3.601.190 3,474,915 126,275 97.501 4.943 97.513 4.919 97.496 4.953 3,602,115 June 9 91 4,199,745 2,301,700 1,969,580 332,120 98.824 4.653 98.830 4.629 98.821 4.664 2,305,740 Sept. 8 182 5,858,740 3,403.240 3.249.320 153,920 97.490 4.965 97.502 4.941 97.486 4.973 3,405,405 June 16 91 3,974,590 2,110,145 1,776,125 334,020 98.851 4.546 98.857 4.522 98.848 4.557 2,104,170 Sept. 15 182 5,760,855 3,102,640 2,954,170 148,470 97.567 4.813 97.574 4.799 97.561 4.824 3,102,515 June 23 91 4,365.390 2.106.330 1,830,700 275,630 98.849 4.554 98.855 4.530 98.847 4.561 2,110,380 Sept. 22 182 5,615,035 3,103,890 2,960,645 143,245 97.560 4.826 97.568 4.811 97.556 4.834 3,104,595 June 30 91 4,881,825 2,303,440 1,994.925 308.515 98.835 4.609 98.840 4.589 98.833 4.617 2.306.875
, Sept. 29 182 6,845,120 3,403,870 3,265,665 138.205 97.538 4.869 97.544 4.858 97.535 4.876 3,404.075 , July 7 91 4.610,210 2,504,070 2,188,810 315,260 98.841 4.585 98.852 4.542 98.838 4.597 2,506,580 . Oct. 6 182 6,411,220 3,503,035 3,356,865 146,170 97.550 4.846 '97.558 4.830 97.548 4.850 3,506,085 . July 14 91 5,361,010 2,402,355 2,043,640 358,715 98.847 4.562 98.852 4.542 98.845 4.569 2,412,155 , Oct. 13 182 6,725,740 3,503,075 3,350,150 152,925 97.590 4.767 "97.599 4.749 97.586 4.775 3,508,300 . July 21 91 5,549,370 2.402.035 2.097.710 304.325 98:864 4.494 »98.866 4.486 98.863 4.498 2.402,610 Oct. 20 182 6,643.135 3.406.480 3.260.975 145.505 97.620 4.708 97.630 4.688 97.615 4.718 3.401.500
. July 28 91 5.031,515 2,303,260 2,019,350 283,910 98.858 4.518 98.865 4.490 98.856 4.526 2,506,870
. Oct. 27 182 5,844,665 3,299,620 3,177,105 122,515 97.554 4.839 97.568 4.811 97.546 4.854 3,501,270
. Aug. 4 91 4,374,710 2,304,070 1,993,250 310,820 98.785 4.807 »98.793 4.775 98.781 4.822 2,602,570
. Nov. 3 182 6,053,775 3,307,200 3,197,150 110,050 97.446 5.052 97.462 5.020 97.444 5.056 3,710,360
. Aug. 11 91 4,448,660 2,204,125 1,911,065 293.060 98.781 4.823 98.789 4.791 98.777 4.838 2,703.165
. Nov. 10 182 6.065.200 3,302,820 3,157,690 145,130 97.406 5.131 97.414 5.115 97.401 5.141 3,702,200
L ^ • -'" . A - . ^ m ^ . k^ \ ^ _ -
Digitized for FRASER http://fraser.stlouisfed.org/ Federal Reserve Bank of St. Louis

19... 19... 26... 26...
June 2.. 2.. 9.. 9.. 16.. 16.. 23.. 23.. 30.. 30..
July 7.. 7.. 14.. 14.. 21.. 21.. 28.. 28..
Aug. 4. 4.. 11.. 11.. 18.. 18.. 25.. 25..
Sept. 1. 1..
15.. 15.. 22..
29.. 29..
Aug. 18 Nov. 17 Aug. 25 Nov. 25 Sept. 1 Dec. 1 Sept. 8 Dec. 8 Sept. 15 Dec. 15 Sept. 22 Dec. 22 Sept. 29 Dec. 29 Oct. 6 Jan. 5, 1978... Oct. 13, 1977.. Jan. 12, 1978.. Oct. 20, 1977.. Jan. 19, 1978.. Oct. 27, 1977.. Jan. 26, 1978 ..
, Nov. 3, 1977.. , Feb. 2, 1978... . Nov. 10, 1977. . Feb. 9, 1978... . Nov. 17, 1977. . Feb. 16, 1978.. . Nov. 25, 1977. . Feb. 23, 1978.. . Dec. 1, 1977 .. . Mar. 2, 1978 .. . Dec. 8, 1977 .. . Mar. 9, 1978 .. . Dec. 15, 1977 . . Mar. 16, 1978 . . Dec. 22, 1977 . . mar. 23, 1978 . . Dec. 29, 1977 . . Mar. 30. 1978 .
91 182 91 183 91 182 91 182 91 182 91 182 91 182 91 182 91 182 91 182 91 182 91 182 91 182 91 182 92 182 91 182 91 182 91 182 91
lOiC
91 182
4.636.295 6.288.250 4.032.780 6.504.835 4.055.805 5.486.760 4.016.425 6.336.845 4,059.580 5.205.815 3.751.180 4,987,285 4,193,970 6,347,425 3,752,705 5,809,260 4,379,115 5,820,830 4,220,695 6,627,400 3.973,360 6,035.790 4.306.770 7.059,275 4,702.055 6.348.680 4.039.145 5,658,460 4.032.585 6,363,315 4,617.795 7.617.540 4,016.700 6,571,575 4.082.885 6.014,535 5,678,080 5,684,650 4,647,255 5,825.055
2.103.420 3.202.880 2.099.415 3.201.400 2.004.485 3.101.770 2.006,785 3.002.035 2.003,090 3,001,265 2,000,085 3,001,285 2,103,945 3,200.905 2.303.085 3.305.460 2.203.275 3.403.830 2.300.995 3.407,515 2,403,115 3,500,995 2,402,695 3,599,195 2,403,185 3,503,930 2,307,345 3.402,640 2,303,505 3,403,525 2,300,675 3,304,365 2,208,060 3,203,110 2,514,885 3,376,735 2,506,985 J,JU^,UJU
2,202,315 3,302,410
1,765,170 3,066,295 1,789,510 3,064,175 1,690,310 2,990,455 1,659,395 2,874,450 1,675,770 2,874,685 1,736,175 2,900,720 1,799,245 3,067,890 2,025,560 3,183,050 1,867,665 3,263,705 2,014,980 3,263,145 2,118,750 3,372,435 2.104.725 3.470.890 2.096.870 3,374.645 1.971.300 3.260.330 1.993.545 3,244.410 1.982,410 3,154.035 1.898.540 3.066.075 2.191.990 3,207.450 2.193.775 J.Jtl.J/.U
1.869.885 3.138.105
338.250 136,585 309,905 137,225 314,175 111,315 347,390 127,585 327,320 126,580 263,910 100,565 304,700 133,015 277,525 122,410 335,610 140,125 286,015 144,370 284,365 128,560 297,970 128,305 306,315 129,285 336,045 142,310 309,960 159,115 318,265 150,330 309,520 137,035 322,895 169,285 313,210 160,730 332,430 164,305
98.737 97.354 98.700 97.279 98.738 97.375 98.724 97.354 98.736 97.388 98.733 97.360 98.745 97.385 98.725 97.348 98.695 97.292 98.682 97.252 98.695 97.288 98.629 97.123 98.647 97.129 98.567 96.978 98.581 97.022 98.591 97.043 98.596 97.045 98.512 96.917 98.521 96.979 98.488 96.873
4.996 5.234 5.142 5.353 4.993 5.192 5.047 5.234 5.000 5.166 5.013 5.222 4.965 5.172 5.045 5.246 5.162 5.357 5.214 5.436 5.162 5.364 5.424 5.690 5.353 5.679 5.670 5.977 5.552 5.891 5.575 5.849 5.554 5.845 5.887 6.098 5.851 5.976 5.981 6.185
"98.741 97.361 98.704
"97.285 98.746 97.387 98.731 97.361 98.740 97.397
"98.739 97.375 98.749 97.395
"98.731 97.357
"98.699 "97.301 98.689 97.259 98.703 97.296 98.638 97.133 98.655 97.141 98.593
"97.000 98.604
"97.033 98.599
"97.049 98.604
"97.051 "98.524 96.933 98.525 70.77/
98.496 96.890
4981 5.220 5.127 5.341 4.961 5.169 5.020 5.220 4.985 5.149 4.989 5.192 4.949 5.153 5.020 5.228 5.147 5.339 5.186 5.422 5.131 5.349 5.388 5.671 5.321 5.655 5.566 5.934 5.463 5.869 5.542 5.837 5.523 5.833 5.839 6.067 5.835 5.940 5.950 6.152
98.736 97.349 98.694 97.276 98.733 97.370 98.722 97.350 98.733 97.383 98.729 97.354 98.742 97.381 98.718 97.341 98.691 97.285 98.678 97.250 98.692 97.284 98.625 97.120 98.643 97.124 98.561 96.973 98.571 97.015 98.588 97.040 98.593 97.042 98.502 96.908 98.519 96.97 i 98.486 96.868
5.000 5.244 5.167 5.359 5.012 5.202 5.056 5.242 5.012 5.176 5.028 5.234 4.977 5.180 5.072 5.260 5.178 5.370 5.230 5.440 5.175 5.372 5.440 5.697 5.368 5.689 5.693 5.987 5.592 5.904 5.586 5.855 5.566 5.851 5.926 6.116 5.859 3.7>1
5.989 6.195
2,505,310 3,502,295 2,609,335 3,600,815 2,503,000 3,506,370 2,301,700 3,404,460 2,110,145 3,202,275 2,106,330 3,103,365 2,303,440 3,403,170 2,504,070 3,502,880 2,402,355 3,500,970 2,402,035 3,503,080 2.303.260 3.596.450 2.304.070 3.704.240 2,204.125 3.699.270 2.103.420 '3,603.410 2.099.415 3.604.465 2.004.485 3.601,190 2,006,785 3,403,240 2,003,090 3,102,640 2,000,085 j,iuj,oyu
2,103.945 3,403.870
H > H in H o > r > ^ ^ tfl z 2 X
See footnotes at end of table.
to ON -o
Digitized for FRASER http://fraser.stlouisfed.org/ Federal Reserve Bank of St. Louis

T A B L E 39.—Summary of information pertaining to Treasury bills issued during fiscal year 1977—Continued [Dollar amounts in thousands]
Maturity value Prices and rates
Date of issue
Date of maturity
Days to
maturity' Total
applied for
Tenders accepted Total bids accepted High Low
Total accepted
On On noncompetitive comj)etitive
basis basis
Average price per hundred
Equivalent average
rate
Price per hundred
Equivalent rate
_ Amount maturing on issue
Price per Equivalent date of new hundred rate offering
to ON oo
52 WEEK 7i tfl ^ O 70 H
O
H X tfl ifi tfl o 73 tfl H > po
O ^ H X tfl
H 70 tfl > ifi C 70
1976 1977 Percent Percent Oct. 19.... Oct. 18 364 $5,248,460 $3,095,140 $3,036,700 $58,440 94.817 5.126 94.840 5.103 Nov. 15.. . Nov. 15 365 5.376,090 3,401,740 3,340,020 61,720 94.727 5.201 "94.738 5.190 Dec. 14. . . Dec. 13 364 6,939,300 3,504,600 3,435.885 68.715 95.240 4.708 "95.258 4.690
7977 1978 Jan. 11 . . . . Jan. 10 364 7,053,160 3,070,660 2,996.890 73,770 95.219 4.728 "95.231 4.717 Feb. 8 . . . . . Feb. 7 364 5,909,820 3,105,470 3,047,120 58.350 94.596 5.344 "94.617 5.324 Mar. 8 Mar. 7 364 6,264,805 3.208,270 3,145,750 62.520 94.716 5.226 94.742 5.200 Apr. 5 Apr. 4 364 6,986,160 3,342,455 3.286.060 56.395 94.785 5.158 "94.797 5.146 May 3 May 2 364 6,195,855 2.966,135 2,909,380 56.755 94.780 5.163 94.804 5.139
31 30 364 4,971,300 2,454,330 2,400.445 53.885 94.537 5.403 94.540 5.400 June 28.... June 27 364 5,478,295 2.252,925 2,198,555 54.370 94.532 5.408 "94.540 5.400 July 26. . . . July 25 364 5,901.055 3,037,575 2.981,670 55,905 94.290 5.648 94.317 5.621 Aug. 23 . . . Aug. 22 364 6,144,845 3,004,675 2,933.795 70.880 93.827 6.105 "93.834 6.098 Sept. 20. . . Sept. 19 364 5.247.050 3.035,920 2.947,970 87.950 93.776 6.156 "93.804 6.128
94.803 94.718 95.218
95.210 94.584 94.707 94.779 94.763 94.529 94.526 94.280 93.822 93.769
Percent 5.140 5.210 4729
4737 5.356 5.235 5.164 5.179 5.411 5.414 5.657 6.110 6.163
$3,061,880 3,244,555 3,253,145
3,068,750 2,930,390 3.104,915 3,202,725 3,335,470 2,921,370 2,611,625 2,976,525 2,952,615 2,917,285
SPECIAL
1976
Dec. 10 ..
1977
Apr. 6... June 1... Sept. 6 ..
6 . .
7977
Apr. 21
Apr. 21 June 16 Sept! 15
22
132 $4,699,900 $2,005,600 $1,972,705 $32,895
15 14,940,000 9 9,460,000 9 4,316,000
16 5,278,000
4,505,920 4.505,920 2,002.250 2,002,250
901,040 901,040 902,800 902.800
98.369
99.807 99.869 99.856 99.744
Percent
4.449
4.638 5.222 5.764 5.761
Percent
98.379 4.421
"99.809 "99.870 99.858 99.747
4.584 5.200 5.680 5.693
Percent
98.360 4.473
99.805 4.680 99.869 . 5.240 99.855 5.800 99.743 5.783
'The 90-. 91-, and 92-day bills are additional issues of bills with an original maturity of press release announcing results of auction. 3 days before date ofissue. 181. 182. or 183 days.
" Relatively small amounts of bids were accepted at a price or prices somewhat above the high shown. However, the higher price or prices are not shown in order to prevent an appreciable discontinuity in the range (covered by the high to the low prices shown) which would make it misrepresentative.
NOTE.—The usual timing with respect to weekly issues of Treasury bills is: Press release inviting tenders. 9 days before date.^issue; and closing date for the receipt of tenders and
i i n • 1 r ' ^ 1 r . .^ ^
Figures are final and may differ from those shown in the press release announcing preliminary results.
For each issue of regular weekly and 52-week bills, noncompetitive tenders in the amount of $5(X),0(X) or less from any one bidder were accepted in full at the average price of accepted competitive bids.
All equivalent rates of discount are on a bank discount basis. Digitized for FRASER http://fraser.stlouisfed.org/ Federal Reserve Bank of St. Louis

STATISTICAL APPENDIX 269 TABLE 40.—Statutory debt retirements, beginning fiscal year 1918
[In thousands of dollars. On basis of par amounts and of daily Treasury statem(mts through 1947. and on basis of Public Debt accounts thereafter; see "Basis of Tables"]
Cumu-Fiscal lative year sinking
fund
Repayments of foreign
debt
Bonds and
notes re
ceived for
estate taxes
Bonds received for loans
from Public Works
Administration
Franchise tax receipts. Federal Reserve
banks
Payments from net earaings Federal inter
mediate credit banks
Commodity Credit Corporation capital repayments
Miscellaneous
gifts, forfeitures, etc.
Total
-35 1918 1936... 1937... 1938... 1939... 1940... 1941... 1942... 1943... 1944... 1945... 1946... 1947... 1948... 1949... 1950... 1951... 1952... 1953... 1954... 1955... 1956... 1957... 1958... 1959... 1960... 1961.. . 1962... 1963... 1964... 1965... 1966... 1967... 1968... 1969... 1970... 1971... 1972... 1973... 1974... 1975... 1976... T.Q.. . : 1977...
Total.
5.349,836 403.238 103,815 65.116 48,518
128,349 37,011 75,342
3,460 — 1
746,636 7,498 1,815
839 551 241
762,627
—57
1,000,000
1,579,132 66,278
142 210 120
149.809 2,505
8,095 134
1,321 668
8,028
1.501 685 548 315
1.634 178 261 394 300 285 387 231 462 139
25,364 18,393
45,509
48,943
' 15,954 1
14 139 12 16 16 5 4 3 2 4
(') '209,828
'81 '690
•1,000 '58,000
"73,100 '12,336
7,163, 403, 103, 65, 58,
129, 64, 94,
3,
,514 ,240 ,971 ,465 ,246 ,184 ,260 ,722 463
2 2 4
1,011, 7,
51, 1,
763,
,636 ,758 ,709 ,232 851 526 387 231 ,089 139
-57
1,000,000 1,000
58,000
73,100 12,336
8,734,833 1,579.605 66,278 18,246 149,809 9.825 138.209 371.205 11.068.011
'Includes $4,842,066.45 written off the debt Dec. 31. 1920. for fractional currency estimated to have been lost or destroyed in circulation.
"Beginning with 1947. bonds acquired through gifts, forfeitures, and estate taxes are redeemed prior to maturity from regular public debt receipts.
' Represents payments from net earaings. War Damage Corporation. •Represents Treasury notes of 1890 determined by the Secretary ofthe Treasury on Oct. 20, 1961, pursuant
to the Old Series Currency Adjustment Act approved June 30, 1961 (31 U.S.C. 9i;i-916) to have been destroyed or irretrievably lost and so will never be presented for redemption.
'Represents $15,000,000 national bank notes, $1,000,000 Federal Reserve bank notes, and $15,000,000 silver certificates, all issued prior to July 1. 1929; $18.0(X).0(X) Federal Reserve notes issued prior to the series of 1928; $9,0(X).(XX) gold certificates issued prior to Jan. 30, 1934; all of which have been detennined pursuant to 31 U.S.C. 912-916 to have been destroyed or irretrievably lost.
"Represents $24,000,000 U.S. notes, $1,000,000 Federal Reserve bank notes, $13,500.00(1 national bank notes, and $14,500,000 silver certificates, all issued before July 1, 1929; $6,000,000 gold certificates prior to 1934 series; $100,000 Treasury notes of 1890; and $14,000,000 Federal Reserve notes (prior to series of 1928); all of which were determined on Nov. 16, 1964, pursuant to 31 U.S.C. 912-916, to have been destroyed or irretrievably lost.
'Represents $142,000 U.S. notes. $63,000 Federal Reserve bank notes. $420,000 nati(mal bank notes, and $280,000 silver certificates, all issued before July 1, 1929; $8,950,000 gold certificates prior to 1934 series; $31,000 Treasury notes of 1890; and $2,450,000 Federal Reserve notes (prior to series of 1928); all of which were determined on May 26, 1966, pursuant to 31 U.S.C. 912-916, to have been destroyed or irretrievably lost. Digitized for FRASER
http://fraser.stlouisfed.org/ Federal Reserve Bank of St. Louis

270 1977 REPORT OF THE SECRETARY OF THE TREASURY
TABLE 41.—Cumulative sinking fund, beginning fiscal year 1921 [On basis of Public Debt accounts; see "Bases of Tables"]
PART I—APPROPRIATIONS AND EXPENDITURES
[In millions of dollars]
1921-1947. 1948. 1949. 1950. 1951. 1952. 1953. 1954 1955. 1956. 1957 1958 1959 1960 1961. 1962 1963 1964 1965 1966 1967 1968 1969 1970 1971 1972 1973 1974 1975 1976-' 1977.
Deduc
Fiscal
46
TQ::::::::::::::::
Total.
;t cumulative exp
Unexpended bah
year
>enditures
mce
Appropriations
11,731.9. 587.6 603.5 619.6 619.7 619.8 619.8 619.8 619.8 619.8 623.8 633.3 633.3 633.3 633.3 657.1 680.8 680.8 680.8 680.8 680.8 680.8 680.8 680.8 680.8 680.8 680.8 680.8 680.8 680.8 680.8 "680.8
31,969.1 8,727.1
23,242.0
Available for expenditure during
year'
5,525.0 6,112.6 6,716.0 6,589.0 7,201.2 7,819.2 8,438.1 9,057.4 9,676.9
10,296.7 10,920.5 10,791.2 11,424.5 12,057.9 12,691.3 13,348.4 13,029.3 13,710.1 14,391.0 15,071.8 15,752.7 16,433.5 17,114.4 17,795.2 18,476.1 19.156.9 19.837.8 20.518.6 21.199.5 21.880.3 22.561.2 23.242.0
Debt retired"
Par amount
6.214.7
746.6 7.5 1.8 .8 .6 .2
762.6
1.000.0
8.734.8
Cost (principal)
6,207.0
746.6 7.5 1.8 .8 .6 .2
762.6
1,000.0
8,727.1
See footnotes at end of table.
Digitized for FRASER http://fraser.stlouisfed.org/ Federal Reserve Bank of St. Louis

STATISTICAL APPENDIX 2 7 1
TABLE 41.—Cumulative sinking fund, beginning fiscal year 1921—Continued PART II.—TRANSACTIONS ON ACCOUNT OF THE CUMULATIVE SINKING FUND
FISCAL YEAR 1977
Unexpended balance Oct. 1, 1976 $22,561,151,000.95 Appropriation for 1976:
Initial credit: (a) Under the Victory Liberty Loan Act {2'A percent of
the aggregate amount of Liberty bonds and Victory notes outstanding on July 1, 1920, Jess an amount equal to the par amount of any obligation of foreign goveraments held by the United States on July 1, 1920) $253,404,864.87
(b) Under the Emergency Relief and Construction Act of 1932 {2'A percent of the aggregate amount of expenditures from appropriations made or authorized under this act) 7,860,606.83
(c) Under the National Industrial Recovery Act (2'A percent of the aggregate amount of expenditures from appropriations made or authorized under this act) 80.164.079.53
Total initial credit 341,429.551.23
Secondary credit (the interest which would have been payable during the fiscal year for which the appropriation is made on the bonds and notes purchased, redeemed, or paid out of the sinking fund during such year or in previous years) 339,419,534.24 680.849,085.47
Total available 1977 23.242.000.086.42
Unexpended balance Sept. 30. 1977" 23,242,000,086.42
' Represents appropriations authorized by Congress. There are no specific funds set aside for this account since any retirements of public debt charged to this account are made from cash balances to the credit of the Treasury ofthe United States.
"Net discount on debt retired through Sept. 30, 1977, is $7.7 million. NOTE.—Comparable annual data for 1921 through 1946 are shown in the 1962 Annual Report, p. 726.
Digitized for FRASER http://fraser.stlouisfed.org/ Federal Reserve Bank of St. Louis

2 7 2 1977 REPORT OF THE SECRETARY OF THE TREASURY
III.—U.S. savings bonds and notes
TABLE 42.—Sales and redemptions of series E through K savings bonds by series, fiscal year 1941 to date^^
^ [In millions of dollars]
Fiscal year Sales Accrued discount
Sales plus
accrued discount
Redemption
Total Original purchase
price
Accrued discount
Amount outstanding ^
Matured Interest- non-bearing interest-
bearing
Series E and H
1941-55 79,203.6 9,183.8 88,387.4 49,102.2 45,969.3 3,132.9 39,285.1 1956 5,259.9 1,114.1 6.374.0 4,730.1 4,069.1 660.9 40,929.1 1957 4,613.0 l,132r4 5,745.4 5,176.2 4.444.0 732.2 41,498.5 1958 4,670.1 1,160.7 5,830.8 5,187.1 4,431.9 755.3 42,142.2 1959 4,506.0 1,174.5 5,680.4 5,106.8 4,309.8 797.0 42,715.8 1960 4,307.0 1,194.2 5,501.2 5,502.2 4,616.3 885.9 42,714.8 1961 4,463.7 1,253.7 5,717.4 4,626.7 3,905.8 720.8 43,805.6 1962 4,421.5 1,331.0 5,752.5 4,603.3 3,872.7 730.6 44,954.8 1963 4,518.0 1,386.5 5,904.5 4,500.5 3,758.5 742.0 46,358.8 1964 4,656.4 1,458.0 6.114.4 4.736.3 3.981.8 754.5 47,736.9 1965 4,543.0 1,502.1 6,045.1 4,987.4 4,154.1 833.3 48,794.5 1966 4,650.1 1,541.6 6,191.7 5,304.6 4,407.5 897.1 49,681.6 1967 4,965.4 1,618.6 6,583.9 5,448.7 4,535.7 912.9 50,816.9 1968 4,738.9 1,730.7 6,469.5 5,714.7 4,738.6 976.1 51,571.7 1969 4,549.7 1,787.7 6.337.5 6.198.2 5.112.2 1.086.0 51,710.9 1970 4.449.2 1,841.4 6,290.6 6,720.6 5,484.0 1,236.6 51,281.0 1971 5,081.9 2,056.0 7,137.9 5,416.1 4,334.0 1,082.2 53,002.8 1972 5,939.6 2,310.2 8,249.9 5,331.2 4,300.2 1,031.0 55,921.4 1973 6,513.6 2,564.1 9,077.7 5,581.0 4,489.9 1,091.1 59,418.2 1974 6,428.8 2,749.2 9,178.0 6,675.4 5,361.0 1,314.4 61,920.8 1975 6,826.5 3,251.8 10,078.3 6,517.4 5,171.6 1,345.7 65,481.8 1976 7.293.2 3.496.4 10.789.7 6.538.8 5,130.1 1.408.8 69,732.6 T.Q 1,832.6 902.1 2,734.7 1,715.4 1.344.8 370.6 70,751.9 1977 7,894.7 3.827.0 11.721.7 7,062.8 5,495.5 1,567.4 75,410.8
Total through Sept. 30, 1977 196,326.5 51.568.1 247,894.5 172,483.7 147,412.1 25,071.7 75,410.8
Series F, G, J, and K
1941-55 1956 1957 1958 1959 1960 1961 1962 1963 1964 1965 1966 1967 1968 1969 1970 1971 1972 1973 1974 1975 1976 T.Q 1977
Total through Sept 30, 1977
31,096.5 586.3 268.4
(•) (*) (*) (•)
31,951.2
836.9 99.6 83.4 65.2 53.6 46.0 32.1 27.4 21.6 17.7 14.9 12.1 7.8 3.9 1.2
1,323.2
31,933.3 686.0 351.8 65.2 53.6 46.0 32.1 27.4 21.6 17.7 14.9 12.1 7.8 3.9 1.2
33.274.4
12.634.4 3.104.8 3.773.5 3.350.5 2,137.2 3.049.3 1.188.0 1.109.9 770.7 426.3 357.5 418.3 472.3 266.0 140.0 27.0 8.2 6.2 4.7 4.8 1.0 3.6 1.4 1.0
33.256.8
12.298.8 2.940.6 3,605.0 3.234.6 2.063.4 2.921.2 1.128.8 1.059.0 721.7 399.8 333.1 383.7 434.2 239.1 124.3 23.7 7.1 5.4 4.0 4.4 .9 3.2 1.3 .9
31.935.4
335.6 164.2 168.5 115.9 73.8 128.1 59.1 50.9 49.0 26.6 24.4 34.5 38.1 26.8 15.7 3.3 1.1 .8 .6 .5 .2 .4 .2 .1
1.321.4
19,080.3 16,567.6 13,123.5 9,842.2 7,786.7 4,829.0 3,708.4 2,651.9 1,954.9 1,562.6 1,248.1 855.7 396.6 140.0
218.4 312.8 334.7 331.0 302.8 257.3 221.6 195.8 143.7 127.4 99.3 85.5 80.2 74.7 75.8 48.7 40.6 34.3 29.7 24.8 23.6 20.0 18.6 17.5
17.5
See footnotes at end of table.
Digitized for FRASER http://fraser.stlouisfed.org/ Federal Reserve Bank of St. Louis
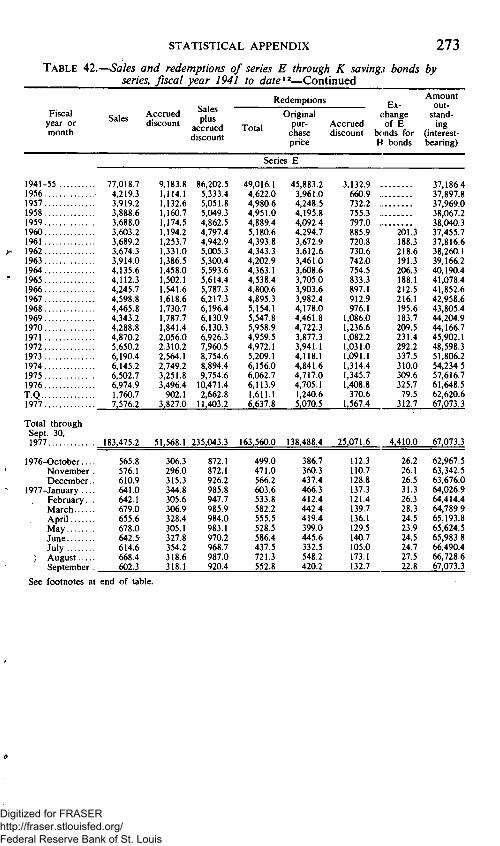
STATISTICAL APPENDIX 273 TABLE 42.-
Fiscal year or month
-Sales and redemptions of series E through K saving: bonds by series, fiscal year 1941 to date^^—Continued
Sales Accrued discount
Sales plus
accrued discount
Redemptions
Total
Original pur
chase price
Accrued discount
Exchange of E
bonds for Ki bonds
Amount out
standing
(interest-bearing)
Series E
1941-55 77,018.7 9,183.8 86,202.5 49,016.1 45,883.2 3,132.9 1956 4,219.3 1,114.1 5,333.4 4,622.0 3,961.0 660.9 1957 3,919.2 1,132.6 5,051.8 4,980.6 4,248.5 732.2 1958 3,888.6 1,160.7 5,049.3 4,951.0 4,195.8 755.3 1959 3,688.0 1,174.5 4,862.5 4,889.4 4,092.4 797.0 1960 3,603.2 1.194.2 4.797.4 5,180.6 4.294.7 885.9 1961 3.689.2 1,253.7 4,942.9 4,393.8 3,672.9 720.8 1962 3,674.3 1,331.0 5.005.3 4.343.3 3,612.6 730.6 1963 3,914.0 1,386.5 5,300.4 4.202.9 3.461.0 742.0 1964 4.135.6 1,458.0 5.593.6 4.363.1 3.608.6 754.5 1965 4.112.3 1,502.1 5,614.4 4.538.4 3.705.0 833.3 1966 4,245.7 1,541.6 5,787.3 4,800.6 3,903.6 897.1 1967 4,598.8 1,618.6 6,217.3 4,895.3 3,982.4 912.9 1968 4,465.8 1,730.7 6.196.4 5.154.1 4,178.0 976.1 1969 4.343.2 1,787.7 6.130.9 5,547.8 4.461.8 1.086.0 1970 4.288.8 1.841.4 6.130.3 5,958.9 4.722.3 1,236.6 1971 4,870.2 2,056.0 6,926.3 4.959.5 3,877.3 1,082.2 1972 5,650.2 2.310.2 7,960.5 4,972.1 3,941.1 1,031.0 1973 6,190.4 2,564.1 8,754.6 5,209.1 4,118.1 1,091.1 1974 6,145.2 2,749.2 8,894.4 6,156.0 4,841.6 1,314.4 1975 6,502.7 3,251.8 9,754.6 6,062.7 4,717.0 1.345.7 1976 6,974.9 3,496.4 10.471.4 6,113.9 4,705.1 1,408.8 T.Q 1,760.7 902.1 2,662.8 1,611.1 1.240.6 370.6 1977 7.576.2 3.827.0 11,403.2 6.637.8 5.070.5 1.567.4
Total through Sept. 30, 1977 183,475.2
201.3 188.3 218.6 191.3 206.3 188.1 212.5 216.1 195.6 183.7 209.5 231.4 292.2 337.5 310.0 309.6 325.7 79.5
312.7
1976-October.... 565.8 November . 576.1 December.. 610.9
1977-January.... 641.0 February... 642.1 March 679.0 April 655.6 May 678.0 June 642.5 July 614.6
) August 668.4 September . 602.3
See footnotes at end of table.
37,186.4 37,897.8 37,969.0 38,067.2 38,040.3 37,455.7 37,816.6 38,260.1 39,166.2 40,190.4 41,078.4 41,852.6 42,958.6 43,805.4 44,204.9 44,166.7 45,902.1 48,598.3 51,806.2 54,234.5 57,616.7 61,648.5 62,620.6 67,073.3
51.568.1 235.043.3 163.560.0 138.488.4 25.071.6 4.410.0 67.073.3
306.3 296.0 315.3 344.8 305.6 306.9 328.4 305.1 327.8 354.2 318.6 318.1
872.1 872.1 926.2 985.8 947.7 985.9 984.0 983.1 970.2 968.7 987.0 920.4
499.0 471.0 566.2 603.6 533.8 582.2 555.5 528.5 586.4 437.5 721.3 552.8
386.7 360.3 437.4 466.3 412.4 442.4 419.4 399.0 445.6 332.5 548.2 420.2
112.3 110.7 128.8 137.3 121.4 139.7 136.1 129.5 140.7 105.0 173.1 132.7
26.2 26.1 26.5 31.3 26.3 28.3 24.5 23.9 24.5 24.7 27.5 22.8
62.967.5 63.342.5 63.676.0 64.026.9 64,414.4 64,789.9 65,193.8 65,624.5 65,983.8 66,490.4 66,728.6 67.073.3
Digitized for FRASER http://fraser.stlouisfed.org/ Federal Reserve Bank of St. Louis

274 1977 REPORT OF THE SECRETARY OF THE TREASURY
TABLE 42.—Sales and redemptions of series E through K savings bonds by series, fiscal year 1941 to date^^—Continued
Fiscal year or month Sales
Exchanges Do^^^«*;««o for E bonds Redemptions ^ „
bonds
Amount outstanding
(interest-bearing)
Series H
1952-55 1956 1957 1958 1959 1960 1961 1962 1963 1964 1965 1966 1967 1968 1969 1970 1971 1972 1973 1974 1975 1976 T.Q 1977
Total through Sept. 30. 1977.
1976-October November December
1977-January February March April May June July August September
See footnotes at end of table.
2.184.9 1.040.6
693.8 781.6 818.0 703.9 774.5 747.2 604.1 520.8 430.7 404.4 366.6 273.2 206.5 160.4 211.7 289.4 323.2 283.6 323.7 318.3 71.9
318.5
12.851.3
20.6 24.2 22.0 36.3 25.5 32.5 27.1 31.3 22.8 28.4 29.5 18.3
86.1 108.1 195.5 236.1 217.4 321.6 232.9 260.1 297.5 373.3 449.0 504.0 553.4 560.6 650.4 761.8 456.6 359.1 371.8 519.3 454.6 425.0 104.3 425.0
8.923.7
32.2 33.0 34.4 37.8 33.8 38.7 35.5 35.0 33.1 38.8 38.7 34.1
201.3 188.2 218.6 191.3 206.3 188.1 212.5 216.1 195.6 183.7 209.5 231.4 292.2 337.5 310.0 309.6 325.7 79.5
312.7
4.410.0
26.2 26.1 26.5 31.3 26.3 28.3 24.5 23.9 24.5 24.7 27.5 22.8
2.098.7 3.031.2 3.529.5 4.075.0 4,675.5 5,259.1 5,989.0 6,694.7 7,192.5 7,546.4 7,716.1 7,829.0 7,858.2 7,766.3 7,506.1 7,114.2 7,100.6 7,323.2 7,612.0 7,686.3 7,865.1 8,084.2 8,131.3 8,337.5
8.337.5
8.146.0 8.163.2 8,177.4 8,207.2 8,225.2 8,247.3 8,263.4 8,283.7 8,297.9 8,312.2 8,330.5 8.337.5
Digitized for FRASER http://fraser.stlouisfed.org/ Federal Reserve Bank of St. Louis
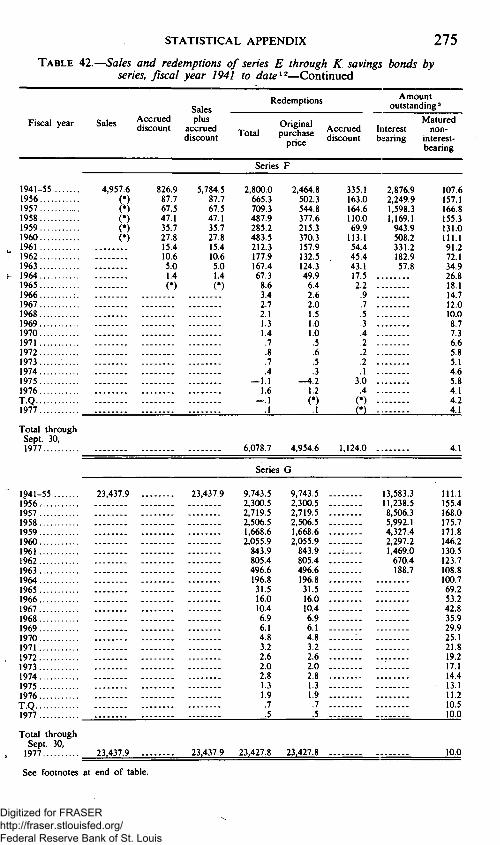
STATISTICAL APPENDIX 2 7 5
TABLE 42.—Sales and redemptions of series E through K savings bonds by series, fiscal year 1941 to date^^—Continued
Fiscal year Sales Accrued discount
Sales plus
accrued discount
Redemptions
Total Original purchase
price
Accrued discount
Amo outstam
Interest bearing
unt ding^*
Matured non
interest-bearing
Series F
1941-55 1956 1957 1958 1959 1960 1961 1962 1963 1964 1965 1966 1967 1968 1969 1970 1971 1972 1973 1974 1975 1976 T Q 1977
Total through Sept. 30, 1977
4,957.6
(*) (•) (*) ( • )
(•)
826.9 87.7 67.5 47.1 35.7 27.8 15.4 10.6 5.0 1.4 (•)
5,784.5 87.7 67.5 47.1 35.7 27.8 15.4 10.6 5.0 1.4 (*)
2.800.0 665.3 709.3 487.9 285.2 483.5 212.3 177.9 167.4 67.3
8.6 3.4 2.7 2.1 1.3 1.4 .7 .8 .7 .4
—1.1 1.6
—.1 .1
6.078.7
2,464.8 502.3 544.8 377.6 215.3 370.3 157.9 132.5 124.3 49.9
6.4 2.6 2.0 1.5 1.0 1.0 .5 .6 .5 .3
—4.2 1.2 (*) .1
4,954.6
335.1 163.0 164.6 110.0 69.9
113.1 54.4 45.4 43.1 17.5 2.2
.9
.7
.5
.3
.4
.2
.2
.2
.1 3.0
.4 ( • )
(*)
1.124.0
2.876.9 2.249.9 1.598.3 1.169.1
943.9 508.2 331.2 182.9 57.8
107.6 157.1 166.8 155.3 131.0 111.1 91.2 72.1 34.9 26.8 18.1 14.7 12.0 10.0 8.7 7.3 6.6 5.8 5.1 4.6 5.8 4.1 4.2 4.1
4.1
Series G
1941-55 1956. 1957 1958 1959 1960 1961 1962 1963 1964 1965 1966 1967 1968 1969 1970 1971 1972 1973 1974 1975 1976 T Q 1977
Total through Sept. 30,
1977
23,437.9
23.437.9
23,437.9
23.437.9
9,743.5 2,300.5 2,719.5 2,506.5 1,668.6 2,055.9
843.9 805.4 496.6 196.8 31.5 16.0 10.4 6.9 6.1 4.8 3.2 2.6 2.0 2.8 1.3 1.9 .7 .5
23,427.8
9,743.5 2,300.5 2,719.5 2,506.5 1,668.6 2.055.9
843.9 805.4 496.6 196.8 31.5 16.0 10.4 6.9 6.1 4.8 3.2 2.6 2.0 2.8 1.3 1.9 .7 .5
23.427.8
13.583.3 11.238.5 8.506.3 5,992.1 4,327.4 2,297.2 1,469.0
670.4 188.7
111.1 155.4 168.0 175.7 171.8 146.2 130.5 123.7 108.8 100.7 69.2 53.2 42.8 35.9 29.9 25.1 21.8 19.2 17.1 14.4 13.1 11.2 10.5 10.0
10.0
See footnotes at end of table.
Digitized for FRASER http://fraser.stlouisfed.org/ Federal Reserve Bank of St. Louis

276 1977 REPORT OF THE SECRETARY OF THE TREASURY
TABLE 42.—Sales and redemptions of series E through K savings bonds by series, fiscal year 1941 to date^^—Continued
Redemptions Amount outstanding ^
Fiscal year Sales
Sales Accrued plus Oricinal Matured discount accrued xr.tQi «„r/?Koc*> Accrued Interest- non-
discount ^°^^' ndce discount bearing interest-^ bearing
Series J
1952-57 1958. 1959. 1960. 1961. 1962. 1963. 1964. 1965. 1966. 1967. 1968. 1969. 1970. 1971 . 1972. 1973 . 1974. 1975. 1976. T.Q.. 1977 .
Total through Sept. 30. 1977
972.4 (•) (*)
(•)
37.8 18.1 17.8 18.2 16.7 16.8 16.6 16.3 14.9 12.1 7.8 3.9 1.0
1,010.2 18.1 17.8 18.2 16.7 16.8 16.6 16.3 14.9 12.1 7.8 3.9 1.0
199.8 98.4 51.2
144.2 39.1 37.2 33.2 46.2 87.6
124.4 136.0 95.0 55.4 9.7 3.2 2.2 1.6 1.3 .9
—.1 .8 .\
194.1 92.8 47.3
129.2 34.4 31.7 27.4 37.1 65.4 90.8 98.6 68.7 40.1
7.0 2.3 1.6 1.1 .9
89.5 —.1
.6
.1
5.7 810.4 5.6 730.2 3.9 696.9
15.0 570.8 4.8 548.4 5.5 527.9 5.9 511.3 9.1 481.4
22.2 403.8 33.6 287.5 37.4 154.1 26.3 59.8 15.4 2.7
.9
.6 5 .4
-88.6 (*) .2
(*)
4.8
972.4 198.1 1,170.5 1,167.6 970.2 197.3 2.9
See footnotes at end of table.
Digitized for FRASER http://fraser.stlouisfed.org/ Federal Reserve Bank of St. Louis

STATISTICAL APPENDIX 277 TABLE 42.—Sales and redemptions of series E through K savings bonds by
series, fiscal year 1941 to date^^—Continued
Fiscal year
1952-57 1958 1959 1960 1961 1962 1963 1964 . . 1965 1966 1967 1968 1969 1970 1971 1972 1973 1974 1975 1976 T.Q. 1977
Total through Sept. 30, 1977
Sales
2,583.3 (*) (•)
2,583.3
Accrued discount
Sales plus
accrued discount
2,583.3 (•) (*)
2.582.5
Redemptions
Total ' l r = Series K
374.9 257.7 132.2 365 8 92.7 89 4 73 5
116.0 229.8 274.4 323.2 162.0 77.2 11.1
1.0 .6 .3 .3 .1 .3 .1 .2
2.582.7
374.9 257.7 132.2 -. 365.8 92.7 . . : 89.4 73.5 -•
116.0 229.8 274.4 323.2 162.0 77.2 11.1
1.0 .6 .3 .3 .1 .3 .1 .2
2,582.7
Amount outstanding"
Interest-bearing
2.208.5 1.950.7 1.818.6 1.452.8 1,360.1 1,270 7 1,197.2 1.081.3
844.3 568.2 242.5
80.1
Matured non
interest-bearing
7.2 8.8
11.4 11.7 14.7 3.6 2.6 1.9 1.7 1.3 1.1 .9 .8 .6
.6
* Less than $50,000. ' Sales and redemption figures include exchanges of minor amounts of matured series \i for series G and K
bonds from May 1951 through April 1957, series F and J bonds for series H bonds beginniiig January 1960, and U.S. savings notes for series H bonds beginning January 1972; they exclude exchanges of series E bonds for series H bonds. Redemption figures for fiscal 1953-54 and fiscal years 1960-63 also include the maturing series F and G savings bonds exchanged for marketable Treasury securities during special exchange offerings. The amounts involved were $416.6 million in 1953, $0.7 million in 1954, $745.4 million in 1960, $147.3 million in 1961, $320.1 million in 1962, and $75.1 million in 1963.
" Sales of series E, F, and J bonds are included at issue price, and their redemptions and amounts outstanding at current redemption value. Series G, H, and K bonds are included at face value througho ut.
" Matured F, G, J, and K bonds outstanding are included in the interest-bearing debt until all bonds of the annual series have matured, and are then transferred to matured debt on which interest has ceased.
NOTE.—Series E and H are the only savings bonds now being sold. Series A-D, sold from Mar. 1, 1935, through Apr. 30. 1941, have all matured and are no longer reflected in these tables. Series F and G were sold from May 1, 1941, through Apr. 30, 1952. Series J and K were sold from May 1, 1952, through Apr. 30, 1957. Sales figures for series F, G, J, and K after fiscal 1957 represent adjustments. Details by mDnths for series E, F, and G bonds from May 1941 will be found on p. 608 ofthe 1943 Annual Report, and in corresponding tables in subsequent reports through 1972. Monthly detail for series H, J, and K bonds will be found in the 1952 Annual Report, pp. 629 and 630. ind in corresponding tables in subsequent reports through 1972,. Monthly detail for series F, G. J, and K was discontinued in 1973.
Digitized for FRASER http://fraser.stlouisfed.org/ Federal Reserve Bank of St. Louis

TABLE 43.—Sales and redemtions of series E and H savings bonds by denomination, fiscal 1941 to date^ [In thousands of pieces. Estimated on basis of Daily Treasury Statement through 1974, Monthly Statement
of the Public Debt of the United States thereafter; and reports from Bureau of the Public Debt]
Fiscal year or month Total, all denominations"
$25 $50 »$75 $100 •$200 $500 $1,000 $5,000 »« $10,000
oo
Sales'
1941-55 1956 1957 1958 1959 1960 1961 1962 1963 1964 1965 1966 1967 1968 1969 1970 1971 1972 1973 1974 1975 1976 T.Q 1977 1976-October....
November . December..
1977-January — February... March April May June July August September .
1,696,608 90,053 90,160 89,431 85,882 85,607 86,495 86,479 89,627 96.609 99.560 103,500 114,433 117,279 118,184 117,026 121,544 127,671 134,552 134,754 136,600 142,539 35,704 146,931 11,720 11,868 13,295 12,942 11,492 12,985 11,782 12,130 12,296 11,919 12,550 11,951
1,155,275 56,719 56,327 54,908 52,895 52,972 53,453 53,010 54,629 59,230 60,928 63,430 71,506 75,925 78,508 78,043 76,103 76,616 78,859 78,505 77,493 79,243 19,612 79,531 6,498 6,480 7,370 7,280 6,138 6,947 6.283 6,419 6.595 6.435 6.692 6,393
267,768 18,784 20,256 21,043 20,108 20,220 20,434 20,901 21,903 23,442 23,947 24,704 26,476 25,823 25,106 24,675 28,034 30,131 32,265 32,789 33,591 35,388 8,970
37,090 2,941 3,038 3,369 3,129 2,902 3,298 2,936 3,060 3,139 3,021 3,192 3.064
135 1,141 1,469 1,749 1,860 1,822 1,682 1,989 2,304 2,518 2,758 2,969 3,243 836
3,510 281 284 313 293 273 312 279 288 296 288 306 299
189,789 10,090 9,969 9,824 9,477 9,208 9,273 9,286 9,623 10,324 10,409 10,714 11.411 10.769 10,192 10,072 12.073 14,177 15,862 16,204 17,442 18,955 4,841 20,425 1,580 1,620 1,799 1,697 1,611 1,827 1,681 1,743 1,736 1,666 1,775 1,690
8,798 929 851 893 798 774 789 813 928
1,006 982
1,010 1,068 987 869 878
1,159 1,443 1,651 1,581 1,763 1,975 511
2.189 160 168 178 180 173 202 192 194 188 181 193 180
26,230 1,608 1,320 1,304 1,212 1,165 1,201 1,186 1,233 1,220 1,087 1,101 1,131 987 871 868
1,122 1,502 1,688 1,451 1,620 1,770 441
1,909 126 134 132 160 167 181 183 188 161 153 176 149
27,519 1.854 1,396 1,413 1,340 1,230 1,299 1,237 1,270 1,214 1,033 1,042 1,064 906 796 796
1,050 1,476 1,684 1,452 1,706 1,950 485
2,258 133 143 134 201 226 217 226 234 180 175 215 173
106 48 29 33 35 -27 31 30 25 22 18 17 15 11 8 7 12 18 20 11 13 11 2 12 1 1 1 1 1 1 1 1 1 1 1 1
73
48 tg 21 O 12 2 14 H 16 O 11 ^ 15 H 16 X 16 W 16 c/) 14 tfl
12 g 11 > 6 70 3 < ^ O 5 y
3 S 4 tfl
7 ^ (*) tfl (•) > (•) ^
1 1 1 1 1 1 1 Digitized for FRASER
http://fraser.stlouisfed.org/ Federal Reserve Bank of St. Louis

1941-1955 1956 1957 1958 1959 1960 1961 1962 1963 1964 1965 1966 1967 1968 1969 1970 1971 1972 1973 1974.. . . 1975 1976 T.Q 1977 1976-October....
November . December..
1977-January . . . . February... March April May June July August Septeniber .
1,229,060 89,953 93,175 93,452 88,647 90,748 85,077 83,804 83,469 87,242 90,012 94,720 98,349 105,057 114,396 118,696 102,145 103,651 106,065 120,258 115,941 116,858 31,340 123,451 9,455 9,229 11,333 10,241 9.559 10.745 10.206 9.780 10,674 9,888 11.683 10.658
892.320 60.014 60,612 59,880 56,036 56,796 54,280 52,958 53,018 55,264 56,736 59.235 61.960 66,953 73,560 76,446 66,127 66,832 65,880 72,588 69,534 68,965 18,427 71,210 5,558 5,423 6,725 5,733 5,479 6,172 5.812 5.618 6.166 5.688 6,722 6,115
182,015 16,503 18,165 19,467 18,598 19,507 18,654 18,746 19,022 20,034 20,744 21,948 22,627 23,604 25,308 25,789 22,659 23,921 25,089 29,137 28,411 29,134 7,855
31,600 2,382 2,331 2,828 2.746 2.477 2.750 2.612 2.495 2.699 2,516 2.989 2.774
(•) 245 585 837
1.032 1.205 1.303 1.327 1.577 1.784 2.215 2,239 2,486 668
2,711 200 195 237 213 220 248 232 218 236 219 259 235
Redemptions
109,032 9,925 10,590 10,433 10,394 10,634 9,197 9,150 8,715 9,080 9,322 9,822 9,839 10,276 10,955 11,410 9,313 9,689 10,515 12,768 12,490 13,036 3,532 14,421 1,054 1,033 1.252 1,226 1,111 1,263 1,245 1,166 1,265 1,174 1,386 1,245
7 T
3,061 537 633 639 675 725 616 653 601 648 694 756 760 808 864 933 740 776 855
1,080 1,035 1,074 291
1,210 89 87 102 108 90 106 107 97 106 100 116 104
^
12,605 1,255 1,354 1,320 1,301 1,351 1,076 1,077 1,005 1,051 1.070 1,113 1,084 1,107 1,165 1,297 943 899 955
1,196 1.091 1.065 282
1.139 86 80 93 104 90 102 99 91 101 95 96 93
11.839 1.281 1.485 1.464 1,451 1,567 1,139 1,126 1,028 1,088 1,122 1,182 1.169 1.208 1.266 1.438 988 917 948
1,228 1,095 1,056 275
1,121 84 77 93 107 89 102 95 90 98 94 103 90
4 5 9 11 9 15 10 10
. 12 15 19
= 22 24 24 28 33 18 14 16 23 20 18 5 19 2 1 2 2 2 2 1 1 2 2 2 2
(*) (*)
(•)
(*)
(*)
(*)
' t ifi H
>
r > ha m z a X
• L^ss than 5(X) pieces. 'Sales of series H began on June 1, 1952; the denominations authorized were: $5(X),
$1,000, $5,000, and $10,000. "Totals include $10 denomination series E bonds sold to Armed Forces only from June
1944 to March 1950. Details by years will be found in the 1952 Annual Report, pp. 631, 633; thereafter, monthly detail for each fiscal year appears in a footnote to the redemptions by denominations table of successive Annual Reports through 1973. Total such redemptions in fiscal 1974: 16,917, fiscal 1975: 15,533, fiscal 1976: 15,508, T.Q.: 5,228. fiscal 1977: 13.323.
' Sales of $75 denomination series E bonds began in May 1964. • Sales of $2(X) denomination series E bonds began in October 1945. " Sales of $10,(XX) denomination series E bonds were authorized on May 1. 1952. "Includes sales of $1(X).(XX) denomination series E bonds which are purchasable only by
trustees of employees' savings plans beginning April 1954. and personal trust accounts beginning January 1955.
' See table 42, footnote 1. VO
Digitized for FRASER http://fraser.stlouisfed.org/ Federal Reserve Bank of St. Louis

280 1977 REPORT OF THE SECRETARY OF THE TREASURY
T A B L E 44.—Sales and redemptions of U.S. savings notes, fiscal year 1967 to date
[In millions of dollars]
Fiscal year Sales Accrued ^^'^^ P^"^
Redemptions *
Total Sales price
Accrued discount
Amount out
standing (interest-bearing)
1967. 1968. 1969. 1970. 1971. 1972. 1973. 1974. 1975. 1976. T.Q.. 1977.
1.5 200.8 326.2 322.7
10.6 (•) (•) (•) 2.0
—2.0 (•)
0.3 11.4 24.6 35.4 28.3 29.0 34.6 31.1 24.1
5.8 23.0
1.5 201.1 337.5 347.3 43.9 28.3 29.0 34.6 33.1 22.1
5.8 23.0
(*) 0.1
35.2 110.6 166.9 85.8 70.8 76.6 75.0 44.9 11.0 36.1
(*) 0.1
33.7 104.9 157.1 77.5 59.6 62.2 58.4 32.1 7.5
24.3
(•) 1.4 5.7 9.8 8.3
11.2 14.5 16.6 12.8 3.4
11.8
1.5 202.5 504.9 741.6 618.6 561.1 519.3 477.2 435.3 412.J> 407.4 394.3
Total through Sept. 30, 1977. 861.7 245.5 1,107.3 712.9 617.5 95.5 394.3
* Less than $50,000. ' Includes U.S. savings notes exchanged for series H bonds beginning January 1972. NOTE.—U.S. savings notes were sold from May 1, 1967. through June 30. 1970. Sales figures after fiscal
1970 represent adjustments.
Digitized for FRASER http://fraser.stlouisfed.org/ Federal Reserve Bank of St. Louis

STATISTICAL APPENDIX 281 TABLE 45.—Sales of series E and H savings bonds by State, fiscal
years 1976-77 and cumulative^ [In thousands of dollars, at issue price. The Treasury, with totals adjusted to basis of Monthly
Statement of the Public Debt of the United States]
States and other areas Fiscal 1976 T.Q. Fiscal
1977 May 1941-Sept. 1977
Alabama 72.008 19.928 Alaska 8.651 2.232 Arizona 47,827 11,496 Arkansas 35,287 8,629 Califoraia 475,766 128,773 Colorado 60,688 15,715 Connecticut 132,637 32,295 Delaware 33,192 8,349 District of Columbia 96,877 20,312 Florida 172,595 40,904 Georgia 99,550 28,186 Hawaii 27,826 7,034 Idaho 10,889 2,829 Illinois 470,418 117,115 Indiana 208,644 53,236 Iowa 103,793 25,552 Kansas 77.347 20.093 Kentucky 85.899 23.204 Louisiana 67.054 16.961 Maine 22,368 6,306 Maryland 172,910 41,470 Massachusetts 227,809 58,324 Michigan 432,382 115,095 Minnesota 119,449 31,240 Mississippi 30,420 8,343 Missouri 201,513 52,536 Montana 18,542 4,507 Nebraska 57,772 13,264 Nevada 11,782 3.256 New Hampshire 17.633 4,851 New Jersey 368,977 93,216 New Mexico 25,478 6,922 New York 803,867 196,858 North Carolina 100,408 24,938 North Dakota 17,980 4,070 Ohio 428,017 107,977 Oklahoma 70,437 17,777 Oregon 55,624 14,283 Pennsylvania 699,587 175,847 Rhode Island 31,340 8,186 South Carolina 43,308 11,149 South Dakota 25,167 5,651 Tennessee 85,970 21,530 Texas 259,219 71,586 Utah 30,472 8,225 Vermont 8,686 2,288 Virginia 152,380 38,166 Washington 97,808 24,046 West Virginia 69,027 17,126 Wisconsin 139,444 35,928 Wyoming 8,101 2,125 Canal Zone 3,396 689 Puerto Rico 6,046 1.638 Virgin Islands 738 311 Undistributed and adjustment to monthly public debt statement -fl62,239 -f20.080
Total 7,293,244 1,832,647
81,531 S',446
66,282 38,403
534,140 66,980
159,186 35.243
117.680 198,822 112,631 31,463 12,116
506,090 217,397 108,433 83,734 95.480 73.284 25,146
189,711 252,329 536,314 139,971 35.273
218,896 19.523 59.976 14,085 20.439
395.952 28,359
840,630 109,639
17,581 453,673
72., 173 62.515
758.,889 34740 49,162 25.165 97,093
286,995 33.625 9.467
156.592 108,381 70,990
144,217 8,457 7,932 5,852 1,150
2.012,310 "139,510
949,090 1,077,997
13,758,513 1.555.211 3,225.831
667,639 2,424,070 3,308,744 2,408,209
727,771 422,059
14,943,765 5,602,528 4,604,685 2,817,343 2,255,877 1,892,795
721,912 3,222.954 5,668.825
11,668.435 3,420,553 1,016,604 5,620,619
813,017 2,708,894
280,974 469,865
8,048,714 581,375
22,141,784 2,411,428
806,226 12,371,879 2,332,166 1,723,072
17,467,412 870,141
1,182,311 1,003,568 2,170,759 7,018,174
853,528 248,381
3,665,121 2,969,268 1,976,642 4,167,399
328,790 121,784 127,426 10,989
+ 55.464 =»-f 1.321.532
7.894,697 196.326,468
* Figures include exchanges of minor amounts of series F and J bonds and savings notes into series H bonds from January 1960 through October 1964, series J for H through October 1969, and U.S. savings notes from February 1972 to date; however, they exclude series E bonds exchanged for series H, which are reported in table 42.
"Excludes data for period April 1947 through December 1956, when reports were noi: available. In the Annual Reports for 1952-1958 data for period May 1941 through March 1947 were included with "Other Possessions."
^ Includes a small amount for other possessions. NOTE.—Sales by State ofthe various series of savings bonds were published in the Annual Report for 1943,
pp. 614-621, and in the subsequent reports; and by months at intervals in the Treasury Bulletin, beginning with the issue of July 1946. Since Apr. 30. 1953, figures for sales of series E and H bonds only have been available by State.
Digitized for FRASER http://fraser.stlouisfed.org/ Federal Reserve Bank of St. Louis
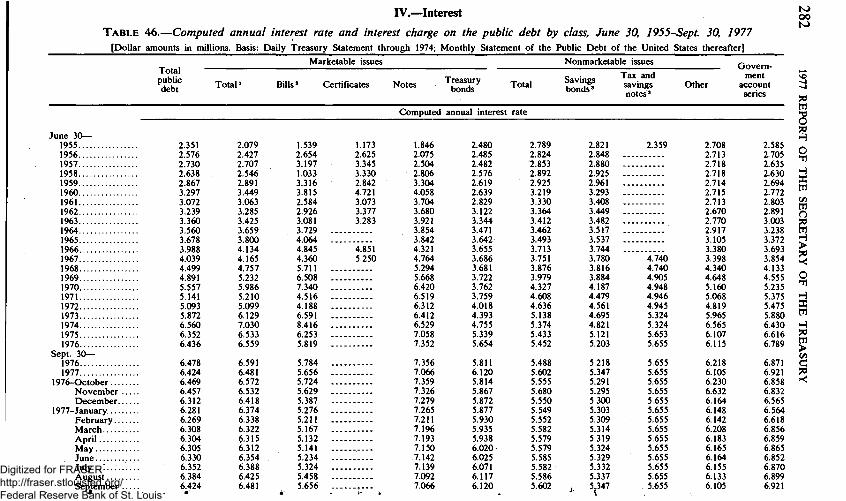
IV.—Interest
TABLE 46.—Computed annual interest rate and interest charge on the public debt by class, June 30, 1955-Sept. 30, 1977 [Dollar amounts in millions. Basis: Daily Treasury Statement through 1974; Monthly Statement of the Public Debt of the United States thereafter]
CX)
Total public debt
Marketable issues Nonmarketable issues
TotaP Bills" Certificates Notes Treasury
bonds Total Savings bonds'
Tax and savings notes'
Other
Goverament
account series
73 tfl ^ O Ti H O
H X tfl ifi tfl O 73
> 73
O ^ H X tfl H 73 tfl > ifi C 73
Computed annual interest rate
June 3 0 — 1955 2.351 2.079 1956 2.576 2.427 1957 2.730 2.707 1958 2.638 2.546 1959 2.867 2.891 1960 3.297 3.449 1961 3.072 3.063 1962 3.239 3.285 1963 3.360 3.425 1964 3.560 3.659 1965 3.678 3.800 1966 3.988 4.134 1967 4.039 4.165 1968 4.499 4.757 1969 4.891 5.232 1970 5.557 5.986 1971 5.141 5.210 1972 5.093 5.099 1973 5.872 6.129 1974 6.560 7.030 1975 6.352 6.533 1976 6.436 6.559
Sept. 30— 1976 6.478 6.591 1977 6.424 6.481
1976-October 6.469 6.572 November 6.457 6.532 December 6.312 6.418
1977-January 6.281 6.374 February 6.269 6.338 March 6.308 6.322 April 6.304 6.315 May 6.305 6.312 June 6.330 6.354 July . . : . . : . . . . . . 6.352 6.388 August 6.384 6.425 September 6.424 6.481
1.539 1.173 2.654 2.625 3.197 3.345 1.033 3.330 3.316 2.842 3.815 4.721 2.584 3.073 2.926 3.377 3.081 3.283 3.729 4.064 4.845 4.851 4.360 5.250 5.711 6.508 7.340 4.516 4.188 6.591 8.416 6.253 5.819
5.784 5.656 5.724 5.629 5.387 5.276 5.211 5.167 5.132 5.141 5.234 5.324 5.458 5.656
1.846 2.075 2.504 2.806 3.304 4.058 3.704 3.680 3.921 3.854 3.842 4.321 4.764 5.294 5.668 6.420 6.519 6.312 6.412 6.529 7.058 7.352
7.356 7.066 7.359 7.326 7.279 7.265 7.211 7.196 7.193 7.150 7.142 7.139 7.092 7.066
2.480 2.485 2.482 2.576 2.619 2.639 2.829 3.122 3.344 3.471 3.642 3.655 3.686 3.681 3.722 3.762 3.759 4.018 4.393 4.755 5.339 5.654
5.811 6.120 5.814 5.867 5.872 5.877 5.930 5.935 5.938 6.020 6.025 6.071 6.117 6.120
2.789 2.824 2.853 2.892 2.925 3.219 3.330 3.364 3.412 3.462 3.493 3.713 3.751 3.876 3.979 4.327 4.608 4.636 5.138 5.374 5.433 5.452
5.488 5.602 5.555 5.680 5.550 5.549 5.552 5.582 5.579 5.579 5.585 5.582 5.586 5.602
2.821 2.848 2.880 2.925 2.961 3.293 3.408 3.449 3.482 3.517 3.537 3.744 3.780 3.816 3.884 4.187 4.479 4.561 4.695 4.821 5.121 5.203
5.218 5.347 5.291 5.295 5.300 5.303 5.309 5.314 5.319 5.324 5.329 5.332 5.337 5.347
2.359
4.'7'4b 4.740 4.905 4.948 4.946 4.945 5.324 5.324 5.653 5.655
5.655 5.655 5.655 5.655 5.655 5.655 5.655 5.655 5.655 5.655 5.655 5.655 5.655 5.655
2.708 2.713 2.718 2.718 2.714 2.715 2.713 2.670 2.770 2.917 3.105 3.380 3.398 4.340 4.648 5.160 5.068 4.819 5.965 6.565 6.107 6.115
6.218 6.105 6.230 6.632 6.164 6.148 6.142 6.208 6.183 6.165 6.164 6.155 6.133 6.105
2.585 2.705 2.635 2.630 2.694 2.772 2.803 2.891 3.003 3.238 3.372 3.693 3.854 4.133 4.555 5.235 5.375 5.475 5.880 6.430 6.616 6.789
6.871 6.921 6.858 6.832 6.565 6.564 6.618 6.856 6.859 6.865 6.852 6.870 6.899 6.921
Digitized for FRASER http://fraser.stlouisfed.org/ Federal Reserve Bank of St. Louis

Computed annual interest charge
June 30-1955 1956 1957 1958 1959 1960 1961 1962 1963 1964 1965 1966 1967 1968 1969 1970 1971 1972 1973 1974 1975 1976
Sept. 30-1976 1977
1976-October.... November . December..
1977-January February... March April May June July August September .
$6,387 6.950 7.325 7.245 8.066 9.316 8.761 9.519
10,119 10,900 11,467 12,516 12,953 15,404 17,087 20,339 20,254 21,545 26,591 30,741 33,509 39,494
40.683 44,481 40,730 41,212 40,845 40,687 41,201 41,829 41,824 41,990 42.312 42.329 4J . J48 44.481
$3,225 3,758 4,210 4,242 5,133 6,317 5,718 6,422 6,944 7,513 7.878 8.580 8,709
10,684 11,703 13,743 12,670 12,998 15,900 18,416 20,325 25,396
26,508 28,396 26,494 26,781 26,698 26,694 27,028 27,199 27,093 26,916 27,075 27,162 27,819 28,396
$299 $162 549 428 743 685 231 1,096
1,046 962 1,249 833
937 410 1,212 457 1,433 728 1,855 2,135 2,595 80 2,490 295 3,573 4,302 5,380 3,823 3,879 6,383 8,471 7,766 9.071
9.031 8.551 8.943 8.807 8.560 8,388 8,297 8,234 8,064 7,876 7,869 7,963 8,162 8,551
$752 746 776 573 902
2,088 2,084 2,408 2,043 2,591 2,017 2,186 2.339 3.764 4.473 5,998 6.820 7.149 7.542 8.372
10.598 14.088
15.166 17.053 15.242 15.589 15.756 15.928 16.268 16.505 16.572 16,439 16,608 16,494 16,863 17,053
$2,010 2,034 2,005 2,341 2,221 2,145 2.288 2.344 2.740 3.067 3.727 3.718 3.585 3.347 2.928 2.364 2.026 1.970 1.975 1.573 1.961 2.237
2.311 2.792 2.309 2.385 2,382 2,378 2,463 2,460 2,457 2,601 2,598 2.705 2.794 2.792
$2,044 1.972 1.881 1,787 1.728 1.754 1.781 1.798 1.830 1.878 1.948 2.049 2.080 2.259 2.341 2.601 3.135 3.642 4.709 4,902 5,225 5,240
5,338 6,387 5,517 5,728 5,630 5,669 5,716 5,841 5,883 5,941 6,003 6.067 6,123 6,387
$1,647 $45 1.637 1.573 1.520 1.496 1,566 1,619 1,642 1,682 1,734 1,770 1.892 1,936 (•) 1.973 10 2,009 25 2,147 37 2,374 31 2,551 28 2,789 28 2,985 25 3,353 25 3,628 23
3,692 4,032 3,763 3,787 3,808 3,831 3,857 3,881 3,907 3,935 3,959 3.983 4,006 4,032
23 22 23 23 23 23 23 23 23 23 22 22 22 22
$352 334 308 266 232 189 162 156 148 144 178 157 144 276 308 417 730
1,064 1.892 1,892 1,847 1.589
1.623 2.333 1.731 1,918 1.799 1.815 1.836 1.937 1.953 1.983 2.022 1 fw;')
2.095 2,333
$1,118 1,220 1.234 1,216 1,206 1,245 1,263 1.299 1.345 1.509 1.641 1.888 2.164 2.460 3,042 3,995 4,449 4,905 5,982 7,423 7,959 8,858
8.837 9.698 8,719 8.703 8.517 8.324 8.457 8.789 8.848 9.133 9,234 O 1/V>
9,406 9,698
^
i l j
n >
> "73
tfl
z a X
* Less than $500,000. 'Total includes Panama Canal bonds prior to 1961, and postal savings bonds prior to
1956. "Included in debt outstanding at face amount, but the annual interest charge and the
annual interest rate are computed on the discount value.
"The annual interest charge and annual interest rate on U.S. savings bonds and U.S. savings notes are computed on the basis of the rate to maturity applied against the amount outstanding.
NOTE.—For methods of computing annual interest rate and charge see note to table 46. See table 26 for amounts of public debt outstanding by classification. For figures for 1939-55 see 1966 Annual Report, pages 770-1.
to OO
Digitized for FRASER http://fraser.stlouisfed.org/ Federal Reserve Bank of St. Louis

284 1977 REPORT OF THE SECRETARY OF THE TREASURY
TABLE 47.—Amount of interest-bearing public debt outstanding and the computed annual interest charge and rate of interest, June 30, 1955-Sept. 30, 1977 [Dollar amounts in thousands. On basis of Daily Treasury Statement through fiscal 1974,
Monthly Statement of the Public Debt of the United States thereafter]
Date Interest-bearing debt'
Computed annual interest
charge"
Computed rate of
June 30— 1955 1956 1957 1958 1959.. 1960 1961 1962 1963 1964 1965 1966 1967 1968 1969 1970 1971 1972 1973 1974 1975 1976
Sept. 30— 1976 1977
1976-October.... November . December..
1977-January . . . . February... March April May June July August September .
$271,741,268 269,883,068 268,485,563 274,697,560 281,833,362 283,241,183 285,671,609 294,442,001 301,953,731 307,356,562 313,112,817 315.431,055 322.285,952 344.400.507 351,729.445 369,025,522 396,289,177 425,359,898 456,353,394 473.237.795 532.121,826 619.253.913
633.559,537 697.628.734 635.061.683 643.642.635 652.457.423 652,979,579 662.320.344 668.215.861 668.509.012 670.957.999 673,389.138 671,385,732 684,081,015 697,628,734
$6,387,226 6,949,700 7,325,147 7,245,155 8,065,917 9,316,067 8.761,496 9,518,857 10,119,295 10.900.361 11.466,618 12.516.398 12.952.924 15,403,812 17,086,631 20,338,884 20,253,660 21,545,452 26,590,841 30,741.024 33,500,178 39.494,340
40,682,939 44,481,327 40,730,119 41,212,415 40,844,572 40,687,183 41,200,517 41,829,191 41.824,012 41.990,259 42,311,661 42.329.095 43.348.327 44.481.327
Percent 2.351 2.576 2.730 2.638 2.867 3.297 3.072 3.239 3.360 3.560 3.678 3.988 4.039 4.499 4.891 5.557 5.141 5.093 5.872 6.560 6.352 6.436
6.478 6.424 6.469 6.457 6.312 6.281 6.269 6.308 6.304 6.305 6.330 6.352 6.384 6.424
' Includes face amount of securities, except that current redemption value is used for savings bonds of series C-F and J. U.S. savings notes, and retirement plan bonds. The face value of matured savings bonds and savings notes outstanding is included until all of the annual series have matured, when the entire amount is transferred to matured debt on which interest has ceased.
"Comparable annual data 1916-54 are contained in 1962 Annual Report, p. 735. Current monthly figures are published in the Treasury Bulletin. Ck)mparable monthly data 1929-36 appear in 1936 Annual Report, p. 442. and from 1937 in later reports. Annual interest charge monthly 1916-29 appears in 1929 Annual Report, p. 509.
NOTE.—The computed annual interest charge represents the amount of interest that would be paid if each interest-bearing issue outstanding at the end of the month or year should remain outstanding for a year at the applicable annual rate of interest. The charge is computed for each issue by applying the appropriate annual interest rate to the amount outstanding on that date. Beginning Dec. 31, 1958. the computed average rate is based upon the rate of "effective yield for issues sold at premiums or discounts. Before that date the computed average rate was based upon the coupon rates of the securities. That rate did not materially differ from the rate on the basis of effective yield. The "effective yield" method of computing the average interest rate on the public debt more accurately reflects the interest cost to the Treasury, and is believed to be in accord with the intent of Congress where legislation has required the use of the rate of effective yield for various purposes.
Digitized for FRASER http://fraser.stlouisfed.org/ Federal Reserve Bank of St. Louis
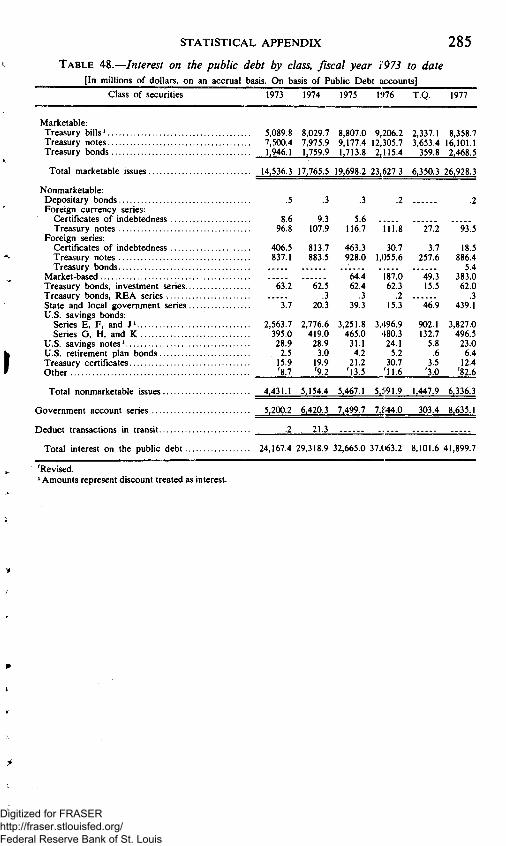
STATISTICAL APPENDIX 2 8 5
TABLE 48.—Interest on the public debt by class, fiscal year 1973 to date [In millions of dollars, on an accrual basis. On basis of Public Debt accounts]
Class of securities 1973 1974 1975 1!!76 Y ^ . 1977
Marketable: Treasury bills' 5,089.8 8,029.7 8,807.0 9,206.2 2,337.1 8,358.7 Treasury notes 7,500.4 7,975.9 9,177.4 12,305.7 3,653.4 16,101.1 Treasury bonds 1,946.1 1,759.9 1,713.8 2,115.4 359.8 2.468.5
Total marketable issues 14.536.3 17.765.5 19.698.2 23,627.3 6.350.3 26.928.3
Nonmarketable: Depositary bonds .5 .3 .3 .2 .2 Foreign currency series:
Certificates of indebtedness 8.6 9.3 5.6 Treasurynotes 96.8 107.9 116.7 111.8 27.2 93.5
Foreign series: Certificates of indebtedness 406.5 813.7 463.3 30.7 3.7 18.5 Treasurynotes 837.1 883.5 928.0 1.055.6 257.6 886.4 Treasury bonds 5.4
Market-based 64.4 187.0 49.3 383.0 Treasury bonds, investment series 63.2 62.5 62.4 62.3 15.5 62.0 Treasury bonds. REA series .3 .3 .2 .3 State and local goverament series 3.7 20.3 39.3 15.3 46.9 439.1 U.S. savings bonds:
Series E, F. and J ' 2,563.7 2.776.6 3,251.8 3.496.9 902.1 3.827.0 Series G, H. and K 395.0 419.0 465.0 480.3 132.7 496.5
U.S. savings notes' 28.9 28.9 31.1 24.1 5.8 23.0 U.S. retirement plan bonds . 2.5 3.0 4.2 5.2 .6 6.4 Treasury certificates 15.9 19.9 21.2 30.7 3.5 12.4 Other ^8.7 ^9.2 ^13.5 ^11.6 ^3.0 ^82.6
Total nonmarketable issues 4.431.1 5,154.4 5.467.1 5,!i91.9 1.447.9 6.336.3
Goverament account series 5.200.2 6.420.3 7.499.7 7.844.0 303.4 8.635.1
Deduct transactions in transit .2 . 21.3
Total interest on the public debt 24.167.4 29.318.9 32,665.0 37,063.2 8,101.6 41,899.7
'Revised. ' Amounts represent discount treated as interest.
Digitized for FRASER http://fraser.stlouisfed.org/ Federal Reserve Bank of St. Louis

V.—Prices and yields of securities
TABLE 49.—Average yields of taxable^ long-term Treasury bonds by month, January 1951-September 1977^ [Averages of daily figures. Percent per annum compounded semiannually]
Year Jan. Feb. Mar. Apr. May June July Aug. Sept, Oct. Nov. Dec. Average
to OO OS
1951 2.39 1952 2.74 1953 2.80 1954 2.69 1955 2.68
1956 2.88 1957 3.34 1958 3.24 1959 3.91 1960 4.37
1961 3.89 1962 4.08 1963 3.89 1964 4.15 1965 4.14
1966 4.43 1967 4.40 1968 5.18 1969 5.74 1970 6.86
1971 5.92 1972 5.62 1973 5.96 1974 6.56 1975 6.69
1976 6.93 1977 6.68
2.40 2.71 2.83 2.62 2.78
2.85 3.22 3.28 3.92 4.22
3.81 4.09 3.92 4.14 4.16
4.61 4.47 5.16 5.86 6.44
5.84 5.67 6.14 6.54 6.66
6.92 7.16
2.47 2.70 2.89 2.53 2.78
2.93 3.26 3.25 3.92 4.08
3.78 4.01 3.93 4.18 4.15
4.63 4.45 5.39 6.05 6.39
5.71 5.66 6.20 6.81 6.77
6.88 7.20
2.56 "2.64 "2.97
2.48 2.82
3.07 3.32 3.12 4.01 4.18
3.80 3.89 3.97 4.20 4.15
4.55 4.51 5.28 5.84 6.53
5.75 5.74 6.11 7.04 7.05
6.73 7.13
2.63 2.57 3.11 2.54 2.81
2.97 3.40 3.14 4.08 4.16
3.73 3.88 3.97 4.16 4.14
4.57 4.76 5.40 5.85 6.94
5.96 5.64 6.25 7.09 7.01
7.01 7.17
2.65 2.61 3.13 2.55 2.82
2.93 3.58 3.20 4.09 3.98
3.88 3.90 4.00 4.13 4.14
4.63 4.86 5.23 6.05 6.99
5.94 5.59 6.32 7.02 6.86
6.92 6.99
2.63 2.61 3.02 2.47 2.91
3.00 3.60 3.36 4.11 3.86
3.90 4.02 4.01 4.13 4.15
4.75 4.86 5.09 6.07 6.57
5.91 5.59 6.53 7.18 6.89
6.85 6.98
2.57 2.70 3.02 2.48 2.95
3.17 3.63 3.60 4.10 3.79
4.00 3.98 3.99 4.14 4.19
4.80 4.95 5.04 6.02 6.75
5.78 5.59 6.85 7.33 7.11
6.82 7.01
2.56 2.71 2.98 2.52 2.92
3.21 3.66 3.75 4.26 3.84
4.02 3.94 4.04 4.16 4.25
4.79 4.99 5.09 6.32 6.63
5.56 5.70 6.41 7.30 7.28
6.70 6.94
2.61 2.74 2.83 2.54 2.87
3.20 3.73 3.76 4.11 3.91
3.98 3.89 4.07 4.16 4.28
4.70 5.19 5.24 6.27 6.59
5.46 5.69 6.25 7.22 7.29
6.65
2.66 2.71 2.86 2.57 2.89
3.30 3.57 3.70 4.12 3.93
3.98 3.87 4.11 4.12 4.34
4.74 5.44 5.36 6.52 6.24
5.48 5.51 6.30 6.93 7.21
6.62
2.70 2.75 2.79 2.59 2.91
3.40 3.30 3.80 4.27 3.88
4.06 3.87 4.14 4.14 4.43
4.65 5.36 5.66 6.81 5.97
5.62 5.63 6.35 6.77 7.17
6.38
2.57 2.68 2.94 2.55 2.84
3.08 3.47 3.43 4.08 4.02
3.90 3.95 4.00 4.15 4.21
4.65 4.85 5.26 6.12 6.58
5.74 5.64 6.31 6.98 7.00
6.78
73 tfl
i H
O
tfl ifi
^ T3
T3
^ §
tfl
rl 73 tfl > C/)
' Taxable bonds are those on which the interest is subject to both the normal and surtax rates ofthe Federal income tax. This average commenced Oct. 20, 1941.
"Prior to October 1941 yields were on partially tax-exempt long-term bonds. For January 1930 through December 1950, see the 1956 Annual Report, p. 492, and for January 1919 through December 1929, see the 1943 Annual Report, p. 662.
"Beginning Oct. 20, 1941, through Mar. 31, 1952, yields are based on bonds neither due nor callable for 15 years; beginning Apr. 1, 1952, through Mar. 31, 1953, on bonds neither due nor callable for 12 years; beginning Apr. 1, 1953, on bonds neither due nor callable for 10 years. -- ^ A . ^ J ^ ^ ^ -^ ^ > ^ _
NOTE.—For bonds selling above par and callable at par before maturity, the yields are computed on the basis of redemption at first call date; while for bonds selling below par, yields are computed to maturity. Monthly averages are averages of daily figures. Eiach daily figure is an unweighted average of the yields of the individual issues. Yields before 1953 are computed on the basis of the mean of closing bid and ask quotations in the over-the-counter market. Commencing April 1953, yields, as reported by the Federal Reserve Bank of New York, are based on over-the-counter closing bid quotations. See Treasury Bulletin for current monthly yields.
i tfl^ ; ^ 1 t k •» >
Digitized for FRASER http://fraser.stlouisfed.org/ Federal Reserve Bank of St. Louis

TABLE 50.-
Issue'
-Prices and yields of marketable public debt issues Sept. 30, 1976 and 1977, and price range since first traded [Prices are in 32d's and -|- indicates additional 64th's]
Sept. 30, 1976
Price
Bid
86.16 85.14 92.16 89.12
100.16 97.00 95.04 85.14 92.08 86.08 85.30 98.18 85.26 85.08
105.06
92.06 92.30
106.08 85.08
100.24 105.08 102.02 85.12
104.12
100.01 100.02 100.08 100.13 100.29 100.05 100.14 100.31
Ask
87.16 85.30 93.00 90.12
101.16 97.16 96.04 86.14 93.08 87.08 86.30 99.18 86.26 86.08
105.22
93.'o'6 93.30
106.24 86.08
101.00 105.24 102.06 86.12
104.28
100.05 100.06 100.12 100.17 101.01 100.09 100.18 101.03
Yield to call or
maturity"
Percent 6.30 5.91 6.52 6.48 6.88 7.06 7.20 5.38 7.22 5.57 5.30 7.65 5.38 5.03 7.63
7".'5'9 7.67 7.84 4.16 7.80 7.84 7.79 4.56 7.84
5.91 5.56 5.37 5.43 5.40 5.58 5.58 5.64
Sept
Price
Bid
83.26 83.16 94.06 91.24
100.00 97.14 95.08 79.26 93.12 79.10 78.30
100.20 78.18 78.08
106.10 98.01 95.14 95.30
107.24 78.06
102.04 106.20 103.04 78.14
105.26 99.10
. 30, 1977
Ask
84.26 84.16 94.22 92.08
100.16 97.30 96.08 80.26 94.12 80.10 79.30
101.20 79.18 79.08
106.26 98.05 96.14 96.30
108.08 79.06
102.12 107.04 103.12 79.14
106.10 99.18
Yield to call or
maturity"
Percent 7.03 6.79 6.69 6.46 7.00 7.07 7.27 6.67 7.13 6.43 6.14 7.42 6.21 6.02 7.47 7.47 7.25 7.39 7.67 4.88 7.65 7.69 7.68 5.19 7.70 7.68
Price
105.28 111.28 103.18 97.24
110.02 101.14 100.10 101.04 100.20 104.10 100.11 104.14 100.26 106.26 111.05 99.10 99.22 99.22
112.16 101.12 107.04 111.16 108.10 95.14
110.24 100.28
100.24 103.27 101.12 102.00 114.08 100.10 100.24 101.24
Price range since
High
Date
May 5, 1961 Aug. 4, 1954 May 12, 1961 May 12, 1961 Nov. 15, 1971 Mar. 9, 1972 Dec. 3, 1976 May 11, 1958 Nov. 5, 1971 Dec. 26, 1962 Jan. 16, 1963 Sept. 28, 1973 Aug. 28, 1963 Apr. 21, 1958 Dec. 31. 1976 June 29, 1977 Jan. 4, 1973 Sept. 28, 1973 Dec. 31, 1976 June 18, 1955 Dec. 31, 1976 Dec. 31, 1976 Dec. 31, 1976 May 12, 1961 Dec. 31, 1976 June 28, 1977
Jan. 30. 1976 Dec. 28, 1971 June 16. 1975 Feb. 19. 1975 Mar. 22. 1971 Apr. 14, 1976 Apr. 15, 1976 Jan. 30, 1976
first traded
Price
66.30 62.02 71.04 66.24 93.16 86.16 87.12 61.08 85.04 63.00 62.18 8916 61.26 59.20 97.00 97.10 82.18 84.04 97.02 59.20 91.22 96.04 99.30 59.20 95.00 97.19
98.10 94.02 98.31 99.03 98.08 97.03 97.18 98.23
2
Low
Date
May 26, May 26, Dec. 29,
^May 24, Sept. 18, Aug. 28, Aug. 27. May 26. Sept. 29. May 26. May 26. Aug. 26. Aug. 26. May 26. Sept. 12. Aug. 16. Aug. 26. Aug. 26. Aug. 26. May 26. Sept. 16, Sept. 16, Aug. 10, May 26, Sept. 15,
May 6,
Aug. 15, Aug. 23, Aug. 15, Aug. 15, Aug. 23, Sept. 11, Aug. 15, Sept. 16,
1970 1970 1969 1970 1974 1974 1974 1970 1974 1970 1970 1974 1974 1970 1975 1977 1974 1974 1974 1970 1975 1975 1976 1970 1975 1977
1975 1973 1975 1975 1974 1975 1975 1975
2 >
H O >
>
tfl
z u X
N> 0 0 --J
Treasury bonds: A'A% May 15, 1975-85 3'/4% June 15, 1978-83 4% Feb. 15, 1980 3'/2% Nov. 15, 1980 7% Aug. 15, 1981. 63/8% Feb. 15, 1982 d%% Aug. 15, 1984 3 ' / .% May 15, 1985 d'A% Nov. 15, 1986 4'/.% Aug. 15, 1987-92 4% Feb. 15, 1988-93 l'A% Aug. 15, 1988-93 4»/8% May 15, 1989-94 3'/a% Feb. 15, 1990 8'/«% May 15, 1990 l'A% Aug. 15, 1992 6"/.% Feb. 15, 1993 7% May 15, 1993-98 8'/,% May 15. 1994-99 3% Feb. 15, 1995 7'/8% Feb. 15, 1995-00 8y8% Aug. 15, 1995-00 8% Aug. 15, 1996-01 3'/2% Nov. 15, 1998 8'/,% May 15, 2000-05 7y8% Feb. 15, 2002-07
Treasury notes: d'A% Oct. 31, 1976-0 d'A% Nov. 15, 1976-D 7'/8% Nov. 30, 1976-N l'A% Dec. 31, 1976-K 8% Feb. 15, 1977-A 6% Feb. 28, 1977-F d'A% Mar. 31. 1977-G 7y8% Apr. 30. 1977-H
See footnotes at end of table. Digitized for FRASER http://fraser.stlouisfed.org/ Federal Reserve Bank of St. Louis

TABLE 50.- -Prices and yields of marketable public debt issues Sept. 30, 1976 and 1977, and price range since first traded-[Prices are in 32d's and -|- indicates additional 64th's]
-Continued
Issue'
Sept. 30. 1976 Sept. 30. 1977 Price range since first traded"
Price
Bid Ask
Yield to call or
maturity"
Price
Bid Ask
Yield to call or
maturity"
High Low
Price Date Price Date
ro oo oo
Treasury notes—Continued 6'/9% May 15. 1977-C.. . . 9% May 15. 1977-D 6y4% May 31. 1977-1 d'A% June 30. 1977-J l'A% July 31. 1977-K.. . . 7y4% Aug. 15. 1977-B.... 8'/4% Aug. 31. 1977-L.... 8y8% Sept. 30. 1977-M... l'A% Oct. 31. 1977-N.. . . 7y4% Nov. 15. 1977-E.... 6y8% Nov. 30. 1977-Q.... 7'/4% Dec. 31, 1977-P.. . . 6y8% Jan. 31, 1978-J 6'/,% Feb. 15. 1978-A... . 8% Feb. 28. 1978-G 6y4% Mar. 31. 1978-K.... d'A% Apr. 30. 1978-L.. . . 7'/8% May 15. 1978-D... . 7'/8% May 15. 1978-F. . . . 7'/8% May 31. 1978-M.... 6'/8% June 30, 1978-N.... 6'/8% July 31. 1978-P 7y8% Aug. 15. 1978-E.... 8y4% Aug. 15, 1978-C.... 6y8% Aug. 31. 1978-Q.... 6'/4% Sept. 30. 1978-R.... 5'/8% Oct. 31, 1978-S 6% Nov. 15. 1978-B 5y4% Nov. 30. 1978-T.... 5'/4% Dec. 31. 1978-U.... 8'/8% Dec. 31, 1978-H..., 5'/8% Jan. 31. 1979-L 7% Feb. 15. 1979-H 5'/8% Feb. 28, 1979-M.... 6% Mar. 31, 1979-N 5'/8% Apr. 30, 1979-P.. . .
100.22 101.31 100.20 100.18 101.14 101.23 102.06 102.13 101.21 101.30 100.23 101.15 100.13 100.06 102.17 100.28 100.16 101.14 102.16 101.13 101.00 101.00 102.07 104.07 100.18 99.28
103.16
100.26 102.03 100.24 100.22 101.18 101.27 102.10 102.17 101.25 102.02 100.27 101.19 100.17 100.10 102.21 101.00 100.20 101.18 102.20 101.17 101.04 101.02 102.11 104.11 100.20 99.30
99.12 99.16
101.04
103.20
101.08
Percent 5.72 5.70 5.77 5.71 5.69 5.69 5.74 5.84 5.89 5.93 5.97 6.00 6.05 6.10 6.10 6.13 6.16 6.18 6.22 6.22 6.26 6.29 6.35 6.32 6.31 6.32
' 6.32
6.42
'6."4'8
Percent
100.01 100.04 100.00 100.05 99.31 99.30 100.20 100.04 99.31 100.10 100.25 100.12 100.06 100.06 100.25 101.24 99.31 99.20 99.06 99.10 99.00 98.10 101.22 98.30 100.12 98.28 99.00 98.24
100.03 100.06 100.02 100.07 100.01 100.00 100.24 100.06 100.03 100.14 100.29 100.16 100.10 100.10 100.29 101.28 100.03 99.24 99.10 99.14 99.04 98.14 101.26 98.02 100.16 99.00 99.04 98.28
6.87 6.48 6.48 6.47 6.40 6.37 6.38 6.48 6.56 6.60 6.57 6.54 6.61 6.64 6.68 6.64 6.66 6.65 6.67 6.65 6.66 6.69 6.69 6.72 6.71 6.72 6.72 6.72
101.13 105.19 101.00 101.00 102.01 114.00 103.03 103.11 102.08 103.19 101.20 102.12 101.16 106.20 103.15 102.05 101.30 102.22 103.25 102.26 102.17 102.18 103.24 106.10 102.06 101.20 101.01 101.08 100.28 99.27 105.08 100.09 103.09 100.11 100.18 99.28
Feb. 21. 1975 Feb. 21. 1975 Apr. 14. 1976 Dec. 3. 1976 Jan.! 29. 1976 Mar. 22, 1971 Jan. 12, 1976 Jan. 12, 1976 Dec. 7, 1976 Feb. 21, 1975 Dec. 3, 1976 Dec. 3, 1976 Dec. 7, 1976 Mar. 22. 1971 Dec. 3. 1976 Dec. 3. 1976 Dec. 3. 1976 Dec. 3. 1976 Dec. 3. 1976 Dec. 3. 1976 Dec. 3. 1976 Dec. 3. 1976 Dec. 3. 1976 Feb. 5. 1975 Dec. 3. 1976 Dec. 10. 1976 Dec. 10. 1976 Dec. 3. 1976 Dec. 10, 1976 Dec. 27. 1976 Dec. 3. 1976 Apr. 14. 1977 Dec. 2, 1976 Apr. 14. 1977 Apr. 14. 1977 Apr. 20. 1977
94.29 99.31 97.17 97.00 98.18 97.04 99.26 100.03 100.01 98.30 99.08 100.02 98.20 92.06 99.12 99.00 98.17 96.27 98.16 99.18 99.22 99.29 97.26 99.24 99.28 99.18 99.04 90.10 98.29 98.07 100.07 98.29 98.23 98.26 98.28 98.23
Aug. 26. Aug. 23, Sept. 16. Sept. 16. Sept. 16. Aug. 26. Sept. 15. Sept. 17. Sept. 30, Sept. 16, May 27, May 27, May 27, Aug. 23, Sept. 30. May 27. May 27. Sept. 16. Sept. 16. May 27. June 28. July 21, Sept. 16. Aug. 23. Aug. 20. Sept. 26. Sept. 28, Aug. 23, Sept. 13, Sept. 13. Oct. 15. Sept. 13, Mar. 4, Sept. 26, Aug. 16, Aug. 16,
1974 1974 1975 1975 1975 1974 1975 1975 1977 1975 1976 1976 1976 1974 1975 1976 1976 1975 1975 1976 1976 1976 1975 1974 1976 1977 1977 1974 1977 1977 1975 1977
1976 1977 1977 1977
70 tfl
S 70 H O
H X tfl (/) tfl
o 73
> 73
O ^ H X tfl H 73 tfl > ifi
a 73
Digitized for FRASER http://fraser.stlouisfed.org/ Federal Reserve Bank of St. Louis
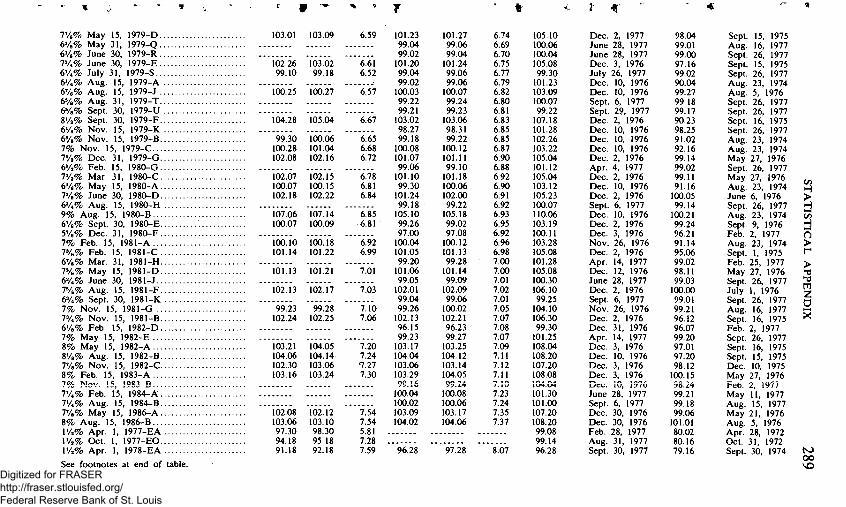
f
7'/8% May 15. 1979-D 103.01 103.09 6'/8% May 31. 1979-Q 6'/8% June 30. 1979-R 7y4% June 30. 1979-E 102.26 d'A% July 31. 1979-S 99.10 6'/.% Aug. 15. 1979-A 6'/8% Aug. 15. 1979-J 100.25 100.27 6y8% Aug. 31. 1979-T 6y8% Sept. 30. 1979-U 8'/2% Sept. 30. 1979-F 104.28 105.04 6'/4% Nov. 15. 1979-K 6y8% Nov. 15, 1979-B 99.30 7% Nov. 15, 1979-C 100.28 VA% Dec. 31, 1979-G 102.08 d'A% Feb. 15, 1980-G VA% Mar. 31, 1980^C 102.07 6'/8% May 15, 1980-A 100.07 7y8% June 30, 1980-D 102.18 6y4% Aug. 15, 1980-H 9% Aug. 15, 1980-B 107.06 6'/8% Sept. 30, 1980-E 100.07 5'/8% Dec. 31, 1980-F 7% Feb. 15, 1981-A 100.10 7y8% Feb. 15, 1981-C 101.14 6'/8% Mar. 31, 1981-H 7y8% May 15, 1981-D 101.13 101.21 6y4% June 30, 1981-J 7y8% Aug. 15, 1981-F 102.13 102.17 6y4% Sept. 30. 1981-K 7% Nov. 15. 1981-G 99.23 7y4% Nov. 15. 1981-B 102.24 6'/8% Feb. 15. 1982-D 7% May 15. 1982-E 8% May 15. 1982-A 103.21 8'/8% Aug. 15. 1982-B 104.06 7'/8% Nov. 15. 1982-C 102.30 8% Feb. 15, 1983-A 103.16 nof, Nov. 15 1983 B 7%% Feb.*"i5,*^984^A;:::::::::::.:::::::::: VA% Aug. 15, 1984-B 7'/8% May 15, 1986-A 102.08 8% Aug. 15, 1986-B 103.06 l'/2% Apr. 1, 1977-EA 97.30 \'A% Oct. 1, 1977-EO 94.18 l'/2% Apr. 1, 1978-EA 91.18
See footnotes at end of table.
103.02 99.18
100.06 101.04 102.16
102.15 100.15 102.22
107.14 100.09
"l'00."l"8 101.22
99.28 102.25
104.05 104.14 103.06 103.24
102.12 103.10 98.30 95.18 92.18
6.59 101.23 99.04 99.02
6.61 101.20 6.52 99.04
..... 99.02 6.57 100.03
99.22 99.21
6.67 103.02 98.27
6.65 99.18 6.68 100.08 6.72 101.07
99.06 6.78 101.10 6.81 99.30 6.84 101.24
99.18 6.85 105.10 • 6.81 99.26
97.00 6.92 100.04 6.99 101.05
99.20 7.01 101.06
99.05 7.03 102.01
99.04 7.10 99.26 7.06 102.13
96.15 99.23
7.20 103.17 7.24 104.04 7.27 103.06 7.30 103.29
7.54 7.54 5.81 7.28 7.59
100.04 100.02 103.09 104.02
96.28
101.27 99.06 99.04 101.24 99.06 99.06 100.07 99.24 99.23 103.06 98.31 99.22 100.12 101.11 99.10 101.18 100.06 102.00 99.22 105.18 99.02 97.08 100.12 101.13 99.28 101.14 99.09 102.09 99.06 100.02 102.21 96.23 99.27
103.25 104.12 103.14 104.05
l66:08 100.06 103.17 104.06
6.74 6.69 6.70 6.75 6.77 6.79 6.82 6.80 6.81 6.83 6.85 6.85 6.87 6.90 6.88 6.92 6.90 6.91 6.92 6.93 6.95 6.92 6.96 6.98 7.00 7.00 7.01 7.02 7.01 7.05 7.07 7.08 7.07 7.09 7.11 7.12 7.11
7:23 7.24 7.35 7.37
97.28 8.07
105.10 100.06 100.04 105.08 99.30 101.23 103.09 100.07 99.22 107.18 101.28 102.26 103.22 105.04 101.12 105.04 103.12 105.23 100.07 110.06 103.19 100.11 103.28 105.08 101.28 105.08 100.30 106.10 99.25 104.10 106.30 99.30 101.25 108.04 108.20 107.20 108.08 i«-r4.w4
101.30 101.00 107.20 108.20 99.08 99.14 96.28
Dec. Apr. Dec.
Dec. 2, 1977 June 28, 1977 June 28, 1977 Dec. 3, 1976 July 26, 1977 Dec. 10, 1976 Dec. 10, 1976 Sept. 6, 1977 Sept. 29, 1977 Dec. 2. 1976 Dec. 10. 1976 Dec. 10. 1976 Dec. 10. 1976
2. 1976 4. 1977 2. 1976
Dec. 10. 1976 Dec. 2. 1976 Sept. 6, 1977 Dec. 10. 1976 Dec. 2. 1976 Dec. 3, 1976 Nov. 26, 1976 Dec. 2, 1976 Apr. 14, 1977 Dec. 12. 1976 June 28. 1977 Dec. 2. 1976 Sept. 6. 1977 Nov. 26. 1976 Dec. 2, 1976 Dec. 31. 1976 Apr. 14. 1977 Dec. 3. 1976 Dec. 10. 1976 Dec. 3. 1976 Dec. 3. 1976 Dec. 10, 1976 June 28, 1977 Sept. 6, 1977 Dec. 30, 1976 Dec. 30, 1976 Feb. 28, 1977 Aug. 31, 1977 Sept. 30, 1977
98.04 99.01 99.00 97.16 99.02 90.04 99.27 99.18 99.17 90.23 98.25 91.02 92.16 99.14 99.02 99.11 91.16 100.05 99.14 100.21 99.24 96.21 91.14 95.06 99.02 98.11 99.03 100.00 99.01 99.21 96.12 96.07 99.20 97.01 97.20 98.12 100.15 9S.24 99.21 99.18 99.06 101.01 80.02 80.16 79.16
Sept. 15, 1975 Aug. 16, 1977 Sept. 26, 1977 Sept. 15, 1975 Sept. 26, 1977 Aug. 23, 1974 Aug. 5, 1976 Sept. 26, 1977 Sept. 26, 1977 Sept. 16, 1975 Sept. 26. 1977 Aug. 23. 1974 Aug. 23, 1974 May 27. 1976 Sept. 26, 1977 May 27, 1976 Aug. 23, 1974 June 6. 1976 Sept. 26. 1977 Aug. 23, 1974 Sept. 9. 1976 Feb. 2. 1977 Aug. 23. 1974 Sept. 1. 1975 Feb. 25, 1977 May 27. 1976 Sept. 26. 1977 July 1. 1976 Sept. 26. 1977 Aug. 16. 1977 Sept. 16, 1975 Feb. 2, 1977 Sept. 26, 1977 Sept. 16, 1975 Sept. 15. 1975 Dec. 10. 1975 May 27, 1976 reb. 2. 197/ May 11. 1977 Aug. 15. 1977 May 21. 1976 Aug. 5. 1976 Apr. 28. 1972 Oct. 31. 1972 Sept. 30. 1974
ifi H >
H O > r >
tfl z a
to 00
Digitized for FRASER http://fraser.stlouisfed.org/ Federal Reserve Bank of St. Louis

TABLE 50.—Prices and yields of marketable public debt issues Sept. 30, 1976 and 1977, and price range since first traded—Continued ^ [Prices are in 32d's and -\- indicates additional 64th*s]
Sept. 30, 1976 Sept. 30, 1977 Price range since first traded"
Issue' Price
Bid Ask
Yield to call or
maturity
Price
Bid Ask
Yield to call or
maturity'
High Low
Price Date Price Date
t o VO o
Treasury notes—Continued \'A% Oct. 1, 1 9 7 8 - E O . . . . \'A% Apr. 1, 1979-EA.. . \'A% Oct. 1, 1979-EO.... \'A% Apr. 1, 1980-EA.. . \'A% Oct. 1, 1980-EO.... \'A% Apr. 1, 1981-EA.. . \'A% Oct. 1, 1981-EO.... \'A% Apr. 1, 1982-EA.. . \'A% Oct. 1, 1982-EO....
89.06 86.16 84.12 82.04 80.00 77.20
90.06 87.16 85.12 83.04 81.00 78.20
Percent 7.44 7.54 7.42 7.40 1.31 7.45
94.08 92.04 90.02 88.04 85.24 83.20 81.18 79.18 77.16
95.08 93.04 91.02 89.04 86.24 84.20 82.18 80.18 78.16
Percent 7.61 7.15 6.92 6.75 6.84 6.85 6.85 6.86 6.90
94.08 92.04 90.02 88.04 85.24 83.20 82.26 79.18 77.16
Sept. 30, 1977 Sept. 30, 1977 Sept. 30, 1977 Sept. 30, 1977 Sept. 30, 1977 Sept. 30, 1977 July 31, 1977 Sept. 30, 1977 Sept. 30, 1977
77.20 75.12 73.04 74.10 72.00 74.00 76.20 78.00 77.16
Sept. 30, 1974 Sept. 30, 1974 Oct. 31, 1974 Apr. 30, 1975 Oct. 1, 1975 May 28, 1976 Oct. 1, 1976 Mar. 31, 1977 Sept. 30, 1977
73 tfl
S 73 H O
H X tfl ifi tfl n 73 tfl H > 73 ><
o H X tfl
ifi C 73
' Excludes Treasury bills, which are fully taxable. For description and amount of each issue outstanding on Sept. 30. 1977, see table 28; for information as of Sept. 30, 1976, see 1976 Statistical Appendix, p. 83.
"Beginning April 1953, prices are closing bid quotations. Prices for prior dates are the mean of closing bid and ask quotations; "when issued" prices are included in price range. Dates of highs and lows in case of recurrence are the latest dates. Issues with original maturity of less than 1 year are excluded.
'Yields are based on bid prices and are computed to earliest call date when prices are above par and to maturity date when prices are at par or below.
NOTE.—Prices and yields (based on closing bid prices) on Sept. 30, 1976 and 1977 are over-the-counter quotations, as reported to the Department of the Treasury by the Federal Reserve Bank of New York. Yields are percent per annum compounded semiannually except that on securities having only one interest payment, they are coniputed on a simple interest basis.
^ " «
Digitized for FRASER http://fraser.stlouisfed.org/ Federal Reserve Bank of St. Louis

VI.—Ownership of Federal securities
TABLE 51.—Estimated ownership of Federal securities outstanding June 30, 1965-76, and Sept. 30, 1976-77 [Par value.' In billions of dollars]
y , Held by banks Held bv ^^^^ ^^ private nonbank investors
amount r^«^.„«. Federal U.S. Gov- T^^A,;^ T«C....O«^O Mutual r^^^^ State and Miscella-out- Total ^ ^ , 7 S ; Reserve erament Totals ' ^^^md- Insurance ^ C o ^ local gov- neous
standing"' * * *' "*' banks accounts "^^^ companies ^^^^^ rations ernments« investors"
I. Public debt issues
June 30, 1965 1966 1967 1968 1969 1970 1971 1972 1973 1974 1975 1976
Sept. 30, 1976 1977
313.8 316.1 322.9 345.4 352.9 370.1 397.3 426.4 457.3 474.2 533.2 620.4 634.7 698.8
97.3 97.0 102.2 111.9 109.4 110.3 126.5 132.3 133.8 133.6 '153.8 '187.0 '191.7 205.7
58.2 54.8 55.5 59.7 55.3 52.6 61.0 60.9 58.8 53.2 69.0 '92.5 '95.3 101.0
39.1 42.2 46.7 52.2 54.1 57.7 65.5 71.4 75.0 80.5 84.7 94.4 96.4 104.7
61.1 64.3 71.8 76.1 84.8 95.2 102.9 111.5 123.4 138.2 145.3 149.6 146.1 155.5
155.5 154.9 148.9 157.3 158.7 164.6 168.0 182.7 200.1 202.4 234.1 '283.8 '296.9 337.6
70.7 72.8 70.4 74.2 77.3 81.8 75.4 73.2 75.9 80.7 87.1 96.4 99.7 103.9
10.7 10.0 9.0 8.5 8.1 7.2 7.0 6.7 6.3 5.9 7.1
'10.6 '11.7 14.5
5.6 5.0 4.2 4.0 3.5 3.2 3.3 3.5 3.3 2.6 3.6 '5.4 '5.7 6.1
15.3 14.2 11.0 12.0 11.1 8.5 7.4 9.3 9.8 10.8 13.2 '24.3 '25.3 23.9
24.1 24.5 23.6 25.1 26.4 29.0 25.9 26.9 28.8 28.3 '31.7 '393 '38.7 53.5
29.1 28.3 30.6 33.4 32.3 35.0 49.0 63.2 76.0 74.1 '91.5
'107.8 '115.8 135.8
ifi H > H i n H n > r > tfl z a
Digitized for FRASER http://fraser.stlouisfed.org/ Federal Reserve Bank of St. Louis

Digitized for FRASER http://fraser.stlouisfed.org/ Federal Reserve Bank of St. Louis
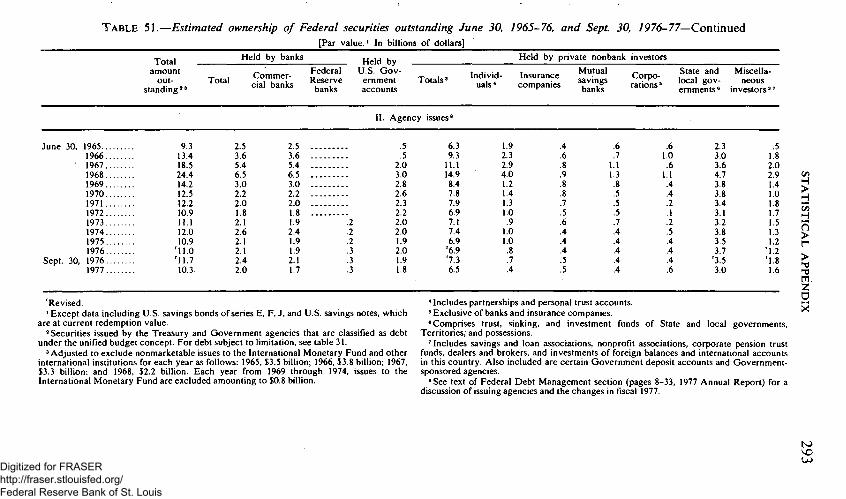
TABLE 51.—Estimated ownership of Federal securities outstanding June 30, 1965-76, and Sept. 30, 7976-77—Continued [Par value.' In billions of dollars]
Total amount
outstanding " =
Held by banks
Total Commercial banks
Federal Reserve
banks
Held by U.S. Gov
erament accounts
Held by private nonbank investors
Totals ' Individuals*
Insurance companies
Mutual savings banks
Corporations '
State and Miscella-local gov- neous eraments* investors"
II. Agency issues^
June 30, 1965 9.3 2.5 2.5 .5 6.3 1.9 1966 13.4 3.6 3.6 .5 9.3 2.3
' 1967 18.5 5.4 5.4 2.0 11.1 2.9 1968 24.4 6.5 6.5 3.0 14.9 4.0 1969 14.2 3.0 3.0 2.8 8.4 1.2 1970 12.5 2.2 2.2 2.6 7.8 1.4 1971 12.2 2.0 2.0 2.3 7.9 1.3 1972 10.9 1.8 1.8 2.2 6.9 1.0 1973 11.1 2.1 1.9 .2 2.0 7.1 .9 1974 12.0 2.6 2.4 .2 2.0 7.4 1.0 1975 10.9 2.1 1.9 .2 1.9 6.9 1.0 1976 '11.0 2.1 1.9 .3 2.0 '6.9 .8
Sept. 30. 1976 '11.7 2.4 2.1 .3 1.9 '7.3 .7 1977 10.3 2.0 1.7 .3 1.8 6.5 .4
.6
.7 1.1 1.3 .8 .5 .5 .5 .7 .4 .4 .4 .4 .4
.6 1.0 .6
1.1 .4 .4 .2 .1 .2 .5 .4 .4 .4 .6
2.3 3.0 3.6 4.7 3.8 3.8 3.4 3.1 3.2 3.8 3.5 3.7
'3.5 3.0
.5 1.8 2.0 2.9 1.4 1.0 1.8 1.7 1.5 1.3 1.2
'1.2
in H > H
H O > r > » ^ tfl^ z a 'Revised.
' Except data including U.S. savings bonds of series E, F, J. and U.S. savings notes, which are at current redemption value.
"Securities issued by the Treasury and Government agencies that are classified as debt under the unified budget concept. For debt subject to limitation, see table 31.
'Adjusted to exclude nonmarketable issues to the International Monetary Fund and other international institutions for each year as follows: 1965, $3.5 billion; 1966. $3.8 billion; 1967. $3.3 billion; and 1968, $2.2 billion. Each year from 1969 through 1974. issues to the International Monetary Fund are excluded amounting to $0.8 billion.
* Includes partnerships and personal trust accounts. ' Exclusive of banks and insurance companies. * Comprises trust, sinking, and investment funds of State and local governments.
Territories, and possessions. 'Includes savings and loan associations, nonprofit associations, corporate pension trust
funds, dealers and brokers, and investments of foreign balances and international accounts in this country. Also included are certain Goverament deposit accounts and Government-sponsored agencies.
*See text of Federal Debt Management section (pages 8-33, 1977 Annual Report) for a discussion of issuing agencies and the changes in fiscal 1977.
to VO
Digitized for FRASER http://fraser.stlouisfed.org/ Federal Reserve Bank of St. Louis

294 1977 REPORT OF THE SECRETARY OF THE TREASURY
TABLE 52.—Summary of Treasury survey of ownership [Par value. In
Classification
Number of institutions or funds
Public debt issues: Interest-bearing public debt securities:
Marketable Nonmarketable'
Total interest-bearing public debt securities
Matured debt and debt bearing no interest
Total public debt securities
Govemment agency issues: Regular issues Participation certificates'
Total Govemment agency securities covered in Treasury survey
Nonsurveyed Govemment agency securities
Total Goverament agency securities
Total Federal securities
Memorandum: Securities issued by selected Goverament-SDonsored aeencies *
Total amount outstanding'
Sept. 30
1976
407.663 225.897
633,560
1, 42
634,702
5,146 4,395
9,541
'2.137
'11,678
'646,380
'^87. 74
1977
443.508 254. 21
697.629
1.211
698,840
4,297 4.018
8,315
1.933
10,298
709,138
91,506
U.S. Goverament
accounts and Federal
Reserve banks
Sept. 30
1976
113,068 129,464
242,532
242,532
267 1,813
2,080
141
2,221
244,753
6,673
1977
116,834 143.372
260,205
260,205
236 1,734
1,970
124
2,094
262,299
7.220
Total private investors
Sept. 30
1976
294,595 96,433
391,028
1.142
392.170
4,879 2,582
7,461
'1,996
'9,457
'401.627
80,511
1977
326,674 110.750
437.423
1,211
438,635
4.061 2,284
6,345
1,859
8,204
446,839
84,286
Held by private investors covered in j
1 Treasury survey
Commercial banks"
Sept. 30
1976
5.508
70.201
70,201
70.201
1.053 577
1,630
....
18,175
1977
5,492
75,132 (•)
75,132
75.132
774 552
1,326
....
17,711
Mutual savings banks"
Sept. 30
1976
471
3,975
3,975
3,975
222 199
421
3,372
1977 1
466
4,422
4,422
4,422
177 203
380
• - 1
3,501
'Rev i sed . 'Secur i t ies issued by the Treasury and G o v e r a m e n t agencies that are classifieid as Federa l debt under the
unified budge t concept . F o r debt subject to limitation, see table 31. " Excludes trust depar tments . ' I n c l u d e d wi th all o ther investors are those banks, insurance companies , savings and loan associations,
corpora t ions , and State and local g o v e r a m e n t funds not repor t ing in the Treasury survey. Also included are certain G o v e r a m e n t deposit accounts and Goverament - sponsored agencies.
* Consists of co rpora te pension trust funds and profit-sharing plans wh ich involve ret i rement benefits. Quar te r ly data are presented in the Survey of Ownersh ip section of the Treasury Bulletin.
' Se r i e s E U.S. savings bonds and U.S. savings notes a re included at cur ren t redempt ion value.
Digitized for FRASER http://fraser.stlouisfed.org/ Federal Reserve Bank of St. Louis

STATISTICAL APPENDIX 295 of Federal securities, Sept. 30, 1976 and 1977 millions of dollars]
Held by private investors covered in Treasury survey—Continued
Insurance companies
Life
Sept. 30
1976
288
3,914
3,914
3,914
126 63
189
502
1977
289
3,969
3,969
3,969
85 100
185
797
Fire, casualty
and marine
Sept. 30
1976
439
5,740
5,740
5,740
43 167
210
1,082
1977
439
7,564
7,564
7,564
40 177
217
1.430
Savings and loan associa
tions
Sept. 30
1976
486
4.439
4,439
4,439
139 79
218
3.637
1977
486
5.179
5.179
5,179
99 204
303
4,488
Corporations
Sept. 30
1976
451
14.102
14.102
14, 02
190 96
286
1,596
1977
440
11.126 («)
11,126
11.126
182 116
298
1.154
State and local goveraments
General funds
Sept. 30
1976
374
8.866
8.866
8,866
266 225
491
...
4,352
1977
311
12.153 («)
12,153
12.153
232 159
391
4,926
Pension and retirement funds
Sept. 30 .
1976
186
2,600
0
2,600
2,600
279 740
1,019
1,490
1977
185
4,807
4,807
4,807
300 579
879
1,950
All other private
investors'
Sept. 30
1976
180,759 96,432
277,191
1,142
278,333
2,561 436
2,997
46,305
1977
202,322 110,750
313,071
1,211
314,282
2,171 195
2,366
48,328
Memorandum* Held by
corporate pension
trust funds*
Sept. 30
1976
61,262
8,203
8,203
8,203
102 190
292
...
2,222
1977
63,451
10,622 («)
10,622
10,622
97 422
519
3,408
*Data on holdings of nonmarketable public debt were no longer collected beginning; with the July 1974 Treasury Survey of Ownership.
' Export-Import Bank and Govemment National Mortgage Association issues. "Federal home loan banks. Federal land banks, beginning in 1969, the Federal National Mortgage
Association, banks for cooperatives, and Federal intermediate credit banks, and beginning in 1970, the Farmers Home Administration.
* Includes securities issued for use as collateral for short-term borrowings.
Digitized for FRASER http://fraser.stlouisfed.org/ Federal Reserve Bank of St. Louis
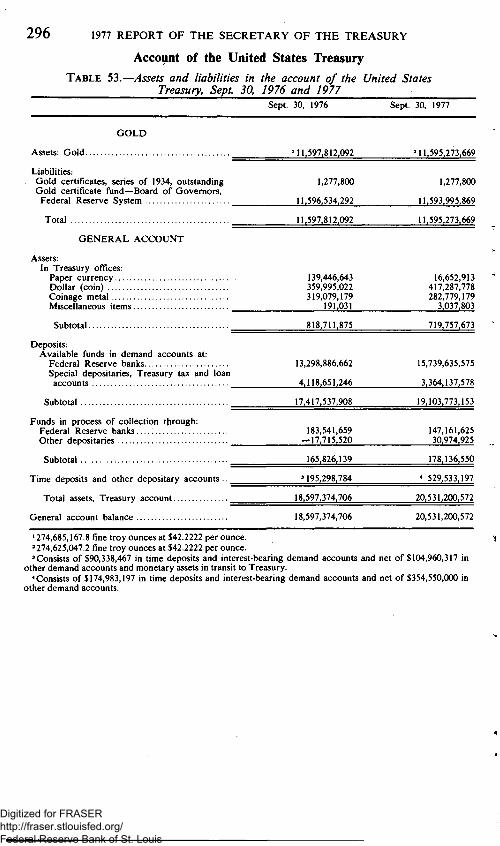
296 1977 REPORT OF THE SECRETARY OF THE TREASURY
Account of the United States Treasury
TABLE 53.^Assets and liabilities in the account of the United States Treasury, Sept. 30, 1976 and 1977
Sept. 30, 1976 Sept. 30, 1977
GOLD
Assets: Gold '11,597,812,092 "11.595.273.669
Liabilities: Gold certificates, series of 1934. outstanding 1.277.800 1,277,800 Gold certificate fund—Board of Governors,
Federal Reserve System 11,596,534,292 11,593,995,869
Total 11.597,812,092 11,595,273,669
GENERAL ACCOUNT
Assets: In Treasury offices:
Paper currency 139,446,643 16,652,913 Dollar (coin) 359,995,022 417,287,778 Coinage metal 319,079,179 282,779,179 Miscellaneous items 191,031 3,037,803
Subtotal 818,711,875 719,757,673
Deposits: Available funds in demand accounts at:
Federal Reserve banks 13,298,886.662 15.739.635.575 Special depositaries. Treasury tax and loan accounts 4.118.651.246 3.364.137.578
Subtotal 17.417.537.908 19.103.773.153
Funds in process of collection through: Federal Reserve banks. . . . : 183,541,659 147,161,625 Other depositaries --17,715,520 30,974.925
Subtotal 165.826.139 178.136.550
Time deposits and other depositary accounts .. '195.298,784 * 529,533.197
Total assets, Treasury account 18,597,374,706 20,531.200.572
General account balance 18.597,374,706 20,531,200,572
' 274,685,167.8 fine troy ounces at $42.2222 per ounce. " 274,625,047.2 fine troy ounces at $42.2222 per ounce. 'Consists of $90,338,467 in time deposits and interest-bearing demand accounts and net of $104,960,317 in
other demand accounts and monetary assets in transit to Treasury. * Consists of $174,983,197 in time deposits and interest-bearing demand accounts and net of $354,550,000 in
other demand accounts.
Digitized for FRASER http://fraser.stlouisfed.org/ Federal Reserve Bank of St. Louis

TABLE 54.—Location of gold, coin, and coinage metals held by the Treasury, Sept. 30, 1976 and 1977 [In thousands of dollars]
Sept. 30, 1976 Sept. 30, 1977
Gold Dollars Fractional coin
Coinage metals Gold Dollars
Silver Other
Fractional coin
Coinage metals
Silver Other
U.S. mints: Denver 1,711,045 8,817 107,536 135 Philadelphia 93 42,124 103.333 212
U.S. assay offices: N e w Y o r k ' 3.164.917 10 64.204 41.404 San Francisco 141.025 9.087 15.730 (*)
Bullion depository. Fort Knox 6.221,596 Treasury. Washington. D.C 13 214 8.942 Custody account—Federal Reserve Bank of New York — "359.123
Total assets 11,597.812 60.251 299.744 41.751 Deduct accounts payable to vendors
Net assets, as in table 53 11.597.812 60.251 299.744 41.751 277.328 11.595.274
—31.044 1.711.045 293.594 91
2.317 3.164.591 13.319 141.025
6.221.595
' 356.926
278.186 11.595.274 —858
3.200 38.001
10 • 11.225
96
148.824 121.679
66.874 18.629
8.751
52,531 364.756
52.531 364.756
135 212
41.170 (*)
41.517
—7.296 232.481
1.459 14.776
241.419 — 158
41.517 241.261
in H > H GO
H O > r > tfl z a
* Less than $500. ' Includes bullion depository at West Point. N.Y. " Physically located as follows: At bank of Canada. Ottawa. $60,290,026; at Bank of
England. London $54,569,948; at New York Assay Office. $41,877,399; and in Federal Reserve Bank's own vaults. $202,353,449. Also includes gold on display at Federal Reserve Bank of Atlanta. $16,693; at Federal Reserve Bank of New York, $15,084; at Federal
Reserve Bank of Minneapolis. $356; at Federal Reserve Bank of San Francisco. $343; and at Federal Reserve Bank of Los Angeles, $153.
' Physically located as follows: At Bank of Canada. Ottawa, $60,290,026; at New York Assay Office. $41,877,399; and in Federal Reserve Bank's own vaults. $254,726,442. Also includes gold on display at Federal Reserve Bank of Atlanta, $16,693; at Federal Reserve Bank of New York. $ 15.083.
to VO -o
Digitized for FRASER http://fraser.stlouisfed.org/ Federal Reserve Bank of St. Louis
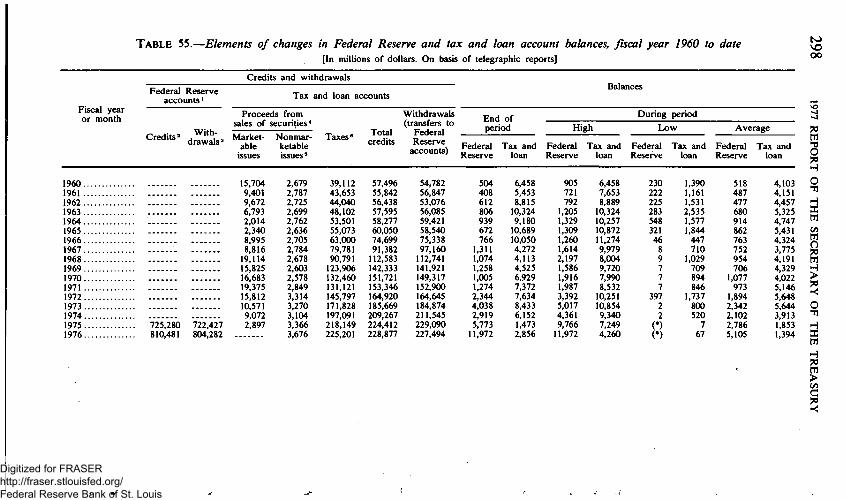
TABLE 55.—Elements of changes in Federal Reserve and tax and loan account balances, fiscal year 1960 to date [In millions of dollars. On basis of telegraphic reports]
Credits and withdrawals
Fiscal year or month
Federal Reserve accounts'
Balances Tax and loan accounts
Credits" Withdrawals'
Proceeds from sales of securities*
Marketable
issues
Nonmarketable issues'
Taxes* Total credits
Withdrawals (transfers to
Federal Reserve
accounts)
End of period
During period
High Low Average
Federal Reserve
Tax and loan
Federal Reserve
Tax and loan
Federal Reserve
Tax and loan
Federal Reserve
to
OO
7i tfl
Tax and loan
4.103 4.151 4,457 5,325 4.747 5.431 4.324 3.775 4.191 4,329 4.022 5.146 5,648 5,644 3,913 1,853 1,394
po H
O
ri tfl
in
i tfl H • >
*/0
fri 'fl H X tfl
1960. 1961. 1962. 1963. 1964. 1965. 1966. 1967. 1968. 1969. 1970. 1971. 1972. 1973. 1974. 1975. 1976.
725,280 810,481
15,704 9,401 9,672 6,793 2,014 2,340 8,995 8,816 19,114 15,825 16,683 19,375 15,812 10,571 9,072
722,427 2,897 804,282
2,679 2,787 2,725 2,699 2,762 2,636 2,705 2,784 2,678 2,603 2,578 2,849 3,314 3,270 3,104 3,366 3,676
39,112 43,653 44,040 48,102 53.501 55,073 63,000 79,781 90,791 123,906 132,460 131,121 145,797 171,828 197,091 218,149 225,201
57,496 55,842 56,438 57,595 58,277 60,050 74,699 91,382 112,583 142,333 151,721 153,346 164,920 185,669 209,267 224,412 228,877
54,782 56,847 53,076 56,085 59,421 58,540 75,338 97,160 112,741 141,921 149,317 152,900 164,645 184,874 211,545 229,090 227,494
504 408 612 806 939 672 766
1,311 1,074 1,258 1,005 1,274 2,344 4,038 2,919 5,773 11,972
6,458 5,453 8,815 10,324 9,180 10,689 10,050 4,272 4,113 4,525 6,929 7,372 7,634 8,433 6,152 1,473 2,856
905 721 792
1.205 1,329 1,309 1,260 1,614 2,197 1,586 1,916 1,987 3,392 5,017 4,361 9,766 11,972
6,458 7,653 8,889 10,324 10,257 10,872 11,274 9,979 8,004 9.720 7,990 8,532 10,251 10,854 9,340 7,249 4,260
230 222 225 283 548 321 46 8 9 7 7 7
397 2 2
(•)
(*)
1,390 1,161 1,531 2,535 1,577 1,844 447 710
1,029 709 894 846
1,737 800 520
7 67
518 487 477 680 914 862 763 752 954 706
1,077 973
1,894 2,342 2,102 2,786 5,105
H 7i tfl > C 70 ><
Digitized for FRASER http://fraser.stlouisfed.org/ Federal Reserve Bank of St. Louis

1977 875,071 1976-Oct 58,160
Nov 69,570 Dec 74,209
1977-Jan 62,615 Feb 72,365 Mar 77,084 Apr 84,249 May 79,473 June 83,004 July 57,888 Aug 73,727 Sept 82,727
872,627 61,218 73,042 70,582 61,611 71,583 82,113 77,771 87,263 73,659 64,282 76,401 73,102
3,908 280 283 309 355 341 369 351 345 313 320 348 294
267,125 17,032 17,730 24,300 18,583 18,532 26,722 25,905 20,583 32,374 19,571 19,926 25,867
271,033 17,312 18,013 24,609 18,938 18,873 27,091 26,256 20.928 32.687 19,891 20,274 26,161
271,787 19,625 17,932 25,218 18,924 17,740 27,637 23,995 23,914 32,768 19,598 20,691 23,745
15,740 10,238 6,766
10,393 11,397 12,179 7,150
13,628 5,838
15,183 8,789 6,115
15,740
3,364 1,805 1,886 1,277 1,291 2,424 1,878 4,139 1,153 1,072 1,365
948 3,364
16,115 14,053 10.106 10,393 11,397 12.815 12,745 13,628 14,475 16,115 12,851 8,895
15,740
6,286 2,319 2,627 4,229 2,891 3,023 5,860 6,286 4,771 5,463 2,496 2,803 5,714
1.204 7,291 5,531 1,993 5,400 8,677 4,274 3,473 5,838 1,204 5,874 3,921 3,116
118 610 300 335 305 371 300 198 519 234 381 250 118
8,035 9,206 6,709 6,138 7,850
10,699 8,577 7,369
10,996 7,057 8,843 6,025 6,956
1,548 1,529 1,534 1,519 1,402 1,406 1,475 1,940 1,311 1,727 1.234 1,351 2,147
* Less than $500,000. ' Figures are from the revised Daily Treasury Statement, effective July 1, 1974. Prior data
not available. "Represents transfers from tax and loan accounts, proceeds from sales of securities other
than Goverament account series, and taxes. 'Represents checks paid, wire transfer payments, drawdowns on letter of credit,
redemptions of securities other than Goverament account series, etc. * Special depositaries are permitted to make payment in the form of a deposit credit for
the purchase price of U.S. Goverament securities purchased by them for their own account, or for the account of their customers who enter subscriptions through them, when this method of payment is permitted under the terms of the circulars inviting subscriptions to the issues.
'Includes U.S. savings bonds, savings notes, retirement plan and tax and loss bonds. U.S. savings notes first ofifered for sale as of May 1, 1967, and were discontinued after June 30,
1970. Retirement plan bonds first offered for sale as of Jan. 1, 1963; tax and loss bonds first issued in March 1968.
"Taxes shown for 1960 through 1967 include income (by special arrangement). Under a special procedure begun in March 1951, authorization was given during certain periods for income tax payments, or a portion of them made by checks of $10,000 or more drawn on a special depositary bank to be credited to the tax and loan account in that bank. This procedure was discontinued in April 1967. Taxes eligible for credit consist of those deposited by taxpayers in the depositary banks, as follows: Withheld income taxes beginning March 1948; taxes on employers and employees under the Federal Insurance Contributions Act beginning January 1950, and under the Railroad Retirement Tax Act beginning July 1951; a number of excise taxes beginning July 1953; estimated corporation income taxes beginning April 1967; all corporation income taxes due on or after Mar. 15, 1968, and FUTA taxes beginning April 1970.
in H > H GO
H O > r > tfl z a X
VO VO
Digitized for FRASER http://fraser.stlouisfed.org/ Federal Reserve Bank of St. Louis
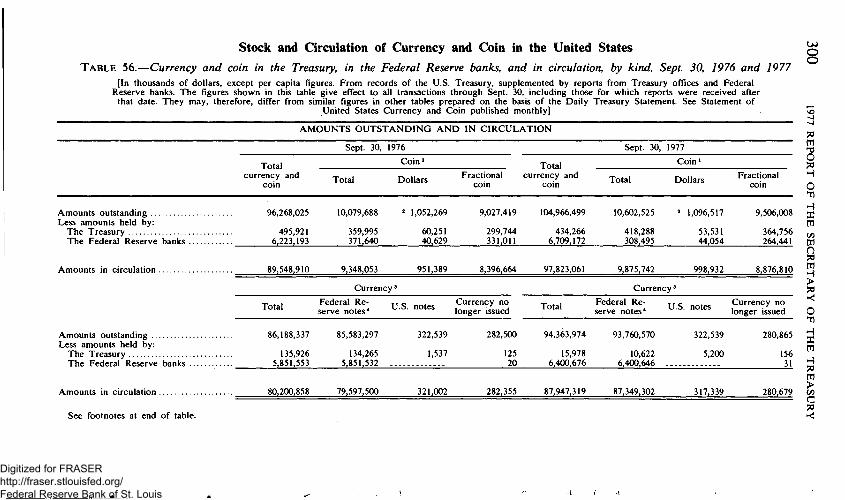
Stock and Circulation of Currency and Coin in the United States
TABLE 56.—Currency and coin in the Treasury, in the Federal Reserve banks, and in circulation, by kind, Sept. 30, 1976 and 1977 [In thousands of dollars, except per capita figures. From records of the U.S. Treasury, supplemented by reports from Treasury offices and Federal
Reserve banks. The figures shown in this table give effect to all transactions through Sept. 30, including those for which reports were received after that date. They may, therefore, differ from similar figures in other tables prepared on the basis of the Daily Treasury Statement. See Statement of
United States Currency and Coin published monthly]
AMOUNTS OUTSTANDING AND IN CIRCULATION
Sept. 30, 1976 Sept. 30, 1977
Total currency and
coin
Coin'
Total Dollars Fractional coin
Total currency and
coin
Coin'
Total Dollars Fractional coin
O O
Ti tfl ^ O Ti H
O
H X tfl in tfl
n Ti tfl H > Ti
O ^ H X tfl H Ti tfl > c/5 C Ti
Amounts outstanding Less amounts held by:
The Treasury The Federal Reserve banks ..
Amounts in circulation
Amounts outstanding Less amounts held by:
The Treasury The Federal Reserve banks ..
Amounts in circulation
See footnotes at end of table
96,268,025 10,079,688 " 1.052,269 9,027.419 104.966.499 10,602.525 " 1,096.517 9.506.008
495.921 6.223.193
89,548.910
359.995 371.640
9.348,053
60.251 40.629
951.389
299,744 331.011
8.396.664
434.266 6.709.172
97.823.061
418.288 308.495
9.875.742
53.531 44,054
998.932
364.756 264,441
8.876.810
Total Federal Reserve notes*
; U.S. notes Currency no ^ j Federal Re- ^ ^ Currency * longer issued serve notes* longer iss
no longer issued
86.188.337 85.583,297 322,539 282,500 94,363,974 93,760,570 322.539 280.865
135.926 5.851.553
80,200.858
134,265 5.851.532 -.
79.597,500
1.537
321.002
125 20
282,355
15.978 6.400.676
87.947.319
10,622 6,400.646 ..
87.349.302
5.200
317.339
156 31
280,679
Digitized for FRASER http://fraser.stlouisfed.org/ Federal Reserve Bank of St. Louis
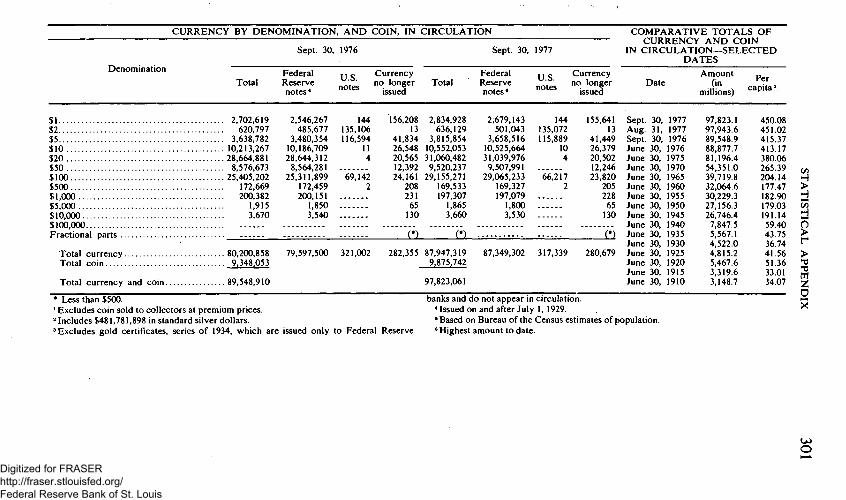
CURRENCY BY DENOMINATION, AND COIN, IN CIRCULATION
Denomination
Total
Sept. 30, 1976
Federal Reserve notes *
U.S. notes
Currency no longer
issued Total
Sept. 30, 1977
Federal Reserve notes *
U.S. notes
Currency no longer
issued
COMPARATIVE TOTALS OF CURRENCY AND COIN
IN CIRCULATION—SELECTED DATES
Date Per Amount
millions) ^^Pi^^'
$1 2,702,619 2,546,267 144 156,208 $2 620,797 485,677 135,106 13 $5 3,638,782 3,480,354 116,594 41.834 $10 10.213.267 10.186.709 11 26.548 $20 28,664,881 28,644,312 4 20,565 $50 8,576,673 8,564,281 12,392 $100 25,405,202 25,311,899 69,142 24,161 $500 172,669 172,459 2 208 $1,000 200,382 200,151 231 $5,000 1,915 1,850 65 $10,000 3,670 3,540 130 $100,000 Fractional parts (*)
Total currency 80,200,858 79,597,500 321,002 282,355 Total coin 9,348,053
Total currency and coin 89,548,910
• Less than $500. ' Excludes coin sold to collectors at premium prices. "Includes $481,781,898 in standard silver dollars. 'Excludes gold certificates, series of 1934. which are issued only to Federal Reserve
2.834.928 636.129
3,815.854 10.552.053 31.060.482 9.520.237
29.155.271 169,533 197.307
1.865 3.660
'(*)
2,679.143 501.043
3.658.516 10.525,664 31.039.976 9.507.991
29.065.233 169,327 197.079
1.800 3.530
144 135.072 115.889
10 4
66,217 2
87,947,319 9,875,742
97,823,061
155,641 13
41,449 26,379 20,502 12,246 23,820
205 228
65 130
87,349,302 317,339 280,679
Sept. 30, Aug. 31, Sept. 30, June 30, June 30, June 30, June 30, June 30, June 30, June 30, June 30, June 30, June 30, June 30, June 30, June 30. June 30, June 30.
1977 1977 1976 1976 1975 1970 1965 1960 1955 1950 1945 1940 1935 1930 1925 1920 1915 1910
97.823.1 97.943.6 89.548.9 88,877.7 81.196.4 54.351.0 39.719.8 32.064.6 30.229.3 27.156.3 26,746.4 7.847.5 5,567.1 4,522.0 4.815.2 5.467.6 3,319.6 3.148.7
450.08 451.02 415.37 413.17 380.06 265.39 204.14 177.47 182.90 179.03 191.14 59.40 43.75 36.74 41.56 51.36 33.01 34.07
C/5
H > H 00
H O
> r > tfl Z o banks and do not appear in circulation.
* Issued on and after July 1. 1929. * Based on Bureau of the Census estimates of population. * Highest amount to date.
O
Digitized for FRASER http://fraser.stlouisfed.org/ Federal Reserve Bank of St. Louis

TABLE 51.—Stock of bullion, coin and currency, selected dates, June 30, 1945-76, and Sept. 30, 1976-77 O [In thousands of dollars, except percentage of gold to total stock] """
Classification 1945 1950 1955 1960 1965 1970 1975 1976 ^^^976^ ' ^^^^ll^'
Bullion and coin: ^ Gold' 20,212,973 24,230,720 21,677,575 19,322,238 13,934,083 11,156,525 11,619,862 11,598,269 11,597,812 11,595,274 "^ Silver bullion (at monetary value) 1,520,295 2,022,835 2,187,429 2,252,075 " 1,267,417 (") (") (") (") (") TO Dollars' 493,943 492,583 490,347 487,773 484,720 484.720 862.431 1,052,269 1,052,269 1,096,517 tfl Subsidiary coin 825,798 1,001,574 1,296,140 1,552,106 2,375,327 4,703,397 6,518,193 7,076,620 7,170,309 7,514,305 pS Minor coin 303.539 378.463 449.625 559.148 853.388 1.174.345 1.699.012 1.823.793 1.857.110 1.991.703 ^
H O
Subtotal 23.356.548 28,126,175 26,101,115 24,173,340 18,914.934 17.518,986 20,699,498 21,550,951 21,677,500 22,197,799 Less: Gold, silver bullion, and standard silver dollars held as security for, or redemption of outstanding paper currencies* 20.079.777 25,504.665 23.594.948 21.611.053 14.715.025 11.045.392 11.620.037 11.598.269 11.597.812 11.595,274 g
Total bullion and coin (net) 3.276.771 2,621.510 2.506,168 2,562,287 4,199,909 6,473,595 9,079,461 9,952,682 10,079,688 10.602,525 X tfl C/D
Currency: O Gold certificates, and credits payable therein' 18,106,600 23,022,852 21,028,137 19,059,416 13,670.235 11.045.392 11.620.037 11.598.269 11.597.812 11.595,274 pO Less: Amount included in collateral held by Federal Reserve tfl agents for Federal Reserve notes 10.968.000 14.349.000 11.108,000 10.565.000 6.295.000 3,322,000 11,596,264 11,596,759 11,596,459 11,593,487 J^
Subtotal 7,138,600 8,673,851 9,920,137 8,494,416 7,375,235 7,723,392 23,773 1,510 1,353 1,787 2< Gold certificates prior to Series of 1934« 13, 40 3,820 3,548 3,512 3,508 3,482 _ Silver certificates' 1,815,988 2,324,628 2,409,630 2,394,456 889,17^ 220,096 210,658 209,494 209,230 208,138 g Treasury notes of 1890« 1,150 1.145 1.142 1.142 42 11 11 11 11 11 ^ U.S. notes' 346,681 346,681 346,681 346,681 322,681 322,539 322,539 322,539 322,539 322,539 H Federal Reserve notes'" 23,650,975 23,602,680 26,629,030 28,394,186 37,347,185 50,431,429 77,003,198 83,994,059 85,584,016 93,761,279 * Federal Reserve bank notes" 533,979 277,202 164,412 100,736 68,793 55,436 50,150 49,426 49,383 48,912 ^ National bank notes'" 121.215 87,615 67.379 55.979 22.283 20.291 19.706 19.654 19.651 19.614 H
Total paper currency (net) 33.608.588 35,313,803 39,538,411 39,787,595 46,038,735 58,777,015 77,633,583 84.600.205 86,189.691 94.365.762 ^ C/3
Total stock 36.885.360 37.935.313 42.044.579 42.349.882 50.238.644 65.250.610 86.713.044 94.552.887 96.269.379 104.968.287 C . ^
Percentage of gold to total stock 54.80 63.87 51.56 45.63 27.74 17.10 13.40 12.27 12.05 11.05 "^
Digitized for FRASER http://fraser.stlouisfed.org/ Federal Reserve Bank of St. Louis

'Value ofgold holdings at $35 per fine troy ounce through 1970, and at $42.22 for 1974 through 1977. Amount for 1970 is exclusive ofgold deposited with the United States by the Interaational Monetary Fund.
" Excludes bullion carried at monetary value but released for coinage use. 'Through 1970 consists of standard silver dollars. Amount for 1977 consists of
$481,781,898 in standard silver dollars and $614,735,000 in cupronickel-clad dollars. * Comprises the security for: Gold certificates and credits payable therein (100 percent in
gold); U.S. notes (gold to the extent of the reserve required by law (31 U.S.C. 408)); and silver certificates and Treasury notes of 1890 (100 percent in silver bullion or standard silver dollars). Since enactment of the Old Series Currency Adjustment Act (31 U.S.C. 912-916) on June 30, 1961, gold certificates prior to the Series of 1934, silver certificates issued before July 1, 1929, and Treasury notes of 1890 have been payable from the general fund. The requirement for a gold reserve against U.S. notes and Treasury notes of 1890 was repealed by Public Law 90-269, approved Mar. 18, 1968. Silver certificates issued on and after July 1, 1929, became redeemable from the general fund on June 24, 1968 (31 U.S.C. 405a-3). The amount of security shown on this line for years after those dates has been reduced accordingly.
'Consists of: Gold certificates outside of the Treasury (issues prior to Series of 1934 are included through 1961), and credits with the Treasury ofthe United States payable to the Board of Goveraors, Federal Reserve System, in gold certificates. These obligations are fully secured by gold in the Treasury.
* Pursuant to the Old Series Currency Adjustment Act are redeemable from the general fund of the Treasury and upon redemption will be retired.
'Silver certificates were originally secured by silver bullion at monetary value ($1.29 -f per fine troy ounce) and standard silver dollars held in the Treasury. They are now payable from the general fund (see footnote 4).
* Treasury notes of 1890 have been in process of retirement since March 1900 (31 U.S.C. 411) upon receipt by the Treasury. Until June 30, 1961, secured by silver; thereafter redeemable from the general fund.
'U.S. notes were secured by a gold reserve (31 U.S.C. 408) until this requirement was repealed by Public Law 90-269, approved Mar. 18, 1968. This reserve, which was also a
dates in this table through 1965. The act of May 31, 1878 (31 U.S.C. 404) required that the amount of U.S. notes then outstanding, $346,681,016. be kept in circulation. The Old Series Currency Adjustment Act provided that this amount should be reduced by such amounts of notes as the Secretary of the Treasury might determine to have been destroyed or irretrievably lost. To date, the Secretary has made such determinations with respect to $24,142,000 ofthe U.S. notes issued prior to July 1, 1929.
"* Federal Reserve banks secure Federal Reserve notes by depositing like amounts of collateral with Federal Reserve agents. The Federal Reserve Act, as amended (12 U.S.C. 412), authorizes the use of the following assets for this purpose: (a) gold certificates or gold certificate credits; (b) certain discounted or purchased commercial paper; (c) securities issued by the United States; and (d) special drawing rights certificates issued by the Exchange Stabilization Fund. Federal Reserve notes are obligations of the United States and are a first lien on all assets of the issuing Federal Reserve bank.
Pursuant to the Old Series Currency Adjustment Act of 1961, funds were deposited by the Federal Reserve banks on July 28, 1961, with the Treasurer ofthe United States for the redemption of all series of Federal Reserve notes issued before the Series of 1928. The amount shown for 1977 includes $709,028 of such series.
" Federal Reserve bank notes at issuance were secured by direct obligations ofthe United States or commercial paper. Since termination of their issuance on June 12, 1945 (12 U.S.C. 445 note), the notes have, been in process of retirement, and lawful money has been deposited with the Treasury of the United States for their redemption.
'" National bank notes at issuance were secured by direct obligations of the United States. From Dec. 23, 1915 (12 U.S.C. 441) these notes have been in process of retirement, and lawful money has been deposited with the Treasury of the United States for their redemption.
NOTE.—Figures for years not shown appeared in the following Annual Reports: 1860-1947, 1947 report, p. 482; 1948-49, 1956 report, p. 542; 1951-61, 1961 report, p. 634; 1962-64, 1964 report, p. 596; 1966-68, 1968 Statistical Appendix, p. 224; 1969-71, 1971 Statistical Appendix, p. 234; and 1972-74, 1974 Statistical Appendix, p. 250.
in
t H GO
H > r > tfl z a
O
Digitized for FRASER http://fraser.stlouisfed.org/ Federal Reserve Bank of St. Louis

TABLE 58.—Currency and coin in circulation by kind, selected dates, June 30, 1945-76, and Sept. 30, 1976-77 [In thousands of dollars]
Gold certificates ' Dollars Silver cer
tificates '
Treasury notes of
1890'
Subsidiary coin
Minor coin
United States notes'
Federal Reserve notes'
Federal Reserve
bank notes'
National bank
notes' Total
June 30-1945 1950 1955 1960 1965 1970 1975 1976
Sept. 30— 1976 1977
52,084 40,772 34,466 30,394 13,209 3,731 3,464 3,425
3,415 3,390
125,178 170,185 223,047 305,083 481,698 481.675 815.566 940.799
951.389 998.932
1.650.689 2.177.251 2.169.726 2.126.833
829.177 220.061 210.655 209.491
209,227 208,135
1,150 1,145 1,142 1,142
42 11 11 11
11 11
788,283 964,709
1,202,209 1,484,033 2,355,380 4,519,799 6,069,276 6,602,212
6,669,300 7,017,118
291,996 360,886 432,512 549,367 824,585
1,126,617 1,611,568 1.701.536
1.727.364 1.859.692
322.587 320,781 319,064 318,436 301.978 296.784 322.200 321.705
321,002 317,338
22,867,459 22,760,285 25,617,775 27,093,693 34,823,233 47,626,751 72,093,807 79,029.427
79,598.211 87.350.004
527.001 273.788 162,573 99.987 68.333 55.272 50.119 49.417
49.357 48.860
120.012 86.488 66,810 55,652 22,167 20,271 19.692 19.645
19.635 19,581
26.746.438 27.156.290 30,229.323 32,064,619 39,719,801 54,350,972 81.196.358 88,877,667
89,548,910 97,823.061
Ti tfl ^ O Ti H
O
H X tfl c/5 tfl o po tfl H > Ti
O ^ H X tfl H 70 tfl > in C 7i
'For description of security required to be held against the various kinds of paper currency, and for retirement provisions, see footnotes to table 57.
NOTE.—Figures for years not shown appeared in the following Annual Reports: 1860-
1947. 1947 report, p. 485; 1948-49. 1956 report, p. 543; 1951-61, 1961 report, p. 636; 1962-64. 1964 report, p. 598; 1966-68. 1968 Statistical Appendix, p. 226; 1969-71. 1971 Statistical Appendix, p. 236; and 1972-74. 1974 Statistical Appendix, p. 252.
Digitized for FRASER http://fraser.stlouisfed.org/ Federal Reserve Bank of St. Louis

STATISTICAL APPENDIX 3 0 5
TABLE 59.—Paper currency issued and redeemed during fiscal 1977 and outstanding Sept. 30, 1977
^ _ ________ [In thousands of dollars]
Issued during
1977
Redeemed during \911
Outstanding Sept. 30, 1977'
In Treasury
In Fedeial Reser v<; banks
In circulation
CLASS
Gold certificates-Series of 1934... U.S. notes" Federal Reserve notes—issued on and after July 1. 1929 Currencies no longer issued:"
Federal Reserve notes—issued before July 1. 1929
Federal Reserve bank notes ^National bank notes Gold certificates—issued before
series of 1934 Silver certificates Treasury notes of 1890
Total
DENOMINATION
$1 $2 $5 $10 $20 $50 $100 $500 $1.000 $5.000 $10.000 $100.000 Fractional parts
Total
3.664
22.710,844
22,714,508
1,789,528 23,956
2,320,800 3,888,960 7,704,800 1,802,400 5,184,064
22,714,508
3",664
14,533,572
9 471 37
26 1,091
14.538.870
1.584.883 16.350
1.988.349 3.396.879 5,378.173 919.521
1.247.658 3.376 3,582 60 40
14.538.870
5^200
10.622
7 46 8
92 3
15.978
782 296
1,566 698
6,556 169
5,820 17 34 10 30
15,978
1,278
6,400,646
6 24
6,401,954
368,188 149,044 481,621
1.366.807 2,725.781 550.692 757.613
402 403 45 160
1.200
6.401.954
"""317339
87.349.302
702 48.860 19,581
3,390 208,135
11
87.947.319
2,834,928 636,129
3,815,854 10,552,053 31,070,483 9,520,237
29,145,271 169,533 197,307
1,865 3,660
(•)
87,947,319
* Less than $500. 'The Secretary of the Treasury is authorized to determine, from time to time, the amounts of certain
urrencies, which, in his judgment, have been destroyed, are irretrievably lost or are held in collections and so will never be presented for redemption, and to reduce the outstanding amounts thereof accordingly. The totals of such reductions effected through Sept. 30, 1977, were:
Authorized by Old Series Currency Adjustment Act (31 U.S.C. 915c) approved June 30, 1961:
Issued before July 1, 1929: U.S. notes $24,142,000 Federal Reserve notes 34,450,000 Federal Reserve bank notes 2,063,000 National bank notes 28.920,000 Gold certificates 16.600.000 Silver certificates 29.780,000 Treasury notes of 1890 1.131.000 Gold certificates, series of 1928 7.350,000
Authorized by act approved June 24, 1967 (31 U.S.C. 405a-2): Silver certificates, issued after June 30, 1929 200,000,000
Total 344,436,000 "Amounts outstanding are also included in the public debt (see table 34, final page).
Digitized for FRASER http://fraser.stlouisfed.org/ Federal Reserve Bank of St. Louis

306 1977 REPORT OF THE SECRETARY OF THE TREASURY
Trust and Other Fuiids
TABLE 60.—Airport and airway trust fund, Sept. 30, 1977 [In thousands of dollars. This trust fund established in accordance
with the provisions of section 208(a) of the Airport and Airway Revenue Act of 1970 (49 U.S.C. 1742 (a))]
I. RECEIPTS AND EXPENDITURES (EXCLUDING INVESTMENT TRANSACTIONS)
Cumulative picr-ai Cumulative through 7^57 through
Sept. 30, 1976 ^ ^ " Sept. 30, 1977
Receipts: Excise taxes:
Any liquid fuel other than gasoline Tires used on aircraft Tubes used on aircraft Gasoline:
Commercial 4 cents tax Noncommercial 4 cents tax Noncommercial 3 cents tax
Transportation by air—seats, berths, etc Use of international travel facilities Transportation of property, cargo Use of civil aircraft
i
152,855 9,240 1.490
7.700 85.401 62,757
4,011,299 295,512 243,841 127.640
31.115 860 100
1,200 13,438 10,076
1,006,968 56,999 50,671 21.578
183.970 10.100 1.590
8.900 98.835a 72.833^
5.018,267 352,511 294,512 149,218
Gross taxes 4,997.735 1.193.005 6.190,740 I
7.115 947
2.195 543
1.200 15 441 412
8.315 962
2,636 955
10.800
4.986.937 720.279 270.852
5.978.068
2.068
1,190.937
193.540
1.384.476
12,868
6,177,874 720,279 464,392"'
7,362,544
Deduct—reimbursement to general f u n d -refund of tax receipts:
Commercial aviation Noncommercial gasoline Civil aircraft Any liquid fuel other than gasoline
Total refunds of taxes
Net taxes Federal payment Interest on investments
Net receipts
Expenditures: Federal Aviation Administration: Operations 1,159,183 250,230 1,409,413 Grants-in-aid for airports 1,228,451 334,823 1,563,274 Facilities and equipment ' 1,350,425 197,109 1,547,534 Research and development 374,946 70.487 445.433 \
Aviation Advisory Commission—salaries and expenses
Interest on refund of taxes
Total expenditures
Transfers: From general fund accounts'
Net transfers
Balance '2,736,038 531,812 3,267,850
1,941 ... 112
'4.115.058
873.033
873.033
15
852.664
0
0
1.941 127
4.967,722
873,033
873,033
See footnotes at end of table.
Digitized for FRASER http://fraser.stlouisfed.org/ Federal Reserve Bank of St. Louis

STATISTICAL APPENDIX 307 TABLE d^.—Airport and airway trust fund, Sept. 30, 1977—Continued
[In thousands of dollars]
II. ASSETS HELD BY THE DEPARTMENT OF THE TREASURY
Assets Sept. 30, 1976 Fiscal 1977 increase, or
decrease (—) Sept. 30, 1977
Investments in public debt securities: Goverament account series, Treasury certificates of indebtedness, airport and airway trust fund series, maturing June 30: d'A of 1977 d'A of 1978 6'/8 of 1978 Total investments, par value
Undisbursed balance Total assets
2,712,201
2,712,201 '23,837
'2,736,038
—2,712,201 .. 3,025,40,5 220.57(S 533.780 —1.961 J 531,8i;>
"'"Y,625^465 220,576
3,245,981 21,869
3,267,850
' Revised. 'Unexpended balances of certain general fund accounts transferred to the trust fund pursuant to Airport and
Airway Revenue Act of 1970, section 208 (c).
Digitized for FRASER http://fraser.stlouisfed.org/ Federal Reserve Bank of St. Louis

308 1977 REPORT OF THE SECRETARY OF THE TREASURY
TABLE 61.—Civil service retirement and disability fund, Sept. 30, 1977 [In thousands of dollars. This trust fund was established in accordance with the
provisions of the act of May 22, 1920, as amended (5 U.S.C. 8348). For further details see Annual Report of the Secretary for 1941, p. 136]
I. RECEIPTS AND EXPENDITURES (EXCLUDING INVESTMENT TRANSACTIONS IN FEDERAL AND NON-FEDERAL SECURITIES)
Cumulative through
Sept. 30, 1976 Fiscal 1977
Cumulative through
Sept. 30, 1977
Receipts: Deductions from salaries, service credit
payments, and voluntary contributions of employees subject to retirement act '
Federal contributions " Payments by employing agencies " Interest and profits on investments Transfer from the Comptroller of
the Currency retirement fund Other income
Total receipts
Expenditures: Annuity payments, refunds, etc Transfer to policemen's and fire
men's relief fund, D.C, deductions and accrued interest thereon
Total expenditures
34.356,129 20,472,064 27.821,912 19,387.452
5 050 . 5 . .
102,042,613
59,364,088
2.908.808 7,805.621 2,924,757 2,840.794
16.479.980
9.563,189
37.264.937 28,277,685 30.746.669 22.228.246
5 050 5
118.522.593
68.927.277
2,785
59,366,873
334 3.119
68.930.396
Balance. 42.675.739 6,916,458 49.592,197
II. ASSETS HELD BY THE DEPARTMENT OF THE TREASURY
Fiscal 1977 Assets Sept. 30, 1976 increase, or Sept. 30. 1977
decrease (—)
Investments in public debt securities: Government account series, civil service retire
ment fund series, maturing June 30: Certificates of indebtedness:
l'A% of 1977 1% of 1978 l'A% of 1978
Treasury notes: VA% of 1977 d'A% of 1978 5'/,% of 1979 6V8% of 1980
Treasury bonds: 3V8% of 1978 4'/8% of 1978 4'/8% of 1979 4'/8% of 1980 7'/8% of 1981 7'/8% of 1981 VA% of 1981 7V8% of 1981 7'/8% of 1982 7'/8% of 1982 VA% of 1982 7'/8% of 1982 7'/8% of 1983 7'/8% of 1983 l'A% of 1983 7V8% of 1983 7'/8% of 1984
See footnotes at end of table.
408,870
2.742.233 5.828,489 3,980,233 .
—408,870 8,539.346
568.158
—2,742.233 —1,526,742
3.951,273
826,643 142.474 969,117 .
-826.643 —142,474
969 117 - -- - - _ - - -
561486 -139,639
623 755 597 744
561486 . 140.755
623 755 597 744 .
561 486 140,755
623 755 597 744
140.755
8,539.346 568.158
4.301.747 3,980,233 3,951.273
969,117 969.117 139.639 561,486 623,755 597,744 140,755 561,486 623,755 597,744 140,755 561,486 623.755 597,744 140.755
Digitized for FRASER http://fraser.stlouisfed.org/ Federal Reserve Bank of St. Louis

STATISTICAL APPENDIX 309 TABLE 61.—Civil service retirement and disability fund, Sept. 30,
1977—Continued II. ASSETS HELD BY THE DEPARTMENT OF THE TREASURY-Continued
Assets Sept. 30, 1976 Fiscal 1977 increase, or
decrease (—) Sept. 30, 1977
Investments in public debt securities—Con. Goverament account series, civil service retirement fund series, maturing June 30—Con. Treasury bonds—Continued
7'/8% of 1984 l'A7o of 1984 7'/8% of 1984 7'/8% of 1985 7'/8% of 1985 l'A% of 1985 7'/8% of 1985 7'/8% of 1986 7'/8% of 1986 l'A% of 1986 VA% of 1986.. 7'/8% of 1987 7'/8% of 1987 l'A% of 1987 7V8% of 1987 7'/8% of 1988 7'/8% of 1988 l'A% of 1988 7»/8% of 1988 7'/8% of 1989 7'/8% of 1989 l'A% of 1989 VA% of 1989 7'/8% of 1990 7'/8% of 1990 l'A% of 1990 7'/8% of 1991 l'A% of 1991 7'/8% of 1992. _
Total Goverament account series _
Marketable issues: Treasury notes:
VA% Series B-1977 8% Series A-1977 6% Series B-1978 d'A% Series A-1978 d'A% Series A-1979
Treasury bonds: 4'/4% of 1975-85 3'/4% of 1978-83 3'A% of 1980 4% of 1980 6'/8% of 1984 3'A% of 1985 6'/8% of 1986 A'A% of 1987-92 l'A% of 1988-93 4'/8% of 1989-94 1% of 1993-98 8'/2% of 1994-99 3'/a% of 1990 3% of 1995 VA% of 1998 778% of 1995-00 8'/8% of 1995-00 8% of 1996-01 8'/,% of 2000-05 7'/8% of 2002-07 _
Total marketable issues _
See footnotes at end of table.
561.486 623,755 597,744
140,756 561.487 623,754 597,743
140,756 561,487 623,754 597.743
140,756 561,487 623,754 597,743
140,756 561,487 623,754 597,743
140,755 561,487 623.754 597.743
140,755 1,159,229 623.755
140.755 1.782.984
.^^^^^^^ 1.923.739
39,431.277
73,800 —13,1100 65,600 —dS/m 77,700
320,750 91,550
53,105 16,800 15.700
110,394 200,000 85,900 50,000
358,970 283,214 10,750 29,500 190,360 98,600 55.205 83.269 10.000 13,000
225,700 338,750
139. k)0
2.858,617
561,486 623,755 597,744 140,756 561.487 623,754 597,743 140,756 561,487 623,754 597,743 140,756 561,487 623,754 597,743 140,756 561,487 623,754 597,743 140,755 561,487 623,754 597.743 140,755
1,159.229 623.755 140,755
1,782,984 1,923.739
46,362,751
77,700 320.750 91,550
53,105 16,800 15,700
110,394 200,000 85,900 50,000
358,970 283,214 10,750 29,500 190,360 98.600 55,205 83,269 10.000 13,000
225,700 338,750 139^400
2.858,617
Digitized for FRASER http://fraser.stlouisfed.org/ Federal Reserve Bank of St. Louis

310 1977 REPORT OF THE SECRETARY OF THE TREASURY
TABLE 6L—Civil service retirement and disability fund, Sept. 30, 7977—Continued
II. ASSETS HELD BY THE DEPARTMENT OF THE TREASURY-Continued
Assets Sept. 30, 1976 Fiscal 1977 increase, or
decrease (—) Sept. 30, 1977
Investments in agency securities: Goverament National Mortgage Association participation certificates: Federal assets liquidation trust:
5.20% of 1982 Federal assets finance trust:
6.40% of 1987 6.05% of 1988 6.45% of 1988 6'/8% of 1978
Total agency securities
Total investments, par value Undisbursed balance
Total assets
100,000
75,000 65,000 35,000 100,000
375,000
42,664,894 10,845
6,931,474 — 15.016
100.000
75,000 65,000 35,000
100,000
375,000 ^ I
49,596,368 —4.171
42,675,739 6,916,458 49,592,197
' Basic compensation deductions have been at the rate of 7 percent since the beginning of the first applicable pay period beginning after Dec. 31, 1969. Since 1958 District of Columbia and Goverament corporations' contributions have been included with contributions from agency salary funds.
" Beginning July 1, 1957, appropriations are not made directly to the fund. Instead, in accordance with the act approved July 31, 1956 (5 U.S.C. 8334(a)), the employing agency contributes (from appropriations or funds from which the salaries are paid) amounts equal to the deductions from employees' salaries.
TABLE 62.—Employees health benefits fund, Civil Service Commission, Sept. 30, 1977
[In thousands of dollars. On basis of reports from the Civil Service Commission. This trust revolving fund was established in accordance with the
provisions of the act pf Sept. 28, 1959, as amended (5 U.S.C. 8909)]
RECEIPTS AND EXPENDITURES (EXCLUDING INVESTMENT TRANSACTIONS)
Cumulative Cumulative through Fiscal 1977 through
Sept. 30. 1976 Sept. 30. 1977
Receipts: Direct appropriations Employees and annuitants withholdings — Agency contributions Interest and profits on investments
Total receipts
Expenditures: Subscription charges paid to carriers Contingency reserve paid to carriers Carrier refunds Administrative expenses Interest on administrative expenses paid by employees life insurance fund '
Express premium retumed Other "
Total expenditures
Balance
1,279,887 8,509,417 5,320,951 122,310
429,184 1.042,110 1,201,121
24.132
1.709,071 9,551,522 6,522,078 146,442
15.232.566
14.417,981 429,587 — 2 5 3 .. 30,745
44
—1.524
14.876.578
2.696.548
2,559,284 57,671
6,606
864
2.624.425
17.929.113
16,977,265 487.258 — 2 5 3 37.351
44 —1
- 6 6 0
17.501.003
355.988 72,123 428,110
See footnotes at end of table.
Digitized for FRASER http://fraser.stlouisfed.org/ Federal Reserve Bank of St. Louis

STATISTICAL APPENDIX 311
TABLE 61.—Employees health benefits fund. Civil Service Commission, Sept. 30, 7977—Continued
II. ASSETS HELD BY THE DEPARTMENT OF THE TREASURY
Fiscal 1977 Assets Sept. 30, 1976 increase, or Sept. 30, 1977
decrease (—)
Investments in public debt securities: Goverament account series, employees health
benefits fund series: Treasury bills maturing:
10/14/76 79,400 --79,400 12/23/76 36,695 —36,695 10/13/77 77,900 77,900 10/27/77 38,1(0 38,160 12/8/77 3,3<iO 3,340 12/22/77 56,6S'0 56.690
Treasury notes: 7%% of 1978 41,200 41,200 7y8% of 1982 6,942 6,942
J * 8% of 1983 32,029 32,029 7y8% of 1986 11,595 11,595 8% of 1986 4,466 4,466
Treasury bonds: 8'/4% of 5/15/2000-05 25,183 25,183 7V8% of 2/15/2002-07 1 7 ^ 0 17.070
Total Goverament account series 212.327 102,248 314.575
Marketable issues: Treasury notes:
6% Series B-1978 13,498 13,498 6'/4% Series A-1978 9,596 9,596 6'/4% Series A-1979 11,650 11,650 678% Series A-1980. . . . 74,420 74,420
Treasury bonds: 8'/,% of 1994-99....
Total marketable issues
Total investments, par value. Undisbursed balance
Total assets 355,988 72,12.3 428,110
' As provided in the act (5 U.S.C 8909). " Difference betweeh oost and face value of investments.
423 ...
109.587
321,914 34,074
102,243 -30.12:5
423
109.587
424,162 3.948
Digitized for FRASER http://fraser.stlouisfed.org/ Federal Reserve Bank of St. Louis

V-I
312 1977 REPORT OF THE SECRETARY OF THE TREASURY
TABLE 63.—Retired employees health benefits fund, Civil Service Commission, Sept. 30, 1977
[In thousands of dollars. On basis of reports from the Civil Service Commission. This trust revolving fund was established in accordance with the
provisions of the act of Sept. 8, 1960 (5 U.S.C. 8906)]
I. RECEIPTS AND EXPENDITURES (EXCLUDING INVESTMENT TRANSACTIONS)
Cumulative Cumulative through Fiscal 1977 through
Sept. 30. 1976 Sept. 30. 1977
Receipts: Direct appropriations (Goverament contribu
tion) , 177,170 7,850 185,020 Annuitants withholdings 94,439 369 94,808 Interest and profits on investments 16,379 1,092 17,471 I
Total receipts 287,988 9,311 297,299
Expenditures: Subscription charges paid to carrier 146,881 2,943 149,824
. Goverament contributions paid to annuitants'. 95,218 4,925 100,143r^ Administrative expenses 5,318 68 5,386 Interest on loans 6 6 Payment from contingency reserve 23,440 6,123 29,563 Other " —618 —250 —868
I
Total expenditures 270,245 13,809 284,054
Balance 17,742 . —4,498 13,244
"' i
II. ASSETS HELD BY THE DEPARTMENT OF THE TREASURY __ Fiscal 1977
Assets Sept. 30, 1976 increase, or Sept. 30. 1977 decrease (—)
Investments in public debt securities: Marketable issues: Treasury notes:
7'/4% Series B-1977 6'/4% Series A-1978
Treasury bonds: 8'/,% of 1994-99
Total investments, par value Undisbursed balance
Total assets 17,742 —4,498 13,244
' In accordance with 5 U.S.C. 3055(a), subject to specified restrictions, a retired employee who elects to obtain or retain a health benefits plan other than the uniform Goverament-wide health benefits plan directly with a carrier shall be paid a Goverament contribution toward the cost of his plan which shall be equal in ^ amount to the appropriate Goverament contribution.
" Difference between cost and face value of investments. ' Includes $22,271 advances to retirement systems. * Includes $ 13.519 advances to retirement systems.
3,319 733
13.229 ...
17,281 ' 461
-3,319 .... — 7 3 3 .. .
-4,052 — 4 4 6 •
13,229
13,229 * 15
Digitized for FRASER http://fraser.stlouisfed.org/ Federal Reserve Bank of St. Louis
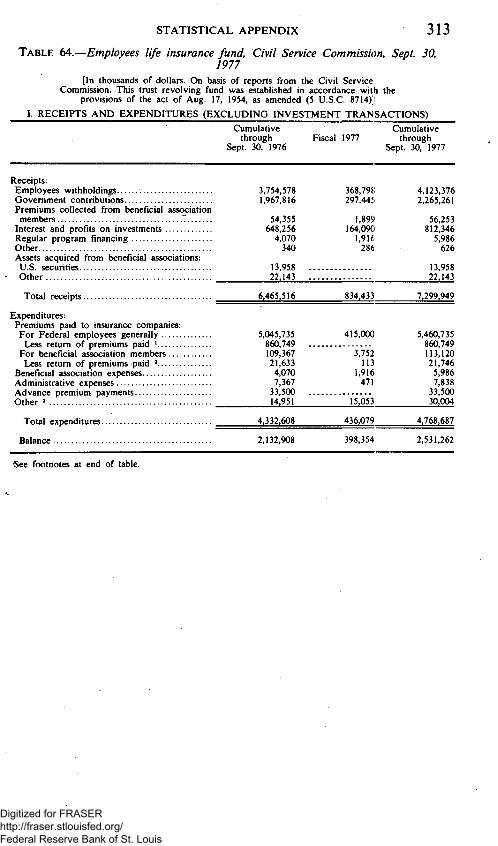
STATISTICAL APPENDIX 313 TABLE 64.—Employees life insurance fund, Civil Service Commission, Sept. 30,
1977 [In thousands of dollars. On basis of reports from the Civil Service
Commission. This trust revolving fund was established in accordance with the provisions of the act of Aug. 17, 1954, as amended (5 U.S.C. 8714):!
I. RECEIPTS AND EXPENDITURES (EXCLUDING INVESTMENT TRANSACTIONS)
Cumulative Cumulative through Fiscal 1977 through
Sept. 30, 1976 Sept. 30, 1977
Receipts: Employees withholdings Goverament contributions Premiums collected from beneficial association members
Interest and profits on investments Regular program financing Other Assets acquired from beneficial associations:
U.S. securities Other
Total receipts
Expenditures: Premiums paid to insurance companies: For Federal employees generally
Less retura of premiums paid ' For beneficial association members
Less retura of premiums paid " Beneficial association expenses Administrative expenses Advance premium payments Other '
Total expenditures
Balance
3.754.578 1.967.816
54,355 648,256 4,070 340
13,958 ... 22.143 ...
6.465i516
5.045.735 860.749 ... 109,367 21,633 4,070 7,367
33 500 14,951
4,332.608
368.79?; 297.44!.
1,89S' 164,090
1,916 286
834.433
415.000
3.752 113
1.916 471
15.053
436.079
4.123.376 2,265.261
56.253 812.346 5.986 626
13.958 22.143
7.299.949
5.460.735 860.749 113,120 21,746 5,986 7,838
33 500 30,004
4.768.687
2.132.908 398.354 2.531.262
See footnotes at end of table.
Digitized for FRASER http://fraser.stlouisfed.org/ Federal Reserve Bank of St. Louis
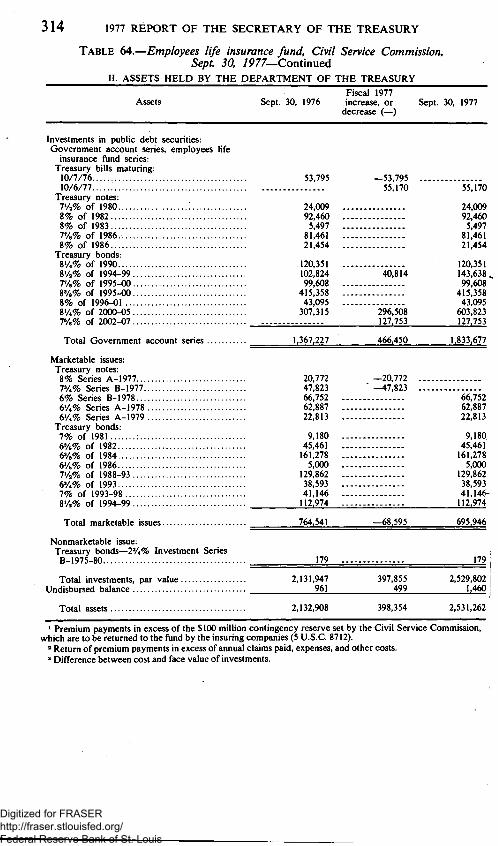
314 1977 REPORT OF THE SECRETARY OF THE TREASURY
TABLE 64.—Employees life insurance fund. Civil Service Commission, Sept. 30, 7977—Continued
II. ASSETS HELD BY THE DEPARTMENT OF THE TREASURY
Assets Sept. 30. 1976 Fiscal 1977 increase, or
decrease (—) Sept. 30. 1977
Investments in public debt securities: Government account series, employees life
insurance fund series: Treasury bills maturing: 10/7/76 10/6/77
Treasury notes: 7'/,% of 1980 : 8% of 1982 8% of 1983 VA% of 1986. 8% of 1986
Treasury bonds: 8'/4% of 1990 8'/2% of 1994-99 7V8% of 1995-00 8'/8% of 1995-00 8% of 1996-01 8'/4% of 2000-05 7»/8% of 2002-07
Total Govemment account series
Marketable issues: Treasury notes:
8% Series A-1977 7'/4% Series B-1977 6% Series B-1978 6'/4% Series A-1978 6'/4% Series A-1979
Treasury bonds: 7% of 1981 6'/8% of 1982 6'/8% of 1984 6'/8% of 1986 7'/3% of 1988-93 6'/4% of 1993 7% of 1993-98 8'/a% of 1994-99
Total marketable issues
Nonmarketable issue: Treasury bonds—2'/4% Investment Series
B-1975-80
Total investments, par value Undisbursed balance
Total assets
.... 53,795
24,009 92,460 5,497
81,461 21,454
.120,351 102,824 99,608
415,358 43,095 307.315
1,367.227
20.772 47.823 66,752 62,887 22,813
9,180 45,461 161,278 5,000
129,862 38.593 41.146 112.974
764.541
179
2.131.947 961
—53.795 .. 55.170
40,814
29"6,V08 127,753
466,450
—20,772 .. • —47,823 ..
—68,595
397,855 499
"55]i70
24,009 92,460 5,497
81,461 21,454
120,351 143,638. 99 608
415,358 43,095 603,823 127.753
1.833.677
66,752 62,887 22.813
9,180 45.461 161.278 5.000
129,862 38,593 41 146^ 112,974
695,946
179
2,529,802 1,460
2,132.908 398.354 2.531.262
' Premium payments in excess ofthe $100 million contingency reserve set by the Civil Service Commission, which are to be returaed to the fund by the insuring companies (5 U.S.C. 8712).
" Retura of premium payments in excess of annual claims paid, expenses, and other costs. ' Difference between cost and face value of investments.
Digitized for FRASER http://fraser.stlouisfed.org/ Federal Reserve Bank of St. Louis

STATISTICAL APPENDIX 315 TABLE 65.—Federal disability insurance trust fund, Sept. 30, 1977
[In thousands of dollars. This trust fund was established in accordance with the piovisions of the Social Security Act amendments approved Aug. 1. 1956 (42 U.S.C. 401(b))]
I. RECEIPTS AND EXPENDITURES (EXCLUDING INVESTMENT TRANSACTIONS IN FEDERAL AND NON-FEDERAL SECURITIES)
Cumulative through
Sept. 30. 1976 Fiscal 1977
Cumulative through
Sept. 30, 1977
Receipts: Appropriations '
Less refund of internal revenue collections.. Deposits by States Interest and profits on investments " Payments from railroad retirement account... Other (HEW) Transfers from general fund
Total receipts
Expenditures: Benefit payments To railroad retirement account Administrative expenses: To general fund Salaries and expenses Construction of buildings
Vocational rehabilitation—administrative expenses
Vocational rehabilitation program payment . . . To Federal supplementary medical insurance
trust fund To Federal old-age and survivors insurance
trust fund From Federal hospital insurance trust fund...
Total expenditures
55,886,636 513,003
5,819,367 3,626,761
26,831 830
391.000
}.133.60:> 39.260
805.160 373.907
14 103.000
64.020.238 552,263
6,624,528 4,000,668
26,831 844
494,000
65.238.422 9.376 .42 :L 74.614.846
55.609.181 320.454
128,913 1,802,489
12,760
4,372 383,018
988
517,819 — 1,937
11,135,237 -31^1
17,911 329,044.
162,
552. 77,044
27,343
—575 5,598
66,744,418 320,136
• 146,824 2.131,533
12,922
4,924 460,062
28,331
517,244 3,661
58.778,057 11.591.998 70,370,055
Balance.. 6,460,365 -2.215,574 4,244,791
II. ASSH IS HELD BY THE DEPARTMENT OF THE TREASURY
Fiscal 1977 Assets Sept. 30, 1976 increase, or Sept. 30, 1977
decrease (—)
Investments in public debt securities Government account series, Federal disability
insurance trust fund series, maturing June 30:
Certificates of indebtedness: 7'/8% of 1977 7% of 1978
Treasury notes: 6'/8% of 1978 5'/4% of 1979 6»/8% of 1980
Treasury bonds: 7'/8% of 1981.; 7'/2% of 1981 7»/8% of 1981 7'/8% of 1982 7'/8% of 1982 7'/a% of 1982 7»/8% of 1982.. 7'/8% of 1983 7'/8% of 1983 l'A% of 1983 7»/8% of 1983 7'/8% of 1984 7'/8% of 1984 7'/a% of 1984 7'/8% of 1984 7'/8% of 1985 7'/8% of 1985 l'A% of 1985 7V8% of 1985
See footnotes at end of table.
724,491
452,652 1,058,617 943,266
—724,491 710,032
—452,652 -1,058,617 —943,266
710,032
84,338 —61,499 63,020 121,663
5,830 84,338 63,020 121,663
5,830 84,338 63,020 121,663
5,830 84,338 63,020 121,663
5,830 84,338 63,020 121,663
22,839 63,020 121,663 5,830
84,338 63,020 121,663 5,830
84,338 63,020 121,663 5,830
84,338 63,020 121,663 5,830
84,338 63,020 121,663
Digitized for FRASER http://fraser.stlouisfed.org/ Federal Reserve Bank of St. Louis

316 1977 REPORT OF THE SECRETARY OF THE TREASURY
TABLE 65.—Federal disability insurance trust fund, Sept. 30, 7977—Continued
II. ASSETS HELD BY THE DEPARTMENT OF THE TREASURY-Continued
Assets Sept. 30, 1976 Fiscal 1977 increase, or
decrease (—) Sept. 30, 1977
Investments in public debt securities—Continued Government account series. Federal disability
insurance trust fund series. maturing June 30—Continued
Treasury bonds—Continued 7'/8% of 1986 7'/8% of 1986 7'/2% of 1986 7V8% of 1986 7'/8% of 1987 7'/8% of 1987 7'/2% of 1987 7V8% of 1987 7'/8% of 1988 7'/8% of 1988 7'/,% of 1988 7'/8%'of 1988 7'/8% of 1989 7'/8% of 1989 VA% of 1989 7V8% of 1989 7'/8% of 1990. 7'/8% of 1990 7'/2% of 1990 7y8% of 1991 VA% of 1991 7'/8% of 1992
Total Goverament account series
Marketable issues: Treasury notes:
7'/4% Series B-1977 8% Series A-1977 6'/4% Series A-1978 6% Series B-1978
Treasury bonds: 4'/*% of 1975-85 4% of 1980 6'/8% of 1984 4'/4% of 1987-92 VA% of 1988-93 4'/8% of 1989-94 3'/2% of 1990 l'A% of 1998 8% of 1996-01 8'/*% of 2000-05 7'/8% of 2002-07
Total marketable issues
Total investments, par value Undisbursed balance '
Subtotal Unamortized discount and premium on
investments (net)
: Total assets
84,338 63,020
121,663
84,338 63,019
121,663
84,337 63,020
121,663
84,337 63,020
121,663
206,000 63,020
269.020
6,138.252
5.830
5,831
5,831
5,831
5,831
5,831
274.851
—2,197,337
14,000 —14,000 10,000 —10,000 2,000 2.000
20,795 30,250 15.000 80.800 26.500 68,400 10,500 5,000
26,000 3,750
10.000
314.995
6.453.247 7,118
6,460,365
^-1,757
— 14,000
—2.211.337 —4,237
—2,215,574
96
300,99!
4,241.91( 2.881
4,244,79:
— 1,66
'6,458,608 -2,215,478
'Revised. ' Appropriations are equal to the amount of employment taxes collected as estimated by the Secretary of the
Treasury and adjusted in accordance with wage reports certified by the Secretary of Health, Education, and Welfare for distribution to this fund, the Federal old-age and survivors insurance trust fund, and the Federal hospital insurance trust fund.
" Through June 30, 1967, includes amortization of premium and discount, net. ' Includes the following balances in accounts as of Sept. 30, — (in thousands)
Benefit payments Vocational rehabilitation program payments.
1976 $3,071
3.986 Digitized for FRASER http://fraser.stlouisfed.org/ Federal Reserve Bank of St. Louis

STATISTICAL APPENDIX 317 TABLE 66.—Federal hospital insurance trust fund, Sept. 30, 1977
[In thousands of dollars. This trust fund was established in accordance with the provisions of the Social Security Act amendments approved .fuly 30,
1965 (42 U.S.C. 1395i)]
I. RECEIPTS AND EXPENDITURES (EXCLUDING INVESTMENT TRANSACTIONS , IN FEDERAL AND NON-FEDERAL SECURITIES)
Cumulative • through
Sept. 30, 1976 Fiscal 1977
Cumulative through
Sept. 30, 1977
Receipts: Appropriations '
Less refund of interaal revenue collections... Deposits by States Interest and profits on investments " Transfers from general fund Payments from railroad retirement accounts ... Other : Gifts Premiums collected for utiinsured individuals..
Total receipts
Expenditures: Benefit payments Interest paid to Federal supplementary medical insurance trust fund
Administrative expenses: To general fund To Federal old-age and survivors insurance
trust find To Federal disability insurance trust fund — To Federal supplementary medical insurance
trust fund Salaries and expenses Construction
Public health services
Total expenditures
Balance
64,702,829 528,260
7,222.523 2,631,682 6,051,568 395 920
7,704 21
19,910
12,434,382 61,920
1,276,073 " 769,925 944,000
15 2
10.506
77,137,211 590,180
8,498,596 3,401.607 6,995,568 395 920
7,719 23
30.416
80,503,897
'67,650,973
800
80,863
64,820 —8,360
—5,463 1,697,452
4,277 70,726
'69,556,(
15,372,983
14,912,370
11,973
—5,747 —5,5<.)8
3!)0 275,306
90 17,3(>3
15.206,107
95,876.880
82,563,343
800
92,836
59,073 — 13,958
—5,113 1,972,758
4,367 88,089
84.762,195
'10,947,809 166,876 11,114,685
See footnotes at end of table.
Digitized for FRASER http://fraser.stlouisfed.org/ Federal Reserve Bank of St. Louis

318 1977 REPORT OF THE SECRETARY OF THE TREASURY
TABLE 66.—Federal hospital insurance trust fund, Sept. 30, 7977—Continued
II. ASSETS HELD BY THE DEPARTMENT OF THE TREASURY
Assets Sept. 30. 1976 Fiscal 1977 increase, or
decrease (—) Sept. 30, 1977
Investments in public debt securities: Goverament account series, Federal hospital
insurance trust fund series, maturing June 30:
Certificates of indebtedness: 7'/8% of 1977 7% of 1978
Treasury notes: , 6'/8% of 1978 5y4% of 1979 6%% of 1980
Treasury bonds: 7'/8% of 1979 7'/8% of 1981 7»/a% of 1981 7V8% of 1981 7'/8% of 1982 7'/a% of 1982 7y8% of 1982 7'/8% of 1983 7'/,% of 1983 7y8% of 1983 7'/8% of 1984 7'/,% of 1984 7y8% of 1984 7'/8% of 1985 7'/a% of 1985 7y8% of 1985 7'/8% of 1986 7'/,% of 1986 7y8% of 1986 7'/8% of 1987 7'/a% of 1987 7y8% of 1987 7'/8% of 1988 7'/,% of 1988 7y8% of 1988 7'/8% of 1989 7'/a% of 1989 7y8% of 1989 7'/8% of 1990 7'/2% of 1990 l'A% of 1991 7'/8% of 1992
Total Govemment account series
Investments in agency securities: Goverament National Mortgage Association
participation certificates: Federal assets liquidation trust:
5.20% of 1982
Total agency securities
Total investments, par value Undisbursed balance
Total assets
687,920 —687,920 506,993 506,993
85,516 —85,516 537,999 —537,999
2,159,064 -^5,891 2,113,173
290,112 165,760 : 109,372 405,685 165,760 109,372 405,685 165,760 109,372 405,685 165,760 109.372 405,685 165,759 109.373 405,685 165,759 109,373 405,685 165.759 109,373 405,685 165.760 109,372 405,684 165,760 109,372 405,684 571,444 109.372 680.816
524^79
10959^482 -35J^42
290.112 165.760 -109.372 405,685 165,760 109,372 405,685 165,760 109,372 405,685 165,760 109,372 405,685 165,759 109,373 405,685 165,759 109,373 405,685 165,759 109,373 405,685 165,760 . 109,372 ^ 405,684' 165,760 109,372 405,684 571,444 109,372 680,816 524,479
10,923,740
50,000 ...
50,000 ...
11,009,482 '—61,672
—35,742 202,617
50.000
50.000
10.973.740 140.945
' 10.947.809 166.876 11,114,685
' Revised. ' Appropriations are equal to the amount of employment taxes collected as estimated by the Secretary of the
Treasury and adjusted in accordance with wage reports certified by the Secretary of Health, Education, and Welfare for distribution to this fund, the Federal old-age and survivors insurance trust fund, and the Federal disability insurance trust fund.
" Through June 30, 1967, includes amortizations of premium and discount, net.
Digitized for FRASER http://fraser.stlouisfed.org/ Federal Reserve Bank of St. Louis
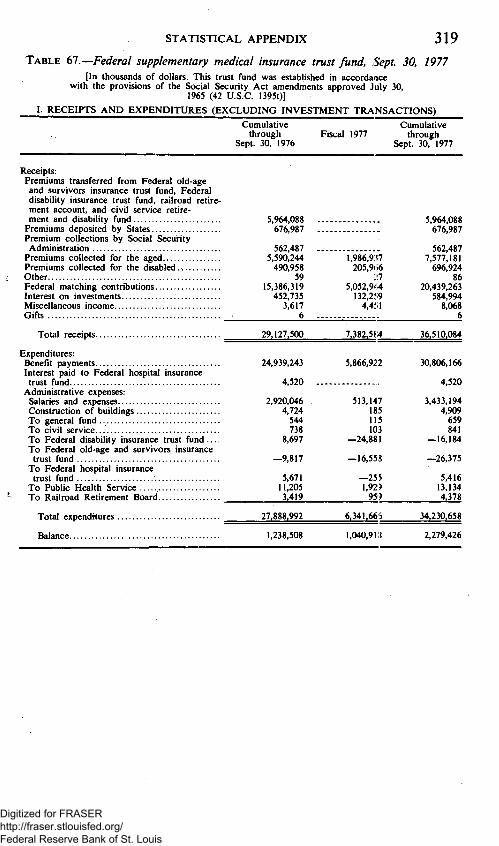
STATISTICAL APPENDIX 319 TABLE 61.—Federal supplementary medical insurance trust fund, Sept. 30, 1977
[In thousands of dollars. This trust fund was established in accordance with the provisions of the Social Security Act amendments approved July 30,
1965 (42 U.SC. 1395t)]
I. RECEIPTS AND EXPENDITURES (EXCLUDING INVESTMENT TRANSACTIONS)
Cumulative Cumulative through Fiscal 1977 through
Sept. 30, 1976 Sept. 30, 1977
Receipts: Premiums transferred from Federal old-age and survivors insurance trust fund, Federal disability insurance trust fund, railroad retire ment account, and civil service retirement and disability fund
Premiums deposited by States Premium collections by Social Security Administration
Premiums collected for the aged Premiums collected for the disabled. Other Federal matching contributions Interest on investments Miscellaneous income Gifts
Total receipts
Expenditures: Benefit payments Interest paid to Federal hospital insurance
trust fund Administrative expenses:
Salaries and expenses Construction of buildings To general fund To civil service To Federal disability insurance trust fund .... To Federal old-age and survivors insurance
trust fund To Federal hospital insurance
trust fund To Public Health Service To Railroad Retirement Board
Total expenditures
Balance
5,964.088 .. 676.987 ..
562.487 .. 5.590.244 490.958
59 15.386,319
452.735 3.617
6 .-
1.986,9.37 205,9(i6
21 5,052,9^W 132,2!i9 4,4!il
5,964,088 676,987
562,487 7,577,181 696,924
86 20,439,263
584,994 8,068
6
29,127,500
24,939,243
4,520 ..
2,920,046 . 4,724 544 738
8,697
—9,817
5,671 11,205 3.419
27,888.992
7,382.5J;4
5,866,922
513,147 185 115 103
—24,881
—16,558
— 2 5 5 1,92? 959
6,341.666
36.510.084
30,806,166
4,520
3,433,194 4,909 659 841
—16,184
—26.375
5.416 13.134 4.378
34.230,658
1.238,508 l,040,9l:J 2,279,426
Digitized for FRASER http://fraser.stlouisfed.org/ Federal Reserve Bank of St. Louis

320 1977 REPORT OF THE SECRETARY OF THE TREASURY
TABLE 67.—Federal supplementary medical insurance trust fund, Sept. 30, 7977—Continued
II. ASSETS HELD BY THE DEPARTMENT OF THE TREASURY
Assets Sept. 30, 1976 Fiscal 1977 increase, or
decrease (—) Sept. 30, 1977
Investnients in public debt securities: Government account series, Federal
supplementary medical insurance trust fund series, maturing June 30:
Certificates of indebtedness: 7'/8% of 1977 7y8% of 1977 7'/8% of 1978
Treasury notes: 6y8% of 1980
Treasury bonds: 7'/8% of 1978 7'/8% of 1979 7'/8% of 1981 7'/8% of 1981 l'A% of 1981 7'/8% of 1981 7'/8% of 1982 7'/8% of 1982 7'/,% of 1982 7y8% of 1982 7'/8% of 1983 7'/8% of 1983 l'A% of 1983 7y8% of 1983 7'/8% of 1984 7'/8% of 1984 VA% of 1984 7y8% of 1984 7'/8% of 1985 7'/8% of 1985. l'A% of 1985 7y8% of 1985 7'/8% of 1986 7'/8% of 1986 l'A% of 1986 7»/8% of 1986 7'/8% of 1987 7'/8% of 1987 7'/,% of 1987 7y8% of i987 7'/8% of 1988 7'/8% of 1988 7'/a% of 1988.
• VA% of 1988 7'/8% of 1989 7'/8% of 1989 l'A% of 1989 7»/8% of 1989 7'/8% of 1990.. 7'/8% of 1990... 7'/a% of 1990 7'/8% of 1991 7'/a% of 1991 7'/8% of 1992...,
Total investments, par value, Undisbursed balance . . . ; . .
Total assets
51,533 —51,533 17,311 ^17,311
41,235
277,822
121,411 137,817 56.246
11,547 8,060
61,964 56,245
11.547 8.060
61,964 56,245
11,546 8.061
61,964 56,245
11,546 *. 8.061
61.964 56.245
11.546 8,061
61,964 56.245
11.547 8.061
61.963 56.245
11,547 8,061
61.963 56.245
11,547 8,061
61,963 56,245
11,547 8,061
61,963 56,246
73,510 8,060
56,246 81,570
137^16
41.235
277,822
121,411 137.817 56,246 '-11,547 8,060
61,964 56.245 11.547 8.060
61.964 56,245 11,546 8.061
61.964 56.245 11.546 8,061
61,964 56,245 11,546 8,061
61,964 56,245 11,547
56,245 11,547 8,061
61,963 56,245 11,547 8,061
61,963 56,245 11,547 8,061
61,963 56,246 73,510 8,060
56.246 81.570 137.816
1.243.945 —5,437
988,133 52,785
2,232,078 47,348
1,238,508 1,040,918 2,279,426
Digitized for FRASER http://fraser.stlouisfed.org/ Federal Reserve Bank of St. Louis

STATISTICAL APPENDIX 321 TABLE 6%.—Federal old-age and survivors insurance trust fund, Sept. 30, 1977
[In thousands pf dollars. This trust fund, the successor of the old-age reserve account, was established in accordance with provisions of the Social Secuiity Act
amendments (42 U.S.C. 401). For further details see Annual Reports of the Secretary for 1940, p. 212 and 1950, p. 42]
I. RECEIPTS AND EXPENDITURES (EXCLUDING INVESTMEl^^T TRANSACTIONS IN FEDERAL AND NON-FEDERAL SECURITIES)
Cumulative through
Sept. 30, 1976 Fiscal 1977
Cumulative through
Sept. 30, 1977
Receipts: Appropriations '
Less refund of interaal revenue collections.. Deposits by States Interest and profits on investments " Interest on advances from supplemental security income program
Transfers from general fund ' ,. Payments from railroad retirement account.. . Other * Gifts
Total receipts
Expenditures: Benefit payments Construction of buildings To railroad retirement account Administrative expenses:
Salaries and expenses ' To general fund To Department of Health. Education, and
Welfare ' From Federal disability insurance trust fund . From Federal hospital insurance trust fund... From Federal supplementary medical insurance trust fund —
Vocational rehabilitation administrative expenses
Total expenditures
505,654,912 4,700.063
47,836.849 25,282,757
656 3,720.617
35,393 23,720
57
577,854,898
520.843.498 90,855
10.360,991
8,370,583 1,562,706
73,379 —498,675
—50,600
3,745
30,538 .
540,787,020
61,517,723 298,960
7,676,04<) 2,289,64'^
613,90:'.
(') 1()
71,798,37:1
71,270,51<> 14,73:i
1.207,84'
822.9 Ki 127.90:'.
5,49<> 57!i
• 5,747
18,45:;
.„ 7.64;i
73.481.82S[_
567,172,635 4,999,023
.55,512,895 27,572.401
656 4,334.519
35.393 23,726
67
649,653,269
592,114,017 105,588
11,568,832
9,193,499 1,690,608
78,878 —498,100 —44.853
22.197
38.183
614.268,849
Balance.. 37.067.878 -^1.683.45^. 35.384.420
II. ASSETS HELD BY THE DEPARTMENT OF THE TREASURY
Fiscal 1977 Assets Sept. 30. 1976 increase, or Sept. 30. 1977
decrease (—)
Investments in public debt securities: Goverament account series. Federal old-age
and survivors insurance trust fund series, maturing June 30:
Certificates of indebtedness: 7'/8% of 1977 7'/4% of 1977 7% of 1978 7'/8% of 1978
Treasury notes: 5'/.% of 1979 6»/8% of 1980
Treasury bonds: 7'/8% of 1981 7'/8% of 1981 7'/,% of 1981 7»/8% of 1981. . . . . . 7'/8% of 1982 7'/8% of 1982 l'A% of 1982 7y8% of 1982 7'/8% of 1983
See footnotes at end of table.
4.582.664 1.248.386
1.821.626 4,547,285
688,956 522,029 677,910
688^956 522,029 677,910
-4,582.66^: -1.248,38(1 5,180,29<-1.649,44(1
-1.821.626 -4.221,13:1
125.84(.
125.84(.
125.84(.
5.180,294 1,649,440
326,153
125,846 688,956 522,029 677,910 125,846 688,956 522,029 677,910 125,846
Digitized for FRASER http://fraser.stlouisfed.org/ Federal Reserve Bank of St. Louis

322 1977 REPORT OF THE SECRETARY OF THE TREASURY
TABLE 68.—Federal old-age and survivors insurance trust fund, Sept. 30, 7977—Continued
II. ASSETS HELD BY THE DEPARTMENT OF THE TREASURY-Continued
Assets Sept. 30, 1976 Fiscal 1977 increase, or
decrease (—) Sept. 30. 1977
Investments in public debt securities—Continued Government account series. Federal old-age
and survivors insurance trust fund series, maturing June 30—Continued
Treasury bonds—Continued 7'/8% of 1983 l'A% of 1983 7'/8% of 1983 7'/8% of 1984 7'/8% of 1984 7'/2% of 1984 7»/8% of 1984 7'/8% of 1985 7'/8% of 1985 7'/2% of 1985 7y8% of 1985 7'/8% of 1986 7'/8% of 1986 7'/a% of 1986 7»/8% of 1986 7'/8% of 1987 7'/8% of 1987 7'/2% of 1987 7y8% of 1987 7'/8% of 1988 7'/8% of 1988 7'/2% of 1988 7»/8% of 1988 7'/8% of 1989 7'/8% of 1989 7'/a% of 1989 7y8% of 1989 7'/8% of 1990 7'/8% of 1990 7'/a% of 1990 7'/8% of 1991 7'/2% of 1991 7'/8% of 1992 _
Total Goverament account series _
Marketable issues: Treasury bonds:
4'/4% of 1975-85 3'/4% of 1978-83 4% of 1980 3'/a% of 1980 7% of 1981 6'/8% of 1984 3'/4% of 1985 4'/4% of 1987-92 7'/2% of 1988-93 4'/8% of 1989-94 3'/ ,% of 1990 8'/,% of 1994-99 3% of 1995 3'/ ,% of 1998 7y8% of 1995-00 8'/8% of 1995-00 8% of 1996-01 8'/4% of 2000-05 7y8% of 2002-07
Treasury notes: 8% Series A-1977 _
Total marketable issues _
Nonmarketable issue: Treasury bonds—2'/4% Investment Series
B-1975-80 _
See footnotes at end of table.
688.956 522.029 677.910
688,956 522,029 677,910
688,956 522,029 677,910
688,956 522,028 677,910
68'8]955 522,029 677,910
688,956 522,029 677,909
688,956 522,029 677,909
1,366,865 522,029
1,888,893
125,846
125,846
125.847
r2'5".847
125,847
125,847
125,847
125,848
'ioivVi
32,977,799
2,457,146
1.064.902
—1.645.020
78.023 60.200
153,100 449,450
50,000 31,500 25,700 33,000 99,934 91,300
556,250 6,352
70,170 552,037 22,180 50,000 90,500 22,450
15,000
15,000 —15.000
688,956 522,029 677,910 125,846 688,956 522,029 677,910 125,846 688,956 522,029 677,910 125,847 688.956 522.028 677.910 125.847 688.955 522.029 677.910 125.847 688.956 522,029 677,909 125,847 688,956 522,029 677,909 125,847
1,366,865 522,029 125,848
1,888,893 2,014,741
31,332,779
78,023 60,200
153,100 449,450
50,000 31,500 25,700 33,000 99,934 91,300
556,250 6,352
70,170 552,037 22,180 50,000 90,500 22,450 15,000
2,457,146
1.064.902
Digitized for FRASER http://fraser.stlouisfed.org/ Federal Reserve Bank of St. Louis

STATISTICAL APPENDIX 323 TABLE 68.—Federal old-age and survivors insurance trust fund,
Sept. 30, 7977—Continued II. ASSETS HELD BY THE DEPARTMENT OF THE TREASURY-Continued
Assets Sept. 30. 1976 Fiscal 1977 increase, or
decrease (—) Sept. 30. 1977
Investments in agency securities: Goverament National Mortgage Association:
Federal assets liquidation trust: 5.20% of 1982 5.10% of 1987
Federal assets finance trust: 6.40% of 1987 6.05% of 1988 6.45% of 1988 6.20% of 1988
Total agency securities
Total investments, par value Undisbursed funds *
Subtotal Accrued interest purchased Unamortized discount and premium on investments (net)
Total assets
100.000 .. 50 000 ..
75.000 .. 65.000 -. 35.000 ..
230.000 ..
555.000 ..
37.054.847 13.031
37.067.878
—12.682
—1.645,020 —38,438
—1.683.458
475
100.000 50 000
75.000 65.000 35.000
230.000
555.000
35.409,827 —25,407
35,384,420
—12,207
37,055,196 -1,682,983 35,372,213
' Appropriations are equal to the amount of employment taxes collected as estimated by the Secretary of the Treasury and adjusted in accordance with wage reports certified by the Secretary of Health, Education, and Welfare for distribution to this fund, the Federal disability insurance trust fund, and the Federal hospital insurance trust fund.
" Through June 30, 1967, includes amortization of premium and discount, net. ' In connection with payments of benefits to survivors of certain World War II veterans who died within 3
years after separation from active service. * Incidental recoveries, and beginning with fiscal 1958, includes reimbursement of interest in the net amount
of $15,039,908 transferred from the Federal disability insurance trust fund; beginning with fiscal 1966, $1,929,801 from the Federal hospital insurance trust fund; and beginning with fiscal 1967, $1,132,572 from the Federal supplementary medical insurance trust fund.
' Paid directly from the trust fund beginning with fiscal 1947 under annual appropriation acts. «Includes the following balances in accounts as of Sept. 30, — (in thousands)
Benefit payments Salaries and expenses Construction of buildings Vocational rehabilitation program payment.
1976 $1,168 10.075 647
1,005
1977 -$22,851
7,122 -12,173
1,622
Digitized for FRASER http://fraser.stlouisfed.org/ Federal Reserve Bank of St. Louis

324 1977 REPORT OF THE SECRETARY OF THE TREASURY
TABLE 69.—Foreign service retirement and disability fund, Sept. 30, 1977 [In thousands of dollars. This trust fund was established in accordance with
the provisions of the act of May 24, 1924, and the act of Aug. 13, 1946 (22 U.S.C. 1062). For further details, see Annual Report of the Secretary for 1941, p. 138]
I. RECEIPTS AND EXPENDITURES (EXCLUDING INVESTMENT TRANSACTIONS)
Cumulative Cumulative through Fiscal 1977 through
Sept. 30, 1976 Sept. 30, 1977
Receipts: Deductions from salaries, service credit pay
ments and voluntary contributions of employees subject to retirement ac t . . .
Appropriations ' Payments by employing agency ' Receipts from civil service retirement and disability fund
Adjustments in widow survivor benefits ... Interest and profits on investments
Total receipts.
Expenditures: Annuity payments and refunds
Balance 176,222 92.313 268,535
^ See footnote at end of table.
301,396 25,816 ... 101,278
78,479 58 ...
58.540
565,566
389.344
132,196
16,791
13,682
13,487
176.156
83.843
433.592 25.816 118,069
92,161 58
72.027
741.722
473,187
Digitized for FRASER http://fraser.stlouisfed.org/ Federal Reserve Bank of St. Louis

STATISTICAL APPENDIX 325 TABLE 69.—Foreign service retirement and disability fund,
Sept. 30, 7977—Continued II. ASSETS HELD BY THE DEPARTMENT OF THE TREASURY
Assets Sept. 30, 1976 Fiscal 1977 increase, or
decrease (—) Sept. 30, 1977
Investments in public debt securities: Government account series, foreign service re
tirement fund series, maturing June 30: Certificates of indebtedness:
7% of 1978 7'/8% of 1978..
Treasury notes: 6'/8% of 1978 5'/4% of 1979 6y8% of 1980
Treasury bonds: 4% of 1978 7'/8% of 1978 4% of 1979 7'/8% of 1979 4% of 1980 4% of 1981 7'/8% of 1981 7'/8% of 1981 7'/,% of 1981 4% of 1982 7'/8% of 1982 7'/8% of 1982 7'/2% of 1982 4% of 1983 7'/8% of 1983 7'/8% of 1983 VA% of 1983 7'/8% of 1984 7'/8% of 1984 l'A% of 1984 7y8% of 1984 7'/8% of 1985..... 7'/8% of 1985 7'/2% of 1985 7V8% of 1985 7'/8% of 1986 7'/8% of 1986 7'/2% of 1986 7y8% of 1986 7'/8% of 1987 7'/8% of 1987. 7'/,% of 1987 7y8% of 1987 7'/8% of 1988 7'/8% of 1988 7'/2% of 1988 7y8% of 1988 7'/8% of 1989 7'/8% of 1989 7'/a% of 1989 7'/8% of 1989 7'/8% of 1990.. 7'/8% of 1990 7'/2% of 1990 7'/8% of 1991 7'/2% of 1991 7'/8% of 1992
Total investments, par value Undisbursed balance
Total assets
66,222 2,582
4,454 -^,454 9,125 11,192
357 — 3 5 7 9,398
3,017 2.067
3,017 ..... 3,017
312 7,323 • 2,792 3,017
312 7.323 :.-2,792 3.017
312 7,323 2,792
312 3,348 2.792 6,992
312 3,347 2.793 6,992
313. 3,347 2,792 6,992
313 3,347 2,792 6.992
313 3.347 2.792 :.. 6.992
313 3.348 2.792 :. 6.991
313 10,339 2,792
313 13,131
13,444
175,608 92.340 614 — 2 7
66,222 2,582
9,125 11,192
9,398 3,017 2,067 3.017 3,017 312
7,323 2,792 3,017 312
7,323 2,792 3,017 312
7,323 2,792
312 3,348 2,792 6.992
312 3,347 2,793 6,992
313 3.347 2.792 6.992
313 3,347 2,792 6,992
313 3,347 2,792 6,992
313 3,348 2,792 6,991
313 10.339 2,792
313 13,131 13,444
267,948 587
176,222 92,313 268,535
' Beginning July 1, 1961, appropriations are not made directly to the fund. Instead, in accordance with the act approved Sept. 8, 1960 (22 U.S.C. 1071(a)), the employing agency contributes (from appropriations or funds from which the salaries are paid) amounts equal to the deductions from employees salaries.
Digitized for FRASER http://fraser.stlouisfed.org/ Federal Reserve Bank of St. Louis

326 1977 REPORT OF THE SECRETARY OF THE TREASURY
TABLE 10.—Highway trust fund, Sept. 30, 1977 3f dollars. This trust fund was established in accordance with n 209(a) of the Highway Revenue Act of 1956 (23 U.S.C. 12
I. RECEIPTS AND EXPENDITURES (EXCLUDING INVESTMENT TRANSACTIONS)
[In thousands of dollars. This trust fund was established in accordance with the provisions of section 209(a) of the Highway Revenue Act of 1956 (23 U.S.C. 120 note)]
Cumulative Cumulative through Fiscal 1977 through
Sept. 30, 1976 Sept. 30, 1977
Receipts: Excise taxes: ' Gasoline " Diesel and special motor fuels Tires » Tread rubber "... Trucks, buses, and trailers " Truck use Inner tubes " Other tires Parts and accessories for trucks, buses, etc. Lubricating oils
59.808,284 4,016,063 9,070,915 460,037
7,586,222 2,363,316 459,388 272,718 ..
1,041,906 1.005.205
4,396,643 453,814 757,995 24,916
708,127 239,700 30,059
164,714 101,390
64,204,927 4,469,877 9,828,910 484,953
8,294,349 2,603,016 489,447 272,718
1,206,620 1,106.595
Total taxes 86,084,054 6,877,358 92,961,412 Transfer to land and water conservation fund. 333,800 33,000 366,800
Gross taxes 85,750,254 6,844,358 92,594,612
Deduct—reimbursement to general fund—refund of tax receipts:
Gasoline used on farms 1,902,155 106,444 2,008,599 Gasoline for nonhighway purposes or local transit systems 367,440 3,615 371,055
Gasoline, other 103 103 Tires and tread rubber 97 : . . 97 Trucks, buses, and trailers 67 67 Floor stock taxes Lubricating oils not used in highway motor vehicles 190,335 25,069 215,404
Light-duty trucks 174,821 174,821
Total refunds of taxes 2.635.018 135.128 2.770.146
Net taxes 83,115,237 6,709,230 89,824,467 Interest on investments 2,550,681 593,048 3,143,729 Miscellaneous interest 420 20 440 Advances from general fund 489.000 489,000
Less return of advances to general fund 489,000 489,000 Reimbursement from general fund 15,098 15,098
Net receipts 85.681,436 7,302,298 92,983,734
Expenditures: Highway program:
Reimbursement to general fund 501,019 501,019 Federal Aid Highway Act of 1956 75.063,358 5,574,815 80,638,174 Pentagon road network 2,245 2,245 Right-of-way revolving fund 169,126 9,176 178,302 Forest highways 10,000 10.000 National Highway Traffic Safety Administration 389,686 124,900 514,586
Trust fund share other highway programs,... 57,243 28,844 86,087 Public lands highways 5.000 5,000 Highway safety construction 462.191 398,131 860,322 Baltimore-Washington Parkway 461 70 531 Highway safety research and development ,.. 5,927 7,570 13,497 Overseas highways 1,830 1,830 Highland Scenic Highway 1,331 1,331 Acceleration of projects 508 508
Total highway program 76,666,256 6,147,175 82,813,432 Services of Department of Labor (administration and enforcement of Labor standards) 368 368
Interest on advances from general fund 6.288 6.288 Total expenditures 76.672.912 6.147.175 82.820.088
Balance 9,008,523 1,155,123 10,163,646
See footnotes at end of table.
Digitized for FRASER http://fraser.stlouisfed.org/ Federal Reserve Bank of St. Louis

STATISTICAL APPENDIX 3 2 7
TABLE 10.—Highway trust fund, Sept. 30, 7977—Continued II. ASSETS HELD BY THE DEPARTMENT OF THE TREASURY
Fiscal 1977 Assets Sept. 30, 1976 increase, or Sept. 30, 1977
decrease (—)
Investments in public debt securities: Government account series, Treasury
certificates of indebtedness, highway trust fund series, maturing June 30:
6'/2% of 1977 d'A% of 1978 6'/8% of 1978
Total investments, par value Undisbursed balance
Total assets
' Amounts equivalent to specified percentages of receipts from certain taxes on motor fuels, vehicles, tires and tubes, and use of certain vehicles are appropriated and transferred monthly from general fund receipts to the trust fund on the basis of estimates by the Secretary of the Treasury, with proper adjustments to be made in subsequent transfers as required by section 209(c) ofthe Highway Revenue Act of 1956, as amended (23 U.S.C. 120 note). See also the annual report to Congress on the financial condition and results of operations of the highway trust fund.
" Includes floor stocks taxes.
8,951,876
8,951,876 56.647
9,008.523
—8.951.876 .. 8,671.356 1.407.331
1.126,811 28,312
1,155,123
8,671.356 1.407.331
10.078.687 84.959
10.163,646
Digitized for FRASER http://fraser.stlouisfed.org/ Federal Reserve Bank of St. Louis

328 1977 REPORT OF THE SECRETARY OF THE TREASURY
TABLE 71.—Judicial survivors annuity fund, Sept. 30, 1977 [In thousands of dollars. This fund was established in accordance with the provisions of the act of Aug. 3, 1956 (28 U.S.C. 376(b)]
I. RECEIPTS AND EXPENDITURES (EXCLUDING INVESTMENT TRANSACTIONS)
Receipts: Deductions from salaries and contributions . Interest and profits on investments
Total receipts Expenditures: Annuity payments, refunds, etc
Balance
II. ASSETS HELD BY THE
Assets
Cumulative through
Sept. 30. 1976
19,856 3,917
23,772
12.825
10,947
Fiscal 1977
2;515 1,908
4,423
—26,324
30,747
DEPARTMENT OF THE TREASURY
Sept. 30, 1976 Fiscal 1977 increase, or
decrease (—)
Cumulative through
Sept. 30, 1977
Sept.
22,371 5,825
28,195
— 13,499
41,694
30, 1977
Investments in public debt securities: Goverament account series, judicial survivors
annuity fund: Treasury bonds:
8'/2% of 1994-99 8'/8% of 1995-2000 8% of 1996-2001 8'/4% of 2000-05 7y8% of 2002-07
Total Government account series
Marketable issues: Treasury notes:
7'/4% Series B-1977 8% Series A-1977 6% Series B-1978 6'/4% Series A-1978 6'/4% Series A-1979
Treasury bonds: 4'/4% of 1975-85 3'/4% of 1978-83 3'/2% of 1980 4% of 1980 6'/8% of 1982 6'/8% of 1984 6'/8% of 1986 4'/4% of 1987-92 7'/2% of 1988-93 4'/8% of 1989-94 3'/2% of 1990 6'/4% of 1993 %'A% of 1994-99 3% of 1995 3'/2% of 1998 7% of 1998
Total marketable issues
Total investments, par value — Undisbursed balance
Total assets
324 482 222 975
2,003
155 395 359 146 . . . 191
755 ' 5 4 5 . . . ' 306 . . .
664 . . . 236 . . . 416 . . . 239 . . . 722 . . .
1,054 . . . 167
' 188 281
1 738 51
' 113 195 . . .
8,918
10,921 26
1,833 28.692
23 550
31,098
— 155 —395
—550
30,548 199
2,157 29,174
222 998 550
33,101
359 146 191
755 ' 545 ' 306
664 236 416 239 722
1,054 167
' 188 281
1 738 51
' 113 195
8,368
41,469 225
10,947 30,747 41,694
' Excludes $500 U.S. Treasury bonds.
Digitized for FRASER http://fraser.stlouisfed.org/ Federal Reserve Bank of St. Louis

TABLE 11.—Library of Congress trust funds, Sept. 30, 1977 [Established in accordance with provisions of thi;-.V,l of Mar. 3. 1925, as amended (2 U.S.C. 154-161). For further details see 1941 Annual Report, p. 149]
Permanent loan account
Funds on deposit with Treasury of the United States
Interest paid by U.S. Treasury ' Income from donated securities, etc.
Sept. 30, 1976
Fiscal 1977
Sept. 30. 1977
Cumulative Cumulative Cumulative through Fiscal through through Sept. 30. 1977 Sept. 30. Sept. 30,
1976 1977 1976
Cumulative Fiscal through 1977 Sept. 30,
1977
Name of donor: Coolidge, Elizabeth S Evans, Archibald B., fund Feinberg, Lenore B. and Charles, fund Friends of Music in the Library of Congress . Kaplan, Milton, fund Koussevitzky Music Foundation, Inc Porter, Henry K., memorial fund Stera memorial fund Whittal, Gertrude C : Collection of Stradivari instruments
and Tourte bows Poetry fund General literature Appreciation and understanding of good literature
Subtotal .
Babine, Alexis V Benjamin, William E Bowker, Richard R Carnegie Corporation of New York Elson, Louis C , memorial fund Feinberg. Lenore B. and Charles, fund , Guggenheim. Daniel Hanks, Nymphus Corridon Huntington. Archer M Kaplan. Milton, fund
See footnotes at end of table.
$804,444 25.000
189 11.359 2.660
208.099 290.500
27,549
1.538.609 414.698 393.280
150.000
3.866.388
6.685 83,083 14,843 93,308 12.585
811 90.654
5.227 260.578
$300
$804,444 25.000
189 11.659 2.660
208.099 290.500
27.549
1.538.609 414.698 393.280
150.000
$771,142 670 192
9.500
192^374 354.427
13.759
1.456.955 211.435 326.288
137.407
$58,484 $829,626 $131,905 1,818 2,488
15 " 207 ' 846 10,346 318 194 194
15,129 207,503 21,119 375,546 25,369 2,003 15,762 75
111,859 1,568,814 3.382 7.353 218.788 51.387 377.675 2.168
10,904 148,311
300 3,866.688 3,474,149 281,111 3,755,260 163,217
6,685 83,083 14,843 93,308 12,585
811 90,654 5,227
260,578
10,849 100,804 14,306
148,266 16,411
107 146,814 4,529
321,618 193
567 6,996 1.185 7,478 1,109
64 10,041
417 21.059
11.416 1.786 107.800 49.745 15.491 8,025
155.744 37,838 17,520
171 156.855 32,759 4.946 .........
342.677 691,002 193 ..:
'3..905
c/3
------ H 318 >
H on
25,369 H 75 O
•> r
$28,195
3,382
2,168
163,217
1,786 49.745 8,025
37,838
32.759
719.197
>
cn Z
a
to
Digitized for FRASER http://fraser.stlouisfed.org/ Federal Reserve Bank of St. Louis

TABLE 72.—Library of Congress trust funds, Sept. 30, 1977—Continued O Permanent loan account
Funds on deposit with Treasury of the United States
Interest paid by U.S. Treasury ' Income from donated securities, etc.
Sept. 30. 1976
Fiscal 1977
Sept. 30. 1977
Cumulative Cumulative Cumulative through Fiscal through through Sept. 30. 1977 Sept. 30. Sept. 30.
1976 1977 1976
Fiscal 1977
Cumulative through Sept. 30.
1977 7i m s po H o H X tn in tn
7i
cn
t 70 O ^ H X tn
cn > c/3 G 7i
Name of donor—Continued Longworth, Nicholas, Foundation McKim fund Miller, Dayton C National Library for the Bhnd, Inc PenneU, Joseph Roberts fund Scala, Norman P., memorial fund Sonneck memorial fund Swann, Caroline and Erwin, memorial fund. Wilbur. James B
Subtotal *
Donations and investment income. Expenditures from—
Investment income Permanent loan accounts Investment accounts
Balance in the accounts..
$10,692
20.548 36.015
303.250 62.704 92.229 12.088
$10,692 $15,257
20,548 36,015
303,250 62,704 92,229 12,088
27,115 36,085
440,445 68,222 40.372 19,169
305,814 305.814 489,442
1,411,113 1,411,114 1,900,004
5,277,502 $300 5,277,802 5.374.153
4.695.203 170.410 72,955
$1,005 $16,262 $757 176,444
1,672 28,787 413 2,874 38,959
24,202 464,647 85,488 5,916 74,138
• 7,444 47,816 1.162 20.331 4.430
7,500 25,413 514,855 107,345
118,604 2,018,608 1,203,532
399.715 5.773.868 1.366.749
243.365 4.938,568 1.310.531 6.523 176.933 7.890 80.845
$55,000
20.461
$757 231.444
413
85.488
4.430 27.961 107.345
103,656 1.307.188
103,656 1,470,405
106,851 1,417,382
5,277,502 300 5,277,802 435,585 141,937 577,522 56,218 —3,195 53,023
' Interest paid at the rate of 4 percent to May 22, 1976. Thereafter, paid at the rate which is 0.25 percent less than a rate determined by the Secretary of the Treasury, taking into consideration the current average market yield on outstanding long-term marketable obhgations of the United States, adjusted to the nearest one-eighth of 1 percent, but not less than 4 percent, as provided in Public Law 94-289, 94th Congress.
" The Lenore B. and Charles Feinberg fund includes both permanent loan funds as well as investments in special bonds.
' Includes income from securities held as investments under deed of trust dated Nov. 17, 1936, administered by designated trustees including the Bank of New York.
* During fiscal 1975 these funds were invested in 8.5 percent special bonds. ' Represents unappropriated receipts. NOTE.—Above table does not include $57,000 of bank securities repjesenting market
value of bequest to the "Katie and Walter Louchheim Fund" donations. Also does not include securities received from the bequest of the late Leonora Jackson McKim estate consisting of various stocks, notes, and bonds at a market value of $940,000, together with invested income of $205,000.
Digitized for FRASER http://fraser.stlouisfed.org/ Federal Reserve Bank of St. Louis

STATISTICAL APPENDIX 331 TABLE 73.—National service life insurance fund, Sept. 30, 1977 [In thousands of dollars. This trust fund was established in accordance with the
provisions of the act of Oct. 8. 1940 (38 U.S.C. 720). For further details, see Annual Report of the Secretary for 1941, p. 143]
I. RECEIPTS AND EXPENDITURES (EXCLUDING INVESTMENT TRANSACTIONS IN FEDERAL AND NON-FEDERAL SECURITIES)
Receipts: Premiums and other receipts Interest on investments Payments from general fund.
Total receipts Expenditures:
Benefit payments, dividends.
Balance
and
II. ASSETS HELD
Assets
refunds . . . .
Cumulative through
Sept. 30, 1976
16,666,546 6,557,625 4,799,939
28,024,110
20,741,280
7,282,830
Fiscal 1977
478,053 432,655
2,114
912,822
697,602
215,220
BY THE DEPARTMENT OF THE TREASURY
Sept. 30, 1976 Fiscal 1977 increase, or
decrease (—)
Cumulative through
Sept. 30, 1977
Sept.
17,144,599 6,990,280 4,802.053
28,936.932
21.438.882
7.498,050
30. 1977
Investments in public debt securities: Government account series, national service
Hfe insurance fund series. maturing June 30:
Certificates of indebtedness: d'A% of 1977 7% of 1977 7'/8% of 1977 6'/8% of 1978 678% of 1978
Treasury notes: 7'/2% of 1977 5'/.% of 1978 5'/2% of 1979 6'/2% of 1980
Treasury bonds: 3'/4% of 1977 3%% of 1977 3'/8% of 1978 3V8% of 1978 3V8% of 1979 yA% of 1980 4'/.% of 1981 6'/4% of 1981 6'/4% of 1982 7% of 1982 7'/4% of 1982 7'/2% of 1982 6'/4% of 1983 7% of 1983 7'/4% of 1983 7'/2% of 1983 6'/4% of 1984 7% of 1984 7'/4% of 1984 7'/2% of 1984 6'/,% of 1985
See footnotes at end of table.
511 12,791 11,957
569,007 1,091,044
481,013 666,100
386,307 7,512
298.259 95.560
393.819 393.819 225.452
85,056 75,793 71,456
85,056 75,793 71,456
85,057 75,793 71,455
—511 — 12,791 — 11,957
3,944 6,162
—569,007
-386,307 —7,512 —4,940
93,341 86,488
86,488
86,488
86,488
3,944 6,162
1,091,044 481,013 666,100
293,319 95,560
393,819 393,819 225,452 93,341 86,488 85,056 75,793 71,456 86,488 85,056 75,793 71,456 86,488 85,057 75.793 71,455 86,488
Digitized for FRASER http://fraser.stlouisfed.org/ Federal Reserve Bank of St. Louis

332 1977 REPORT OF THE SECRETARY OF THE TREASURY
TABLE 73.—National service life insurance fund, Sept. 30, 1977—Continued II ASSETS HELD BY THE DEPARTMENT OF THE TREASURY-Continued
Cumulative through
Sept. 30, 1976 Fiscal 1977
Cumulative through
Sept. 30, 1977
Investments in public debt securities—Con. Government account series, national service
life insurance fund series, maturing June 30—Continued
Treasury bonds—Continued 7% of 1985 l'A% of 1985 772% of 1985 6'/*% of 1986 7% of 1986 l'A% of 1986 7'/2% of 1986 :. 6'/,% of 1987 7% of 1987.. 7%% of 1987 7'/2% of 1987 6'/.% of 1988 7% of 1988 VA% of 1988 .' 7'/2% of 1988 6'/,% of 1989 7% of 1989 7'/4% of 1989. 7'/2% of 1989 6'/,% of 1990 7% of 1990 7'/4% of 1990 6'/.% of 1991... 7'/,% of 1991 6'/4% of 1992
Total Government account series
Investments in agency securities: Government National Mortgage Association
participation certificates: Federal assets liquidation trust:
5.20% of 1977 Federal assets finance trust:
6'/8% of 1978 6.45% of 1988 6.20% of 1988
Total agency securities
Total investments, par value Undisbursed balance —
Total assets
85,057 75,793 71,455
86,487 85,057 75,793 71,455
86,488 85,056 75,793 71,455
86,489 85,056 75,792 71,455
86,489 85,056 75,792 . . - . . 71,455
86,489 156,511 75,792 -
86,489 232,303
318,792
6,956.192 294,097
75,000
310,000
7,266,192 16.638
7,282,830
-75,000
100,000 35,000
100,000
-75,000
219,097 —3,878
215,220
85,057 75,793 71,455 86,487 85,057 75,793 71,455 86,488 85,056 75,793 71,455 86,489 85,056 75,792 71,455 86,489 85,056 75,792 71,455 86,489
156,511 75,792 86,489
232,303 318,792
7,250,289
100,000 35,000
•100,000
235,000
7,485,289 12,760
7,498,050
NOTE.—Policy loans outstanding, on basis of information furnished by the Veterans Administration, amounted to $1,005,543,000 as of Sept. 30, 1977.
Digitized for FRASER http://fraser.stlouisfed.org/ Federal Reserve Bank of St. Louis

STATISTICAL APPENDIX 333 TABLE 14.—Pershing Hall Memorial fund, Sept. 30, 1977
[In thousands of dollars. This special fund was established in accordance with the provisions of the act of June 28, 1935, as amended (36 U.S.C. 491). For further
details, see Annual Report of the Secretary for 1941, p. 155]
RECEIPTS AND EXPENDITURES (EXCLUDING INVESTMENT TRANSACTIONS)
Receipts: Appropriations Profits on investments Net increase in book value of bonds Interest earned
Total receipts
Expenditures: Claims and expenses National Treasurer, American Legion
Total expenditures
Balance
Cumulative through
Sept. 30, 1976
482 6
12 244
744
289 237
525
219
Fiscal 1977
" l
7
7
7
Cumulative through
Sept. 30, 1977
482 6
12 251
751
289 244
532
219
II. ASSETS HELD BY THE DEPARTMENT OF THE TREASURY
Assets Sept. 30, 1976 Fiscal 1977 increase, or
decrease (—) Sept. 30, 1977
Investments in public debt securities: Marketable issues: Treasury bonds, 3'/2% of 1990
Undisbursed balance
Total assets
211 211
219 219
Digitized for FRASER http://fraser.stlouisfed.org/ Federal Reserve Bank of St. Louis

334 1977 REPORT OF THE SECRETARY OF THE TREASURY
TABLE 15.—Railroad retirement account, Sept. 30, 1977 [In thousands of dollars. This trust account was established in accordance
with the provisions of the act of June 24, 1937 (45 U.S.C. 228o(a)). For further details, see Annual Report of the Secretary for 1941, p. 148]
I. RECEIPTS AND EXPENDITURES (EXCLUDING INVESTMENT TRANSACTIONS IN FEDERAL AND NON-FEDERAL SECURITIES)
Cumulative through
Sept. 30, 1976 Fiscal 1977
Cumulative through
Sept. 30, 1977
Receipts: Tax collections:
Appropriated ' Unappropriated
Less refunds of taxes " Fines and penalties Interest and profits on investments Payments from Federal old-age and survi
vors and Federal disability insurance ' Payments to Federal hospital insurance trust fund
Railroad unemployment insurance account: Interest on advances Repayment of advances
Total receipts
Expenditures: Benefit payments, etc Administrative expenses * Payments to railroad unemployment insurance account t
Federal old-age and survivors and Federal disability insurance trust funds:
Payments Interest payments
Advances to railroad unemployment insurance account
Interest on refunds of taxes
Total expenditures
Transfers: From railroad retirement supplemental account From railroad retirement holding account To unemployment trust fund
Net transfers
Balance
See footnotes at end of table.
25.719.998
4.171 2 .
4.241.596
10.681,445
—852,834 .
94,269 894,075 .
40.774.380
'36.020.652 333.673
2.031.283
224
'228.605
1.207.523
757
3.467,943
3.651.948 31.200
27.751.281
4.395 2
4.470,201
11.888.968
—852.834
95.026 894.075
44.242.323
39.672.600 364,873
37,547 37,547
26,831 .. 35,393 ..
894,075 .-178
'37,348,353
4,869 ' 4,473 .. 5,600
3.742
'3.429.768
8 .
3,683.152
9.140
45.400
—36.260
—251.469
26.831 35,393
894,075 186
41.031.505
14.009 ' 4.473 51.000
—32.518
3.178.299
Digitized for FRASER http://fraser.stlouisfed.org/ Federal Reserve Bank of St. Louis
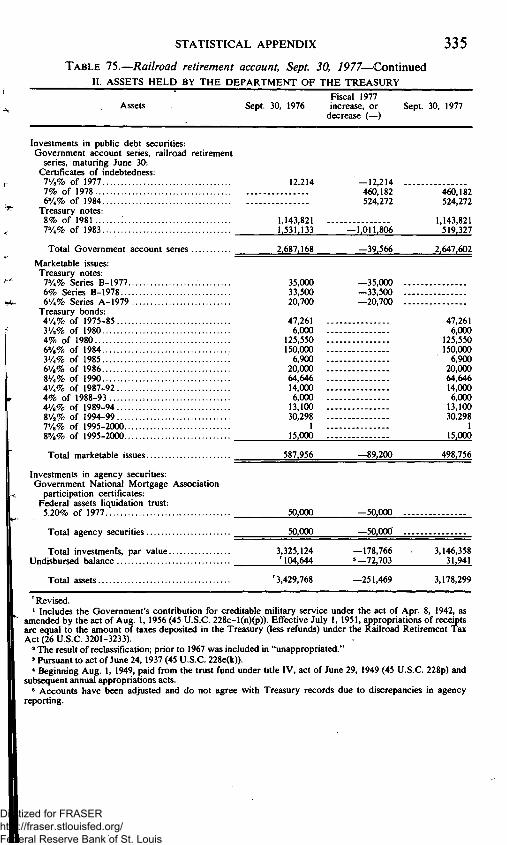
STATISTICAL APPENDIX 335 TABLE 75.—Railroad retirement account, Sept. 30, 7977—Continued
II. ASSETS HELD BY THE DEPARTMENT OF THE TREASURY
Assets Sept. 30, 1976 Fiscal 1977 increase, or
decrease (—) Sept. 30, 1977
Investments in public debt securities: Goverament account series, railroad retirement
series, maturing June 30: Certificates of indebtedness:
7'/8% of 1977 7% of 1978 6'/4% of 1984
Treasury notes: 8% of 1981 . . . . . . . . 7'/4% of 1983 _
Total Government account series _
Marketable issues: Treasury notes:
7'/4% Series B-1977 6% Series B-1978 6'/4% Series A-1979
Treasury bonds: 4'/,% of 1975-85 3'/2% of 1980 4% of 1980 6'/8% of 1984 3'/4% of 1985 6'/8% of 1986 8'/4% of 1990 4'/4% of 1987-92 4% of 1988-93 4'/8% of 1989-94 8'/2% of 1994-99 VA% of 1995-2000 8'/8% of 1995-2000 _
Total marketable issues _
Investments in agency securities: Government National Mortgage Association
participation certificates: Federal assets liquidation trust:
5.20% of 1977
Total agency securities
Total investments, par value Undisbursed balance
Total assets
12,214
1,143,821 L531J33
2,687,168
587,956
'3,429,768
—12,214 460,182 524,272
LOl 1,806
-39^566
47,261 6,000
125,550 150,000 6,900
20,000 64,646 14,000 6,000 13,100 30,298
1 15,000
-89.200
—251,469
460,182 524,272
1,143,821 519,327
2,647,602
35,000 —35,000 33,500 —33,500 20,700 —20,700
47,261 6,000
125.550 150,000
6,900 20,000 64,646 14,000 6,000
13,100 30,298
1 15,000
498.756
50.000
50.000
3.325.124 '104.644
—50.000 ...
-50.000 ...
— 178,766 »—72.703
3,146,358 31,941
3,178,299
'Revised. ' Includes the Goverament's contribution for creditable military service under the act of Apr. 8, 1942, as
amended by the act of Aug. 1, 1956 (45 U.S.C. 228c-l(n)(p)). Effective July 1, 1951, appropriations ofreceipts are equal to the amount of taxes deposited in the Treasury (less refunds) under the Railroad Retirement Tax Act (26 U.S.C. 3201-3233).
" The result of reclassification; prior to 1967 was included in "unappropriated." ' Pursuant to act of June 24, 1937 (45 U.S.C. 228e(k)). * Beginning Aug. 1, 1949, paid from the trust fund under title IV, act of June 29, 1949 (45 U.S.C. 228p) and
subsequent annual appropriations acts. ' Accounts have been adjusted and do not agree with Treasury records due to discrepancies in agency
reporting.
Digitized for FRASER http://fraser.stlouisfed.org/ Federal Reserve Bank of St. Louis

336 1977 REPORT OF THE SECRETARY OF THE TREASURY
TABLE 76.—Railroad retirement supplemental account, Sept. 30, 1977 [In thousands of dollars. The trust fund was established in accordance with
the provisions of the act of Oct. 30. 1966 (45 UfS.C. 228o(b))]
I. RECEIPTS AND EXPENDITURES (EXCLUDING INVESTMENT TRANSACTIONS)
Cumulative through
Sept. 30, 1976 Fiscal 1977
Cumulative through
Sept. 30. 1977
Receipts: Tax collections:
Appropriated Interest and profits on investments .
Total receipts
Expenditures: Benefit payments.
Total expenditures .
Transfers: To railroad retirement account From railroad retirement holding account .
Net transfers.
Balance
679,663 15.685
695,348
655.898
655,898
4,869 ' 313
A555
127.435 1.665
129.100
116.470
116.470
9.140 ' - 2 5
9.165
807,098 17.350
82A448
772.368
772.368
14,009 ' 288
13,721
34,894 3,465 38,358
II. ASSETS HELD BY THE DEPARTMENT OF THE TREASURY
Sept. 30, 1976 Fiscal 1977 increase, or
decrease (—) Sept. 30, 1977
Investments in public debt securities: Goverament account series, railroad retirement
series, maturing June 30: Treasury certificates of indebtedness:
7'/8% of 1977 7'/8% of 1977 7'/4% of 1977 6V8% of 1978 7% of 1978
Total investments, par value. Undisbursed balance
Total assets.
9,980 5,309
12,708
27,997 ' 6^896
34,894
—9,980 —5,309 -12,708
4,834 30.916
7,753 -4,288
3,465
4.834 30,916
35,750 ^ ' 2,608
38,358
' Accounts have been adjusted and do not agree with Treasury records due to discrepancies in agency reporting.
Digitized for FRASER http://fraser.stlouisfed.org/ Federal Reserve Bank of St. Louis

STATISTICAL APPENDIX 3 3 7
TABLE 11 .—Unemployment trust fund, Sept. 30, 1977 [In thousands of dollars. TTiis trust fund was established in accordance with the
provisions of Sec. 904(a) of the Social Security Act of Aug. 14, 1935 (42 U.S.C. 1104). For further details see Annual Report of the Secretary for 1941, p. 145]
I. RECEIPTS AND EXPENDITURES (EXCLUDING INVESTMENT TRANSACTIONS IN FEDERAL AND NON-FEDERAL SECURITIES)
Cumulative Cumulative through Fiscal 1977 through
Sept. 30, 1976 Sept. 30, 1977
STATE UNEMPLOYMENT ACCOUNTS
Receipts: Appropriations from general fund' 138,025 138,025 Deposits by States" , 86,112,155 9,279,905 95,392,060 Interest eamed: Collected Accrued
Total receipts
Expenditures: Withdrawals by States Advances to States
Total expenditures
Transfers: From employment security administration account (1958 Act) 21,660 21.660
To the railroad unemployment insurance account. 107,227 107,227 From Federal unemployment account 3,382,048 1,488,247 4,870,295 From Federal extended compensation account (reimbursement) 46,283 46,283
To Federal unemployment account 220,021 109,384 329,405 From Federal extended unemployment account.... 8,635.701 2,563,655 11.199,356
Net transfers 11.758,444 3.942,518 15.700,962
9,147,569 52,112
95,449,861
102,602,512
102,602,512
218,678 16,249
9,514,832
12,368,807
12.368,807
9,366,247 68,361
104,964.693
114.971,319
114,971,319
Balance 4,605,793 1,088.543 5.694.336
RAILROAD UNEMPLOYMENT INSURANCE ACCOUNTS
BENEFIT PAYMENTS ACCOUNT
Receipts: Deposits by Railroad Retirement Board Advances from the railroad retirement account.... From the railroad unemployment insurance administration fund
Advance by the Secretary of the Treasury Interest earned: Collected Accrued
Total receipts
Expenditures: Benefit payments To the railroad unemployment insurance administration fund
Repayment of advances to railroad retirement account •
Repayment of advance to the Secretary of the Treasury
Repayment of advances from general fund for temporary unemployment compensation benefits
Payment of interest on advances from railroad retirement account
Total expenditures
See footnotes at end of part I.
3,545,200 924,525
106,187 .... 15000 -. .
232,589 115
4,823,616
3,885,157
12 338
918,925
15,000 ----
19,399 ..--
92.875
4,943,694
169,203 56,700
912 68
226,883
174,691
16,300
3,496
194,487
3,714,403 981,225
106,187 15,000
233,501 183
5,050,499
4,059,848
12,338
935,225
15,000
19,399
96,371
5,138,181
Digitized for FRASER http://fraser.stlouisfed.org/ Federal Reserve Bank of St. Louis
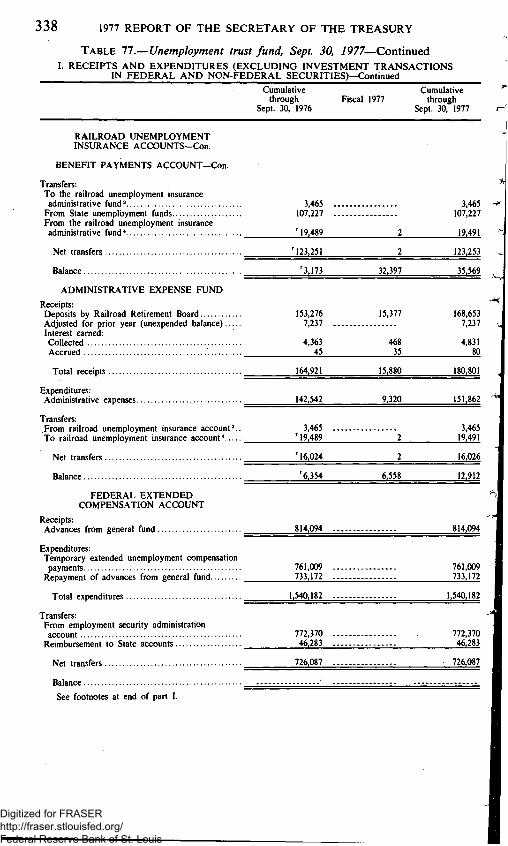
338 1977 REPORT OF THE SECRETARY OF THE TREASURY
TABLE 11 .—Unemployment trust fund, Sept. 30, 1977—Continued I. RECEIPTS AND EXPENDITURES (EXCLUDING INVESTMENT TRANSACTIONS
IN FEDERAL AND NON-FEDERAL SECURITIES)—Continued
Cumulative through
Sept. 30. 1976 Fiscal 1977
Cumulative through
Sept. 30. 1977
RAILROAD UNEMPLOYMENT INSURANCE ACCOUNTS-Con.
BENEFIT PAYMENTS ACCOUNT-Con.
Transfers: To the railroad unemployment insurance administrative fund'
From State unemployment funds From the railroad unemployment insurance administrative fund *
Net transfers
Balance
ADMINISTRATIVE EXPENSE FUND
Receipts: Deposits by Railroad Retirement Board Adjusted for prior year (unexpended balance).... Interest earned: Collected Accrued
Total receipts
Expenditures: Administrative expenses
Transfers: From railroad unemployment insurance account'. To railroad unemployment insurance account*....
Net transfers
Balance
FEDERAL EXTENDED COMPENSATION ACCOUNT
Receipts: Advances from general fund
Expenditures: Temporary extended unemployment compensation payments
Repayment of advances from general fund........
Total expenditures
Transfers: From employment security administration account
Reimbursement to State accounts
Net transfers
Balance
See footnotes at end of part I.
3,465 .... 107,227
' 19.489
'123.251
'3.173
153.276 7,237
4,363 45
164.921
142,542
3,465 ' 19.489
'16.024
'6.354
2
2
32.397
15.377
468 35
15.880
9.320
2
2
6.558
3.465 107.227
19.491
123.253
35.569
168.653 7.237
4.831 80
180.801
151.862
3.465 19.491
16.026
12.912
814,094
761.009 733,172
1.540.182
772370 46.283
726.087
814.094
761.009 733.172
1.540.182
772.370 46.283
726.087
Digitized for FRASER http://fraser.stlouisfed.org/ Federal Reserve Bank of St. Louis

STATISTICAL APPENDIX 339 TABLE 11 .—Unemployment trust fund, Sept. 30, 7977—Continued
I. RECEIPTS AND EXPENDITURES (EXCLUDING INVESTMENT TRANSACTIONS IN FEDERAL AND NON-FEDERAL SECURITIES)—Continued
Cumulative through
Sept. 30, 1976 Fiscal 1977
Cumulative through
Sept. 30, 1977
EMPLOYMENT SECURITY ADMINISTRATION ACCOUNT
Receipts: Transfers (Federal unemployment taxes): Appropriated' Less refund of taxes
Advance from general (revolving) fund Less retura of advances to general fund
Interest earned: Collected Accrued
Total receipts
Expenditures: Administrative expenses to Department of Labor.. Salaries and expenses, Bureau of Employment Security
Grants to States for unemployment compensation and employment service administration
Payments to general fund: Temporary unemployment compensation—1958... Reimbursement for administrative expenses Interest on advances from general (revolving) fund
Interest on refund of taxes
Total expenditures
Transfers: To State accounts To Federal unemployment account: Excess Reduced tax credits: Alaska Connecticut Michigan Vermont Washington
To Federal extended compensation account To extended unemployment compensation account
Net transfers
Balance
EXTENDED UNEMPLOYMENT COMPENSATION ACCOUNT
Receipts: Interest earned: Collected Accrued
Total receipts
Expenditures: Repayment of advances to the general fund for extended benefits, Public Law 91-373
Transfers: From general fund From employment security administration account To State account
Net transfers
Balance
See footnotes at end of part I.
14.540.013 189,019
2,760,728 ... 2,760,728 ...
120,819 2.044
14.473.857
8.973
318.172
10.662.553
182,433 ... 228,049
34,231 ... 6,623
11,441,034
21,660 ...
150,422 ...
1,362 ... 12,883 15.381 ...
772.370 ... 1.605,626
2,579,704
453,118
1,910,447 35,729
21,360 1,587
1,897.665
1.312
32.235
1,514,841
22.279
919
1,571,586
18
1,437 12,268
532,518
546,241
-220.160
16.450.460 224.748
2,760.728 2.760,728
142,179 3.631
16.371.522
10,285
350,407
12,177,394
182,433 250,328
34,231 7.542
13.012.620
21,660
150.422
1,362 12.901 15.381 1,437
12,268 772.370
2.138.144
3.125,945
232,956
1,720 3 ...
1,723
50.000 ...
7,138,463 1,605,626 8,620.326
123.763
75.486
2
2
2,192.095 532.518
2.556.196
168.417
168.419
1.722 3
1.725
50.000
9.330.558 2,138.144 11.176.522
292.180
243.904
Digitized for FRASER http://fraser.stlouisfed.org/ Federal Reserve Bank of St. Louis

340 1977 REPORT OF THE SECRETARY OF THE TREASURY
TABLE 77.—Unemployment trust fund, Sept. 30, 1977—Continued RECEIPTS AND EXPENDITURES (EXCLUDING INVESTMENT TRANSACTIONS
IN FEDERAL AND NON-FEDERAL SECURITIES)—Continued
Cumulative through
Sept. 30, 1976 Fiscal 1977
Cumulative through
Sept. 30, 1977
FEDERAL UNEMPLOYMENT ACCOUNT Receipts: Appropriations from general fund' 207,351 207,351 Interest earned: Collected 315,097 273 315,370 Accrued 1 629 21 1 ^
Total receipts 524,077 294 524,371
Expenditures: To Bureau of Employment Security, Department of Labor 6,071 6,071
Transfers: Advances from general fund 2,861,000 1,250,000 4,111,000 To State unemployment accounts 3,382,049 1,488,247 4,870,296 From State unemployment accounts 230,021 109,384 339,405 From employment security administration account—reduced tax credits 29,627 13,723 43,350
From employment security administration account—excess" 205,982 205,982
To employment security account 55,561 55,561
Net transfers 110,979 115,140 226,120
Balance 407,026 -114,846 292,180
SUMMARY OF BALANCES State unemployment accounts 4,605,793 1,088,543 5,694,336 Railroad unemployment insurance accounts: Benefit payments account '3,173 32,397 35,569 Administrative expense fund '6,354 6,558 12,912 Federal extended compensation account --Employment security administration account 453,118 —220,160 232,956 Extended unemployment compensation account.... 74,486 168,419 243,904 Federal unemployment account 407,026 —114.846 292,180
. Total assets 5,550,950 960,908 6,511,856
'Revised. 'Amounts appropriated to the unemployment trustfund prior to enactment ofthe Employment Security Act
of 1960 representing the excess of collections from Federal unemployment tax over employment security expenses (42 U.S.C. 1101(b)).
"Includes $29,298,172 for fiscal 1977 for return of excess Reed Act funds, and reimbursements. 'Amount transferred pursuant to Public Law 88-133, approved Oct. 5, 1963 (77 Stat. 219). * Represents the excess in the administrative expense funds transferred pursuant to sec. 11(d) ofthe Railroad
Unemployment Insurance Act (45 U.S.C. 361 (d)). 'Includes $36,274,281 not repayable to general fund pursuant to sec. 905(a) of the Social Security Act as
amended. ^Represents excess in the employment security administration account transferred pursuant to 42 U.S.C.
1102.
Digitized for FRASER http://fraser.stlouisfed.org/ Federal Reserve Bank of St. Louis
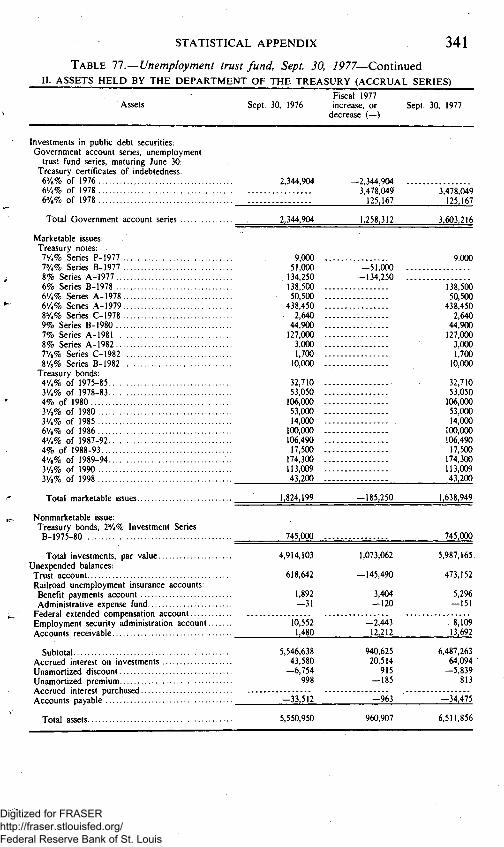
STATISTICAL APPENDIX 341 TABLE 11 .—Unemployment trust fund, Sept. 30, 7977—Continued
II. ASSETS HELD BY THE DEPARTMENT OF THE TREASURY (ACCRUAL SERIES)
Assets Sept. 30, 1976 Fiscal 1977 increase, or
decrease (—) Sept. 30, 1977
Investments in public debt securities: Government account series, unemployment
trust fund series, maturing June 30: Treasury certificates of indebtedness:
6y8% of 1976 d'A% of 1978 6'/8% of 1978
Total Government account series
Marketable issues: Treasury notes:
7'/4% Series P-1977 7'/4% Series B-1977 8% Series A-1977 6% Series B-1978 6'/4% Series A-1978 6'/4% Series A-1979 8'/4% Series C-1978 9% Series B-1980 7% Series A-1981 8% Series A-1982 VA% Series C-1982 8'/8% Series B-1982
Treasury bonds: 4'/4% of 1975-85 3'/4% of 1978-83 4% of 1980 3'/2% of 1980 3'/4% of 1985 6'/8% of 1986 4'/4% of 1987-92 4% of 1988-93 4'/8% of 1989-94 3'/,% of 1990 3'/^% of 1998
Total marketable issues
Nonmarketable issue: Treasury bonds, 2'/4% Investment Series
B-1975-80
Total investments, par value Unexpended balances: Trust account Railroad unemployment insurance accounts: Benefit payments account Administrative expense fund
Federal extended compensation account Employment security administration account Accounts receivable
Subtotal Accrued interest on investments Unamortized discount Unamortized premium Accrued interest purchased Accounts payable
Total assets
2,344,904
2,344,904
1,824,199
-2,344,904 3,478,049 125,167
1,258,312
9,000 51,000 -51,000 134,250 -134,250 138,500 50,500
438,450 2,640
44,900 --..-127,000 3,(X)0 1,700
10,000 --
32,710 53,050 106,000 53,000 14,000 .
100,000 106,490 17,500
174,300 -. 113,009 43,200
-185,250
3,478,049 125,167
3,603,216
9,000
138,500 50,500
438,450 2,640
44,900 127,000 3,000 1,700 10,000
32,710 53,050 106,000 53,000 14,000
100,000 106,490 17,500
174,300 113,009 43,200
1,638,949
4,914,103
618,642
1.892 - 3 1
10.552 1,480
5,546,638 43,580 —6,754
998
-33,512
1,073,062
-145,490
3,404 - 1 2 0
—2,443 12,212
940,625 20,514
915 -185
-963
5,987,165
473,152
5,296 -151
. 8,109 13,692
6,487,263 64,094
-5,839 813
-34,475
5,550,950 960,907 6,511,856
Digitized for FRASER http://fraser.stlouisfed.org/ Federal Reserve Bank of St. Louis

342 1977 REPORT OF THE SECRETARY OF THE TREASURY
TABLE 11 .—Unemployment trust fund, Sept. 30, 1977—Continued III. BALANCE OF UNEMPLOYMENT TRUST FUND BY STATES AND OTHER ACCOUNTS,
SEPT. 30, 1976, OPERATIONS IN FISCAL 1977, AND BALANCE SEPT. 30, 1977
States and other accounts Balance Sept. 30,
1976 Deposits
Operations in fiscal 1977
Eamings Transfers
Balance — Sept. 30,
Withdrawals 1977
Alabama Alaska Arizona Arkansas Califomia Colorado Connecticut Delaware District of Columbia. Florida Georgia Hawaii Idaho Illinois Indiana Iowa Kansas Kentucky Louisiana Maine Maryland Massachusetts Michigan Minnesota Mississippi Missouri Montana Nebraska Nevada New Hampshire New Jersey New Mexico New York North Carolina North Dakota Ohio Oklahoma Oregon. Pennsylvania Puerto Rico Rhode Island South Carolina South Dakota Tennessee Texas Utah Vermont Virginia Washington West Virginia Wisconsin Wyoming
Subtotal
18,940 94,529 34,961 11,244
614,227 37,357 13,468 '2.781 2.453
39.289 '227,754
11,052 50,625 17,922
214,567 49,559 145,376 130,510 166,970 8.415
23.438 116,896 213,713 33.881 97,455 97,153 3,070
35,433 '10,712 '32,629 70,529 33,159
333,558 285,576 20.981
237,632 18,118 50,552 '29,205
97 14,219 81,747 '16,104
'182,597 '214,774 26,487
610 99,736 62,479 76,115
'161,153 33,989
118,915 68,907 78,270 59,993
1,557,393 85,972
202,827 22,345 41,828
261,419 138,368 65,183 29,832
481,250 142,662 101,693 63,731 108,330 112,086 45,701 159,127 331,247 607,399 174,447 56,070 178,494 27,410 40,862 50,458 23,793
513,746 26,396
814,712 140,185 17,344
415,922 78,413 162,579 483,765 86,841 58,568 81,200 7,001
100,363 165.952 39,692 18,202 88,877
211,347 46,310 243,233 13,950
91 5,224 2,646
43 45,436 2,388
9 20 29
2,937 13,749
32 3,196 243
13,282 3,092 8,753 7,641 9,126
15 259 109 248 46
6,245 5,924
58 2,468 355
2,085 59
2,027 11,119 15,869 1,067
11,864 1,237 2,716 345 17 15
4,964 870
10,208 13,207 1,493
2 5,402
9 4,093 10,342 2,252
51,220 5,971 8,983 19,680
351,442 3,940
164,625 33,585 29,975 18,400 13,504 15,918 2,388
544,550 6,895 8,630 4,450 16,108 8,264
20,939 44,222 115,338 315,895 95,417 4,550 23,224 11,859 1,629
11,112 710
371,909 1,447
628,693 26.350 1.783
32.050 5.912 7.610
672,301 70,150 32,512 6,548 675
22,863 13,355 3,533 19,996 6,985
59.198 5.720
28.555 247
145.430 96.766 64.200 67.360
1,540,571 74.650
351.450 51.253 72.948
220.475 152.400 68,880 28,410
931,000 120,233 107,100 68,700 118.000 165.500 69.164 157,167 449.562 799.300 220.950 44,715 182,884 34,570 28,900 50,591 20,829
864,375 26,600
1.552.600 199,950 24,100
453,883 64,363 146,610
1,134,350 154,900 99,208 85,020 11,910
147,575 163,354 42,940 31,036 108,150 255,500 65,498
224,821 8.106
43,736 77,865 60,660 23,600
1,027,927 55,007 29,478 . . 7,479 1,337
101,570 > 240,974 23,305 57,630 • 112,965 257.173 i. 55.874 153.610 ^ 144.589 ^ 130,946 5,907
69,879 114,028 337,955 82,841 119,605 121,911 7,827 51,492 ^ 22,046 38,387 91,868 36,429
235,482 -1 268,030 17,075
243,585 39,318 76,846 * 51,265 2,204 - .< 6,106
89,439 12.739 ^
168,456 243,934 28,264 7,775
92,851 77,532 66.740 .u^
218,462 42,331
4.605,793 9,250.607 234.927 3.971,813 12,368.804 5.694,336 Railroad unemployment insurance accounts: Benefit and refund payments Administrative expenses
Federal unemployment account Employment security administration account Extended unemployrnent compensation account
Railroad unen»ployment insurance accounts: Benefit and refund Administrative expenses
Employment security administration account.
1,280 6,385
407,027 442,566 75,486
169,203 15,377
1 910,447
980 40,402 503 -2 294 -115,141
22,990 -546,283 2 168,417
181,591 9,200
1,604,873
30.273 13.063
292,180 224,846 243,904
5.538.537 11.345.634
1.892 -31
10.552
259,694 3,519,206 14,164,469
-3.404 120
2.443
6.498.602
5.296 -151 8,109
Total as shown in parts I and II 5,550,950 11,345,634 259,694 3,519,206 14,163,628 6,511,856
' Revised. Digitized for FRASER http://fraser.stlouisfed.org/ Federal Reserve Bank of St. Louis

STATISTICAL APPENDIX 3 4 3
TABLE IS.—US. Government life insurance fund, Sept. 30, 1977 [In thousands of dollars. This trust fund operates in accordance with
the provisions of the act of June 7, 1924, as amended (38 U.S.C. 755). For further details, see Annual Report of the Secretary for 1941, p. 142]
I. RECEIPTS AND EXPENDITURES (EXCLUDING INVESTMENT TRANSACTIONS)
Receipts: Premiums and other receipts Interest and profits on investments Payments from general fund'
Total receipts
Expenditures; Benefit payments, dividends, and refunds . . . .
Balance
Cumulative through
Sept. 30, 1976
2,197,141 1,583.168
273
3.780.583
3.219.184
561,399
Fiscal 1977
5,608 31,761
33
37.402
71.105
—33.703
Cumulative through
Sept. 30. 1977
2,202.749 1.614,929
306
3,817,984
3,290.289
527.696
See footnotes at end of. table.
Digitized for FRASER http://fraser.stlouisfed.org/ Federal Reserve Bank of St. Louis

344 1977 REPORT OF THE SECRETARY OF THE TREASURY
TABLE 78.-^.5. Government life insurance fund, Sept. 30, 7977—Continued II. ASSETS HELD BY THE DEPARTMENT OF THE TREASURY
Assets Sept. 30. 1976 Fiscal 1977 increase, or
decrease (—) Sept. 30, 1977
Investments in public debt securities: Government account series, U.S. Government
life insurance fund series, maturing June 30:
Treasury notes: 7'/4% of 1977 5'A% of 1978 5'/,% of 1979 6'/4% of 1980
Treasury bonds: 3'/2% of 1977 3V8% of 1977 3'/9% of 1978 4'/4% of 1978 4'/4% of 1979 d'A% of 1981 6'/4% of 1981 7% of 1981 7'/4% of 1981 6'/,% of 1982 6'/4% of 1982 7% of 1982 7'/4% of 1982 d'A% of 1983 6'/4% of 1983 7% of 1983 7'/4% of 1983 d'A% of 1984 6'/,% of 1984 7% of 1984 7'/4% of 1984 d'A% of 1985 6'/4% of 1985 7% of 1985 7'/4% of 1985 6'/2% of 1986 6'/4% of 1986 7% of 1986 7»/4% of 1986 6'/2% of 1987 6'/.% of 1987 7% of 1987 7'/4% of 1987 6'/2% of 1988 6'/.% of 1988 7% of 1988 7'/4% of 1988 d'A% of 1989 6'/4% of 1989 7% of 1989 l'A% of 1989 d'A% of 1990 6'/4% of 1990 7% of 1990 d'A% of 1991 7% of 1991 d'A% of 1992
Total Government account series
Total investments, par value Undisbursed balance
Total assets
29,964 111,949 32,152 46,875
12,590 5,376
17,966
560X)79
560,079 1320
561,399
—29,964
41,015 —41,015 23,807 —23,807 48,214 —10.941 25,556 2.912
4,463 8,711 5,377 3,879
4.463 8,711 5,377 3.879
4,463 8,711 5,377 3,879
4,463 8,711 5,377 3,879
4,463 8,711 5;377 3.879
4.463 8.711 5.377 3,879
4,463 8,711 5,377 3,879
4,462 8.711 5,377 3,879
4,462 8.712 5,377 3,878
4,463
4,463
22^29
-34,207
-34,207 504
-33,703
111,949 32,152 46,875
37,273 ' 25,556 2,912 ^ 4,463 8,711 . .. 5,377 • 3,879 4,463 N 8,711 5,377 3,879 4,463 8,711 . 5,377 3,879 4,463 " 8,711 5,377 3.879 4,463 8,711 -5,377 3,879 4,463 8,711 5,377 *"-" 3,879 4,463'^< 8,711 5,377 . 3,879 ' 4,462 8,711 5,377 3,879 I 4,462 8,712 5,311--^ 3,878 4,463
12,590 5,376 4,463
17,966 22,429
525^72
525,872 L824
527,696
'Included under premiums and other receipts prior to fiscal 1962. Negative amounts from adjustments of prior years' receipts.
NOTE.—Policy loans outstanding on basis of information furaished by the Veterans Administration amounted to $51,598,000 as of Sept. 30. 1977.
Digitized for FRASER http://fraser.stlouisfed.org/ Federal Reserve Bank of St. Louis

STATISTICAL APPENDIX 345
Customs Operations
TABLE 79.—Seizures of narcotics and dangerous drugs by the U.S. Customs Service, fiscal years 1976-77 '
Type of seizure 1976* T.Q. 1977
Heroin: Number of seizures 437 104 243 Quantity (in lbs.) 367.7 45.3 277.7 Va lue . . . . . . . $126,089,478 $15,534,004 $124,815,042
-Cocaine: Number of seizures 1,167 330 1,017 Quantity (in lbs.) 1,029.6 236.1 951.0 Value $219,561,291 $50,333,451 $246,099,780
Hashish: Number of seizures. 5,162 1,343 6,257 Quantity (in lbs.) 13,436.7 469.6 15,921.8 Value $67,895,645 $2,372,889 $75,393,226
Marijuana: Number of seizures 13,555 4,620 14,651 Quantity (in lbs.) 759,359.9 115,334.4 1,546,894.3 Value. . . $233,882,849 $35,522,995 $477,557,208
Opium: Number of seizures.... 72 18 49 Quantity (in lbs.) 37.6 4.4 20.0 Value n.a. n.a. n.a.
Morphine: Number of seizures 15 1 14 Quantity (in lbs.) 3.9 1.3 Value n.a. n.a. n.a.
Other drugs, barbiturates and LSD: Number of seizures 2,581 836 2,057 Quantity (in units) 21,418,652 2,114,245 7,811,758 Value $17,777,481 $1,754.823 $6.796.229
Total number of seizures 22.989 7,252 24,288 Total value of seizures $665,206,744 $105,518,162 $930,661,485
• Values computed with retail values as of the fourth quarter of fiscal 1976. Heroin value computed for 60 percent purity,
n.a. Not available.
TABLE 80.—Seizures of merchandise by the U.S. Customs Service, fiscal years 1976-77
Type of seizure 1976 T.Q. 1977
Prohibited nonnarcotic articles: Number of seizures
Vehicles: Number of seizures Domestic value
Aircraft: Number of seizures Domestic value
Vessels: Number of seizures Domestic value
Monetary instruments: Number of seizures Domestic value
General merchandise: Number of seizures Domestic value
Total seizures Total domestic value
27,875 8,000 26,404
10,897 $33,572,848
130 $18,798,777
191 $46,399,780
374 $7,781,633
27,667 • $49,674,583
67.134 $156,227,621
4.010 $9,310,925
42 $1,834,430
63 $1,945,460
168 $2,694,555
7.063 $16,002,464
19,346 $31,787,834
10,980 $29,803,169
121 $5,553,150
287 $90,463,390
533 $7,411,058
28,072 $79,252,118
66,397 $212,482,885
Digitized for FRASER http://fraser.stlouisfed.org/ Federal Reserve Bank of St. Louis

346 1977 REPORT OF THE SECRETARY OF THE TREASURY
TABLE 81.—Imported merchandise entries, fiscal years 1976-77^ Entries 1976 T.Q. 1977
Formal entries: Consumption free Consumption dutiable Vessel repair Appraisement Drawback Warehouse and rewarehouse
Total formal entries'
Other entries: Warehouse withdrawals Outbound—immediate transportation and exportation
Mail Informal Passenger declarations Crew declarations Military declarations
Total other entries
Total entries of merchandise
858.315 2.299.589
1,096 485 .
23,994 80.617
3.264.096
247,593
1,355,685 2,432,792 379.919
10,882,123 1,471,742 700,409
17.470.263
20.734,359
250.434 571,038
257 88
4,061 21.197
847.075
61.707
340.630 608,443 97.331
3.333.815 423,145 165.414
5,030,485
5.877,560
1,091.336 2.487,175
1.043 447
21,833 88,635
3,690,469
255,905
1.483,048 2.365.339 393,257
11,857,812 1.796,211 702,859
18,854,431
22,544,900
' Excludes Puerto Rico and the Virgin Islands. * Formal entries, by customs region:
I (Boston) II (New York) III (Baltimore) IV (Miami) V (New Orleans) .. VI (Houston)... VII (Los Angeles)... VIII (San Francisco).. IX (Chicago)
1976
554.395 810,529 188,341 168.436 55.664 191.743 387,957 319,791' 587.240
T.Q.
144,139 200,990 50,331 47,621 15.678 47,616 94,938 88,029 157,733
1977
639,295 877,279 204,966 196,999 66,715
227,835 440,739 368,180 668,461
Digitized for FRASER http://fraser.stlouisfed.org/ Federal Reserve Bank of St. Louis

STATISTICAL APPENDIX 347 TABLE 82.—Carriers and persons entering the United States by mode of
travel, fiscal years 1976-77^ Type of entrant 1976 T.Q. 1977
Carriers entering: Vessels entering direct from foreign ports Vessels entering via. U.S. ports ' Ferries Commercial planes entering direct from foreign ports .'.
Commercial planes entering via U.S. ports ' Military planes Private planes Freight carrier ground vehicles Other ground vehicles.
Total carriers
Persons entering: By vessels By ferries .' By commercial planes By precleared planes' By military planes By private planes By ground vehicles and on foot Crewmembers —
Total persons —
49,264 (30,907) 76,755
215.944 (14,022) 21,751 115,545
3,716,706 75,151,149 ,
79.347,114
959,861 1,576.187
12.808,257 3.925,836 567.109 286.921
246.923.184 2,937.938
269.985,293
14.210 (8,328) 22,944
61,655 (3,729) 5,297
35.613 822.678
21.741.676
22.704.073
286.528 879.395
4.351.300 1.138.588 143,403 85,896
71,298,179 862,715
79,046.004
"48.000 ''(29.0(K))
77,451
216.774 (13.878) 21.768 120,184
3,968,648 73.785,638
. "78,238.463
900.000 1,699.506
14,211,299 4,457,119 545,813 293,999
237,936,904 3,317,985
263,362,625
" Preliminary. ' Excludes Puerto Rico and the Virgin Islands. " Not included in totals; already counted under vessels and commercial planes entering direct from foreign
ports. 'Includes persons cleared prior to their departure for the United States (e.g., persons cleared at preclearance
activities in Montreal, Toronto, Vancouver, Winnipeg, Bermuda, and the Bahamas).
Digitized for FRASER http://fraser.stlouisfed.org/ Federal Reserve Bank of St. Louis

TABLE 83.—Total carriers and persons entering the United States, by Customs region, fiscal years 1976-77^ I. CARRIERS E N T E R I N G '
Customs region Vessels and ferries Aircraft Ground vehicles Total carriers
1976 T.Q. 1977" 1976 T.Q. 1977 1976 T.Q. 1977 1976' T.Q.' 1977"
OO
I II III IV V . VI VII VIII IX
(Boston) (New York) (Baltimore) (Miami) (New Orleans)... (Houston) (Los Angeles)... (San Francisco) . (Chicago)
I II III IV V VI VII VIII IX
13,428 7.297
11,573 12.876 9,070
22,565 4,654
16,413 59,050
7,460 1,827 2,857 3,260 2.447 3.867 1,168 5,400
17,196
11,200 7,100
11.200 12,500 9,000
20,400 4,200
16,500 62,351
35,374 59,586 17.010 83,994 2,762
33,482 32,141 55,430 47,481
10.951 16.941 4,318
23.656 868
7,857 . 6,883
18,812 16,008
34.964 14,934.861 59.219 -16.431 83.953 3.381
30,893 29.520.279 .32.164 20,047,066 59,545 4,763,892 52,054 9,601,757
6,010,434
7,394,403 4,892,094 1,674,762 2,592.661
15,208,693 14,983,663 6.028,845 15.254.857 66,883 18,768 66,319 28,583 7,175 27,631
.--- 96,870 26,916 96.453 11,832 3,315 12,381
28,119,578 29,576,326 7,406.127 28.170,871 19,565,482 20,083,861 4,900.145 19,601,846 5,234,364 4,835,735 1,698,974 5,310,409 9,626,169 9,708,288 2,625.865 9,740,574
Total 156,926 45,482 154,451 367,260 106,294 372,604 78,867,855 22,564.354 77,754,286 79,392,041 22,716,130 78,281,341
II. PERSONS ENTERING'
Customs region 1976'
By sea
T.Q 1977"
By air
1976' T.Q.' 1977 1976
By land
T.Q.' 1977
Total persons
1976' T.Q.' 1977"
(Boston) 616,592 (New York) 609,207 (Baltimore) 67,933 (Miami) 604,185 (New Orleans) 34,936 (Houston) 119,439 (Los Angeles) 203.200 (San Francisco) 666,015 (Chicago) 660,945
Total 3,582,452
269,708 170,668 11,442
146,058 3,143 13,846 44,560
434,238 390,506
370,000 600,250 80,000
575,260 31,093 100,500 230,000 700,000
1,035.950
3,375,832 5.848,425 799.404
2,657,715 135,956 810,958
1,488.834 3.050.017 1.312.516
922,348 2,125,044 237,765 816,410 40,140
208,440 458.402 970,926 484.181
3,729,450 41,906.661 6,704,227 782,450 --
2,839,633 146,446 830,365 91,783,443
1,708,551 77,934.478 3,330.475 13.572.109 1.631.071 21.726,493
17,421,516
22,374.657 19,357,439 4.796,985 7.347.582
44.244.231 45,899.085 18,613,572 48,343,681 6,457.632 2,295.712 7,304,477 867,337 249,207 862,450
3,261,900 962,468 3,414,893 170,892 43,283 177,539
81,769,574 92,713.840 22,596,943 82,700,439 75,763.268 79.626.512 19.860,401 77,701,819 14,493,472 17,288.141 6,202,149 18,523,947 21.666.359 23,699.954 8.222,269 24,333.380
1,484,169 3,723,053 19,479.657 6,263,656 21,702,668 246.923.184 71,298,179 237,936,904 269,985.293 79,046,004 263,362,625
po tn
o 73 H O
H X tn
tn o 73 tn H > 70 >< O
H X tn H 73 tn > c/5
a 73
' Revised. " Preliminary. ' Excludes Puerto Rico and the Virgin Islands.
'Includes carriers entering direct from foreign ports and via other U.S. ports. 'Includes crew.
4 t Digitized for FRASER http://fraser.stlouisfed.org/ Federal Reserve Bank of St. Louis
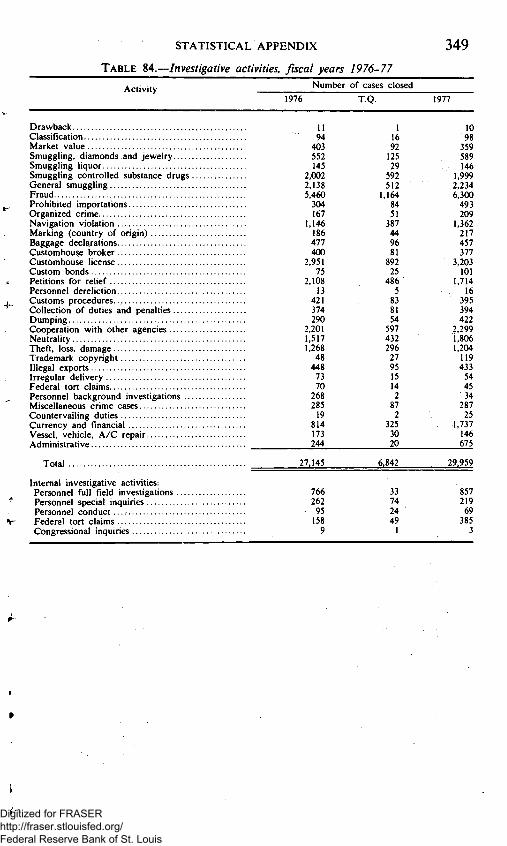
STATISTICAL APPENDIX
TABLE 84.—Investigative activities, fiscal years 1976-77
349
Activity Number of cases closed
1976
11 94 403 552 145
2,002 2,138 5,460 304 167
1,146 186 477 400
2,951 75
2.108 13
421 374 290
2,201 1,517 1,268 48 448 73 70 268 285 19 814 173 244
27,145
766 262 95 158 9
T.q.
1 16 92 125 29 592 512
1,164 84 51 387 44 96 81 892 25 486 5 83 81 54 597 432 296 27 95 15 14 2 87 2
325 30 20
6,842
33 74 24 49 1
1977
10 98 359 589 146
1,999 2,234 6,300 493 209
1,362 217 457 377
3,203 101
1,714 16 395 394 422
2.299 1.806 1.204 119 433 54 45 34 287 25
1.737 146 675
29.959
'857 219 69 385 3
Drawback Classification Market value Smuggling, diamonds and jewelry Smuggling liquor Smuggling controlled substance drugs General smuggling Fraud Prohibited importations Organized crime Navigation violation Marking (country of origin) Baggage declarations Customhouse broker Customhouse license Custom bonds Petitions for relief Personnel dereliction Customs procedures.; Collection of duties and penalties Dumping Cooperation with other agencies Neutrality Theft, loss, damage Trademark copyright Illegal exports Irregular delivery Federal tort claims Personnel background investigations .. Miscellaneous crime cases Countervailing duties Currency and financial Vessel, vehicle, A/C repair Administrative
Total
Interaal investigative activities: Personnel full field investigations . . . . Personnel special inquiries Personnel conduct Federal tort claims Congressional inquiries
Digitized for FRASER http://fraser.stlouisfed.org/ Federal Reserve Bank of St. Louis

350 1977 REPORT OF THE SECRETARY OF THE TREASURY
Engraving and Pnnting Operations
TABLE 85.—Postage stamp issues delivered, fiscal year 1977 Number of stamps p ,
Issues delivered ^^"^^ ''^^"^ (in thousands) (in thousands)
Regular: Sheet
Precanceled Airmail
Book Coil
Precanceled Special delivery Postage due Aerogramme Federal migratory bird hunting Canal Zone Special:
13$ Independence Hall 13(t Christmas (Currier)—1976 13e Christmas (Copley)—1976 13c Christmas (Rural Mailbox)—1977 13e Christmas (Washington at Valley Forge)—1977
Bicentennial mural—Surrender of Lord Cornwallis
Bicentennial mural—Declaration of Independence
Bicentennial mural—Washington Crossing the Delaware
Bicentennial mural—Washington at Valley Forge
Commemoratives: Issues of 1975:
10(f World Peace Through Law 10(P D.W. Griffith 10<t Salem Poor lOc Haym Salomon 10(t Bunker Hill 10(t Paul L. Dunbar
Issues of 1976: 13$ Spirit of '76 13(p Interphil I3(p Commercial Aviation 13(f 50 State Flags 13$ Telephone Centennial 13c Chemistry 13(t Ben Franklin 13c Signing the Declaration of Independence. I3c Clara Maass 13c Adolph S. Ochs 13c Olympic Games
Issues of 1977: 13c Centennial of Colorado Statehood 13c Butterflies 13c Skilled Hands for Independence I3c Peace Bridge 13c Centennial of Sound Recording 13c Marquis de Lafayette 13c Drafting Articles of Confederation I3c Alta California 13c 50th Anniversary of Talking Pictures I3c Washington at Princeton 13c Pueblo Indian Pottery I3c Herkimer at Oriskany 13c Surrender at Saratoga 13c Energy Conservation and Development... 13c Lindbergh Flight
4,752,340 18,790
182.580 5,031.735 10.776.607
439.450 870
65.390 45.380 5,208 1,600
952,640 760,540 608,625 534,160
670,770
1,750
1.350
1.563
1.313
5 25 5 5 44 35
14,145 625 950
11,240 1,020 1.000 1.180 6.250 2,084 8,483 5,710
189,750 217,010 180,900 162.450 176,550 132,640 156,445 153,745 138,185 160.028 194,932 155,520 137,880 3,600
208,440
$748,797 2.598 53.754
641.160 1.307,171
32,032 522
17.887 9.984
26.000 220
128.843 98,870 79,121 69,441
87,200
228
175
375
407
.5 2.5 .5 .5 4.4 3.5
1,839 81 124
1,461 133 130 153 813 271
1,103 742
24,668 28,211 23,517 21,119 22,952 17,243 20,338 19,987 17.964 20,804 25,341 20.218 17,924 468
27.097
Digitized for FRASER http://fraser.stlouisfed.org/ Federal Reserve Bank of St. Louis

STATISTICAL APPENDIX 3 5 1
TABLE 86.—Deliveries of finished work by the Bureau of Engraving and Printing, fiscal years 1976 and 1977
^ [Dollar amounts in thousands]
Number of pieces Face value Class _ ^
1976 1977 1976 1977
Currency: Federal Reserve notes 2,763,520,000 2,997.120,000 $18,747,980 $19,546,720 Specimens 73 106
Total 2,763,520,073 2,997,120,106 18,747,980 19,546,720
Bonds, notes, bills, certificates, and debentures: Bonds: Treasury 126,435 261,740 5,225,500 18,301,300 Consolidated Federal farm loan bank bonds (the 12 Federal land banks) 1,500 3,298 1.500 165,500
Notes: Treasury 2,397,311 1,503,443 115,047,500 94.599,500 Farmers Home Administration insured note insurance contract 3,000
Federal Home Loan Bank consolidated discount 15,004 15,000,000
Bills: Treasury 1,863,000 498.000 130,040,000 21,875,000
Certificates: Interim certificate universal series 34,000 2,730,000 Interim certificate for Treasury notes 52.011 5,108,000 Participation—Federal National Mortgage Association. 7,150 1,010,000
Participation—Govemment National Mortgage liquidation trust 2,600 250 366,500 125,000
Mortgage backed—Govemment National Mortgage Association 83,007 102,510
Debentures: Federal Housing Administration 18,000 26,500 104,400 115,825
Total 4,543,864 2,454,895 255,893,400 153,922.125
Stamps: U.S. internal revenue 2,905,889,720 2,807,366,700 144 261 Alligator authenticity stamp 60.000 Gas coupons—NATO Forces Italy 7,755,084 4.214,170 Puerto Rican intemal revenue 108,255,000 34,560,000 U.S. postage: Regular 24,979,626,412 21,026,856,000 2,817,781 2,731,758 Airmail 326,621,000 182,580,000 84,111 53,754 Commemorative 2,491,984,950 2,420,883,696 297,541 314,711 Special delivery 10,820,000 870,000 6,492 522 Special issue 3,525,698,524 3,532,988,500 397.517 464.966 Postage due 84,790,000 65,390,000 13.985 17,887 U.S. aerogramme 50,889,000 45,380.000 10.715 9,984
Federal migratory bird hunting 4,461,000 5,208.000 22,305 26,000 Canal Zone postage:
Regular 4,609,600 1,600,000 603 220 Airmail 4,715,400 765
Food coupons 2,171,022,070 2,090,648,003 8,306,851 8,251,502 Food certificates 2,140,000 535 Obsolete stock authorized for destruction by the office of issue 124,040,790
Total 36,803,378,550 32.218,545.069 - 11,959,345 11,871.565
Miscellaneous: Cards, certificates, etc., to office of issue 9,592,038 4,793,842
Grand total 39,581,034,525 35,222,913,912 286.600,725 185,340,410
Digitized for FRASER http://fraser.stlouisfed.org/ Federal Reserve Bank of St. Louis

352 1977 REPORT OF THE SECRETARY OF THE TREASURY
TABLE Sl.—Statement of financial condition, Sept. 30, 1976 and 1977
Sept. 30, 1976 Sept. 30, 1977
ASSETS ~ ~ Current assets*
Cash with the Treasury $7,726,627 $11,461,574 Accounts receivable 10,274,395 11,583,860 Inventories" 26,376,656 23,744,860 Prepaid expenses 203.559 184.506
Total current assets
Plant and equipment"
Less accumulated depreciation "
Net plant and equipment
Deferred charges' *
Total assets LIABILITIES AND INVESTMENT
OF THE U.S. GOVERNMENT Current liabilities:
Accounts payable Accrued liabilities' Trust and deposit liabilities Advances from others' Current installments of capitalized lease-purchase cont rac ts ' . . . . ; .
Total current liabilities.
Capitalized lease-purchase contracts less current installments'
Total liabilities'
Investment of the U.S. Govemment: Appropriation from U.S. Treasury Donated assets, net Provision for capital improvements' Accumulated earaings, or deficit (—)'
Total investment of the U.S. Goverament.
Total liabilities and investment of the U.S. Goverament 73,047,403 , 76,074,449 •"f'
' Significant accounting policies: .. Inventories.—Finished goods and work-in-process inventories are valued at cost, including administrative and
service overhead. Except for the distinctive paper, which is valued at the acquisition cost, raw materials and stores inventories are valued at the average cost of the materials and supplies on hand.
Plant and equipment.—Machinery and equipment, furaiture and fixtures, office machines, and motor vehicles acquired on or before June 30, 1950, are stated at appraised values as at that date. Additions since June 30, 1950, J and all building appurtenances are valued at acquisition cost. The act that established the Bureau of Engraving | and Printing fund specifically excluded land and buildings costing about $9 million from the assets of the fund. | Also excluded are appropriated funds of about $7,184,000 for extraordinary uncapitalized building repairs and air conditioning.
Lease-purchase contracts capitalized.—Certain long-term lease-purchase contracts relating to the financing of equipment are accounted for as installment purchases of property. Upon payment of the required amounts, the equipment covered by these contracts becomes the property of the Bureau, and accordingly, for financial reporting purposes this equipment is being capitalized on the basis of the outright purchase price per contract. The difference between the total cbntract amounts, which are recorded as either current or long-term liabilities and the capitalized equipment costs, represent an implicit amount of interest and contractor risk, because of Bureau termination without liability privileges. This difference is accounted for as a deferred lease cost. Amortization of this lease cost is based on the ratio of each monthly lease payment to the total contract price.
Depreciation.—Depreciation is computed under the straight-line method. The depreciation rates used are based on the following useful lives: 6 to 30 years for machinery and equipment, 6 to 20 years for motor vehicles, 10 years for office machines, 10 years for furaiture and fixtures, and 3 to 20 years for building appurtenances.
Surcharge.—In accordance with Public Law 95-81, dated July 31, 1977, the Bureau includes in its selling prices a surcharge which is used for financing capital improvements. This surcharge is being accounted for as a direct addition to the investment ofthe U.S. Government on the statement of financial condition.
Earnings.—Customer agencies make payment at prices deemed adequate by the Bureau to recover costs. Because of variations between prices charged and actual costs, the Bureau could eara a profit or incur a loss in any fiscal year. All profit is to be paid into the general fund of the Treasury except that required to offset any accumulated loss from prior years' operations.
44.581.237
54.617.226 29.233.832
25.383.394
3.082.772
73.047.403
2.752.850 9.086.099 342,480
14,000,000
4,619.638
30.801.067
6.502.755
37.303.822
9.250,000 18,044,969 8,703,784 —255,172 .
35,743.581
46.974.800
57,820,946 31,545.645
26.275.301
2.824.348
76.074.449
2.015.783 10.817.854
357,409 14,650,000
3,022.840
30,863,886
4,241,880
35.105.766
9.250.000 18.044.969 14.832.961
— 1.159.247
40.968.683
Digitized for FRASER http://fraser.stlouisfed.org/ Federal Reserve Bank of St. Louis

Sept. 30. 1976 $12,310,005
8,430,651 2,813,280 2,822,720
Sept. 30. 1976
$10,100,307 34,020,463
234,822 474,249 706,268
6,302.792
Sept. 30. 1977 $11,503,848
7,356,974 1,842,989 3,041,049
Sept. 30. 1977
$10,100,307 38,190,077
370,061 468,575 719,258
6,487,619
STATISTICAL APPENDIX 3 5 3
' The following is a summary of the major categories of inventories:
Finished goods Work in process
I Raw materials Stores
' An analysis of plant and equipment is as follows:
Machinery and equipment: Lease-purchase contracts Outright purchases
Motor vehicles -,; Office machines
Furniture and fixtures Building appurtenances
Total v ^ Less accumulated depreciation
Net •* Construction in progress
-^ Total
Construction in progress for various items is as follows:
Machinery and equipment .p Motor vehicles
Furaiture and fixtures Building appurtenances . .
Total
Fully depreciated assets still in use are as follows: Machinery and equipment Motor vehicles Office machines Furaiture and fixtures , Building appurtenances
-i Total •
* An analysis of deferred charges is as follows:
"^ Sept. 30. 1976 Sept. 30. 1977 Lease-purchase financing costs $2,823,166 $1,733,152 Alterations and maintenance 184,295 813,672 Experimental equipment 7,833 4,333 Other 67,478 273.191
'The following is a summary ofthe major categories of accrued liabilities:
Sept. 30. 1976 Sept. 30. 1977 Payroll $3,448,508 $3,816,192
•^ Accrued leave 3.012.373 3.352.985 Constructive receipts 1.223.087 1.705.368 Other 1.402.131 1.943.309
The accrual for constructive receipts is the estimated value of work performed by contractors to * Goverament specifications, which had not been delivered to or accepted by the Bureau at the statement date.
Excluded from this amount is the value of any lease-purchase equipment which has not been accepted by the b Bureau because of contractual language contained in the contracts limiting Bureau liability in the event of
cancellation. The offsetting entries are as follows:
• Sept. 30. 1976 Sept. 30, 1977 Machinery and equipment $173,518 Raw materials $204,000 193,864 Stores 56.087 42.915 Work in process 963,000 1,295.071
Footnotes continued on following page.
51.838.901 29.233.832
22.605.069 2.778.325
25.383.394
$2,449,974
328.351
2.778.325
$14,171,782 78.670 195.613 300.999
4.142,805
18.889.869
56.335.897 31.545.645
24.790.252 1.485,049
26.275.301
$1,089,456 1.617 888
393.088
1.485.049
$16,205,389 80,704 130,314 290,854
4.320.380
21.027.641
Digitized for FRASER http://fraser.stlouisfed.org/ Federal Reserve Bank of St. Louis

354 1977 REPORT OF THE SECRETARY OF THE TREASURY
«The following agencies have advanced funds to the Bureau which are being used to finance increased inventories needed for future deliveries or site preparation costs for processing facilities for alien registration identification cards:
Sept. 30. 1976 Sept. 30. 1977 Department of Agriculture (food coupon books) .. $14,000,000 $14,000,000 Department of Justice (site preparation) ^ 650.000
' Outstanding commitments with suppliers for unperformed contracts and undelivered purchase orders were as follows:
Sept. 30. 1976 Sept. 30, 1977 Outstanding commitments $ 12.282,409 $9,904,848
A lease agreement for the rental of a closed-circuit television system provides for payments averaging about $101,502 for fiscal 1978. $59,509 for fiscal 1979, $27,253 for fiscal years 1980 and 1981, and $2,271 for fiscal 1982. At the end of payment the Bureau will assume ownership of the equipment. Under the agreement, the Bureau could be liable for a termination charge if it suspends or discontinues making rental payments. The Bureau has no plans to suspend or discontinue this system. . The charge is computed as follows:
Sept. 30, 1976 Sept. 30, 1977 - Termination charge $32,112 $59,049
^The provision for capital improvements, resulting from the Bureau's need to obtain modera equipment, is funded by the use of a surcharge included in the selling price of Bureau products. The surcharge is computed by various methods designed to equitably identify the needed funds to a specific program or overall Bureau requirements for which the capital expenditure is to be utilized.
The value of capital improvements considered as being acquired with surcharge funds is computed on the basis of a ratio of the surcharge generated during the period to the total funds available for capital expenditures (depreciation and surcharge), times the cost of all equipment purchased during the period involved. For those items of equipment identified as being purchased entirely with surcharge funds, the actual cost of the equipment and not the foregoing ratio method is used in determining the value of capital improvements acquired with surcharge funds.
An analysis ofthe provision for capital improvements is as follows:
Pending Authorized Total projects projects
Surcharge (7/1/74 through 9/30/76), $8,703,784 $8,703,784 Capital improvements acquired with surcharge
funds (7/1/74 through 9/30/76) —6,506,755 $6,506,755
w
Balance Sept. 30, 1976 2,197.029 6,506,755 8,703,784
Surcharge (FY 1977) 6.129.177 6.129.177
Total 8.326.206 6.506,755 " 14,832,961 ^~i Capital improvements acquired with surcharge
funds (FY 1977) —6.456,974 6.456.974 n ^
Balance Sept. 30, 1977 1,869,232 12,963,729 14,832,961
Digitized for FRASER http://fraser.stlouisfed.org/ Federal Reserve Bank of St. Louis
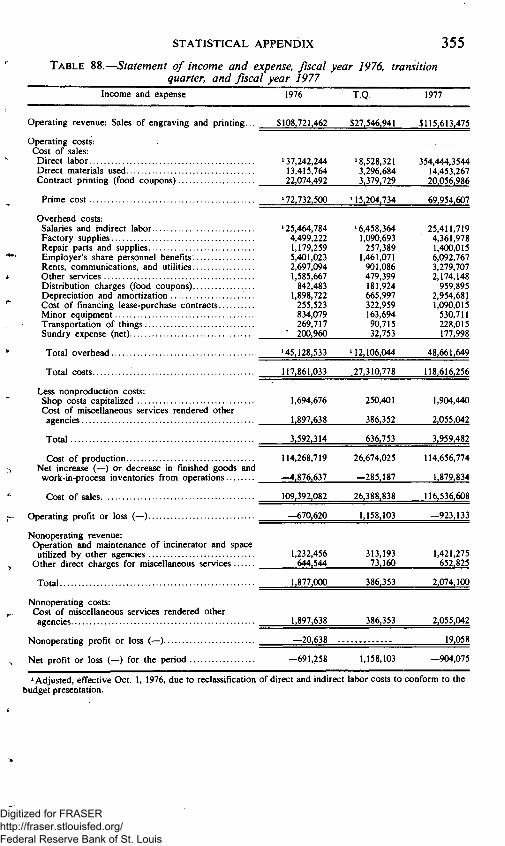
STATISTICAL APPENDIX 3 5 5
TABLE 88.—Statement of income and expense, fiscal year 1976, transition _____^__ quarter, and fiscal year 1977
Income and expense 1976 T.Q. 1977
Operating revenue: Sales of engraving and printing... $108,721,462 $27,546,941 $115,613,475
Operating costs: Cost of sales:
Direct labor ' 37,242,244 ' 8,528,321 354,444,3544 Direct materials used 13,415,764 3,296,684 14,453.267 Contract printing (food coupons) 22.074.492 3.379.729 20.056,986
Prime cost '72.732.500 '15.204.734 69.954,607
Overhead costs: Salaries and indirect labor '25,464,784 '6,458.364 25.411.719 Factory supplies 4.499.222 1.090.693 4,361.978 Repair parts and supplies 1.179.259 257,389 1,400.015 Employer's share personnel benefits. 5.401.023 1.461.071 6,092.767 Rents, communications, and utilities 2,697.094 901,086 3,279.707 Otherservices 1,585,667 479,399 2,174,148 Distribution charges (food coupons) 842,483 181,924 959,895 Depreciation and amortization 1,898,722 665,997 2,954,681 Cost of financing lease-purchase contracts 255,523 322,959 1.090,015 Minor equipment 834.079 163.694 530,711 Transportation of things 269.717 90.715 228,015 Sundry expense (net) ' 200,960 32,753 177,998
Total overhead '45,128.533 '12,106,044 48.661.649
Total costs 117,861,033 27,310,778 118,616,256
Less nonproduction costs: Shop costs capitalized 1,694,676 250,401 1,904,440 Cost of miscellaneous services rendered other
agencies 1.897.638 386.352 2,055.042
Total 3.592.314 636.753 3.959.482
Cost of production 114.268,719 26,674,025 114,656,774 Net increase (—) or decrease in finished goods and work-in-process inventories from operations —4,876,637 —285,187 1,879,834
Cost of sales 109,392,082 26,388,838 116.536.608
Operating profit or loss (—) —670.620 1.158.103 —923.133
Nonoperating revenue: Operation and maintenance of incinerator and space
utilized by other agencies 1.232.456 313.193 1,421,275 Other direct charges for miscellaneous services 644,544 73,160 652,825
Total 1,877,000 386,353 2,074,100
Nonoperating costs: Cost of miscellaneous services rendered other agencies 1,897,638 386,353 2.055.042
Nonoperating profit or loss (—) —20.638 19.058
Net profit or loss (—) for the period —691.258 1.158.103 —904.075
'Adjusted, effective Oct. 1, 1976, due to reclassification of direct and indirect labor costs to conform to the budget presentation.
Digitized for FRASER http://fraser.stlouisfed.org/ Federal Reserve Bank of St. Louis
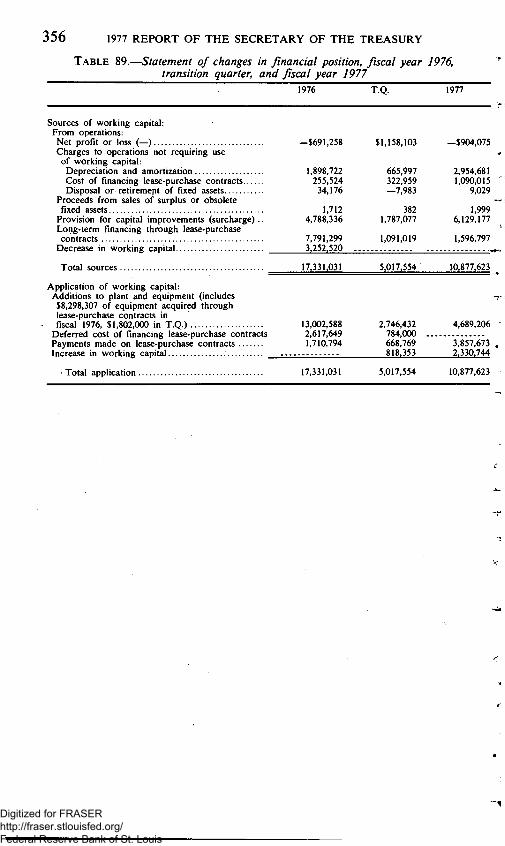
356 1977 REPORT OF THE SECRETARY OF THE TREASURY
TABLE 89.—Statement of changes in financial position, fiscal year 1976, transition quarter, and fiscal year 1977
1976 T Q . 1977
Sources of working capital: From operations:
Net profit or loss (—) Charges to operations not requiring use
of working capital: Depreciation and amortization Cost of financing lease-purchase contracts..... Disposal or retirement of fixed assets
Proceeds from sales of surplus or obsolete fixed assets
Provision for capital improvements (surcharge) . Long-term financing through lease-purchase contracts
Decrease in working capital
-$691,258
1,898,722 255,524 34,176
1,712 4,788,336
7.791.299 3.252.520 ..
$1,158,103
665,997 322,959 —7,983
382 1,787,077
1,091,019
-$904,075
2,954,681 1,090,015
9,029
1,999 6,129,177
1,596,797
Total sources 17,331,031 5.017,554 10.877.623
Application of working capital: Additions to plant and equipment (includes
$8,298,307 of equipment acquired through lease-purchase contracts in fiscal 1976. $1,802,000 in T.Q.)
Deferred cost of financing lease-purchase contracts Payments made on lease-purchase contracts .. Increase in working capital
• Total application
13.002.588 i 2.617.649
1.710.794
17.331.031
2.746,432 784.000 .. 668.769 818.353
5,017,554
4,689,206
3,857,673 2.330,744
10,877,623
Digitized for FRASER http://fraser.stlouisfed.org/ Federal Reserve Bank of St. Louis

STATISTICAL APPENDIX 357
International Claims
TABLE 90.—Status of Class III awards of the Mixed Claims Commission, United States and Germany, and Private-Law 509, Sept. 30, 1977
Description
AWARDS'
Principal of awards Less amounts paid by Alien Property and others..
Interest to Jan. 1, 1928, as specified in awards Interest thereon to date of payment or, if unpaid, to June 30, 1971, at 5 percent per annum, as specified in the Settlement of War Claims Act of 1928
Total due claimants
PAYMENTS
Principal of awards Interest to Jan. 1, 1928 Interest at 5 percent from Jan. 1, 1928, to date of payment
Total payments'
BALANCE DUE
Principal of awards
Accrued interest from Jan. 1, 1928
Balance due claimants
Total reimbursement for administrative expenses'
' Excludes Class I awards (on account of death and personal injury) which have been paid in full and also Class II awards on which there remain balances totaling $42,830.84. For details conceraing all classes of awards, including claims of U.S. Government, see 1962 Annual Report, pages 138 and 826.
'Amounts shown are gross; deductions for administrative expenses are shown below (see footnote 3). 'Deductions of 'A of 1 percent are made from each payment to cover administrative expenses. These amounts
are covered into the Treasury as miscellaneous receipts. NOTE. — On Feb. 27, 1953, the German Goverament agreed to pay $97,500,000 (U.S. dollars) over a period
of 25 years in full settlement of Germany's obligations on account of Class III awards and the award under Private Law 509. Through Sept. 30, 1977, $93,500,000 has been obligated for payment to awardholders. On Apr. 30, 1970, $32 million was received from the Goverament of Germany and deposited into a special account on behalf of the Deutsche Bundesbank. Each year, on Apr. 1, through 1978, $4 million will be transferred from the Deutsche Bundesbank account into the German deposit fund for distribution to awardholders.
Class III awards—over
$100,000
$117,387,252 266.073
53.245.392
81,526.247
251.892.818
98.626.691 53.245.392
81.416.923
233.289.006
18,494,488 109,324
18,603.812
1,164,620
Private Law 509, approved July 19, 1940
$160,000
64,000
178,192
402,192
132,909 64,000
176,349
373,258
27,091 1,843
28,934
1,866
Digitized for FRASER http://fraser.stlouisfed.org/ Federal Reserve Bank of St. Louis

T A B L E 91.—Status of claims of American nationals against certain foreign governments, Sept. 30, 1977
Bulgaria Hungary Romania Poland War claims fund Yugoslavia Italy
OO
Awards certified to the Treasury: Number of awards 244 1.788 672 7.363 ' 8,793 659 727
Amount of awards: Principal $4,825,586 $61,993,386 $61,102,450 $101,662,682 $340,509,577 $9,685,093 $3,157,337 Interest 1.914.973 24.121.681 24.846.637 51.775.175 2,866,280 1,072,477
Total 6,740,559 86,115,067 85,949,087 153,437,857 340,509,577 12,551,373 4,229,814
Deposits in claims funds 3,217,088 13,830,514 23,725,000 34,000,000 244,668,082 3,546,960 5,000,000 Statutory deduction for
administrative expenses 160,854 766,526 1,186,274 ' 9(K),000 Q 145,827 250,000
Amount available for payment on awards 3,056,234 13,063,988 22,538,726 33,100,000 244,668,082 3,401,133 4,750,000
Payments on awards: Principal 3,050,114 9.578,168 22,527,218 32.956.512 244.511.704 3.364.462 * 4.231.658 Interest
Balances in claims funds 6.120 3.485.820 11.508 143.488 156.378 36.671 ' 2 6 0
'Private Law 91-88. 'Statutory deduction of 5 percent made by the Foreign Claims Settlement Commission 'Public Law 90-421. approved July 24. 1968, amended the Interaational Claims prior to the funds being transferred to Treasury.
Settlement Act of 1949 to permit the 5-percent deduction to be made from the installment * Includes both principal and interest. payments made under the claims agreements, rather than from each payment made to '$518,082 transferred to war claims fund pursuant to section 304, title III of the awardees. Interaational Claims Settlement Act. as amended.
70 tn O 70 H
O
H X tn c/5 tn o 73
73
O
H X tn H 70 tn > c/3 C 73
Digitized for FRASER http://fraser.stlouisfed.org/ Federal Reserve Bank of St. Louis

STATISTICAL APPENDIX
International Financial Transactions
TABLE 92.—U.S. reserve assets, fiscal year 1965 to date [In milhons of dollars]
359
End of fiscal year or month Total
reserve
Gold stock'
Total ' Treasury
Reserve Special Convertible position in drawing foreign Interaational rights' * currencies' Monetary
Fund'«
1965 15,762 ' 14,049 ' 13,934 1966 14,958 13,529 13,433 1967 . . . . ; 14,274 13,169 13,110 1968 14,063 10,681 10,367 1969 16,057 11,153 10,367 1970 ' 16,328 11,889 11,367 1971 13,504 10,507 10,332 1972 '"M3,339 10,490 10,410 1973" . . . ; 12,914 10,487 10,410 1974 14,946- 11,652 11,567 1975 16,242 11,620 11,620 1976 18,477 11,598 11,598 T.Q 18,945 11,598 11,598 1977 18,988 11,658 11,595 1976_October 19,013 11,598 11,598
November 19,416 11,598 11,598 December 18,747 11,598 11,598
1977_January 19,087 11,658 11,658 February 19,122 11,658 11,650 March 19,120 11,658 11,636 April 18,868 11,658 11,636 May 19,195 11,658 11,629 June 19,156 11,658 11,620 July 18,927 11,658 11,595 August 19,055 11,658 11,595 September 18,988- 11,658 11,595
957 1,247 1,958 1,949 2,195 2,418 2,316 2,357 2,489 2,352 2,365 2,395 2,375 2,383 2,389 2,384 2,470 2,486 2,498 2,483 2,489
546 722 738
2,479. 3,355
' 1,132 322
» 457 8
94 25
1,365 1,038
65 1,066 1,146
320 372 262 261 106 95 92 55 55 65
1,167 707 367 903
1,549 2,350 1,428
434 470
1,005 2,179 3,198 3,952 4,776 3,997 4,307 4,434 4,682 4,819 4,812 4,720 4,972 4,920 4,716 4,859 4,776
Footnotes on following page.
Digitized for FRASER http://fraser.stlouisfed.org/ Federal Reserve Bank of St. Louis

360 1977 REPORT OF THE SECRETARY OF THE TREASURY
' Beginning July 1974. the IMF adopted a technique for valuing the SDR based on a weighted average of exchange rates for the currencies of 16 member countries. The U.S. SDR holdings and reserve position in the IMF are also valued on this basis beginning July 1974. At valuation used prior to July 1974 (SDR 1 = $1.20635), the following end-of-month values amounted to (in millions ofdollars):
SDR ^'^' U.S. holdings nnJfn^Tr, ^eserve
(net) ^ ' ^ ' 7 ^ ; ^ total
1976—October 2,457 4,087 19,208 November 2,481 4,415 19,640 December 2,487 4,495 18,900
1977—January 2,487 4,783 19,300 February 2,487 4,904 19,311 March 2.487 4.885 19.291 April 2.475 4,779 19,018 May 2,565 5,031 19,349 June 2.572 4.964 19,286 July 2,572 4,738 19,023 August 2,578 4,921 19,212 September 2,581 4,831 19,135^
' Includes gold sold to the United States by the Interaational Monetary Fund with the right of repurchase, and gold deposited by the Interaational Monetary Fund to mitigate the impact on the U.S. gold stock of foreign purchases for the purpose of making gold subscriptions to the Fund under quota increases.
' Includes gold held by the Exchange Stabilization Fund. * Includes initial allocation on Jan. 1, 1970, of $867 million, second allocation on Jan. 1, 1971, of $717 million,
and third allocation on Jan. 1, 1972, of $710 million of special drawing rights (SDR's) in the Special Drawing Account in the Interaational Monetary Fund, plus or minus transactions in SDR's.
'Includes holdings of Treasury and Federal Reserve System. *The United States has the right to purchase foreign currencies equivalent to its reserve position in the Fund
automatically if needed. Under appropriate conditions the United States could purchase additional amounts equal to the U.S. quota, which amounted to $8,083 million as of Sept. 30, 1976.
'Reserve position includes, and gold stock excludes, $259 million gold subscription to the Fund in June 1965 for a U.S. quota increase which became effective on Feb. 23, 1966. In figures published by the Fund from June 1965 through January 1966, this gold subscription was included in the U.S. gold stock and excluded from the reserve position.
'Includes gain of $67 million resulting from revaluation of the German mark in October 1969, of which $13 million represents gain on German mark holdings at time of revaluation.
'Includes $28 million increase in dollar value of foreign currencies revalued to reflect market exchange rates asofDec. 31,1971.
'"Total reserve assets include increase of $1,016 million resulting from change in par value of the U.S. dollar .. on May 8, 1972, consisting of $828 million total gold stock, $155 million SDR's, and $33 million reserve position ' in the Interaational Monetary Fund.
"Dollar equivalents not revalued to reflect change in par value of the dollar, effective Oct. 18, 1973. ^
Digitized for FRASER http://fraser.stlouisfed.org/ Federal Reserve Bank of St. Louis

.»...^».^,»^ fr»M ..i^MfM-«fMi/(((»<cjt *i/ vm. v^.riKr j u r c i g n e r s , l y o j w a a t e
[In millions ofdollars]
Liabilities to foreign countries
End of period Total
Liquid liabilities
to Interaational
Monetary Fund
arising from gold
transactions '
Official institutions' Liquid liabilities to other foreigners
Liquid
Total
Short-term liabilities
reported by banks
in the United States
Marketable U.S.
Treasury bonds
and notes'
Nonmarketable
U.S. Treasury
bonds and
notes*
Other readily market
able liabilities'
Liquid liabilities to
banks' Total
Short-term liabilities
reported by banks
in the United
S ta tes"
Marketable U.S.
Govem-. ment bonds
and notes
Liquid liabilities
to nonmonetary intemational
and regional organizations"
r >
i i
1965—June December.
1966-June
December'...
1967—June
December"...
1968—June
December'...
1969—June
December"".
1970—June
December'...
1971—June
December'".
1972—June December....
1973—June"" .... December....
1974—June December....
1975—June December....
1976—June December....
1977—June
28,398 29,568 29,619 31,144 31,019 31,757 35,819 35,667 36,171 38,687 38,473 43,627 45,755 45,914 47,461 47,009 46,960 54,764 67,681 67,808 73,995 82,861 92,088 92,490 104,189 119,163 122.347
'126.552 '135.247 151,357 163,543
800 834 983
1,011 1,011 1,033 1,033 1,033 1,030 1,030 1,030 1,028 1,019 1,019 1,010 566 566 548 544 554
14,768 15,825 15,225 14,840 14,895 16.230 18.201 18.194 15.758 17,407 17,340 14,826 15,975 15,998 19,383 23,786 23,775 33,995 51,209 50,651 54,604 61.526 70.701 66.861 70.132 76.823 81.089 '80.712 '85.254 91.976 103.656
12,201 13,066 12,661 12,484 12,539 12,802 14,034 14,027 10,733 11,318 11,318 9,112 11,054 11,077 14,508 19,333 19,333 26,808 39,679 39,018 38,603 40,000 45,713 43,923 47,465 53v079 52,123 '49,53a '50,101 53,619 57,413
1,126 1.105 1,106 860 860 917 908 908 557 529 462 454 346 346 360 306 295 379
1,955 1,955 3,292 5,236 6,934 5,701 5,013 5,059 6,139 6,671 9,225 11,788 18,345
1,333 1,534 1,020 583 583 698
1,452 1,452 2.395 3.219 3,219 3,157 3,070 3,070 3,399 3,452 3,452 6,474 9,431 9,534 12,317 15,747 16,050 15,564 16,074 16,339 19,169 19,976 20,251 20,648 20,917
108 120 438 913 913
1,813 1,807 1,807 2,073 2,341 2,341 2,103 1,505 1,505 1,116 695 '695 334 144 144 392 543
2.004 1.673 1,580 2,346 3,658 4,335 5,677 5,921 6,981
7,261 7,419 8,139 10,116 9,936 9,339 11,209 11,085 13,928 14,472 14.472 22,320 23,638 23,645 21,766 17,137 17,169 14,367 10,262 10,949 13,412 14,666 14,362 17,694 25,119 30,106 27,954 29,516 '32,628 37,329 36,687
3,939 4,059 4,234 4,271 4,272 4,364 4,685 4,678 4,785 5.053 4.909 4,738 4,464 4,589 4,622 4,676 4,604 4,530 4,138 4,141 4,501 5,043 5,356 5,932 7,139 8,912 9,283
' 10,701 '11,418 13,569 15,016
3,471 3,587 3,744 3,743 3,744 3.826 4.127 4.120 4.172 4.444 4.444 4.286 3.939 4.064 4.086 4.029 4,039 3,957 3,691 3,694 4,129 4,618 4,973 5,502 6,776 8,414 8,628
'10,000 10.617 12.592 13.620
468 472 490 528 528 538 558 558 613 609 465 452 525 525 536 647 565 573 447 447 372 425 383 430 363 498 655 701 801 977 ,396
1.630 1.431 1,038 906 905 791 691 677 670 725 722 715 659 663 680 844 846
1,324 1,528 1,523 1,478 1,626 1,669 2,003 1.799 3.322 4.021 '5.623 5.947 8.483 8.184
CN
See footnotes at end of table.
Digitized for FRASER http://fraser.stlouisfed.org/ Federal Reserve Bank of St. Louis
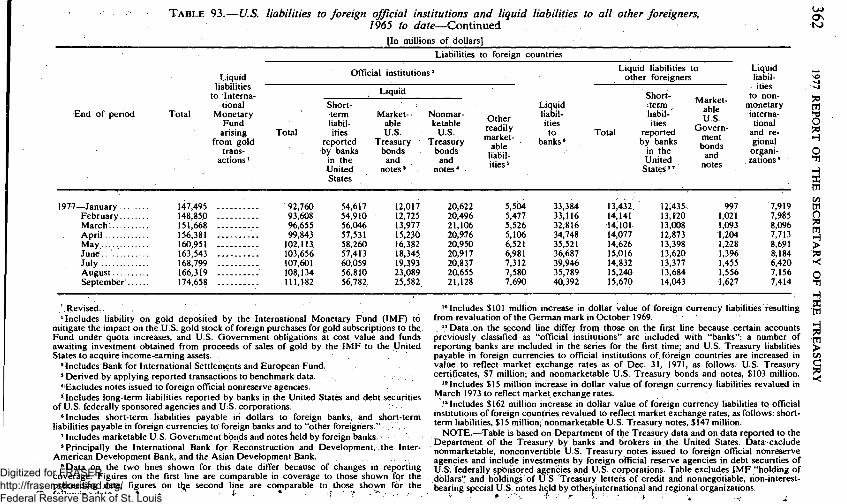
T A B L E 93.—U.S. liabilities to foreign official institutions and liquid liabilities to al l other foreigners, 1965 to date—Continued
[In millions of dollars]
Liabilities to foreign countries
End of period Total
Liquid liabilities
to Interaational
Monetary Fund
arising from gold
transactions '
Official institutions' Liquid liabilities to other foreigners
Liquid
Total
Short-term liabilities
reported by banks
in the United States
Marketable U.S.
Treasury bonds
and notes'
Nonmarketable
U.S. Treasury
bonds and
notes*
Other readily market
able hiabil-ities'
Liquid liabilities to
banks * Total
Short-term
liabilities
reported by banks
in the United
S ta tes"
Marketable U.S.
Government bonds
and notes
Liquid liabilities
to nonmonetary interaational
and regional organizations '
t o
po tn
s po H O
H X tn CA> tn o po
> 73
O
X tn H 70 tn > (n C 70 <
1977—January ... February.,. March: April May. June... July August September'.
147.495 148.850 151,668 156.381 160,951 163.543 168.799 166.319 174.658
92,760 93,608 96,655 99,843 102,113. 103.656 107,601 108.134 111.182
54.617 54.910 56.046 57,531 58,260 57,413 60,059 56,810 56,782
12,017 12,725 13,977 15,230 16,382 18,345 19,393 23.089 25.582
20.622 20.496 21.106 20,976 20,950 20,917 20,837 20,655 21,128
5,504 5,477 5.526 5.106 6.521 6.981 7.312 7.580 7.690
33.384 33.116 32.816 34.748 35.521 36.687 39,946 35.789 40.392
13.432. 14.141 14.101 14.077 14.626 15,016 14,832 15,240 15,670
12;435. 13,120 13,008 12,873 13.398 13.620 13.377 13.684 14.043
997 1.021 1.093 1.204 1.228 1.396 1.455 1.556 1.627
7.919 7.98!5 8.096 7.713 8.691 8.184 6.420 7.156 7.414
'.Revised. ' Includes liability on gold deposited by the International Monetary Fund (IMF) to
mitigate the impact on the U.S. gold stock of foreign purchases for gold subscriptions to the. Fund under quota increases, and U.S. Goverament obligations at cost value and funds awaiting investment obtained from proceeds of sales of gold by the IMF to the United States to acquire income-earaing assets.
'Includes Bank for International Settlernents and European Fund. 'Derived by applying reported transactions to benchmark data. , . . . * Excludes notes issued to foreign official nonreserve agencies. 'Includes long-term liabilities reported by banks in the United States and debt securities
of U.S. federally sponsored agencies and U;S. corporations. ' ® Includes short-term liabilities payable in dollars to foreign banks, and short-term
liabilities payable in foreign currencies to foreign banks and to "other foreigners." ' Includes marketable U.S. Government bonds and notes held by foreign banks. -'Principally the International Bank for Reconstruction and Development, the Inter-
American Development Bank, and the Asian Development Bank. 'Data on the two lines shown for this date differ because of changes in reporting
coverage. Figures on the first line are comparable in coverage to those shown for the preceedjijig date; figures on the second line are comparable to those shown for the
'"Includes $101 million increase in dollar value of foreign currency liabilities resulting from revaluation of the German mark in October 1969. . "Data on the second line differ from those on the first Hne because certain accounts
previously classified as "official institutions" are included with "banks"; a number of reporting banks are included in the series for the first time; and U.S. Treasury liabilities payable in foreign currencies to official institutions of fbreign countries are increased in value.to reflect market exchange rates as of Dec. 31. 1971. as follows: U.S. Treasury certificates. $7 million; and nonmarketable U.S. Treasury bonds and notes. $103 million.
"Includes $15 million increase in dollar value of foreign currency liabilities revalued in March 1973 to reflect market exchange rates.
"Includes $162 million increase in dollar value of foreign currency liabilities to official institutions of foreign countries revalued to reflect market exchange rates, as follows: short-term liabilities. $15 million; nonmarketable U.S. Treasury notes. $147 million.
NOTE.—^Table is based on Department of the Treasury data and on data reported to the Department of the Treasury by banks and brokers in the United States. Data exclude nonmarketable. nonconvertible U.S. Treasury notes issued to foreign official nonreserve agencies and include investments by foreign official reserve agencies in debt securities of U.S. federally sponsored agencies and U.S. corporations. Table excludes IMF "holding of dbllars" and holdings of U.S. Treasury letters of credit and nonnegotiable. non-interest-bearing special U.S. notes held by othefjinteraational and regional organizations.
% -I'
Digitized for FRASER http://fraser.stlouisfed.org/ Federal Reserve Bank of St. Louis

1
TABLE 94.—International investment position of the United States at yearend^ [Millions o f dollars]
Line Type of investment Total Western Europe Canada Japan
Latin American Republics and other Western
Hemisphere
Other foreign
countries
International
organizations and
unallocated t
1975 1976 1975 1976 1975 1976 1975 1976 1975 1976 1975 1976 1975 1976
1 Net international investment position of the United States 74,597 82,548-45.474-45.851 41,701 48,038 1,110 -2,022 39,505 52,519 14,834 5.444 22.919 24,418
2 U.S. assets abroad 295,630 347,369 79,304 90,844 59,296 68,657 17,366 18,233 61,172 79,460 49,459 57,226 29,032 32,948
9 10 11 12
13 14 15 16 17 18
19 20 21 22 23
U.S. official reserve assets Gold' Special drawing rights'' Reserve position in the Intemational Monetary F u n d " Foreign currencies
16,226 11,599 2,335 2,212
U.S. Govemment assets, other than official reserve assets 41,814 U.S. loans and other long-term assets 39,819 Repayable in dollars* 36,830 Othe r^ . . : '. 2,989
U.S. foreign currency holdings and U.S. short-term assets 1,995
U.S. private assets 237,590 Direct investments abroad 124,212 Foreign securities 35,186 . Bonds 25,601 Corporate stocks 9,585
U.S. claims on unaffiliated foreigners reported by U.S. nonbanking concerns 18,425
Long-term 5,960 Short-term 12,465
U.S. claims reported by U.S. banks, not included elsewhere 59,767 Long-term 9,536 Short-term 50,231
18,747 11,598 2,395 4,434
320
45,988 44,132 41,313 2,819 1,856
282,634 137,244 44,581 35,128 9,453
20,138 5,950
14,188 80,671 11,660 69,011
79 19
79 19
8,897 9,119 8,731 9,005 7,998 8,325
733 681 166 114
70,328 49,533
3,871 1,195 2,676
6,133 1,708 4,425
10,791 2,014 8,777
81,706 55,906 4,940 2,277 2,663
6,614 1,583 5,031
14,246 2,397
11,849
24 Foreign assets in the United States 221,033 264,822 124,778 136,695
25 Foreign official assets in the United States 87,471 106,337 47,326 47,682 26 U.S. Government securities '. 63,292 73,565 27 U.S. Treasury securities 60,846 70,161 C) C) 28 Other 2 446 3 404 29 Other U.S. Government liabilities ..\ 5 186 lo!l25 1,733 1,857
Sep footnotps at end of table.
(•) (*)
(*) (•)
275 286 272 285 272 285
" "3 1
59,021 68,371 31,038 33,927 20,930 26,639 14,973 20,768 5,957 5,871
3,681 1,555 2,126 3,372 555
2,817
4,119 1,654 2,465 3,686 586
3,100
17,595 20,619
3,217 3,536
{') ()
85 130
1
1
1,228 92
1,136
e) 443
1
1
300
300
16,146 18,427 11,599 11,598 2,335 2,395 2,212 4,434
628 687 9,115' 9,631 20,562 23,176 2,336 3,089 608 673 9,079 9,598 18,797 21,487 2,331 3,084 589 663 8,475 9,011 17,164 19,946 2,331 3,084 19 10 604 587 1,633 1,541 20 14 36 33 1,765 1,689 5 5
16,737 17,545 52,057 69,529 28,897 34,050 10,550 11,432 3,339 3,787 22,101 23,536 11,134 13,043 67,067 667,044 1,098 1,390 1,794 1,995 4,037 5,255 3,456 4,362 513 789 1,658 1.862 3,806 5,070 3,456 4,362 585 601 136 133 231 185
989 4,157 81 1,700
908 2,457
5,152 1,589 3,563
3,226 905
2,321
3,264 1,043 2,221
11,072 11,379 24,005 38,846 10,500 12,488 296 387 3,472 4,812 3,172 3,452
10,776 10,992 20,533 34,034 7,328 9,036
16,256 20,255 21,667 26,941 34,625 51,782
27 27 (•)
26 26 (*)
6,113 8,530
e) 528
4,673
(A I )
214
5,134
(A \ )
261
e) (')i 0
2,712 7,349
C/)
H > H GO
H n > r > tn z a
OS
Digitized for FRASER http://fraser.stlouisfed.org/ Federal Reserve Bank of St. Louis

TABLE 94.—International investmerit position of the United States at yearend^—Continued [Millions of dollars]
Line Type of investment Total Western Europe Canada
Latin American Republics and other Western
Hemisphere
Other foreign
countries
International
organizations and
unallocated t
1975 1976 . 1975 1976 1975 1976 1975 1976 1975 1976 1975 1976 1975 1976
ON
7i tn ^ O 7i H O
H X tn C/) tn o 7i
> 7i
O ^ H X tn H 7i tn > c/5
d 7i
30 U.S. liabilities reported by U.S. banks, not included elsewhere 16,262 17,155 31 Other foreign official assets 2,731 5,492
33
35 36 37
38 39 40 41
42 43 44 45
C) C) C) C)
Other foreign assets in the United States 133,562 158,485 77,452 89,013 14,378 17,083
Direct investments in the United States ^ . 27,662 30,182 18,584 19,916 5,352 5,859 34 U.S. securities other than U.S. Treasury'securities 45,338 54,800 32,233 38,460 5,963 7,313
Corporate and other bonds 10,025 Corporate stocks 35,313
U.S. liabilities to unaffiliated foreigners reported by U.S. non-banking concerns 13,842
Long-term 6,765 Short-term 7,077
U.S. long-term liabilities reported by U.S. banks 881 U.S. Treasury securities and other short-term liabilities
reported by U.S. banks 45,839 U.S. Treasury securities.
Bills and certificates Bonds and notes _.
U.S. short-term liabilities reported by U.S. banks, not included, elsewhere
4,245 3,214 1,031
11,934 42,866
13,018 5,818 7,200 1,056 I
59,429 7,028 3,018 4,010
41,594 52,401
J,730 23,503
8,602 5,136 3,466
(0
10,370 28,090
7,333 4,373 2,960
(0
864. 5,099
601 288 313
(0
1,059 6,254
598 218 380
(0
e) 591 702
74 628
693 397 296
e)
(8) I C) C)
16,994 21,807 C) n
890 2,774 3,084 361 433 876 1,645 2,144 4,418 5,538 66 251 337 69 49
810 1,394 1,807 4.349 5,489
(0
6,113
'"377 37
340;
(0
8,530
'"'469 53
416
626 397 229
(«)
1,547 498
1,049
1,506 470
1,036
0
2,399 446
1,953
(«)
2,955 360
2,595
(«) C) r)
t Includes U.S. gold stock. • Less than $500,000. ' Data for 1975 are revised; data for 1976 are preliminary. 'Total reserve assets include increases from changes in the par value of the dollar, as
officially implemented. 'U.S. holdings of special drawing rights and the reserve position include changes in the
SDR based on changes in a weighted average of exchange rates for currencies of 16 member countries ofthe Interaational Monetary Fund.
*Also includes paid-in capital subscription to international financial institutions and outstanding amounts of miscellaneous claims that have been settled through international agreements to be payable to the U.S. Goverament over periods in excess of One year. Excludes World War I debts that are not being serviced.
' Includes indebtedness that the borrower may contractually, or at its option, repay with its currency, with a third country's currency, or by delivery of materials or transfer of services.
«For the most part, represents the estimated investment in shipping companies registered primarily in Panama and Liberia.
7 Details not shown separately are included in totals in lines 25 and 32. 'Details not shown separately are included in line 24. 'Data are based on the results of the 1974 Survey of Foreign Direct Investment in the
United States. Source: U.S. Department of Commerce. Bureau of Economic Analysis. Survey of
Current Business. October 1977.
Digitized for FRASER http://fraser.stlouisfed.org/ Federal Reserve Bank of St. Louis

STATISTICAL APPENDIX 365 TABLE 95.^Assets and liabilities of the Exchange Stabilization Fund,
Sept. 30, 1976 and 1977
Assets and liabilities Sept. 30. 1976 Sept. 30, 1977 Fiscal 1977 increase, or
decrease (—)
ASSETS
Cash: Treasury of the United States (includes
undeposited collections Federal Reserve Bank of New York, special accounts
Total cash Gold Special drawing rights Foreign exchange due from foreign banks:
Bank of England. Investments in U.S. Government securities (schedule 1)
Accounts receivable Accrued interest receivable—U.S. Government securities
Accrued interest receivable—SDR holdings — Accrued interest receivable—foreign Furniture and equipment, less allowance for depreciation
Building, less allowance for depreciation Land Prepaid expenses
Total assets
LIABILITIES AND CAPITAL
Accounts payable Exchange translation liability' Special drawing rights certificates Special drawing rights allocations Capital account Cumulative net income (schedule 2)
Totai liabilities and capital
$637,468
32.430.735
33.068,203
""2."3"5'6,6'3"3",'2"8'5
300.000.117
1,529.336,674 119.446
6.092.377 35,780.241
89,963
491,685 27.950 100,000 552.073
4.262.292.014
44.844.005 409.630.843 800,000.000
2,654,344,415 200,000,000 153,472.751
4.262.292.014
$581,350
22,946.907
23.528.257 ' 62.723.123
2.489.275.252
117
2.049,565.091 440.607
9.031.421 37.227.521
476.232 26.150 100.000 470.156
4.672.863.927
43.919,161 404,305,333
1,200,000,000 2,669,131,815 200,000,000 155.507.618
4,672.863,927
—$56,118
—9,483,828
—9,539,946 ' 62,723,123 132,641,967
—300.000,000
520,228,417 321,161
2,939.044 1.447.280 —89.963
— 15,453 — 1,800
—81.917
410.571.913
—924.844 —5.325.510 400.000,000 14,787.400
"2".034 867
410.571,913
'1,485,548,424 ounces. 'The exchange translation liability shown is the additional amount of loss that the Exchange Stabilization
Fund (ESF) would sustain if redemption of the outstanding $1,289 million Swiss franc-denominated U.S. Treasury notes had taken place at the exchange rate on that date. During the period Sept. 30, 1977, to Mar. 31, 1978, $254 million Swiss franc-denominated notes were redeemed and actual losses of $133 million were realized by the ESF. The exchange translation liability on the $1,035 million Swiss franc notes remaining outstanding as of Mar. 31, 1978. had increased to $755 million based on the exchange rate on that date. In addition, the ESF entered into a I-year bilateral currency agreement with the Deutsche Bundesbank on Jan. 3, 1978. As of Mar. 31, 1978, the ESF exchange translation liability with respect to that agreement amounted to $23 million.
Digitized for FRASER http://fraser.stlouisfed.org/ Federal Reserve Bank of St. Louis

366 1977 REPORT OF THE SECRETARY OF THE TREASURY
TABLE 95.—Assets and liabilities of the Exchange Stabilization Fund, Sept. 30, 1976 and 7977—Continued
SCHEDULE 1—INVESTMENTS HELD BY THE EXCHANGE STABILIZATION FUND. _ _ _ _ _ _ ^ ^ SEPT. 30, 1977 .
Securities T-^^^ woi,.^ r-«c» Accrued Face value Cost interest
Goverament account series. Exchange Stabilization Fund Series, 5.35 percent, maturing Oct. I, 1977 $2,049,565,091 $2,049,565,091 $9,031,421
SCHEDULE 2—INCOME AND EXPENSE
Classification " " Jan. 31. 1934. t h rough-Sept. 30, 1976 Sept. 30. 1977
Income: Profits on transactions in: Gold and exchange (including profits from handling charges on gold)' —$651,638,767 —$721,516,730
Sale of silver to U.S. Treasury 3,473.362 3,473,362 Silver 102.735 102.735 Investments 1,325,207 1.325.207 Miscellaneous 242.474 244.256
Interest on: Investments 914,137.908 1,005,274,496 Special drawing rights —107,384,909 —117,007,862 Fbreign balances 183,192,903 192,181,065
Revaluation of SDR holdings and allocations —43,608,437 —44,95.3,118
Total income 299.842,476 319,123.411
Expense: Personnel compensation and benefits 104.588,894 . 117.136,935
• Travel 7,742.396 8.325.898 Transportation of things. 4.598,563 4,654.708 Rent, communications, and utilities .... 4,610,718 5.676,396 Supplies and materials. 989,168 1,182.591 Other. 23.839,986 26.639,265
Total expense 146,369,725 163.615.793
Cumulative net income 153,472.751 155.507.618
'Reflects exchange translation liability incurred as result of redemption of Swiss franc-denominated notes per agreement with Banque Nationale Suisse in October 1976.
Digitized for FRASER http://fraser.stlouisfed.org/ Federal Reserve Bank of St. Louis
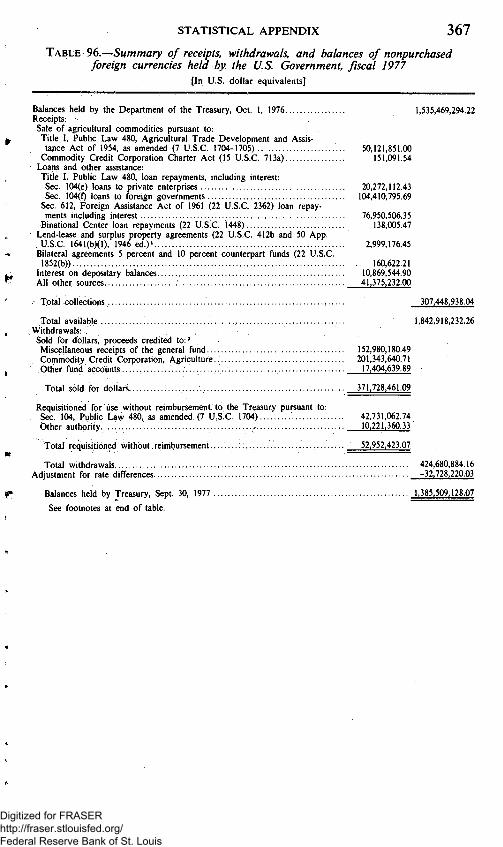
STATISTICAL APPENDIX 3 6 7
TABLE 96.—Summary of receipts, withdrawals, and balances of nonpurchased foreign currencies held by the US. Government, fiscal 1977
[In U.S. dollar equivalents]
Balances held by the Department of the Treasury, Oct. 1, 1976 1,535,469,294.22 Receipts: Sale of agricultural commodities pursuant to: Title I. Public Law 480, Agricultural Trade Development and Assistance Act of 1954, as amended (7 U.S.C. 1704-1705) 50,121,851.00
Commodity Credit Corporation Charter Act (15 U.S.C. 7l3a) 151.091.54 Loans and other assistance: Title I, Public Law 480. loan repayments, including interest: Sec. 104(e) loans to private enterprises 20,272,112.43 Sec. 104(0 loans to foreign governments 104,410,795.69
Sec. 612, Foreign Assistance Act of 1961 (22 U.S.C. 2362) loan repayments including interest 76,950,506.35
Binational Center loan repayments (22 U.S.C. 1448) 138,005.47 Lend-lease and surplus property agreements (22 U.S.C. 412b and 50 App. U.S.C. 1641(b)(1), 1946 ed.)' 2,999,176.45
Bilateral agreements 5 percent and 10 percent counterpart funds (22 U.S.C. 1852(b)) . 160,622.21
Interest on depositary balances 10,869,544.90 All other sources ' 41,375,232.00
• Total -collections 307,448,938.04
Total available 1,842,918,232.26 Withdrawals: .. Sold for dollars, proceeds credited to:' Miscellaneous receipts of the general fund 152,980,180.49 Commodity Credit Corporation, Agriculture.. 201,343,640.71 Other fund accounts 17,404,639.89
Total sold for dollars 371,728,461.09
Requisitioned for use without reimbursement, to the Treasury pursuant to: Sec. 104, Public Law 480, as amended (7 U.S.C. 1704) 42,731,062.74 Other, authority....... 10.221.360.33
Total requisitioned without .reimbursement...;....;...; 52,952,423.07
Total withdrawals 424,680,884.16 Adjustment for rate differences -32,728,220.03
Balances held by Treasury, Sept. 30, 1977 1,385,509,128.07
See footnotes at end of table.
Digitized for FRASER http://fraser.stlouisfed.org/ Federal Reserve Bank of St. Louis

368 1977 REPORT OF THE SECRETARY OF THE TREASURY
TABLE 96.—Summary of receipts, withdrawals, and balances of nonpurchased foreign currencies held by the U.S. Government, fiscal 1977—Continued
[In U.S. dollar equivalents]
Balances held by the Department of the Treasury, Sept. 30, 1977: Proceeds for credit to miscellaneous receipts of the general fund 900,952,417.54 Proceeds for credit to agency accounts: Commodity Credit Corporation, Agriculture 305,003.777.58 Other -2,859,713.40
For program allocations: Sec. 104, title I, Public Law 480, as amended 182,412,646.35
Total balances held by Treasury, Sept. 30, 1977 1.385.509.128.07
Balances held by other executive agencies Sept. 30, 1977, for purpose of: Program uses under Agricultural Trade Development and Assistance Act 69.537.741.41 Trust agreements with foreign countries 24,449,495.89 Economic and technical assistance under Mutual Security Act 999,944.33 American schools and hospitals 15,788,788.34
Total balances held by other executive agencies 110,775.969.97
Grand total. 1,496,285,098.04
'Collections under lend-lease and surplus property agreements will continue to be made until such agreements are satisfied, although the act originally authorizing such action has been repealed.
' Dollars acquired from the sale of foreign currencies are derived from charges against the dollar appropriations of the Federal agencies which use the currencies. These dollar proceeds are credited to either miscellaneous receipts or other appropriate accounts on the books of the Treasury.
NOTE.—For the purpose of providing a common denominator, the currencies of 72 foreign countries (see table 97) are herein stated in U.S. dollar equivalents. It should not be assumed that dollars in amounts equal to the balances shown are actually available. The dollar equivalents are calculated at varying rates of exchange. Foreign currencies deposited under certain provisions of Public Law 480 and the Mutual Security Act were converted at deposit rates provided for in the international agreements with the respective countries. Many of these currencies are available to agencies without reimbursement pursuant to legislative authority and, when disbursed to the foreign governments, will generally be accepted by them at the deposit of collection rates. The dollar equivalents bf currencies sold for dollars during the month were calculated at the prevailing market rates used to pay U.S. obligations. The closing balances were converted at the Sept. 30. 1977. reporting rates.
Additional data on foreign currency transactions appears in the Treasury publication "Foreign Currency Held by U.S. Government." The above figures exclude country-owned foreign currencies, generally called "counterpart funds."
Digitized for FRASER http://fraser.stlouisfed.org/ Federal Reserve Bank of St. Louis

STATISTICAL APPENDIX 369 TABLE 97.—Balances of nonpurchased foreign currencies held by the
U.S. Government, Sept. 30, 1977 In Treasury accounts In agency accounts
^ Foreign Dollar Foreign Dollar currency equivalent currency equivalent
Afghani -12,110,553.00 -270,626.88 12,110,553.00 270,626.88 Peso -380,651.00 -840.29 380,651.00 840.29 Dinar -6,044.52 -15,321.98 6,044.52 15,321.98 Taka 55,814.76 3.674.44 Dollar -30,169.45 -15.009.68 30,169.45 15.009.68 Peso -3,274,864.45 -160,690.11 3,274,864.45 160,690.11 Pula -2.621.70 -3.187.86 2.621.70 3.187.86 Cruzeiro -9.557.615.17 -648.413.51 9,557,615.17 648,413.51 Kyat 80,108,734.50 11.008,483.51 1.890.762.34 259.827.17 CFA Franc -14,370.00 -58.61 14.370.00 58.61 CFA Franc -53,436.00 -217.93 53,436.00 217.93 Peso -4,535.00 -204.10 4,535.00 204.10 N.T. Dollar -1,450,696.45 -38.226.52 1,450,696.45 38,226.52 Peso 5,839,069.55 158,713.49 129,791.73 3,527.91 Colon -312.493.58 -36.591.75 312,493.58 36,591.75 Koruna 7.161.557.00 994,660.69 Peso -73,961.80 -73,961.80 73,961.80 73,961.80 Sucre -70,052.39 -2,682.97 70,052.39 2,682.97 Pound 121,367,915.79 173,382,736.85 24,001,989.57 34,288,556.54 Birr —107,599.49 —52,385.34 107,599.49 52.385.34 Dollar —7,688.95 —8,455.90 7,688.95 8,455.90 Franc -1,256.98 -256.37 1,256.98 256.37 Dalasi -17,753.11 -7,845.14 17,573.11 7,845.14 DDR Mark. 32,042.69 2,584.09 D.Mark. 68,471.77 29,412.27 Cedi —55,388.18 —48,757.20 55,388.18 48,757.20 SyU 165,100,715.39 7,769,445.43 16,004,935.20 753,173.42 Lempira —17,803.87 —8,901.94 17,803.87 8,901.94 Rupee 6,708,944,974.62 795,684,750.60 163,372,306.09 18,865,162.37 Rupiah 789,359,575.00 1,904,365.68 251,635,634.00 607,082.35 Rial -2,061,639.00 -29,243.11 2,061,639.00 29,243.11 Pound 10,508,724.15 1,013,377.45 Lira 34,228,251.00 38,759.21 CFA Franc -398,215.80 -1,624.04 398.215.00 1,624.04 Dollar -11,070.94 -8,870.95 11,070.94 8,870.95 Yen..: 160.395.232.00 600,506.30 3,538,910.442.00 13.249.383.90 Shilling -1,274,149.32 -154,050.21 1,274,149.32 154,050.21 Cambodian Riel. 118,000,000.00 71,515.15 694,615,410.88 420.979.03 Won -199.249,408.00 -413,637.96 228,015,504.00 473,355.83 Kip —2,106,851.00 —10,640.66 2,106,851.00 10,640.66 Kwacha -27,836.76 -31,140.80 27,836.76 31,140.80 Ringgit -54,391.48 -22,074.46 54,391.48 22,074.46 Franc -827,223.00 -1,687.18 827,223.00 1,687.18 Dirham 35.603,697.46 7,831,873.62 1,248,060.52 274,540.37 Indian Rupee.... 5.000.000.00 577,367.21 10,971,128.78 1,266,873.99 Rupee 6,010,500.00 482,771.08 178,843,128.32 14,364.909.90 Cordoba -24,927.27 -3,561.04 24,927.27 3,561.04 Naira ' -19,995.66 -30,287.27 19,995.66 30,287.27 Rupee 1,695,668,616.92 171,279,658.27 92,235,095.03 9,316,676.27 Guarani -1,326,747.59 -10,166.65 1,326,747.59 10,166.65 Sol -8.52 - .11 8.52 .11 Peso -6,865,980.54 -927,835.21 6,865,980.54 927,835.21 Zloty 4,424,282,211.73 184,755,544.87 19,716,545.00 989.786.40 CFA Franc —114.827,752.00 —468,302.41 114,827,752.00 468,302.41 Leone -6,452.52 -5,635.39 6,452.52 5,635.39 Rand -63,534.58 -73,204.95 63.534.58 73.204.95 Peseta -277,776.00 -3,291.18 277,776.00 3,291.18 Rupee 7.931.514.37 1,054,301.43 Pound 464.880.13 1,168,040.54 453,984.38 1,140,664.27 Pound 5,602,682.00 1,439,538.03 20,980,000.00 5,390,544.71 Shilling.... -1,122,969.90 -135.264.98 1,122,969.90 135,264.98 Baht -661,081.83 -32,421.87 3,221,849.07 158,011.24 Dinar 7,589,593.18 17,799,233.55 135,928.64 318,782.00 Lira 3,101,618.15 161,123.02 2,692,355.75 139,862.64 Shilling —622,385.75 -76,021.22 622,385.75 76,021.22 CFA Franc -418.234.00 -1,705.69 418,234.00 1,705.69 Peso -38,813.43 -7,716.39 38,813.43 7,716.39 Piastre 306,325,300.00 405,728.88 2,982,067,494.06 3,949,758.27 Rial -17.525.25 -3.864.44 17.525.25 3,864.44 Dinar 183.284.171.80 10,126,197.34 13,671,586.90 755,336.29 Zaire —273,065.05 -324,845.42 273.065.05 324.845.42 Kwacha -17.947.56 -23.071.81 17.947.56 23.071.81
1.385,509,128.07 110,775.969.97
Country
Afghanistan Argentina Bahrain Bangladesh Barbados Bolivia Botswana Brazil Burma Cameroon Chad Chile China Colombia Costa Rica Czechoslovakia Dominican Republic... Ecuador Egypt Ethiopia Fiji Islands France Gambia Germany, East Germany, West Ghana Guinea Honduras India Indonesia Iran Israel Italy Ivory Coast Jamaica Japan Kenya Khmer Republic Korea Laos Malawi Malaysia Mali Morocco Nepal Nepal Nicaragua Nigeria Pakistan Paraguay Peru Philippines Poland Senegal Sierra Leone South Africa. Spain Sri Lanka Sudan Syrian Arab Republic Tanzania Thailand Tunisia Turkey Uganda Upper Volta Uruguay Vietnam Yemen Yugoslavia Zaire Zambia
Totai Digitized for FRASER http://fraser.stlouisfed.org/ Federal Reserve Bank of St. Louis
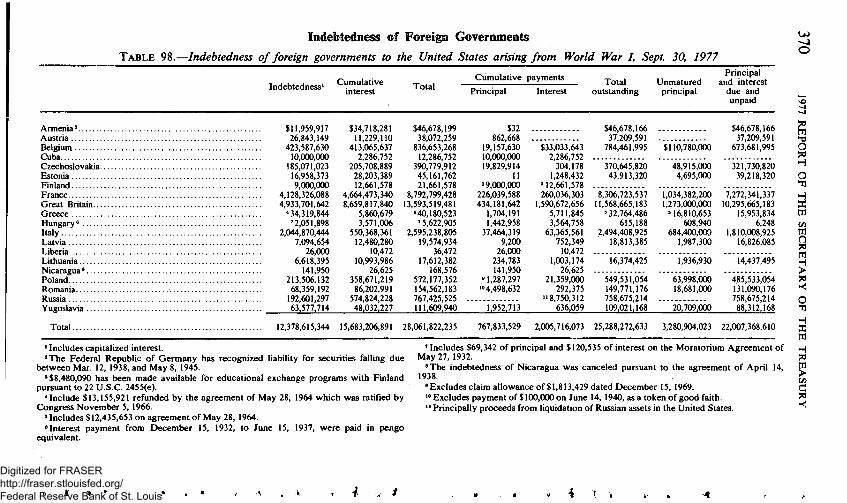
Indebtedness of Foreigii Governments T A B L E 98.—Indebtedness of foreign governments to the United States arising from World War I, Sept. 30, 1977
Indebtedness' Cumulative
interest Total Cumulative payments
Principal Interest
Principal Total Unmatured and interest
outstanding principal due and unpaid
O
Armenia' $11.959.917 Austria 26.843,149 Belgium 423,587,630 Cuba 10.000,000 Czechoslovakia 185,071,023 Estonia 16.958.373 Finland 9.000,000 France 4,128,326.088 Great Britain 4,933,701,642 Greece * 34,319.844 Hungary« '2,051.898 Italy 2.044.870.444 Latvia 7,094.654 Liberia 26.000 Lithuania 6,618.395 Nicaragua* 141.950 Poland 213,506,132 Romania 68,359,192 Russia 192.601.297 Yugoslavia 63.577.714
Total 12.378.615,344
$34,718,281 11.229,110
413.065,637 2.286.752
205.708.889 28,203,389 12.661.578
4,664.473,340 8,659,817,840
5.860.679 3.571,006
550.368.361 12.480.280
10,472 10,993.986
26.625 358,671.219 86.202.991
574,824.228 48,032^7
$46,678,199 38,072,259
836,653,268 12.286,752
390,779,912 45,161,762 21,661,578
8,792,799,428 13,593,519,481 * 40,180,523 '5,622,905
2,595.238.805 19.574,934
36,472 17,612,382
168,576 572,177,352 154,562,183 767,425,525 111,609,940
$32 862.668
19,157,630 10,000,000 19,829,914
11 3 9,000,00)
226,039,588 434,181,642
1,704,191 1,442,958
37,464,319 9,200
26,(X)0 234.783 141.950
' 1.287.297 "4.498.632
'l."9'5"2'.'713
$33,033,643 2,286.752 304,178
1.248.432 M2.661.578 260.036.303
1.590.672,656 5,711,845 3,564.758
63.365.561 752.349 10.472
1,003,174 26,625
21,359,000 292.375
"8,750.312 636.059
$46,678,166 37,209,591
784.461,995 $110,780,000
370,645.820 '' "48,'915,000 43.913,320 4.695.000
8,306,723,537 1,034,382,200 11,568.665,183 1,273,000,000
»32.764,486 M6,810,653 615,188 608,940
2,494,408.925 684.400.003 18.813.385 1.987,300
15.683.206,891 28,061,822.235 767,833.529
16.374.425 1,936,930
549.531.054 63,998.000 149,771,176 18,681,000 758,675,214 109,021,168 20.709.000
2,005.716.073 25,288.272.633 3,280,904,023
$46,678,166 37.209.591
673,681.995
321.730,820 39,218,320
7,272,341.337 10.295,665,183
15.953,834 6,248
1,810,008,925 16,826.085
14.437.495
485,533.054 131,090,176 758,675,214
88,312.168
22,(X)7,368.610
70
^ O 7i H O
H X
w n 70
> Ti >< O
H X W
H 73
^ in C 7i ><
' Includes capitalized interest. 'The Federal Republic of Germany has recognized liability for securities falling due
between Mar. 12, 1938, and May 8, 1945. ^$8,480,090 has been made available for educational exchange programs with Finland
pursuant to 22 U.S.C. 2455(e). * Include $13,155,921 refunded by the agreement of May 28. 1964 which was ratified by
Congress November 5, 1966. »Includes $12,435,653 on agreement of May 28. 1964. ® Interest payment from December 15, 1932, to June 15, 1937, were paid in pengo
equivalent.
'Includes $69,342 ofprincipal and $120,535 of interest on the Moratorium Agreement of May 27, 1932.
'The indebtedness of Nicaragua was canceled pursuant to the agreement of April 14, 1938.
'Excludes claim allowance of $1,813,429 dated December 15. 1969. '"Excludes payment of $100,000 on June 14, 1940, as a token of good faith. " Principally proceeds from liquidation of Russian assets in the United States.
Digitized for FRASER http://fraser.stlouisfed.org/ Federal Reserve Bank of St. Louis

TABLE 99.—Status of German World War I indebtedness, Sept. 30, 1977
mdebtedness _,„„^ ^ ^ ^ , , , p r i „e ipa ' n ^ ^ i ^ i ^ T - ' " " ' ' ' " ' " " ' " " " " • " " - " " " P - ^
Agreements as of June 23, 1930, and May 26. 1932:
Mixed claims (reichsmarks) ' 1,632.(X)0.000 1.174.530.000 2,806,530,(X)0 81,600,000 5,610,000 2,719,320,000 163,200,000 2,556,120,000
Army costs (reichsmarks) l,048,l(K),000 936,983,927 1,985,083,927 50,600,000 856,406 1,933,627,521 1,933,627,521
Total (reichsmarks) 2,680,100,000 2.111,513,927 4.791.613.927 132.200.000 6,466.406 4,652,947.521 163,200,000 '4,489,747,521
U.S. dollar equivalent^ $1.059,107.666 $851.013.889 $1.910.121,545 *$31,539,596 ^$2,048,214 $1,876,533.735 $65,818,560 $1,810.. 5,175
Agreement of Feb. 27, 1953, mixed claims (U.S. dollars) 97,500.000 97,500.000 93.500.000 4.000.000 4,000,000
' A g r e e m e n t of F e b . 27. 1953, p rov ided for cancel la t ion of 24 bonds total ing 489,600.000 dol lars as required by the debt and mora to r ium agreement , r e i chsmarks and issuance of 26 dol lar b o n d s total ing $97,500,000. T h e dol lar bonds ma tu re s ^ h e unpaid por t ion of this indebtedness is conve r t ed at 40.33 cents to the re ichsmark. serially o v e r 25 years beginning Apr . 1. 1953. All unmatured b o n d s a re of $4 million w h i c h was the exchange rate at the t ime of default. T h e 1930 agreement p rov ided for a denomina t ion . convers ion formula for payments relat ing to the t ime of payment . These figures are
' I n c l u d e s 4.027.612 re ichsmarks (1.529.049 on mora to r ium agreemen t ( A r m y costs) and est imates m a d e solely for this statistical repor t . 2,498,563 interest o n funded agreement ) deposi ted by G e r m a n G o v e r a m e n t in t he «Payments conve r t ed to U .S . dol lars at ra te applicable at the t ime of payment ; i.e., 40.33 Konvers ionskasse fur D e u t s c h e Aus landsschulden and not paid to the Uni ted States in or 23.82 cents to the re ichsmark.
c/5 H > H H n > r
>
z D
Digitized for FRASER http://fraser.stlouisfed.org/ Federal Reserve Bank of St. Louis
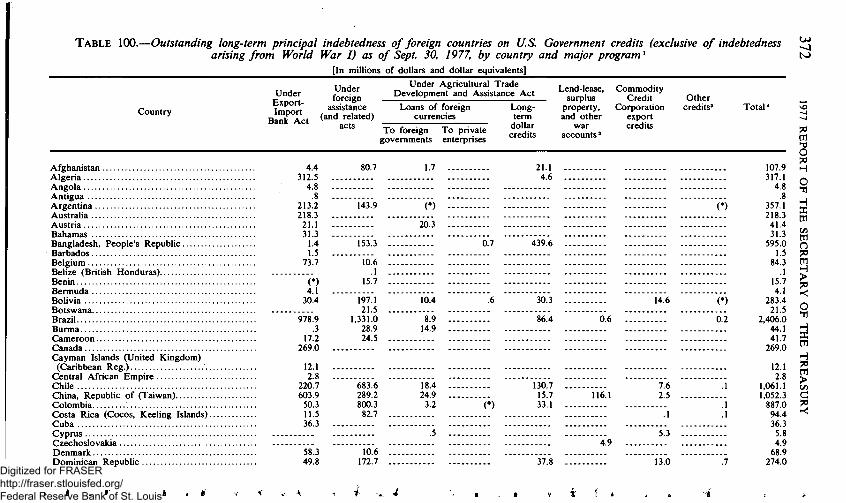
TABLE 100.—Outstanding long-term principal indebtedness of foreign countries on U.S. Government credits (exclusive of indebtedness arising from World War I) as of Sept. 30, 1977, by country and major program^
[In millions of dollars and dollar equivalents]
Country
Under Export-Import
Bank Act
Under foreign
assistance (and related)
acts
Under Agricultural Trade Development and Assistance Act
Loans of foreign currencies
To foreign goveraments
To private enterprises
Long-term
dollar credits
Lend-lease. surplus
property. and other
war accounts'
Commodity Credit
Corporation export credits
Other credits' Total*
70 cn ^ O 7i H
O
H X
c/3
n 7i W H > 7i
O ^ H X cn H 7i cn > c/3 a 7i
Afghanistan Algeria Angola Antigua Argentina Australia Austria Bahamas Bangladesh. People's Republic Barbados Belgium Belize (British Honduras) Benin Bermuda Bolivia Botswana Brazil Burma Cameroon Canada Cayman Islands (United Kingdom)
(Caribbean Reg.) Central African Empire Chile China. Republic of (Taiwan) Colombia Costa Rica (Cocos. Keeling Islands). Cuba Cyprus Czechoslovakia Denmark Dominican Republic
4.4 80.7 312.5
4.8 .8
213.2 143.9 218.3
21.1 31.3
1.4 153.3 1.5
73.7 10.6
"•"(*) 15:7 4.1
30.4 197.1 21.5
978.9 1,331.0 .3 28.9
17.2 24.5 269.0
12.1 2.8
220.7 683.6 603.9 289.2
50.3 800.3 11.5 82.7 36.3
"V8.3 16.6 49.8 172.7
1.7
(*) 20.3
21.1 4.6
0.7 439.6
10.4
8.9 14.9
18.4 24.9
3.2
30.3
( • )
14.6 (*) 86.4 0.6 0.2
(*)
130.7 15.7 33.1
116.1 7.6 2.5
5.3 4.9
37.8 13.0
107.9 317.1
4.8 .8
357.1 218.3
41.4 31.3
595.0 1.5
84.3 .1
15.7 4.1
283.4 21.5
2,406.0 44.1 41.7
269.0
12.1 2.8
1,061.1 1,052.3
887.0 94.4 36.3
5.8 4.9
68.9 274.0
Digitized for FRASER http://fraser.stlouisfed.org/ Federal Reserve Bank of St. Louis

Ecuador Egypt, Arab Republic of.....: El Salvador Ethiopia Finland France Gabon Gennany, Federal Republic of .. Ghana Greece Guatemala Guinea Guyana Haiti Honduras Hong Kong (United Kingdom)... Iceland India Indonesia Iran Iraq Ireland Israel Italy Ivory Coast Jamaica Japan Jordan Kenya Khmer Republic (Cambodia) Korea, Republic of Laos.. Lebanon Liberia Luxembourg Madagascar (Malagasy Republic). Malawi Malaysia Mah Malta Mauritania Mexico Morocco Mozambique
See footnotes at end of table.
9.1 30.1
5.8 6.0
46.9 . 150.7
17.9 76.0 . 38.6 30.3 19.5 15.6 6.6
20.7 7.3
37.8 . 6.6
89.6 401.3 642.2
1.3 . 9.4
152.1 237.4 . 47.7 62.8
759.6 . 11.2 8.8
302.5
39.1 17.2
.1
53.8
4.0 -565.2 41.5
1.9 .
99.7 268.6
73.8 . . . 124.8
.3 . . .
.4 . . .
127.1 496.7
92.7 . . . 7.0
56.1 . . . 10.7 . . . 76.6 . . .
2.7 2,774.5 . . .
472.4 . . . 42.5
36.4 . . . 2,899.0
6.7 31.4 . . .
124.5 64.1 . . .
773.7 . . . (•) --• 3.3 . . .
73.3 . . . .8 . . .
6.0 . . . 23.0 . . . 36.7 . . . 2.9 5.0 . . .
76.3 345.7
.1 . . . 192.2 . . .
.4 . . . 15.5 . . .
16.1 42.4
19.0 . . .
1.7 . . .
24.6 . . .
36.6
1.1 . . .
3.5 . . .
.2 . . .
3.7 . . . 41.4
2.5 .4
55.8
.1
1.0.
1.3
11 8 4643
55 . . .
29.8 . . . 8.3 . . .
1 42 7 . . .
.5 . . . 17.5 . . . 6.6 . . .
3.8 . . . 631 3 816.6
35.2 3.5 . . .
243.0 . . .
1.9 . . . 4.7 . . . 3 5
40.7 . . . 4 4 . . .
206.9 . . . 614.7
13.7 . . . 2.5
82.7 . . .
88.0 ..
1.8 -.
33.4 23.3 . .
17.9
15.1 . .
1.0 8.6 . .
•
92.3
39.0
230.3 . .
31 7 .
.1
40.0
.1
.2
.2
.1
10.0 »—3.2
7.2
( • )
121.8 963.8
79.6 136.7 62.4
279.0 18.3 77.8
214.1 670.5 112.5 84.3 63.2 49.1 90.6 37.8 14.8
3,561.2 1,759.5
767.8 4.8
45.8 3,330.8
237.4 57.4 98.9
770.3 179.9 77.3
206.9 1,940.1
" 56.1 108.1
.9 6.0
23.0 90.5
3.1 5.0 4.0
645.2 544.3
1.9
2 S ^ >
> 5 cn z u X
U)
Digitized for FRASER http://fraser.stlouisfed.org/ Federal Reserve Bank of St. Louis

TABLE 100.—Outstanding long-term principal indebtedness of foreign countries on U.S. Government credits (exclusive of indebtedness arising from World War I) as of Sept. 30, 1977, by country and major program^—Continued
^ [In millions of dollars and dollar equivalents]
Country
Under Export-Import
Bank Act
Under foreign
assistance (and related)
acts
Under Agricultural Trade Development and Assistance Act
Loans of foreign currencies
To foreign goveraments
To private enterprises
Long-term
dollar credits
Lend-lease, surplus
property, and other
war accounts'
Commodity Credit
Corporation export credits
Other credits' Total*
UJ
7i
cn 3 70 H O H X cn c/3 cn o 73 cn H > 73 >< O H X cn
cn > c/3 C 73
Nepal Netherlands Netherland Antilles . New Zealand Nicaragua Niger Nigeria Norway Pakistan Panama Paraguay Peru Philippines Poland Portugal Romania Rwanda Saint Lucia Saudi Arabia Senegal Sierra Leone Singapore Somalia South Africa Spain Sri Lanka (Ceylon) . Sudan Surinam Swaziland Sweden— Switzerland
.2 187.5
2.8 104.4
11.3 128.0 3.1
18.1 78.2 290.1 7.1
69.7 1,713.2 65.7 127.2
4.8 45.2 83.9 179.7
193.5 155.9 151.1 21.0 104.6 13.8 46.9
. . . . . .2
7.5 4.1
18.7 88.7
15.5
"811.6 17.9 2.4 25.3
14.8 11.9 3.2 .5
2.7 68.4 91.7
2.0
220.1 7.0 500.6
4.4 5.4 4.3
.2
.2
7.1 .1
79.9
55.8
(*) 1.9
151.6 9.4 4.9
91.3
2.4
.2 142.7
9.2
112.1 66.1
265.3 147.7 38.7
(•) .7
2.2
2.2 187^5
2.8 104.4 139.3
3.1 96.3
297.2 2,566.4
192.9 61.5
381.5 499.9 437.4 359.3
85.6 .2
7.5 5.0
21.1 88.7 16.1
982.0 180.2 43.0
3.7 2.7
68.4 91.7
^ ^
Digitized for FRASER http://fraser.stlouisfed.org/ Federal Reserve Bank of St. Louis
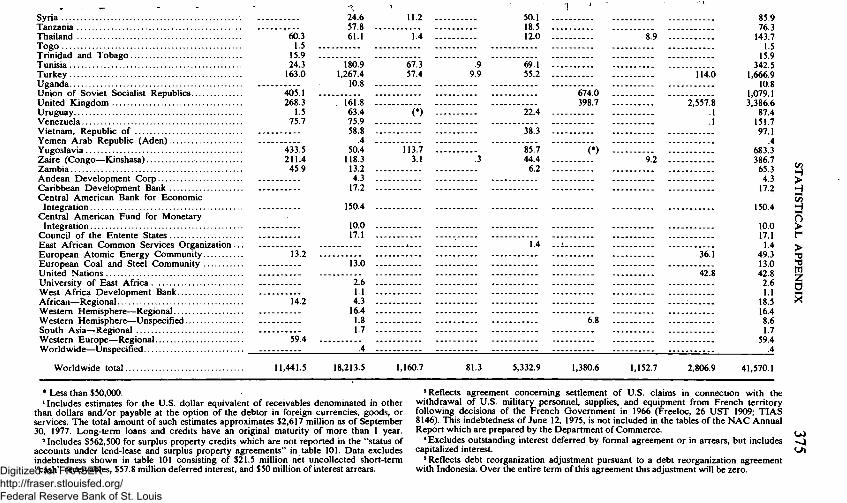
Syria Tanzania Thailand Togo Trinidad and Tobago Tunisia Turkey Uganda Union of Soviet Socialist Republics United Kingdom Uruguay Venezuela Vietnam, Republic of Yemen Arab Republic (Aden) Yugoslavia Zaire (Congo—Kinshasa) Zambia Andean Development Corp Caribbean Development Bank Central American Bank for Economic
Integration Central American Fund for Monetary
Integration Council of the Entente States East African Common Services Organization. European Atomic Energy Community European Coal and Steel Community United Nations University of East Africa West Africa Development Bank African—Regional Western Hemisphere—Regional Western Hemisphere—Unspecified South Asia—Regional Westera Europe—Regional Worldwide—Unspecified
Worldwide total
603 1.5 -
24.6 57 8 61.1
11.2 . . .
14 . .
50.1 -18.5 . 12.0 .
15.9 24.3
163.0
405 1 268.3
1.5 75.7
433.5 211.4 45.9
180.9 1,267.4
10 8
161.8 . . . 63.4 75.9 . . . 58 8
4 . . 50.4
118.3 13.2 . . . A '\
67.3 57.4
(*) ---
113.7 . . . 3.1
.9 9.9
.3
69.1 . 55.2 .
22.4 -
38.3 .
85.7 44.4 . 6.2 .
674 0 398 7
( • )
172
150.4
10 0 17 1 _. _ __ _- _ _. _
132 . 1.4 -
13.0
26 11 . _. _ _ . . _ . _ . . ._
14 2 4 3 . 16.4 . . 1.8 . . . 1 7 __
6.8
59.4 .4
8.9
114.0
2,557.8 .1 .1
9.2
36.1
42.8
85.9 76.3
143.7 1.5
15.9 342.5
1,666.9 10.8
1.079.1 3,386.6
87.4 151.7 97.1
.4 683.3 386.7 65.3
4.3 17.2
150.4
10.0 17.1 1.4
49.3 13.0 42.8
2.6 1.1
18.5 16.4 8.6 1.7
59.4 .4
!^ > H l-H C/3 H l-H
n > r > ^ 2
i X
11,441.5 18,213.5 ,160.7 81.3 5,332.9 1,380.6 1,152.7 2,806.9 41,570.1
• Less than $50,000. ' Includes estimates for the U.S. dollar equivalent of receivables denominated in other
than dollars and/or payable at the option of the debtor in foreign currencies, goods, or services. The total amount of such estimates approximates $2,617 million as of September 30, 1977. Long-term loans and credits have an original maturity of more than 1 year.
'Includes $562,500 for surplus property credits which are not reported in the "status of accounts under lend-lease and surplus property agreements" in table 101. Data excludes indebtedness shown in table 101 consisting of $21.5 million net uncollected short-term "cash" receivables, $57.8 million deferred interest, and $50 million of interest arrears.
'Reflects agreement conceraing settlement of U.S. claims in connection with the withdrawal of U.S. military personnel, supplies, and equipment from French territory following decisions of the French Goverament in 1966 (Freeloc, 26 UST 1909; TIAS 8146). This indebtedness of June 12, 1975. is not included in the tables ofthe NAC Annual Report which are prepared by the Department of Commerce.
* Excludes outstanding interest deferred by formal agreement or in arrears, but includes capitalized interest.
'Reflects debt reorganization adjustment pursuant to a debt reorganization agreement with Indonesia. Over the entire term of this agreement this adjustment will be zero. Digitized for FRASER
http://fraser.stlouisfed.org/ Federal Reserve Bank of St. Louis

TABLE 101.—Status of accounts under lend-lease and surplus property agreements (World War II), Sept. 30, 1977 ON
Credits
Country, etc.
Settlement obligation
and interest billed (net)
Status of amounts outstanding
Collections
U.S. dollars
Foreign currency (in U.S. dollar equivalent)
Other credits
Total outstanding Amounts
past due '
Due over a period ^ of years - J
by agreement "*
S s
::::::::::::: 3 O
^ ""$65^668,'5T9 d
'—3,584,436 g C/3
;;;;;;;;;;;; i 87,976,8'3'5 %
1,808,242 5 '—1,767 C
o ^
' " 33^405,716 H
cn ! ! !^! ! ! ' ;^;^ H
Ti 17,878,498 > 15,097,682 CO
C Ti
" " • ^
Australia $44,061,711 Austria 10,591,497 Belgium 117,118.010 Burma 6,708,049 Canada 388,765,008
China 198,624,223
Czechoslovakia 11, Denmark 5, Ethiopia 4, Finland 25, France 1,301, Germany, Federal Republic o f 224, Greece 72, Greenland Hungary 21, Iceland 4, India* 198, Indonesia 85, Iran. . . , 49, Iraq Italy 268, Japan 13, Korea 39, Liberia 19, Lebanon 1 Luxembourg Middle East 50, Netherlands 176, New Zealand 4,
$34,535,925 3,054,425
43,580.775 1,005,395
388,765,008
16,062,109
.415,223 596,731 ,240,273 4,266,935 ,558,958 3,899,523 ,169,113 22,200,172 ,157,060 1,110,337,689 ,655,098 4,091,510 ,203,796 41,703,907
8,351 8,351 ,710,868 ,855,981 4,496,553 ,174,371 184,777,327 ,083,234 47,007,871 ,000,310 3,782,002
54 54 ,135,731 166,324,766 ,728,410 ,510,761 902,594 4,342,937 ,656,638
120 120 ,377,090 11,142.267 .,795,845 103,219,747 ,935,288 2,176,363
$8,662,269 6,980,265 12,196,413 5,560,577
1,591,796
1,062,961 931,000 23,621
2,271,136 51,445,798
218,755,345 29,344,893
"l9,"892V8'66 359,428
13,109,090 3,765,000 9,635,795
'98,269,394 12,971,483 17,524,308
'521,819
"39,'2'3'4.'8'2'3 45,192,686 2,114,004
$863,517 556,807
61,340,822 142,077
8,521,771
1,990,966 42,338
635,814 697,805
51,402,738
"i,'l'5'6,'7'6'3
1,818,002
' "2'8'7,'9'5'4 904,647
3,541,571 756,927
4,107.955 461,974
1,134,819
28,383,412 644,921
$172,448,547^ a—3,584,436/
7,764,565
87,970,835. 1,808,242 '—1,767
»33,405,716 35,582,513
17,878,498 15,097,682
$107,440,028
7,764,565
35,582,513
Digitized for FRASER http://fraser.stlouisfed.org/ Federal Reserve Bank of St. Louis

Norway 21,277,848 11,262,135 8,435.075 1,580,638 Pakistan 40,308,976 40,308,976 Philippines 5,000,000 2,005,855 2,988,159 5,986 5,986 Poland 51,104,064 40.718,320 10,385,744 Saudi Arabia 21,427,120 21,427,120 Southem Rhodesia • 1,415,511 1,371,932 43,579 43,579 Sweden...: 2,115,456 240,690 1,824,653 50,113 Thailand 7,064,989 2,235.736 4,178,322 650,931 Turkey 14,474,333 11,082,482 2,110,714 1.281,137 Union of South Africa 117,774,298 116,608.623 242,488 923.187 United Kingdom 1,212,7(X),034 560,814,358 40,792,980 154,635.336 456,517,360 «456,517,360 U.S.S.R 978,689.250 246,789,250 57,900,000 674,000,000 674,000,000 Yugoslavia 709,942 63,377 16,300 623,065 7,200 7,200 American Republics 136,685,117 114,365,405 11,921.130 3.154,183 7,244.399 494,399 '6,750,000 American Red Cross 2,023,387 2,023,387 Federal agencies 243,114,726 243,092,796 21,930 Military withdrawals 187,630 649 186,981 2 Miscellaneous items 1,472,077 1,136,573 335,504 > United Nations Relief and Rehabilitation H
Administration 7.226,762 7.226,762 5 H
Total 6.208.975,185 3.622.147,033 683,874,446 393,180.349 1,509,775,122 151,325,084 1,358,450,038 o . >
'Principal and interest past due as of Sept. 30, 1977, and items subject to negotiation. 1971, and interest on principal beginning June 11, 1985, respectively. ^ ' Credit. Represents amounts collected under advance payment agreements not applied to * Includes $103,543,802 principal and interest postponed pursuant to agreement. >
outstanding indebtedness. ' Represents amount which is postponed by agreement pending settlement of certain ^ ' Reduced due to settlement of a third party claim. claims. frl * Agreement provides for repayment of 36,913,235 rupees. Z "Agreement dated Mar. 16, 1971, provides for payment of principal and interest on 2
deferred principal semiannually on June 11 and Dec. 11 ofeach year beginning June 11, X
U )
Digitized for FRASER http://fraser.stlouisfed.org/ Federal Reserve Bank of St. Louis

Corporations and Other Business-Type Activities of the Federal Govemment TABLE 102.—Comparative statement of securities of Government corporations and other business-type activities held by the Treasury,
June 30, 1968-76, and Sept. 30, 1976-77 [Face amount, in millions of dollars. Basis: Daily Treasury Statement through 1974; Monthly Treasury Statement of Receipts and
Outlays of the U.S. Goverament thereafter]
Agency 1968 1969 1970 1971 1972 1973 1974 1975 1976 T.Q.
Agency for Intemational Development Bonneville Power Administration Commodity Credit Corporation Export-Import Bank of the United States Federal Financing Bank Federal Home Loan Board Federal Housing Administration: General insurance fund Special risk insurance fund
Federal National Mortgage Association, secondary market operations
Goverament National Mortgage Association: Emergency home purchase assistance fund Management and liquidating functions Special assistance functions
Health, Education, and Welfare Department: Commissioner of Education, student loan insurance fund
Rural Electrification Administration Rural Telephone Bank Saint Lawrence Seaway Development Corporation Secretary of Agriculture. Farmers Home Administration: Rural housing direct loan account Direct loan account' Rural housing insurance fund Agricultural credit insurance fund' Rural development insurance fund'
Secretary of Commerce: National Oceanic and Atmospheric Administration. Federal ship financing fund, fishing vessels
638
'11.989 362
57
988 906
4.770
" ' l29
663 598 24
169
544 512
12.115 12.262 720 1.586
10 10
1.028 1,002 1,399 2,130
5,045 5,328
" l 3 3 'l'3'3
556 --598 598 65 556
364 263
451
"il','9'7'7 783
416
11,501 1,743
374
"l'o','864 1,888
327
""8^608 2,457 602
233
5,046 207
13,466 1,247
2,840 11
22,413 1,534
3,556 73
25,884 1,491
137 86
383 282
""'9'50 • 2,602
'"5.V46
l"30
"""'5"9'8 556 237
" " 6 8 1 3.100
"'6^051
'"'127
598 556 452
831 810
1,307 1,155
80 75 2,972 3,058
15 6,563 6,963
49 123 121
556 1,481 676 676 379 389
(•)
2,037 1,640
505 58
4,850
556 676 250
2,727 1,939
1,562 58
4,503
756 676 285
2;847 2,031
941 58
4,909
7,409 132 120
7,512 191 118
7,409 201 118
1977
125 6,128
3 35,418
1,912 1,617
716 50
4,142
7,865 234 116
831 676 360
856 676 390
u> 00
7i cn s o H X cn cn
[^ Ti
> 73
O
H X cn H 70 cn > c/3 a 70
«,L_ >, . ^ :a.
Digitized for FRASER http://fraser.stlouisfed.org/ Federal Reserve Bank of St. Louis
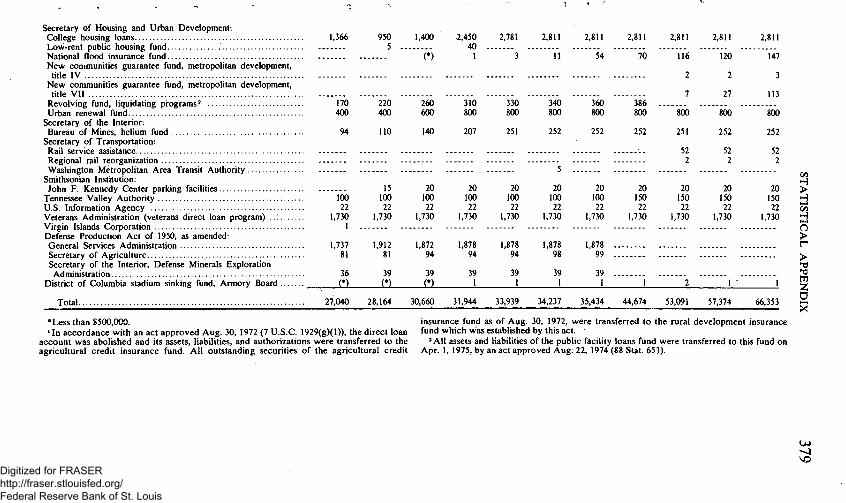
Secretary of Housing and Urban Development: College housing loans Low-rent public housing fund National flood insurance fund New communities guarantee fund, metropolitan development, title IV
New communities guarantee fund, metropolitan development, title VII
Revolving fund, liquidating programs' Urban renewal fund
Secretary of the Interior: Bureau of Mines, helium fund
Secretary of Transportation: Rail service assistance Regional rail reorganization Washington Metropolitan Area Transit Authority
Smithsonian Institution: John F. Kennedy Center parking facilities
Tennessee Valley Authority U.S. Information Agency Veterans Administration (veterans direct loan program)...:.... Virgin Islands Corporation Defense Production Act of 1950, as amended: General Services Administration Secretary of Agriculture Secretary of the Interior, Defense Minerals Exploration Administration
District of Columbia stadium sinking fund. Armory Board —
Total
1,366
170 400
94
100 22
1.730 I
1,737 81
36 (*)
950 1.400 5
(•)
220 260 400 600
110
15 100 22
1.730
1,912 81
39
2,450 2,781 40
1 3
"310 ' " ' 3 3 0 800 800
2.811
" l l
2.811
" "54
2.811
""70
140 207 251
340 800
252
360 800
252
386 800
252
20 100 22
1,730
20 1(X) 22
1.730
20 100 22
1.730
5
20 100 22
1.730
2,811
"l ' l '6
2
7
SCK)
251
52 2
2.811
120
2
27
"soo
252
52 2
1.872 94
39
1.878 94
39 1
1.878 94
39 1
1,878 98
39 I
20 20 1(X) 150 22 22
1,730 1.730
1.878 99
39 1 1
20 150 22
1,730
20 150 22
1,730
I
2,811
"'147
3
113
800
252
52 2
20 150 22
1.730
c/3
H c^ H
n > r > cn Z
27.040 28.164 30,660 31,944 33.939 34.237 35.434 44,674 53,091 57,374 66,353 2
1
*Less than $5(X),000. ' In accordance with an act approved Aug. 30, 1972 (7 U.S.C. 1929(g)(1)). the direct loan
account was abolished and its assets, liabilities, and authorizations were transferred to the agricultural credit insurance fund. All outstanding securities of the agricultural credit
insurance fund as of Aug. 30. 1972, were transferred to the rural development insurance fund which was established by this act.
' All assets and liabilities of the public facility loans fund were transferred to this fund on Apr. 1. 1975. by an act approved Aug; 22. 1974 (88 Stat. 653).
Digitized for FRASER http://fraser.stlouisfed.org/ Federal Reserve Bank of St. Louis
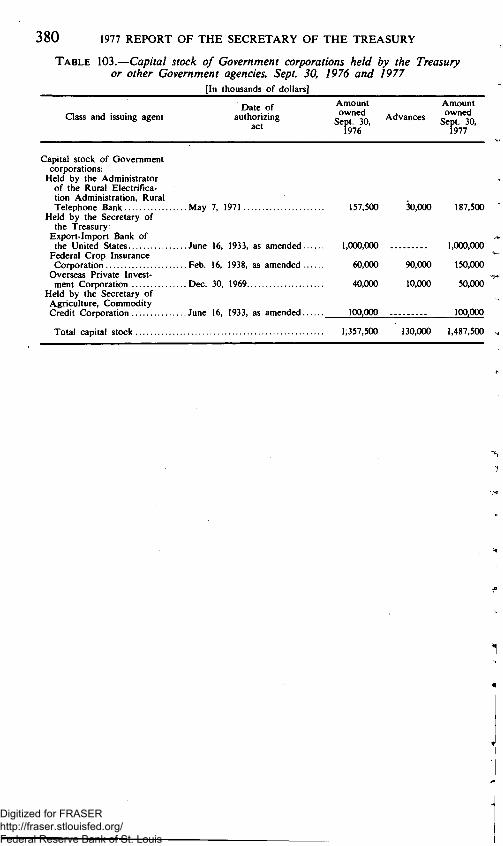
380 1977 REPORT OF THE SECRETARY OF THE TREASURY
TABLE 103.—Capital stock of Government corporations held by the Treasury or other Government agencies, Sept. 30, 1976 and 1977
[In thousands of dollars]
Amount Amount
Class and issuing agent authorizing SeDt"^30 Advances Se^"^30 Date of
horiz act 1976 1977
Capital stock of Goverament corporations:
Held by the Administrator of the Rural Electrification Administration. Rural Telephone Bank May 7, 1971 157,500 30,000 187,500
Held by the Secretary of the Treasury:
Export-Import Bank of the United States June 16, 1933, as amended 1,000,000 1,000,000
Federal Crop Insurance Corporation Feb. 16, 1938, as amended 60,000 90,000 150,000
Overseas Private Investment Corporation Dec. 30, 1969 40,000 10,000 50,000
Held by the Secretary of Agriculture, Commodity Credit Corporation June 16. 1933. as amended 100,000 100,000
Total capital stock 1,357,500 130,000 1,487,500
Digitized for FRASER http://fraser.stlouisfed.org/ Federal Reserve Bank of St. Louis

TABLE 104.—Status of congressional authorizations to borrow from the Treasury, with borrowings handled as public debt transactions, fiscal year 1932 to date
[In millions of dollars]
Fiscal year
Borrowing authorizations due to congressional action'
Increase Decrease
Borrowings'
Borrowings and other advances
from Treasury
Net borrowings
from the public»
Repayments'
Restoring Nonrestoring
Borrowings ffom the Treasury
Note cancellations
Borrowings from the Treasury
Borrowings from the public'
Note cancellations
Unused authority
at end of year
Borrowing outstanding at end of year
Due Treasury
Due others
1932 1,500.0 1933 3,022.4 1934... . 7,384.1 1935 1,909.0 1936 60.0 1937 7.1 1938 1,310.4 1939 458.7 1940 644.1 1941 3,537.4 1942 11.525.0 1943 143.5 1944 447.7 1945 2,055.0 1946 8,229.0 1947 3,750.0 1948 5,485.0 1949 2,588.3 1950 6.491.0 1951 4.298.7 1952 4,432.4 1953 1,498.6 1954 2,874.2 1955 4,062.6 1956 3,091.2
See footnotes at end of table.
400.0
47.4 93.1
199.8 242.7
86.9
54.6 225.7 200.0 217.1 357.7
3,239.8 18,633.6
107.7 1,211.9 2,876.6
" '94.'3 1,219.2 1,323.2
211.6
350.0 1,235.0 1,670.0
825.0 865.0 227.0 345.0 426.3 641.8 798.2
4,178.3 6,969.0 7,615.0 4,149.0 3.553.1 7,346.6 5,505.0 5,851.0 4,031.7 3,780.6 2.739.2 4,420.4 5.398.4 6.295.9 5.273.1
680.8 3.441.9 425.0
595.3 490.0 —53.5 627.0
187.7 401.0 596.0 1,015.0 73.1 796.7
831.5 592.4 -1,806.1 395.9
—470.5 3,487.0 -2,335.3 4.414.0 -1.267.3 2.697.0
—182.6 3.216.3 —244.3 1.707.9
—4.8 2.560.6 —27.5 1.579.9
—9.5 2,260.5 —.4 2,904.9 —.1 1,574.4 —.1 1,498.8 - . 1 - 3,518.8
570.3 2,633.7 (*) 1,122.3
(•) 1.563.3
10.048.9 70.1
.2 66.7
454.2 196.8 956.8
5.8
0.3 224.5 139.4 198.6 205.0 217.3 209.7 224.7 305.1 319.8
2.691.3 20.6 14.1 8.4 5.4
41.5 2.9
.5
.6
.2 0.9 128.2
.4
.3
.2
'l 5.0
1.150.0 2.537.4 7,570.7 4,590.4 4,586.9 4.847.8 5.783.8 6.235.2 6.874.3 9.374.4
18.868.4 15.774.7 15.156.8 16,810.0 24.527.1 21,206.2 15,166.8 13,473.8 16,991.4 17,604.9 21,326.7 20,006.2 20,738.4 19,245.2 17,979.9
350.0 1,585.0 3,255.0 3,655.0 4.030.0 3.630.0
882.7 273.3 104.3 301.7
4.078.7 7.519.1
10.717.3 12.168.7 12.504.9 16.579.8 9.122.7
13.184.3 14.756.8 15.360.7 15.854.1 18.396.3 19.067.4 22.419.4 26.244.6
680.8 4.122.7 4.718.0 4.664.2 4.852.5 5.418.2 5.521.3 6.352.8 4.546.7 4.076.2 1.740.9
473.6 291.0
46.7 41.0 12.9 2.7 1.9 1.6 1.2 l.l
571.3 571.2
C/3
H (n H O > r > cn z a
oo Digitized for FRASER http://fraser.stlouisfed.org/ Federal Reserve Bank of St. Louis

TABLE 104.—Status of congressional authorizations to borrow from the Treasury, with borrowings handled as public debt transactions, fiscal year 1932 to date—Contmued
[In millions of dollars]
U> OQ
Fiscal year
Borrowing authorizations due to congressional ac t ion '
Borrowings ' Repayments '
Restoring Nonrestoring
Increase Decrease
Borrowings and other advances
from Treasury
Net borrowings
from the publ ic '
Borrowings from the Treasury
Note cancellations
Borrowings Borrowings Note from the from the cancel-Treasury publ ic ' lations
Unused authority
at end of year
Borrowing outstanding at end of year
Due Treasury
Due others
po cn
O po H O »n H X cn c/3 cn o po
> T3
O
H X cn H 73 cn > c/3 C 73
1957. 1958. 1959. 1960. 1961. 1962. 1963. 1964. 1965. 1966. 1967. 1968. 1969. 1970. 1971. 1972. 1973. 1974. 1975. 1976. T.Q.. 1977.
Total
5.104.5 5.703.1 5.459.3 1.082.2 3.889.2 1.567.5 976.9
1.016.1 1.049.8 979.5
1.204.3 1.586.7 1.930.8 6,242.7 11,870.7 1,141.2 1,882.9 4,256.7 23,060.4 5,107.9 11,947.1 11,659.7
206.5 647.5 246.2 475.4 799.5 42.0
243.3 479.5 674.9 632.4
481.1 579.9 9.6
6,077.7 (*) 7,301.7 233.4 9.958.7 —6.4 6,733.6 (*) 7.553.5 —797.3 8.323.6 (*) 8,456.4 (*) 7,197.9 7,450.0 8.953.8 9,403.0 12,628.9 13.449.9 12.450.7 11.227.9 11.673.0 10.710.7 12.253.9 47.051.0 26.639.6 7.714.2
29.982.0
3.034.2 (•) 7.842.5 4.727.5 6.075.1 6.776.7 5.498.0 7.470.6 6.915.1 8.141.0 10.062.1 11,540.9 9.940.4 12,107.4 9.743.5 9.695.8 9,445.0 10,364.9 10,975.6 35.699.6 17.603.2 3.430.3
20.991.7
328.4 327.9 422.7 417.9 438.8 256.3 503.4 325.4 248.6 190.0 274.9 299.0 381.6 274.7 312.4 299.2 114.6 149.8 166.2 691.2
1.0 11.0
0.1
(*) .1 .1
(*) (*) (*) (*) (*) (*) (*) (*) (*) (*) (*) (•) (*) ^-(*) . . . . . . . . . (*) 2,014.9 (*) (•) (*)
19,834.4 25,197.4 25,185.7 25,134.0 28,244.2 26,944.2 26,692.0 26,945.7 28.011.7 29.467.1 32.809.3 31.226.5 31.234.8 34.760.7 45.099.4 44.012.6 45,549.7 48,528.0 60,237.0 56,308.4 63.971.7 66.641.1
28.959.7 28.091.0 32.899.5 33,140.2 33,478.2 36,047.5 36,529.9 36,487.3 35,547.6 34,249.4 31,836.6 34,225.9 35,186.8 37,619.3 38,838.9 40,767.6 40,998.9 42,127.4 51,297.6 59,642.8 63,925.8 72,905.0
189,524.6 36,560.7 367,681.3 4.2 268,000.2 13,362.8 8,479.4 4.0 4,933.6 66,641.1 72,905.00
571.1 804.5 798.0 797.9
.5
.5
.5
.4
.4
.4
.4
.4
.4
.4
.3
.3
.3
.3
.3
.3
.3
.3
•Les s than $50,000. ' In cases w h e r e the amoun t s of congress ional author izat ions have been indefinite, the net
a m o u n t of t ransact ions in the year genera l ly represents the increase or decrease in b o r r o w i n g au thor i ty . In addi t ion to au thor i ty to b o r r o w from the Treasury , some agencies also receive au thor i ty to b o r r o w from the public , usually under the same provision of law.
' Exc ludes refundings. ' A m o u n t s represent t ransact ions under the combined au thor i ty to b o r r o w ei ther from the
Secre ta ry of the T reasu ry or the public, and d o not represent the total bo r rowings from the public unde r o the r provisions of law.
Digitized for FRASER http://fraser.stlouisfed.org/ Federal Reserve Bank of St. Louis
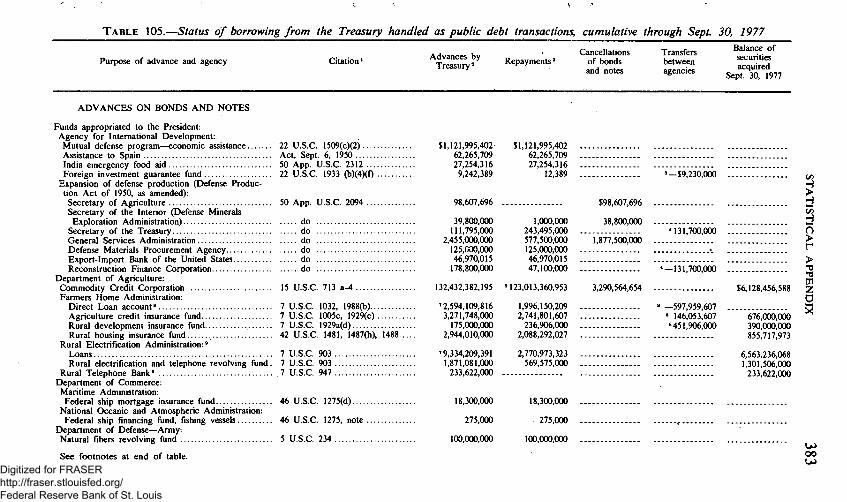
TABLE 105.—Status df borrowing from the Treasury handled as public debt transactions, cumulative through Sept. 30, 1977
Purpose of advance and agency Citation' Advances by Treasury' Repayments'
Cancellations of bonds and notes
Transfers between agencies
Balance of securities acquired
Sept. 30, 1977
ADVANCES ON BONDS AND NOTES
Funds appropriated to the President: Agency for Interaational Development: Mutual defense program—economic assistance Assistance to Spain India emergency food aid Foreign investment guarantee fund
Expansion of defense production (Defense Production Act of 1950, as amended):
Secretary of Agriculture Secretary of the Interior (Defense Minerals Exploration Administration)
Secretary of the Treasury General Services Administration Defense Materials Procurement Agency Export-Import Bank of the United States Reconstruction Finance Corporation
Department of Agriculture: Commodity Credit Corporation Farmers Home Administration:
Direct Loan account * Agriculture credit insurance fund Rural development insurance fund Rural housing insurance fund
Rural Electrification Administration:^ Loans Rural electrification and telephone revolving fund.
Rural Telephone Bank^ Department of Commerce: Maritime Administration: Federal ship mortgage insurance fund
National Oceanic and Atmospheric Administration: Federal ship financing fund, fishing vessels..
Department of Defense—Army: Natural fibers revolving fund
See footnotes at end of table.
22 U.S.C. 1509(c)(2) Act, Sept. 6, 1950 50 App. U.S.C. 2312 .. . . 22 U.S.C. 1933 (b)(4Xf) •
50 App. U.S.C. 2094 .
do do do do do do
15 U.S.C. 713 a-4.
7 U.S.C. 1032, 1988(b) 7 U.S.C. 1005c, 1929(c) 7 U.S.C. I929a(d) 42 U.S.C. 1481, 1487(h). 1488.
7 U.S.C. 903 . 7 U.S.C. 903 . 7 U.S.C. 947 .
46 U.S.C. 1275(d)
46 U.S.C. 1275. note .
5 U.S.C. 234
$1,121,995,402 62.265,709 27,254,316 9,242,389
98,607,696
39,800.000 111,795,000
2,455,000,000 125,000,000 46,970,015 178,800,000
132,432,382,195
'2,594,109,816 3,271,748,000 175,000,000
2,944,010,000
'9,334,209,391 1,871,081,000 233,622,(X)0
18,300,000
275,000
100,000,000
$1,121,995,402 . 62,265,709 . 27,254,316 .
12,389
1.000,000 243,495,000 . 577.500.000 125.000,000 . 46,970,015 47,100,000 .
M23.013,360.953
1.996,150,209 2.741.801,607 236.906,000 .
2,088,292,027
2,770,973,323 . 569,575,000 .
18,300,000 .
275,000 .
100,000,000 .
$98,607,696
38.800,000
1,877,500,000
3.290.564.654
'—$9,230,000
""""*'i3i."7"66."0(K)
^
*—131,700,(K)0
« —597,959.607 « 146.053.607 «451.906.000
$6,128,456,588
676,000.000 390.000.000 855.717.973
6,563.236.068 1,301,506.000 233.622.000
% 2! n > r > ^ cn
X
u> oo UJ Digitized for FRASER
http://fraser.stlouisfed.org/ Federal Reserve Bank of St. Louis

TABLE 105.—Status of borrowing from the Treasury handled as public debt transactions, cumulative through Sept. 30, 1977—Continued ^
Purpose of advance and agency Citat ion ' Advances by
Treasu ry ' Repayments '
Cancellations of bonds and notes
Transfers between agencies
Balance of securities acquired
Sept. 30. 1977
A D V A N C E O N B O N D S A N D NOTES—Con.
Department of Health, Education, and Welfare: Office of Education:
Student loan insurance fund 20 U.S.C. Department of Housing and Urban Development:
Office of the Secretary: College housing loans 12 U.S.C. Low-rent public housing 42 U.S.C. National flood insurance fund 42 U.S.C. N e w communities guarantee fund, title IV 42 U.S.C. New communities guarantee fund, title VII 42 U.S.C. Prefabricated housing loans 12 U.S.C. Public facility loans . . . 42 U.S.C. Revolving funds, liquidating programs. Act.
Aug. 22, 1974 Urban renewal fund 42 U.S.C.
Federal Housing Administration: General insurance fund 12 U.S.C. Special risk insurance fund do .
F ^ e r a l National Mortgage Association: Secondary market operations 12 U.S.C.
Government National Mortgage Association: Emergency home loan program Act, Oct. Management and liquidating functions 12 U.S.C. Special assistance functions 12 U.S.C.
Department of the Interior: Bonneville Power Administration 16 U.S.C. Bureau of Commercial Fisheries:
Federal ship mortgage insurance fund, fishing vessels 46 U.S.C.
Bureau of Mines: Helium fund 50 U.S.C.
Virgin Islands Corporation (liquidated) 48 U.S.C; Department of Transportation:
Rail service assistance 45 U.S.C. Regional rail reorganization 45 U.S.C. Saint Lawrence Seaway Development Corporat ion. . . 33 U.S.C.
1081.
1749(d)(e). . . 1403, 1420. . 4016(a) 3906. . 4518(b) 1701g, n o t e . 1943(a)
1452(e)(0.
1735d(b)..
1719(c).
18, 1974. 1721(d).. 1720(d)..
838k.
1275, note .
167j 1047c(p).
664(a) . 720(e) . 9 8 5 . . . .
$27,000,000
7,906,075,000 4,897,000,000
197,227,746 3,357,714
113,077,772 36,170,297
570,040,900
1,424,005,000
2,992,268,000 2,031,000.000
14.190,992,352
3,599,784,000 8,193,936,293
13,659,736,862
125,000,000
400,000
" 252,650,000 1,225,000
52,479,300 250,279,306 133,800,000
$27,000,000
5,095,075,000 4,891.178.628 $5,821,372
49,776,790
""27,'78V,8"l6 8,"3'8"4,4"8"l l ! ! ! ] ! " . ! ! " . " . ! " " . 184,540,900 '»—$385,500,000
385,500,000 '«> 385,500,000 624,005,000
1,080,613,000 413,834,000
14,190,992,352
2,883,470,000 8,235,704,466 9,518,234,862
400,000
" 1,000,000 1,225,000
247,'8"7"6,917 17,323,949
" 91,768,172
73
cn s 73 H
$2,811,000,000 §
147,450,956 d 3,357,714 X
113,077,772 C/D
:::::::::::::: ^ 7i cn
800,000,000 ^
1,911,655.000 2? 1.617.166.000
H X cn H 70
c/3 C 73 ^
251.650,000
52,479,300 2.402.390
116.476,051
716,314,000 50,000,000
4,141,502,000
125,000.000
Digitized for FRASER http://fraser.stlouisfed.org/ Federal Reserve Bank of St. Louis

1823.
635d.
Department of the Treasury: Office of the Secretary:
Federal Civil Defense Act of 1950. 15 U.S.C. 606; 50 App. U.S.C. as amended 2261 note
Federal Fa rm Mortgage Corporation (in liquidation) 12 U.S.C. 1020c Reconstruction Finance Corporation (liquidated) 15 U.S.C. 606
Veterans Administration: Veterans'^Administration (Veterans direct loan
program) 36 U.S.C. Other independent agencies:
Export-Import Bank of the United States:'* Regular activities 12 U.S.C. Liability transferred from the Reconstruction
Finance Corporation 15 U.S.C. 609. note. Federal Home Loan Bank Board:
Federal home loan banks 12 U.S.C. Home Owners ' Loan Corporation Hquidation fund.. 12 U.S.C.
Small Business Administration: Liability transferred from the Reconstruction
Finance Corporation 15 U.S.C. 609. note. , Smithsonian Institution:
John F . Kennedy Center parking facilities Act. Jan. Tennessee Valley Authori ty 16 U.S.C. U.S. Information Agency:
Information media guarantee fund 22 U.S.C. 1442(b).. Washington Metropolitan Area Transit A u t h o r i t y . . . . Act, July 13, 1972.
District of Colurnbia: District of Columbia, stadium sinking fund, Armory
Board Act, July 28, 1958. Federal Financing B a n k " . . . . . 12 U.S.C. 2288(b). .
1431(i).. 1463(c).
23, 1964. 831n-3 . .
Total advances on bonds and notes .
C A P I T A L S T O C K A N D F O R E I G N L O A N S
Subscriptions to capital stock: Export-Import Bank of the United States '" 12 U.S.C. 635(b) Federal National Mortgage Association—secondary
market operations 12 U.S.C. 17l8(dXe). Intemational Bank for Reconstruction and
Development 22 U.S.C. 286(e) Interaational Finance Corporation 22 U.S.C. 282(e) Intemational Monetary Fund 22 U.S.C. 286(e)
Foreign loans: Credit of the United Kingdom 22 U.S.C. 286
Total capital stock and foreign loans..
Grand total
491,029 988,800,000
26,613,539,957
1,733,055,599
28,708.358.010
1.574.500.000 2.321,000,000
20,400.000 416.772.500
22.393.170 4,505.100
10.520,000 79.118,222,034
2,305,000 988,800,000
13,615.743.334
2,977,603
28,705,034,759
42,000,000
1,574,500,000 2,192,827.891
13.550,160
"266,772,560
9,509,170 4,505,100
9,688,400 43.699,939.868
'* 1.813,971
12,848.664.319 » —149.132.303
12(8.172.109
" 42.000.000
" 13.550.160
'9.230.000
1,730,077,996
3,323,252
• C/3
^ H cn H
20,400,000 O 150,000,000 >
r 22.114.000 ;>
*T3
cn 831.600 2
35,418,282,166 ^ 359,441,530,870 274,791,917,415 18,296,514,631
999,000,000
285,640,610
635,000,000 35,168,000
" 2,325,000,000
285,640,610
3.750,000.000 " 1.192.237.697
8.029.808.610 1.477.878.307
66.353,098.823
999.000.000
635.000,000 35.168.000
2.325.000.000
2,557,762,303
6.551.930.303 ^
367.471,339,480 276,269,795,722 0 18,296,514,631 72,905,029.126 ^
F o o t n o t e s o n fo l lowing page . Digitized for FRASER http://fraser.stlouisfed.org/ Federal Reserve Bank of St. Louis

' Reflects current citations. For detail analysis of prior authorizations, see table 7 of fiscal year 1973 Combined Statement of Receipts. Expenditures and Balances ofthe United States Government.
'Excludes refundings handled as public debt transactions amounting to $269,986,931,952 through Sept. 30, 1977, and exchange of notes.
'Represents obligations transferred from the Agency for International Development to the U.S. Information Agency in accordance with section II of an act approved July 18, 1956 (70 Stat. 563).
* Transferred from the Reconstruction Finance Corporation to the Secretary of the Treasury pursuant to an act approved July 30, 1953 (67 Stat. 230), and Executive Order No. l0489ofSept. 26, 1953.
'Appropriations made by the Congress for restoration of capital impairment to the Commodity Credit Corporation amounting to $56,423,436,967 through Sept. 30, 1977, have been used principally for repayments of advances made by the Department of the Treasury.
*In accordance with an act approved Aug. 30, 1972 (86 Stat. 661), the direct loan account was abolished and its assets, liabilities, and authorizations were transferred to the agricultural credit insurance fund.
'Includes advances on Rural Electrification Administration notes of $510,848,904 and advances on Farmers Home Administration notes of $40,367,816 made by the Reconstruction Finance Corporation. Pursuant to an act approved July 30, 1947 (61 Stat. 545, 547), these securities were transferred to the Department ofthe Treasury and Reconstruction Finance Corporation notes canceled in like amount.
* Securities of $597,959,607 were transferred from the direct loan account to the agricultural credit insurance fund, and securities of $451,906,000 were transferred from the agricultural credit insurance fund to the rural development insurance fund in accordance with an act approved Aug. 30. 1972 (86 Stat. 661).
' In accordance with an act approved May 11. 1973 (87 Stat. 65-71). most outlays ofthe
Rural Electrification Administration, including the Rural Telephone Bank, were classified outside the unified budget totals.
'"Transferred from public facility loans by an act approved Aug. 22. 1974 (88 Stat. 653). " Includes exchanges on notes for preferred capital stock amounting to $92,000,000. "Transferred from the Reconstruction Finance Corporation pursuant to Reorganization
Plan No. 2 of 1954, effective at the close of business June 30, 1954. " T h e $1,000,000 repayment and subsequent borrowing was the result of an incorrect
repayment by the Interior Department on Aug. 31, 1976. Pursuant to 74 Stat. 921. the repayment should have been charged against the capital investment and retained earaings. and not borrowings from the Secretary of the Treasury.
'* Transferred from the Reconstruction Finance Corporation by an act approved July 30, 1953 (67 Stat. 230).
"^Consists of $147,318,333 transferred to Export-Import Bank of the United States, Government National Mortgage Association, and Small Business Administration (see footnote 12); and $1,813,971 transferred to the Secretary ofthe Treasury (see footnote 14).
'«Pursuant to an act approved Aug. 17, 1971 (85 Stat. 345-346). the receipts, expenditures, and net lending of this corporation were classified outside the unified budget totals, effective as of the close of business Aug. 16. 1971.
"Pursuant to an act approved Dec. 29. 1973 (12 U.S.C. 2288(b)). the receipts, expenditures, and net lending of the bank were classified outside the unified budget totals.
'* Additional subscriptions to the International Monetary Fund in the amount of $1,800,000,000 were paid from the Exchange Stabilization Fund.
"Includes $1,009,501,054 deposited in miscellaneous receipts of the Department of the Treasury.
'°Cash recoveries against assets acquired from these cancellations have been made amounting to $2,783,248,431. In addition, the Department of the Treasury holds assets which have not been converted into cash.
CX)
as
73 cn s 73 H O
H X cn c/3 cn o 73 cn H > 73
o H X cn H 73 cn > c/3 c 73
Digitized for FRASER http://fraser.stlouisfed.org/ Federal Reserve Bank of St. Louis
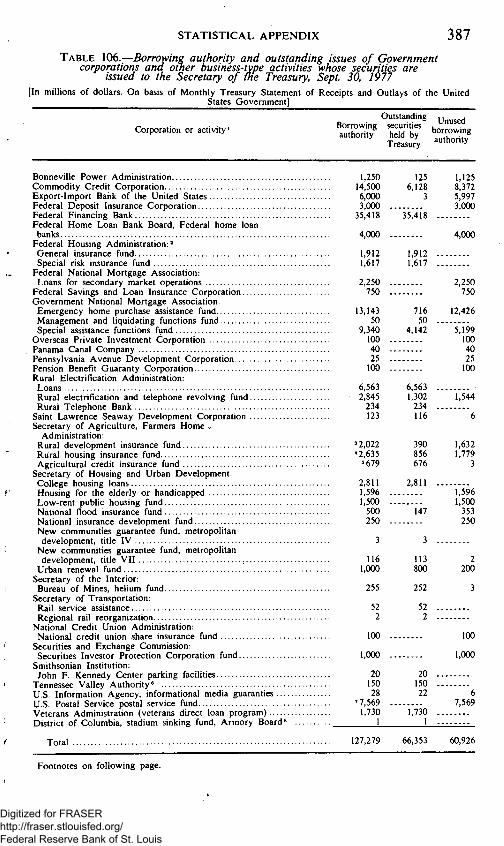
STATISTICAL APPENDIX 387 TABLE 106.—Borrowing authority and outstanding issues of Government
corporations and otner business-type activities whose securities are issued to the Secretary of the Treasury, Sept. 30, 1977
[In millions of dollars. On basis of Monthly Treasury Statement of Receipts and Outlays of the United ^ States Government]
Outstanding rjnused corporation or activity. ^ ^ ^ ^ - c u r i « - bot^.ow.^g
Treasury ™"'°"'>'
Bonneville Power Administration 1,250 125 Commodity Credit Corporation 14,500 6,128 Export-Import Bank of the United States 6.000 3 Federal Deposit Insurance Corporation 3,000 Federal Financing Bank 35,418 35,418 Federal Home Loan Bank Board, Federal home loan banks 4.000
Federal Housing Administration:' General insurance fund Special risk insurance fund
Federal National Mortgage Association: Loans for secondary market operations
Federal Savings and Loan Insurance Corporation Government National Mortgage Association:
Emergency home purchase assistance fund Management and liquidating functions fund Special assistance functions fund
Overseas Private Investment Corporation Panama Canal Company Pennsylvania Avenue Development Corporation Pension Benefit Guaranty Corporation Rural Electrification Administration:
Loans Rural electrification and telephone revolving fund Rural Telephone Bank
Saint Lawrence Seaway Development Corporation Secretary of Agriculture, Farmers Home «
Administration: Rural development insurance fund Rural housing insurance fund Agricultural credit insurance fund
Secretary of Housing and Urban Development: College housing loans Housing for the elderly or handicapped Low-rent public housing fund National flood insurance fund National insurance development fund New communities guarantee fund, metropolitan development, title IV
New communities guarantee fund, metropolitan development, title VII
Urban renewal fund Secretary of the Interior: Bureau of Mines, helium fund
Secretary of Transportation: Rail service assistance Regional rail reorganization
National Credit Union Administration: National credit union share insurance fund
Securities and Exchange Commission: Securities Investor Protection Corporation fund
Smithsonian Institution: John F. Kennedy Center parking facilities
Tennessee Valley Authority * U.S. Information Agency, informational media guaranties U.S. Postal Service postal service fund Veterans Administration (veterans direct loan program) District of Columbia, stadium sinking fund, Armory Board» . . . .
Total 127,279 66,353
1,125 8,372 5.997 3,000
4,000
1,912 1,617
2,250 750
13,143 50
9,340 100 40 25 100
6.563 2.845 234 123
'2.022 * 2.635 »679
2,811 1.596 1,500 500 250
3
116 1,000
255
52 2
100
1,000
20 150 28
'7,569 1,730
1
1.912 1.617
716 50
4,142
6,563 1,302 234 116
390 856 676
2.811
147
3
113 800
252
52 2
20 150 22
1,730 I
2,250 750
12,426
5.199 100 40 25 100
1,544
6
1,632 1,779
3
1.596 1,500 353 250
2 200
3
100
1,000
6 7.569
60,926
Footnotes on following page.
Digitized for FRASER http://fraser.stlouisfed.org/ Federal Reserve Bank of St. Louis

388 1977 REPORT OF THE SECRETARY OF THE tREASURY
' Excludes authorizations to borrow from the public; also excludes authorizations to expend from public debt receipts for subscriptions to capital stock of the following agencies: International Bank for Reconstruction and Development, $6,350 million; International Monetary Fund, $2,325 million; International Finance Corporation, $35 million; and a Government corporation, $999 million. In addition, the authorized credit to the United Kingdom, ofwhich $2,558 million as of Sept. 30, 1977. was outstanding, has been excluded.
'Founds may be borrowed as needed pursuant to an act approved Aug. 10, 1965 (12 U.S.C. 1735d). 'Represents amount due Treasury and net amount obligated less unexpended fund balance. Authority to
borrow from the Treasury is indefinite in amount. Funds may be borrowed as needed to carry out provisions of an act approved Aug. 30, 1972 (7 U.S.C. 1929a(d)).
* Represents amount due Treasury and net amount obligated less unexpended fund balance. Funds may be borrowed as needed but. except as may be authorized in appropriation acts, not for the original or any additional capital ofthe fund, as provided by an act approved Aug. 10. 1965 (42 U.S.C. 1487 (h)).
* Represents amount due Treasury, net amount obligated, and unobligated balance, less unexpended fund balance. Authority to borrow from the Treasury is indefinite in amount. Funds may be borrowed as needed to carry out provisions of an act approved Aug. 8, 1961 (7 U.S.C. 1929(c)).
® Interim securities may be issued to the Secretary of the Treasury under specified conditions as provided by an act approved Aug. 6, 1959 (16 U.S.C. 831n-4(c)).
' Has been reduced by $2,431 million representing authority used to borrow from the Federal Financing Bank and the public.
® Funds may be borrowed from the Secretary of the Treasury under certain conditions as provided by an act appro.ved July 28, 1958 (2 D.C. Code 1727).
Digitized for FRASER http://fraser.stlouisfed.org/ Federal Reserve Bank of St. Louis

STATISTICAL APPENDIX 389 TABLE \ 0 1 .^Description of securities of Government corporations and
other business-type activities held by the Treasury, Sept. 30, 1977
Title and authorizing act
Bonneville Power Administration, act of Aug. 20, 1937, as amended: Advance
Commodity Credit Corporation, act of Mar. 8, 1938, as amended: Advances
Do Do Do Do Do Do
Total
Export-Import Bank of the United States, act of July 31, 1945, as amended:
Notes, Series 1978
Federal Financing Bank, act of Dec. 29, 1973: Advances
Federal Housing Administration, act of Aug. 10, 1965: General insurance fund: Advance
Do Do Do
Advances Do Do Do Do
Advance Do
Subtotal
Special risk insurance fund: Advances Advance Advances
Do Advance
Do Do
Advances Do Do Do Do
Advance Advances
Subtotal
Total Federal Housing Administration....
Date of issue
.Sept. 30, 1977.
.Various dates.. do do do do do do
..Various dates..
..Various dates..
..Oct. 31, 1971.. do
..Jan. 31, 1974..
..Mar. 31, 1974.
..Various dates.. do do do
..Oct. 31, 1974..
..June 30, 1975.
..Oct. 31, 1975..
..Various dates..
..Feb. 28, 1973 .
..Various dates.. do
..Sept. 30, 1973,
..Nov. 30, 1973,
..Mar. 31, 1974,
..Various dates.. do do do
..Oct. 31, 1974.
..June 30, 1975
..Oct. 31, 1975.
Date payable'
Sept. 30, 1979.
Oct. 1, 1977... Jan. 1, 1978...
do do do do do
June 30, 1978 .
Various dates..
Oct. 31, 1986.. do
Jan. 31, 1989.. Mar. 31, !989 . Various dates..
do ..• do do
Oct. 31, 1989.. June 30, 1990 . Oct. 31, 1990..
Various dates.. Feb. 28, 1988.. Various dates..
do , Sept. 30, 1988.
Nov. 30, 1988. . Mar. 31, 1989 . , Various dates..
do do do
. Oct. 31, 1989..
. June 30, 1990 .
. Oct. 31, 1990..
Rate of interest
Percent
6.73
'None 5
5% S'A , 5'/4
5'/8
d'A
4'/4
Various
VA VA
7 VA VA VA
8 8'/8
8'/, 8'/. 8'/.
d'A d% d'A
7 VA 6'/8
VA VA VA
8 8'/8
8'/8
8'/4
8'A
Principal amount
$125,000,000
690,993,035 1,944,463,553
271,000,000 993,000,000 395,000,000
1,217,000,000 617,000,000
6.128,456,588
3,323,252
35,418,282,166
86,000,000 H000,000 50,387,000 84,000,000
314,000,000 385,000,000 171,000,000 273,000,000 142,000,000 202,268,000 160,000,000
1,911.655.000
34,166,000 86,000,000
276,000,000 38,000,000 36,000,000 68,000,000 90.000,000
224,000,000 214,000,000 169,000,000 148,000,000 99,000,000 75,000,000 60,000,000
1,617.166.000
3.528,821,000
Govemment National Mortgage Association, act of Aug. 2, 1954, as amended: Emergency home purchase assistance fund: Advances Various dates
Do.. Do.. Do . Do.. Do.. Do.. Do.. Do.. Do..
)us dates. do do do do do do do do do
. Various dates.. do do do do do do
. July I, 1979...
. July 1, 1981...
. July 1, 1982...
6'/8
6'/8
6'/4
6'/8
7 VA VA VA VA VA
25,600,000 11,520,000 2,700,000
137,620,000 19,900,000
• 137,387,000 203,252.000 156,205,000 17,830,000 4.300.000
Subtotal See footnotes at end of table.
716,314,000
Digitized for FRASER http://fraser.stlouisfed.org/ Federal Reserve Bank of St. Louis

390 1977 REPORT OF THE SECRETARY OF THE TREASURY
TABLE 107.—Description of securities of Government corporations and other business-type activities held by the Treasury, Sept. 30, 1977—Continued
Title and authorizing act
Government National Mortgage Association-Management and Advances
Special assistance Advances
Do Do Do Do Do Do Do Do Do Do Do Do Do Do Do Do...
Subtotal
liquidating functions:
functions:
Total Government National Mortgage Association
Rural Electrification Administration, act of May 20, 1936, J as amended:
Notes of Administrator .
Rural Telephone Bank, act of June 30, 1972:
Advances Do Do Do Do Do Do Do Do Do Do Do
Advance
Total
Saint Lawrence Seaway Development Corporation, act of May Revenue bonds...
13, 1954, as amended:
Date of issue
-Con.
...Various dates.
. ..Various dates. do do
...July 1, 1976.. do do
...Various dates. do do do do do do do do do do
...Various dates.,
...Various dates.. do do do
...July 26, 1973.,
...Various dates.. do do do do do do
...Oct. 28, 1975..
...Various dates..
Date payable'
. Various dates..
. July 1, 1980... do do
. July 1, 1981... do do do do do
. Various dates..
. July 1, 1982...
. Various dates.. do do do do do
. Various dates..
. June 30, 2024 . do do do
, Various dates.. do do do do . . . : . . . do do
, June 30, 2024 . June 30, 2025 .
. Various dates..
Rate of interest
Percent
6'/8
6'/4
8'/8 8'/8
3'/8
3'/8
3'/8
6'/9
6'/8
7 6'/8
7'/8
7'/4
7'/8
VA VA VA VA
'None
7'/4
7'/8
VA VA VA VA
8 8'/8
8'/4
8'/8
%'A 8'/4
8V8
*None
Principal amount
$50,000,000
50,000,000 321,520.000 194.990,000
2,660,000 6,555,000 1,740,000
189,690,000 23,200,000 47,000,000
.209,750,000 45,100,0(X)
432,455,000 810,095,000 394,425,000 291,158,000 431,610,000 689,554,000
4,141,502,000
4,907,816,000
7,864.742,068
5,071,000 7,667,000
10,017,000 10,461,000 24,451,000 27,504,000 11,092,000 41,301,000 42,403,000 31,107,000 16,609,000 5,222,000
717,000
233,622,000
116,476.051
Secretary of Agriculture, Farmers Home Administration: Rural housing insurance fund, act of July 15, 1949, as amended:
Note June 16, 1961 . June 30, 1993 , Notes Various dates.. Various dates., Do do do Do do do Do do do
Advance Oct. 1, 1976... Oct. 1, 1977..,
Subtotal
See footnotes at end of table.
3'/4
3'/8
4 4'/4
4y8 5.683
15,000,000 120,717,973 220,000,000 65,000,000
135,000,000 300,000,000
855,717,973
Digitized for FRASER http://fraser.stlouisfed.org/ Federal Reserve Bank of St. Louis

STATISTICAL APPENDIX 391 TABLE 107.—Description of securities of Government corporations and other
business-type activities held by the Treasury, Sept. 30, 1977—Continued
Title and authorizing act Date of issue
Date payable'
Rate of interest
Principal amount
Secretary of Agriculture Farmers Home Administration—Continued Agricultural credit insurance fund, act of Aug. 14, 1946, as amended: Advances Various dates.. June 30, 1978 . Advance June 30, 1976. June 30, 1981 .
Percent
Subtotal.
Rural development insurance fund, act of Aug. 30, 1972: Advance Sept. 3, 1972 .. June 30, 1992 .
Do. . Oct. 2, .1972... June 30, 1993 . Advances Various dates.. Various dates..
Subtotal.
Total Secretary of Agriculture, Farmers Home Administration .
Secretary of Housing and Urban Development: College housing loans, act of Apr. 20, 1950, as amended: Advance Jan. I, 1977 ... Jan. 1, 1978 .
National flood insurance fund, act of Aug. I, 1968: Advances July 1, 1976... July 1, 1978.
Do Oct. 12, 1976 do Do Jan. 3, 1977 do Do July I, 1977... July 1, 1979.
Subtotal..
New communities guarantee fund, metropolitan development, title LV, act of Aug. I, 1968: Advances Various dates.. Various dates. Advance Nov. 26, 1975. July 1, 1985..
Do May 26, 1976 do Do July 1, 1976... July 1, 1986.. Do Nov. 29, 1976 do Do Jan. I, 1977 do Do July 1, 1977... July I, 1987..
Subtotal.
New communities guarantee fund, metropolitan development, title VII, act of Dec. 31, 1970: Advances Various dates.. July 1, 1986..,
Do do do Do do do Do do do Do do Various dates. Do do do Do do do
Subtotal.
Urban renewal fund, act of July 15, 1949, as amended: Notes, Series URA Various dates.. On demand.
Total Secretary of Housing and Urban Development
See footnotes at end of table.
6'/4
7'/4
7y8
5'/8
8'/8
2'/4
VA 6V8 5'/, 6'/4
7'/8
8'/4
7'/4
8 VA 7
7'/8
7 7'/8
7'/8
VA VA VA 8
6'/4
$350,000,000 326,000,000
676,000,000
30,000,000 25,000,000
335.000,000
390,000,000
1,921,717,973
2,811.000,000
28,654.404 15.615,000 4.361,214
98,820,338
147,450,956
480,000 227,000
1,403,500 23,000
1,036,000 80,169 108,045
3.357.714
2,369,481 2,368,000
37,152,015 42,993,741 2,328,660
22,909,500 2.956,375
113,077,772
800.000,000
3.874.886,441
Digitized for FRASER http://fraser.stlouisfed.org/ Federal Reserve Bank of St. Louis

392 1977 REPORT OF THE SECRETARY OF THE TREASURY
TABLE 107.—Description of securities of Government corporations and other business-type activities held by the Treasury, Sept. 30, 7977^Continued
Title and authorizing act Date of issue
Date payable'
Rate of interest
Principal amount
Secretary of the Interior: Bureau of Mines: Helium fund, act of Sept. 13, 1960: Notes Various dates.. Sept.
Do do Note Dec. 28, 1965 Notes Various dates
Do.. Do.. Do.. Do.. Do.. Do.. Do.. Do.. Do.. Do.. Do.. Do..
Note..
do do do do do do do do do do do do 10,
Do July 28, .Apr. 1970.
1972..
13, 1985. do do do do do do do do do do do do do do do do do
Total.
Secretary of Transportation: Rail service assistance, act of Jan. 8, 1971: Advance Jan. 15, 1976.. Jan. 15, 1978..
Do Apr. 20, 1976. Apr. 20, 1978 .
Subtotal.
Regional rail reorganization, act of Jan. 2, 1974: Advance June 30, 1976 . Sept. 30, 1978.
Total Secretary of Transportation.
Smithsonian Institution: John F. Kennedy Center parking
facilities, act of Jan. 23, 1964: Revenue bonds Various dates.. Dec. 31, 2017 .
Do.. Do.. Do.. Do..
do do do do
Revenue bond June 12, 1969 . Revenue bonds Various dates..
Do do Do do
do do
Dec. 31, do do do do do
2018.
Total.
Tennessee Valley Authority, act of Aug. 6, 1959: Advances May 26, 1977. May 26, 1978.,
U.S. Information Agency, act of Apr. 3. 1948. as amended: . Note of Administrator. ECA Oct. 27. 1948.,
Do.. Do.. Do.. Do.. Do.. Do.. Do..
.Jan.
do do 24. do do do do
1949.
June 30, do do do do do do do
1986.
Percent
4'/8
4'/4
4'/8
4'/, 4V8 4»/4
4'/8
5 5'/8
5'/4
5'/8
5'/, 5y8 6'/8
6'/4
6V8 6'/4
6
$20,500,000 9,000,000 2,000,000 10,500,000 8.000,000 4.000.000 11,700.000 3,500,000 4.200.000 10,400,000 13.100.000 8,700.000 4,800.000 58.830.000 69,500,000 11,400,000
500,000 1.020.000
7'/s 7
7
5'/8
5'A 5'/8
5'/* 5'/8
6 6'/4
d'A d%
S'A
251,650.000
50,000,000 2,479.300
52.479.300
2.402.390
54.881.690.
3.800,000 2,900,000 1,200,000 2,200.000 4.300.000 1,000,000 1,300,000 1,900,000 1,800,000
20,400.000
150.000.000
VA 2
2'A 2'A 2V8
2»/4
2'/8 3
1,410,000 1,305,000 2,272,611
775,000 75,000
302,389 1,865,000 1,100,000
See footnotes at end of table.
Digitized for FRASER http://fraser.stlouisfed.org/ Federal Reserve Bank of St. Louis

STATISTICAL APPENDIX 393 TABLE 107.—Description of securities of Government corporations and other
business-type activities held by the Treasury, Sept. 30, 1977—Continued
Title and authorizing act Date of issue
Date payable'
Rate of interest
Principal amount
U.S. Information Agency, act of Apr. 3, 1948, as amended—Continued
Note of Administrator, ECA—Con. Do Jan. Do.. Do.. Do.. Do.. Do.. Do.. Do.. Do.. Do.. Do.. Do.. Do..
Total...
.Sept.
• Aug.
24, 1949. do do do do do do
18, do 12,
do do do
1958,
1959.
June 30, 1986 . do do do do do do do do
June 30, do do do
1989 .
Veterans Administration: Veterans direct loan program, act of Apr. 20, 1950, as amended: Agreements Various dates.. Indefinite.,
Do do Do do Do do
Agreement Dec. 31, Do Mar. 29, Do June 28, Do Apr. 7,
do do do do do do do do
Agreements Various dates do
1956. 1957. 1957.
1958 .. Do Oct. 6, 1958.
D o . D o . D o . D o . D o .
I960..
do do do do do do Agreement Feb.
Agreements Various dates do
Total .
District of Columbia: Stadium sinking fund, Armory Board, act of July 28, 1958, as amended:
Note .Dec. 1, 1973 , When funds are available.
Percent
VA 3'/4
3'/8
3V8 3'/4
3'/8
4 3'/8
4 3'/8
4 4'/8
4'/8
2'A 2'A 2'/8
3 3'/8
3'/4
VA 3'/8
3y8 3'/4
3'/8
4 4'/8
4'/4
4'/, 4y8 6'/8
$510,000 3,431,548 495,000 220,000
2,625.960 2.440,000 494.333 539.836 349.000 471,164 391,000 983,300 57.859
22.114.000
88.342,741 53,032.393 102.845.334 118.763.868 49.736,333 49,768,442 49.838.707 49.571.200 48.855,090 99,889,310 392.344.555 110.000.000 20,703,541 109,387,321 99,909.138 20,000,000
267.090.023
1.730.077.996
Various 831.600
Total securities' 66.353.098,823
' Securities may be redeemed at any time. 'An act approved Nov. 2. 1965 (15 U.S.C. 713a-lla) provided that after June 30. 1964. the portion of
borrowings from the Treasury equal to the unreimbursed realized losses recorded on the books of the Corporation after June 30 of the fiscal year in which such losses are realized, shall not bear interest and interest shall not be accrued or paid thereon.
'Accrued interest payable on the notes issued to the Secretary ofthe Treasury has been canceled as provided by an act approved May 11. 1973 (87 Stat. 67). Payments of principal when due on these notes will be made without payment of interest.
*In accordance with an act approved Oct. 21. 1970 (33 U.S.C. 985 (b)). the securities issued by this Corporation to the Treasury shall bear no interest, and the unpaid interest that has accrued is terminated.
"These securities were issued to the Treasury in exchange for advances by the Treasury from public debt receipts under congressional authorization for specified Goverament corporations and business-type activities to borrow from the Treasury.
Digitized for FRASER http://fraser.stlouisfed.org/ Federal Reserve Bank of St. Louis

394 1977 REPORT OF THE SECRETARY OF THE TREASURY
TABLE 108.—Summary statements of financial condition of Government corporations, other business-type activities, and regular governmental activities,
Sept. 30, 1977 ^ [In millions of dollars. On basis of reports received from activities]
Account Amount' Account Amount'
ASSETS
Selected current assets: Fund balances with Treasury:' Budget funds 166,516 Budget clearing accounts 459 Deposit funds 2,416 Foreign currency funds 1,497 Allowances, foreign currency funds (—). (*)
Federal security holdings (at par) 155,909
Accounts receivable: Government agencies 11,036 The public 14,556 Allowances (—) —544
Advances to: Government agencies 6,038 The public 7,449
Total selected current assets 365,332
Loans receivable: Repayable in dollars 67,000
Repayable in foreign currencies 2.066 Allowances (—) —2,432
Inventories: Items for sale 13,962 Work in process 945 Raw materials and supplies 1,790 Stockpile materials and commodities - 26,386 Allowances (—) —185
Real property and equipment: Land 5,799 Structures and facilities 142,952 Equipment 98.807 Leasehold improvements 1,233 Acquired security, pending disposition 1,597 Allowances (—) —13,624
Other assets: Work in process, contractors 18,514 Materials and suppliers—other 15,498
Other 52.438 Allowances (—) —Ill
Total assets...., '797,965
LIABILITIES
Selected current liabilities: Accounts payable: Govemment agencies 7,334 The public 33,713
Advances from: Govemment agencies 1,014 The public 9.708
Total selected current liabilities 51,770
Deposit fund liabilities 2,349 Unfunded liabilities: Accrued annual leave 4,549 Other 126.093
Debt issued under borrowing authority: Borrowings from Treasury 22,815
Agency securities outstanding 11,221 Other 7,493
Other liabilities 75.133
Total liabilities 301,422
GOVERNMENT EQUITY ,
Unexpended budget authority: Unobligated 216,311 Undelivered orders 332,771
Unfinanced budget authority (—): Unfilled customer orders —13,495 Z Contract authority —216,815 Borrowing authority —66.261 "^
Invested capital 235,669 Other equity: J Receipt account equity 6,134 Unappropriated receipts (—) —1,295 Foreign currency fund equity 3,524 "-•
Total Govemment equity 496,543 ^
Total liabilities and Govemment equity . 797,965
* Less than $500,000. ' Consists of business- and non-business-type activities. 'Consists mainly of unexpended balances of general, special, and revolving fund accounts against which
checks may be drawn to pay proper charges under these funds. The funds are considered assets of the agencies, but not of the U.S. Goverament since funds must be provided out of cash balances of the Treasury of the United States and future receipts to take care of checks to be issued against the balances. Undeposited collections and unconfirmed deposits are included in these balances.
' Includes foreign currency assets, representing loans and other receivables recoverable in foreign currencies in U.S. depositaries, aggregating $3,592 million in dollar equivalent. These currencies, acquired without dollar payments, were generated under various Goverament programs, principally the Agricultural Trade Development and Assistance Act of 1954, as amended, and the Mutual Security Acts, as amended. Dollar equivalents are computed for reporting purposes to provide a common denominator for the currencies of the many countries involved. Foreign currencies on hand and on deposit and loans under section 104(e) of the Agricultural Trade Development and Assistance Act of 1954, as amended, are stated at the rates as of Sept. 30, 1977, at which the United States could purchase currencies on the market for regular operating purposes. Other loans are stated at the rates at which they are to be repaid or at rates in effect when the loans were extended. Currencies that are dollar denominated or guaranteed as to rate of exchange are stated at rates specified in the agreements.
NOTE.—Business- and non-business-type activities report pursuant to Department Circular No. 966, Revised, dated Dec. 20, 1972, and volume I, part 2, chapter 4100 ofthe Treasury Fiscal Requirements Manual (Transmittal Letter No. 186). Statements of financial condition are published semiannually in the monthly Treasury Bulletin for business-type activities, and annually for all other funds.
Digitized for FRASER http://fraser.stlouisfed.org/ Federal Reserve Bank of St. Louis
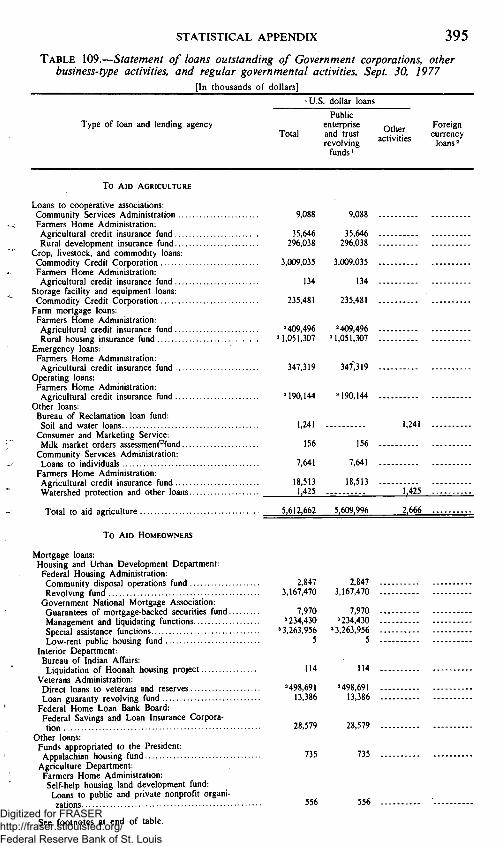
STATISTICAL APPENDIX 395 TABLE 109.—Statement of loans outstanding of Government corporations, other
business-type activities, and regular governmental activities, Sept. 30, 1977 [In thousands of dollars]
U.S. dollar loans
Type of loan and lending agency Total
Public enterprise and trust revolving
funds'
Other activities
Foreign currency
loans'
To AID AGRICULTURE
Loans to cooperative associations: Community Services Administration 9,088 Farmers Home Administration: Agricultural credit insurance fund 35,646 Rural development insurance fund 296,038
Crop, livestock, and commodity loans: Commodity Credit Corporation 3,009,035 Farmers Home Administration: Agricultural credit insurance fund 134
Storage facility and equipment loans: Commodity Credit Corporation 235,481
Farm mortgage loans: Farmers Home Administration: Agricultural credit insurance fund ' 409,496 Rural housing insurance fund ' 1,051,307
Emergency loans: Farmers Home Administration: Agricultural credit insurance fund 347,319
Operating loans: Farmers Home Administration: Agricultural credit insurance fund ' 190,144
Other loans: Bureau of Reclamation loan fund: Soil and water loans 1,241
Consumer and Marketing Service: Milk market orders assessment' fund 156
Community Services Administration: Loans to individuals 7,641
Farmers Home Administration: Agricultural credit insurance fund 18,513 Watershed protection and other loans 1,425
Total to aid agriculture 5,612,662
9,088
35,646
296,038
3,009,035
134
235,481
'409,496
'1,051,307
347,319
'190,144
1,241
156
7,641
18,513 1,425
5,609,996 2,666
To AID HOMEOWNERS
Mortgage loans: Housing and Urban Development Department: Federal Housing Administration: Community disposal operations fund 2,847 Revolving fund 3,167,470
Government National Mortgage Association: Guarantees of mortgage-backed securities fund 7,970 Management and liquidating functions '234,430 Special assistance functions ^ 3,263,956 Low-rent public housing fund 5
Interior Department: Bureau of Indian Affairs: Liquidation of Hoonah housing project 114
Veterans Administration: Direct loans to veterans and reserves '498,691 Loan guaranty revolving fund 13,386
Federal Home Loan Bank Board: Federal Savings and Loan Insurance Corporation 28,579
Other loans: Funds appropriated to the President: Appalachian housing fund 735
Agriculture Department: Farmers Home Administration: Self-help housing land development fund: Loans to public and private nonprofit organizations 556
See footnotes at end of table.
2,847 3,167,470
7,970 '234,430
'3,263,956 5
114
'498,691 13,386
28,579
735
556 Digitized for FRASER http://fraser.stlouisfed.org/ Federal Reserve Bank of St. Louis

396 1977 REPORT OF THE SECRETARY OF THE TREASURY
TABLE 109.—Statement of loans outstanding of Government corporations, other business-type activities, and regular governmental activities,
Sept. 30, 7977—Continued ^ [In thousands of dollars]
Type of loan and lending agency
U.S. dollar loans
Total
Public enterprise and trust revolving
funds •
Other activities
Foreign currency
loans'
To AID HOMEOWNERS—Continued
Housing and Urban Development Department: Federal Housing Administration: Revolving fund: Property improvement loans
Veterans Administration: Direct loans to veterans and reserves Loan guaranty revolving fund
Total to aid homeowners
91,734 91,734
27,904 '907,846
8.246.222
27.904 '907.846
8.246.222
To AID INDUSTRY
Loans to railroads: Expansion of defense production: Treasury Department
Other purposes: Transportation Department: Federal Railroad Administration
Treasury Department: Reconstruction Finance Corporation loans in liquidation
Interstate Commerce Commission United States Railway Association
Ship mortgage loans: Commerce Department: Federal ship financing fund, revolving fund Maritime Administration
Other loans: Defense production guarantees: Army Department Navy Department
Other purposes: Commerce Department: Economic Development Administration: Economic development revolving fund
National Oceanic and Atmospheric Administration: Federal ship fmancing fund, fishing vessels Fisheries loan fund
Promotion of industry and commerce: Trade adjustment assistance
Interior Department: Geological Survey
Transportation Department: Right-of-way revolving fund Urban mass transportation fund
Federal Home Loan Bank Board: Federal Savings and Loan Insurance Corporation
Small Business Administration: Business loan and investment fund
58
80.907
1.695 104,522 316,888
14,821 40,457
5 2,584
337,498
461 1,385
20,906
3,012
178,302 47,296
Total to aid industry
See footnotes at end of table.
58
1,695
14.821
5 2.584
337.498
461 1,385
178,302 47,296
13,942 13.942
'1.831.550 '1,831,550
80,907
104,522 316.888
40,457
20,906
3,012
2.996.291 2.429.598 566.693
Digitized for FRASER http://fraser.stlouisfed.org/ Federal Reserve Bank of St. Louis

STATISTICAL APPENDIX 397 TABLE 109.—Statement of loans outstanding of Government corporations,
other business-type activities, and regular governmental activities, Sept. 30, 7977—Continued
^ [In thousands of dollars]
U.S. dollar loans
Type of loan and lending agency Public
enterprise Total and trust
revolving funds'
Other activities
Foreign currency
loans'
To AID EDUCATION
Health, Education, and Welfare Department: Health Resources Administration: Loans to institutions: Health education loans '22,105 '22.105 Nurse training fund '7.661 '7.661 Other student loan programs 481,621
Office of Education: Elementary and secondary educational activities 463 Higher educational activities, loans to institutions 11.034
Higher educational activities, advances for reserve funds 19,711
Higher education facilities loan and insurance fund '453,467 '453.467
Loans to students in institutions of higher education 3.130,887
Student loan insurance fund 589,058 589,058 Social and Rehabilitation Service: Assistance to refugees in the United States 28,671
Housing and Urban Development Department: College housing loans '3,046,042 '3,046,042
Justice Department: Law Enforcement Assistance Administration 153,597
Veterans Administration: Education loan fund 21,289 21,289
Total to aid education 7,965,606 4,139,622
481,621
463
11.034
19.711
3,130.887
28.671
153.597
3,825,985
To AID STATES, TERRITORIES, ETC.
Commerce Department: Economic Development Administration: Economic development revolving fund
Health, Education, and Welfare Department: Health Resources Administration: Health Services and Mental Health Administration: Medical facilities guarantee and loan fund Other loans
Health Services Administration: Health maintenance organization, loan guarantee and loan fund
Housing and Urban Development Department: Urban renewal programs Lov/-rent public housing fund Revolving fund, liquidating programs
Interior Department: Bureau of Reclamation: Drought emergency assistance Irrigation distribution systems Small irrigation projects
Office of Territorial Affairs: Alaska public works Loans for rehabilitation in Guam
Transportation Department: Federal aid highways trust revolving fund
Loans to the District of Columbia
Total to aid States, Territories, etc
See footnotes at end of table.
165.457
23.331 48.390
12,098
56,059 31.511
'526.670
5,545 75,420
152,134
529 36,287
152.122 1,248,414
2,533,970
165,457
23.331
12,098
56,059 31.511
'526.670
152,122
48,390
5,545 75,420
152,134
529 36,287
1,248,414
967,249 1,566,721
Digitized for FRASER http://fraser.stlouisfed.org/ Federal Reserve Bank of St. Louis

398 1977 REPORT OF THE SECRETARY OF THE TREASURY
TABLE 109.—Statement of loans outstanding of Government corporations, other business-type activities, and regular governmental activities,
Sept. 30, 7977—Continued [In thousands of dollars]
U.S. dollar loans
Type of loan and lending agency Total
Public enterprise and trust revolving
funds'
Other activities
Foreign currency
loans'
FOREIGN LOANS
Funds appropriated to the President: Emergency security assistance for Israel Foreign military credit sales Liquidation of foreign military sales fund Military credit sales to Israel Agency for Intemational Development: Alliance for Progress, development loans Common defense, economic, and triangular trade loans
Development loans Development loan fund liquidation account Loans to foreign firms and U.S. firms in foreign countries
Loans of predecessor agencies in liquidation Other loans
Overseas Private Investment Corporation Agriculture Department: Commodity Credit Corporation: Long-term export sales credits Short-term export sales credits
State Department: Loans to the United Nations
Treasury Department: Miscellaneous loans and certain other assets: Lend-lease and surplus property Loans and other credits
Receivables from foreign banking institutions Energy Research and Development Administration: Long-term receivables
Export-Import Bank of the United States U.S. Information Agency
Total foreign loans .
631,464 875,905
9,149 385,000
3,346,143
24,373 7 167 512 118040
639 970 1,034,757
21 568
5 341 123 1 259,698
42 809
1,361,942 * 2,684,807
562
46,065 11,538,472
36.529.358
9,149
3.346.143
7.167.512 118,040
2"l"."5'6'8
5,341.123 1,259.698
562
11,538.472
28.802.267
631,464 875,905
385,000
24.373
639,970 1,034,757
42,809
1,361,942 * 2,684,807
46,065
7.727,092
1,136.085
322.704
80,722 455,048 52,531
17,886
1.093
2,066.068
OTHER LOANS
Housing and Urban Development Department: Low-rent public housing fund New communities guarantee fund Nonprofit sponsor assistance Rehabilitation loan fund Revolving fund, liquidating programs
Interior Department: Bureau of Indian Affairs: Revolving fund for loans
State Department: Emergencies in the diplomatic and consular service •
General Services Administration: Liquidation of Virgin Islands Corporation .. . . Surplus property credit sales and liquidation activities •
See footnotes at end of table.
533 78,579
1,427 334.218
1,600
55,708
2.543
2,990
51.547
533 78.579
1,427 334,218
1,600
55,708
2,543
2,990 .--
51,547
Digitized for FRASER http://fraser.stlouisfed.org/ Federal Reserve Bank of St. Louis
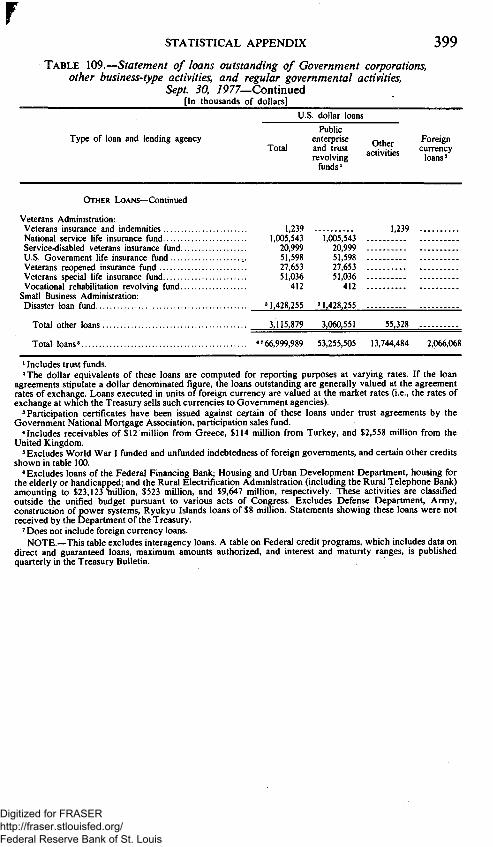
STATISTICAL APPENDIX 399 TABLE 109.—Statement of loans outstanding of Government corporations,
other business-type activities, and regular governmental activities, Sept. 30, 7977—Continued
[In thousands of dollars]
U.S. dollar loans
Type of loan and lending agency Total
Public enterprise and trust revolving
funds'
Other activities
Foreign currency
loans'
OTHER LOANS—Continued
Veterans Administration: Veterans insurance and indemnities National service life insurance fund Service-disabled veterans insurance fund... U.S. Govemment life insurance fund Veterans reopened insurance fund Veterans special life insurance fund Vocational rehabilitation revolving fund...
Small Business Administration: Disaster loan fund
Total other loans .
1,239 1,005,543
20,999 51,598 27,653 51,036 412
1,428,255
1,005,543 20,999 51,598 27,653 51,036 412
'1,428,255
3.115,879 3.060,551
1,239
55.328
Total loans' «'66.999.989 53,255,505 13,744,484 2,066,068
' Includes trust funds. 'The dollar equivalents of these loans are computed for reporting purposes at varying rates. If the loan
agreements stipulate a dollar denominated figure, the loans outstanding are generally valued at the agreement rates of exchange. Loans executed in units of foreign currency are valued at the market rates (i.e., the rates of exchange at which the Treasury sells such currencies to Goverament agencies).
'Participation certificates have been issued against certain of these loans under trust agreements by the Government National Mortgage Association, participation sales fund.
* Includes receivables of $12 million from Greece, $114 million from Turkey, and $2,558 million from the United Kingdom.
»Excludes World War I funded and unfunded indebtedness of foreign goveraments, and certain other credits shown in table 100.
«Excludes loans ofthe Federal Financing Bank; Housing and Urban Development Department, housing for the elderly or handicapped; and the Rural Electrification Administration (including the Rural Telephone Bank) amounting to $23,123 Inillion, $523 million, and $9,647 million, respectively. These activities are classified outside the unified budget pursuant to various acts of Congress. Excludes Defense Department, Army, construction of power systems, Ryukyu Islands loans of $8 million. Statements showing these loans were not received by the Department of the Treasury.
' Does not include foreign currency loans. NOTE.—This table excludes interagency loans. A table on Federal credit programs, which includes data on
direct and guaranteed loans, maximum amounts authorized, and interest and maturity ranges, is published quarterly in the Treasury Bulletin.
Digitized for FRASER http://fraser.stlouisfed.org/ Federal Reserve Bank of St. Louis

400 1977 REPORT OF THE SECRETARY OF THE TREASURY
TABLE 110.—Dividends, interest, and similar earnings received by the Treasury from Government corporations and other business-type activities, fiscal years 1976-77
Agency and nature of earaings Amounts
1976 T.Q. 1977
Agency for Intemational Development: Mutual defense program—economic assistance, interest on borrowings
Commerce Department: Economic Development Administration, economic deyelopment revolving fund, interest on investment
National Oceanic and Atmospheric Administration, fisheries loan fund, interest on investment
Commodity Credit Corporation: Interest on capital stock Interest on borrowings
Community Services Administration: Loan fund, interest on appropriations
Export-Import Bank of the United States: Regular activities: Dividends Interest on borrowings
Farmers Home Administration: Rural development insurance fund, interest on borrowings Rural housing insurance fund, interest on borrowings Agricultural credit insurance fund, interest on borrowings
Federal Financing Bank, interest on borrowings Federal Home Loan Bank Board, revolving fund, interest on borrowings
Federal Housing Administration: General insurance fund, interest on borrowings Special risk insurance fund, interest on borrowings
General Services Administration: Federal buildings fund, eamings Personal property activities, general supply fund, eamings William Langer Jewel Bearing Plant, revolving fund, eamings
Govemment National Mortgage Association: Emergency Home Purchase Assistance Act of 1974, interest on borrowings
Management and liquidating functions, interest on borrowings Special assistance functions, interest on borrowings
Goverament Printing Office, eamings Health, Education, and Welfare Department: Health Resources Administration: Health education loans: Interest on appropriated funds
Nurse training fund: Interest on appropriated funds
Office of Education: Higher education facilities loan and insurance fund: Interest on appropriated funds and capital
$3,201,234
22,727,695
614,329
6,500,000 108,338,858
20,000,000 8,701,678
$132,784
'i9 l'9"8",6Vl
2,950,232
20,000,000 293,399
$29,083,715
536,310
6,625,000 99,191,167
2.279,851
"4*4"39,"4'r2
9,856,493 21,646,302 9,328,515 21,369,795
39,681,103 28,832,433 899.758,837 347,411,453 2,081,891,796
96,636,941 60,683.432 65,732,309
171,343,188 130,528,128
205,387,468 142,206,549
4,434,236 73,650,625
196,344
86,056,823 65,087.688 63.973,260 3.613,825 1.806,912 3,601,623
383,979,278 173,164,698 343,268,228 16,636,572 9.777.352
1.486,088
490,917
30.887.945
1,193,043
398,264
Digitized for FRASER http://fraser.stlouisfed.org/ Federal Reserve Bank of St. Louis

STATISTICAL APPENDIX 401 TABLE WO.—Dividends, interest, and similar earnings received by the Treasury
from Government corporations and other business-type activities, fiscal years 1976-77—Continued
Agency and nature of eamings Amounts
1976 TQ. 1977
Interior Department: Bureau of Reclamation: Colorado River Dam fund, Boulder Canyon project, interest $1,772,263 $525,000 $1,137,561 Colorado River projects, interest on investments 14,036,733 3,542,442 15,216,500
Panama Canal Company, interest on net direct investment of the Govemment 7,627,119 4,100,703 22,531,656
Rural electrification and telephone revolving fund, interest on borrowings 2,239,922 2.329.339 807.958
Rural Telephone Bank: Dividends 2,914,426 791,229 3,647,048 Interest on borrowings 9,174,899 6,896,388 16,174,254
Secretary of Housing and Urban Development: College housing loans, interest on borrowings 72,863,979 35,722,358 70,006,437 National flood insurance fund, interest on borrowings 5,147,089 4,024,105 8,992,836 New communities guarantee fund, metropolitan development, interest on borrowings 10,075 155,233 3,026,329
Revolving fund, liquidating programs, interest on borrowings 14,371,947 Urban renewal fund, interest on borrowings 7,837,112 3,382,186 5,829,205
Secretary of Transportation, regional rail reorganization, interest on borrowings 2,142,077
Small Business Administration, interest on appropriations 213,025,564 324,084,594 Tennessee Valley Authority: Eamings 81,389,374 64,016,716 Interest on borrowings 2,767,548 429,232 1,513,865
Veterans Administration: Direct loans to veterans and reserves, interest on borrowings 9,333,373 4,953,965 10,098,357 Rental, maintenance, and repair of quarters, profits 73 77
Total 2,382,767,695 871,835,830 3,756,798,399
Digitized for FRASER http://fraser.stlouisfed.org/ Federal Reserve Bank of St. Louis

TABLE 111.—Direct sales and repurchases of loans, fiscal year 1967 to date [In miUions of dollars]
Fiscal year or month Total Export-Import Bank of the
United States
Farmers Home Administration
Govemment National Mortgage
Association'
Small Business Administration
Veterans Administration
Sales Repurchases Sales Repur- Sales Repur
chases Sales Repurchases Sales Repur- Sales Repur
chases Ti
m
o H X m W O 73
§ 73
O
*n H X W H 73
^ in C 70
1967 954 92 153 1968 1,070 213 91 1969 1,337 428 379 1970 2,115 842 406 1971 2,548 305 269 1972 3,045 781 248 1973 6,257 330 145 1974 3,903 1,141 21 1975 7,829 1,559 21 1976 11,666 1,281 160 T.Q 2.759 422 1977 7,895 2,121 1976—October 1,142 93
November 508 75 December 789 16
1977—January 1,446 488 February 1 38 March 320 44 April 76 436 May 501 28 June 856 44 July 992 54 August 1,113 70 September 150 734
261 4
187 20
3 2
104
729 974 959
1,668 2,005 2,430 3,324 2,172 6,415 4,247 1,070 5,445
600 14
500 1,158
1 300
2 501 651 752 816 150
50 174 405 569 287 574 284 '2,300
1,105 1,501 1,524 1,232 1,148 6,963
414 1,592 2,083 2,118
93 540 71 482 12 210
484 288 34 1 39
433 24 40 192 51 148 67 258
734
2 (*) (•)
30
2 15 6
(*) 2 1
3 3
(•)
(•)
(•) (*)
71 2 (') 38 244 368 488 209 163 294 96 333 2 .. 12 79
41 24 17 12 12 19 25 30 32 29 6 36
4 4
19 75
13 93 40
* Less than $500,000. 'This Association was created eflfective Sept. 30, 1968, by an act approved Aug. 1, 1968
(12 U.S.C. 1716b). It retained the assets and liabihties ofthe previously existing corporation accounted for under 12 U.S.C. 1720 and 1721 and will continue to operate the functions
authorized by these two sections. Excludes sales and purchases of the secondary market operations of the Federal National Mortgage Association which was converted to private ownership eflfective Sept. 30, 1968, by an act approved Aug. 1, 1968 (12 U.S.C. 1716b).
' Includes sales made under the tandem plan.
Digitized for FRASER http://fraser.stlouisfed.org/ Federal Reserve Bank of St. Louis

STATISTICAL APPENDIX 403
Goyernment Losses in SMpment
TABLE 111.—Government losses in shipment revolving fund, Sept. 30, 1977 [Established July 8, 1937, under authority of the Goverament Losses in
Shipment Act, as amended (40 U.S.C. 721-725)]
I.—STATUS OF FUND
Cumulative Cumulative Transactions through ^ ^ ^ ^ „ „ ^hrough
1976 1977
Receipts: Appropriations r. $5,692,000 $500,000 $6,192,000 Transferred from securities trust fund
pursuant to 40 U.S.C 723 91,803 91,803 Transferred from the account "Unclaimed partial payments
to U.S. savings bonds" pursuant to: Public Law 85-354 50,000 50,000 Public Law 86-561 100,000 100,000 Public Law 87-575 525,000 525,000
Recoveries of payments for losses 550,616 550,616 Repayments to the fund 12,350 8,961 21,311 Unobligated balance of 1975 appropriation withdrawn :. '—332,951 —332,951
Total receipts 6.688.818 508.961 7.197.779
Outlays: Payments for losses '5,666,445 418,667 6,085,112 Other payments (refunds, etc.) 3.719 3.719
Total outlays '5.670.164 418.667 6.088.831
Balance in fund '1,018,654 90,294 1,108.948
'Revised. ' In fiscal 1975, Public Law 93-381, approved Aug. 21, 1974, provided for an appropriation of $600,000 to the
fund, but did not include the usual provision that would have allowed the funds to remain available until expended; therefore, the unobligated balance was returned to the general fund ofthe Treasury.
II—AGREEMENTS OF INDEMNITY ISSUED BY THE DEPARTMENT OF THE TREASURY
Agreements of indemnity' Number Amount
Issued through ^ p t . 30, 1976 '2,156 '$6,360,810 Issued during fiscal 1977 64 171,263
Total issued 2,220 6,532,073 Canceled through Sept. 30. 1977 44 124.696
In force as of Sept. 30, 1977 2,176 6.407,377
'Revised. 'The Government has not sustained any actual monetary loss in connection with its liability under these
agreements of indemnity.
Digitized for FRASER http://fraser.stlouisfed.org/ Federal Reserve Bank of St. Louis

0 0 2
589 2
13,101 38
0 0
1,483
418,667 18.847
14,154,815 23,065
404 1977 REPC li u, rEASURY
TABLE 112.—Government losses in shipment revolving fund, Sept. 30, 1977—Continued
I I I . -CLAIMS MADE AND SETTLED
Claims Number Amount
Through Sept. 30, 1976 12,549 $13,759,278 During fiscal 1977 and processed by—
Bureau of Goverament Financial Operations 3 11,483 Bureau of the Public Debt 587 407,119
Total claims received through Sept. 30, 1977 13.139 14.177,880
Settled: Through Sept. 30, 1976.. 12,508 13,715,818 During fiscal 1977 and processed by—
Bureau of Government Financial Operations: For payment out of the fund For credit in appropriate accounts Without payment or credit
Bureau of the Public Debt: For payment out of the fund: U. S. savings bonds redemption cases Without payment *
Total claims settled through Sept. 30, 1977 Unadjusted as of Sept. 30, 1977
Total 13,139 14,177,880
Personnel
TABLE 113.—Number of employees in the departmental and field services of the Department of the Treasury quarterly from Sept. 30, 1976, to Sept. 30, 1977"
r^,«o«;,of;««oi „«;• Sept. 30, Dec. 31, Mar. 31, June 30, Sept. 30, Organizational umt f ^ j ^ ^ ^ j ^ ^ ^ l^^^ f ^
Oflfice of the Secretary' 1,675 1,662 1,645 Alcohol, Tobacco ahd Firearms, Bureau of 4,119 4,119 4,101 Comptroller of the Currency, Oflfice of the 2,975 2,949 2,923 Engraving and Printing, Bureau of 3,213 3,215 3,169 Federal Law Enforcement Training Center 253 2'50 254 Fiscal Service:
Government Financial Operations, Bureau of 2,655 2,721 2,750 Public Debt, Bureau of the 2,088 2,091 2,028
Intemal Revenue Service 85,265 77,508 «95,717 Mint, Bureau of the 2,995 2,883 2,683 U.S. Customs Service 15,320 15,050 15,126 U.S. Savings Bonds Division 477 488 485 U.S. Secret Service 3.645 3.665 3.688
Total employees 124,680 116,601 134,569 127,321 123,103
»Includes any intermittent employees who worked at any time during the month shown. 'Includes Office ofthe Assistant Secretary for Interaational Aflfairs. 'Includes seasonal employees.
1,745 4,168 2,967 3,188 272
2,786 2,145
88,408 2.514 15,029 482
3.617
1,732 4,011 3,066 3,108 260
2.722 2,090
84,192 2,547 15,248 477
3.650
Digitized for FRASER http://fraser.stlouisfed.org/ Federal Reserve Bank of St. Louis