ara comments to california air resources board – off - bipac
TRANSCRIPT

Analysis of the Impact of the CARB Mobile Off-Road Proposal on ARA Member Businesses
Dr. John McClelland Dr. Michael Graboski
American Rental Associations
March 2006
2
Executive Summary: The Air Resources Board (CARB) presented a set of regulatory concepts at the January 2006 workshop that are the basis for the development of a final regulation to control off-road mobile equipment emissions. CARB requested comments on the regulatory concepts by March 31, 2006. The regulation may be finalized before January 1, 2007. The purpose of the regulation is to move the California mobile off road fleet toward Tier 4 compliance. The Air resources Board set a target of 85% reduction in particulate emissions from the off road mobile fleet in 2020 with the best practicably achievable emissions reductions during the phase in. The program envisions a set of specific compliance dates (2010, 2013, 2017 and 2020) and multiple compliance paths for small and large fleets. Specifically, fleet owners with five or more pieces of equipment (large fleet definition) can elect to meet a “fleet average” compliance target or follow a command and control “Best Available Control Technology” (BACT) approach. ARA members typically turn their fleets rapidly and purchase very little used equipment. There is probably little interest in retrofitting equipment with “Verified Diesel Emissions Control Systems” as envisioned under the BACT compliance approach. The rate of fleet turnover varies across fleets but is a direct function of new equipment costs, sale prices in the resale market, and net rental income. Factors that negatively affect cash flow lengthen the replacement cycle. ARA represents approximately 387 stores in California that rent diesel off-road mobile equipment of which 64 are small businesses with single store operations. The total potential number of stores in California renting such equipment is 1,576. The proposed regulation could impact a considerable number of businesses in California including a large number of single store small businesses. Members were surveyed with regard to fleet characteristics. Over 18,000 pieces of equipment were reported to the fleet sample. By stratifying the data by business size, ARA estimates that the total fleet held by members in California is near 25,500 pieces. The average fleet age is 42 months. Because of the nature of the rental business, a good approximation for the distribution of equipment ages is a uniform distribution. The maximum age of equipment in a uniform distribution is twice the mean age. For the average fleet, the replacement cycle is 7 years and the fraction of equipment replaced annually is about 14.3%. The rental fleet is composed of lighter diesel equipment. The average horsepower rating for the fleet is 70bph. The average use is 439 hours per year. The use varies only modestly across equipment types. Using data from CARB sources, the statewide fleet may average 188 Bhp and operate 948 hours per year. Using CARB data, the average

3
piece of equipment in the statewide fleet in 2000 emitted about six times the emission from a piece of Rental Equipment. ARA estimated that the emissions from ARA owned equipment might constitute 2.7% of the Construction and Mining Emission Budget while representing 15.5% of the statewide fleet. In 2010, without regulation, CARB estimates that the statewide fleet would produce 27% fewer emissions. With normal business practices, the ARA Rental Fleet might provide a 48% reduction. The ARA survey data show that the rental fleet is dominated by engines with rated horsepower less than 100 bhp. Even though ARA members are turning their fleets rapidly and replacing them with the newest low emitting equipment, fleets composed completely of engines of 99 and fewer horsepower will not comply when Averaging on at least one compliance date. Because the rental industry is averse to retrofitting, the BACT approach would be satisfied by replacement. Using the replacement model, only fleets that completely turn over every 5 years can pass the BACT compliance test. ARA believes that CARB should be aggressively targeting older higher emitting equipment. However, the BACT approach allows equipment to remain in service even though only modest emissions benefits might be achieved through the VDECS program because of lack of availability of Level 3 retrofits. In fact, a single analysis shows that if Level 2 retrofits are the highest level available, the emission budget can never approach that provided by Tier 4 emission standards. If the proposed rule is equitable, averaging and BACT should produce equal emissions benefits. CARB has not provided any analysis that shows such equivalency. ARA analyzed an example used by CARB to demonstrate BACT compliance. The BACT compliant hypothetical fleet could not meet the averaging compliance target for any case in 2010 and 2013. If only Level 2 VDECS are available, compliance with the averaging target is never achieved. Under the allowed fleet options, Tier 4 emission levels are never achieved and there are no NOX benefits except from the purchase of a single piece of 2009 equipment. Because CARB would force ARA Rental owners to accelerate their fleet turnover, it would be appropriate for the Agency to justify any such action through a cost analysis. ARA believes that there would a very small benefit in tons per year compared to a relatively large cost imposed on business. An analysis of the impact of the cost of particulate removal as a function of accelerated equipment turnover is required at a minimum to determine whether forcing rental businesses to change their practices is warranted. The cost should be compared to abatement costs used in other CARB analyses.

4
Introduction The Air Resources Board (CARB) presented a set of regulatory concepts at the January 2006 workshop that are the basis for the development of a regulation for off-road mobile equipment emissions control. CARB further indicated that it wanted comments on the regulatory concepts by March 31, 2006. ARA has been working with CARB and its rental members to create a regulatory structure that provides the required clean air benefits without severely penalizing rental businesses whose equipment is relatively new and is not a major source of particulate emissions. The purpose of this white paper is to analyze the CARB proposal with respect to its feasibility, impact and fairness. The regulation should produce emission reduction benefits that result in an equitable burden on affected businesses. Proposed Rule The most current Regulatory Concepts for fleets were made public in January of 2006:
1. The regulation applies to equipment used primarily for construction, mining, landscaping, recycling, land filling, industrial and off-road public fleet purposes. Separate rules apply to agricultural, airport ground and combat equipment.
2. The purpose of the regulation is to force mobile off-road equipment owners to
reduce diesel particulate emissions from their fleets by buying new equipment with lower emissions (Tier1 3 and 4) or by retrofitting existing equipment with approved emissions controls (called VEDECS2).
3. The regulation applies to 25 horsepower and greater mobile off-road engines.
4. There are separate compliance paths for small fleets defined as 4 or fewer pieces
of equipment, and large fleets. Fleet owners with more than four pieces will probably not be able to designate sub-fleets of 4 or fewer pieces located at various sites as separate small fleets.
1 Tier refers to emission standards that depend on engine horsepower. EPA regulations require a timed entry of Tiers 1 through 4. Tier 4 are fully phased-in with Model Year 2013. Tier 0 engines are generally pre 1999 and Tier 1 engines are generally pre-2003, but the year the Tier was implemented depends on engine horsepower. Tier 2, 3 and Tier 4 interim are intermediate standards that are implemented between 2003 and 2008. 2 Under the Verified Diesel Emission Control System (VDECS), the following emissions adjustment factors can be claimed as follows; Level 1 0.75, Level 2 0.50, Level 3 0.15. For level 1, the emission is thus 75% of that for the engine alone.

5
5. Pieces of equipment, regardless of age, that operate for less than 50 hours per year are exempt. By 1/1/2020, low use equipment must be retrofitted to at least Level 2 for small fleets and at least level 3 or Tier 3 for large fleets.
6. CARB is not proposing a formal registration program and fees at this time. Fleet
owners will be responsible for tagging equipment and maintaining records that are adequate to prove compliance for reporting purposes and in the event of a field audit.
7. CARB is silent on how to handle fleets that move equipment routinely across
state lines.
8. Beginning in 2008, it will be illegal to sell, import, deliver, receive or acquire equipment with Tier 0 engines unless the engine is retrofitted with a Level 2 VDECS.
9. Large fleets must limit idle time to 5 minutes or less with exceptions3.
10. All rental fleets must report to CARB by January 1 2008 the details of their
mobile off-road equipment fleets.
11. Large fleet owners can elect to follow an “Averaging” or “Best Available Control Technology” (BACT) approach to compliance.
12. Fleet size changes are immaterial and do not enter into analysis of compliance.
Thus, the regulation does not restrict business growth.
13. Compliance is not based upon hours of operation.
14. Some special provisions and exceptions apply4. The most important is availability of equipment meeting Tier or VDECS requirements.
15. Fleet owners are required to submit detailed compliance reports to CARB in
2010, 2013, 2017, and 2020.
16. CARB is silent on how to fund compliance costs.
17. Failure to comply with any part of the regulation carries a penalty of up to $10,000 for each day the violation persists.
18. Submission of a knowingly false report carries a civil penalty of up to $25,000
for each day the information remains uncorrected.
3 It is nor clear how this would be enforced for rental companies that are not equipment operators. 4 The provisions as written seem to apply only to BACT.

6
19. Authority for penalties is authorized in Section 44381 of the California Health and Safety Code.
Small Fleet Compliance
As of Jan 1, 2008, small fleets are prohibited from adding any equipment that is Tier 1 or 0 unless it has been retrofitted with a Level 2 VDECS. As of January 1, 2017, small fleets cannot operate Tier 0 or Tier 1 equipment unless it is low use or is equipped with “Level 2” controls. As of January 1, 2020, low use Tier 0 and Tier 1 equipment must be retrofitted to “Level 2”.
Large Fleet Compliance As of January 1, 2008, each large fleet (5 pieces or more of greater than 25 horsepower off-road mobile equipment) must report which compliance path it will follow. The choices are fleet averaging or applying Best Available Control Technology (BACT). Once a path is chosen, the owner cannot change the fleet designation. Fleet owners must demonstrate compliance by either average or BACT in each of the four compliance years (2010, 2013, 2017, 2020).
Fleet Averaging Approach:
With fleet averaging, there is no use restriction, retrofit or replacement requirement on any specific piece of equipment in the fleet. Owners can choose a replacement and retrofit approach that is best for that business. Low use equipment is not included in the averaging analysis. Table 1 shows fleet average emissions proposed by CARB that cover the four compliance years and three classes of fleets. Each fleet is split into three sub-fleets; these are equipment under 175 hp and equipment 175 hp to 749 hp and 750 and over hp. Each fleet owner must choose the appropriate class based upon the fleet makeup. Two classes, “Construction and Mining” and “Industrial” could apply to rental companies.
Table 1 Construction and Mining Sub-Fleet Average Targets, g/bhp-hr
Compliance Date 26 to 174hp 175 to 749hp 750hp+
1/1/2010 0.30 0.15 0.16 1/1/2013 0.13 0.07 0.09 1/1/2017 0.10 0.05 0.07 1/1/2020 0.08 0.04 0.06
7
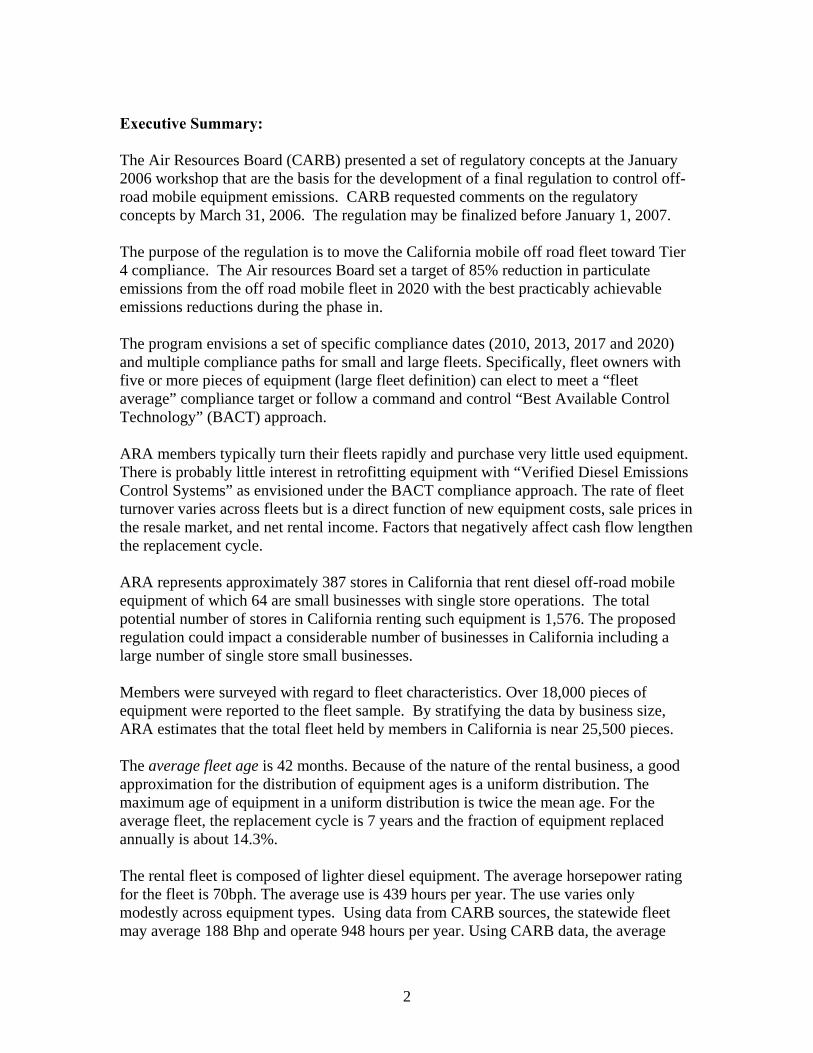
Industrial Sub-Fleet Average Targets, g/bhp-hr
Compliance Date 26-174 hp 175-749 hp 750 hp+ 1/1/2010 0.30 0.19 0.17 1/1/2013 0.14 0.09 0.11 1/1/2017 0.10 0.05 0.10 1/1/2020 0.08 0.04 0.09
The fleet owner will be responsible for obtaining the emission factor5 for each certified engine (generally Tier 1 through 4) in the fleet from either the equipment or engine manufacturer. CARB has proposed factors for older engines (generally Tier 0) that were not certified to an emission tier. For each sub-fleet, the horsepower weighted emission is calculated and compared against the CARB maximum emission for the appropriate fleet class6. If the sub-fleet average is equal to or less than the compliance standard, the fleet is in compliance. BACT Path
Under BACT, CARB requires that every piece of equipment be replaced, repowered or retrofitted with a particulate control device certified under the VDECS program to meet a specific standard in accordance with a time schedule. For most situations, repowering is not a technically feasible option. Thus the choice is to sell equipment and replace it or install a VDECS. Table 2 provides the compliance schedule. Because the availability of VDECS for off-road equipment is and may be very limited, complying is very complicated and doesn’t provide the guaranteed particulate emissions reduction benefits of replacement.
5 The particulate emission factor is the emission in grams/brake-horsepower hour for that engine as obtained from Certification Testing. Engines with the same use, certain characteristics and emissions controls are included in a “Family”. All Family members have the same emissions factor. 6 The calculations is as follows:
1. Multiply the rated horsepower of each engine in the subfleet by its emission factor and if a VEDECS device is installed, multiply by the VDECS adjustment factor.
2. Sum the multiplication products in line 1. 3. Sum the rated horsepower values for all of the engines in the subfleet. 4. Divide the sum in line 3 into the sum in line 2.
8
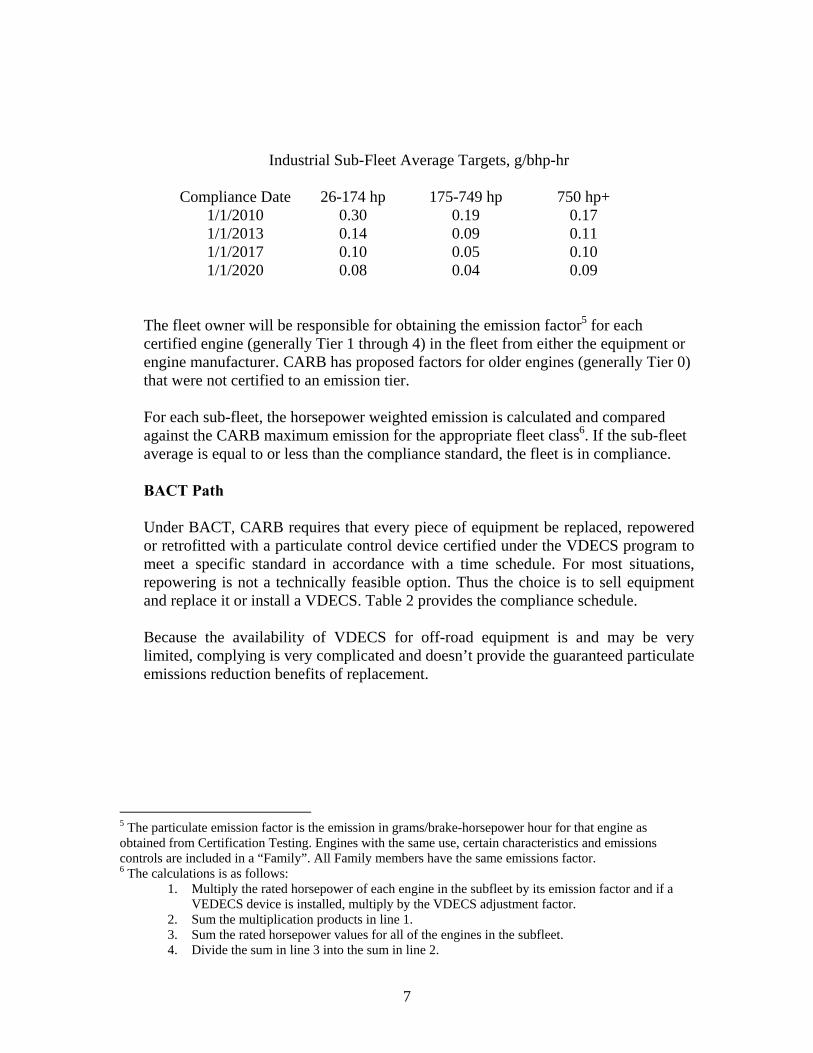
Table 2 BACT Compliance Dates
Group Engine
Model Year Compliance Phase-in Dates, Jan 1 of year shown
% Of the Fleet in each Group 25% 50% 75% 100% 1 Pre 1988 2009 2010 2011 2012 2 1988-1995 2011 2012 2013 2014 3 1996-2002 2010 2011 2012 2013 4 2003-2006 2012 2013 2014 2015 5 2007-2021 MY+5 MY+6 MY+7 MY+8
Rental Industry Replacement Strategy The rental industry generally purchases new equipment. The industry would most likely be averse to retrofitting equipment because it is recognized that equipment renters desire newer equipment that has a higher degree of reliability and the most modern conveniences. The age of equipment at the time of replacement is a function of income and expense streams. The most important are revenues derived from rental income and salvage value while costs include maintenance, which increases with age, and depreciation. Economic analysis of asset replacement is well developed in the economics literature. Using techniques such as dynamic programming and optimal control have allowed economists to investigate complex economic relationships that determine the optimal replacement time of assets being used by profit maximizing firms. Subsequent discussions of data we have analyzed for this report will support the contention that rental businesses participate in a competitive market with few barriers to entry. Thus the rental industry in California and elsewhere can be characterized by the competitive economic model of which the optimal asset replacement model is a well developed extension. For a single replacement cycle, the present value of all net revenue streams is as follows:
C(t,1) = ∫ R(t) exp[-k(t)]dt + M(t) exp(-kt) – M(0)
Where: C(t,1) is the net present value of all revenue streams at time t during a replacement cycle
R(t) is the net revenue due to renting up to time t M(t) is the value of the equipment at time t M(0) is the value of the equipment at the time it is put in service k is the discount rate
The Optimal Replacement Time for a Single Cycle is found by maximizing the net present value.

9
R(T) + M′ (T) = kM(T)
Where: T is the optimal replacement time in the cycle of interest M′ is the rate of change of the salvage value with time
The replacement model can be extended to an infinite number of replacements:
R(T) + M′(T) = k{M(T) + C(T, ∞)} Where
C(t,∞) is the present value of net revenue from an infinite series of identical replacement cycles, C(t,1)
The replacement time depends on each company’s financial requirements and business performance. The optimal replacement time is a function of local market conditions. In poor business climates, equipment utilization may be reduced, lowering net revenue. With lower utilization, there could be sufficient competition to affect rental rates such that individual businesses might not be able to increase rates to make up for decreased utilization. Thus, it would be expected that replacement times would lengthen. However, from an emissions perspective, lower utilization would mean fewer emissions. An important issue related to the lengthening of the optimal replacement time is any negative impact the proposed regulation has on the resale market. It is possible that the regulation could positively impact the resale market in California because holders of older equipment might replace those units with newer used equipment under the BACT program. The cost of adding VDECS could reduce the resale value because procurement of new equipment could become more attractive. However, if the price of new equipment increases, many businesses might opt to buy used equipment delaying the introduction of true Tier 4 equipment and the collateral emissions benefits it brings to the California market. CARB has provided no analysis of the effect of their program on complying equipment costs in either the primary or secondary equipment market. The goal is to track how regulation impacts total emissions over time. While the regulation is health based, it can only be effectively implemented if the cost burden does not disrupt business. The final targets for emissions reductions during phase-in years should not be arbitrarily established to satisfy a Board edict, but instead the program phase-in should consider economic as well as technical feasibility. This means that the measure of compliance during phase-in should be flexible. No matter how the phase-in is accomplished, the overall goal of the entire California fleet being Tier 4 compliant is achievable in 2020 assuming the engine and pollution control manufacturers can deliver products.

10
Analysis of the Impact of CARB Compliance Paths on Rental Fleets The fleet averaging path and the BACT path could be satisfied by replacement of equipment. Both approaches do not exclude older equipment. Under averaging the fleet owner chooses how to meet fleet emission targets using a formula that includes replacement, repowering or retrofitting. Under BACT, a schedule based on equipment age must be met. Both approaches allow fleet owners to hold on to old equipment indefinitely as long as it is retrofitted. Results of the ARA Equipment Survey ARA, via its member census, generally categorizes its members by rental income and main business function. The functions are construction and industrial equipment, general tool and party. Many businesses derive some rental income from two or three of these functions. Member census data are available that provide an estimate of the fraction of rental income by function. ARA also surveyed its members to determine the number, types, engine sizes and ages of equipment in member fleets as a part of its analysis of this regulatory process. The response to the survey was skewed to the larger firms (>$500K of annual rental income). According to the census, firms doing most or all of their business renting construction equipment represent 65% of ARA businesses in California. However, rental equipment could be powered by diesel fuel, gasoline or electricity. Based upon survey responses, it was assumed that all larger businesses (>$500K rental income) renting construction equipment owned some mobile diesel equipment over 25 bhp. Based on survey response, more information on smaller businesses was deemed necessary. A sample of the smaller ARA members (<$500K) was polled by phone to determine whether they rented any diesel mobile equipment over 25 bhp. Essentially all of the smaller businesses operate single stores. Larger businesses may have multiple store locations. Table 3 summarizes the sampling of small members (10% error at 90%CI).
Table 3 Sampling Results for Small Members (<$500K)
Population 110 Businesses and Stores Count Percent Not Affected 15 42% Affected, large 14 39% Affected, small 7 19% Sample Size 36 100%
The resulting estimated distribution of businesses by income and function is as follows:

11
Table 4
ARA Businesses by Function and Rental Income
<$500K $501K-$3MM $3-$10MM $10-$30MM >$30MM Total Construction Equipment, diesel 64 56 15 5 1 140 Construction Equipment, other 46 0 0 0 0 46 Tool and Party 73 23 0 0 0 96 Total 183 79 15 5 0 282
Of the 140 businesses renting diesel construction equipment, it is estimated that 12 (10%) have 4 or fewer pieces of equipment. 128 ARA member businesses are affected by the proposed large fleet regulation. The estimated number of ARA member stores renting 25 hp diesel off-road mobile equipment is approximately 387 as shown in Table 5:
Table 5 ARA Stores by Function
Construction Equipment, diesel 387 70.7% Construction Equipment, other 46 8.4% Tool and Party 113 20.7% Unidentified 1 0.2% Total 547 100.0%
Population of California Rental Businesses The purpose of this analysis is to estimate the population of affected California rental businesses who have construction equipment. The website www.yellowpages.com was used to establish a list of California stores that rent equipment, tools and supplies. The search tool7 yielded three yellow pages categories For the state, the total identified population was established from the following categories:
Contractors Equipment and Supplies 620 Contractors Equipment and Supplies-Renting 518 Rental Service Stores and Yards 2,031 Total 2,443
The actual number of unique business addresses may be more or less than this number. The “yellow pages” may not list all stores. Some stores have multiple telephone numbers or were listed under multiple categories and can thus be double counted. The number of replicates was found to be 487 leaving 1,956 unique business addresses.
7 The “yellowpages” search tool allows distance to be used as a criterion. Sacramento was used as the base, and distance was expanded to 500 miles. The search tool then allowed only California listings to be displayed.

12
The “yellow pages” may not find all relevant businesses. There is no way to know if the particular database is all-inclusive. The ratio of ARA stores to total “yellow page” stores is known. This was compared against the actual ratio of ARA member stores to yellow page stores found by count in the “yellow pages” population. If the yellow pages capture all businesses, the ratio should be the same. A random sample of unique business addresses was selected from the 1,956 elements. For 5% error with 90% confidence, a sample of 231 businesses is required. Such a sample was found to contain 41ARA stores. Therefore as the following table shows, the number of rental businesses operating in California may be significantly larger than identified using the “yellow pages” search tool.
Number of ARA stores in sample 41 Sample Size 231
% In Sample 18 Number of Stores in ARA Database 547 “Yellow pages” Population 1,956 % in Population 28
Adjusted Population of Businesses 3,082
Of the 231 IDs in the sample, it was possible to eliminate 64 that did not directly rent equipment, tools or party supplies. Using these data, 72.3% of the adjusted yellow pages population is actually rental stores. The number of rental stores in California with the ARA functions is estimated to be 2,228. If the 70.7% of ARA stores renting equipment to all ARA member stores is universally true, there could be 1,576 equipment rental stores in California that are impacted by this regulation. Thus, the regulation will impact a large number of businesses, many of which are small businesses in California. ARA Fleet Data
The fleet sampling was carried out in two steps. The objective of the first round was to obtain a picture of fleet in terms of equipment type, power rating and average age. Figures 1 and 2 show fleet distribution by horsepower and equipment type obtained in the first round of sampling. The data are provided in appendix 1. In the second round, businesses were asked to provide some details on equipment selected at random from their fleets to gauge use by equipment type. The second stage is more labor intensive and the response to the survey was less complete. The data are provided in Appendix 2. The sample fleet consisted of 18,051 pieces of equipment purchased new and 613 pieces of equipment purchased used. Thus, only about 3.3% of equipment in the ARA fleet was bought used. 74.5% of equipment pieces are between 50 and 99 bhp and 85.6 % are below 100hp. 96.4% of equipment pieces are under 175 bhp. The same sample of businesses reported 3,870 pieces of portable equipment purchased new and 163 pieces of equipment purchased used. Thus, the estimated ratio of off-road mobile to portable equipment in the ARA fleet is 4.6:1.

13
Based upon the sample data and income strata, the average number of pieces of equipment in fleets in the strata was estimated. Data for the <$500K businesses were apportioned by small and large fleet percentages. Using business count in each strata, The total fleet was estimated. The results are shown in Table 6.
Table 6
ARA Rental Fleet Equipment Count <$500K $501K-$3MM $3-$10MM $10-$30MM >$30MM Total Average Count/Business
Small-2, Large-9 41 359 1,474 10,078
Equipment Count 420 2,277 5,385 7,372 10,078 25,532
Because of the good response to the survey for the top three revenue categories, the estimated equipment count is most likely a good representation of the true ARA rental fleet count. The top five types of equipment are compactor, backhoe, boom lift, aerial lift and skidsteer. Individual ARA businesses generally rent a mixture of construction and industrial equipment. The majority of the equipment types fall under construction and mining. Based upon the Phase 1survey, the average age of equipment purchased new in the rental fleet is 37.2 months. The correlation coefficient for age and fleet size is –0.152 and the p-value is 0.675. Fleet age does not depend on size. This suggests that major chain and large independents use a similar business model that expects newer equipment to maximize profitability. The average fleet age is 42.0 months. Because of the nature of the rental business, a good approximation for the distribution of equipment ages is a uniform distribution. The maximum age of equipment in a uniform distribution is twice the mean age. For the average fleet, the replacement cycle is 7 years and the fraction of equipment replaced annually is about 14.3%. The following summary data are available for the Phase 2 sample of equipment in Appendix 2.
Table 7
Summary Data for Detailed Equipment Sample
Average Age
Months Annual
Use, Hrs Rated
Horsepower Mean 36.5 439.0 69.5
Upper 95% Confidence 40.4 479.4 74.0 The sample of detailed equipment may be representative of the fleet data collected in the first phase of the survey. If the sample is randomly drawn from the fleet as a whole, the

14
size of the sample is sufficient to describe the population with 10% error at 95% confidence. While each fleet was sampled randomly, there were fewer responses than
Figure 1
Mobile Equipment by Type in Rental Fleet
813
217
2195
1639
2489
649525
2292
202
2485
0
489 563
317
36 099
3083
74 8
2014
150
500
1000
1500
2000
2500
3000
3500
Off-Highway
truck
s
Crane
Aerial
Lifts
Forklift
Boom forkl
ift
Materia
l Han
dler
Mobile C
oncrete/
Industrial
Saw
Crawler
Doze
r
Wheel D
ozer
Track L
oader/
Backh
oe
Wheel L
oader/
Backh
oe
Crawler
Tractor
Wheel T
ractor
Excav
ator
Trench
er
Grader
Paver
Planers
and re
claim
ers
Compactor a
nd rolle
r
Sweeper
Scraper
Skid Stee
rOther
Cou
nt

15
Figure 2 In the second Phase. This could introduce a sampling bias. The sample depicts a fleet
with similar age and horsepower distribution compared to the Phase 1 survey. Table 8 summarizes the data collected from the second phase of the survey by equipment type. The data show that for all types of equipment, the typical horsepower is under 175 and most types exhibit average horsepower under 100 hp.
Table 8 Equipment Data by Type
Type Count Oldest Newest Age Annual Hours Bhp Min Bhp Max Bhp Aerial Lift 4 2000 2003 4.7 396.4 46.0 36 56 Backhoe 29 1998 2005 3.0 505.3 83.5 67 92 Boom Lift 16 2000 2005 4.2 447.0 51.3 40 75 Track loader 1 2004 2004 1.8 313.2 67.0 67 67 Dozer 4 1998 2005 3.2 509.2 94.8 84 115 Excavator 13 2000 2005 1.8 657.5 38.8 25 141 Forklift 24 1997 2005 2.9 402.0 92.5 59 142 Grader 1 2004 2004 1.5 599.1 138.0 138 138 Roller 7 2000 2005 2.2 231.7 59.9 33 99 Skidsteer 37 1998 2005 2.4 409.0 53.1 43 80 Material handler 14 1998 2004 3.9 397.7 83.8 73 125 Tractor 1 2001 2001 4.7 106.9 27.5 28 28 Trencher 6 1994 2004 5.9 154.0 44.7 43 45 Wheel Loader 5 2002 2005 1.8 856.6 141.4 101 185 Other 1 1999 1999 6.6 262.9 36.0 36 36
ARA Survey Data Off- Road Mobile Equipment by Engine Size
1809
13064
1899
73326
54458 10
0
2000
4000
6000
8000
10000
12000
14000
25 to 49 hp 50 to 99 hp 100 to 174 hp 175 hp and larger
Engine Size Group
Cou
nt
Counts - Purchased NewCounts- Purchased Used

16
Statewide Emissions Budget and an Estimate of the Size of the Total Rental Fleet In the CARB Diesel Risk Reduction Program (DRRP), the total population of construction and mining equipment was estimated to be 164,020 pieces of equipment. At the “Workgroup Meeting to Discuss Inventory and Regulatory Concepts” (The Workshop) the Construction and Mining Fleet size was estimated to be 161,583 pieces. The year 2000 DRRP Construction and Mining emission budget is reported to be 7,721 TPY. The budget is estimated to fall to 5,658 TPY in 2010 without regulation. According to data from McKay present at The Workshop, the average age of equipment when scrapped is on the order of 20 years. A rough comparison of the total statewide fleet and the ARA fleet can be made using the DRRP and The Workshop data. At The Workshop, annual use data and equipment count were tabulated. Using these data, ARA estimates that the by piece annual use was 948 hours per year using the 2005 Fleet and 2003 TIAX survey data and the McKay fleet counts. For the 2000 fleet, to satisfy the total fleet emission budget, the indicated average horsepower of the statewide fleet is calculated by ARA to be approximately 188 using a 0.6 g/bhp-hr emission factor with a 40% duty cycle. These data suggest that the off-road construction and mining fleet is older, contains larger equipment and is operated for more hours than the ARA rental fleet. ARA believes that it represents most of the larger businesses renting construction equipment. The ARA fleet is estimated to be 25,532 pieces. CRA members, for example, are composed of single store or at most stores with a few branches. The estimate of fleet size in single stores is 6.5 pieces per store. For businesses with rental incomes between $500K and $3MM, there are 56 ARA member businesses with 88 stores. These businesses have an estimated 25.9 pieces per store. The weighted count by store is 17.7 pieces of equipment. The total number of non-ARA stores estimated from the total population is estimated to be 1,189. Thus the unaccounted for fleet could be 21,097 pieces. The total rental fleet could be 46,629 pieces or approximately 28% of the state construction and mining fleet. Emission Benefits From Fleet Rollover Using the available Phase 2 detailed survey data, the Table 9 and 10 provide distributions for equipment purchase dates and horsepower rating.
Table 9
Horsepower Distribution ARA Fleet
Bhp Count Frequency
25-49 62 38.3% 50-74 32 19.8% 75-99 50 30.9%

17
100-174 18 11.1% 162 100.0%
Table 10
Purchase Year Distribution ARA Fleet- 1st Q 2006
Purchase
Year Count Fraction 1994 1 0.006 1995 0 - 1996 0 - 1997 2 0.012 1998 6 0.037 1999 5 0.031 2000 26 0.160 2001 10 0.061 2002 11 0.067 2003 42 0.258 2004 35 0.215 2005 25 0.153 2006 0 0
In estimating the emissions contribution for the ARA fleet, it is assumed that equipment model year and engine model year are the same. It is also assumed that averaging and banking credits does not impact emission factors. The subset of data with equipment one year old or more (so that at least one full year of hours are available) and where horsepower and use data are available was formed. These data were analyzed by regression to determine if there was any correlation between use, engine size and age. The data were analyzed with the linear model: Average Annual Use = a + b* hp + c * age
Table 11 Regression Analysis of Phase 2 Survey Data
Multiple R 0.469 R Square 0.220 Adjusted R Square 0.201 Standard Error 158.320 Observations 88.000 ANOVA
df SS MS F Significance F Regression 2 600146 300073 11.97 0.0000 Residual 85 2130539 25065 Total 87 2730685

18
Coefficients Standard Error t Stat P-value Intercept 279.871 58.814 4.759 0.000 Age -12.233 7.717 -1.585 0.117 Horsepower 2.438 0.581 4.195 0.000
The correlation suggests that larger equipment is used more than smaller equipment and newer equipment is used more than older equipment. This means that using the average age and horsepower to characterize the fleet will overestimate the fleet emissions. The equipment model year distribution was rolled forward and backward to estimate the average emission factor for the ARA rental fleet as a whole. The average annual use from Table 78 was assumed and but the emission factors were horsepower weighted. Table 12 shows the results9 for weighted emission factors, tons per year of particulate produced and fleet reductions for the ARA fleet.
Table 12 Emission Factors and Fleet Emissions for the ARA Fleet
Year Factor, g/bhp-hr
EmissionsTPD
Emissions Change
2000 0.615 211.3 0.0% 2010 0.317 108.8 48.5% 2013 0.233 80.2 62.0% 2017 0.074 25.3 88.0% 2020 0.026 9.0 95.8%
The estimated percentage of statewide construction and mining equipment emissions produced by the ARA rental fleet is 2.7% of the CARB year 2000 estimate, while the ARA Fleet represents 15.5% of the total equipment count estimated by CARB. The prorated share of emissions from the ARA fleet in 2000 is expected to be 1,204 TPY. Each piece of ARA equipment generates about one sixth the emissions of the average piece of equipment in the 2000 CARB statewide fleet. The statewide reduction without regulation is estimated to be 27% in 2010 compared to the 48.5% achieved through normal business practices for the rental fleet. While the final quantitative comparison may vary as CARB continues its due diligence and ARA collects additional data, it appears clear that the rental fleet is not a major contributor to the overall state emission budget and that any attempt to impose a more aggressive reduction of emissions from the rental fleet will provide few additional tons
8 This average prorates less than 1-year old equipment to a full year and gives a slightly higher use than the regression model in Table 11 yielding a higher fleet emission. 9 The off-road steady state emission test duty cycle is estimated to be 40% of the engine rated horsepower.

19
per year of emission benefits. Without any regulation, the ARA fleet will meet the Board’s 85% target three years early and will be essentially Tier 4 compliant in 2020. Averaging Analysis
The Regulatory Compliance Dates are January 1 of the years 2010, 2013, 2017, and 2020. The Table 13 demonstrates that Tier 3 and 4I (interim) are fully phased in before the first Compliance Date. ARB has provided a Special Provision that allows engines “scheduled to be retired within 1 year of the compliance deadline” in the BACT case. It is not clear that such a provision applies to averaging, and so the provision was not used in the averaging analysis. For fleets that are predominantly 75 bhp and greater, Tier 4 engines are available in 2012, while for 25 to 74 bhp engines, they become available in the 2013 compliance year. Importantly the table shows that EPA particulate standards for Tier 1, 2 and 3-4I smaller engines are higher than for corresponding larger engines.
Table 13 Tier Implementation dates and Emissions Standards
Rated Horsepower Range Min 25 50 75 100 175 300 600 750+ Max 49 74 99 174 299 599 749 Tier Model Year
1 1999 1998 1998 1997 1996 1996 1996 2000 2 2004 2004 2004 2003 2003 2001 2002 2006
3, 4I 2008 2008 2008 2007 2006 2006 2006 4 2013 2013 2012 2012 2011 2011 2011
Min 25 50 75 100 175 300 600 750 Max 49 74 99 174 299 599 749
Tier Particulate Emission Standard g/bhp-hr 1 0.6 NA NA NA 0.4 0.4 0.4 0.4 2 0.45 0.3 0.3 0.22 0.15 0.15 0.15 0.15
3-4I 0.22 0.22 0.3 0.22 0.15 0.15 0.15 0.07 4 0.02 0.02 0.015 0.015 0.015 0.015 0.015 Impact on Rental Fleets

20
The CARB Board required staff to achieve an 85% reduction in 2020 with latitude during the phase-in period. Assuming the rental fleet average age and the rental industry uniform replacement model, the composite rental fleet is completely turned over in seven years. The ability of individual fleet owners to meet the CARB Compliance Targets was evaluated as a function of the size of equipment in their fleets. The analysis shows that the CARB averaging option is not equitable across horsepower groupings in the 25 to 174 range because of implementation dates and standards in the EPA Tiers.
If it is assumed that the fleet is composed of a single horsepower in the 100 to 174 bhp range, Table 14 shows that the rental replacement model is adequate to meet all of the Compliance Targets. The percent reduction is compared to the corresponding 2000 fleet. As long as annual use is the same, this is a robust result because the fleets are composed of very new equipment powered by engines that are within their useful lives. This means that the engine particulate emission should never exceed its certification value and in fact could be cleaner than the standard if the deterioration factor is different from zero.
Table 14 Averaging Compliance of a Fleet with 100-174 bhp Equipment
Fleet Turnover 7 Years
Year CARB Target Emission % Reduction 2010 0.30 0.15 56% 2013 0.13 0.13 62% 2017 0.10 0.05 85% 2020 0.08 0.02 94%
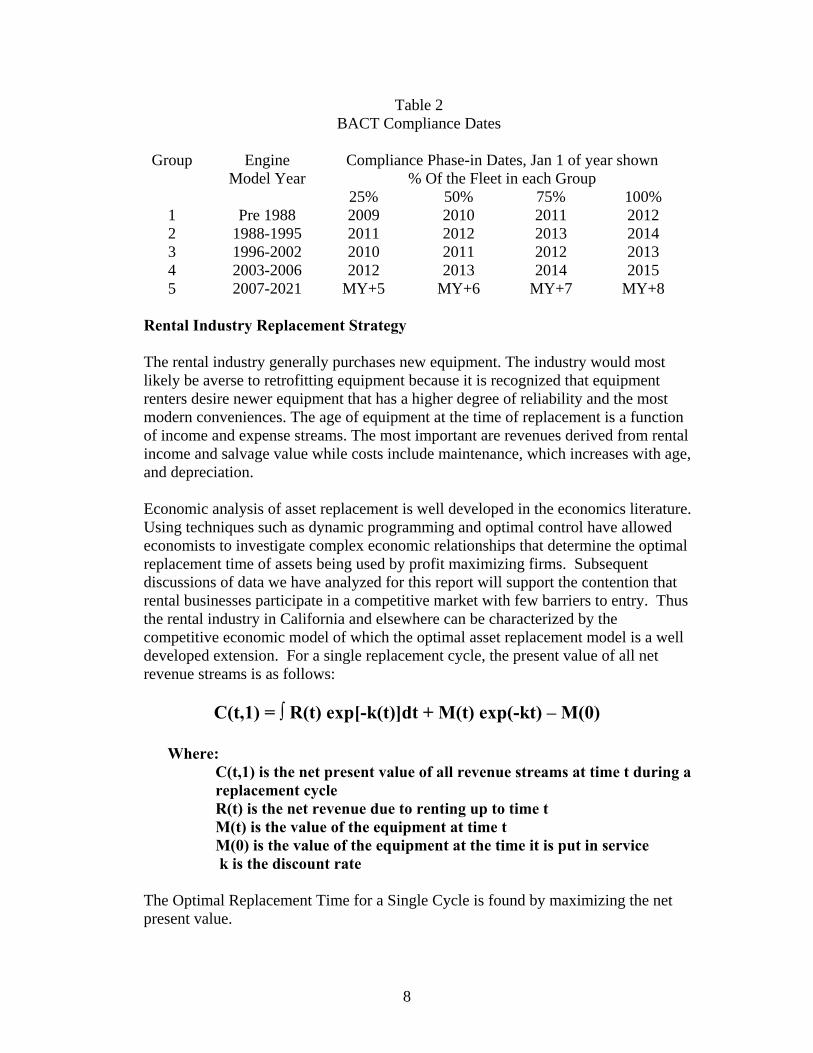
The ARA survey data show that the rental fleet is dominated by engines with rated horsepower less than 100 bhp. If the fleet is composed of engines of 99 and fewer horsepower, it is not possible to comply in at least one compliance period with the targets by the same normal rental industry replacement practices. The calculations in the following tables assume single horsepower fleets in the appropriate horsepower ranges. Tables 15 through 17 show that the average compliance values cannot be achieved by turnover of the average rental fleet in seven years because that fleet is composed mostly of equipment with engines that have less than 99bhp. As the engine size becomes smaller, compliance becomes increasingly more difficult.
Table 15 Averaging Compliance of a Fleet with 75-99 bhp Equipment
21
Fleet Turnover 7 Years Year CARB Target Emission % Reduction 2010 0.30 0.33 48% 2013 0.13 0.21 67% 2017 0.10 0.07 89% 2020 0.08 0.02 97%
Table 16 Averaging Compliance of a Fleet with 50-74 bhp Equipment
Fleet Turnover 7 Years Year CARB Target Emission % Reduction 2010 0.30 0.33 48% 2013 0.13 0.24 62% 2017 0.10 0.11 83% 2020 0.08 0.02 97%
Table 17
Averaging Compliance of a Fleet with 25-49 bhp Equipment
Fleet Turnover 7 Years Year CARB Target Emission % Reduction 2010 0.30 0.41 39% 2013 0.13 0.29 57% 2017 0.10 0.11 84% 2020 0.08 0.02 97%
Table 18 shows that it is not even possible to meet the CARB Compliance targets with a 3-year replacement cycle for fleets with 25-49 horsepower engines.
Table 18
Averaging Compliance of a Fleet with 25-49 bhp Equipment
Fleet Turnover 3 Years Year CARB Target Emission % Reduction 2010 0.30 0.30 55% 2013 0.13 0.22 67% 2017 0.10 0.02 97% 2020 0.08 0.02 97%
An analysis of the impact of the cost of particulate removal as a function of accelerated equipment turnover is required at a minimum to determine whether forcing rental businesses to change their practices is warranted for the benefits achieved. It should be noted that the typical rental fleet turnover provides much greater benefits compared to the Compliance Targets in 2020, as all fleets become fully Tier 4 compliant.

22
These benefits result because the rental industry relies on equipment replacement rather than retrofits. Moreover, the State of California will achieve substantial NOX benefits along with PM reductions as the rental fleet turns over annually. Under the averaging process, rental fleet owners could elect to add VEDECS and defer replacement of equipment. The purpose would be to try to meet interim targets for particulate. This added expense would lengthen the turnover period and probably result in the loss of some out year particulate benefits and NOX benefits. Planning on using VDECS is risky because unlike the BACT path, no special VDECS provisions appear to apply to averaging as a result of VDECS availability. Furthermore, under averaging, owners are at the mercy of engine manufacturers who use averaging and banking credits to produce Tier-compliant equipment that does not meet the appropriate tier particulate emissions standards. No such limitation applies to BACT. This could hinder competition because some owners would have to buy the lower emitting equipment rather than to buy the low bid equipment. A second scenario is that fleet owners would be forced to buy equipment that is not consistent with standardized models in their fleets. This could impact maintenance cost by requiring additional spare parts and tools to be kept in inventory as well as requiring more extensive training of mechanics. BACT Analysis:
Because the rental industry is averse to retrofitting, the BACT approach would be satisfied by replacement. Based upon the uniform distribution replacement assumption, the simplest way to test for compliance is against the 25% of fleet Compliance date. Table 19 shows that for 2013, 28% of the fleet is non-complying because action is needed to be taken in a prior year relative to the compliance year. In fact, only fleets that have an average age of 2.5 years or less can pass the BACT approach by replacement.
Table 19 BACT as Applied to the Rental Fleet
% Annual Replacement
Compliance Year and Fleet Makeup
Data Compliance date 2013
14% 2012 2017 14% 2011 2016 14% 2010 2015 14% 2009 2014 14% 2008 2013 14% 2007 2012 14% 2006 2012

23
Averaging Versus BACT Benefit- Using the CARB Example If the proposed rule is equitable, averaging and BACT should produce equal emissions benefits. CARB presented a valid BACT compliance example for a Tier 0 fleet at the January 2006 workshop. In the example, four under-175 bhp Tier 0 pieces of equipment are present in a larger fleet. Table 20 summarizes engines, emissions factors and VDECS available.
Table 20 Data for Example Calculation
MY Tier Bhp EF
VDECS Available
on Compliance
Date
BACT Compliance
Date
1986 0 95 0.756 None 2009 1997 0 96 0.621 1 to 3 2010 1999 0 96 0.621 1 to 3 2011 1999 0 96 0.621 1 to 3 2011
For the 1986 piece of equipment, CARB assumed that no VDECS was available. BACT requires this equipment be repowered to the available Tier. For this case, the equipment is repowered or replaced with a Tier 3 compliant unit in 2009. For the remaining pieces of equipment, CARB assumed that VDECS are available. In the CARB example, it is assumed Level 3 is available for the three engines. In this analysis, it is also assumed that the highest level available is 1 and 2. It is further assumed that a Level 3 VDECS becomes available for every engine in 2016. If Level 1 is available on the compliance date, all three pieces of equipment must be retrofitted to Level 3 in 2016 or replaced with Tier 4 equipment at the choice of the owner. In this analysis, it is assumed that level 3 VDECS becomes available. Adding a VDECS is assumed to be the low first cost option. Since the fleet was so old to begin with, it appears that the BACT decision would be made on first cost. Since no VDECS was available for the piece of equipment replaced in 2009, a Level 3 VEDECS is required as soon as available. In this case, that unit is retrofitted in 2016 as well. For the three pieces retrofitted in 2010 and 2011, if Level 2 is available, no further action is necessary. Table 21 shows the emissions benefits for this hypothetical fleet following the averaging method. It should be recognized that the emissions factors for the engines in this old fleet are assumptions and are not based on any certification process.
Table 21
Emission Comparison of BACT and Averaging Averaging Cases Year Target Lev 1 Lev 2 Lev 3
2000 0.65 0.65 0.65 2008 0.65 0.65 0.65 2009 0.54 0.54 0.54

24
2010 0.30 0.50 0.46 0.41 2011 0.42 0.31 0.14 2012 0.42 0.31 0.14 2013 0.13 0.42 0.31 0.14 2014 0.42 0.31 0.14 2015 0.42 0.31 0.14 2016 0.08 0.24 0.08 2017 0.10 0.08 0.24 0.08 2018 0.08 0.24 0.08 2019 0.08 0.24 0.08 2020 0.08 0.08 0.24 0.08
For this hypothetical fleet, compliance with the averaging target is not achieved for any case in 2010 and 2013. If only Level 2 VDECS are available, compliance with the averaging target is never achieved. Under the allowed fleet options, Tier 4 emission levels are never achieved and there are no NOX benefits except from the purchase of a single piece of 2009 equipment. It is evident that the BACT approach can be more forgiving than averaging. Furthermore, there is no incentive to replace equipment with new equipment if VDECS are available. BACT encourages fleet owners to keep old equipment and spend the least amount to become compliant. Averaging, at least as would be practiced by rental companies, is a clear path toward Tier 4. However, rental owners might have difficulty meeting averaging targets because of the unavailability of engines with emissions low enough to meet CARB targets. CARB should endeavor to make the two approaches neutral from an environmental impact perspective. Conclusions: CARB is preparing to convert their regulatory concepts into a formal regulatory proposal. The regulation will affect all business that own diesel mobile off-road equipment over 25 horsepower. The purpose of the regulation is to reduce diesel particulate emissions. The Board has mandated an 85% reduction by 2020 with the best practicable reduction during the interim. In response, CARB staff has proposed a plan that considers small fleets and large fleets separately. Large fleets must meet either specific fleet averages or equipment retrofits through a Best Available Control Technology program in 2010, 2013, 2017 and 2020. Small fleets have been determined to be minor emitters. These two large fleet options should be expected to yield similar emissions reduction benefits. However, in one example case proposed by CARB that was analyzed in this paper, it was shown that actual benefits delivered by could be much less than benefits achieved from averaging.

25
The CARB survey and contractor response in workshops suggests that construction industry contractors hold equipment a long time, rebuilding as necessary. They may also be significant purchasers of used equipment. It is appropriate to target this older equipment for emission reduction. Unlike the construction industry, which holds on to equipment for a very long time, rental businesses turn equipment relatively quickly, possibly 7 years on average. Rental owners may be averse to retrofitting under a BACT program and BACT compliance dates appear to not be consistent with rental fleet turnover practices. Averaging can work for rental fleets; however, the CARB proposed averaging limits do not take EPA later Tier implementation dates and higher emission level standards into account. Since rental business fleets are dominated by the lower horsepower range being regulated, it may be difficult for many fleet owners to comply while turning over equipment following their normal business practices. The emissions inventory and cost benefits of forcing rental businesses to comply with either the averaging or BACT approaches as proposed have not been quantified. The achievable emissions reductions during the phase-in should not be based upon arbitrary targets suggested by the staff or Board but based upon economic and technical feasibility. An analysis of the impact of the cost of particulate removal as a function of accelerated equipment turnover is required at a minimum to determine whether forcing rental businesses to change their practices is warranted.

26
Appendix 1 Counts By Type and Horsepower
Counts - Purchased New Counts- Purchased Used Totals Type 25 to 49 50 to 99 100 to 174 >= 175 25 to 49 50 to 99 100 to 174 >=175 New Used Grand Off-Highway trucks 0 250 80 374 0 12 12 0 704 24 728Crane 0 107 2 100 1 6 0 2 209 9 218Aerial Lifts 359 1877 2 0 16 77 0 0 2238 93 2331Forklift 45 1489 56 0 4 60 0 0 1590 64 1654Boom forklift 101 1852 733 0 0 60 0 0 2686 60 2746Material Handler 13 355 163 0 0 50 0 0 531 50 581Mobile Saw 0 500 0 0 0 25 0 0 500 25 525Crawler Dozer 2 156 60 4 0 7 0 0 222 7 229Wheel Dozer 1 0 0 0 0 0 0 1 1 1 2Track Loader/Backhoe 0 179 15 0 0 4 4 0 194 8 202Wheel Loader/Backhoe 19 2009 288 140 0 39 3 1 2456 43 2499Crawler Tractor 0 0 0 0 0 0 0 0 0 0 0Wheel Tractor 64 251 232 6 0 6 3 0 553 9 562Excavator 285 129 134 25 1 0 7 0 573 8 581Trencher 177 111 39 0 0 5 0 0 327 5 332Grader 0 1 23 8 0 0 0 4 32 4 36Paver 0 0 0 0 0 0 0 0 0 0 0Planers, reclaimers 99 0 0 0 0 0 0 0 99 0 99Compactor,roller 186 2656 136 0 4 126 10 0 2978 140 3118Sweeper 70 14 0 0 0 2 0 0 84 2 86Scraper 0 0 0 8 0 0 0 0 8 0 8Skid Steer 622 1428 1 0 0 51 10 0 2051 61 2112Other 0 15 0 0 0 0 0 0 15 0 15Total 2043 13379 1964 665 26 530 49 8 18051 613 18664

27
Appendix 2 Sample of Rental Equipment Types, Usage and Horsepower
Equipment Type Equipment Model
Year Manufactu
rered Equip In
service date
Total Hours
Used to 1/1/06 Age, yrs
Average Use, hrs/yr
Hours used in 2005
Engine Manufacturer & Model
Rated Horsepower
Aerial Lift Genie S45 2000 8-Nov-00 1898.2 5.2 368.5 494.5 Deutz F3L1011 36 Aerial Lift Genie S45 2000 8-Nov-00 1979.3 5.2 384.3 349.8 Deutz F3L1011 36 Aerial Lift Genie S-65 2000 1-May-00 2463.5 5.7 434.2 438.9 Deutz F4L1011F 56 Aerial Lift Genie S-65 2003 25-Mar-03 1106.3 2.8 398.6 284.5 Deutz F4L1011F 56 Backhoe Case 580L 2000 30-Jun-00 4198 5.5 761.9 1031 Cummins 4B3.9 70 Backhoe Deere 410E 2000 12-Apr-00 2197 5.7 383.7 163 Deere 4045T 90 Backhoe Deere 410E 2000 15-Jun-00 3500 5.6 630.6 462 Deere 4045T 90 Backhoe CASE 580M 2003 2-Jul-03 1414 2.5 564.7 311 Cummins 4B3.9 73 Backhoe Deere 410G 2003 23-May-03 2.6 Deere 4045T 92 Backhoe Deere 310G 2004 1-Jun-04 1005 1.6 633.5 546 Deere 4045D 70 Backhoe Deere 410G 2005 13-Jul-05 380 0.5 806.4 199 Deere 4045T 92 Backhoe Extendahoe 2001 27-Apr-01 4.7 86 Backhoe Extendahoe 2003 3-Sep-03 2.3 86 Backhoe Extendahoe 2003 3-Sep-03 2.3 86 Backhoe Extendahoe 2003 8-Oct-03 2.2 86 Backhoe Extendahoe 2003 3-Oct-03 2.2 86 Backhoe Extendahoe 2003 3-Oct-03 2.2 86 Backhoe Extendahoe 2003 8-Oct-03 2.2 86 Backhoe Extendahoe 2003 21-Nov-03 2.1 86 Backhoe Extendahoe 2003 21-Nov-03 2.1 86 Backhoe Extendahoe 2003 21-Nov-03 2.1 86 Backhoe Extendahoe 2003 21-Nov-03 2.1 86 Backhoe Extendahoe 2004 2-Dec-04 1.1 86

28
Backhoe Extendahoe 2004 30-Nov-04 1.1 86 Backhoe Extendahoe 2004 1-Dec-04 1.1 86 Backhoe Extendahoe 2004 30-Nov-04 1.1 86
Backhoe Ford 545D 1998 26-Oct-98 1359.4 7.2 189.1 188.4 New Holland
332T/JC 67
Backhoe Ford 545D 2001 17-Apr-01 826.7 4.7 175.4 89.8 New Holland
332T/JC 67
Backhoe New Holland 555E 2000 7-Jul-00 2668 5.5 485.9 265.7 New Holland 450/NC 83
Backhoe New Holland 555E 2001 2-Mar-01 2312.2 4.8 477.9 251.7 New Holland 450/NC 83
Backhoe Cat 420D 2002 1-Jul-02 1837.9 3.5 524.1 867.8 Perkins 1948/2200 85 Backhoe Cat 420D 2002 1-Jul-02 1757.2 3.5 501.1 423.2 Perkins 1948/2200 85 Backhoe Cat 420D 2003 31-Dec-03 871.5 2.0 434.6 375 Perkins 1948/2200 85 Boom Lift JLG 600A 2000 1-Sep-99 2700 6.3 425.9 63 Deutz F4M-1011F 65 Boom Lift JLG 2000 1-May-00 2902 5.7 511.5 432 Deutz F4M-1011F 65 Boom Lift JLG 400S 2002 5-Jul-02 1324 3.5 378.7 180 Deutz F3M-1011 48 Boom Lift JLG 600S 2002 9-Jul-02 1703 3.5 488.7 130 Deutz F4M-1011F 65 Boom Lift Genie S-125 2002 3-May-02 684 3.7 186.5 120 Cummins 4B3.9 75 Boom Lift JLG 460SJ 2003 21-Jul-03 670 2.5 273.2 268 Deutz F3M1011 48 Boom Lift Genie S-45 2004 8-Feb-05 1022 0.9 1140.8 429 Perkins 404C-22 51 Boom Lift JLG 860SJ 2004 2-Jul-04 614 1.5 409.0 585 Deutz F4M2011L 65 Boom Lift JLG 460SJ 2005 28-Apr-05 142 0.7 209.0 141 Deutz F3M1011 48 Boom Lift 2000 23-May-00 5.6 40 Boom Lift 2000 23-May-00 5.6 40 Boom Lift 2000 23-May-00 5.6 40 Boom Lift 2000 23-May-00 5.6 40 Boom Lift 2000 17-Jan-00 6.0 40 Boom Lift 2000 23-May-00 5.6 50 Boom Lift 2001 9-Jan-01 5.0 40
Dozer Deere 650G-LGP 1998 29-Jun-98 4601 7.5 612.2 372 Deere 4045T 90
Dozer Deere 700H 2003 18-Jun-03 1187 2.5 466.9 533 Deere 6068T 115 Dozer Deere 650J 2005 20-Sep-04 589 1.3 459.4 268 Deere 4045T 90
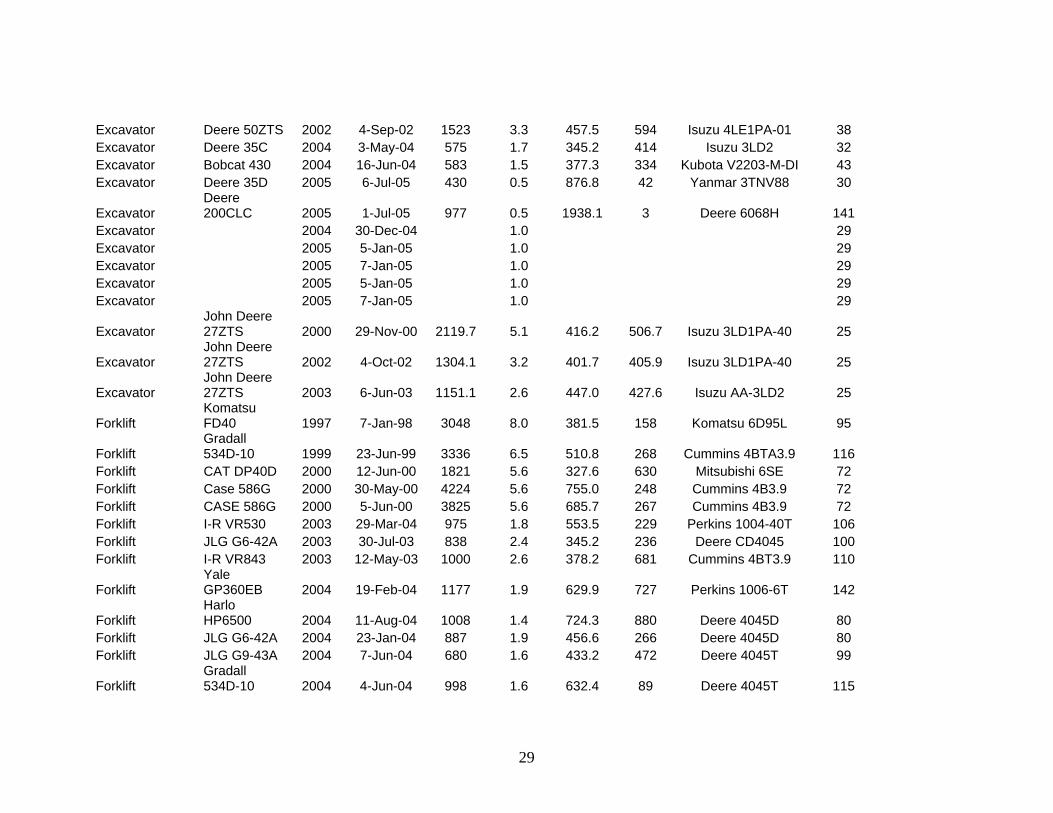
29
Excavator Deere 50ZTS 2002 4-Sep-02 1523 3.3 457.5 594 Isuzu 4LE1PA-01 38 Excavator Deere 35C 2004 3-May-04 575 1.7 345.2 414 Isuzu 3LD2 32 Excavator Bobcat 430 2004 16-Jun-04 583 1.5 377.3 334 Kubota V2203-M-DI 43 Excavator Deere 35D 2005 6-Jul-05 430 0.5 876.8 42 Yanmar 3TNV88 30
Excavator Deere 200CLC 2005 1-Jul-05 977 0.5 1938.1 3 Deere 6068H 141
Excavator 2004 30-Dec-04 1.0 29 Excavator 2005 5-Jan-05 1.0 29 Excavator 2005 7-Jan-05 1.0 29 Excavator 2005 5-Jan-05 1.0 29 Excavator 2005 7-Jan-05 1.0 29
Excavator John Deere 27ZTS 2000 29-Nov-00 2119.7 5.1 416.2 506.7 Isuzu 3LD1PA-40 25
Excavator John Deere 27ZTS 2002 4-Oct-02 1304.1 3.2 401.7 405.9 Isuzu 3LD1PA-40 25
Excavator John Deere 27ZTS 2003 6-Jun-03 1151.1 2.6 447.0 427.6 Isuzu AA-3LD2 25
Forklift Komatsu FD40 1997 7-Jan-98 3048 8.0 381.5 158 Komatsu 6D95L 95
Forklift Gradall 534D-10 1999 23-Jun-99 3336 6.5 510.8 268 Cummins 4BTA3.9 116
Forklift CAT DP40D 2000 12-Jun-00 1821 5.6 327.6 630 Mitsubishi 6SE 72 Forklift Case 586G 2000 30-May-00 4224 5.6 755.0 248 Cummins 4B3.9 72 Forklift CASE 586G 2000 5-Jun-00 3825 5.6 685.7 267 Cummins 4B3.9 72 Forklift I-R VR530 2003 29-Mar-04 975 1.8 553.5 229 Perkins 1004-40T 106 Forklift JLG G6-42A 2003 30-Jul-03 838 2.4 345.2 236 Deere CD4045 100 Forklift I-R VR843 2003 12-May-03 1000 2.6 378.2 681 Cummins 4BT3.9 110
Forklift Yale GP360EB 2004 19-Feb-04 1177 1.9 629.9 727 Perkins 1006-6T 142
Forklift Harlo HP6500 2004 11-Aug-04 1008 1.4 724.3 880 Deere 4045D 80
Forklift JLG G6-42A 2004 23-Jan-04 887 1.9 456.6 266 Deere 4045D 80 Forklift JLG G9-43A 2004 7-Jun-04 680 1.6 433.2 472 Deere 4045T 99
Forklift Gradall 534D-10 2004 4-Jun-04 998 1.6 632.4 89 Deere 4045T 115
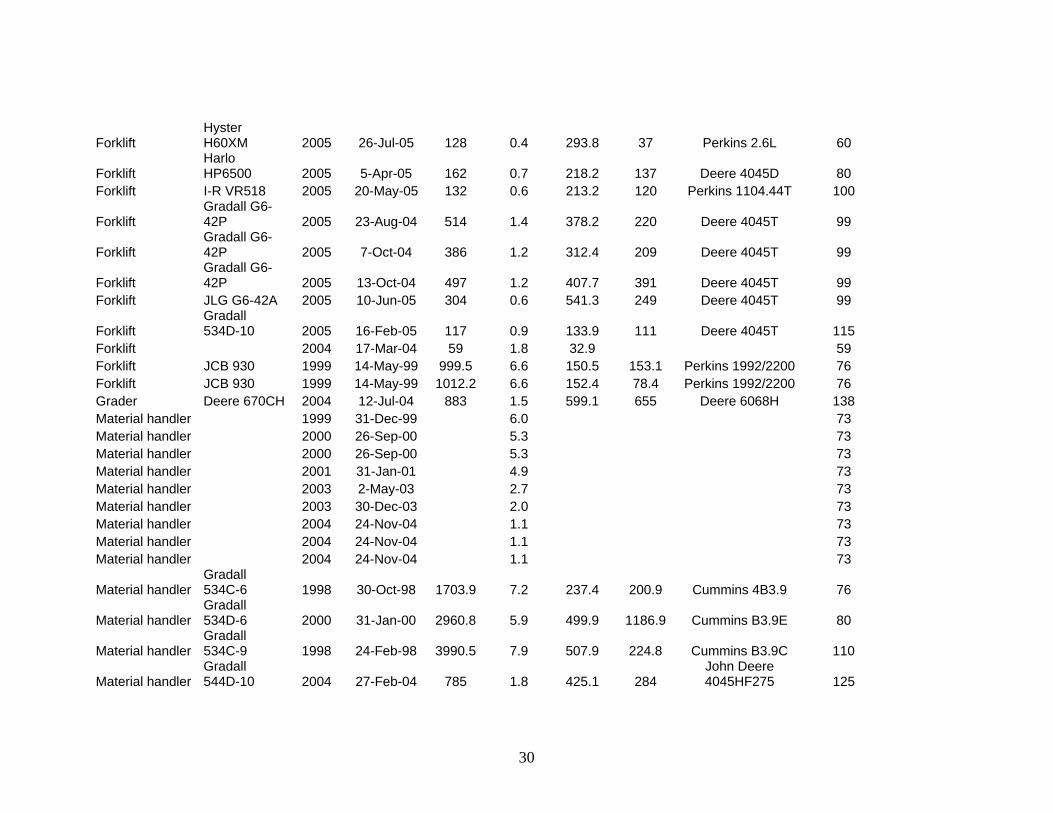
30
Forklift Hyster H60XM 2005 26-Jul-05 128 0.4 293.8 37 Perkins 2.6L 60
Forklift Harlo HP6500 2005 5-Apr-05 162 0.7 218.2 137 Deere 4045D 80
Forklift I-R VR518 2005 20-May-05 132 0.6 213.2 120 Perkins 1104.44T 100
Forklift Gradall G6-42P 2005 23-Aug-04 514 1.4 378.2 220 Deere 4045T 99
Forklift Gradall G6-42P 2005 7-Oct-04 386 1.2 312.4 209 Deere 4045T 99
Forklift Gradall G6-42P 2005 13-Oct-04 497 1.2 407.7 391 Deere 4045T 99
Forklift JLG G6-42A 2005 10-Jun-05 304 0.6 541.3 249 Deere 4045T 99
Forklift Gradall 534D-10 2005 16-Feb-05 117 0.9 133.9 111 Deere 4045T 115
Forklift 2004 17-Mar-04 59 1.8 32.9 59 Forklift JCB 930 1999 14-May-99 999.5 6.6 150.5 153.1 Perkins 1992/2200 76 Forklift JCB 930 1999 14-May-99 1012.2 6.6 152.4 78.4 Perkins 1992/2200 76 Grader Deere 670CH 2004 12-Jul-04 883 1.5 599.1 655 Deere 6068H 138 Material handler 1999 31-Dec-99 6.0 73 Material handler 2000 26-Sep-00 5.3 73 Material handler 2000 26-Sep-00 5.3 73 Material handler 2001 31-Jan-01 4.9 73 Material handler 2003 2-May-03 2.7 73 Material handler 2003 30-Dec-03 2.0 73 Material handler 2004 24-Nov-04 1.1 73 Material handler 2004 24-Nov-04 1.1 73 Material handler 2004 24-Nov-04 1.1 73
Material handler Gradall 534C-6 1998 30-Oct-98 1703.9 7.2 237.4 200.9 Cummins 4B3.9 76
Material handler Gradall 534D-6 2000 31-Jan-00 2960.8 5.9 499.9 1186.9 Cummins B3.9E 80
Material handler Gradall 534C-9 1998 24-Feb-98 3990.5 7.9 507.9 224.8 Cummins B3.9C 110
Material handler Gradall 544D-10 2004 27-Feb-04 785 1.8 425.1 284
John Deere 4045HF275 125

31
Material handler Gradall 544D-10 2004 27-Feb-04 587.5 1.8 318.2 331.9
John Deere 4045HF275 125
Other Genie Z45/25 1999 21-May-99 1741 6.6 262.9 185 Deutz F3L-1011 36 Roller IR SD40-FB 2000 6-Jun-00 1412 5.6 253.3 413 Deere 4039D 76 Roller 2004 4-Oct-04 1.2 E 34 Roller 2004 12-Oct-04 1.2 E 34 Roller I-R SD-25FB 2005 8-Mar-05 132 0.8 161.1 116 Kubota V2203-M 44 Roller I-R SD-70FB 2005 22-Jun-05 178 0.5 336.6 173 Cummins 4BT3.9 99 Roller I-R SD-70D 2005 22-Jun-05 145 0.5 274.2 131 Cummins 4BT3.9 99
Roller Wacker RD25 2000 23-Oct-00 692.1 5.2 133.2 96.1 Hatz 2M41L 33
Skidsteer Deere 210LE 2002 9-Aug-02 2445 3.4 719.1 689 Deere 4045D 78 Skidsteer Bobcat S150 2003 22-Oct-03 2.2 46 Skidsteer Bobcat S150 2003 22-Oct-03 2.2 46 Skidsteer Bobcat S150 2003 29-Oct-03 2.2 46 Skidsteer Bobcat S150 2003 1-Nov-03 2.2 46 Skidsteer Bobcat S150 2003 5-Dec-03 2.1 46 Skidsteer Bobcat S150 2003 20-Nov-03 2.1 46 Skidsteer Bobcat S150 2003 20-Nov-03 2.1 46 Skidsteer Bobcat S150 2003 1-Nov-03 2.2 46 Skidsteer Bobcat S150 2003 30-Oct-03 2.2 46 Skidsteer Bobcat S150 2003 10-Nov-03 2.1 46 Skidsteer Bobcat S150 2003 8-Jan-04 2.0 46 Skidsteer Bobcat S150 2003 11-Dec-03 2.1 46 Skidsteer Bobcat S150 2003 18-Dec-03 2.0 46 Skidsteer Bobcat S150 2003 30-Dec-03 2.0 46 Skidsteer Bobcat S150 2003 12-Jan-04 2.0 46 Skidsteer Bobcat S150 2003 16-Dec-03 2.0 46 Skidsteer Bobcat S150 2003 2-Jan-04 2.0 46 Skidsteer Bobcat S220 2003 8-Dec-03 2.1 75
Skidsteer Case 570MXT 2004 26-Oct-04 175 1.2 147.9 Cummins 4B3.9 73
Skidsteer Bobcat 2004 29-Mar-04 661 1.8 375.2 365 Kubota V3300T-TE 75

32
S220H Skidsteer Deere 210LE 2005 2-Jun-05 415 0.6 711.2 348 Deere 4045T 80
Skidsteer Case 570MXT 2005 24-Jun-05 200 0.5 382.2 194 Case 4-390 73
Skidsteer Bobcat S130 2005 1-Apr-05 100 0.8 132.7 94 Kubota V2203-M-DI-
E28 46 Skidsteer Bobcat 753 1998 4-Jun-98 1950.3 7.6 257.2 50.2 Kubota V2203-E 43 Skidsteer Bobcat 753 2000 8-Dec-00 1794.5 5.1 354.1 155.6 Kubota V2203-E 43 Skidsteer Bobcat 753 2000 8-Dec-00 1965.5 5.1 387.8 373.6 Kubota V2203-E 43 Skidsteer Bobcat 753 2001 17-Apr-01 2070.8 4.7 439.4 389.9 Kubota V2203-E 43 Skidsteer Bobcat 753 2001 18-Apr-01 1700.6 4.7 361.1 299.5 Kubota V2203-E 43 Skidsteer Bobcat S130 2004 16-Aug-04 679.8 1.4 493.3 432.3 Kubota V2203-M-DI 43 Skidsteer Bobcat S130 2004 16-Aug-04 790.7 1.4 573.8 516 Kubota V2203-M-DI 43 Skidsteer Bobcat S130 2004 24-Aug-04 736.5 1.4 543.1 546 Kubota V2203-M-DI 43 Skidsteer Bobcat S130 2004 24-Aug-04 586.8 1.4 432.7 387.9 Kubota V2203-M-DI 43 Skidsteer Bobcat 863 2001 23-Aug-01 1186.5 4.4 272.0 247.9 Deutz 1BF4M1011F 73 Skidsteer Bobcat 863 2001 23-Aug-01 1396.7 4.4 320.2 288.6 Deutz 1BF4M1011F 73 Skidsteer Bobcat S220 2004 9-Aug-04 560.7 1.4 401.3 419.4 Kubota V3300-DI-T 75 Skidsteer Bobcat S220 2004 9-Aug-04 651.5 1.4 466.3 466.3 Kubota V3300-DI-T 75
Track Loader Takeuchi TL130 2004 17-Mar-04 562 1.8 313.2 260 Yanmar 4TNE98 67
Tractor Kubota L3000DT 2001 4-May-01 499 4.7 106.9 73 Kubota 27.5
Trencher D-W 3700 2004 4-Jun-04 255 1.6 161.6 184 Deutz F3L1011 43
Trencher Ditch Witch 3500 1994 1-Aug-94 1429.8 11.4 125.1 51.1 Deutz F3L1011F 45
Trencher Ditch Witch 3700 1997 13-Jun-97 1458 8.6 170.3 133 Deutz F3L1011F 45
Trencher Ditch Witch 3700 1998 30-Jun-98 1363.5 7.5 181.5 74.7 Deutz F3L1011F 45
Trencher Ditch Witch 3700 2002 16-Nov-02 429.2 3.1 137.2 144.5 Deutz F3L1011F 45
Trencher Ditch Witch 3700 2002 16-Nov-02 463.4 3.1 148.1 134 Deutz F3L1011F 45
Wheel Loader Deere 544H 2002 5-Aug-02 1440 3.4 422.2 303 Deere 6068T 130
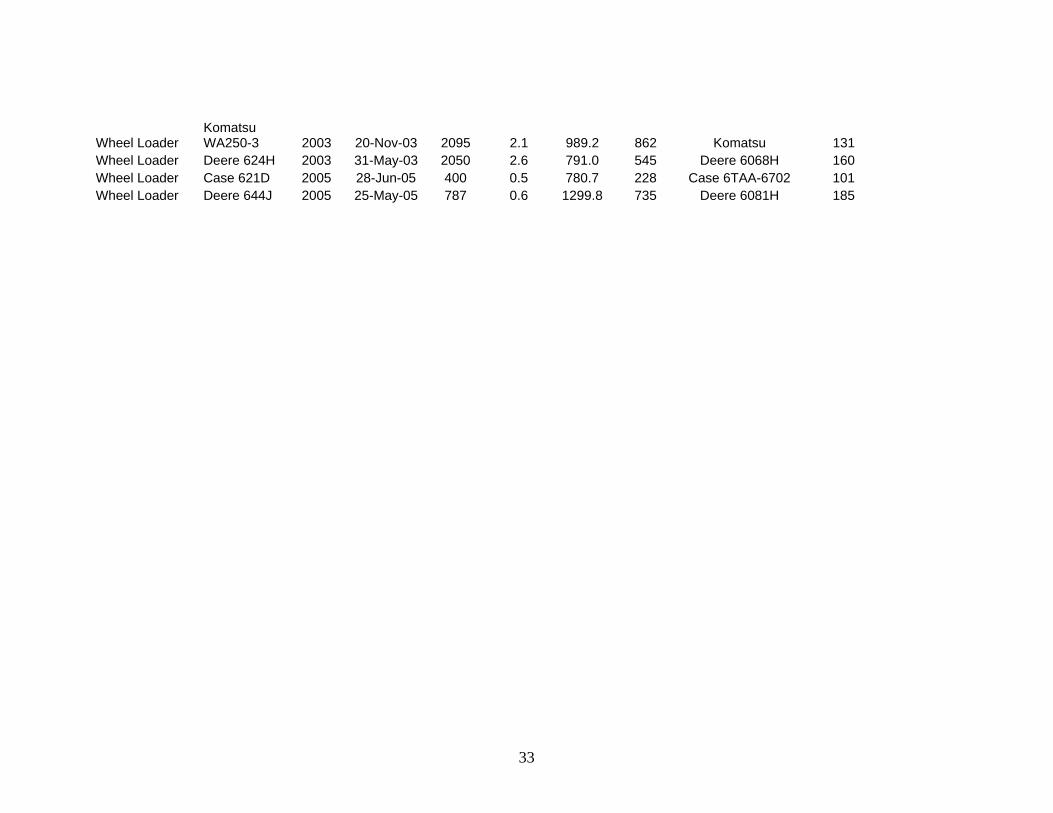
33
Wheel Loader Komatsu WA250-3 2003 20-Nov-03 2095 2.1 989.2 862 Komatsu 131
Wheel Loader Deere 624H 2003 31-May-03 2050 2.6 791.0 545 Deere 6068H 160 Wheel Loader Case 621D 2005 28-Jun-05 400 0.5 780.7 228 Case 6TAA-6702 101 Wheel Loader Deere 644J 2005 25-May-05 787 0.6 1299.8 735 Deere 6081H 185