arab reinsurance company, lebanon are you adequately ... of loss cat_0.pdf · sum insured band no...
TRANSCRIPT

Date 31st October 2011
Arab Reinsurance Company, Lebanon
Are you adequately protected?
Strictly Private and Confidential
Presented by:
Basma Barakat
Head of Technical Department

Are you covered?
Insurance

Catastrophic trends increasing globally?
2011 registered one of the worst natural & man made catastrophic losses
since 2001 – Economic Losses will exceed US$1 Trillion!
Images courtesy of AP and Reuters
HuricaineIrene
$7bn
Japan Earthquake
$250 bn
New Zealand
Earthquakes $16bn
Thailand Flood $13bn
Figures courtesy of Earthquake Report & Middle East Insurance news
$2-$3 bn $15-$20 bn $3-$8 bn $3-$5 bn
Insured Losses

Catastrophic trends increasing globally?
It has even reached our markets!
Images courtesy of AP and Reuters
Arab Political Waves
$20 bn
Turkish Earthquake
?
Figures courtesy of Al Bawaba
Insured Losses
? ?

What’s at stake?
HAZARD
• Probability
• Magintude
• Duration
Exposure
• Location
• Construction
• Age of Buildings
Damage
• Physical Damage
• Repair cost
Insured Loss / Terms of Covers

Insurance Companies:
Images courtesy of AP and Reuters
Exposure
Property & Engineering
Motor
Life & Health
Marine
Solutions
Risk Transfer
Captive
Risk Transfers
Proportional Treaties
Non-Proportional Treatie
CAT Pool

Designing a reinsurance protectionBasic questions to ask
Mandatory capital requirement and financial capability
Risk appetite and the relationship between the reinsurance
retention and the overall profitability of the company?
How much volatility to
transfer? Consistency with the goal set by the shareholders?
Expertise and know-how?
Frequency vs. Severity?
In which form / type of
reinsurance protection? Expected premium income?

What are we dealing with – What’s the make-up of the portfolio?
Random fluctuations like severity and volatility,
accumulation, frequency, etc.
Structural changes like inflation, global
warming and population growth
Errors in data analysis, models and in pricing.
(Models are TOOLS not the truth!)
Portfolio Risk

Basic Reinsurance Structure followed in the Arab Insurance Market:
QS Treaty
Surplus Treaty
Retention
CAT XL Cover offering protection for the cedant’s retention against
an accumulation of small/medium losses arising from one event
Depending on the size and make up of this portfolio, the CAT Cover
will be purchased in Layers
Pricing method used for CAT XL Cover relies ideally on Exposure &
Experience method combined

To set the proper path towards choosing & pricing the CAT XL Cover, the
insurance company’s portfolio needs to demonstrate the following:
CAT XL Structure
Class of Business per type of risk
(Industrial, Commercial, etc…)
Homogenous Risks
Territory / Exposure
Sum Insured versus PML/EML
Direct Insurance versus facultative reinsurance

Step 1: Setting the Retention/Priority
Return Period
• 1 in 100 year event
• 1 in 250 year event
• 1 in 500 year event
Capital
• Yearly dependence on the capital, rule of thumb 10% of Capital?
Risk Appetite – Risk Aversion
• The BOD’s decision, how much to retain?
No wrong retention?!

Step 1: Setting the Retention/Priority (Cont)
Risk appetite / Risk Aversion
• What is shareholder’s risk appetite and the level of risk they are willing to take?
• High Risk is necessary for high return!
0%
5%
10%
15%
20%
25%
30%
35%
0.00 1.00 2.00 3.00 4.00 5.00 6.00 7.00
Risk - Standard Deviation
Avera
ge P
rofit

Step 2: Prepare the Data:
Risk Profiles per type of Risk
Sum Insured Band No of
Policy
Aggregate Sum
Insured
Total
Premium AV Rate Retention
Quota
Share
1st
Surplus
- 250,000 340 48,000,000 670,000 1.40% 148,000 222,000 300,000
250,001 500,000 400 155,000,000 450,000 0.29% 122,000 183,000 145,000
500,001 1,000,000 650 500,000,000 670,000 0.13% 180,000 270,000 220,000
1,000,001 1,100,000 65 70,000,000 104,000 0.15% 21,600 32,400 50000
1,100,001 1,200,000 60 72,000,000 95,000 0.13% 22,000 33,000 40000
ETC….
Premium
For Example – All Commercial Property
Aggregate Sum Insured Per Region/Zone
Loss history – IF any

Step 3: Deciding on how much protection to buy:
Aggregate Total Sum Insured
• Per Zone (Cresta Zone for EQ)
• Per Area/Region exposed
• Know your maximum accumulation
Probable Maximum Loss
• Set by CAT actuarial models
• Not much modeling done in our region
Solvency / Capital
• How much strain are we placing on our capital & what’s the return period?

Step 4: Exposure Rating
Establish a suitable loss distribution curve (CAT) or Poison Tables (Risk)
Actuarial tools which determines price of a cover using the probability of an event occurring the 1st time, the 2nd time, etc…
Establish a catastrophe premium
Risk premium per band estimated by applying a loss ratio to the GNPI
Do not account for the risk premium for the retention
Establish an estimate maximum loss
What is the expected PML? CAT PML for instance can be found through CRESTA
No real significant real experience available
It uses expected loss based on likely exposure

Step 4: Exposure Rating (Cont)
RISK XL COVERS
An example of pricing using one of Lloyd’s first loss scale:
Sum Insured BandNo of
Policy
Retained Sum
Insured
Retained
PremiumMid point
Layer 4,000,000 XS 1,000,000
Exposure as
% of Mid
Point
Priority as
% of Mid
Point
Rating
Factor
Exposure
Premium
0 1,000,000 1000 150,000,000 450,000 500,000 0 100 0 0
1,000,001 2,000,000 540 220,000,000 270,000 1,500,001 33 67 14 37,800
2,000,001 3,000,000 650 134,328,358 180,000 2,500,001 60 40 21 37,800
3,000,001 4,000,000 200 800,000,000 900,000 3,500,001 71 29 27 239,400
4,000,001 5,000,000 185 900,000,000 1,000,000 4,500,001 78 22 32 320,000
5,000,001 6,000,000 100 520,000,000 550,000 5,500,001 73 18 32 176,000
6,000,001 7,000,000 120 756,000,000 700,000 6,500,001 62 15 29 203,000
7,000,001 8,000,000 75 550,000,000 440,000 7,500,001 53 13 29 127,600
8,000,001 9,000,000 40 352,000,000 281,600 8,500,001 47 12 30 84,480
9,000,001 10,000,000 10 925,000,000 740,000 9,500,001 42 11 29 214,600
Total 5,307,328,358 5,511,600 1,440,680
ROL 26%Payback Years 3.8

Step 4: Exposure Rating (Cont)
CAT XL COVERS
An example of pricing a CAT XL Cover using the same data & Lloyds’ first
loss scale:
ROL 2.4%Payback Years 41
Layer: 20,000,000 XS 2,000,000
GNPI 5,511,600
PML (2% of Aggregate) 106,146,567
Limit 20,000,000
Priority 2,000,000
Loss Cost 16,011,590
Rating Factor (1st Loss Scale) 3%
Pure Exposure Rate 8.7%
Premium to Layer 480,348

Step 4: Exposure Rating (Cont)
An example of the Swiss Re exposure curves & MBBFED distribution class
There are numerous industry severity curves based on “similar” portfolios:
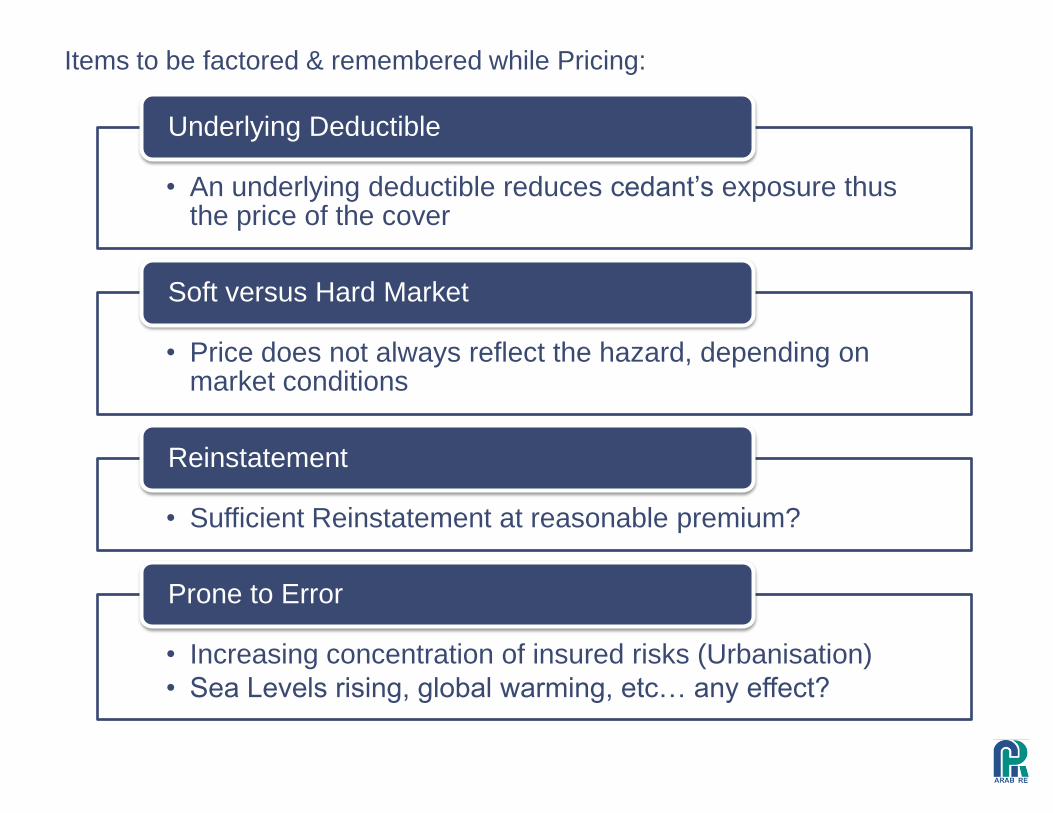
Items to be factored & remembered while Pricing:
• An underlying deductible reduces cedant’s exposure thus the price of the cover
Underlying Deductible
• Price does not always reflect the hazard, depending on market conditions
Soft versus Hard Market
• Sufficient Reinstatement at reasonable premium?
Reinstatement
• Increasing concentration of insured risks (Urbanisation)
• Sea Levels rising, global warming, etc… any effect?
Prone to Error

Underwriting Considerations:
• Loss amount after deducting all other reinsurance recoveries
Ultimate net loss
• What is considered one event or any one occurrence?
Hours Clause
• When does this cover start working? What is one risk?
Two risk warranty

It’s not only a science but an art…
Thank you for your attention: Questions?