arab spatial for nexus mapping modeling the water-food-energy nexus in the arab world v3 par hed
TRANSCRIPT

Modeling the Water-Food-Energy Nexus in the Arab World : The Case of Egypt
AR AB S PATI AL FO R N EXUS MAPPI NG
H A G A R E L D I D I
I F P R I
APRIL 18, 2016
CONRAD - CAIRO, EGYPT
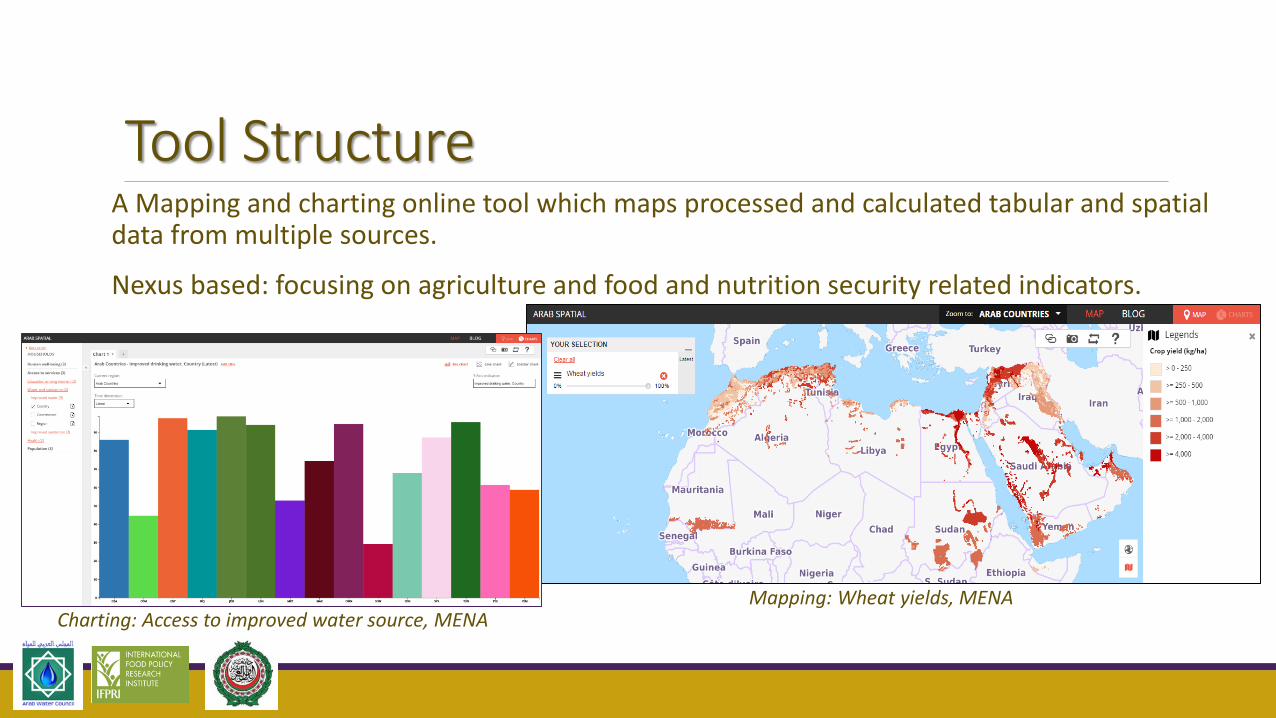
Tool StructureA Mapping and charting online tool which maps processed and calculated tabular and spatial data from multiple sources.
Nexus based: focusing on agriculture and food and nutrition security related indicators.
Mapping: Wheat yields, MENACharting: Access to improved water source, MENA
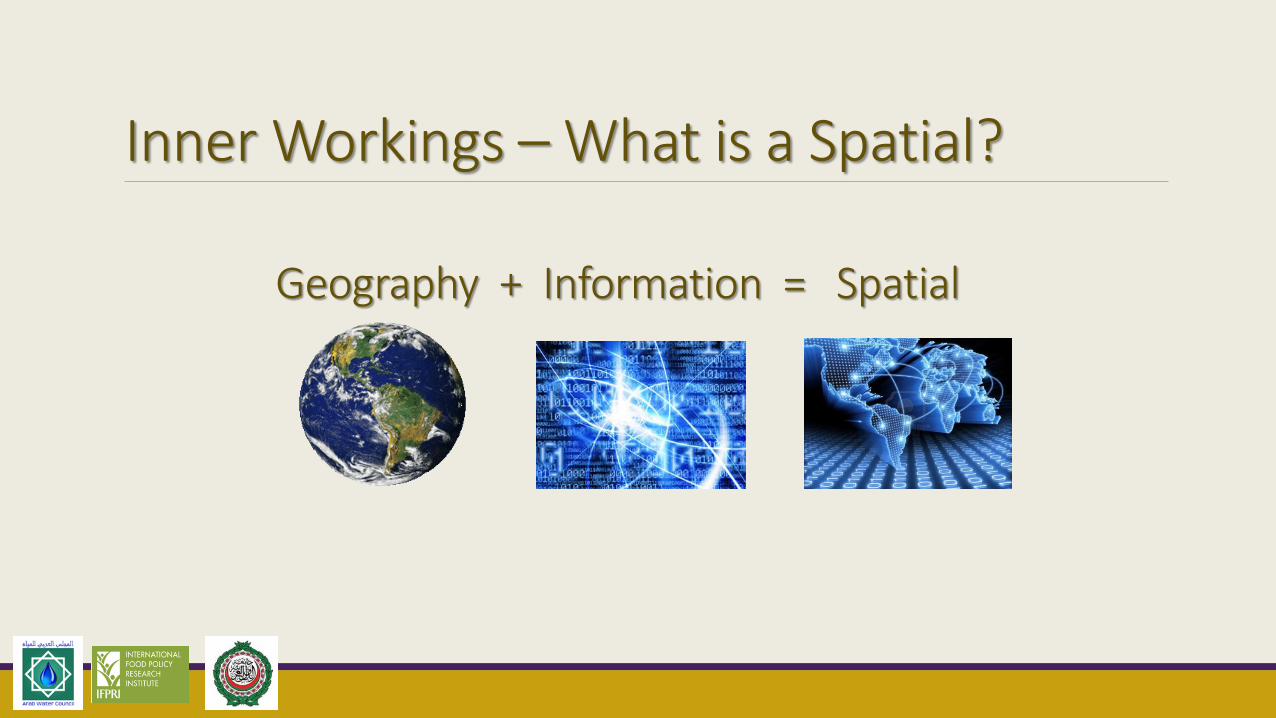
Inner Workings – What is a Spatial?
Geography + Information = Spatial
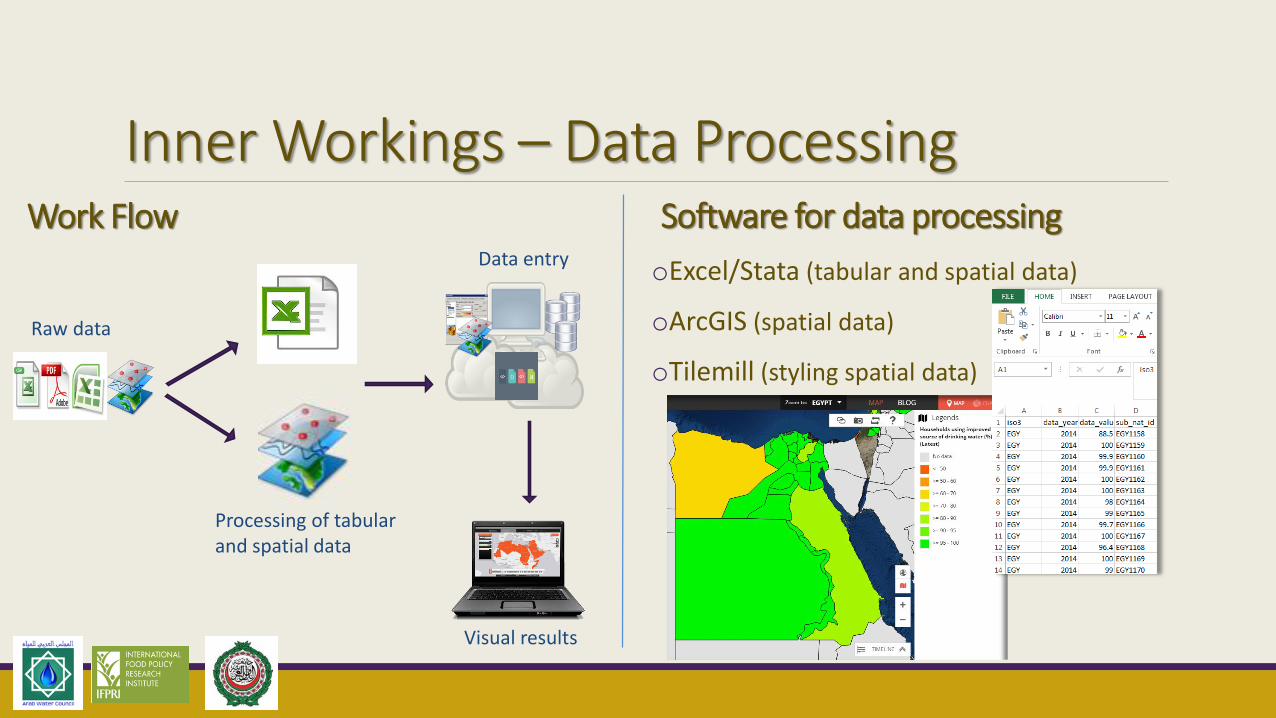
Inner Workings – Data ProcessingSoftware for data processing
oExcel/Stata (tabular and spatial data)
oArcGIS (spatial data)
oTilemill (styling spatial data)
Raw data
Processing of tabular and spatial data
Data entry
Visual results
Work Flow
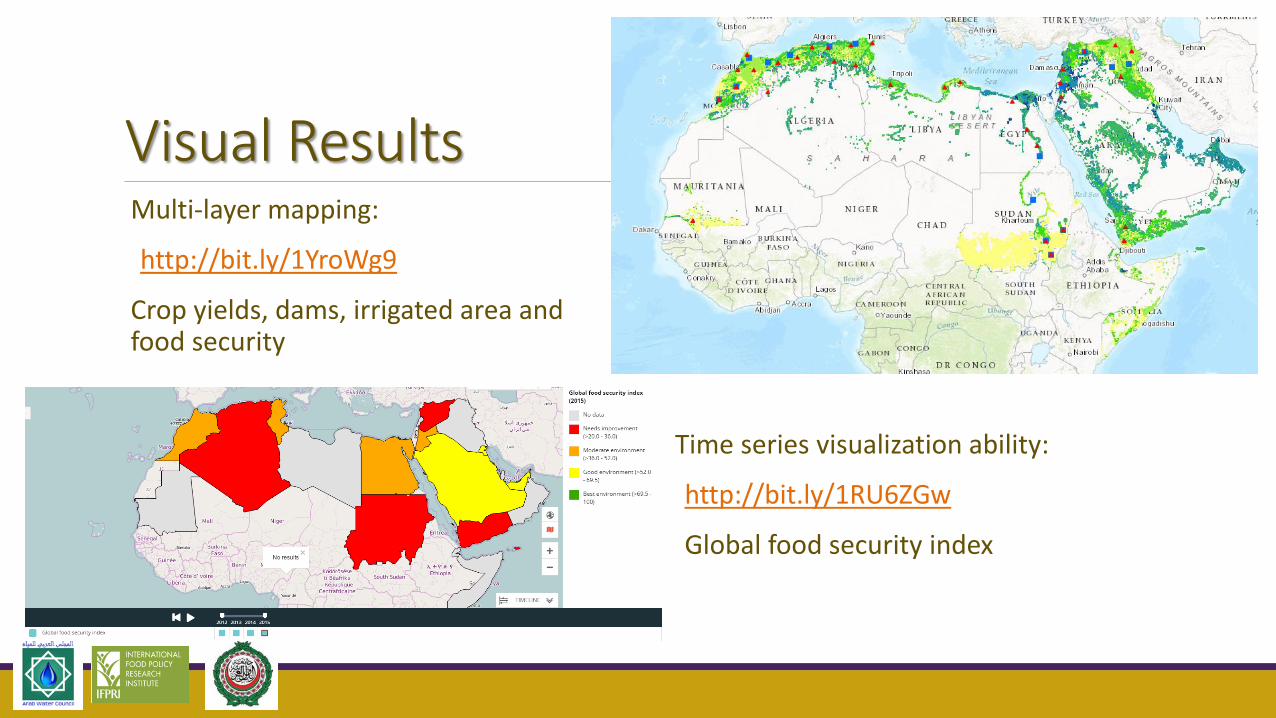
Visual Results
Time series visualization ability:
http://bit.ly/1RU6ZGw
Global food security index
Multi-layer mapping:
http://bit.ly/1YroWg9
Crop yields, dams, irrigated area and food security
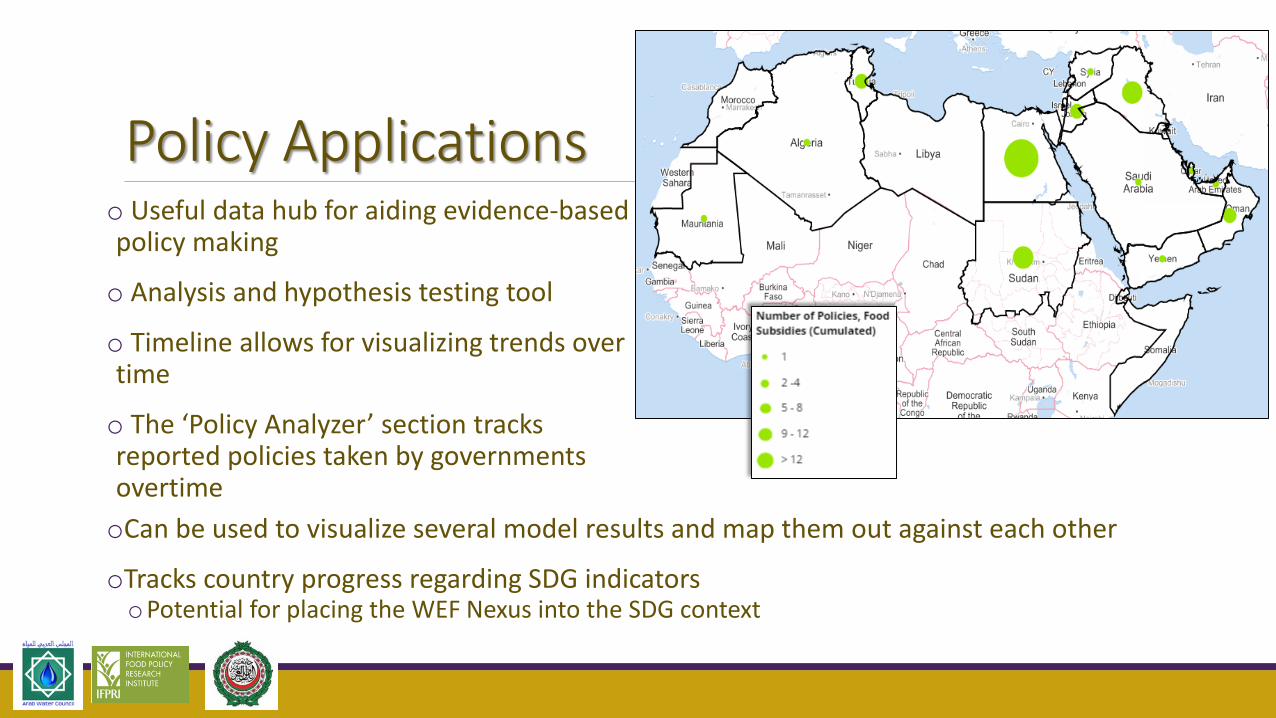
Policy Applicationso Useful data hub for aiding evidence-based policy making
o Analysis and hypothesis testing tool
o Timeline allows for visualizing trends over time
o The ‘Policy Analyzer’ section tracks reported policies taken by governments overtime
oCan be used to visualize several model results and map them out against each other
oTracks country progress regarding SDG indicatorsoPotential for placing the WEF Nexus into the SDG context
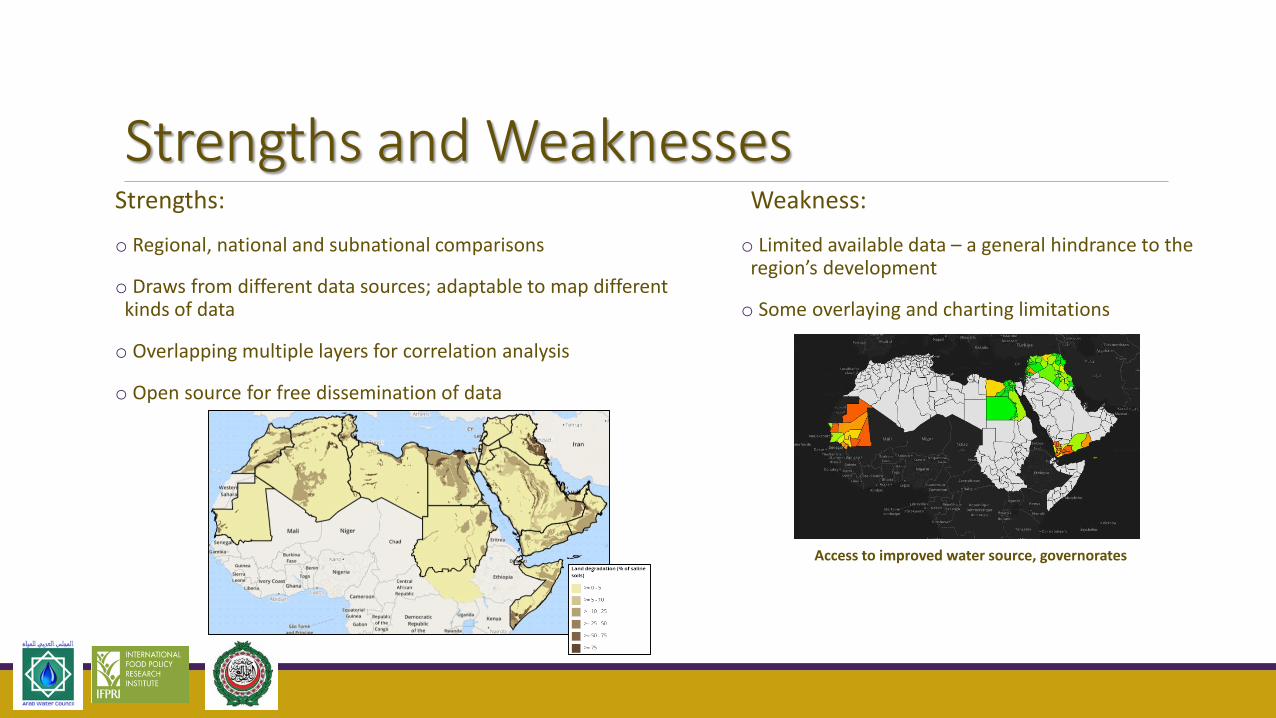
Strengths and WeaknessesStrengths:
o Regional, national and subnational comparisons
o Draws from different data sources; adaptable to map different kinds of data
o Overlapping multiple layers for correlation analysis
o Open source for free dissemination of data
Weakness:
o Limited available data – a general hindrance to the region’s development
o Some overlaying and charting limitations
Access to improved water source, governorates

Thank You!