arabidopsis root meristem: manuel a. valdés date:
TRANSCRIPT

Cell Fate Specification and the Regulation of RNA-dependent DNA Methylation in the
Arabidopsis Root Meristem:
by
Manuel A. Valdés
University Program in Genetics and Genomics
Duke University
Date:_______________________
Approved:
___________________________
Philip Benfey, Supervisor
___________________________
David Sherwood, Chair
___________________________
Tai-ping Sun
___________________________
David McClay
Dissertation submitted in partial fulfillment of
the requirements for the degree of Doctor
of Philosophy in the University Program in
Genetics and Genomics
of Duke University
2016

ABSTRACT
Cell Fate Specification and the Regulation of RNA-dependent DNA Methylation in the
Arabidopsis Root Meristem:
by
Manuel A. Valdés
University Program in Genetics and Genomics
Duke University
Date:_______________________
Approved:
___________________________
Philip Benfey, Supervisor
___________________________
David Sherwood, Chair
___________________________
Tai-ping Sun
___________________________
David McClay
An abstract of a dissertation submitted in partial
fulfillment of the requirements for the degree
of Doctor of Philosophy in the University Program in
Genetics and Genomics in the Graduate School of
Duke University
2016

Copyright by
Manuel A Valdés
2016
iv
Abstract
The Arabidopsis root apical meristem (RAM) is a complex tissue capable of generating
all the cell types that ultimately make up the root. The work presented in this thesis takes
advantage of the versatility of high-throughput sequencing to address two independent questions
about the root meristem. Although a lot of information is known regarding the cell fate decisions
that occur at the RAM, cortex specification and differentiation remain poorly understood. In the
first part of this thesis, I used an ethylmethanesulfonate (EMS) mutagenized marker line to
perform a forward genetics screen. The goal of this screen was to identify novel genes involved in
the specification and differentiation of the cortex tissue. Mapping analysis from the results
obtained in this screen revealed a new allele of BRASSINOSTEROID4 with abnormal marker
expression in the cortex tissue. Although this allele proved to be non-cortex specific, this project
highlights new technology that allows mapping of EMS-generated mutations without the need to
map-cross or back-cross. In the second part of this thesis, using fluorescence activated cell sorting
(FACS) coupled with high throughput sequencing, my collaborators and I generated single-base
resolution whole genome DNA methylomes, mRNA transcriptomes, and smallRNA
transcriptomes for six different populations of cell types in the Arabidopsis root meristem. We
were able to discover that the columella is hypermethylated in the CHH context within
transposable elements. This hypermethylation is accompanied by upregulation of the RNA-
dependent DNA methylation pathway (RdDM), including higher levels of 24-nt silencing RNAs
(siRNAs). In summary, our studies demonstrate the versatility of high-throughput sequencing as a
method for identifying single mutations or to perform complex comparative genomic analyses.

v
Dedication
To Nadia, Alejandro, and Marco

vi
Contents
Abstract ........................................................................................................................................... iv
List of Tables .................................................................................................................................. ix
List of Figures .................................................................................................................................. x
Acknowledgements ......................................................................................................................... xi
Chapter 1: Introduction ................................................................................................................ 1
Overview of the Thesis .......................................................................................................... 1
Introduction to the System .................................................................................................... 1
The Arabidopsis Root Apical Meristem: ............................................................................. 3
Ground Tissue Development ................................................................................................ 4
Cortex Specification and Differentiation ............................................................................. 6
Introduction to RNA-dependent DNA Methylation ......................................................... 7
Methods for Cortex Development Studies ....................................................................... 10
Experimental Overview ................................................................................................ 10
Standard Growing Conditions ..................................................................................... 11
Development of a Cortex-Specific Fluorescent Marker Line ................................... 11
EMS Mutagenesis ........................................................................................................... 12
Screening Protocol ......................................................................................................... 14
Bulk Segregation ............................................................................................................ 14
DNA Extraction .............................................................................................................. 15
Preparation of DNA Libraries and Mutation Mapping ........................................... 15
Key Materials & Reagents ............................................................................................. 16
Methods for RNA-dependent DNA Methylation Studies: ............................................. 16

vii
Standard Growing Conditions ..................................................................................... 16
Fluorescence Activated Cell Sorting ........................................................................... 17
Handling & Storage of Sorted Cells ............................................................................ 17
MethylC-seq .................................................................................................................... 17
Identification of Differentially Methylated Regions ................................................. 18
RNA-seq .......................................................................................................................... 18
Associating DMRs with Proximal Genes .................................................................... 19
Clustering TEs ................................................................................................................ 19
Microscopy Analysis ..................................................................................................... 19
Chapter 2: Identification of candidate genes involved in cortex specification and
differentiation .............................................................................................................................. 20
Results .................................................................................................................................... 20
Pilot EMS Mutagenesis and Screen ............................................................................. 20
Improved EMS Mutagenesis and Validation ............................................................. 21
Forward Genetics Screen .............................................................................................. 22
Validation of Candidate Mutant Lines ....................................................................... 23
Discovery of False Positives ......................................................................................... 26
Identification and Characterization of a Mutant Line .............................................. 27
Mapping Results for EMS608 ....................................................................................... 30
EMS608 is a novel allele of Brassinosteroid-Insensitive 4 ........................................ 31
Discussion of Forward Genetics Screen’s Results: ........................................................... 33
Chapter 3: Unique cell-type specific patterns of DNA methylation in the root meristem36
Results .................................................................................................................................... 36

viii
Columella is the most CHH hypermethylated cell type in Arabidopsis ............... 36
Widespread differential DNA methylation is present in the root meristem ......... 37
Transposable elements are targets for CHH hypermethylation ............................. 42
Enhanced RNA-directed DNA methylation in the columella ................................. 43
DDM1 protein is not present in the columella ........................................................... 44
Discussion of DNA Methylation Results: ......................................................................... 48
Appendix: Supplementary Materials for DNA Methylation & smRNAs ........................... 51
References .................................................................................................................................... 62
Biography ..................................................................................................................................... 69

ix
List of Tables
Table 1: Candidate mutant with morphological defects ................................................................ 24
Table 2: Candidate mutants with aberrant CORTEX marker expression ...................................... 25
Table 3: QC results from high-throughput whole-genome sequencing of EMS608 bulks ............ 31

x
List of Figures
Figure 1: Schematic of the Arabidopsis Root Apical Meristem ...................................................... 4
Figure 2: Schematic showing how SHR/SCR specify endodermal fate in the developing ground
tissue ................................................................................................................................................ 6
Figure 3: Schematic diagram illustrating the initiation of de novo RdDM in Arabidopsis ............. 8
Figure 4: Schematic of the RdDM maintenance pathway in Arabidopsis ............................ 9
Figure 5: Schematic overview of the forward genetics screen .............................................. 11
Figure 6: Confocal images showing expression of the CORTEX marker used in the
forward genetics screen .............................................................................................................. 13
Figure 7: Image of 5 d.a.i. EMS-treated seedlings. ................................................................. 21
Figure 8: EMS608 mutants display short roots and severe dwarfism ................................. 28
Figure 9: Root length comparison between EMS608 mutants and wild type seedlings ... 28
Figure 10: Microscopy of EMS608 mutants ............................................................................. 29
Figure 11: Cross-section of EMS608 mutant ............................................................................ 30
Figure 12: Schematic showing mutation in Bin4..................................................................... 32
Figure 13: Cell type specific patterns of DNA methylation in the root meristem ............. 37
Figure 14: Differentially methylated regions among six root cell types ............................. 39
Figure 15: DNA methylation in genes and TEs ...................................................................... 43
Figure 16: Transcript levels of DNA methylation related components .............................. 45
Figure 17: Loss of DDM1 in the columella .............................................................................. 46

xi
Acknowledgements
I want to thank all the past and current members of the Benfey lab for without you this
would have been a lonely and tiresome journey. I also want to thank my collaborators at SALK,
University of Georgia, University of Western Australia and the National Institute of
Agrobiological Sciences in Japan; you proved to me that science is truly a collaborative and
international endeavor.
I also want to thank my committee for your guidance and mentorship over the last six
years.
Finally, to my adviser, Philip, thank you for providing me with one of the most
intellectually nurturing environments I‟ve ever experienced.

1
Chapter 1: Introduction
Overview of the Thesis
The work presented in this thesis addresses two fundamental questions of great biological
relevance. First, how do different tissues acquire their identities? Second, what roles do small
RNAs and DNA methylation play in an organism‟s development? Since these questions are not
directly related to one another, this thesis is organized into distinct parts. In Chapter 1, I will
provide an introduction to Arabidopsis as a model system capable of addressing complex
developmental questions. This chapter includes a literature review that covers the organization of
the root meristem, ground tissue development, small regulatory RNAs and DNA methylation.
Chapter 1 concludes with a detailed methods section that covers all of the experiments completed
in this thesis. Chapter 2 will cover the results of a forward genetics screen whose goal was to find
novel genes involved in cortex specification and differentiation. This chapter concludes with a
brief discussion of the results and several experimental ideas that could propel this project into
the future. Chapter 3 includes the results of a large-scale epigenomic profiling of the Arabidopsis
root. This chapter places a heavy emphasis on RNA-dependent DNA methylation (RdDM). The
chapter concludes with a full discussion of several new questions that arose from the analysis of
our experimental data.
Introduction to the System
Vascular plants are one of the most prevalent land-based photosynthetic organisms that
are capable of converting the energy of the sun into carbohydrates via carbon fixation. Either
directly or indirectly, plants are the primary source of fuel and nutrients to many organisms on
earth. Because of this, understanding the fundamentals of plant biology is imperative to our

2
advancement as a species. This is particularly important as the world‟s population is rapidly
outpacing the growth of our finite agricultural resources.
Although agricultural research is mainly focused on crops to address the dietary needs of
humanity through applicable research, Arabidopsis thaliana (thale cress), a simple weed capable
of growing in many regions of the world, has been the backbone of basic plant research over the
last several decades. Simply stated, without Arabidopsis’ basic research, modern agriculture
wouldn‟t be as advanced as it is today.
The primary reason for this is due to the genomic complexity of most crop species as
compared to Arabidopsis. Maize, barley, rice and other crops have large and complex genomes
that are riddled with multiple genome duplications and polyploidy. This makes straightforward
genetic studies difficult to accomplish. The growth space requirements for most crops are also
unmanageable or too expensive for many research laboratories. On the other hand, the
Arabidopsis genome is simple by comparison. Unlike crops, Arabidopsis has a relatively small
diploid genome (125Mb) with about 28,000 protein coding genes (Initiative, 2000). In addition,
Arabidopsis plants are small in size, thus making the growth space requirements much more
manageable and affordable. This, coupled with a short generation time of about 8 weeks and a
fully sequenced genome with a wide array of bioinformatics tools, makes Arabidopsis an
excellent model system to study plant biology.
Due to its post-embryonic stereotypical growth, radially symmetric organization and
simple structure, the Arabidopsis root is particularly well-suited for researchers interested in
studying how cells acquire their identity (Cederholm et al., 2012). In addition, the Arabidopsis
root has all stages of development present at all times. This is an incredible advantage to
scientists studying development as the time component is essentially removed.

3
Unlike animals, whose morphological patterning is typically defined by the time
embryogenesis concludes, patterning in Arabidopsis continues post-embryonically through the
stem cell divisions that occur at the root apical meristem (RAM) and shoot apical meristem
(SAM) (Nawy et al., 2005). These developmental zones are responsible for maintaining the stem
cell niches that differentiate into specific tissues throughout the plant‟s life cycle. Since this thesis
is focused on root development, an introduction to the Arabidopsis root apical meristem is
essential.
The Arabidopsis Root Apical Meristem:
The Arabidopsis root apical meristem (RAM) is found at the tip of the growing root and
is capable of differentiating into all the cell types that ultimately form this organ (Birnbaum et al.,
2003). The RAM is composed of a central quiescent center (QC) that is surrounded by initials
(stem cells) of every tissue type in the root. When viewed in a transverse section, the central
vasculature is surrounded by several layers of concentric cylinders. These include (from inside
out), the pericycle, the endodermis and cortex, which together form the ground tissue, and the
epidermis. The RAM is protected from the soil by the columella and lateral root cap (Scheres at
al., 2002).
The main function of the QC, a small group of mitotically inactive cells, is to keep the
surrounding initials in an undifferentiated state. As the root develops, tightly controlled
asymmetric cell divisions allow the initials to regenerate (Nawy et al., 2005). The fate of the
daughter cells generated from these initials depends on positional cues received from their
neighboring cells (Brady et al., 2007). Figure 1 shows a schematic of a typical 5-day-old
Arabidopsis RAM.

4
Figure 1: Schematic of the Arabidopsis Root Apical Meristem
Figure adapted from Petricka et al., 2009
Ground Tissue Development
Due to its stereotypical and tightly regulated divisions, the ground tissue has been
extensively used to study cell specification and differentiation in Arabidopsis. The stem cells that
form the ground tissue are laid down during embryogenesis by the combinatorial actions of
SCHIZORIZA (SCZ) and SCARECROW (SCR) (Pernas et al., 2012). Double mutant analyses
show that embryos that lack SCZ and SCR are incapable of developing the ground tissue stem
cells. To date, this is the only report of a mutant in vascular plants that lacks one of the principal
tissue systems of the root (Pernas et al., 2012).
After seed germination occurs, post-embryonic development becomes the main form of
growth for plants. It is during this period that the cortex endodermis initials (CEIs), adjacent to
the QC, are formed. Once the CEIs are in place, a tightly controlled series of asymmetric cell
divisions allow for endodermis and cortex cell fate determination. The first anticlinal cell

5
division‟s function is to regenerate the CEIs and to form the cortex endodermis initial daughter
cells (CEIDs). These daughter cells then divide asymmetrically and periclinally to form the
separate layers that will eventually define the cortex and endodermis (Dolan et al., 1993). 7 to 14
days after germination, another asymmetric cell division gives rise to the middle cortex (Paquette
and Benfey, 2005).
Asymmetric divisions are central to the proper formation of the ground tissue and its
components. However, after this occurs, the endodermis and cortex need to be specified by
unique transcriptional networks in order for their lineage to be properly established and
maintained. To date, endodermis specification and differentiation are well understood.
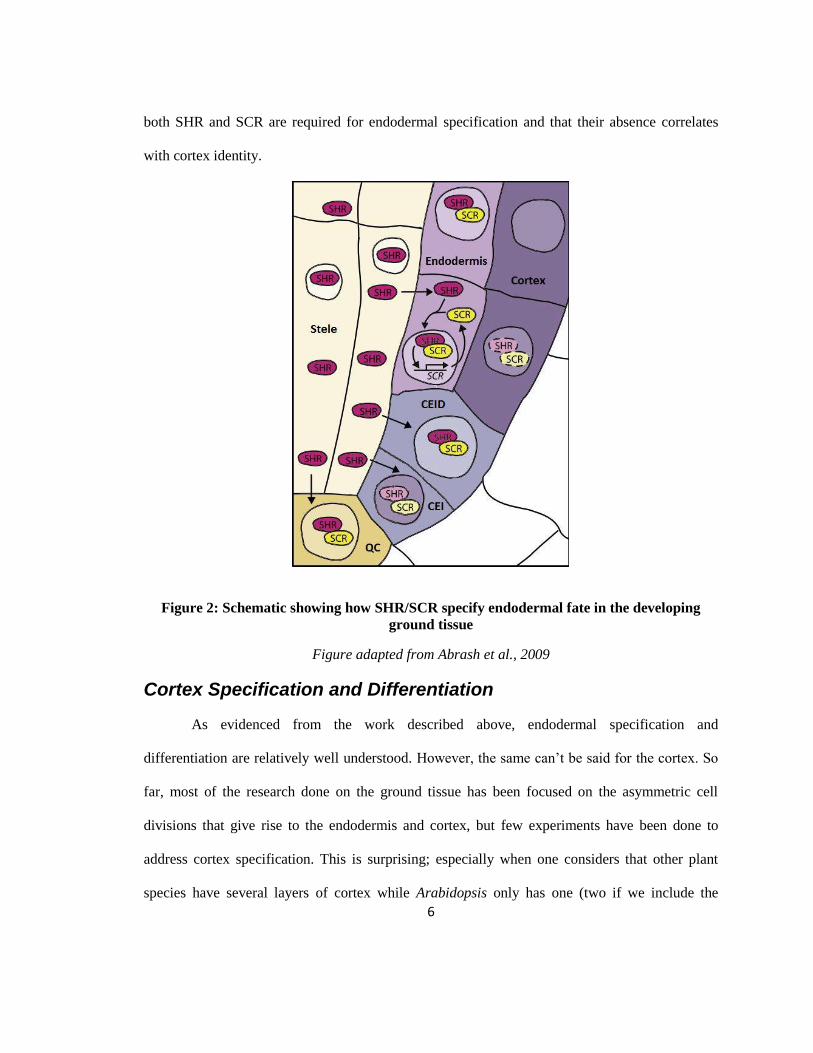
Two members of the GRAS transcription factor family, SHORTROOT (SHR) and
SCARECROW (SCR) are primarily responsible for endodermal specification. SHR is transcribed
in the stele, once the SHR protein is translated, it moves into the QC, CEI and endodermis. When
SHR reaches these surrounding tissues, it becomes nuclear localized, where it activates a set of
target genes, including SCR (Helariutta et al., 2000). After this occurs, SCR sequesters SHR in
the nucleus, where it now activates key patterning genes (Cui et al., 2007). Figure 2 shows a
schematic that depicts SHR movement into the surrounding tissues and how it interacts with SCR
to specify endodermal fate.
Much has been learned from mutant analyses of SHR and SCR. shr mutants have a short
root morphological phenotype and develop a single layer of ground tissue that only expresses
markers of cortex differentiation (Helariutta et al., 2000). Likewise, scr mutants display a short
root phenotype and a single layer of ground tissue. However, this ground tissue layer expresses
markers of both endodermis and cortex cell fates. In addition, experimental data shows that levels
of both SHR and SCR are very low in cortex tissue (Cui et al., 2007). These results suggest that
6
both SHR and SCR are required for endodermal specification and that their absence correlates
with cortex identity.
Figure 2: Schematic showing how SHR/SCR specify endodermal fate in the developing
ground tissue
Figure adapted from Abrash et al., 2009
Cortex Specification and Differentiation
As evidenced from the work described above, endodermal specification and
differentiation are relatively well understood. However, the same can‟t be said for the cortex. So
far, most of the research done on the ground tissue has been focused on the asymmetric cell
divisions that give rise to the endodermis and cortex, but few experiments have been done to
address cortex specification. This is surprising; especially when one considers that other plant
species have several layers of cortex while Arabidopsis only has one (two if we include the

7
middle cortex). How is cortex development regulated? What are the mechanisms that control
cortex proliferation in Arabidopsis and plants in general? To this day, none of these questions
have clear answers. My goal for the first part of this thesis is to directly address cortex
specification and differentiation by detailing the results of a forward genetics screen designed
specifically for this challenge.
Introduction to RNA-dependent DNA Methylation
DNA methylation is an epigenetic modification of cytosine bases implicated in gene
regulation. In plants, DNA methylation occurs in three distinct cytosine contexts; CG, CHG and
CHH, where H is A, C or T. CG and CHG methylation are stably maintained by DNA
METHYLTRANSFERASE 1 (MET1) and CHROMOMETHYLASE 3 (CMT3), respectively. De
novo DNA methylation is catalyzed by DOMAINS REARRANGED METHYLTRANSFERASE
2 (DRM2) in all three sequence contexts, in a process guided by 24 nucleotide (nt) small RNA
(smRNA), known as RNA-directed DNA methylation (RdDM) (Law and Jacobsen, 2010; Matzke
and Mosher, 2014). RdDM occurs in two distinct phases, an initiation phase and a maintenance
phase (Matzke et al., 2014). The main steps required for the initiation phase include: transcription,
processing of transcripts by Dicer-like proteins into 24-nt smRNAs, loading of these smRNAs
into the ARGONAUTE/POL V complex, and de novo DNA methylation by POL V (Figure 3).
The steps involved in RdDM maintenance are similar to those found in the initiation phase,
however, RdDM maintenance requires that target loci be methylated first (Matzke et al., 2014).
These steps include: the production of aberrant RNA transcripts by POL IV, processing of these
transcripts by Dicer-like proteins into 24-nt smRNAs, loading of these smRNAs into the
ARGONAUTE/POL V complex which will guide methylation to target loci (Fig. 4).

8
DNA methylation may also be maintained independently of the RdDM pathway through
the concerted action of DECREASED DNA METHYLATION 1 (DDM1) and
CHROMOMETHYLASE 2 (CMT2) (Zemach et al., 2013; Stroud et al., 2014). DDM1 functions
to displace the linker histone H1 in heterochromatic regions of the genome, allowing CMT2
access to the DNA, where it is able to catalyze the methylation of cytosines in the CHG and CHH
contexts (Stroud et al., 2014; Zemach et al., 2013).
Figure 3: Schematic diagram illustrating the initiation of de novo RdDM in Arabidopsis
Figure adapted from Matzke et al., 2009
While DNA methylation can be a stable epigenetic mark, faithfully maintained over
many hundreds of generations (Cubas et al. 1999), dynamic changes in DNA methylation patterns
can be observed over short time scales in response to the environment (Secco et al. 2015; Dowen
et al. 2012), or in different cell types of a single individual (Pignatta et al. 2014; Slotkin et al.
2009; Calarco et al., 2012; Ibarra et al., 2012), presumably a result of differential regulation of the
RdDM or CMT2-mediated DNA methylation pathways. Thus, DNA methylation is a stable but

9
reversible epigenetic modification, and may reflect, or play an important role in maintaining, cell-
type identity.
Figure 4: Schematic of the RdDM maintenance pathway in Arabidopsis
Figure adapted from Matzke et al., 2009
In Arabidopsis, a major biological role of DNA methylation is in silencing transposable
element (TE) transcription. Loss of DNA methylation due to mutations in DDM1 or MET1 is
sufficient for transcriptional activation of demethylated TE sequences, and transposition of some
of these activated TEs (Mirouze et al., 2009, Tsukahara et al., 2009; Zemach et al., 2013).
Although TE insertions may contribute to novel modes of gene regulation, excess TE activity

10
produces deleterious mutations, and efficient TE silencing is crucial for the maintenance of
genome integrity. Plants may be most vulnerable to TE activity in their stem cells, as these are the
progenitor cells from which all others derive, and TE insertions within the stem cells will
therefore be inherited by all descendant cells. Indeed, highly complex mechanisms of TE
silencing have been reported in the sperm and embryo. TE silencing in the sperm is thought to be
assisted by 21 nt smRNAs derived from the vegetative cell nucleus, a non-generative companion
to the sperm, and in the developing embryo by endosperm-derived 24 nt smRNAs (Slotkin et al.,
2009; Calarco et al., 2012; Ibarra et al., 2012), indicating that silencing of TEs may be
particularly important in these cells. As previously introduced, plants have stem cell niches at
distal axes, known as the shoot apical meristem (SAM) and root apical meristem (RAM). RdDM
factors, DNA methyltransferases, and DDM1 are all upregulated to reinforce TE silencing in the
SAM (Baubec et al., 2014). While there is some indication that gross levels of DNA methylation
may be perturbed in the RAM (Baubec et al., 2014), patterns of DNA methylation in the RAM
have not been studied at high resolution, and the dynamics of DNA methylation mediated TE
silencing in the RAM are so far unexplored.
Methods for Cortex Development Studies
Experimental Overview
The experimental strategy used to find novel genes that control cortex specification and
differentiation consisted of several steps (Fig. 5). First, a new cortex specific fluorescent marker
was developed. Second, random mutations were generated in this new line via EMS treatment.
Third, the M2 generation was screened for aberrant marker expression. Finally, a candidate
mutant was mapped via high throughput DNA sequencing. A detailed methodology is found
below.

11
Standard Growing Conditions
Growth media: 1x Murashige and Skoog (MS) media supplemented with 1% sucrose and 1%
agar. Light conditions: All seedlings were grown under standard long day conditions (16 hours of
light, 8 hrs of darkness, 22 °C).
Figure 5: Schematic overview of the forward genetics screen
Development of a Cortex-Specific Fluorescent Marker Line
Forward genetic screens that rely on fluorescent microscopy as the primary method of
mutant identification require marker lines that are highly specific to the tissue being studied. In
addition, expression of the marker gene needs to be high and should be easily recognizable by the
experimenter‟s eye. In order to study cortex specification and differentiation, we needed to

12
develop a new fluorescent marker line that addresses both processes in a single screen. This was
done by crossing two well established cortex-specific marker lines with distinct developmental
domains of expression. To mark the less differentiated cortex tissue, we used the nuclear
localized CO2:YFP marker as its fluorescent expression is restricted to younger cortex cells, thus
making it well suited to study specification in this tissue (Fig. 6a) (Heidstra et al., 2004).
Alternatively, to mark differentiated cortex tissue, we used 315.1.1, an endoplastic reticulum
(ER) localized GFP line whose expression domain is restricted to mature cortex cells and is well
suited to study cortex differentiation (Fig. 6b) (Lee et al., 2006).
Genetic crosses were performed by following standard Arabidopsis crossing methods
(Sanchez et al. 2014). However, in order to ensure a successful outcome, each of the parental
lines (CO2:YFP & 315.1.1) served as male and female for several independent crosses. The line
used in these studies was verified by segregation analysis at the T3 generation. This ensured that
both markers were in a stable genetic background and the offspring didn‟t have any unwanted
phenotypes. To avoid confusion with the parental lines, the new line was named CORTEX, its
marker expression is shown in Figure 6c.
EMS Mutagenesis
EMS mutagenesis was prepared in accordance with, but with minor modifications to, the
work presented by Kim et al., 2006. 35 mg (~9000 seeds) of dried CORTEX marker seeds were
pre-imbibed overnight in a 0.1% KCl solution. The next day, seeds were soaked on a rocker with
a 100mM EMS solution in 0.1M sodium phosphate and 5% DMSO for 4 hours. Following this,
the mutagen was removed by washing the seeds twice for 15 minutes each with a 100mM sodium
thiosulfate solution. Two additional 15 minute H2O washes were completed to ensure proper
inactivation of the mutagen and the viability of the mutagenized seeds. 5000 seeds were sowed on

13
standard 1X MS plates and allowed to germinate for 2 weeks. Following the completion of this 2
week period, seedlings were transferred to soil in order to collect their M2 progeny. Rather than
bulking the M1 generation into pools, plants were individually collected in order to simplify
mapping from the M2 generation.
Figure 6: Confocal images showing expression of the CORTEX marker used in the forward
genetics screen
(a) CO2:YFP marks early cortex tissue. (b) 315.1.1:GFP marks differentiated cortex tissue.
(c) Newly developed CORTEX line that marks all developmental zones in the cortex.

14
Screening Protocol
The screen was performed by sowing CORTEX-EMS (mutagenized) M2 seeds in 1X MS
plates. These were allowed to develop for 5 days under standard growing conditions. Each plate
contained two rows of approximately 30 M2 seedlings each. In order to ensure high quality
standards and avoid false positives, plates that had evidence of contamination were discarded and
re-sowed. Additionally, as a control before every experiment, plates of Col-0 and non-
mutagenized CORTEX seedlings were inspected under the Axio Zoom fluorescence microscope
in order to account for any variance in fluorescent marker strength or the dissecting microscope‟s
bulbs strength. Any plates that contained seedlings with identifiable phenotypes were saved and
re-screened at another date. New seedlings from each candidate population were also re-screened
in a blind experiment in order to validate the identification of each phenotype.
Bulk Segregation
Bulk segregation was done by collecting 47 2-week old seedlings over a period of several
weeks. EMS608 seedlings that clearly displayed a phenotype, in this case, aberrant CORTEX
marker expression and short roots at day 14 were collected into a single bulk. DNA from these
seedlings was collected into a microcentrifuge tube and labeled as “EMS608-Affected.”
Additionally, unaffected siblings from the EMS608 family, that is, those that didn‟t display
aberrant CORTEX marker expression from the same plates were collected and labeled as
“EMS608-Unaffected.”

15
DNA Extraction
Below is a description of the CTAB based protocol used to extract DNA from the roots
collected after bulk segregation. See the Key Materials and Reagents section below for a detailed
description of each reagent.
Heated CTAB Elution buffer (EB) to 60 °C. Ground frozen tissue in Liquid Nitrogen
(LN). Added as much LN as was necessary. Added appropriate amount of CTAB EB to ground
tissue. Incubate tissue in CTAB EB at 60 °C for 30 minutes. Added an equal volume of
Chloroform to sample and centrifuged at 14,000 RPM for 5 minutes. Took the aqueous phase (top
phase) and repeated the previous step. Took the top phase and added an equal amount of
Isopropanol. Mixed gently to precipitate DNA. Centrifuged at 14,000 RPM for 5 minutes.
Washed DNA with 1 mL NH4 Ac Wash Solution and centrifuged at 14,000 RPM for 5 minutes.
Discarded supernatant without disturbing the pellet. Dissolved pellet in 250 µL RNAseA
Solution. Incubated at 50 °C for 30 minutes. Added 25 µL NaAc and 250 µL Isopropanol to each
sample and spun down at 14,000 RPM for 5 minutes. Discarded supernatant without disturbing
the pellet. Washed DNA with 1 mL 70% EtOH and centrifuged at 14,000 RPM for 5 minutes.
Removed all EtOH and allowed pellet to dry until it was clear and there was no EtOH smell.
Resuspended pellet in 50 – 100 µL of DNAse free water. DNA was stored at 4 °C for 24 hours to
allow for proper suspension in water.
Preparation of DNA Libraries and Mutation Mapping
DNA libraries for Illumina high-throughput sequencing were prepared as described in the
NEBNext Ultra DNA Library Prep Kit protocol. The oligos used were obtained from the
NEBNext Multiplex Oligos Set 1. Libraries were submitted to the New York Genome Center for
Illumina 2 x 50 bp HiSeq 2500 high output sequencing.

16
Mutation mapping was performed by uploading the EMS608-Affected and EMS608-
Unaffected high throughput DNA data to the SNPtrack pipeline developed in Leshchiner et al.,
2012. This pipeline was selected as the best method for mapping due to previous success in
Arabidopsis as shown in Liberman et al., 2015.
Key Materials & Reagents
Microscopy: Axio Zoom V16 Fluorescence Stereo Zoom Microscope with Illuminator HXP
200C
Zeiss LSM 510 upright confocal microscope.
CTAB DNA Extraction Reagents
CTAB Extraction Buffer: CTAB 4.0 g; NaCl 16.36 g; EDTA 0.5M 8.0 mL; 1.0M Tris-HCl pH
8.0 20 mL; H2O Fill to 200 mL
Wash Solution (NH4 Ac Wash):10 mM NH4 Ac (Ammonium Acetate) in 70% EtOH
RNAseA Solution: 10µg/mL RNAseA solution in H2O
Sodium Acetate (NaAc): 3M pH 5.2 Sodium Acetate
DNA Libraries: NEBNext Ultra DNA Library Prep Kit protocol (NEB cat # E7370)
NEBNext Multiplex Oligos Set 1 (NEB cat # E7335).
Methods for RNA-dependent DNA Methylation Studies:
Standard Growing Conditions
Unless specifically noted, all seedlings were grown vertically for 6 days after plating on
1X Murashige and Skoog (MS) media supplemented with 1% sucrose and 1% agar. All seedlings
were grown under standard long day conditions (16 hours of light, 8 hrs of darkness, 22 °C).

17
Fluorescence Activated Cell Sorting
Fluorescence Activated Cell Sorting (FACS) was performed at the Duke Flow Cytometry
Shared Resource (FCRS) using cell specific GFP lines as described previously (Iyer-Pascuzzi and
Benfey, 2010). The whole columella was marked with the enhancer trap PET111 (Nawy et al.,
2005), the bottom two layers of the columella were marked with ProCYCD5:GFP (Collins et al.,
2012), the stele with ProWOL:GFP (Mahonen et al., 2000), the endodermis with ProSCR:GFP
(Birnbaum et al., 2003), the cortex with ProCORTEX:GFP (Lee et al., 2006), and both the
epidermis and lateral root cap with ProWER:GFP (Lee and Schiefelbein, 1999).
The Beckman Coulter MoFlo Astrios was used to sort all of the cells included in these
experiments.
Handling & Storage of Sorted Cells
To preserve the genetic material from cells, sorted protoplasts were collected directly into
specific lysis buffers that were compatible with downstream applications. Cells used for bisulfite
sequencing, mRNA-seq, smRNA-seq were lysed in Buffer AP1 (Qiagen), Buffer RLT (Qiagen),
Trizol (Invitrogen), respectively. All samples were immediately stored at -80 °C until gDNA and
RNA was extracted using DNeasy Plant mini kit (Qiagen) and RNeasy Plant mini kit (Qiagen) or
Trizol, respectively. When necessary, samples were shipped overnight to the SALK Institute for
additional analyses.
MethylC-seq
MethylC-seq library preparation, read mapping, base calling were performed as described
previously (Lister et al., 2008, 2011; Urich et al., 2015), except that reads were mapped against
C-to-T converted TAIR10 reference genome and library amplification was performed with either

18
KAPA HiFi U+ (KAPA) or PfuTurboCx enzyme (Agilent). Bisulfite non-conversion rate was
estimated from the total number of cytosine base calls divided by the total coverage at cytosine
positions in the naturally unmethylated chloroplast genome.
Identification of Differentially Methylated Regions
Differentially methylated regions (DMRs) were identified using the methylpy pipeline
(Schultz et al. 2015). Briefly, differentially methylated sites (DMSs) were identified by root mean
squared tests with false discovery rate at 0.05, using 1,000 permutations. Cytosine positions at
least with 4 reads were examined for differential methylation. Then, DMSs within 200 bp were
collapsed into DMRs. DMRs were classified into CG-DMRs (only CG difference), CH-DMRs
(only CHG and/or CHH difference), C-DMRs (CG and CHG and/or CHH difference). In
addition, CG-DMRs, CH-DMRs, C-DMRs with fewer than 5, or 10 DMSs, respectively, were
discarded in the subsequent analysis. Methylation levels of each region were calculated as
weighted methylation levels (Schultz et al. 2012), in which methylation level was equal to the
frequency of C base calls at C positions within the region divided by the frequency of C and T
base calls at C positions within the region.
RNA-seq
RNA-seq library preparation was performed using the Illumina TruSeq RNA Library
Prep kit from polyA+ selected mRNA as per manufacturer‟s instructions. smRNA sequencing
data was obtained from a previous study (Breakfield et al. 2012). smRNA data were processed
and mapped to the TAIR10 genome as described previously (Lister et al 2009). smRNAs levels
were normalized to TE size and library size by counting reads per kilobase of TE per million
reads mapped (RPKM). Only reads that mapped uniquely to the genome contributed to the

19
average count for each TE. RNA-seq data were mapped to the TAIR10 reference genome using
Tophat2 with the default parameters (Kim et al. 2013), and quantified using Cuffdiff (Trapnell et
al. 2012).
Associating DMRs with Proximal Genes
DMRs located within 3 kb of gene upstream regions, gene bodies, and 3 kb of gene
downstream regions were extracted, and relative position to genes were assigned by the middle
position of DMRs. Pearson correlation coefficients between the methylation levels of DMRs and
the expression levels of proximal genes (FPKM) were computed and plotted as density.
Clustering TEs
mCHH levels within annotated TE bodies at least 400 bp in length were computed, and only TEs
with at least 10% mCHH in one sample from Col-0, drm1 drm2, cmt2, and ddm1 were assigned
as methylated TEs. TEs were then clustered into four clusters by using the R k-means function,
with the “centers” parameter set to 4.
Microscopy Analysis
The DDM1-GFP transgenic line was described previously (Slotkin et al. 2009). Seeds
were plated on 1/2x Linsmaier and Skoog media. Seedlings three days after germination were
incubated in propidium iodide for 5 min to stain cell walls of root tips, and imaged using a Zeiss
LSM 710 Confocal Microscope.

20
Chapter 2: Identification of candidate genes involved in cortex specification and differentiation
As described in Chapter 1, to date, no genes have been identified as key transcription
factors that specify cortex formation in the Arabidopsis root. Since SHR and SCR are required to
direct endodermal specification, taking a cortex-specific forward genetics approach to identify
genes involved in cortex specification and differentiation is a logical step towards a better
understanding of ground tissue development.
Results
Pilot EMS Mutagenesis and Screen
As a pilot experiment, an initial population of 600 M2 CORTEX-EMS (mutagenized)
lines was screened for aberrant changes in fluorescent marker expression. No candidate mutants
were revealed after screening through the entire population. This was a matter of concern as the
random nature of EMS mutagenesis causes easy to identify morphological phenotypes that should
have been found in a population of this size. These phenotypes include, short roots, albino plants,
anisotropic root hairs, lack of root hairs and several others (Page et al., 2002). The absence of
morphological phenotypes was an early indication that EMS treatment was ineffective at
generating mutations. To verify the efficiency of EMS treatment, a random population of
CORTEX-EMS seedlings was sowed on MS plates to test for albinism. If the EMS treatment was
effective, between 5% and 10% of the seedlings should display albino phenotypes. Our results
indicated that regardless of the number of seedlings tested, no albino phenotypes could be
observed (Fig. 7). These results suggested that EMS treatment was ineffective at generating
random mutations throughout the genome.

21
Figure 7: Image of 5 d.a.i. EMS-treated seedlings.
Seedlings grown on 1X MS plates at different densities to identify albino phenotypes.
Initially, it was difficult to identify the cause of the ineffective EMS treatment. However,
after troubleshooting the issue, it was apparent that the EMS incubation performed on the
CORTEX seeds was too short. Although several published works have been able to screen the
offspring of populations that were EMS-treated for only 4 hours, in Arabidopsis, overnight
treatments are far more effective and common as they allow ample time for EMS to penetrate
seeds (Caspar et al., 1998).
Based on these results, a second round of mutagenesis was completed, this time, with a
16 hour incubation period. In addition, several validation methods were put in place to prevent
screening an under-mutagenized population.
Improved EMS Mutagenesis and Validation
To prevent under-mutagenized lines from being generated before the next round of
screening, the efficiency of EMS treatment was tested by several methods. First, siliques from

22
M1 plants were inspected for the presence of aborted embryos as this is a common assay used to
measure the efficiency of EMS treatments in plants (Weigel et al., 2006). Aborted embryos
appear darker and smaller than their healthy counterparts and are easily identified under a
dissecting microscope. The assay was done by quantifying the number of aborted embryos per
silique from 50 independent M1 plants. On average, 12 of 50 siliques displayed aborted embryos,
indicating that EMS mutagenesis was effective (Weigel et al., 2006).
The second validation method used was to verify the number of albino seedlings
produced by EMS as this has been shown to correlate with overall mutagenesis levels in the
Arabidopsis genome (Weigel et al., 2006). Typically, EMS induced mutagenesis produces
between 5% and 10% of chlorophyll deficient albino phenotypes within M2 populations
(Koornneef et al., 1982). Throughout our study, between 6 and 8 lines out of every 100 were
found to have albino phenotypes. These data suggest that the second round of EMS mutagenesis
was successful in generating random DNA mutations throughout the genome and that offspring
from this population could be used for screening.
Forward Genetics Screen
A population of 1300 independent M2 lines was screened by fluorescence microscopy for
aberrant marker expression. Within the first few hundred lines screened, several interesting
phenotypes were identified. These phenotypes were categorized into two groups based on their
fluorescent marker expression.
The first group includes easy to score morphological phenotypes that maintain
fluorescent marker expression. Some of these phenotypes include: short roots, excessive root
hairs, anisotropic root hairs, long hypocotyls, abnormal roots, and several others (Table 1).
Although these phenotypes were unrelated to the main goal of the screen, it was critical to find

23
and categorize them as they confirmed the efficacy of EMS mutagenesis and could prove useful
in other projects.
The second group of mutants involves seedlings with aberrant fluorescent marker
expression. This category is much more interesting as it likely represents cortex-specific
phenotypes. Phenotypes include: faint expression of the fluorescent marker across the whole root,
dim fluorescence in the meristem, faint expression of the marker in the mature cortex, patchy
expression of the marker, and several others. Table 2 includes a detailed breakdown of these
candidates.
Validation of Candidate Mutant Lines
Instead of taking the forward genetics screen to saturation, a strategic approach was taken
in order to prevent additional loss of time and/or resources due to the generation of false
positives. For this reason, candidate mutants were re-screened for their original phenotypes.
Initially, a blind study was conducted in which siblings from the M2 generation were used for this
purpose. The first group of mutants, which included morphological defects, was quickly validated
as most of these mutations were easy to identify and didn‟t require fluorescence microscopy to
detect. On the other hand, mutants from the second group, those with aberrant CORTEX marker
expression, were difficult to detect. Because of this, offspring (M3 generation) from these
candidates were tested for Mendelian segregation. Surprisingly, very few of the M3 candidates
reproduced the phenotypes originally identified in their parents (M2 generation) (Table 1). These
results were unexpected and suggested that additional troubleshooting needed to be completed to
ensure that screening results were reproducible.

24
Table 1: Candidate mutant with morphological defects
EMS Candidate
Number
Aberrant
Marker
Expression
Validated
by M3
Mendelian
Segregation
Initial Root Phenotype
110 1 No Yes Yes Short roots, excessive root
hairs, marker expression
163 2 No Yes Yes Abnormal roots, marker
expression
176 3 No Yes Yes Short and abnormal roots,
marker expression
178 4 No Yes Yes Anisotropic root hairs,
marker expression
227 5 No Yes Yes Anisotropic root hairs,
marker expression
244 6 No Yes Yes Abnormal roots, marker
expression
260 7 No Yes Yes Short roots, marker
expression
269 8 No Yes Yes Short roots, marker
expression
277 9 No Yes Yes Long hypocotyls, marker
expression
309 10 No Yes Yes Anisotropic root hairs,
marker expression
311 11 No Yes Yes Short abnormal roots,
marker expression
315 12 No Yes Yes Excessive hairs around
meristem
316 13 No Yes Yes Short roots, excessive root
hairs
382 14 No Yes Yes Short root, marker
expression
406 15 No Yes Yes Short roots, excessive root
hairs, marker expression

25
Table 2: Candidate mutants with aberrant CORTEX marker expression
EMS Candidate
Number
Aberrant
Marker
Expression
Validated
by M3
Mendelian
Segregation
Initial Root Phenotype
109 16 Yes No No Faint expression of whole
marker
123 17 Yes No No Dim 315
125 18 Yes No No Abnormal CO2
expression
132 19 Yes No No CO2 in fewer cells
145 20 Yes No No Strong CO2 expression
147 21 Yes No No Dim CO2
151 22 Yes No No Very low expression
152 23 Yes No No Very low expression
154 24 Yes No No Dim CO2
182 25 Yes No No Short root with dim 315
191 26 Yes No No Dim CO2
192 27 Yes No No Dim 315
193 28 Yes No No Faint expression of whole
marker
194 29 Yes No No Faint expression of whole
marker
207 30 Yes No No Very short root and dim
CO2
210 31 Yes No No Dim expression and
abnormal
221 32 Yes No No Weak expression
223 33 Yes No No Short root and dim
expression of whole
marker
250 34 Yes No No Faint expression of whole
marker
258 35 Yes No No Short root and dim
expression of 315
260 36 Yes No No Short root with dim
expression of whole
marker
269 37 Yes No No Abnormal CO2
expression
282 38 Yes No No Patchy expression of
marker
284 39 Yes No No Weak expression and long
hypocotyls
302 40 Yes No No CO2 in all cell types
345 41 Yes No No Dim or no 315

26
348 42 Yes No No Dim or no 315
402 43 Yes No No Whole marker almost
invisible
410 44 Yes No No Patchy CO2
418 45 Yes Yes/Marker,
No
Yes/Marker,
No
Short, excessive root
hairs, weak expression
608 46 Yes Yes Yes Short, aberrant marker
expression
Discovery of False Positives
The first step taken to troubleshoot the uncharacteristic results from the candidate
mutants was to test the expression dynamics of the fluorescent marker in these lines. This was
done by allowing candidates to develop on plates for 10 days rather than 5 (as was originally
done throughout the screen). Although non-mutagenized CORTEX seedlings displayed full
expression of their transcriptional reporters by day 4, many of the mutagenized seedlings
analyzed in this screen deviated from this. Most candidates with aberrant expression at day 5
would have normal expression of the transcriptional reporter by day 10. Upon closer inspection of
the candidate mutants at later dates, it became clear that most of them didn‟t display aberrant
marker expression and thus were false positives (Table 2). These results help explain why the M3
offspring from these candidates appeared normal.
An additional factor that contributed to the identification of false positives was the
presence of almost undetectable levels of bacterial or fungal contamination at day 5. At this date,
seedlings with untraceable levels of contamination appeared as if they had aberrant marker
expression. Depending on contamination levels, marker expression would appear patchy, weak,
or stronger than usual. Upon closer inspection, it became evident that the auto-fluorescence
produced by bacteria or fungi was the main cause of this phenomenon (Yang et al., 2012). In
order to prevent the identification of new false positives, candidates with aberrant marker

27
expression were left on plates for up to 2 weeks as this would allow for the easy identification of
plates riddled with bacterial or fungal contamination.
As an additional preventative measure, from this point on, seedlings were screened on
day 10 and re-screened at a later date. This was done in order to prevent EMS-induced variation
and/or contamination from producing false positives. In addition, groups of 5 lines were
combined into a single bulk as this would increase the speed at which candidate mutants would be
identified. Any bulks with phenotypes would be re-screened independently until the original
mutant line was identified.
Identification and Characterization of a Mutant Line
More than 1300 independent lines were tested for aberrant marker expression. From
these, one candidate mutant, EMS608, was identified due to its uncharacteristic fluorescent
marker expression. Unlike previous candidates (Table 1 & Table 2), EMS608 results were
replicable and withstood the validating procedures mentioned above. EMS608 seedlings develop
slower than wild type and display a short root phenotype (Fig. 8). At 10 days after imbibition
(d.a.i.), EMS608 roots are ~50% shorter than wild type roots. Figure 9 shows the results of a root
length assay that compares EMS608 seedlings to wild type (3 biological replicates). When
compared to wild type plants, EMS608 seedlings also develop fewer lateral roots (Fig. 9). More
notably, the expression of the CORTEX marker in these mutants is markedly reduced. In this line,
the fluorescent expression in both the meristematic and maturation zones, appears dimmer when
viewed through a dissection microscope (Fig. 10). These results suggest that EMS608 may be a
cortex specific phenotype.
To test this hypothesis, we needed to test the line‟s specificity by looking at tissue-
specific differentiation mechanisms in other tissues. Since the cortex and endodermis share the

28
same stem cell lineage and together, form the ground tissue, we decided to focus on the effects
caused by EMS608 on endodermal differentiation.
Figure 8: EMS608 mutants display short roots and severe dwarfism
Figure 9: Root length comparison between EMS608 mutants and wild type seedlings

29
Figure 10: Microscopy of EMS608 mutants
EMS608 roots have faint CORTEX marker expression and a reduced meristem. A & B:
dissecting microscope image of (A) control & (B) EMS608. C & D: confocal image of EMS608
(C) & control (D). CORTEX marker line used as control
One of the well-studied mechanisms of endodermis development is the formation of the
Casparian strip, a barrier that prevents the free movement of solutes from the soil into the root‟s
central vasculature (Geldner N., 2013; Liberman et al., 2015). Using Casparian strip formation to
test the cortex specificity of EMS608‟s phenotype is a good approach as the formation of this
barrier is endodermis specific and marks endodermis differentiation. If the EMS608 phenotype is
cortex specific, Casparian strip formation should remain unchanged in mutant seedlings.
The Casparian strip formation assay was performed by submerging 30 homozygous 6 day
old EMS608 roots in propidium iodide for 5 minutes and checking for the penetration of this dye
into the central vasculature with confocal microscopy. myb36 mutants were used as a negative
control as they lack the Casparian strip barrier (Liberman et al., 2015). Figure 11 shows a
representative digital cross section from this assay. 28 of the 30 EMS608 mutants tested had a
fully functioning Casparian strip. The 2 seedlings in which propidium iodide was able to
penetrate into the central vasculature were due to experimental damage caused when transferring
seedlings from the media to microscope slides. These results indicate that EMS608 seedlings

30
have a fully formed and completely functional Casparian strip and suggest that the line‟s
phenotype may be cortex-specific.
Figure 11: Cross-section of EMS608 mutant
Confocal image of a Casparian strip assay of EMS608. Confocal image of a cross section of
EMS608 (A) showing a functional Casparian strip barrier. (B) myb36 control.
Mapping Results for EMS608
To identify the causal mutation that affects CORTEX marker expression in EMS608
mutants, we used bulk-segregant analysis and whole-genome resequencing. A total of 47
EMS608 M2 affected seedlings (homozygous mutants) and 150 EMS608 M2 unaffected siblings
(heterozygotes and wild types) were bulked by phenotype and whole-genome re-sequenced. The
paired-end (PE) sequencing results from both populations displayed high quality reads as greater
than 94% of the base pair calls had a quality score (Q-score) greater than 30 (Table 3). This
indicates that on average, there is less than 1 sequencing error per 1000 base pairs sequenced
(Richterich, 1998). In addition, the GC content of these reads was in accordance with the

31
expected 36% GC content of the Arabidopsis genome (Initiative, 2000). These results indicate
that there is very little or no genomic contamination in the DNA libraries sequenced.
Table 3: QC results from high-throughput whole-genome sequencing of EMS608 bulks
Sample Number of
PE reads
Fraction of
bases Q >= 30
GC content
R1 R2 R1 R2
EMS608-A 60,880,648 96.00% 94.00% 37.10% 37.10%
EMS608-U 50,978,268 96.00% 95.00% 36.60% 36.60%
The causal mutation responsible for EMS608‟s phenotype was found using SNPtrack, a
pipeline developed for mapping phenotypically derived regions from next generation sequencing
data (Leshchiner et al., 2012). Unlike traditional map-based cloning approaches, SNPtrack saves
time and effort as plants from the M2 generation can be directly used for analysis without having
to backcross into parental lines. SNPtrack identified a C-to-T DNA base change (transition) in the
ninth exon of AT5G24630 (Fig. 12). This transition causes a non-synonymous amino acid change
from glycine (gGa) to glutamic acid (gAa) at an essential splicing site. This is significant as
AT5G24630 is predicted to have 6 splice isoforms (Fig. 12). For validation purposes, the
mutation was also identified with a different set of computational tools.
EMS608 is a novel allele of Brassinosteroid-Insensitive 4
Results from a literature search identified AT5G24630 as Brassinosteroid-Insensitive4
(BIN4), a component of the plant DNA Topoisomerase VI complex involved in endoreduplication
(Breuer et al., 2007).

32
Figure 12: Schematic showing mutation in Bin4
Genome browser schematic showing the location of the causative mutation in EMS608. Location
of C-to-T transition in EMS608 mutant RNA transcript
Endoreduplication is the duplication of genomic content without corresponding mitotic
events. This is a key process in plant development as it allows plant cells to enlarge to hundreds
of times their original size. As a comparison, yeast and animal cells typically only double from
their original size as most cells in these organisms don‟t undergo endoreduplication (Sugimoto-
Shirasu et al., 2003).
Multiple alleles of bin4 have been well characterized in the past. Some of these include:
bin4-1, bin4-2, mid-1 and mid-2 (Breuer et al., 2007, Kirk et al., 2007, Schrader et al., 2013).
Phenotypes include: severe dwarfism, smaller nuclei, reduced cell size, reduced ploidy, up-
regulation of double strand repair mechanisms, reduced root hairs, photomorphogenesis defects,
and ectopic activation of cyclin-dependent protein kinase CYCB1;1 (Breuer et al., 2007, Kirk et
al., 2007, Schrader et al., 2013). These phenotypes suggest that mutations in Bin4 severely affect
Arabidopsis’ developmental mechanisms.
The combination of these studies and the experiments conducted in this work indicate
that EMS608 isn‟t directly involved in cortex specification and differentiation. The aberrant
CORTEX marker expression is a result of plant-wide endoreduplication defects that affect all

33
tissues. Nevertheless, EMS608 is a new allele that can be used to study endoreduplication
mechanisms in Arabidopsis.
Discussion of Forward Genetics Screen’s Results:
The main goal of this project was to find novel genes involved in cortex specification and
differentiation. Unfortunately, after screening over 1300 independent lines for aberrant marker
expression, no new genes were found. This makes us question if the developmental mechanisms
of cortex specification and differentiation are controlled by the actions of several redundant
transcription factors working together. Based on the results from our screen and new data from
other experiments, it appears that cortex specification and differentiation may require the
concerted action of multiple genes.
Eric Rogers, a post-doctoral researcher in our lab, mined the cell-specific microarray data
generated for the RootMap project (Brady et al., 2007). Using a generous expression cutoff of
1.25 to mark for overexpression, he identified 86 transcription factors that were considered
upregulated in the cortex. He then analyzed all of the available T-DNA knockout insertion
mutants by looking for any identifiable root phenotypes. Of all the transcription factors studied,
only one displayed a statistically significant root length phenotype. However, this mutant didn‟t
display a cortex or ground tissue phenotype when analyzed using confocal microscopy.
Considering the fact that these genes were selected based on their cortex expression values, and
that they are transcription factors, this data supports a model for cortex development that requires
a complex network of transcription factors working in unison.
In addition, a recent publication from our lab was able to show that the expression of
cortex-specific markers requires inputs from several BIRD transcription factors, namely, JKD,
MGP and NUC (Moreno-Risueno et al., 2015). That is, the only way to see aberrant expression of

34
cortex markers is by knocking down these three transcription factors at once. Even in that case,
the experiment only works when ablating the meristem and waiting for the ground tissue to re-
emerge. This indicates that JKD, MGP and NUC only affect post-embryonic development of the
ground tissue.
Based on the information presented above, since the BIRD transcription factors only
regulate post-embryonic ground tissue development, it is possible that a different set of genes
regulates its embryonic development. Unfortunately, if this is the case, our forward genetics
screen is ill suited to find such genes as key mutations in genes that control embryonic
development would likely cause lethality in embryos. Since we screened for mutations at a post-
embryonic time period, any genes involved in embryonic development would be missed as seeds
would be unable to germinate. One way to get around this is by screening embryos (rather than
seedlings) for reduced expression of early cortex markers with confocal microscopy. However,
this would prove very difficult, cost-intensive and laborious.
An alternative hypothesis that could explain a mechanism of cortex specification may
involve the absence of SHORTROOT in this tissue. As mentioned in Chapter 1, the endodermis
is specified by having SHR transported from the stele into the endodermis. In addition, the
ground tissue in shr mutants is unable to divide asymmetrically, thus forming a monolayer that
has cortex identity. In order to see if SHR absence is sufficient to specify the cortex, a transgenic
line could be generated to express SHR in the cortex by using a cortex-specific promoter.
Although our experiments didn‟t identify novel genes involved in cortex development,
we were able to go from phenotype to genotype by using a mapping approach that didn‟t require
multiple back-crosses or map-crosses. This computational method allowed us to save 6 months of
time, a significant amount of work and lab resources. In addition, we discovered a new allele of

35
BIN4 that could be used in conjunction with currently available alleles to study the process of
endoreduplication in Arabidopsis roots.

36
Chapter 3: Unique cell-type specific patterns of DNA methylation in the root meristem
Results
Columella is the most CHH hypermethylated cell type in Arabidopsis
To investigate patterns of DNA methylation in different plant cell types, we used
protoplasting followed by fluorescence activated cell sorting (FACS) of cell populations marked
by green fluorescent protein (GFP). The sorted lines represent the major cell types or tissues in
the root: epidermis (ProWER:GFP), cortex (ProCOR:GFP), endodermis (ProSCR:GFP), stele
(ProWOL:GFP), whole columella root cap (PET111 enhancer trap line), and lower columella
(ProCYCD5:GFP) (Fig. 13a). Following isolation of highly enriched populations of each cell
type, we generated single-base resolution maps of cytosine methylation by whole genome
bisulfite sequencing, and transcriptome profiles by RNA-seq and smRNA-seq (Urich et al., 2015;
Lister et al., 2008) (Fig. 13b and Table S1). Analysis of global levels of DNA methylation in the
six cell populations revealed that methylation in all CG, CHG and CHH contexts (mCG, mCHG,
mCHH, respectively) were higher for the columella, but there were dramatically increased levels
of mCHH (Fig. 1c). Comparison with previously published Arabidopsis methylomes showed that
mCHH levels in the columella were higher than in any other tissue or cell type (Calarco et al.,
2012; Ibarra et al., 2012) (Fig. 13c). The enrichment of mCHH in the columella was most
pronounced in the pericentromeric regions of the chromosome (Fig. 13d). Whole root tips from
the PET111 transgenic line, as well as from Col-0, showed similar patterns of mC as the non-
columella cell types (Fig. 13c and d), indicating that differences seen in the columella cell
populations were due to cell identity and not to the transgenic lines used for cell isolation.

37
Figure 13: Cell type specific patterns of DNA methylation in the root meristem
(a) Schematic representation of the six root cell types used in this study. Endodermis has two
independent replicates (indicated by numerals) for MethylC-seq and mRNA-seq. Lower
columella, root tip of Col-0 and PET111 have only MethylC-seq data. (b) A genome browser
snapshot showing DNA methylation level, mRNA-seq reads, smRNA-seq reads. (c) Global levels
of DNA methylation in each context for root cells and reproductive cells (VN: vegetative nucleus,
SP: sperm, MS: microspore, EM: embryo, EN: endosperm). VN, SP data are obtained from Ibarra
et al., 2012, EM, ES data are from Hsieh et al., 2009, MS data are from Calarco et al., 2012,
respectively. (d) A heat map showing mC levels within 100 kb bins in the six root cell types and
two root tip control samples. Densities of genes and TEs within 50 kb bins are also shown. Max
mC levels are 0.91 (mCG), 0.72 (mCHG), 0.34 (mCHH).
Widespread differential DNA methylation is present in the root meristem
To better understand the large differences in DNA methylation patterns, we used
methylpy to identify differentially methylated regions of the genome (DMRs) between the cell
types (Schultz et al., 2015). With a target false discovery rate of 5%, we found 38,307 DMRs
between the different cell types (Fig. 14a). Of these, 13.6% (5,225) were differentially methylated
only in the CG context (CG-DMRs), while 82.9% (31,761) were differentially methylated only in

38
the CH context (CH-DMRs) (Fig. 14a, Table S2 and S3). Regions differentially methylated in
both the CG and CH context (C-DMRs) were rare, with only 1,321 such regions observed (Fig.
14a and Table S4). DMR length also seemed to be associated with DNA methylation context,
with CG-DMRs being, on average, shorter than CH- and C-DMRs (Fig. 14b). Overall, 13.8% of
the nuclear genome was differentially methylated between the six cell types, mostly in the CH
context (Fig. 14c).
Some regions of the genome are prone to spontaneous changes in DNA methylation
levels (Schmitz et al., 2011). To determine if the regions of differential DNA methylation
between cell types were due to spontaneous fluctuations in DNA methylation levels between the
different transgenic lines used, we compared the root cell type specific DMRs with two types of
previously identified spontaneous DMRs; transgenerational DMRs (Schmitz et al., 2011) and
population DMRs (Schmitz et al., 2013). We found that 76% and 60% of root cell type specific
CG-DMRs and C-DMRs, respectively, overlapped with population DMRs, whereas only 5% and
2% of root cell type specific CG- and C-DMRs overlapped with transgenerational CG- and C-
DMRs (Fig. S1). We conclude that the majority of root cell type specific DMRs are likely
spontaneous events, as they overlap with regions of the genome previously identified as being
subject to spontaneous changes in DNA methylation levels.

39
Figure 14: Differentially methylated regions among six root cell types
(a) Numbers of each type of DMR. (b) Average sizes of each type of DMR. (c) Genomic
fraction of each type of DMR relative to the whole genome. (d) Genome wide
distribution of each type of DMR. Counts were scaled by maximum count as one. Only
chromosome 1 is shown. (e) Genomic features covering DMRs. (f) Hierarchical
clustering of six root cell types for CG-, CH-, and C-DMRs based on mCG, mCH and
mC levels, respectively. (g) mCHH levels within CH- and C-DMRs. (h) 24 nt smRNA
expression levels of CH- and C-DMRs. (i) Heatmap representation of DMR distribution
along genes, and correlation between DMR methylation and gene expression.
To determine if the enrichment of DNA methylation in pericentromeric regions (Fig.
13d) was linked to DMRs, we assessed the distribution of DMRs along the chromosomes (Fig.
14d and S2). While CG-DMRs are most abundant in the chromosome arms, the number of CH-
and C-DMRs peaked in the proximal and distal pericentromeric regions, respectively. Closer
inspection of the genomic features intersecting each set of DMRs revealed that over 80% of CG-
DMRs overlapped with protein-coding gene bodies (Fig. 14e), while 73% of CH-DMRs and 44%
40
of C-DMRs overlapped with TEs. The remaining CH-DMRs and C-DMRs were found to overlap
mainly with intergenic regions or pseudogenes.
Hierarchical clustering based on differences in DNA methylation showed that the
columella cells form a highly distinct group compared to other cells of the root (Fig. 14f).
Interestingly, DNA methylation patterns seemed to be more similar between cell types located
physically close to one another in the root, regardless of their lineage, whereas transcriptional
profiles were more dependent on cell lineage than physical position in the root (Fig. S3). This
may suggest that methylation patterns are in part regulated by positional information or cell-cell
communication. Columella cells seemed highly distinct in their DNA methylation landscape,
particularly in the mCHH context. Methylation at CH- and C-DMRs was higher in the columella
than in other cell types, suggesting that CHH hypermethylation in the columella is the primary
basis for CH- and C-DMRs among root meristem cells (Fig. 14f and S4).
As mCHH is deposited by two distinct DNA methyltransferases, DRM2 and CMT2
(Zemach et al., 2013; Stroud et al., 2014), we sought to determine which methyltransferase was
responsible for mediating changes in mCHH in each set of DMRs. We analysed mCHH levels
within DMR coordinates in leaves of wild type, drm1drm2, and cmt2 plants in order to categorise
DMRs as DRM2 or CMT2 targets, using previously published DNA methylation data (Stroud et
al., 2014) (Fig. S5). For CH-DMRs, both drm1drm2 and cmt2 showed decreased mCHH in these
regions, but the effect of cmt2 was much larger, whereas for C-DMRs only drm1drm2 caused a
decrease in mCHH levels. These results reveal that mCHH within CH-DMRs and C-DMRs is
mainly catalyzed by CMT2 and DRM2, respectively. DRM2 is involved in two types of RdDM,
the canonical Pol IV-mediated RdDM guided by 24 nt smRNAs (Law and Jacobsen, 2010), and
RDR6-mediated RdDM guided by 21 and 22 nt smRNAs (Nuthikattu et al., 2013). We found a

41
pronounced upregulation of 24 nt smRNA within C-DMRs as well as CH-DMRs in the
columella, but only slight upregulation of 21 nt (Fig. 14H and S6), suggesting that the canonical
Pol IV-mediated RdDM pathway plays an important role in establishing these DMRs. We did not
observe TE transcriptional activation in the columella (Fig. S7).
Gene body methylation in the CG context is correlated with constitutive gene expression
(Tran et al., 2005; Zhang et al., 2006; Zilberman et al., 2006). In contrast, DNA methylation in
gene-flanking regions is thought to repress gene expression. To address whether DMRs affect the
expression of nearby genes, we correlated DMR methylation levels and nearby gene expression
levels (Fig. 14i). Most CG-DMRs were located within the gene bodies, especially near
transcriptional termination sites. However, minimal correlation between methylation levels at
CG-DMRs and expression levels of nearby genes was observed. CH- and C-DMRs are largely
excluded from the gene bodies. While the correlation between CH- and C-DMR methylation and
gene expression was also variable, methylation at transcription start sites was weakly and
negatively correlated with nearby gene expression levels. Similarly, methylation at C-DMRs
within gene bodies showed a negative correlation with gene expression. These results suggest
root cell type specific CH and C-DMRs only weakly contribute to cell type specific gene
expression patterns. Additionally, gene ontology enrichment analysis showed CH-DMR
associated genes were enriched for response genes, such as “defense response” and “innate
immune response” (Fig. S8). This suggests that CH-DMRs only weakly correlate with nearby
gene expression, and may only have an impact on gene expression under specific environmental
circumstances.

42
Transposable elements are targets for CHH hypermethylation
Although only a small percentage of CH-DMRs were found to intersect with gene bodies
(Fig. 2f), these still represented over 1,000 genomic loci due to the abundant nature of CH-
DMRs. To further investigate whether there might be a correlation between mCHH levels within
genes and the transcript abundance of those genes, we ordered genes based on average transcript
abundance among cell populations and further analyzed patterns of DNA methylation (Fig. 15).
This revealed that, while levels and patterns of mCG and mCHG were similar between cell types
(Fig. 15a), lowly expressed and silent genes were CHH hypermethylated in the columella.
Furthermore, we found that the number of genes harboring TEs were also enriched in genes with
lower expression (Fig 15a), suggesting that increases in mCHH within lowly expressed genes
may be due to the hypermethylation of TEs contained within these genes. As mCHH serves to
transcriptionally silence TEs in Arabidopsis, and most CH-DMRs were found within annotated
TEs, we compared patterns and levels of DNA methylation across all TEs in the genome (Fig.
15b-d). Levels of mCG and mCHG in TEs were only moderately higher in both columella cell
populations, consistent with what was observed on a genome-wide scale (Fig. 1c). However, a
large increase in mCHH in both columella cell populations was observed compared with the other
cell types, and this was consistent across all known TE superfamilies in Arabidopsis (Fig. S9).
This indicates that, while some CH-DMRs were found to intersect with protein-coding genes,
differences in mCHH between cell types can be attributed almost entirely to the CHH
hypermethylation of TEs in the columella. As TEs are greatly enriched in the pericentromeric
heterochromatin, this would also explain the enrichment of mCHH and CH-DMRs in the
pericentromeric regions (Fig. 13c and 14d).

43
Figure 15: DNA methylation in genes and TEs
(a) DNA methylation patterns within genes ordered by average mRNA abundance. (b-d)
DNA methylation levels within TEs for each cell type. TEs show greatly increased CHH
DNA methylation in the columella genome, while CG and CHG DNA methylation levels
are similar and moderately higher than in other cell types.
Enhanced RNA-directed DNA methylation in the columella
As we observed an increase in mCHH in TEs, as well as an increase in 24 nt smRNA
abundance at CH-DMRs, we next sought to determine whether there might be transcriptional
upregulation of the RdDM pathway in the columella. Analysis of mRNA-seq data revealed an
increase in mRNA transcripts encoding components of the RdDM pathway in the columella as

44
compared to the other cell populations (Fig. 4a). In particular, we found an enrichment for
transcripts encoding proteins needed for smRNA biogenesis, such as the major unique Pol IV
component NRPD1a, as well as CLSY1, RDR2 and DCL3, while those components involved
directly in the deposition of DNA methylation were only mildly upregulated in the columella (Xie
et al., 2004; Onodera et al., 2005; Henderson et al., 2006; Smith et al., 2007). To investigate
whether this increased production of smRNA biogenesis machinery in the columella translated
into an increase in the proportion of 24 nt smRNAs sequenced, we assessed levels of uniquely
mapped 21, 22, 23, and 24 nt smRNAs genome-wide (Fig. 16b and Table S5). This revealed a
strong increase in the fraction of 24 nt smRNAs in the columella, indicating that the
hypermethylation of TEs in the columella is coupled with a transcriptional upregulation of the
smRNA biogenesis machinery and increased production of 24 nt smRNAs needed for the RdDM
pathway.
DDM1 protein is not present in the columella
In the vegetative cell nucleus of the pollen, a loss of mCG and mCHH throughout the
genome is coupled with increased mCHH at the centromere, the absence of DDM1 protein, and
loss of heterochromatin (Slotkin et al., 2009; Calarco et al., 2012) (Fig. S10). This triggers TE
transcriptional activation and increased production of 21 nt smRNAs from TE transcripts, which
are thought to be transported to the sperm cells to reinforce TE silencing in the germline (Slotkin
et al., 2009; Ibarra et al., 2012). We observed an increase in 24 nt smRNA and CHH
hypermethylation of TEs in columella cells. Although no decrease in DDM1 transcript abundance
specific to the columella was detected (Fig. 16a and 17a), DDM1-GFP protein was undetectable
in the columella, whereas it was present in the nuclei of other root cell types (Fig. 17b). This
indicates that DDM1 is transcribed in the columella, but either the transcripts are not translated or

45
there is rapid degradation of DDM1 protein. Despite an apparent lack of DDM1 in the columella
and in contrast to ddm1, normal levels of mCG and mCHG are maintained at TEs, and there are
elevated levels of mCHH (Fig. 13d, 17c).
Figure 16: Transcript levels of DNA methylation related components
(a) Increased transcript abundance for genes involved in smRNA biogenesis in the columella.
Scale is log2 fold change FPKM for each cell type compared to average FPKM for all cell types.

46
Average FPKM for all cell types are also shown. (b) Fraction of uniquely-mapped smRNA for
each size class relative to total uniquely-mapped smRNA. 24 nt smRNA levels are greatly
increased in the columella.
Figure 17: Loss of DDM1 in the columella
(a) DDM1 transcript abundance in the 5 cell types. (b). Absence of DDM1-GFP in the columella.
(c) CHH methylation levels and smRNA accumulation around methylated TEs. Methylated TEs
were classified into 4 clusters based on TE body methylation levels of wild type, drm1 drm2,
cmt2, ddm1 in leaf, using k-means (centers = 4). Left panel shows mCHH levels of TEs with 2kb

47
upstream and downstream. Each region consists of equally sized 40 bins. Right panel shows
smRNA expression levels as in left panel. Periodic hyper methylated TEs are centromeric TEs,
because TEs were ordered by coordinate within cluster, and stacked from bottom: chromosome 1,
to top: chromosome 5. (d) Representative browser shots for TEs in each cluster.
DDM1-dependent mCHH deposition is catalyzed by the DNA methyltransferase CMT2
(Zemach et al., 2013), and the RdDM pathway together with CMT2 are responsible for almost all
mCHH in the genome (Stroud et al., 2014). We classified all methylated TEs into four clusters,
based on mCHH levels within TE bodies of wild type, drm1 drm2, cmt2 and ddm1 leaf tissue
(Fig. 5c left panel). mCHH levels in TEs in clusters 1 and 2 were decreased in drm1 drm2,
indicating that they were RdDM-dependent. mCHH levels in TEs in cluster 3 and cluster 4 were
decreased in cmt2, indicating that their methylation was CMT2-dependent. Strikingly, in the
columella, TEs in all four clusters were hypermethylated. RdDM-dependent TEs were
hypermethylated, accompanied by 24 nt, but not 21 nt, smRNA accumulation. CMT2-dependent
TEs were hypermethylated in the columella, and those located in chromosome arms were
accompanied by 24 nt smRNA accumulation, consistent with 24 nt smRNA enrichment in CH-
DMRs. The edges of CMT2-dependent TEs are subjected to RdDM, and 24 nt smRNAs are
enriched in these regions (Zemach et al., 2013). However, the edges as well as the bodies of
CMT2-dependent TEs accumulated 24 nt smRNA in the columella (Fig. 17c and d), suggesting
that the bodies of CMT2-dependent TEs are also subjected to RdDM. This may account for CHH
hypermethylation of CMT2-dependent TEs, but lower expression of CMT2 in the columella (Fig.
4a).
DDM1 is normally required for the displacement of histone H1 at heterochromatic
regions of the genome, allowing DNA methyltransferases MET1, CMT3 and CMT2 to access and
methylate the DNA (Zemach et al., 2013). As loss of H1 suppresses the reduction in DNA

48
methylation in ddm1 mutants, we examined transcript levels for the two canonical histone H1
genes, H1.1 and H1.2, and found a lower abundance of transcripts for both genes in columella
cells as compared with other cells in the root meristem (Fig. 16a and 17e). Also H2A.W6 and
H2AW.7, which are required for chromatin condensation (Yelagandula et al., 2014), were down-
regulated in the columella (Fig. 16a and 17e), suggesting that the columella may lose
heterochromatin through a reduction of heterochromatin related components. Loss of
heterochromatin in the columella may play a role in enhancing generation of the 24 nt smRNA
transcripts needed for RdDM, leading to the observed CHH hypermethylation of TEs.
Discussion of DNA Methylation Results:
Plants are multicellular organisms containing a variety of cell types with specialized
functions. While differences in patterns of DNA methylation have been found previously between
different somatic tissues (Widman et al., 2014) and reproductive cell types (Hsieh et al., 2009;
Slotkin et al., 2009; Calarco et al., 2012; Ibarra et al., 2012), this is the first report of differences
in DNA methylation between cell types from the same somatic tissue.
The root meristem contains a diverse variety of cell types. Among these, the columella is
a group of specialized gravity-sensing cells, required for proper development of the root (Tsugeki
and Fedoroff, 1999; Swarup et al., 2005). The most striking and unique feature of these root cell
methylomes is CHH hypermethylation of TEs in the columella, which is obscured when
methylomes are analyzed using whole roots or dissected root tips. To date, the columella is the
most highly methylated tissue or cell type in Arabidopsis, and such an extreme level of
hypermethylation is not recapitulated by any known gene silencing mutant. Columella cells are
rapidly replaced in the root as they grow outward from the columella initials, located just below

49
the quiescent centre (QC), ultimately being detached into the soil. Consequently, columella cells
are short lived and undergo rapid differentiation.
mCHH primarily serves to silence TE transcription in Arabidopsis, preventing potentially
damaging genetic mutations caused by transposition. Due to the terminally differentiated and
short-lived nature of columella cells, it is reasonable to expect that TE insertions in the columella
would have little impact on fitness, as these mutations would be quickly lost from the plant, and
the apparent enhancement of DNA methylation-mediated TE silencing in the columella is
therefore counterintuitive. One possible explanation for this seeming contradiction is that the
columella acts as a companion to nearby stem cells, and is similar in function to the reproductive
companion cells found in the developing pollen and seed (Hsieh et al., 2009; Slotkin et al., 2009;
Calarco et al., 2012; Ibarra et al., 2012). Excess 24 nt smRNAs produced by the columella,
required for initiation of RdDM at TEs, may be transported upward to the neighboring stem cell
niches, reinforcing transcriptional silencing of TEs in these stem cells in a manner analogous to
the smRNA transport thought to occur between the vegetative cell nucleus and sperm cells in the
developing pollen, between the central cell and egg, and possibly between the endosperm and
embryo (Ibarra et al., 2012; Calarco et al., 2012). As the root stem cells are responsible for the
establishment of tissue patterning in the root, and all cells of the root descend from these stem
cells, transpositions in them may have a larger impact on plant fitness, and therefore have a
greater need for effective TE silencing, similar to generative stem cells in the germline.
Although DDM1 is undetectable in both the columella and the vegetative cell nucleus of
the pollen, the patterns of mCHH at TEs are distinct between these two cell types, with mCHH
levels in the vegetative cell nucleus being more similar to that found in ddm1. Heterochromatin
has been suggested to inhibit RdDM, while open chromatin increases the accessibility of RdDM

50
components to the genome leading to hypermethylation (Schoft et al., 2009). DDM1, and
associated proteins such as H1, may play an important role in regulating the exclusion of RdDM-
related factors from the heterochromatin, and it is possible that DDM1 protein accumulation is
actively suppressed in the columella to allow RdDM at DDM1-regulated heterochromatic
regions. Another possible explanation for the CHH hypermethylation and upregulation of the
RdDM pathway in the columella may be that special attributes of the columella, such as the rapid
differentiation after one division of the stem cell and possible increased ploidy level (Dolan et al.,
1993), are conducive to hypermethylation of TEs. Future experiments will be needed to further
examine these hypotheses.

51
Appendix: Supplementary Materials for DNA Methylation & smRNAs
Supplemental Figure 1. Expression levels of cell type specific marker genes in each cell type. (a) Root meristem of ProCYCD5:GFP. GFP is specifically expressed in lower columella. (b) – (e)
Expression levels of genes used for reporter lines in each cell population. Promoters of WER,
AT1G09750, SCR and WOL were used to drive GFP in epidermis, cortex, endodermis and stele,
respectively. (f) Expression levels of upper columella marker ARL2 in each cell population. (g)
Expression levels of CYCD5 in each cell population. Discrepancy between ProCYCD5:GFP and
CYCD5 transcript levels in each cell population indicates that the ProCYCD5:GFP reporter does

52
not fully recapitulate CYCD5 expression, but instead confers gene expression restricted to the
lower columella.
Supplemental Figure 2. Intersection of root cell specific, populational, and
transgenerational DMRs. (related to Fig. 14)
(a) CG-DMRs. (b) C-DMRs. Populational DMRs and transgenerational DMRs were obtained
from Schmitz et al., (2013) and Schmitz et al., (2011), respectively.
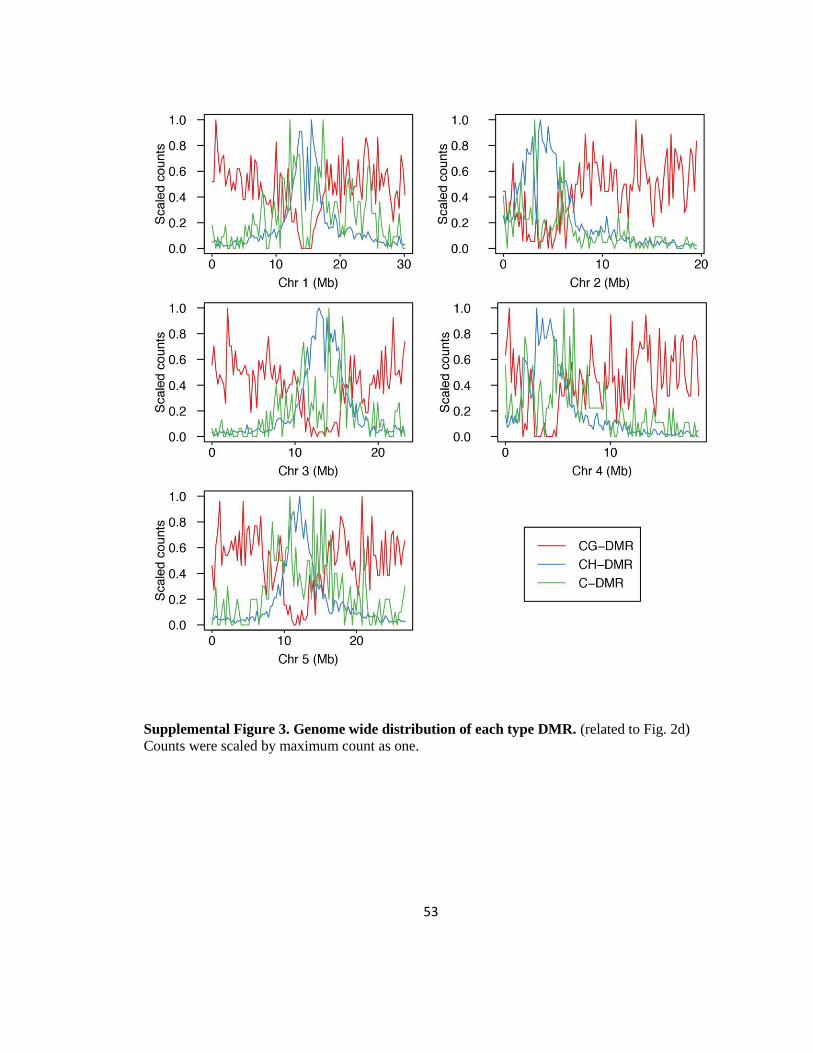
53
Supplemental Figure 3. Genome wide distribution of each type DMR. (related to Fig. 2d)
Counts were scaled by maximum count as one.

54
Supplemental Figure 4. Hierarchical clustering of six root cell types for transcriptomes.
(related to Fig. 14f)
Clustering was performed based on log2 transformed FPKM of expressed genes (FPKM > 1 in at
least one sample), using R dist and hclust function with default parameters.

55
Supplemental Figure 5. DNA methylation levels of each type of DMRs in each class. (related
to Fig. 14f)
DMRs were clustered based on mCG (CG-DMRs) or mCHH (CH- and C-DMRs) levels using R
dist and hclust function with default parameters, and ordered.

56
Supplemental Figure 6. Dependency of CHH methylation of DMRs on DNA
methyltransferases. (related to Fig. 14)
(a) CHH methylation levels of DMRs in leaf of wild type (wt), drm1 drm2, cmt2. (b)-(d) Kernel
density plots of methylation differences between mutants and wt in CG-DMRs (b), CH-DMRs
(c), C-DMRs (d). Negative values show hypomethylation in mutants, indicating CHH
methylation is dependent on the DNA methyltransferase.

57
Supplemental Figure 7. mCHH levels and smRNA expression levels in each size within
DMRs. (related to Fig. 14g and h)

58
Supplemental Figure 8. TE expression levels. (related to Fig. 14g and h)
(a) Expression levels of all TEs. (b) Expression levels of expressed TEs only (FPKM > 1 at least
in one cell type). Values are shown in log2 (FPKM + 1).

59
Supplemental Figure 9. Gene ontology enrichment analysis of DMR overlapping genes. (related to Fig. 14i)
Gene ontologies enriched in CG- (a), CH- (b), C- (c) overlapping genes. Labels in red indicate
responsive gene ontologies. Values are indicated in -log10 (FDR). Gene ontology analysis was
performed using DAVID tool (https://david.ncifcrf.gov/).

60
Supplemental Figure 10. DNA methylation in transposable elements. (related to Fig. 15b-d)
Diverse TE superfamilies, including LTR retrotransposons (a) Copia, (b) Gypsy, (c) LINEs, (d)
SINEs, (e) Helitrons, (f) MuDRs show increased DNA methylation in CHH contexts in both
columella cells, while levels of CG methylation are similar and levels of CHG methylation are
moderately increased in the columella.

61
Supplemental Figure 11. Genome wide DNA methylation levels in various cells and mutants
(related to Fig. 17)
A heat map showing DNA methylation levels within 100 kb bins in columella (CRC), vegetative
nucleus (VN), sperm (SP), microspore (MS), embryo (EM), ES (ES), leaf of Col-0, drm1 drm2,
cmt2, ddm1. Densities of genes and TEs within 50 kb bins are also shown. Max DNA methylation
levels are 0.98 (mCG), 0.85 (mCHG), 0.40 (mCHH).

62
References
Abrash, E. B., & Bergmann, D. C. (2009). Asymmetric Cell Divisions: A View from Plant
Development. Developmental Cell, 16(6), 783–796.
Baubec, T., Finke, A., Mittelsten Scheid, O., & Pecinka, A. (2014). Meristem-specific expression
of epigenetic regulators safeguards transposon silencing in Arabidopsis. EMBO Reports,
15(4), 446–452.
Birnbaum, K., Benfey, P. N., Nawy, T., Lee, J.-Y., Colinas, J., Wang, J. Y., Benfey, P. N.
(2005). Transcriptional profile of the Arabidopsis root quiescent center. The Plant Cell,
17(7), 1908–25.
Birnbaum, K., Shasha, D. E., Wang, J. Y., Jung, J. W., Lambert, G. M., Galbraith, D. W., &
Benfey, P. N. (2003). A gene expression map of the Arabidopsis root. Science (New York,
N.Y.), 302(5652), 1956–1960.
Brady, S. M., Orlando, D. a, Lee, J.-Y., Wang, J. Y., Koch, J., Dinneny, J. R., Benfey, P. N.
(2007). A high-resolution root spatiotemporal map reveals dominant expression patterns.
Science (New York, N.Y.), 318(5851), 801–6.
Breakfield, N. W., Corcoran, D. L., Petricka, J. J., Shen, J., Sae-Seaw, J., Rubio-Somoza, I.,
Benfey, P. N. (2012). High-resolution experimental and computational profiling of tissue-
specific known and novel miRNAs in Arabidopsis. Genome Research, 22(1), 163–76.
Breuer, C., Stacey, N. J., West, C. E., Zhao, Y., Chory, J., Tsukaya, H., Sugimoto-Shirasu, K.
(2007). BIN4, a novel component of the plant DNA topoisomerase VI complex, is required
for endoreduplication in Arabidopsis. The Plant Cell, 19(11), 3655–3668.
Calarco, J. P., Borges, F., Donoghue, M. T. a, Van Ex, F., Jullien, P. E., Lopes, T., Martienssen,
R. a. (2012). Reprogramming of DNA methylation in pollen guides epigenetic inheritance
via small RNA. Cell, 151(1), 194–205.
Caspar, T. (1998). Seed Mutagenesis of Arabidopsis. Methods in Molecular Biology.
Cederholm, H. M., Iyer-Pascuzzi, A. S., & Benfey, P. N. (2012). Patterning the primary root in
Arabidopsis. Wiley Interdisciplinary Reviews: Developmental Biology, 1(5), 675–691.
Coleman-Derr, D., & Zilberman, D. (2012). Deposition of Histone Variant H2A.Z within Gene
Bodies Regulates Responsive Genes. PLoS Genetics, 8(10).
Collins, C., Dewitte, W., & Murray, J. A. H. (2012). D-type cyclins control cell division and
developmental rate during Arabidopsis seed development. Journal of Experimental Botany,
ers015.

63
Cubas, P., Vincent, C., & Coen, E. (1999). An epigenetic mutation responsible for natural
variation in floral symmetry. Nature, 401(6749), 157–161.
Cui, H., & Benfey, P. N. (2008). Interplay between SCARECROW, GA and LIKE
HETEROCHROMATIN PROTEIN 1 in ground tissue patterning in the Arabidopsis root.
The Plant Journal, 4(6), 551–3.
Cui, H., & Benfey, P. N. (2009). Cortex Proliferation Addendum. Plant Signaling & Behavior,
(June), 551–553.
Cui, H., Levesque, M. P., Vernoux, T., Jung, J. W., Paquette, A. J., Gallagher, K. L., Benfey, P.
N. (2007). An evolutionarily conserved mechanism delimiting SHR movement defines a
single layer of endodermis in plants. Science (New York, N.Y.), 316(5823), 421–5.
Dowen, R. H., Pelizzola, M., Schmitz, R. J., Lister, R., Dowen, J. M., Nery, J. R., Ecker, J. R.
(2012). Widespread dynamic DNA methylation in response to biotic stress. Proceedings of
the National Academy of Sciences of the United States of America, 109(32), E2183–91.
Geldner, N. (2013). The endodermis. Annual Review of Plant Biology, 64, 531–58.
Heidstra, R., Welch, D., & Scheres, B. (2004). Mosaic analyses using marked activation and
deletion clones dissect Arabidopsis SCARECROW action in asymmetric cell division.
Genes and Development, 18(16), 1964–1969.
Helariutta, Y., Fukaki, H., Wysocka-Diller, J., Nakajima, K., Jung, J., Sena, G., … Benfey, P. N.
(2000). The SHORT-ROOT gene controls radial patterning of the Arabidopsis root through
radial signaling. Cell, 101(5), 555–567.
Henderson, I. R., Zhang, X., Lu, C., Johnson, L., Meyers, B. C., Green, P. J., & Jacobsen, S. E.
(2006). Dissecting Arabidopsis thaliana DICER function in small RNA processing, gene
silencing and DNA methylation patterning. Nature Genetics, 38(6), 721–725.
Hsieh, T., Ibarra, C. A., Silva, P., Zemach, A., & Eshed-williams, L. (2008). Genome-Wide
Demethylation of Arabidopsis Endosperm. Science, (June), 1451–1455.
Iyer-pascuzzi, A. S., & Benfey, P. N. (2010). Fluorescence-Activated Cell Sorting in Plant
Developmental Biology, 655, 313–319.
Johnson, L. M., Du, J., Hale, C. J., Bischof, S., Feng, S., Chodavarapu, R. K., Jacobsen, S. E.
(2014). SRA- and SET-domain-containing proteins link RNA polymerase V occupancy to
DNA methylation. Nature, 507(7490), 124–8.
Kim, D., Pertea, G., Trapnell, C., Pimentel, H., Kelley, R., & Salzberg, S. L. (2013). TopHat2:
accurate alignment of transcriptomes in the presence of insertions, deletions and gene
fusions. Genome Biology, 14(4), R36.

64
Kim, Y., Schumaker, K. S., & Zhu, J.-K. (2006). EMS mutagenesis of Arabidopsis. Methods in
Molecular Biology (Clifton, N.J.), 323(6), 101–3.
Kirik, V., Schrader, A., Uhrig, J. F., & Hulskamp, M. (2007). MIDGET unravels functions of the
Arabidopsis topoisomerase VI complex in DNA endoreduplication, chromatin
condensation, and transcriptional silencing. The Plant Cell, 19(10), 3100–3110.
Koornneef, M. (1982). Frequencies at Individual Loci in Arabidopsis, 93, 109–123.
Law, J. a, Du, J., Hale, C. J., Feng, S., Krajewski, K., Palanca, A. M. S., Jacobsen, S. E. (2013).
Polymerase IV occupancy at RNA-directed DNA methylation sites requires SHH1. Nature,
498(7454), 385–389.
Law, J. A., & Jacobsen, S. E. (2010). Establishing, maintaining and modifying DNA methylation
patterns in plants and animals. Nature Reviews. Genetics, 11(3), 204–220.
Lee, J. Y., Colinas, J., Wang, J. Y., Mace, D., Ohler, U., & Benfey, P. N. (2006). Transcriptional
and posttranscriptional regulation of transcription factor expression in Arabidopsis roots.
Proceedings of the National Academy of Sciences of the United States of America, 103(15),
6055–6060. doi:10.1073/pnas.0510607103
Leshchiner, I., Alexa, K., Kelsey, P., Adzhubei, I., Austin-Tse, C. a., Cooney, J. D., Sunyaev, S.
R. (2012). Mutation mapping and identification by whole-genome sequencing. Genome
Research, 22, 1541–1548.
Liberman, L. M., Sparks, E. E., Moreno-Risueno, M. A., Petricka, J. J., & Benfey, P. N. (2015).
MYB36 regulates the transition from proliferation to differentiation in the Arabidopsis root.
Proceedings of the National Academy of Sciences, 112(39), 12099–12104.
Lister, R., O‟Malley, R. C., Tonti-Filippini, J., Gregory, B. D., Berry, C. C., Millar, a H., &
Ecker, J. R. (2008). Highly integrated single-base resolution maps of the epigenome in
Arabidopsis. Cell, 133(3), 523–36.
Lister, R., Pelizzola, M., Dowen, R. H., Hawkins, R. D., Hon, G., Tonti-Filippini, J., Ecker, J. R.
(2009). Human DNA methylomes at base resolution show widespread epigenomic
differences. Nature, 462(7271), 315–22.
Lister, R., Pelizzola, M., Kida, Y. S., Hawkins, R. D., Nery, J. R., Hon, G., Ecker, J. R. (2011).
Hotspots of aberrant epigenomic reprogramming in human induced pluripotent stem cells.
Nature, 471(7336), 68–73.
Mähönen, A. P., Bonke, M., Kauppinen, L., Riikonen, M., Benfey, P. N., & Helariutta, Y. (2000).
A novel two-component hybrid molecule regulates vascular morphogenesis of the
Arabidopsis root. Genes and Development, 14(23), 2938–2943.

65
Matzke, M. a., & Mosher, R. a. (2014). RNA-directed DNA methylation: an epigenetic pathway
of increasing complexity. Nature Reviews Genetics, 15(6), 394–408.
Matzke, M., Kanno, T., Daxinger, L., Huettel, B., & Matzke, A. J. M. (2009). RNA-mediated
chromatin-based silencing in plants. Current Opinion in Cell Biology, 21(3), 367–76.
Mirouze, M., Reinders, J., Bucher, E., Nishimura, T., Schneeberger, K., Ossowski, S., Mathieu,
O. (2009). Selective epigenetic control of retrotransposition in Arabidopsis. Nature,
461(September), 1–5.
Miyashima, S., Hashimoto, T., & Nakajima, K. (2009). ARGONAUTE1 acts in arabidopsis root
radial pattern formation independently of the SHR/SCR pathway. Plant and Cell
Physiology, 50(3), 626–634.
Moreno-Risueno, P. N. B. (2015). Transcriptional control of tissue formation throughout root
development. Science, 1(May).
Myeong, L. M., & Schiefelbein, J. (1999). WEREWOLF, a MYB-Related Protein inArabidopsis ,
Is a Position-Dependent Regulator of Epidermal Cell Patterning. Cell, 99(5), 473–483.
Nuthikattu, S., McCue, A. D., Panda, K., Fultz, D., DeFraia, C., Thomas, E. N., & Slotkin, R. K.
(2013). The initiation of epigenetic silencing of active transposable elements is triggered by
RDR6 and 21-22 nucleotide small interfering RNAs. Plant Physiology, 162(1), 116–31.
Onodera, Y., Haag, J. R., Ream, T., Nunes, P. C., Pontes, O., & Pikaard, C. S. (2005). Plant
nuclear RNA polymerase IV mediates siRNA and DNA methylation- dependent
heterochromatin formation. Cell, 120(5), 613–622.
Page, D. R., & Grossniklaus, U. (2002). The art and design of genetic screens: Arabidopsis
thaliana. Nature Reviews. Genetics, 3(2), 124–36.
Paquette, A. J., & Benfey, P. N. (2005). Maturation of the Ground Tissue of the Root Is
Regulated by Gibberellin and SCARECROW and Requires SHORT-ROOT 1 [ w ]. Plant
Physiology, 138(June), 636–640.
Pauluzzi, G., Divol, F., Puig, J., Guiderdoni, E., Dievart, A., & Périn, C. (2012). Surfing along
the root ground tissue gene network. Developmental Biology, 365(1), 14–22.
Pernas, M., Ryan, E., & Dolan, L. (2010). SCHIZORIZA controls tissue system complexity in
plants. Current Biology : CB, 20(9), 818–23.
Petricka, J. J., Van Norman, J. M., & Benfey, P. N. (2009). Symmetry Breaking in Plants:
Molecular Mechanisms Regulating Asymmetric Cell Divisions in Arabidopsis, 1(5), 17.
66
Pignatta, D., Erdmann, R. M., Scheer, E., Picard, C. L., Bell, G. W., & Gehring, M. (2014).
Natural epigenetic polymorphisms lead to intraspecific variation in Arabidopsis gene
imprinting. eLife, 3, e03198.
Richterich, P. (1998). Estimation of Errors in “„ Raw ‟” DNA Sequences : A Validation Study
Error Rate Prediction Accuracy for Six Projects, (781), 251–259.
Sanchez, J., & Salinas, J. (2014). Arabidopsis Protocols. Methods in Molecular Biology (Vol.
1062).
Scheres, B., Benfey, P., & Dolan, L. (2002). Root Development. The Arabidopsis Book, 40(1), 1.
Schmitz, R. J., Schultz, M. D., Lewsey, M. G., O‟Malley, R. C., Urich, M. A., Libiger, O., Ecker,
J. R. (2011). Transgenerational epigenetic instability is a source of novel methylation
variants. Science (New York, N.Y.), 334(6054), 369–73.
Schmitz, R. J., Schultz, M. D., Urich, M. A., Nery, J. R., Pelizzola, M., Libiger, O., Ecker, J. R.
(2013). Patterns of population epigenomic diversity. Nature, 495(7440), 193–8.
Schoft, V. K., Chumak, N., Mosiolek, M., Slusarz, L., Komnenovic, V., Brownfield, L., Tamaru,
H. (2009). Induction of RNA-directed DNA methylation upon decondensation of
constitutive heterochromatin. EMBO Reports, 10(9), 1015–21.
Schrader, A., & Uhrig, J. F. (2013). MIDGET cooperates with COP1 and SPA1 to repress
flowering in Arabidopsis thaliana, (September), 6–9.
Schrader, A., Welter, B., Hulskamp, M., Hoecker, U., & Uhrig, J. F. (2013). MIDGET connects
COP1-dependent development with endoreduplication in Arabidopsis thaliana. Plant
Journal, 75(1), 67–79.
Schultz, M. D., He, Y., Whitaker, J. W., Hariharan, M., Mukamel, E. A., Leung, D., Ecker, J. R.
(2015). Human body epigenome maps reveal noncanonical DNA methylation variation.
Nature, 523(7559), 212–6.
Schultz, M. D., Schmitz, R. J., & Ecker, J. R. (2012). “Leveling” the playing field for analyses of
single-base resolution DNA methylomes. Trends in Genetics, 28(12), 583–585.
Secco, D., Wang, C., Shou, H., Schultz, M. D., Chiarenza, S., Nussaume, L., Lister, R. (2015).
Stress induced gene expression drives transient DNA methylation changes at adjacent
repetitive elements. eLife, 4(July), e09343.
Shaw, R. G., Byers, D. L., & Darmo, E. (2000). Spontaneous mutational effects on reproductive
traits of Arabidopsis thaliana. Genetics, 155(1), 369–378.
67
Slotkin, R. K., Vaughn, M., Borges, F., Tanurdžić, M., Becker, J. D., Feijó, J. a., & Martienssen,
R. a. (2009). Epigenetic Reprogramming and Small RNA Silencing of Transposable
Elements in Pollen. Cell, 136(3), 461–472.
Smith, L. M., Pontes, O., Searle, I., Yelina, N., Yousafzai, F. K., Herr, A. J., Baulcombe, D. C.
(2007). An SNF2 protein associated with nuclear RNA silencing and the spread of a
silencing signal between cells in Arabidopsis. The Plant Cell, 19(5), 1507–1521.
Sozzani, R., Cui, H., Moreno-Risueno, M. a, Busch, W., Van Norman, J. M., Vernoux, T.,
Benfey, P. N. (2010). Spatiotemporal regulation of cell-cycle genes by SHORTROOT links
patterning and growth. Nature, 466(7302), 128–32.
Sparks, E., Wachsman, G., & Benfey, P. N. (2013). Spatiotemporal signalling in plant
development. Nature Reviews. Genetics, 14(9), 631–44.
Sroufe, L. a, Erickson, M., Dumont, K., Czaja, S. J., Hearn, E. F., Do, D., Yoon, S. O. (2012a).
Active DNA Demethylation in, 337(September), 1360–1364.
Sroufe, L. a, Erickson, M., Dumont, K., Czaja, S. J., Hearn, E. F., Do, D., Yoon, S. O. (2012b).
Active DNA Demethylation in Plant Companion Cells Reinforces Transposon Methylation
in Gametes. Science, 337(September), 1360–1364.
Stroud, H., Do, T., Du, J., Zhong, X., Feng, S., Johnson, L., Jacobsen, S. E. (2014). Non-CG
methylation patterns shape the epigenetic landscape in Arabidopsis. Nature Structural &
Molecular Biology, 21(1), 64–72.
Sugimoto-Shirasu, K., & Roberts, K. (2003). “Big it up”: endoreduplication and cell-size control
in plants. Current Opinion in Plant Biology, 6(6), 544–553.
Swarup, R., Kramer, E. M., Perry, P., Knox, K., Leyser, O., Beemster, G. T. S., Bennett, M. J.
(2005). Root gravitropism requires lateral root cap and epidermal cells for transport and
response to a mobile auxin signal. Nature Cell Biology, 7(11), 1057–1065.
The Arabidopsis Genome Initiative. (2000). Analysis of the genome sequence of the flowering
plant Arabidopsis thaliana. Nature, 408(6814), 796–815.
Trapnell, C., Roberts, A., Goff, L., Pertea, G., Kim, D., Kelley, D. R., Pachter, L. (2012).
Differential gene and transcript expression analysis of RNA-seq experiments with TopHat
and Cufflinks. Nature Protocols, 7(3), 562–78.
Tsugeki, R., & Fedoroff, N. V. (1999). Genetic ablation of root cap cells in Arabidopsis.
Proceedings of the National Academy of Sciences of the United States of America, 96(22),
12941–6. Retrieved from
http://www.pubmedcentral.nih.gov/articlerender.fcgi?artid=23173&tool=pmcentrez&render
type=abstract

68
Tsukahara, S., Kobayashi, A., Kawabe, A., Mathieu, O., Miura, A., & Kakutani, T. (2009). Bursts
of retrotransposition reproduced in Arabidopsis. Nature, 461(7262), 423–426.
Urich, M. A., Nery, J. R., Lister, R., Schmitz, R. J., & Ecker, J. R. (2015). MethylC-seq library
preparation for base-resolution whole-genome bisulfite sequencing. Nature Protocols, 10(3),
475–83.
Wachsman, G., Sparks, E. E., & Benfey, P. N. (2015). Genes and networks regulating root
anatomy and architecture. New Phytologist, 208(1), 26–38.
Widman, N., Feng, S., Jacobsen, S. E., & Pellegrini, M. (2013). Epigenetic differences between
shoots and roots in Arabidopsis reveals tissue-specific regulation. Epigenetics : Official
Journal of the DNA Methylation Society, 9(2), 1–7.
Xie, Z., Johansen, L. K., Gustafson, A. M., Kasschau, K. D., Lellis, A. D., Zilberman, D.,
Carrington, J. C. (2004). Genetic and functional diversification of small RNA pathways in
plants. PLoS Biology, 2(5), 642–652.
Yang, L., Zhou, Y., Zhu, S., Huang, T., Wu, L., & Yan, X. (2012). Detection and quantification
of bacterial autofluorescence at the single-cell level by a laboratory-built high-sensitivity
flow cytometer. Analytical Chemistry, 84(3), 1526–1532.
Yelagandula, R., Stroud, H., Holec, S., Zhou, K., Feng, S., Zhong, X., Berger, F. (2014). The
histone variant H2A.W defines heterochromatin and promotes chromatin condensation in
arabidopsis. Cell, 158(1), 98–109.
Zemach, A., Kim, M. Y., Hsieh, P.-H., Coleman-Derr, D., Eshed-Williams, L., Thao, K.,
Zilberman, D. (2013). The Arabidopsis nucleosome remodeler DDM1 allows DNA
methyltransferases to access H1-containing heterochromatin. Cell, 153(1), 193–205.

69
Biography
Manuel A. Valdés was born in Santurce, Puerto Rico on December 21, 1980. He grew up
in Manatí, a small coastal city in the northern parts of the island and graduated from Colegio
Marista de Manatí in 1998. Upon graduating from high school, Manuel joined the United States
Marines and moved to the US mainland where he met his wife of 15 years, Nadia. Manuel
received his Bachelors of Science in Biology from the University of Massachusetts Boston in
2010. It was here that he became passionate about science while working in the lab of Dr.
Aleksey Veraksa. Immediately following graduation, Manuel moved to North Carolina to pursue
a PhD degree in the lab of Dr. Philip Benfey at Duke University. The rest of the story is yet to be
written.