arcgis geostatistical analyst brochure - usfws · arcgis geostatistical analyst provides...
TRANSCRIPT
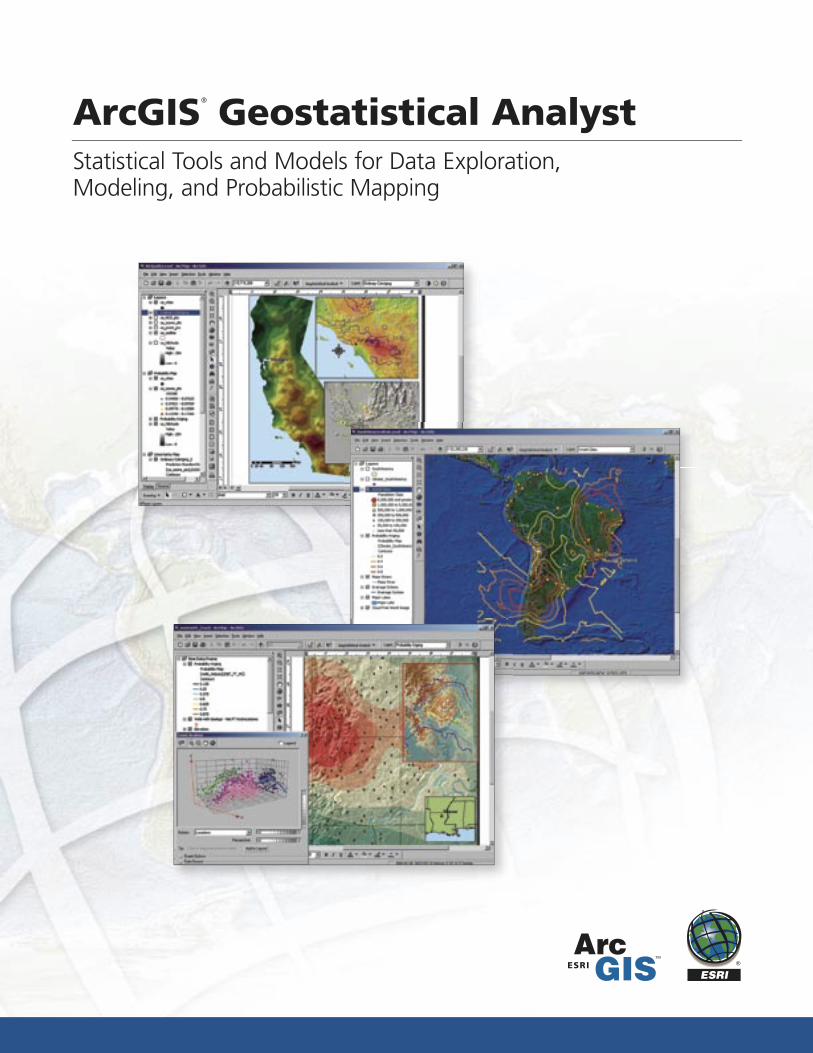
Statistical Tools and Models for Data Exploration, Modeling, and Probabilistic Mapping
ArcGIS® Geostatistical Analyst
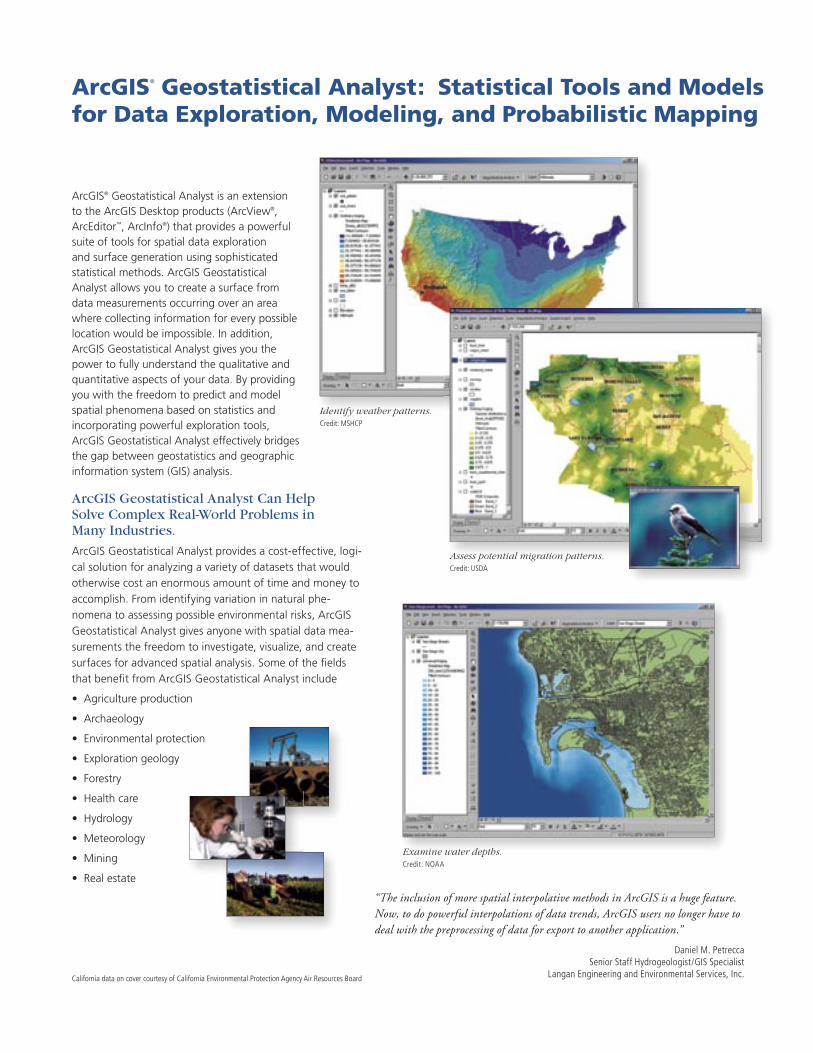
ArcGIS® Geostatistical Analyst is an extension to the ArcGIS Desktop products (ArcView®, ArcEditor™, ArcInfo®) that provides a powerful suite of tools for spatial data exploration and surface generation using sophisticated statistical methods. ArcGIS Geostatistical Analyst allows you to create a surface from data measurements occurring over an area where collecting information for every possible location would be impossible. In addition, ArcGIS Geostatistical Analyst gives you the power to fully understand the qualitative and quantitative aspects of your data. By providing you with the freedom to predict and model spatial phenomena based on statistics and incorporating powerful exploration tools, ArcGIS Geostatistical Analyst effectively bridges the gap between geostatistics and geographic information system (GIS) analysis.
ArcGIS Geostatistical Analyst Can Help Solve Complex Real-World Problems in Many Industries.
ArcGIS Geostatistical Analyst provides a cost-effective, logi-cal solution for analyzing a variety of datasets that would otherwise cost an enormous amount of time and money to accomplish. From identifying variation in natural phe-nomena to assessing possible environmental risks, ArcGIS Geostatistical Analyst gives anyone with spatial data mea-surements the freedom to investigate, visualize, and create surfaces for advanced spatial analysis. Some of the fi elds that benefi t from ArcGIS Geostatistical Analyst include
• Agriculture production
• Archaeology
• Environmental protection
• Exploration geology
• Forestry
• Health care
• Hydrology
• Meteorology
• Mining
• Real estate
ArcGIS® Geostatistical Analyst: Statistical Tools and Models for Data Exploration, Modeling, and Probabilistic Mapping
Examine water depths.Credit: NOAA
Identify weather patterns.Credit: MSHCP
“The inclusion of more spatial interpolative methods in ArcGIS is a huge feature. Now, to do powerful interpolations of data trends, ArcGIS users no longer have to deal with the preprocessing of data for export to another application.”
Daniel M. Petrecca Senior Staff Hydrogeologist/GIS Specialist
Langan Engineering and Environmental Services, Inc.California data on cover courtesy of California Environmental Protection Agency Air Resources Board
Assess potential migration patterns.Credit: USDA
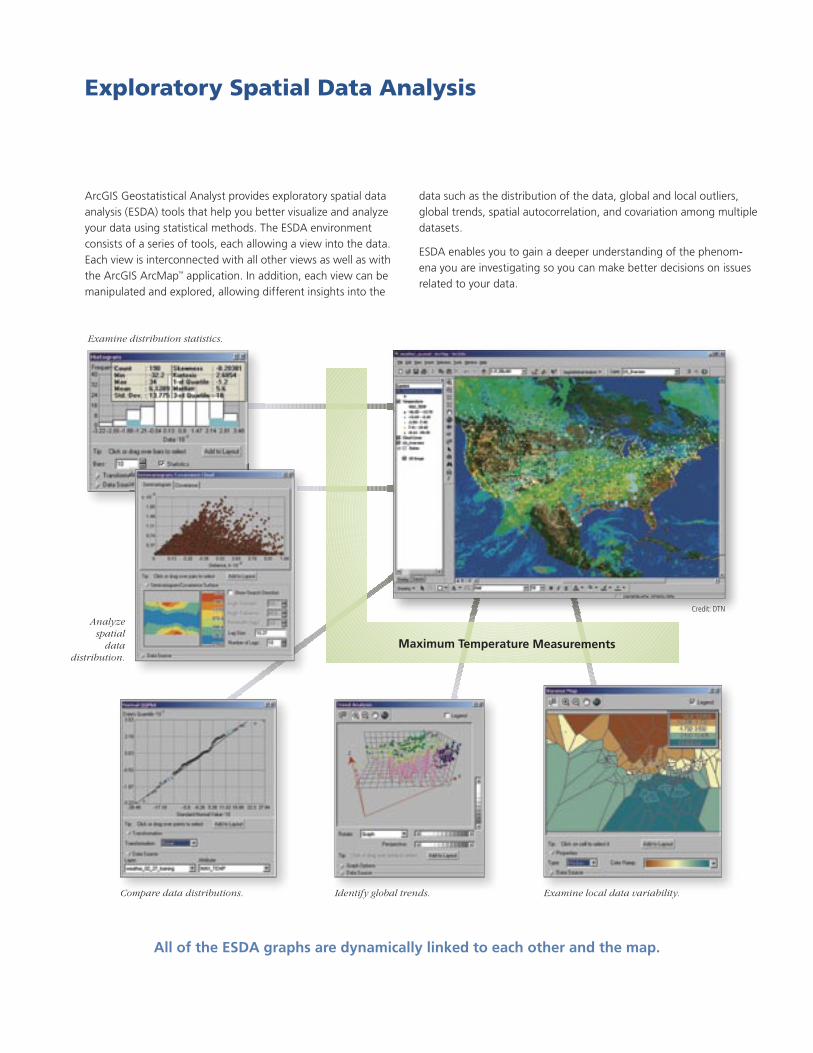
Examine distribution statistics.
Analyze spatial
data distribution.
Examine local data variability.Compare data distributions. Identify global trends.
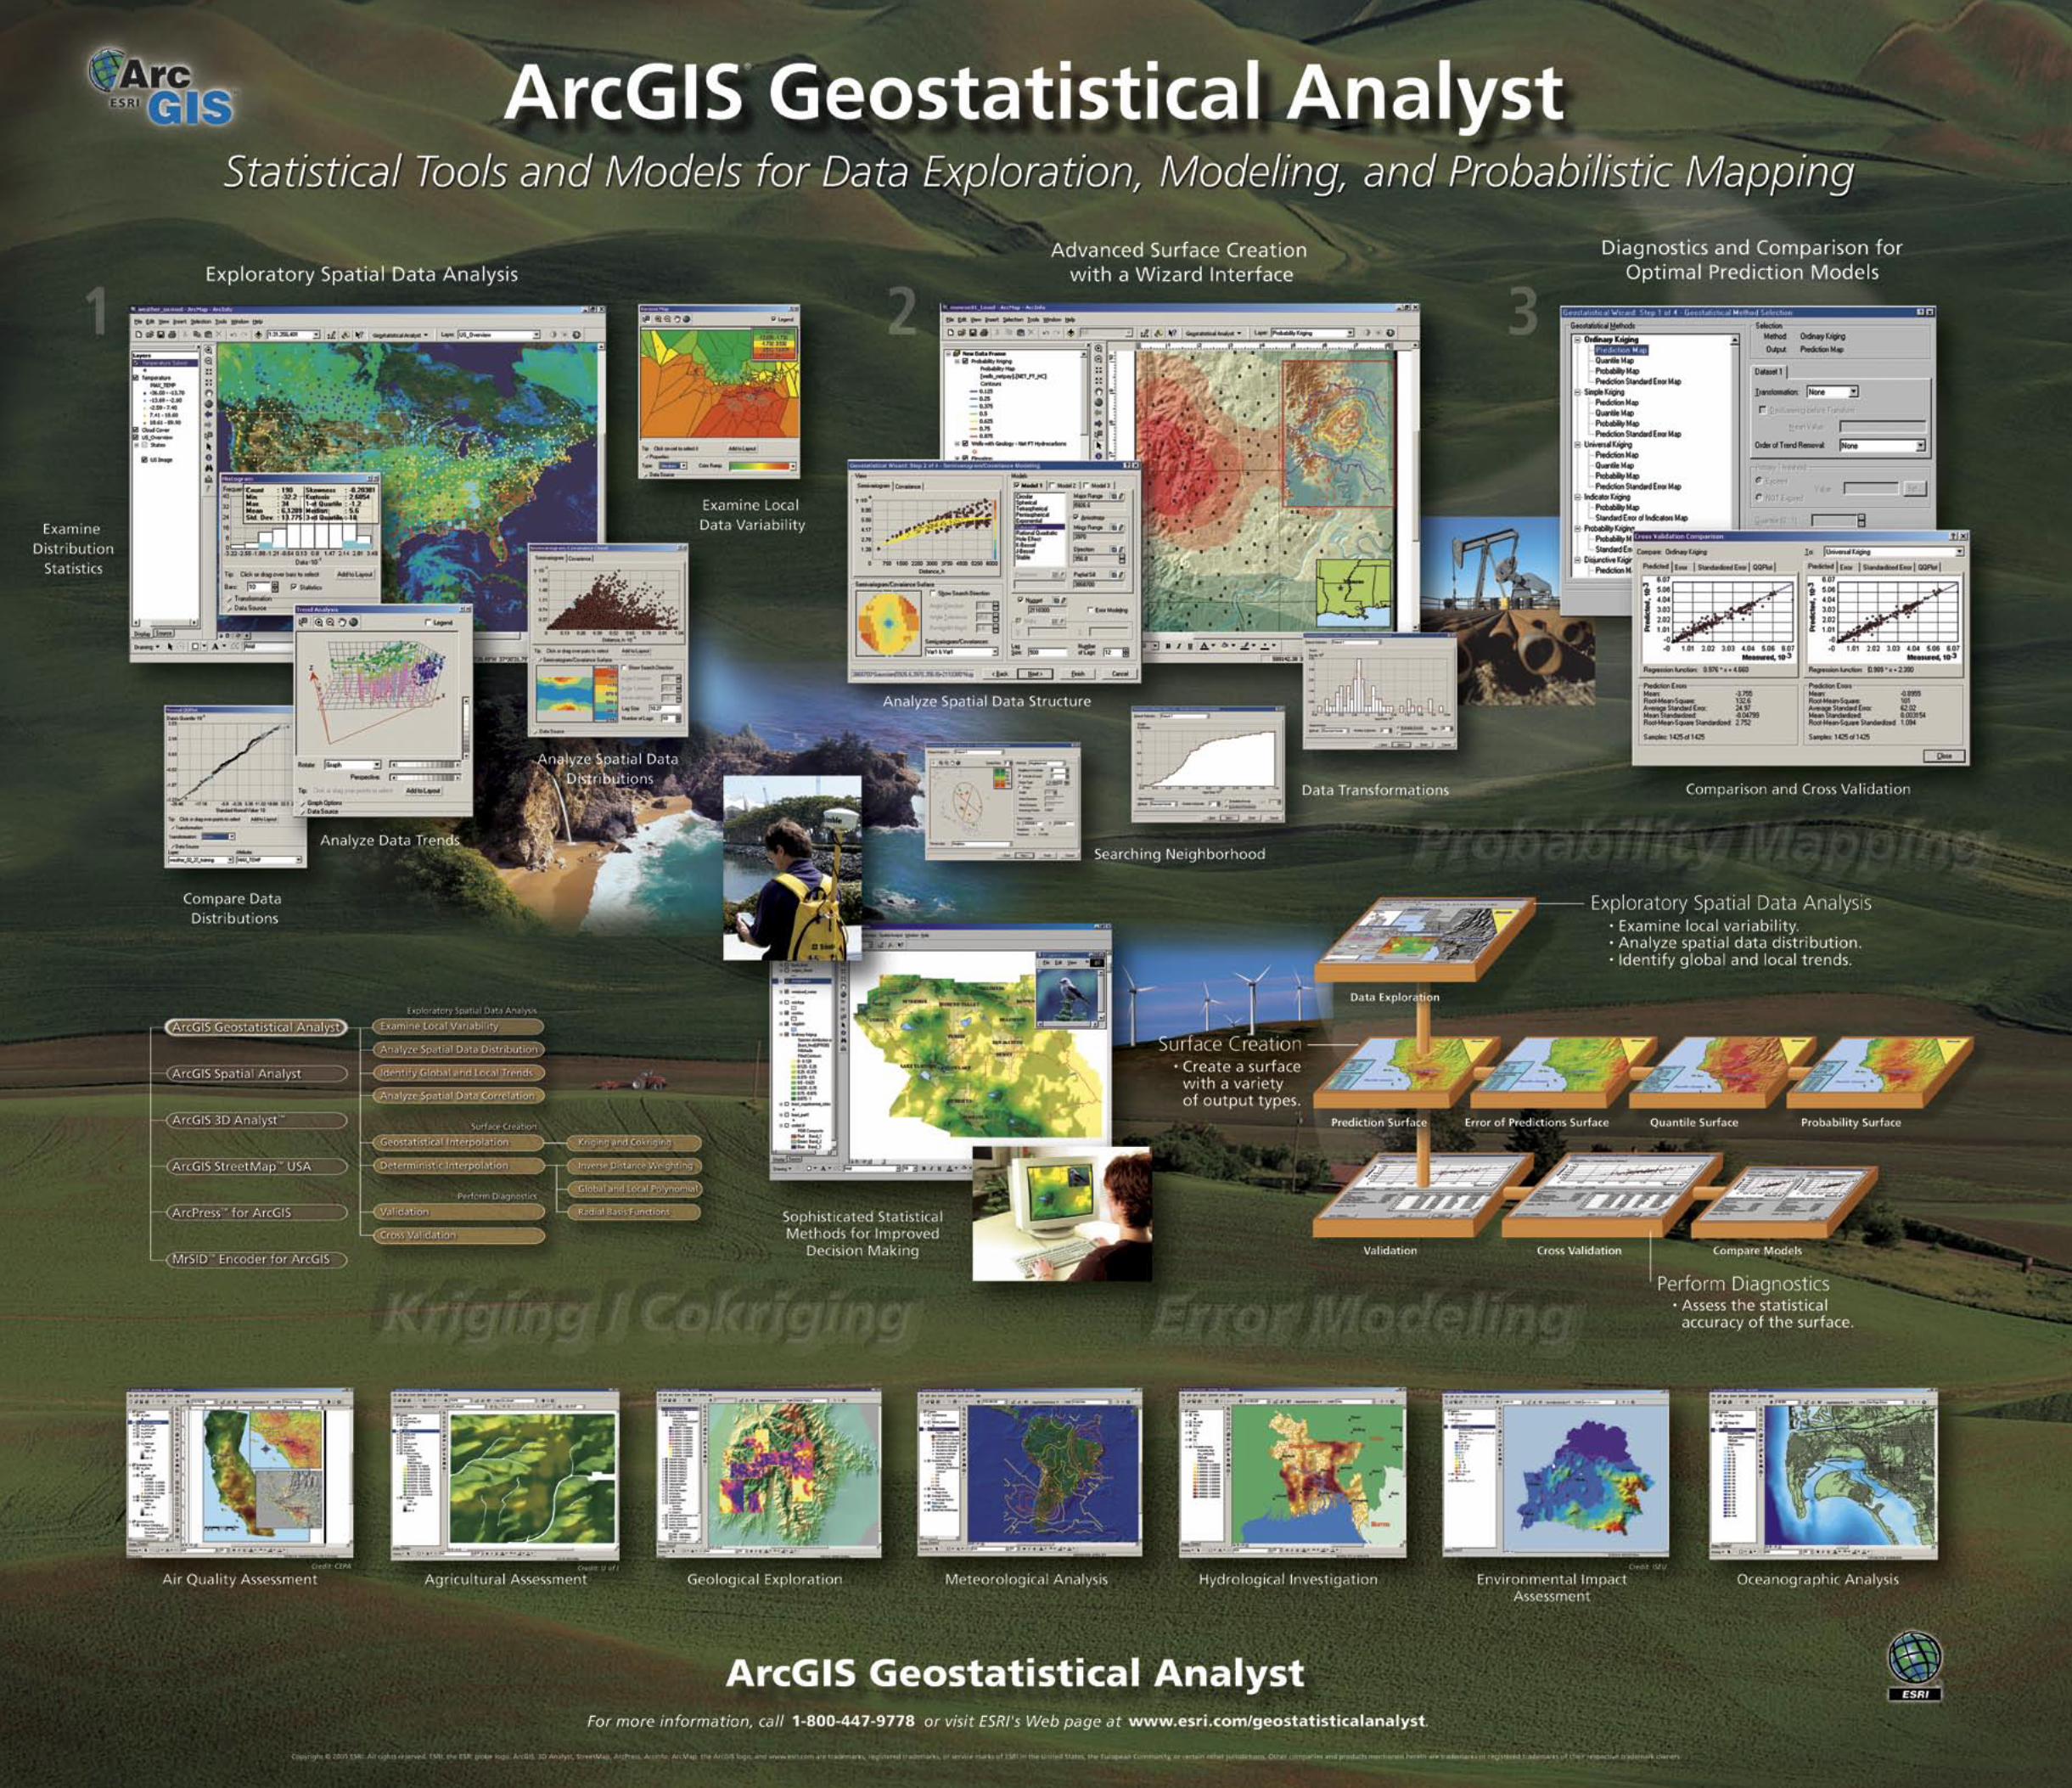
Exploratory Spatial Data Analysis
All of the ESDA graphs are dynamically linked to each other and the map.
ArcGIS Geostatistical Analyst provides exploratory spatial data analysis (ESDA) tools that help you better visualize and analyze your data using statistical methods. The ESDA environment consists of a series of tools, each allowing a view into the data. Each view is interconnected with all other views as well as with the ArcGIS ArcMap™ application. In addition, each view can be manipulated and explored, allowing different insights into the
data such as the distribution of the data, global and local outliers, global trends, spatial autocorrelation, and covariation among multiple datasets.
ESDA enables you to gain a deeper understanding of the phenom-ena you are investigating so you can make better decisions on issues related to your data.
Credit: DTN
Maximum Temperature Measurements
Advanced Surface Creation with a Wizard Interface
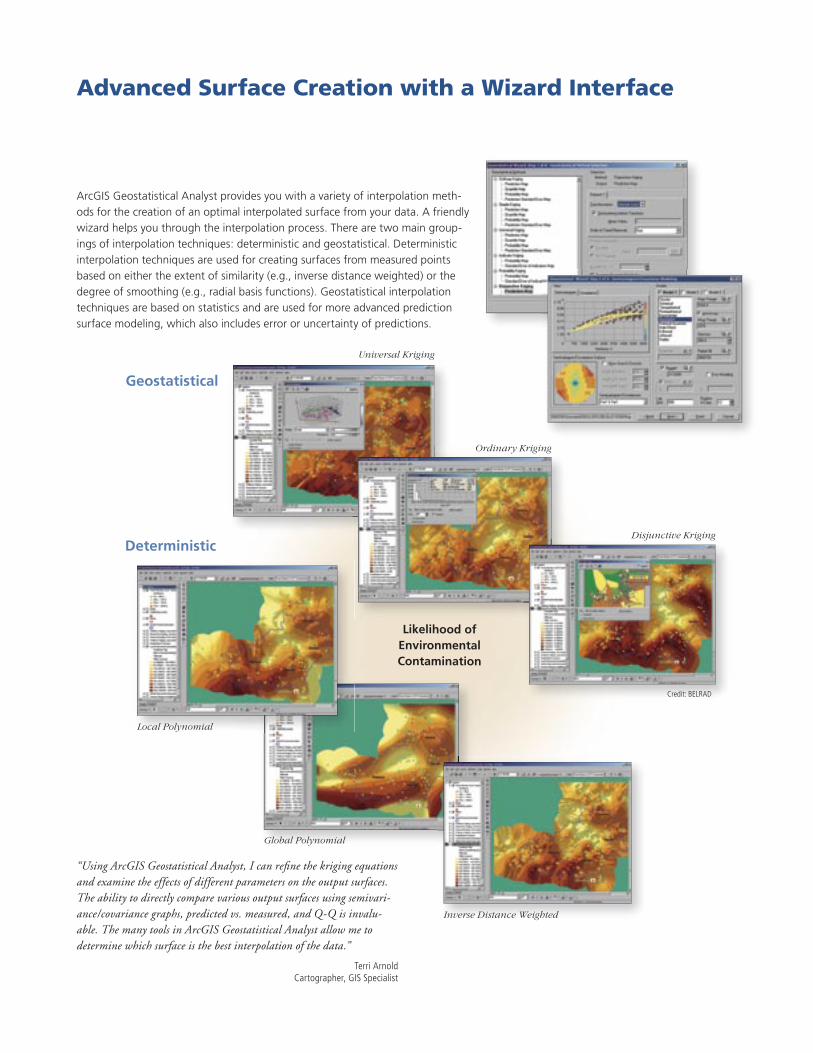
Inverse Distance Weighted
“Using ArcGIS Geostatistical Analyst, I can refi ne the kriging equations and examine the effects of different parameters on the output surfaces. The ability to directly compare various output surfaces using semivari-ance/covariance graphs, predicted vs. measured, and Q-Q is invalu-able. The many tools in ArcGIS Geostatistical Analyst allow me to determine which surface is the best interpolation of the data.”
Terri ArnoldCartographer, GIS Specialist
Geostatistical
Local Polynomial
Global Polynomial
ArcGIS Geostatistical Analyst provides you with a variety of interpolation meth-ods for the creation of an optimal interpolated surface from your data. A friendly wizard helps you through the interpolation process. There are two main group-ings of interpolation techniques: deterministic and geostatistical. Deterministic interpolation techniques are used for creating surfaces from measured points based on either the extent of similarity (e.g., inverse distance weighted) or the degree of smoothing (e.g., radial basis functions). Geostatistical interpolation techniques are based on statistics and are used for more advanced prediction surface modeling, which also includes error or uncertainty of predictions.
Universal Kriging
Deterministic
Likelihood of EnvironmentalContamination
Ordinary Kriging
Disjunctive Kriging
Credit: BELRAD
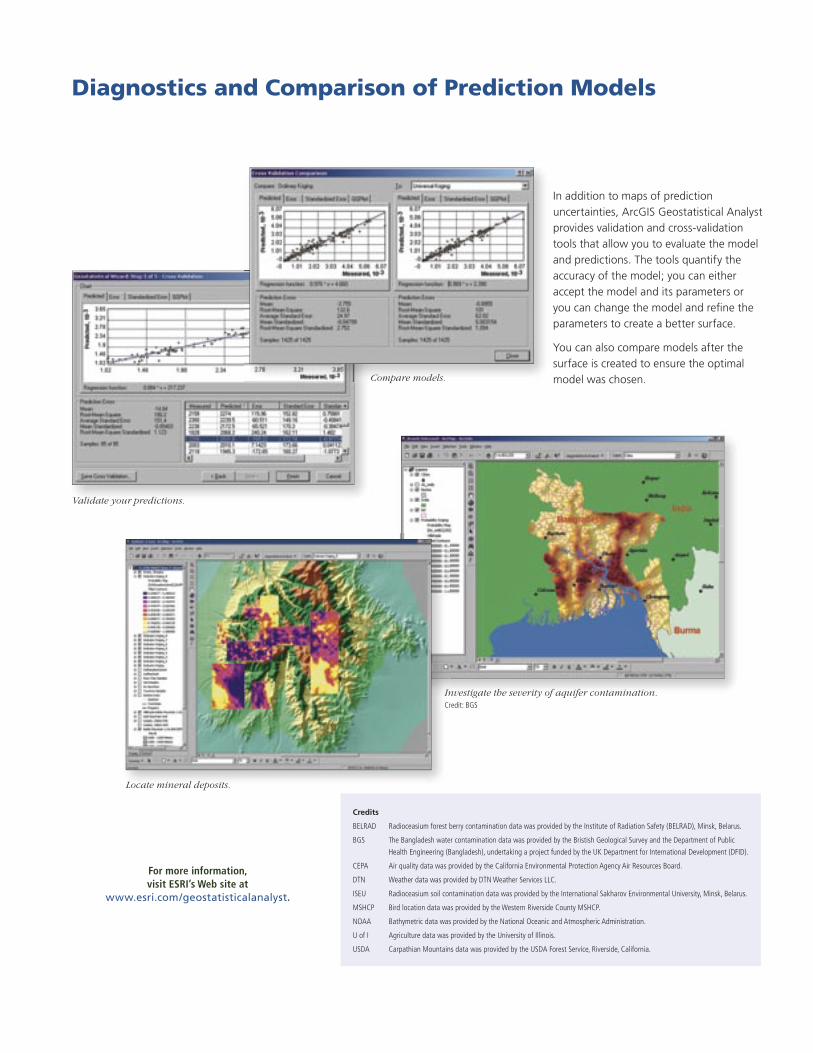
Investigate the severity of aquifer contamination.Credit: BGS
Locate mineral deposits.
In addition to maps of prediction uncertainties, ArcGIS Geostatistical Analyst provides validation and cross-validation tools that allow you to evaluate the model and predictions. The tools quantify the accuracy of the model; you can either accept the model and its parameters or you can change the model and refi ne the parameters to create a better surface.
You can also compare models after the surface is created to ensure the optimal model was chosen.
Diagnostics and Comparison of Prediction Models
For more information, visit ESRI’s Web site at
www.esri.com/geostatisticalanalyst.
Validate your predictions.
Compare models.
Credits
BELRAD Radioceasium forest berry contamination data was provided by the Institute of Radiation Safety (BELRAD), Minsk, Belarus.
BGS The Bangladesh water contamination data was provided by the Bristish Geological Survey and the Department of Public
Health Engineering (Bangladesh), undertaking a project funded by the UK Department for International Development (DFID).
CEPA Air quality data was provided by the California Environmental Protection Agency Air Resources Board.
DTN Weather data was provided by DTN Weather Services LLC.
ISEU Radioceasium soil contamination data was provided by the International Sakharov Environmental University, Minsk, Belarus.
MSHCP Bird location data was provided by the Western Riverside County MSHCP.
NOAA Bathymetric data was provided by the National Oceanic and Atmospheric Administration.
U of I Agriculture data was provided by the University of Illinois.
USDA Carpathian Mountains data was provided by the USDA Forest Service, Riverside, California.
Australia www.esriaustralia.com.au
Belgium/Luxembourg www.esribelux.com
Bulgaria www.esribulgaria.com
Canada www.esricanada.com
China (Beijing) www.esrichina-bj.cn
China (Hong Kong) www.esrichina-hk.com
Finland www.esri-finland.com
France www.esrifrance.fr
Germany/Switzerland www.esri-germany.de
www.esri-suisse.ch
Hungary www.esrihu.hu
India www.esriindia.com
Indonesia/Malaysia 62-21-527-1023 603-7874-9930
Italy www.esriitalia.it
Japan www.esrij.com
Korea www.esrikr.co.kr
Netherlands www.esrinl.com
Poland www.esripolska.com.pl
Portugal www.esri-portugal.pt
Romania www.esriro.ro
Singapore www.esrisa.com
Spain www.esri-es.com
Sweden www.esri-sweden.com
Thailand www.esrith.com
United Kingdom www.esriuk.com
Venezuela www.esriven.com
No. GS-35F-5086H
Printed in USA93119XXX5M8/05sf
Copyright © 2005 ESRI. All rights reserved. ESRI, ArcView, the ESRI globe logo, the ArcGIS logo, ArcInfo, ArcEditor, ArcMap, ArcGIS, @esri.com, and www.esri.com are trademarks, registered trademarks, or service marks of ESRI in the United States, the European Community, or certain other jurisdictions. Other companies and products mentioned herein are trademarks or registered trademarks of their respective trademark owners.
Place ESRI business partner or distributor address here.
For more than 35 years ESRI has been helping people manage and analyze geographic information. ESRI offers a framework for implementing GIS technology in any organization with a seamless link from personal GIS on the desktop
to enterprise-wide GIS client/server and data management systems. ESRI GIS solutions are flexible and can be customized to meet the needs of our users. ESRI is a full-service GIS company, ready to help you begin, grow, and build success with GIS.
International Offices
ESRI
380 New York Street
Redlands, California
92373-8100, USA
Telephone: 909-793-2853
Fax: 909-793-5953
For more information
on ESRI, call
1-800-447-9778(1-800-GIS-XPRT)
or contact an ESRI value-added
reseller near you.
Send e-mail inquiries to
Visit ESRI’s Web page at
www.esri.com
Corporate
Outside the United States,
contact your local ESRI distributor.
For the number of your distributor,
call ESRI at 909-793-2853,
ext. 1-1235,
or visit our Web site at www.esri.com/international
Regional Offices
ESRI-Minneapolis 651-454-0600ESRI-Olympia
360-754-4727ESRI-Boston 978-777-4543
ESRI-California 909-793-2853 ext. 1-1906
ESRI-Denver 303-449-7779
ESRI-San Antonio 210-499-1044
ESRI-Charlotte 704-541-9810
ESRI-Washington, D.C. 703-506-9515
ESRI-St. Louis 636-949-6620 ESRI-Philadelphia
610-644-3374
ESRI-New York City 212-349-3700