arch model plus and minus three sigma - m.cdn.blog.hum.cdn.blog.hu/el/eltecon/file/workingpapers/pdf...
TRANSCRIPT

1
GLOBAL FINANCIAL STABILITY AND LONG TERM RISKS
Robert Engle, NYU Stern School of BusinessEotvos Lorand, December 2009
WHAT IS FINANCIAL MARKET VOLATILITY?
� Unpredictable movements in asset prices.� Although we cannot predict future asset
prices we can predict their magnitude.� Thus we can predict risk � How can we do this and does it work in
turbulent times?
ARCH MODEL
� The ARCH model predicts the variance of returns on the next day.
� Autoregressive Conditional Heteroskedasticity
� It relies on two features of returns� Volatility Clustering
� Mean Reversion of Volatility
� Econometric Methods fit this model to data including many varieties, GARCH, TGARCH,…
Plus and Minus three Sigma
- . 1 0 0
- . 0 7 5
- . 0 5 0
- . 0 2 5
. 0 0 0
. 0 2 5
. 0 5 0
. 0 7 5
. 1 0 0
9 0 9 2 9 4 9 6 9 8 0 0 0 2 0 4 0 6
3 * S P V O L S P R E T -3 * S P V O L
SURPRISING SUCCESS
� Although the original application of ARCH was macroeconomic, the big success was for financial data.
� Why does it work?
� What makes volatility high?
BETTER ANSWER
� Economic news on future values and risks moves prices
� Volatility is the natural response of a financial market to new information.
� News arrives in clusters.� High volatility means a cluster of important
news!
2
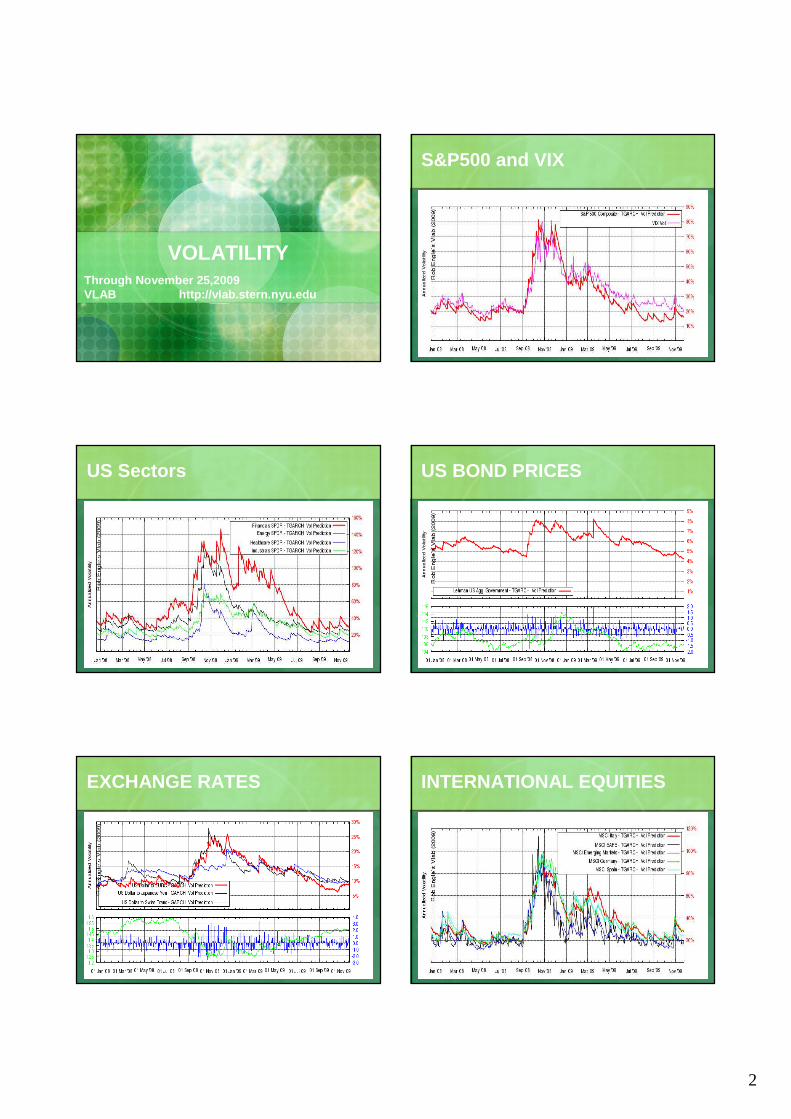
VOLATILITYThrough November 25,2009VLAB http://vlab.stern.nyu.edu
S&P500 and VIX
US Sectors US BOND PRICES
EXCHANGE RATES INTERNATIONAL EQUITIES

3
FINANCIAL CRISIS - CAUSES
FUNDAMENTAL CAUSES OF FINANCIAL CRISIS� Risk was underestimated by many market
participants (traders, money managers, bank ceo’s and boards, ratings agencies, regulators, investors and probably risk managers)
� Many of these had strong incentives to ignore risks.
IMPROVING RISK MEASUREMENT
SHOULD WE HAVE KNOWN?
� Would a good econometrician and risk assessor have known that the financial crisis was coming?
� Would the crisis have been in the confidence set?
� Was there information that risk assessment typically misses?
� Would economics have helped?
FORECAST PERFORMANCE IN VLAB
� During the financial crisis, the short run forecasts were just as accurate as during the low volatility period.
� One month ahead forecasts were less accurate during the crisis but were still within the 1% confidence interval of historical and theoretical experience.
� See Brownlees, Engle, Kelly,”A Practical Guide to Forecasting in Calm and Storm”

4
SHORT RUN VS. LONG RUN RISK� Widely used risk measures are Value at Risk
and Expected Shortfall.� These measure risk at a one day horizon (or
10 day which is calculated from 1 day)� However, many positions are held much
longer than this and many securities have long horizons.
� There is a risk that the risk will change!!
INVESTING IN A LOW RISK ENVIRONMENT
� Many investors took low borrowing rates and low volatilities as opportunities to increase leverage without much risk.
� Structured products such as CDOs were very low risk unless volatility or correlations rose.
� Insurance purchased on these positions made the risks even lower as long as the insurer had adequate capital.
� Credit spreads were low because volatility was low.
WHAT HAPPENED?
� Volatilities and correlations rose and all these low risk positions became high risk and impossible to sell without deep discounts.
� Insurance became worthless as insurers were undercapitalized.
� Options market and many forecasters including myself believed volatility would rise.
� Risk measurement does not have a good way to incorporate this information.
HOW TO MEASURE TERM STRUCTURE OF RISK?
� Calculate VaR and ES for long horizons with return processes that allow changing risk.
� Use economic information to improve these estimates
� Continue to use Scenario and Stress Testing
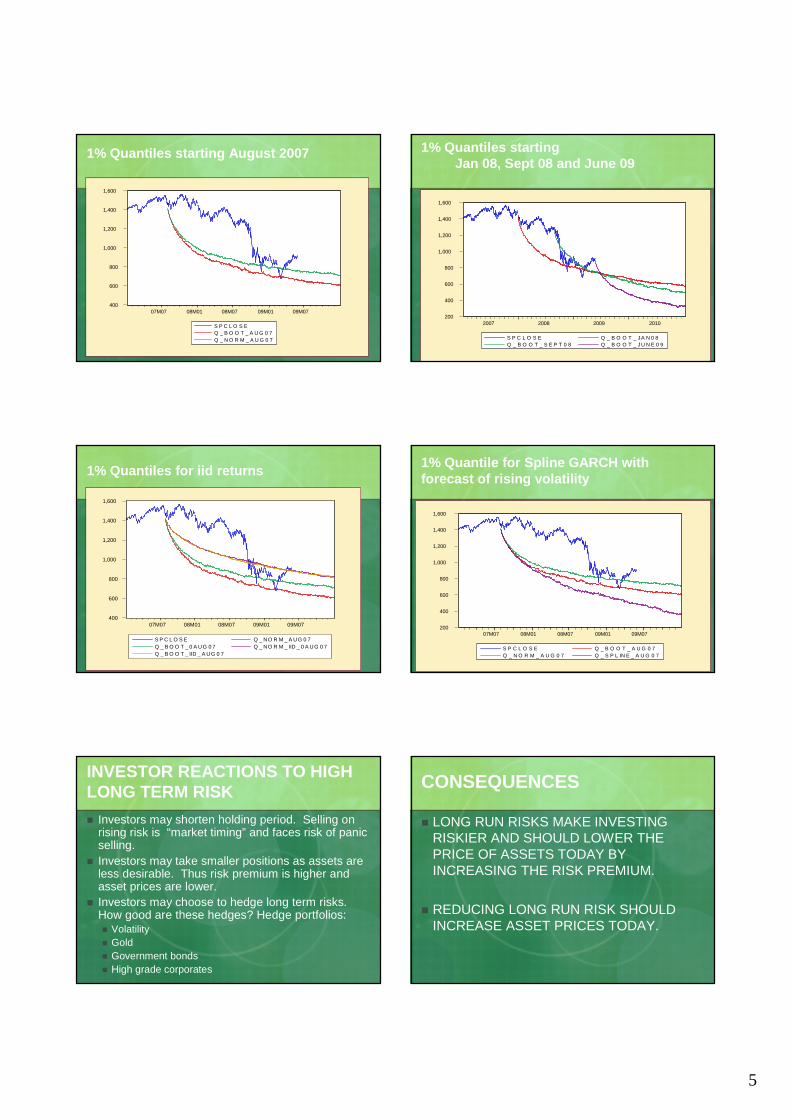
SIMULATED 1% QUANTILES FROM TARCH
� Using S&P500 data through 2007, estimate a model.
� Simulate from the model 10,000 times and calculate the 1% quantile.
� Assume either normal shocks or bootstrap from historical shocks.
5
400
600
800
1,000
1,200
1,400
1,600
07M07 08M01 08M07 09M01 09M07
S P C L O S EQ _ B O O T _ A U G 0 7Q _ N O R M _ A U G 0 7
1% Quantiles starting August 2007
200
400
600
800
1,000
1,200
1,400
1,600
2007 2008 2009 2010
S P C L O S E Q _ B O O T _ JA N 0 8Q _ B O O T _ S E P T 0 8 Q _ B O O T _ JU N E 0 9
1% Quantiles startingJan 08, Sept 08 and June 09
1% Quantiles for iid returns
400
600
800
1,000
1,200
1,400
1,600
07M07 08M01 08M07 09M01 09M07
S P C L O S E Q _ NO R M _ A UG 0 7Q _ B O O T _ 0 A UG 0 7 Q _ NO R M _ IID _ 0 A UG 0 7Q _ B O O T _ IID _ A UG 0 7
1% Quantile for Spline GARCH with forecast of rising volatility
200
400
600
800
1,000
1,200
1,400
1,600
07M07 08M01 08M07 09M01 09M07
S P C L O S E Q _ B O O T _ A U G 0 7Q _ N O R M _ A U G 0 7 Q _ S P L IN E _ A U G 0 7
INVESTOR REACTIONS TO HIGH LONG TERM RISK
� Investors may shorten holding period. Selling on rising risk is “market timing” and faces risk of panic selling.
� Investors may take smaller positions as assets are less desirable. Thus risk premium is higher and asset prices are lower.
� Investors may choose to hedge long term risks. How good are these hedges? Hedge portfolios: � Volatility� Gold� Government bonds� High grade corporates
CONSEQUENCES
� LONG RUN RISKS MAKE INVESTING RISKIER AND SHOULD LOWER THE PRICE OF ASSETS TODAY BY INCREASING THE RISK PREMIUM.
� REDUCING LONG RUN RISK SHOULD INCREASE ASSET PRICES TODAY.

6
HOW TO CORRECT INCENTIVES?
TWO KINDS OF RISK
� INDIVIDUAL RISK
� SYSTEMIC RISK
REGULATION
� Regulate to reduce systemic risk, not all risk
� Tax on biggest, most systemically risky firms – not just financials
� Tax rate is countercyclical – higher when economy is doing well
� Coordinate globally
� Establish legal resolution authority to wind down complex financial institutions in bankruptcy.
� Reduce role of ratings agencies in capital requirements.
IT IS TIME
� It is now time to put new regulatory structures in place.
� It is time to coordinate this process globally.� As the finance sector recovers, there is a
temptation to return to business as usual.� We cannot forsee the next crisis so we need
robust institutions and appropriate incentives.
LONG RUN RISKS
FUTURE FINANCIAL INSTABILITY
� Reducing this risk will improve financial markets now.
� This is the G-20 agenda and finance ministers globally.
� This risk is being hedged by investors with big appetites for US Treasuries, gold, and maybe volatility products
� We also see substantial cash on the sidelines, trying to time the market.

7
THE RISK OF WAR AND TERRORISM
� Deteriorating Global Economy� Increasing income differential between rich
and poor countries� Rising fundamentalism� Rising social unrest� Competition for resources
� Increase the risk of War and Terrorism
DEPRESSED ASSET PRICES
� Rising Long run risks lower asset prices as investors are more cautious.
� This raises the cost of doing business and raising capital
� This reduces income of entrepreneurs� And costs jobs
WHAT TO DO?
�PROMOTE PEACE AND STABILITY
�PEACE PERMITS PROSPERITY
BENEFITS
� Reducing future risk of war/terrorism� Yields benefits today by� Improving business and stock market
valuations and� Creating jobs
GLOBAL OVERHEATING
WHAT ARE THE RISKS?
� Scientific evidence seems clear that the climate is changing.� CO2 concentrations are rising rapidly
� Glaciers and polar ice are melting
� Warmest years on record are almost all within 10 years.
� But what are the costs? Scientific evidence is not precise.

8
ECONOMIC COSTS
� THE GLOBAL ECONOMY WILL BE UNABLE TO PRODUCE AS MUCH IN THE FUTURE AS IT WOULD WITHOUT CLIMATE CHANGE
� TAXES WILL BE RAISED TO PAY FOR PUBLIC EFFORTS TO MITIGATE THESE COSTS
� COMPANIES WILL HAVE EXTRA COSTS OF DOING BUSINESS SO PROFITS WILL BE LOWER.
FINANCIAL MARKET EVALUATION OF CLIMATE RISK. IS CLIMATE RISK PRICED?
� Can we see evidence of climate risk in financial markets?
� We would expect that stock prices would be depressed by climate risk.
� This should be especially true of businesses that will suffer from climate change.
� We expect high prices for assets that will benefit from climate change as these are the hedge portfolios.
A SOLUTIONHigh Oil Prices are a Good Thing!� These encouraged consumers and industry
to use less oil� Driving in the US was down
� Hybrid Cars were selling and SUV’s were not
� House prices in the suburbs were declining more than in the central city
� Ridership on public transportation was up
� Today these effects may be reversed.
A SOLUTION
� Most Economists believe the best solution to global overheating is a comprehensive tax on carbon emissions and other greenhouse gases. � Only if it is comprehensive will it encourage
alternative energy solutions
� Only if it is comprehensive will efforts to avoid the tax be socially beneficial.
� In a time of big deficits, such a tax might be politically acceptable.
Cap and Trade
� This is the Obama choice� Kyoto agreement and probably Copenhagen
outcome� Covers only a subset of emissions� Raises consumer prices only if certificates
are scarce.� Raises revenue only if certificates are sold,
not given away.� Likely to be expensive and ineffective.

9
CONCLUSION
� Make sure you take only the risks you intend to take including long term risks.
� Regulators should reduce incentives to take systemic risks.
� Policy makers must know that reducing long term risks gives benefits today.