archean, highly unradiogenic lead in shallow cratonic mantle · 2020-03-27 · this includes:...
TRANSCRIPT

Archean, highly unradiogenic lead in shallow cratonic mantle
Jun-Bo Zhanga,b, Yong-Sheng Liua,*, Mihai N. Duceac,d, Rong Xua
a State Key Laboratory of Geological Processes and Mineral Resources, School of Earth Sciences, China University
of Geosciences, Wuhan 430074, China
b Institute of Geophysics and Geomatics, China University of Geosciences, Wuhan 430074, China,
c Department of Geosciences, University of Arizona, Tucson, AZ 85721, USA
d Faculty of Geology and Geophysics, University of Bucharest, 010041 Bucharest, Romania
*Corresponding author. State Key Laboratory of Geological Processes and Mineral Resources, China University of
Geosciences, Wuhan 430074, China. Tel: 86-27-67883003; Fax: 86-27-67885096.
Email address: [email protected] (Y.-S. Liu)
Supplementary Online Materials
This PDF file includes:
Analytic methods Figures DR1 to DR2Tables DR1 to DR5
Supporting References
GSA Data Repository 2020172

1. Analytic methods
1.1. Zircon U–Pb dating
Zircon grains were separated using standard density and magnetic separation techniques.
Representative grains were mounted in an epoxy resin disc and polished. Their internal structures
were examined using cathodoluminescence (CL) at the State Key Laboratory of Geological
Processes and Mineral Resources, China University of Geosciences in Wuhan (GPMR-CUG).
U–Pb isotopic analyses were carried out by LA-ICP-MS at GPMR-CUG. Laser sampling was
performed with a spot size of 32 μm using a GeoLas 2005. An Agilent 7500a ICP-MS instrument
was used to acquire ion-signal intensities using Helium as a carrier gas. Argon was used as the
make-up gas and mixed with the carrier gas via a T-connector before entering the ICP. Detailed
operating conditions for the laser ablation system and the ICP-MS instrument and data reduction
are described by Liu et al. (2010). Off-line selection and integration of background and analyte
signals, and time-drift correction and quantitative calibration for trace element contents and U-Pb
dating were performed by ICPMSDataCal (Liu et al., 2010). Zircons from the Jinan gabbro are
euhedral in morphology (up to 150 μm in length) and show clear oscillatory zoning in
cathodoluminescence images (Fig. DR1). The 206Pb/238U ages of twenty-two zircon grains
analyzed by LA-ICP-MS cluster in the range of 124–129 Ma with a weighted mean of 127.3 ± 0.7
Ma (Fig. DR1 and Table DR1), indicating crystallization age of the Jian gabbro.
1.2. In situ analyses of sulfur isotope in sulfide
In situ analyses of sulfur isotope in sulfide were carried out using a 257 nm Yb femtosecond
(fs) laser ablation system (NWR-FemtoUC, USA) coupled to a Neptune Plus multiple collector
inductively coupled plasma mass spectrometer (MC-ICP-MS, Thermo Fisher Scientific, Germany)
at GPMR-CUG. The Neptune Plus is a double-focusing MC-ICP-MS with a movable
multi-collector array of Faraday cups which permitted the simultaneous detection of 32S, 33S and
34S signals collected in the L3, center and H3 Faraday cups, respectively. The detailed
instrumental and data acquisition parameters of the lasers and the MC-ICP-MS are listed in the
previous study (Fu et al., 2017).
The final sulfur isotope ratios (34S/32S) were calculated by correcting for instrumental mass
bias using linear interpolation between the biases calculated from four neighboring standard
analyses. All results are expressed in ‰ using delta notation as follows: δ34SV-CDT (‰) =

(34S/32S)sample/(34S/32S)V-CDT − 1] × 1000, where (34S/32S)sample is the measured 34S/32S of the sample
and (34S/32S)V-CDT is defined as (34S/32S)V-CDT = 0.044163 [V-CDT represents the Vienna Canon
Diablo Troilite (Ding et al., 2001)]. Pyrite PPP-1 reference material (a pyrite single crystal from
the Sukhoi Log deposit, Russia) was used to determine the instrumental mass fractionation (IMF)
and the reference mass instrumental law. The sulfur isotopic values [δ34SV-CDT (‰) = 5.301 ±
0.142 (n = 65, 2σ)] of PPP-1 measured here (see Figure below) are agreement with the reference
values [δ34SV-CDT (‰) = 5.30 ± 0.20 (2σ) (Gilbert et al., 2014)].
1.3. Bulk major and trace element analyses
Whole-rock samples were crushed in a corundum jaw crusher (to 60 mesh). Approximately
60 g was powdered in an agate ring mill to less than 200 mesh. The major elements were
determined by using a Rigaku RIX 2100 X-ray fluorescence spectrometer (XRF) at the State Key
Laboratory of Continental Dynamics, Northwest University in Xi'an, China. Analyses of reference
materials and duplicate analyses suggest that the analytical precision and accuracy are better than
5% (Rudnick et al., 2004; Gao et al., 2008).
Trace elements were analyzed with an Agilent 7500a inductively coupled plasma mass
spectrometry (ICP-MS) at the GPMR-CUG. Sample powder (200 mesh, ~50 mg each) was
weighed into a Teflon bomb and moistened with a few drops of Milli-Q ultrapure water. Then, 1.5
ml of HNO3 and 1.5 ml of HF were added to the Teflon bomb, which was sealed in a steel jacket
and heated in an oven at 190 °C for 48 h to completely dissolve the sample. After opening the
bomb and evaporating the solution on a hotplate at ~115 °C to dryness, 1 ml of HNO3 was added
to the Teflon bomb and evaporated to a second round of dryness. The resultant salt was
re-dissolved by adding ~3 ml of 30% HNO3, resealed in a steel jacket and heated in an oven at
190 °C for 12–24 h. The final solution was diluted to ~100 g with a mixture of 2% HNO3 for
ICP-MS analysis. Analyses of international rock standards (AGV-2, BHVO-2 and BCR-2)
4.9
5.1
5.3
5.5
5.7
5.9
Pyrite PPP-1 reference material (n = 65)Ave. value = 5.301 ± 0.142 (this study)Ref. value = 5.30 ± 0.20
δ34 S
V-C
DT
(‰)
indicate that the precision and accuracy are better than 5% for most elements and ~10% for some
transitional elements (Zhang et al., 2017).
1.4. Sr–Nd-Pb isotope analyses
The Sr-Nd-Pb isotope ratios were determined by using a Finnigan Triton thermal ionization
mass spectrometer (TIMS) at the GPMR-CUG. For Rb–Sr and Sm–Nd isotope analyses, sample
powders (200 mesh, ~50 mg each) were digested in Teflon bombs by using mixed agents of
double distilled HNO3 (1 ml) and HF (1 ml) acids at 190 °C for 48 h. After the samples were
completely dissolved, the solutions were dried on a hotplate at 115 °C to remove the HF. The
sample residues were re-dissolved in 1–2 ml of 6 N HCl and then dried down again. Finally, the
samples were dissolved in 1 ml of 2.5 N HCl and then centrifuged to remove any remaining
undissolved material.
The elements Nd and Sr were separated and purified in a clean laboratory by successively
using ion exchange columns of a Dowex AG50WX12 cation resin and Eichrom Ln-Spec resin.
The isotopic ratios of 143Nd/144Nd and 87Sr/86Sr were normalized to 146Nd/144Nd = 0.721900 and
88Sr/86Sr = 8.375209, respectively. Analyses of the reference materials BCR-2 (143Nd/144Nd =
0.512640 ± 3) and NBS-607 (87Sr/86Sr = 1.200 393 ± 10) demonstrate the analytical precision and
accuracy to better than 0.01‰. Measurements of the La Jolla and NBS987 standards provide
average values of 0.511847 ± 3 (n = 25) and 0.710254 ± 8 (n = 22) for the 143Nd/144Nd and
87Sr/86Sr ratios, respectively.
For Pb isotope determination, ~50 mg sample powders were weighed into the Teflon cup and
dissolved in concentrated HNO3 and HF at 190 °C for 48 h. Pb was separated and purified by ion
exchange columns of Dowex AG50WX12 cation resin with diluted HBr as eluant. Pb standard
NBS 981 was used to determine isotopic fractionation, and the measured isotopic ratios of samples
were corrected with a value of 0.11% per atomic mass unit. Ten analyses on NBS 981 during the
course of this study yielded 206Pb/204Pb = 16.9376 ± 0.0015 (2σ), 207Pb/204Pb = 15.4939 ± 0.0014
(2σ), and 208Pb/204Pb = 36.7219 ± 0.0033 (2σ).

List of geochemical datasets showed in Figure 4C–D
Carbonate (Bolhar et al., 2015)
Shale (Pollack et al., 2009)
Banded iron Formation(Frei and Polat, 2007; Frei et al., 2008; Døssing et al., 2009)
Marble Bar Chert (Li et al., 2013)
Sulfide in sedimentary rock (Døssing et al., 2009)
Modern global subducting sediments (GLOSS) (Plank and Langmuir, 1998)
OIB from GEOROC (http://georoc.mpch-mainz.gwdg.de/georoc)
Uranium contents of black shales (Partin et al., 2013; Wille et al., 2013)
Earth’s atmospheric oxygen content (Campbell and Allen, 2008)

50 mm0.0186
0.0190
0.0194
0.0198
0.0202
0.0206
0.0210
0.11 0.12 0.13 0.14 0.15 0.16 0.17
120
132
207 235Pb/ U2
06
23
8P
b/
U
206 238Weighted mean Pb/ U127.3 ± 0.7 Ma (n = 22)
MSWD = 1.3
Jinan
Figure DR1. Concordia plots for LA-ICP-MS zircon geochronology of Jinan gabbro (MJN0606). Insets show CL images of representative grains analysed.
A B
C D
10μm 10μm
olivine plagioclase
500μm500μm
E F
chalcopyrite
pyrite
silicate melt
pyrite pyrite
50μm50μm
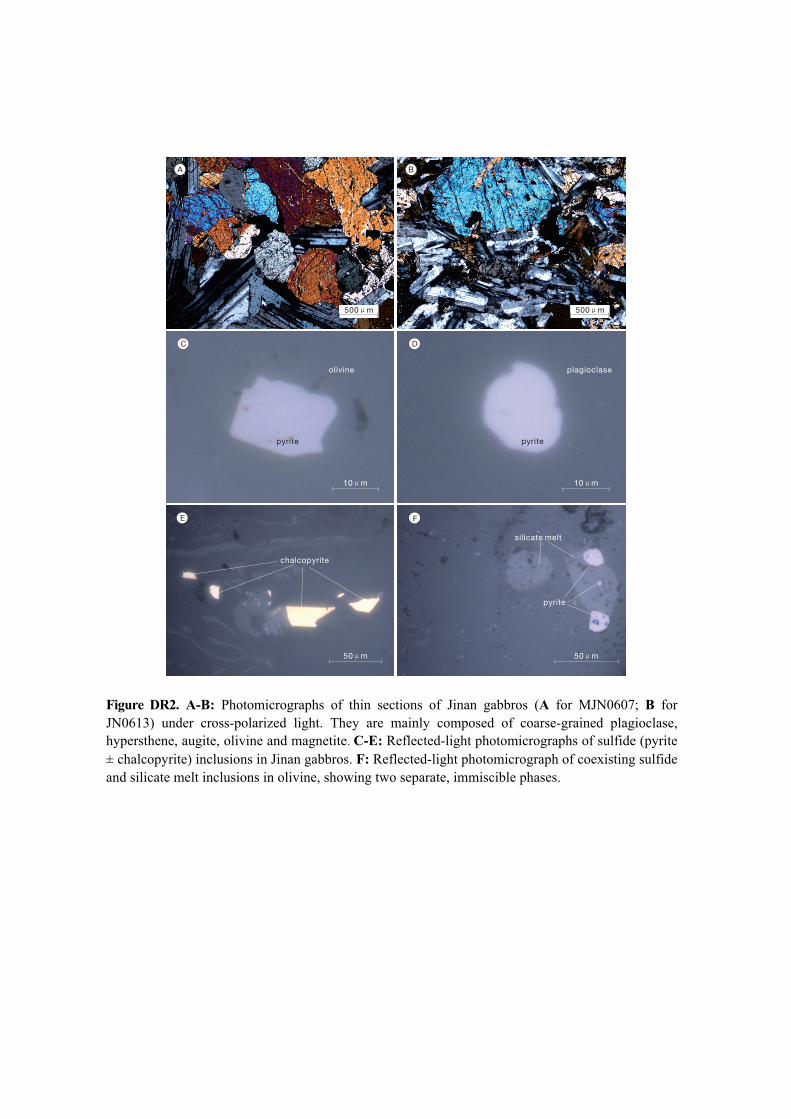
Figure DR2. A-B: Photomicrographs of thin sections of Jinan gabbros (A for MJN0607; B for JN0613) under cross-polarized light. They are mainly composed of coarse-grained plagioclase, hypersthene, augite, olivine and magnetite. C-E: Reflected-light photomicrographs of sulfide (pyrite ± chalcopyrite) inclusions in Jinan gabbros. F: Reflected-light photomicrograph of coexisting sulfide and silicate melt inclusions in olivine, showing two separate, immiscible phases.

Table DR1. U–Pb ages of zircons for the Early Cretaceous Jinan gabbros.
Analysis
number
Th
(ppm)
U
(ppm) Th/U
Isotopic ratio Apparent age (Ma) Concordance
207Pb/206Pb±σ 206Pb/238U±σ 207Pb/235U±σ 208Pb/232Th±σ 206Pb/238U±σ
MJN0606
JUL06E07 193 213 0.91 0.04964 0.00154 0.01946 0.00021 0.1332 0.00402 0.00593 0.00008 124.2 1.35 0.99
JUL06E06 272 384 0.71 0.04949 0.00146 0.01953 0.00022 0.1333 0.00383 0.00599 0.00009 124.7 1.36 0.99
JUL06E08 202 250 0.81 0.04915 0.00161 0.01956 0.00022 0.13258 0.00424 0.00642 0.0001 124.9 1.41 0.99
JUL06E13 89 124 0.72 0.04984 0.0024 0.01965 0.00026 0.13507 0.00639 0.00605 0.00013 125.5 1.61 0.99
JUL06E22 229 223 1.03 0.04931 0.00152 0.01967 0.00022 0.13374 0.00403 0.00641 0.00008 125.6 1.37 0.99
JUL06E15 303 300 1.01 0.04832 0.00131 0.01971 0.00021 0.13134 0.00346 0.00608 0.00007 125.8 1.32 1.00
JUL06E21 73 111 0.66 0.05081 0.00365 0.01972 0.00035 0.13816 0.00971 0.00612 0.00021 125.9 2.19 0.98
JUL06E30 499 472 1.06 0.04826 0.0011 0.01986 0.00021 0.1322 0.00293 0.00622 0.00007 126.8 1.3 1.00
JUL06E10 644 628 1.03 0.04935 0.00117 0.01992 0.00021 0.13561 0.00313 0.00627 0.00007 127.2 1.31 0.99
JUL06E17 383 478 0.80 0.04905 0.00105 0.01992 0.0002 0.13476 0.00279 0.00624 0.00007 127.2 1.28 1.00
JUL06E25 342 466 0.73 0.04831 0.00109 0.01996 0.0002 0.13299 0.00292 0.00628 0.00008 127.4 1.29 1.00
JUL06E28 241 261 0.92 0.04875 0.00138 0.01997 0.00022 0.13423 0.00371 0.0063 0.00008 127.4 1.37 1.00
JUL06E34 321 456 0.70 0.04777 0.00106 0.02 0.00021 0.13174 0.00284 0.00655 0.00008 127.7 1.3 1.01
JUL06E24 323 464 0.70 0.04738 0.00113 0.02008 0.00021 0.13121 0.00306 0.00631 0.00008 128.2 1.32 1.01
JUL06E33 278 295 0.94 0.05000 0.0013 0.02009 0.00021 0.13848 0.0035 0.00628 0.00008 128.2 1.36 0.99
JUL06E31 541 558 0.97 0.04852 0.00098 0.0201 0.0002 0.13448 0.00262 0.00626 0.00007 128.3 1.29 1.00
JUL06E16 191 213 0.90 0.05034 0.00166 0.02013 0.00023 0.13976 0.00451 0.00593 0.00009 128.5 1.45 0.98
JUL06E14 303 301 1.01 0.04777 0.0013 0.02018 0.00021 0.13299 0.00353 0.00615 0.00008 128.8 1.36 1.01
JUL06E29 674 626 1.08 0.04759 0.00095 0.0202 0.0002 0.13256 0.00257 0.00636 0.00007 128.9 1.29 1.01
JUL06E09 910 832 1.09 0.04916 0.00084 0.02021 0.0002 0.13704 0.00225 0.00618 0.00006 129 1.25 0.99
JUL06E32 113 183 0.62 0.04708 0.0019 0.02025 0.00024 0.13145 0.0052 0.00675 0.00012 129.2 1.53 1.02
JUL06E23 1847 1373 1.34 0.04964 0.00079 0.02027 0.0002 0.13879 0.00213 0.00638 0.00006 129.4 1.25 0.99

Table DR2. Geochemical compositions for the Early Cretaceous Jinan gabbros.
Sample MJN0602 MJN0603 MJN0604 MJN0605 MJN0606 MJN0607 MJN0608 MJN0609 MJN0610 MJN0612 MJN0613
Location 36°42.59′N 36°42.60′N 36°42.64′N 36°42.67′N 36°43.61′N
116°57.52′E 116°57.54′E 116°57.51′E 116°57.68′E 117°03.66′E
SiO2 53.47 54.53 53.43 53.56 51.78 48.48 48.45 49.51 55.08 56.35 53.05
TiO2 0.65 0.77 0.74 0.86 0.69 0.61 0.61 0.49 0.69 0.71 0.60
Al2O3 13.09 14.15 13.55 14.26 13.81 11.24 11.23 14.56 15.07 15.57 14.68
TFe2O3 9.69 9.32 9.74 9.14 9.93 12.46 12.90 10.70 8.35 8.12 9.38
MnO 0.16 0.15 0.15 0.13 0.16 0.19 0.19 0.16 0.12 0.13 0.14
MgO 9.57 7.79 9.07 7.65 8.58 13.71 13.33 11.02 7.40 6.68 8.68
CaO 8.97 8.08 8.79 9.28 9.00 11.16 10.82 11.03 7.22 7.28 8.89
Na2O 2.57 2.81 2.63 2.73 2.71 1.48 1.90 1.98 3.38 3.55 2.87
K2O 1.04 1.78 1.28 1.38 0.83 0.23 0.36 0.30 1.67 1.48 1.24
P2O5 0.13 0.17 0.20 0.38 0.17 0.32 0.08 0.12 0.24 0.24 0.18
LOI 0.20 0.28 0.03 0.26 -0.06 -0.32 -0.26 -0.08 0.41 0.03 -0.70
TOTAL 99.54 99.83 99.61 99.63 97.60 99.56 99.61 99.79 99.63 100.14 99.01
Mg# 66.17 62.35 64.85 62.38 63.12 68.55 67.18 67.11 63.71 61.97 64.70
V 184 210 313 233 251 259 282 275 184 193 255.29
Cr 702 466 835 376 646 698 608 756 504 380 616
Ni 132 90.1 161 105 136 151 149 186 165 125 149
Rb 26.7 38.9 40.1 33.4 23.1 3.48 6.18 5.66 34.8 34.8 35.5
Sr 404 445 605 483 619 407 436 765 614 604 720
Y 17.8 19.5 25.7 23.1 22.4 12.2 11.2 12.6 17.5 17.6 21.9
Zr 55.6 64.7 99.3 78.9 69.9 15.9 23.1 21.6 80.8 86.0 88.5
Nb 4.21 4.66 6.13 5.40 4.37 0.60 1.00 0.88 5.09 5.20 4.77
Ba 484 842 866 598 630 173 222 313 812 769 757
La 13.2 16.4 20.2 19.9 18.1 6.06 4.99 6.49 19.0 20.1 17.9
Ce 29.3 34.9 47.2 46.5 40.6 15.2 12.4 15.1 40.7 42.6 40.6
Pr 3.67 4.33 5.46 5.54 4.98 2.13 1.75 2.05 4.75 4.94 4.98
Nd 16.4 19.1 24.6 24.0 21.7 10.4 8.35 9.98 20.0 21.0 21.2
Sm 3.81 4.00 5.29 5.12 4.90 2.65 2.29 2.54 4.04 4.15 4.68
Eu 1.12 1.28 1.59 1.38 1.59 0.84 0.80 1.11 1.25 1.25 1.48
Gd 3.01 3.42 4.52 4.35 4.11 2.32 2.00 2.33 3.23 3.36 3.87
Tb 0.49 0.55 0.70 0.65 0.64 0.36 0.33 0.36 0.48 0.49 0.58
Dy 3.13 3.36 4.34 3.99 4.07 2.21 2.02 2.31 2.98 3.03 3.61
Ho 0.64 0.67 0.88 0.78 0.81 0.44 0.40 0.46 0.60 0.61 0.72
Er 1.67 1.78 2.34 1.95 2.00 1.10 0.98 1.18 1.54 1.54 1.87
Tm 0.23 0.25 0.31 0.26 0.28 0.14 0.13 0.16 0.22 0.22 0.26
Yb 1.64 1.77 2.33 1.86 2.09 1.03 0.95 1.14 1.57 1.56 1.84
Lu 0.22 0.26 0.31 0.24 0.28 0.13 0.13 0.15 0.21 0.22 0.26
Hf 1.54 1.68 2.42 2.06 1.83 0.49 0.68 0.65 1.84 2.03 2.10
Ta 0.23 0.23 0.31 0.28 0.25 0.057 0.073 0.082 0.25 0.28 0.27
Pb 6.25 7.93 9.97 7.96 9.12 1.67 2.15 3.15 5.02 7.24 8.06
Th 1.72 2.35 2.26 2.55 1.89 0.26 0.38 0.33 1.89 2.04 2.05
U 0.51 0.63 0.65 0.73 0.53 0.08 0.12 0.12 0.51 0.57 0.65
Eu/Eu* 1.01 1.05 0.99 0.89 1.08 1.03 1.14 1.39 1.06 1.02 1.05
Fe/Mn 52.63 56.38 57.07 59.83 54.36 58.33 58.31 59.44 57.59 57.97 57.36
Y/Yb 10.85 11.02 11.03 12.42 10.72 11.84 11.79 11.05 11.15 11.28 11.90
Gd/Lu 13.68 13.15 14.58 18.13 14.68 17.85 15.38 15.53 15.38 15.27 14.88
Ba/Rb 18.1 21.6 21.6 17.9 27.3 49.7 35.9 55.3 23.3 22.1 21.3
Ba/Th 281 358 383 235 333 665 584 948 430 377 369
Th/U 3.37 3.73 3.48 3.49 3.57 3.25 3.17 2.75 3.71 3.58 3.15

Table DR3. Sulfur isotopic composition of sulfides in the Jinan gabbros.
Sample name Mineral δ34SV-CDT (‰) ±2σ
17JN10-1 pyrite 24.92 0.11
17JN10-2 pyrite 23.87 0.22
17JN10-6 pyrite 25.31 0.31
17JN10-14 pyrite 23.96 0.16
17JN10-19 pyrite 25.34 0.19
TDM
2.31
1.98
2.01
2.06
2.30
2.99
3.84
3.00
2.28
2.25
2.20
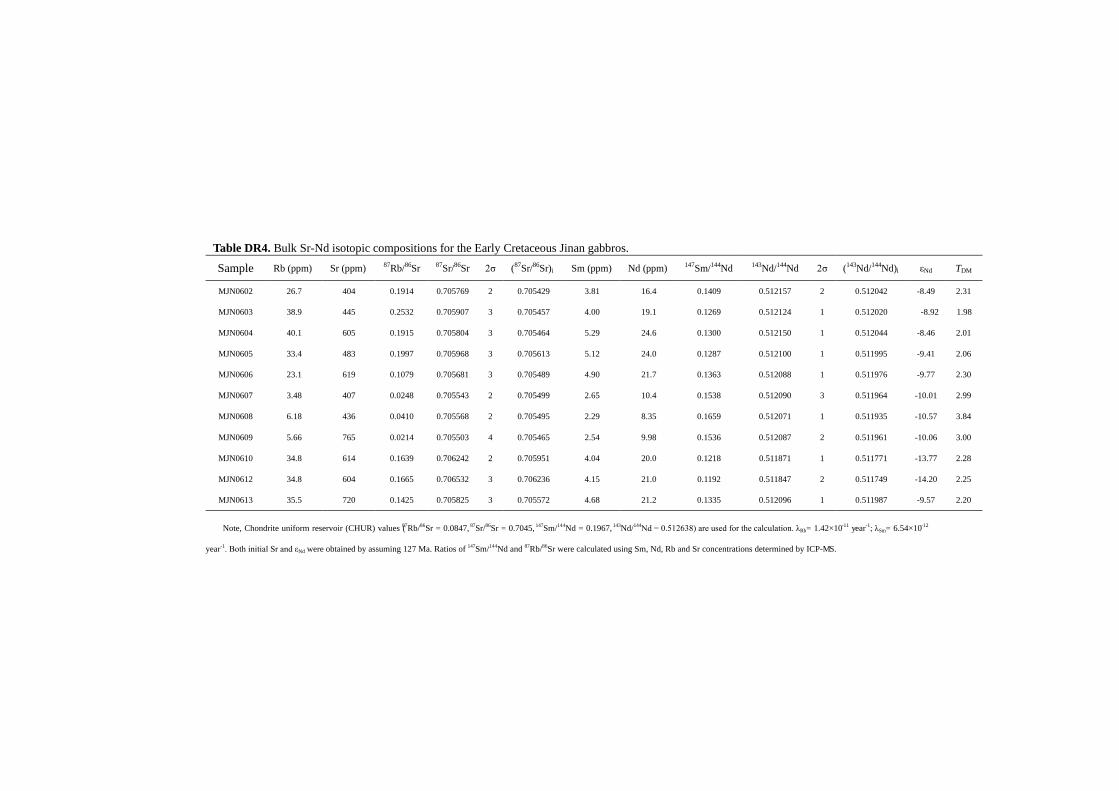
Table DR4. Bulk Sr-Nd isotopic compositions for the Early Cretaceous Jinan gabbros. εNd
-8.49
-8.92
-8.46
-9.41
-9.77
-10.01
-10.57
-10.06
-13.77
-14.20
-9.57
Note, Chondrite uniform reservoir (CHUR) values (87Rb/86Sr = 0.0847, 87Sr/86Sr = 0.7045, 147Sm/144Nd = 0.1967, 143Nd/144Nd = 0.512638) are used for the calculation. λRb= 1.42×10⁻¹¹ year-1; λSm= 6.54×10⁻¹²
year-1. Both initial Sr and εNd were obtained by assuming 127 Ma. Ratios of 147Sm/144Nd and 87Rb/86Sr were calculated using Sm, Nd, Rb and Sr concentrations determined by ICP-MS.
(143Nd/144Nd)i
0.512042
0.512020
0.512044
0.511995
0.511976
0.511964
0.511935
0.511961
0.511771
0.511749
0.511987
2σ
2
1
1
1
1
3
1
2
1
2
1
143Nd/144Nd
0.512157
0.512124
0.512150
0.512100
0.512088
0.512090
0.512071
0.512087
0.511871
0.511847
0.512096
147Sm/144Nd
0.1409
0.1269
0.1300
0.1287
0.1363
0.1538
0.1659
0.1536
0.1218
0.1192
0.1335
Nd (ppm)
16.4
19.1
24.6
24.0
21.7
10.4
8.35
9.98
20.0
21.0
21.2
Sm (ppm)
3.81
4.00
5.29
5.12
4.90
2.65
2.29
2.54
4.04
4.15
4.68
(87Sr/86Sr)i
0.705429
0.705457
0.705464
0.705613
0.705489
0.705499
0.705495
0.705465
0.705951
0.706236
0.705572
2σ
2
3
3
3
3
2
2
4
2
3
3
87Sr/86Sr
0.705769
0.705907
0.705804
0.705968
0.705681
0.705543
0.705568
0.705503
0.706242
0.706532
0.705825
87Rb/86Sr
0.1914
0.2532
0.1915
0.1997
0.1079
0.0248
0.0410
0.0214
0.1639
0.1665
0.1425
Sr (ppm)
404
445
605
483
619
407
436
765
614
604
720
Rb (ppm)
26.7
38.9
40.1
33.4
23.1
3.48
6.18
5.66
34.8
34.8
35.5
Sample
MJN0602
MJN0603
MJN0604
MJN0605
MJN0606
MJN0607
MJN0608
MJN0609
MJN0610
MJN0612
MJN0613
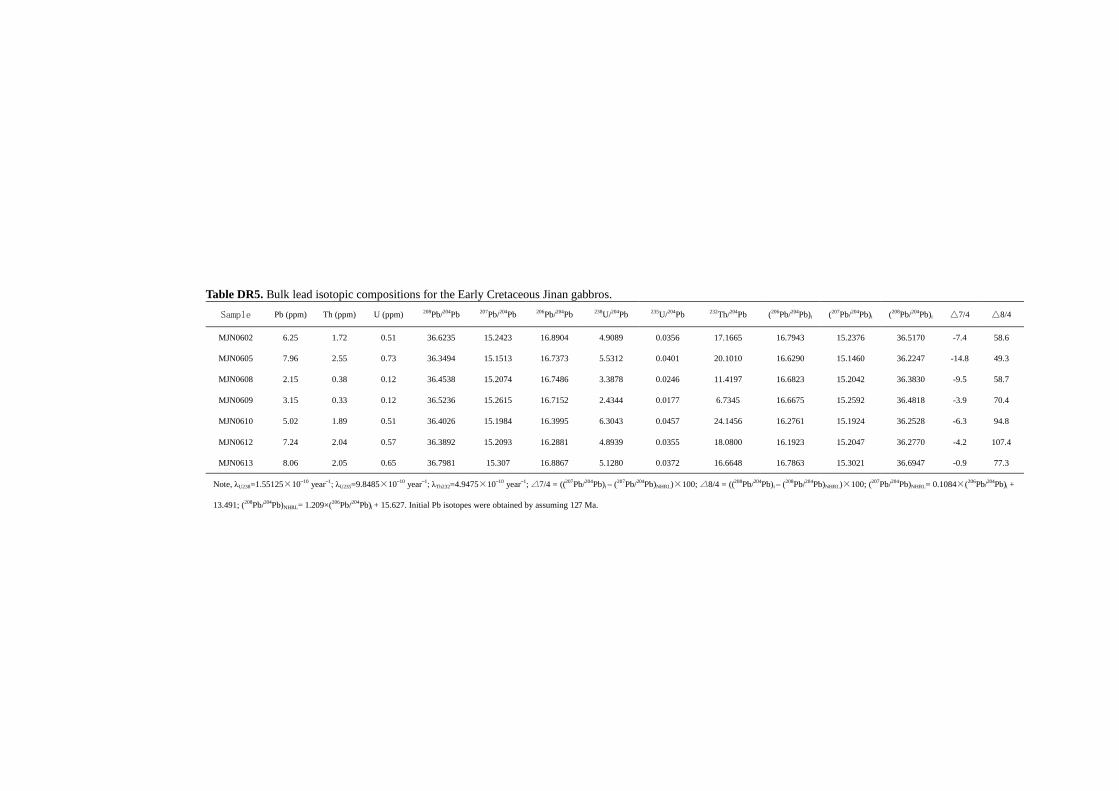
Table DR5. Bulk lead isotopic compositions for the Early Cretaceous Jinan gabbros. △8/4
58.6
49.3
58.7
70.4
94.8
107.4
77.3
Note, λU238=1.55125×10⁻¹⁰ year–1; λU235=9.8485×10⁻¹⁰ year–1; λTh232=4.9475×10⁻¹⁰ year–1; △7/4 = ((207Pb/204Pb)i – (207Pb/204Pb)NHRL)×100; △8/4 = ((208Pb/204Pb)i – (208Pb/204Pb)NHRL)×100; (207Pb/204Pb)NHRL= 0.1084×(206Pb/204Pb)i +
13.491; (208Pb/204Pb)NHRL= 1.209×(206Pb/204Pb)i + 15.627. Initial Pb isotopes were obtained by assuming 127 Ma.
△7/4
-7.4
-14.8
-9.5
-3.9
-6.3
-4.2
-0.9
(208Pb/204Pb)i
36.5170
36.2247
36.3830
36.4818
36.2528
36.2770
36.6947
(207Pb/204Pb)i
15.2376
15.1460
15.2042
15.2592
15.1924
15.2047
15.3021
(206Pb/204Pb)i
16.7943
16.6290
16.6823
16.6675
16.2761
16.1923
16.7863
232Th/204Pb
17.1665
20.1010
11.4197
6.7345
24.1456
18.0800
16.6648
235U/204Pb
0.0356
0.0401
0.0246
0.0177
0.0457
0.0355
0.0372
238U/204Pb
4.9089
5.5312
3.3878
2.4344
6.3043
4.8939
5.1280
206Pb/204Pb
16.8904
16.7373
16.7486
16.7152
16.3995
16.2881
16.8867
207Pb/204Pb
15.2423
15.1513
15.2074
15.2615
15.1984
15.2093
15.307
208Pb/204Pb
36.6235
36.3494
36.4538
36.5236
36.4026
36.3892
36.7981
U (ppm)
0.51
0.73
0.12
0.12
0.51
0.57
0.65
Th (ppm)
1.72
2.55
0.38
0.33
1.89
2.04
2.05
Pb (ppm)
6.25
7.96
2.15
3.15
5.02
7.24
8.06
Sample
MJN0602
MJN0605
MJN0608
MJN0609
MJN0610
MJN0612
MJN0613

SUPPORTING REFERENCES CITED
Bolhar, R., Hofmann, A., Siahi, M., Feng, Y.-x., and Delvigne, C., 2015, A trace element and Pb isotopic
investigation into the provenance and deposition of stromatolitic carbonates, ironstones and associated shales
of the ∼3.0Ga Pongola Supergroup, Kaapvaal Craton: Geochimica et Cosmochimica Acta, v. 158, p. 57-78,
doi: 10.1016/j.gca.2015.02.026.
Campbell, I.H., and Allen, C.M., 2008, Formation of supercontinents linked to increases in atmospheric oxygen:
Nature Geoscience, v. 1, p. 554-558, doi: 10.1038/ngeo259.
Døssing, L.N., Frei, R., Stendal, H., and Mapeo, R.B.M., 2009, Characterization of enriched lithospheric mantle
components in ∼2.7Ga Banded Iron Formations: An example from the Tati Greenstone Belt, Northeastern
Botswana: Precambrian Research, v. 172, p. 334-356, doi: 10.1016/j.precamres.2009.06.004.
Ding, T.P., Valkiers, S., Kipphardt, H., De Bièvre, P., Taylor, P.D.P., Gonfiantini, R., and Krouse, R., 2001,
Calibrated sulfur isotope abundance ratios of three IAEA sulfur isotope reference materials and V-CDT with a
reassessment of the atomic weight of sulfur: Geochimica et Cosmochimica Acta, v. 65, p. 2433-2437, doi:
10.1016/S0016-7037(01)00611-1.
Frei, R., Dahl, P.S., Duke, E.F., Frei, K.M., Hansen, T.R., Frandsson, M.M., and Jensen, L.A., 2008, Trace element
and isotopic characterization of Neoarchean and Paleoproterozoic iron formations in the Black Hills (South
Dakota, USA): Assessment of chemical change during 2.9–1.9Ga deposition bracketing the 2.4–2.2Ga first
rise of atmospheric oxygen: Precambrian Research, v. 162, p. 441-474, doi: 10.1016/j.precamres.2007.10.005.
Frei, R., and Polat, A., 2007, Source heterogeneity for the major components of 3.7 Ga Banded Iron Formations
(Isua Greenstone Belt, Western Greenland): Tracing the nature of interacting water masses in BIF formation:
Earth and Planetary Science Letters, v. 253, p. 266-281, doi: 10.1016/j.epsl.2006.10.033.
Fu, J.L., Hu, Z.C., Li, J.W., Yang, L., Zhang, W., Liu, Y.S., Li, Q.L., Zong, K.Q., and Hu, S.H., 2017, Accurate
determination of sulfur isotopes (δ33S and δ34S) in sulfides and elemental sulfur by femtosecond laser ablation
MC-ICP-MS with non-matrix matched calibration: Journal of Analytical Atomic Spectrometry, v. 32, p.
2341-2351, doi: 10.1039/C7JA00282C.
Gao, S., Rudnick, R., Xu, W.L., Yuan, H.L., Liu, Y.S., Walker, R.J., Puchtel, I.S., Liu, X.M., Huang, H., Wang,
X.R., and Yang, J., 2008, Recycling deep cratonic lithosphere and generation of intraplate magmatism in the
North China Craton: Earth and Planetary Science Letters, v. 270, p. 41-53, doi: 10.1016/j.epsl.2008.03.008.
Gilbert, S.E., Danyushevsky, L.V., Rodemann, T., Shimizu, N., Gurenko, A., Meffre, S., Thomas, H., Large, R.R.,

and Death, D., 2014, Optimisation of laser parameters for the analysis of sulphur isotopes in sulphide minerals
by laser ablation ICP-MS: Journal of Analytical Atomic Spectrometry v. 29, p. 1042-1051, doi:
10.1039/c4ja00011k.
Li, W.Q., Czaja, A.D., Van Kranendonk, M.J., Beard, B.L., Roden, E.E., and Johnson, C.M., 2013, An anoxic,
Fe(II)-rich, U-poor ocean 3.46 billion years ago: Geochimica et Cosmochimica Acta, v. 120, p. 65-79, doi:
10.1016/j.gca.2013.06.033.
Liu, Y.S., Gao, S., Hu, Z.C., Gao, C.G., Zong, K.Q., and Wang, D.B., 2010, Continental and oceanic crust
recycling-induced melt-peridotite interactions in the Trans-North China Orogen: U-Pb dating, Hf Isotopes and
trace elements in zircons from mantle xenoliths: Journal of Petrology, v. 51, p. 537-571, doi:
10.1093/petrology/egp082.
Partin, C.A., Bekker, A., Planavsky, N.J., Scott, C.T., Gill, B.C., Li, C., Podkovyrov, V., Maslov, A., Konhauser,
K.O., Lalonde, S.V., Love, G.D., Poulton, S.W., and Lyons, T.W., 2013, Large-scale fluctuations in
Precambrian atmospheric and oceanic oxygen levels from the record of U in shales: Earth and Planetary
Science Letters, v. 369–370, p. 284-293, doi: 10.1016/j.epsl.2013.03.031.
Plank, T., and Langmuir, C.H., 1998, The chemical composition of subducting sediment and its consequences for
the crust and mantle: Chemical Geology, v. 145, p. 325-394, doi: 10.1016/S0009-2541(97)00150-2.
Pollack, G.D., Krogstad, E.J., and Bekker, A., 2009, U–Th–Pb–REE systematics of organic-rich shales from the ca.
2.15 Ga Sengoma Argillite Formation, Botswana: Evidence for oxidative continental weathering during the
Great Oxidation Event: Chemical Geology, v. 260, p. 172-185, doi: 10.1016/j.chemgeo.2008.10.038.
Rudnick, R.L., Gao, S., Ling, W.L., Liu, Y.S., and McDonough, W.F., 2004, Petrology and geochemistry of spinel
peridotite xenoliths from Hannuoba and Qixia, North China craton: Lithos, v. 77, p. 609-637, doi:
10.1016/j.lithos.2004.03.033.
Wille, M., Nebel, O., Van Kranendonk, M.J., Schoenberg, R., Kleinhanns, I.C., and Ellwood, M.J., 2013, Mo–Cr
isotope evidence for a reducing Archean atmosphere in 3.46–2.76Ga black shales from the Pilbara, Western
Australia: Chemical Geology, v. 340, p. 68-76, doi: 10.1016/j.chemgeo.2012.12.018.
Zhang, J.B., Liu, Y.S., Ling, W.L., and Gao, S., 2017, Pressure-dependent compatibility of iron in garnet: Insights
into the origin of ferropicritic melt: Geochimica et Cosmochimica Acta, v. 197, p. 356-377, doi:
10.1016/j.gca.2016.10.047.