architecture for biodiversity image retrieval...
TRANSCRIPT

ARCHITECTURE FOR BIODIVERSITY IMAGE
RETRIEVAL USING ONTOLOGY AND
CONTENT BASED IMAGE RETRIEVAL (CBIR)
ARPAH BINTI ABU
THESIS SUBMITTED IN FULFILMENT OF THE
REQUIREMENTS FOR THE DEGREE OF
DOCTOR OF PHILOSOPHY
INSTITUTE OF BIOLOGICAL SCIENCES
FACULTY OF SCIENCE
UNIVERSITY OF MALAYA
KUALA LUMPUR
2013

ii
ABSTRACT
This research looks into how ontology can be used to pre-classify training set images to
improve the efficiency of Content-Based Image Retrieval (CBIR) for Biodiversity. The
set of images used for image retrieval are the Malaysian monogeneans belonging to the
order Dactylogyridae Bychowsky, 1937. Monogeneans are parasitic Platyhelminths and
are distinguished based on both soft reproductive anatomical features as well as shapes
and sizes of sclerotised hard parts (haptoral bar, anchor, marginal hook, and male and
female copulatory organ). The diagnostic features of monogeneans especially their
sclerotised hard parts are given as illustrations in the literatures. In this study, two
models of image retrieval were built; one that does not use image pre-classification,
while the other uses image pre-classification. A model without image pre-classification,
named Model 1, runs using typical CBIR approach, whereby all the images in the image
database are used as training set images. The second model, a model with image pre-
classification, named Model 2 runs by integrating the CBIR with ontology, which pre-
classifies the images in the image database for training purposes. In this approach, the
images are annotated with taxonomic classification, diagnostic parts and image
properties using the Taxonomic Data Working Group (TDWG) Life Sciences Identifiers
(LSID) structured vocabulary that is represented in the form of ontology. In this context,
the purpose of the image pre-classification is to classify the images in the training set
based on certain parameters, which in this study focuses on the dorsal and ventral side
of the haptoral bars. As a result, the size of the images in the training set decreases after
the image pre-classification process. In the CBIR approach implemented in both
models, region-based shape information using pixel mean value is used as the descriptor
to represent the shapes of the images. As for image classification, Minimum distance
classifier is used to classify the retrieved images and the relevant images in the retrieved
images are then measured based on the Euclidean distance and visual comparison. For

iii
both the systems, the implementation is tested on 148 haptoral bar images. The
performances of both systems are assessed using R-Precision, Error Rate (ER), Mean
Average Precision (MAP), PR Graph, Receiver Operating Characteristic (ROC) and
Area under ROC Curve (AUC). According to these measurements, Model 2 system
performed better image retrieval. The application of this method shows that the
relevancy rate increases when the size of the training set decreases since all the images
are mostly relevant to the query image. Also, it shows that the size of training set affects
the relevancy rate of the retrieved images whereby the relevancy rate is inversely
proportional to the size of the training set. Besides that, the retrieval results contain the
retrieved images with their annotations, providing more understanding and knowledge
to the user. Finally, in this study a three-tier architecture of Biodiversity image retrieval
is proposed and developed.

iv
ABSTRAK
Kajian ini melihat kepada bagaimana ontologi boleh digunakan untuk mengesahkan
pengkelasan imej set latihan untuk meningkatkan kecekapan Biodiversiti Content-Based
Image Retrieval (CBIR). Satu set imej yang digunakan untuk temubalik imej adalah
monogeneans Malaysia dalam order Dactylogyridae Bychowsky, 1937. Monogeneans
adalah platyhelminths parasit dan dibezakan berdasarkan kedua-dua ciri-ciri anatomi
pembiakan lembut serta bentuk dan saiz bahagian keras sclerotised haptoral bar, sauh,
cangkuk dan organ sanggama jantan dan betina mereka. Ciri-ciri diagnostik
monogeneans terutamanya bahagian keras sclerotised mereka diberikan sebagai ilustrasi
didalam penerbitan. Dalam kajian ini, dua model temubalik telah dibina; salah satu yang
tidak menggunakan imej pra-klasifikasi, manakala yang lain menggunakan imej pra-
klasifikasi. Satu model tanpa imej pra-klasifikasi, dinamakan Model 1 berjalan
menggunakan pendekatan CBIR biasa, di mana semua imej dalam pangkalan data imej
digunakan sebagai imej set latihan. Model kedua, model dengan imej pra-klasifikasi,
dinamakan Model 2 berjalan dengan mengintegrasikan CBIR dengan ontologi yang pra-
mengklasifikasikan imej dalam pangkalan data imej untuk latihan. Dalam pendekatan
ini, semua imej adalah dicatatkan dengan pengelasan taksonomi, bahagian diagnostik
dan sifat imej menggunakan perbendaharaan kata berstruktur Taxonomic Data Working
Group (TDWG) Life Sciences Identifiers (LSID) yang diwakili dalam bentuk ontologi.
Dalam konteks ini, tujuan imej pra-klasifikasi adalah untuk mengelaskan imej dalam
latihan yang ditetapkan berdasarkan parameter tertentu yang mana dalam kajian ini
menekankan kepada dorsal dan ventral haptoral bar. Akibatnya, saiz imej dalam latihan
menurun selepas proses imej pra-klasifikasi. Pendekatan CBIR yang dilaksanakan
didalam kedua-dua model, maklumat berasaskan rantau bentuk menggunakan nilai min
piksel digunakan sebagai pemerihal untuk mewakili bentuk imej; untuk pengelasan
imej, pengelas jarak minimum digunakan untuk mengelaskan imej yang diambil; dan

v
imej-imej yang relevan dalam imej yang dicapai kemudiannya diukur berdasarkan jarak
Euclidean dan perbandingan visual. Bagi kedua-dua sistem, pelaksanaan diuji pada 148
imej haptoral bar. Prestasi kedua-dua sistem dinilai menggunakan R-Precision, Error
Rate (ER), Mean Average Precision (MAP), PR Graph, Receiver Operating
Characteristic (ROC) dan Area under ROC Curve (AUC). Menurut pengukuran ini,
sistem Model 2 telah melakukan temubalik imej yang lebih baik. Implikasi kaedah ini
menunjukkan bahawa kadar kesesuaian meningkat apabila saiz set latihan berkurangan
kerana semua imej kebanyakannya relevan kepada pertanyaan imej. Selain itu, ia
menunjukkan bahawa saiz set latihan memberi kesan kepada kadar kesesuaian imej-
imej yang dicapai di mana kadar kesesuaian adalah berkadar songsang kepada saiz set
latihan. Disamping itu, hasil capaian mengandungi imej-imej yang dicapai dengan
catatan mereka, menyediakan pemahaman dan pengetahuan yang lebih kepada
pengguna. Akhirnya, dalam kajian ini seni bina tiga peringkat temubalik imej
Biodiversiti adalah dicadangkan.

vi
ACKNOWLEDGEMENTS
I would like to thank the Almighty God, for blessing me with everything; in whatever I
do throughout my life and for giving me guidance and strength to see me through this
study.
I would like to express my sincere gratitude to those who had helped me to reach
success on this study. I extend my apologies to anyone I may have failed to mentioned.
First of all, I wish to express my heartfelt appreciation to my supervisors, Dr Sarinder
Kaur Kashmir Singh and Professor Susan Lim Lee Hong, for their invaluable support,
guidance and advice over this study.
Secondly, to my beloved parents, Haji Abu bin Turok and Hajah Siti binti Haji Hashim,
without their constant love, care and support, I would not have been who I am today. To
my brothers, sisters, nieces, and nephews, thanks for their understanding and
overwhelming support and motivation. From the bottom of my heart, I am greatly
indebted to them and thank you for everything.
Thirdly, I am very grateful to Ministry of Higher Education, Malaysia for the financial
support under the Skim Latihan Akademik IPTA (SLAI) scholarship. I am also very
grateful to University Malaya for the University of Malaya’s Postgraduate Research
Fund (PS284/2009B) for the supporting grant over this study.
Finally, I would like to extend my sincere thanks to my friends and colleagues,
especially to Zahriah, Shahrizim, Ruby and Ida, for their encouragement and
motivation. To my BIL lab mates, Azah, Farhana and Evelyn, I owe thanks for their
helps, efforts and ideas. Last but not least, many thanks to industrial students, Lee Kien,
Huey Jia and Jian Bin, for helping me in preparing the database during your internship,
and Pn Sri for the ontology part.
Thank you for all your support.
Arpah binti Abu
2013

vii
TABLE OF CONTENTS
ABSTRACT .................................................................................................................... II
ABSTRAK .................................................................................................................... IV
ACKNOWLEDGEMENTS ......................................................................................... VI
TABLE OF CONTENTS ............................................................................................ VII
LIST OF FIGURES ....................................................................................................... X
LIST OF TABLES .................................................................................................... XIII
LIST OF ABBREVIATIONS ................................................................................... XIV
LIST OF APPENDICES ............................................................................................ XV
CHAPTER 1: INTRODUCTION ............................................................................. 1
1.1 Background ....................................................................................................................1 1.1.1 Monogenean data ...................................................................................................1 1.1.2 Image retrieval methods .........................................................................................2 1.1.3 Biodiversity image retrieval ...................................................................................4
1.2 Problem Statement .........................................................................................................7
1.3 Objective ........................................................................................................................9
1.4 Scope of the Study .......................................................................................................11
1.5 Research Significance ..................................................................................................11
1.6 Chapter Organization ...................................................................................................13
CHAPTER 2: LITERATURE REVIEW ............................................................... 15
2.1 Introduction ..................................................................................................................15
2.2 Biodiversity Data Sources ............................................................................................15 2.2.1 Existing data sources - Image databases ..............................................................17 2.2.2 Summary of current data sources review .............................................................24
2.3 Biological Image Processing ........................................................................................27 2.3.1 Existing automated identification systems ...........................................................28 2.3.2 Summary of current systems review ....................................................................31 2.3.3 System requirements ............................................................................................34
2.4 Image Retrieval Methodologies ...................................................................................35 2.4.1 Image retrieval basic principles ...........................................................................38 2.4.2 Image retrieval techniques ...................................................................................38
2.5 Image Classification Methodologies ............................................................................63 2.5.1 The classifiers ......................................................................................................63 2.5.2 The methodologies ...............................................................................................70
2.6 Summary ......................................................................................................................72
CHAPTER 3: PROBLEM DEFINITION .............................................................. 74
3.1 Introduction ..................................................................................................................74
3.2 Problem Definitions .....................................................................................................74 3.2.1 Image data ............................................................................................................74 3.2.2 Image processing procedures ...............................................................................75 3.2.3 Ontology ..............................................................................................................77 3.2.4 Image classification..............................................................................................79

viii
3.3 Problem of Biodiversity Image Data Integration .........................................................81
3.4 Need for Integrated Semantic CBIR Framework .........................................................82
3.5 Summary ......................................................................................................................84
CHAPTER 4: SOLUTION OVERVIEW ............................................................... 86
4.1 Introduction ..................................................................................................................86
4.2 User Requirements .......................................................................................................86
4.3 Proposed Image Retrieval Models ...............................................................................86 4.3.1 Proposed solution: Model 1 .................................................................................87 4.3.2 Proposed solution: Model 2 .................................................................................87
4.4 Data Gathering Methodology.......................................................................................90 4.4.1 Image digitization ................................................................................................90 4.4.2 Image pre-processing ...........................................................................................91 4.4.3 Pre-defined classes of monogenean haptoral bar images .....................................92
4.5 Ontology-Based Image Annotation and Retrieval .......................................................93 4.5.1 Structured vocabularies ........................................................................................94 4.5.2 Conceptual framework of the proposed ontology ................................................96 4.5.3 Biodiversity image data annotation ....................................................................101 4.5.4 Ontology based image retrieval .........................................................................101
4.6 Image Classification using Ontologies in CBIR ........................................................103
4.7 Content-Based Image Retrieval Methodology ...........................................................103
4.8 Summary ....................................................................................................................106
CHAPTER 5: SYSTEM DESIGN, IMPLEMENTATION AND TESTING .... 107
5.1 Introduction ................................................................................................................107
5.2 System Design ...........................................................................................................107 5.2.1 System architecture ............................................................................................108 5.2.2 Prototype process model for ontology development ..........................................111 5.2.3 User interface design ..........................................................................................112
5.3 Development Environment ........................................................................................113
5.4 System Implementation..............................................................................................115 5.4.1 Pre-processing of the images .............................................................................116 5.4.2 Ontologization - Building the ontology .............................................................121 5.4.3 Image annotation ................................................................................................127 5.4.4 Implementation of the image classification using ontology-based image retrieval
(OBIR) ………………………………………………………………...…….................131 5.4.5 Implementation of image retrieval using CBIR .................................................134
5.5 Testing........................................................................................................................140 5.5.1 Tester ..................................................................................................................141 5.5.2 System testing ....................................................................................................141 5.5.3 Performance testing............................................................................................143
5.6 Results and Discussions .............................................................................................149 5.6.1 Ontology evaluation ...........................................................................................149 5.6.2 Results of similarity-based image retrieval – Model 1 ......................................156 5.6.3 Results of similarity-based image retrieval – Model 2 ......................................159 5.6.4 Performance results and comparisons for Model 1 and Model 2 .......................164
5.7 Summary ....................................................................................................................170

ix
CHAPTER 6: FUTURE WORK AND CONCLUSION ..................................... 171
6.1 Introduction ................................................................................................................171
6.2 Proposed Image Retrieval ..........................................................................................171
6.3 Reducing the Semantic Gap .......................................................................................172
6.4 Retrieval Performance................................................................................................173
6.5 Approach Applicability ..............................................................................................173
6.6 Ontology Applicability in Organizing Biology Data .................................................174
6.7 Display Retrieved Images in Ranked Order ...............................................................174
6.8 Query Image by Example ..........................................................................................175
6.9 Proposed Architecture Limitations ............................................................................175 6.9.1 Image pre-processing .........................................................................................175 6.9.2 Query by example using internal image .............................................................175 6.9.3 Data annotation in ontology ...............................................................................176 6.9.4 CBIR limitations ................................................................................................176
6.10 Future Work ...........................................................................................................176 6.10.1 Implementation in other domain ....................................................................176 6.10.2 Upgrading query image methods ...................................................................177 6.10.3 Automatic image quality checker...................................................................177 6.10.4 Customizable search criteria with semantic query .........................................178 6.10.5 Semantic search engine ..................................................................................178 6.10.6 Upgrading to more informative ontology ......................................................178
6.11 Conclusion .............................................................................................................179
APPENDICES ............................................................................................................. 181
REFERENCES ............................................................................................................ 212

x
LIST OF FIGURES
Figure 2.1: ImageBrowse in FlyBase .............................................................................. 17
Figure 2.2: Retrival results from FlyBase ....................................................................... 18
Figure 2.3: GCD searching page ..................................................................................... 19
Figure 2.4: Retrieved results from GCD ......................................................................... 20
Figure 2.5: Retrieved images from GCD ........................................................................ 20
Figure 2.6: SID – Search page interface ......................................................................... 21
Figure 2.7: Universal Chalcidoidea Database – Search page interface .......................... 23
Figure 2.8: Browsed image page ..................................................................................... 23
Figure 2.9: Monogenean images in MonoDb ................................................................. 24
Figure 2.10: SPIDA-web interface .................................................................................. 30
Figure 2.11: Image retrieval basic principles .................................................................. 38
Figure 2.12: Interpreting an image .................................................................................. 39
Figure 2.13: Relational model for Parasite Host data (Physical design)......................... 45
Figure 2.14: Example of an Entity Relationship Diagram – ERD (Logical design)....... 45
Figure 2.15: A graph of triples showing information about a specimen (S1) ................. 47
Figure 2.16: A typical architecture of CBIR system (Torres & Falcao, 2006) ............... 49
Figure 2.17: Back-Propagation Neural Network procedures .......................................... 68
Figure 4.1: Procedural flow of Model 1 .......................................................................... 87
Figure 4.2: Procedural flow of Model 2 .......................................................................... 89
Figure 4.3: Example of the images from manuscript (Lim & Gibson, 2009) ................. 91
Figure 4.4: Image pre-processing flow ........................................................................... 92
Figure 4.5: Six distinct classes of monogenean haptoral bar .......................................... 93
Figure 4.6: The ontology in a graph format .................................................................... 98
Figure 4.7: A detailed example of triple statements to form a graph .............................. 99
Figure 4.8: MHBI-Fish ontologies in a graph format ................................................... 100
Figure 5.1: Image retrieval architecture for the Model 1 .............................................. 109
Figure 5.2: Image retrieval architecture for the Model 2 .............................................. 110

xi
Figure 5.3: Ontology development using evolutionary prototyping model .................. 111
Figure 5.4: The software development tools environment ........................................... 113
Figure 5.5: Image rescaling process .............................................................................. 117
Figure 5.6: Image normalization process ...................................................................... 117
Figure 5.7: Image resizing process................................................................................ 118
Figure 5.8: Species images ............................................................................................ 119
Figure 5.9: Haptoral anchor images .............................................................................. 120
Figure 5.10: Haptoral bar images .................................................................................. 120
Figure 5.11: Haptoral hook images ............................................................................... 121
Figure 5.12: Wizard in Protégé to create an ontology .................................................. 122
Figure 5.13: Creating a class in Protégé........................................................................ 123
Figure 5.14: Creating an object property in Protégé ..................................................... 123
Figure 5.15: Creating a datatype property in Protégé ................................................... 124
Figure 5.16: Linking MHBI and Fish ontologies .......................................................... 125
Figure 5.17: Top-level classes in MHBI ontology ........................................................ 126
Figure 5.18: Top-level classes in MHBI-Fish ontologies ............................................. 127
Figure 5.19: Creating a new instance for Specimen class ............................................. 128
Figure 5.20: Annotating an instance with object properties ......................................... 130
Figure 5.21: Annotating an instance with datatype properties ...................................... 130
Figure 5.22: Annotated instance for Specimen class ..................................................... 131
Figure 5.23: Annotated instance for TaxonName class ................................................. 131
Figure 5.24: OBIR process flow ................................................................................... 132
Figure 5.25: CBIR process flow for Model 1 ............................................................... 136
Figure 5.26: CBIR process flow for Model 2 ............................................................... 136
Figure 5.27: 19 unknown query images for testing....................................................... 148
Figure 5.28: Results of the Clarity criteria evaluation (Test 1 and Test 8); and the
Coherence criteria evaluation (Test 6, Test 7 and Test 11)........................................... 150
Figure 5.29: Results of the Clarity criteria test (Test 3 and Test 7). Visualization of
MHBI ontology in Protégé. ........................................................................................... 151

xii
Figure 5.30: Results of the Coherence criteria evaluation (Test 4, Test 5, Test 8 and Test
10). ................................................................................................................................ 153
Figure 5.31: Results of the Coherence criteria evaluation (Test 9). ............................. 154
Figure 5.32: Results of the Extendibility criteria evaluation. ....................................... 155
Figure 5.33: Query page for the Model 1 ...................................................................... 157
Figure 5.34: User has to select preferred query image.................................................. 157
Figure 5.35: Upload the query image into the server .................................................... 158
Figure 5.36: Options for query image to against individual shape or all shapes .......... 158
Figure 5.37: Retrieval results for the Model 1 .............................................................. 159
Figure 5.38: Query page for the Model 2 ...................................................................... 160
Figure 5.39: User has to select preferred query image.................................................. 160
Figure 5.40: Send the query image and preferred training set images to the server ..... 161
Figure 5.41: Buttons to view retrieved images and options for query image to against
individual shape or all shapes ....................................................................................... 161
Figure 5.42: Retrieved images display in a new web browser ...................................... 162
Figure 5.43: Retrieval results for the Model 2 .............................................................. 162
Figure 5.44: View an image with the annotations......................................................... 163
Figure 5.45: PR-Graph for both models ........................................................................ 168
Figure 5.46: ROC curves for both models .................................................................... 169

xiii
LIST OF TABLES
Table 2.1: A summary of the features and requirements of existing Biodiversity data
sources ............................................................................................................................. 25
Table 2.2: A summary of the features and requirements of existing automated
identification systems ...................................................................................................... 32
Table 2.3: A summary of the review on the image recognition systems in Biology ...... 36
Table 2.4: Parasite Host data for reading purposes ......................................................... 43
Table 2.5: Parasite Host data for reading and querying purposes ................................... 43
Table 4.1: Naming of instance and number of instances for each concept ................... 102
Table 5.1: Server- and client- side hardware tools ........................................................ 115
Table 5.2: Classes, instances, object or datatype properties ......................................... 129
Table 5.3: A test case sample ........................................................................................ 142
Table 5.4: Sample of retrieval – Results of similarity-based retrieval of both models,
Model 1 and Model 2, for the ventral bar query image ................................................ 165
Table 5.5: The efficiency of retrieval for both models ................................................. 166

xiv
LIST OF ABBREVIATIONS
API Application Programming Interface
CBIR Content-Based Image Retrieval
CSS Cascading Style Sheets
DBMS Database Management Systems
GUI Graphical User Interface
HTML Hypertext Markup Language
JDBC Java Database Connectivity
JAI Java Advanced Imaging
JSP Java Server Pages
LSID Life Science Identifiers
OBIR Ontology-Based Image Retrieval
OWL Web Ontology Language
RDF Resource Description Framework
RDFS Resource Description Framework Schema
ROI Region of Interest
SPARQL SPARQL Protocol and RDF Query Language
TDWG Taxonomic Database Working Group
URL Uniform Resource Locator
URI Uniform Resource Identifier
XML Extensible Markup Language

xv
LIST OF APPENDICES
Appendix A TDWG LSID and New Vocabularies
Appendix B Sample of Source Codes
Appendix C Sample of Ontology OWL Codes and RDF Graph Data Code
Appendix D Sample of Test Cases
Appendix E Retrieval Results

1
CHAPTER 1:
INTRODUCTION
1.1 Background
Images play an important role in numerous human activities. Images are central to a
wide variety of fields ranging such as law enforcement, agriculture and forestry
management, earth sciences and so forth. One of the uses of digital images is in face
recognition and identification for security purposes. In the field of medicine, MRI
images are used for cancer detection as well as for disease diagnosis and educational
purposes. Similarly, geological images are needed in every stage of work for oil
exploration. Images also play an important role in continually monitoring the surface of
the earth via satellites. Hence, applications of digital images continue to develop in
many areas.
1.1.1 Monogenean data
Taxonomy is a prerequisite for all biological endeavors. Globally, it is envisaged that
there will be a decline in the number of expert taxonomists in the near future and this
decrease will be more deeply felt in countries such as Malaysia where the number of
expert taxonomists are few to begin with (Lim & Gibson, 2010b). In view of this
impending decrease in taxonomists, particularly in parasitology, Lim and Gibson (2010)
proposed that along with training of a new generation of taxonomists with multiple
skills, alternative tools to assist Biologists in species identification such as computer-
assisted identification system for DNA should be developed so as to reduce dependence

2
on the few available taxonomists. Here in Malaysia, the taxonomists are also preparing
for the eventuality that we might have to resort to using the said alternative tools to
assist non-taxonomist biologists in species identification due to lack of researchers
willing to take up the challenges of being taxonomists. This is done by digitizing known
Malaysian parasite species, in particular the monogeneans, into a databases, which can
then be analyzed for further information.
Monogeneans are parasitic platyhelminths and are distinguished based on both soft
reproductive anatomical features as well as shapes and sizes of sclerotised hard parts of
their haptoral bar, anchor, hook and male and female copulatory organ (see Lim, 1995,
1998; Lim & Gibson, 2007, 2010a). The diagnostic features of monogeneans, especially
their sclerotised hard parts, are given as illustrations in the literatures.
Currently, species are recognized and identified using morphological and
morphometrical characteristics of the sclerotised hard parts in the form of illustrated
images. In this study, we are looking at developing a computerized system to automate
recognition using these images.
1.1.2 Image retrieval methods
Generally, there are two approaches in image retrieval i.e. metadata-based and content-
based which are based on human-annotated metadata and analyzing the actual image
data, respectively (Avril, 2005).
Metadata-based image retrieval is the approach based on the textual string to describe
the image. This approach involves two important aspects, i.e. image annotation and
image retrieval. Image annotation refers to the process in describing images, while

3
image retrieval refers to the process of finding images by using the annotated metadata.
This approach is lexically motivated whereby it is relating to the words or vocabularies
rather than understanding the meaning of the words or vocabularies. Since the retrieved
images are based on the word comparison rather than the actual meaning of the word, it
leads into irrelevant retrieved images. In terms of data representation, there are two
main questions that could be raised regarding this approach, viz (i) How to represent the
annotated metadata? and (ii) What are the techniques and tools that are needed in order
to interpret the metadata? With the advancement in semantic web ontology techniques
(Lassila, van Harmelen, Horrocks, Hendler, & McGuinness, 2000) and metadata
languages (Hyvönen, Harjula, & Viljanen, 2002), it makes for a promising aid in this
approach for semantic image retrieval. As for the image retrieval results, the retrieved
images are normally listed in an unranked order.
On the other hand, content-based image retrieval (CBIR) is an approach suitable for
task-dependent query, whereby the image query cannot be described and is very
subjective to put into words. Thus, in this approach, similar images will be searched and
retrieved based on the query image. The interface layer allows users to send a query
image. The images from the image database are then assigned as training set images.
Both query and training set images' features (such as shape, texture and color) are
extracted and form the feature vectors in the feature space. The similarity comparison
(using distance parameters such as Euclidean distance and Mahalanobis distance)
between the query and training set images are then measured, and the classifier (such as
Minimum distance, Maximum distance and K-Nearest classifier) is used to classify the
retrieved images. The results are then returned to the user through a user interface. As
for the results, the retrieved images must be accurate, relevant and related to the user
query. The retrieved images are usually indexed in the ranked order.

4
The performance of this approach is dependent on features such as color, texture or
shape to represent the image, as well as the classifier to categorize the similar images.
The selection of features and classifier are determined generally by the complexity of
the domain problem. Other factors such as the image quality must also be considered
because of its effects on the image processing and analysis. Some of the problems are
caused by lighting conditions, presence of complex background, and differences in scale
and viewing angle. Constraints such as low quality image and small number of training
images may lead to irrelevant retrieved images. To eliminate or alleviate some of these
problems, Gaussian-smoothing technique can be used to minimize the background
effect. Other techniques such as image normalization can be performed before the
recognition process to eliminate the problem of scale and viewing angle (Lemieux &
Parizeau, 2003).
1.1.3 Biodiversity image retrieval
In biology, images are needed, particularly for organism identification, educational and
scientific purposes. For example, in biodiversity studies, the researchers produce a vast
number of biological images and these outputs are important for anyone interested in
biology or any other related fields. From the images, elements such as diagnostic hard
part structures can be used to identify the organism at any level such as genus or
species. Along with the images, the annotations that describe the related details are
provided. These annotations are also important so that the information provided is
detailed enough and relevant. However, this data can only be retrieved from the
literatures or personal communication with the researchers.
To enable the sharing, and to some extent, remote access of this information, the way to
go is towards entirely digitizing the data wherein the database system plays a most

5
important role. Currently, there are many online databases and current biodiversity
databases, which exist independently i.e. image database and textual database. Image
annotations are often ignored, rendering the information provided to the user as useless
data. When the databases exist independently, the user has to switch between distinct
systems and perform laborious analysis on their own before the extracted information
can be combined.
Moreover, specialized taxonomic image databases are very limited. It may be because
image storing is cumbersome (Curry & Humphries, 2007). In order to develop a
practical system, developers may have technical difficulties especially in dealing with
diagnostic characters. Besides that, there is a lack of interest because this kind of
database has no commercial impact. From image databases, it can be used for
information sharing such as Global Cestode Database (Caira, 1995) and Flybase
(McQuilton, Pierre, Thurmond, & Consortium, 2012) where the retrieved images are
based on the textual query. However, the retrieved images may be irrelevant to the user
query. Furthermore, it can be used for automated identification systems such as DAISY
(O'Neill, 2010) and Butterfly family identification (Wang, Ji, Liang, & Yuan, 2012)
where the identified images are retrieved without their annotations. Thus, the retrieved
images are insufficient to the user since the details pertinent to the images are not
provided.
On the contrary, well established biodiversity textual databases such as Parasite-Host
Database at the Natural History Museum (Gibson, Bray, & Harris, 2012) and MonoDB
(Andy & James, 2012) provides information on the known species of monogeneans for
parasitologists. The information from both databases can be retrieved based on the
textual query. However, to get a clearer picture of the information, user has to obtain

6
through other image databases, from the original literature or personal correspondence
with the researchers responsible for the information.
Biodiversity data exists in different forms (such as text and image), interlinked between
different repositories such as Parasite-Host and Herbivore-Plant, and complex images
that are not easily described using words. Thus in this study, after considering the data
used for retrieval i.e. heterogeneity of biological data and the complexity of images, as
well as the aim to get more relevant images based on the user query, both the image
retrieval approaches stated previously are combined in order to develop a system for
biodiversity image retrieval.
Ontology-based image retrieval (OBIR) is developed based on the ontology approach. It
is a concept whereby the terms can be used to express the intentional meaning s and the
information can be queried based on human perception. It is also very suitable for
dynamic datasets as information in biology are always evolving over time. In the
proposed architecture, OBIR was used as an approach to filter images to be used as
training set images in the Content-based image retrieval (CBIR) layer by eliminating the
irrelevant images using the text-based query, rather than the classifier used in matching
the images.
The performance of image retrieval was measured based on the efficiency of the
retrieval between Model 1 and Model 2, which is conventional CBIR and CBIR
integrated with ontology, respectively. This step is to determine whether this approach
can be used as support in the CBIR layer.

7
1.2 Problem Statement
As stated previously, there are many types of biodiversity databases and these databases
exist independently i.e. image database and textual database. To provide more
information and knowledge to the user, researchers in biology or anyone interested in
this field needs an integrated automatic image retrieval system so that relevant images
are retrieved and corresponding annotations can be used in their work. However, to
develop this kind of image retrieval system, challenges such as (i) how to manage the
image content, (ii) how to provide the image retrieval capabilities, and (iii) how to
retrieve more relevant images to the user query, must be addressed (Murthy et al.,
2009).
Generally, there are two image retrieval approaches i.e. metadata-based image retrieval
and content-based image retrieval, which are based on human-annotated metadata and
analyzing the actual image data, respectively. These two approaches have many
differences but the main similarity of both approaches is that both may lead to the
retrieval of irrelevant images (Avril, 2005).
Developing an image retrieval system is not an easy task because it is difficult to
measure the performance in terms of image accuracy and relevancy (Abu, Lim, Sidhu,
& Dhillon, 2013). Generally, at the end of the process, the retrieved images must be
accurate and relevant to the user query. Accuracy is an important factor to determine
whether a system is working well or not and it is defined by the closeness of a
measurement to an accepted true value, whereby the smaller the difference between the
measurement and the true value, the more accurate the measurement (Universities,
2005).

8
Most previous research focused on image representations (Krishnapuram, Medasani,
Sung-Hwan, Young-Sik, & Balasubramaniam, 2004; Wei, Guihua, Qionghai, & Jinwei,
2006; Lamard et al., 2007; Sergyan, 2008), classifier algorithms (Xin & Jin, 2004;
Duan, Gao, Zeng, & Zhao, 2005; Liu, Wang, Baba, Masumoto, & Nagata, 2008), the
use of image database (Kak & Pavlopoulou, 2002), and relevance feedback (Stejić,
Takama, & Hirota, 2003; Zhang, Chen, Li, & Su, 2003; Ortega-Binderberger &
Mehrotra, 2004; Wang & Ma, 2005; Wei & Li, 2006) in an effort to enhance the image
retrieval system using CBIR approach.
Another alternative approach is to integrate textual image retrieval into the conventional
CBIR. However, there were not many studies looking into this. Some examples are
EKEY (EKEY, 2012), BISs (Torres, Medeiros, Goncalves, & Fox, 2004), SuperIDR
(Murthy et al., 2009), and teaching tool for parasitology (Kozievitch et al., 2010).
EKEY is a web-based system that provides taxonomic classification, dichotomous key,
text-based search and combination of shape and text-based search, which takes into
account fish shape outlines and textual terms. For the SuperIDR, instead of providing
the same features as EKEY, it enables user interaction features such as add content,
support for working with specific parts of images, performing content-based image
annotation and retrieval and has pen-input capabilities, which mimics free-hand drawing
and writing on paper. In terms of database system, the relational database architecture
was used for text annotation. Both systems were used in the Ichthyology domain. As an
alternative approach to teach, compare and learn concepts about parasites in general,
research groups (Kozievitch et al., 2010) adapted SuperIDR.
Furthermore, most of them rely on computer readable formats such as in relational
databases (examples such as Biota (Colwell, 2010), InsideWood (InsideWood, 2004-

9
2012), MonoDb (Andy & James, 2012)) and XML (examples such as Open Microscopy
Environment (OME) Data Model and XML File (Goldberg et al., 2005), knowledge-
based grid services for high-throughput biological imaging (Ahmed, Lenz, Jia,
Robinson, & Ghafoor, 2008), PLAZi (Jesse, 2005-2012))
Based on this, there was no work done on using ontology for image pre-classification
and how it affects the content-based image retrieval process. Though this study is
concerned with the development of biodiversity image retrieval with integration of the
ontology- and content- based image retrieval, this study also looks into how image pre-
classification can aid in the matching process in order to overcome the problem of the
efficiency of the retrieval system. Image pre-classification is a way to group only
selected images that are relevant and similar, given certain parameters, to the training
set.
Besides that, currently there is no such work done on monogenean diagnostic hard parts.
Thus, in this study, haptoral bar images were used as the data samples. Compared to the
other diagnostic hard parts, haptoral bar has a very simple shape, thus making it easier
for feature extraction purposes in image recognition process.
1.3 Objective
The main objective of this study is to produce an automated prototype of biodiversity
image retrieval using both text and image as query. By doing this, the retrieval process
can be improved i.e. images with their annotations, more accurate and relevant to the
user query. The use of image pre-classification also aids in the image retrieval process
in terms of accuracy, where can be accomplished when the rate of the retrieved images
is increased.

10
In order to achieve the above objectives, the following tasks were performed:-
(i) Analyses of current techniques of image retrieval; specifically to study and evaluate
work done on image retrieval using text- and content- based image retrieval,
particularly on improving the accuracy of such approaches.
(ii) Collection and digitization of monogenean species and their diagnostic hard part
images from manuscripts into e-library of monogenean images (Image database), in
particular the haptoral bars.
(iii)Collection and digitization of monogenean species data and their literatures that will
be stored in an e-library of monogenean species and literature (Textual data).
(iv) Developing the monogenean haptoral bar ontology (text and image) using semantic
web ontology and metadata languages.
(v) Develop ontology-based image retrieval (OBIR) for retrieving monogenean haptoral
bar images.
(vi) Develop content-based image retrieval (CBIR) for retrieving monogenean haptoral
bar images using shapes to represent the object.
(vii) Integrate OBIR and CBIR for retrieving monogenean haptoral bar images.
(viii) Measure and compare the efficiency of image retrieval using R-Precision,
classification Error Rate, Mean Average Precision, Precision-Recall Graph,
Receiver Operating Characteristic (ROC), and Area under ROC Curve.
(ix) Use image pre-classification to increase the semantic gap between the visual
features and user’s level of understanding.
(x) Propose a solution that can improve the accuracy of content-based image retrieval
using shape description and matching using image pre-classification technique.

11
1.4 Scope of the Study
In the present work, two image retrieval systems were built:-
1. Model 1 - Content-based image retrieval (CBIR)
2. Model 2 - Integration of ontology and CBIR
For both of the systems, the same collections of images from the image database were
used. These images were annotated with vocabularies (parameters) such as taxon name,
publication and so forth. As a result, MHBI-Fish ontologies were produced and are then
used for Model 2 image retrieval system.
The CBIR approach was used to develop the image retrieval system for both Model 1
and Model 2. As for Model 1, all the images from the monogenean image database was
allocated and put into a training set; while for the Model 2, only a subset of the images
in the database was put into the training set, depending on the parameters given by the
user. Image pre-classification for Model 2 emphasized on the dorsal and ventral sections
of the haptoral bar.
In the testing phase, the performance is measured based on the retrieval efficiency of
both image retrieval systems in terms of their Precision, Recall, F-measure, R-Precision,
classification Error Rate, Mean Average Precision, Precision-Recall Graph, Receiver
Operating Characteristic and Area under ROC Curve. The results gathered are then
compared in order to validate the accuracy of the retrieved images.
1.5 Research Significance
The purpose of this study is to provide an alternative approach to image retrieval,
specifically in biodiversity image database. Both image and textual data play an

12
important role in taxonomy studies to provide more information and knowledge to the
user. However, due to the lack of database functionalities, it is very hard to develop a
practical system and this compromises the accuracy of the retrieved images.
This study also provide another alternative in improving the accuracy of the image
retrieval system by focusing on the data aspect i.e. the approach to reduce the training
images for the CBIR layer by eliminating the irrelevant images using the text-based
query, rather than the algorithm or techniques used in matching the images.
The main impact of using image pre-classification is on the size of the training set,
whereby there is a decrease in the number of images in the training set. Theoretically,
the collected images in the training set will be the nearest subset to the query image to
be recognized. Thus, the accuracy rate on the identified image is higher.
Apart from the above, some characteristics of the biological data are heterogeneous,
containing complex images and terminology to describe the data and are always
evolving overtime. Thus, the proposed architecture in this study is able to manage and
handle the heterogeneous dataset collection. Furthermore, it could also be implemented
in other domains involving images such as in archeology, earth sciences and geology.
In biology, images can be used for species identification and image retrieval. This study
is a proof of concept specifically for image retrieval in the monogenean domain. There
are many biological databases, which exist independently, thus the users have to switch
between different database systems before the extracted information can be combined
for further analysis. The proposed architecture is able to solve this problem whereby the
retrieved results contains the relevant images in ranked order, with the textual

13
annotations attached to the image, therefore providing more information and
knowledge.
One of the issues in integrated text- and content- based information retrieval is the data
modeling for textual representation. In order to organize data in a manner that focuses
on the meaning of objects by expressing relationships, this can only be done via
semantics. In this study, the images in the database were annotated along with textual
information in a structured manner using semantics. Thus, the information can be
queried based on human perception and enables rapid information retrieval.
1.6 Chapter Organization
This thesis report is divided into six chapters described as follows. Each chapter starts
with an introduction and ends with a summary or conclusion.
Chapter 1 provides an overview about the biodiversity image retrieval, the objective
and justification for this study.
Chapter 2 provides the literature review of this study. It is a summary of the results
from the fact-finding of current existing systems, current technologies and other related
and relevant matters pertaining to the biodiversity databases as well as image retrieval
approach issues.
Chapter 3 describes the output interpreted from the fact-findings. All the problems that
correspond to biodiversity image data integration and image retrieval approaches are
defined in this section. The compiled information helps in identifying the system
requirements for the proposed architecture.

14
Chapter 4 describes the overview of the proposed solution. It includes the research
methodologies that were used in the development of the system and the strategies for
system development.
Chapter 5 provides the implementation of system development for both Model 1 and
Model 2 based on the proposed solution as described in Chapter 4. It includes the
technical design and implementation of the system i.e. system architecture, design of
input and output interface, description of the development tools and the relevant code
segmentations are given to show how the system works for each implementation.
Testing procedures and experimental results are given. The results are then further
interpreted to justify the objectives of this study. The strengths and weaknesses of the
study were also discussed for future enhancement.
Finally, Chapter 6 discusses the proposed architecture for biodiversity image retrieval.
The strengths and limitations as well as future enhancements are presented. A
conclusion is given at the end of this chapter.

15
CHAPTER 2:
LITERATURE REVIEW
2.1 Introduction
A literature review was conducted to investigate and confirm the status of the research
topic. All of the information was collected using on-line search via internet and from
reading materials such as articles in academic journals, proceedings, conference papers,
reference books and so on. The collected information resources are listed below:-
(i) Reading materials from library, ebook and Web of Knowledge at
http://apps.webofknowledge.com
(ii) Online reference thesis from other local and international universities
(iii)Online database systems from organisations’ and individuals’ websites and articles
This chapter presents the review done on previous and current literatures, which are
relevant and related to the field of study. It includes a brief overview of the application
of digital images in biology. Furthermore, emphasize is given to the application of
image retrieval approaches in biology. It discusses the status of both text- and content-
based image retrieval approaches, including the techniques, current issues and current
applications in the field of study. Image classifiers are also discussed in this chapter.
2.2 Biodiversity Data Sources
A biological database is similar to any other database in many aspects such as, the
function of database is to store the data, the data is easily accessible remotely and the

16
data can be shared with others. However, some of unusual aspects to this database are
(i) biology data are large because of its large subject area and its inter-relationships
among other data, (ii) the business logics are complex and are constantly changing and
evolving over time, and (iii) it need special requirements of scientific culture.
Biological database is a library of life science information, which is collected from
scientific experiments, published literatures, high throughput experiment technology
computational analysis and others ("Biological databases introduction," 2010). It
encompasses many research areas such as molecular biology, biochemistry, cell
biology, evolutionary & population biology, and biodiversity and ecology. Furthermore,
these databases are in inter-related manner such as in parasites-hosts, herbivores-plants,
DNA-organs and organs-donors. Moreover, biological data is kept in many formats
such as in a text, sequence data, protein structure, and taxonomic description form; and
this form is either in text or image data format.
This fact shows that some of the biological database features are heterogeneous,
dynamic, has broad domain knowledge, workflow oriented and information is more or
less integrated. Thus, one of the issues that need to be addressed in order to develop a
more useful biological database is, how to organize this data in a meaningful manner so
that the relevant and useful information to a user’s query can be searched and retrieved.
This study focuses on the biodiversity data. In biodiversity studies, particularly in
taxonomy, both text and image data plays an important role to the researchers so as to
have a better understanding of that particular organism. The following section discusses
further the topic of this study.

17
2.2.1 Existing data sources - Image databases
There are huge numbers of online databases specifically in the biodiversity field
(Parker, 2010). Some of these databases provide image database as one of the system
functions. After going through these image databases, most of databases provide almost
the same system requirements and features but they are used in different domains such
as catfish, ants, insects, birds and plant. Thus in this study, only five were selected for
reviewing purposes.
a) FlyBase (http://flybase.org/)
FlyBase (McQuilton et al., 2012) is an image database of Drosophila genes and
genomes. One of the query tools provided in this system is ImageBrowse (see Figure
2.1) for browsing the images based on the organ system, life-cycle stages, major tagma,
germ layer and all species images.
Figure 2.1: ImageBrowse in FlyBase

18
The images in this database were collected from the literatures such as journal articles
and books. The retrieved images are listed in unranked order along with a short
description (see Figure 2.2).
Figure 2.2: Retrival results from FlyBase
b) Global Cestode Database (GCD) (http://tapewormdb.uconn.edu/)
The Global Cestode Database – GCD initiative was funded by the U.S. National
Science Foundation’s Partnership for Enhancing Expertise in Taxonomy Program
(PEET). The project began in 1995 at the University of Connecticut in Storrs, but has
developed into an ongoing collaboration among Cestodologists in nine countries from
around the world (Caira, 1995). The GCD provides a resource about the global cestode
or tapeworms, whereby it has currently progressed on the entry of taxonomic names and
literature. For easier accessing and tracking of the database elements, they have
migrated from multiple FileMaker Pro databases to a single MySQL database. It allows
direct data entry and uploading of PDFs from any site in the world that has Internet
access.

19
As shown in Figure 2.3, the information can be searched based on the four main
categories, which are Cestode Scientific Name, Type Host, Type Locality and
Specimen. For image retrieval, there are a few parameters given and users have to select
the category based on their interest. Any images that are related to taxonomic
classification as shown in Figure 2.4 will be retrieved together as shown in Figure 2.5.
Figure 2.3: GCD searching page

20
Figure 2.4: Retrieved results from GCD
Figure 2.5: Retrieved images from GCD
c) Specimen Image Database – SID (http://sid.zoology.gla.ac.uk/)
Specimen Image Database – SID (Simon & Vince, 2011) is a searchable database of
high-resolution images for phylogenetic and biodiversity research. This database is

21
intended as a reference collection of named specimens and a resource for comparative
morphological research. Each image is accompanied by a fully searchable annotation,
and can be browsed, searched or downloaded. Public users can register in this database
and the registered users can add, annotate or label the images. Currently, this database is
devoted to the insect order Phthiraptera (lice) and contains 7650 images of 440 taxa.
Key features of SID (see Figure 2.6) include web upload/download of images, bulk and
single image annotation via web forms, extensive browse and search options by text
query, web service facility, web utility to label specific image features, taxonomy
served and validated independently by the Glasgow Taxonomy Name Server, plus alias
addresses for images by accession number and freeware which allows anyone to set up
the database and serve their own images. The retrieved images are listed in unranked
order with the taxon information, host as well as image properties.
Figure 2.6: SID – Search page interface

22
d) Universal Chalcidoidea Database (UCD) (http://www.nhm.ac.uk/chalcidoids)
The Universal Chalcidoidea Database – UCD currently contains citations of taxonomic
names made available within the Chalcidoidea. It includes a comprehensive list of the
various generic combinations and misspellings that have been used in the literature.
Also included are host/associate and distribution records, for which the latter can be
used to provide regional lists of Chalcidoidea (Noyes).
Figure 2.7 shows the searching page in this database. A bibliographic database lists over
40,000 references have been used in Chalcidoidea and this can be searched using 120
predefined keywords in order to locate references dealing with specified subjects. A
similar search can also be conducted in the taxonomic part of the database. More than
350 images of a wide range of living chalcidoids are also available. The full set can be
browsed or restricted to images specific to a particular family, genus or species. A new
aspect of this database is the inclusion of .pdf files of references. Currently, it is limited
to papers by Girault (by permission of Michael Schauff) and Grandi (by permission of
Jean-Yves Rasplus). A .pdf icon alongside the reference in the bibliographic database
indicates the presence of these .pdf files.

23
Figure 2.7: Universal Chalcidoidea Database – Search page interface
The images can be retrieved by using text query based on the taxon family, or by
browsing the entire image database as shown in Figure 2.8. The retrieved images are
listed in unranked order with the taxonomic classification and additional information
such as the owner of the photo and image description.
Figure 2.8: Browsed image page

24
e) MonoDb (http://www.monodb.org/index.php)
MonoDb (Andy & James, 2012) is another biodiversity database that provides image
gallery as one of the features in the database. MonoDb is a web-host for the parasite
monogenea. As mentioned in this website, the purpose of this website is to help
children, adults, experts and non-experts to learn more about this fascinating group of
animals. Browsing the entire images provided in the database can retrieve images in this
database. The images are listed randomly and no information is attached to the images
(see Figure 2.9).
Figure 2.9: Monogenean images in MonoDb
2.2.2 Summary of current data sources review
Table 2.1 is a summary of the features of current existing Biodiversity data sources
presented in the previous section. Based on this information, it helps in identifying the
proposed approach’s requirements, which is explained in more detail in the following
chapter.

25
Table 2.1: A summary of the features and requirements of existing Biodiversity data sources
Features /
Requirements
Biodiversity data sources
Flybase Global Cestode
Database
Speciemen Image
Database
Universal
Chalcidoidea
Database
MonoDB
Developer Peter McQuilton,
Susan E. St. Pierre,
Jim Thurmond, and
the FlyBase
Consortium
Janine N. Caira,
University of
Connecticut and
Kirsten Jensen,
University of Kansas
Simon Rycroft and
Vince Smith
Dr John S. Noyes,
The Natural History
Museum London
Collaboration of
many institutions
Aim To provide a
complete annotation
of the Drosophila
melanogaster genes
and genomes
To provide images
of specimens,
habitats, living hosts,
and pressed host
voucher specimens
To provide a
searchable database
of high-resolution
images for
phylogenetic and
biodiversity research
To provide a
complete citations of
taxonomic names
within the
Chalcidoidea
To help experts or
non-experts to learn
more about parasite
monogenea
System-based Web Web Web Web Web
System requirements
Query method Browsing Text-based Text-based Text-based Browsing
Retrieval approach Browsing Metadata Metadata Metadata Browsing
Database Built-in image
database
Built-in image
database
Built-in image
database, 7650
images of 440 taxa
Built-in image
database, more than
350 images
Static, Built-in image
database
Image pre-
preprocessing
- - - - -

26
Table 2.1, continued
Development tools
Operating system - - Mac, Windows,
Linux
- -
Language - - Php, Java - Php
DBMS - MySQL MySQL - -
Image editor - - Imagemagick - -
System process
Input - Textual string Textual string Textual string -
Output List of images in
unranked order
List of colored
images in jpeg
format, unranked
order
List of colored
images in jpeg
format, unranked
order
List of colored
images in jpeg
format, unranked
order
An image
Textual annotations Taxon information,
description, anatomy
terms, image
properties
Taxon information Taxon information,
host, image
properties
Taxon information,
owner of the photo,
photo description
-
Interfaces Yes. Simple and user
friendly
Yes. Simple and user
friendly
Yes. Simple and user
friendly
Yes. Simple and user
friendly
Yes. Simple and user
friendly

27
Most of the images in the image database are retrieved based on the text-based query.
Usually, the results of retrieved images are listed in unranked order plus in a very broad
manner because it depends on the words or vocabularies to represent the images.
Moreover, each image will be attached together with their annotations such as taxon
information, short description and distribution information to describe the image.
However, there is no CBIR capability provided.
2.3 Biological Image Processing
As stated in (Castelli & Bergman, 2002), images are central to a wide variety of field
ranging from history to medicine, including astronomy, oil exploration and weather
forecasting. Image plays an important role in numerous human activities such as law
enforcement, agriculture and forestry management, earth science and so forth. One of
the uses of images is in face recognition and identification. Other example is in
medicine where images are used for both diagnostic and educational purposes. In the
same way, geologic images are needed in every stage of work for oil exploration.
Images also play an important role in numerous satellites to continually monitor the
surface of the earth. Hence, applications of digital images are continually developing in
many areas.
Similarly, specifically in biology, images are needed for organism identification,
educational and scientific purposes. In biodiversity research, scientists produce vast
number of images, which provide very useful information to many contemporaries.
From the images, the elements such as diagnostic hard parts can be used to identify the
organism at any level such as genus or species. This finding can be shared and used for
teaching and educational purposes such as in research. However, these images can only
be retrieved from the literatures or personal communication with the experts. With the

28
advancement in information technology, these images can be shared, accessed and
retrieved remotely to make it useful to other people who have interest on the matter.
Thus, it leads towards an entirely digitalized image wherein image databases partake a
most important role. Besides that, as stated in (Curry & Humphries, 2007), the whole
approach to computing and database management has shifted from the independent
researcher keeping records for a particular project to the state-of-the-art file storage
systems, presentation and distribution over the World Wide Web.
In biology, automated systems and tools such as organism identification, data
management, data sharing and information retrieval are needed to assist and support
biologists in doing their research. With the advancement in computer vision (Forsyth &
Ponce, 2002), image processing (Gonzalez & Woods, 2010) and machine vision studies
which involve many studies such as artificial intelligence, imaging and pattern
recognition, one of the major applications of digital images in biology is for species
identification. The following sections present the selected current systems, which are
reviewed in this study. The current systems were reviewed based on (i) the aim of the
system, (ii) the system requirements used to develop the systems, approach used in
retrieval, training set, image pre-preprocessing and relevant structures for the
identification, and (iii) system flow on how to use the system from input requirement
right up to the retrieved results to the user.
2.3.1 Existing automated identification systems
a) Digital Automated Identification SYstem – DAISY
One of the established identification systems is DAISY. DAISY is widely used for
species identification (O'Neill, 2010). It can be used to help non-experts for rapidly
screening the unknown species. The prototype was first developed and tested to

29
discriminate five species of parasitic wasp, based on differences in their wing structure
using principle component analysis and linear discriminant analysis (Weeks, O'Neill,
Gaston, & Gauld, 1999). DAISY was also used in the identification of other insect
groups such as the biting midges, Xylophanes hawkmoth (Gauld, O'Neill, & Gaston,
2000) and live moths of Macrolepidoptera (Watson, 2002; Watson, O'Neill, & Kitching,
2004). DAISY system is generic (O'Neill, 2007) and was then further enhanced with
new methods such as artificial neuron network and support vector machines (Mayo &
Watson, 2007), and plastic self-organizing map (Lang, 2007). In summary, as
mentioned in (O'Neill, 2010), DAISY has been exhaustively tested in many significant
morphological and molecular datasets including British bumblebees (Pajak, 2000),
British Lepidoptera (butterflies), sphingid larvae and lycosid spiders.
b) SPecies IDentified Automatically – SPIDA
Other example for generic species identification is SPIDA (Platnick, Russell, & Do,
2012). SPIDA (see Figure 2.10), which is an identification system for spiders whereby
artificial neuron network is applied to recognize images, encoded with wavelet (Do,
Harp, & Norris, 1999). Until 2005, they have developed internet-accessible automated
identification system named SPIDA-web (SPecies IDentification, Automated and web
accessible) with two perspectives i.e. taxonomic (Family Trochanteriidae) and
geographic (surveys conducted in Knox Co., TN).

30
Figure 2.10: SPIDA-web interface
c) Automated Bee Identification System Automated – ABIS
ABIS is an identification system of bee species by image analysis of their wings. This
system is also integrated and applied as a tool for data gathering within the information
system EDIS - Entomological Data Information System. Geometrical image analysis,
template matching, affine projection, discriminant analysis, kernel functions and GIS
are the methods used in developing this system (Schröder, Drescher, Steinhage, &
Kastenholz, 1995).
d) DrawWing
The last example is DrawWing, which is the software for insect identification based on
the analysis of wing images and currently it is working on honeybee (Apis) wings
(Adam, 2008).

31
2.3.2 Summary of current systems review
Table 2.2 is a summary of the features of current existing identification systems that
were discussed in the previous section. The review helped in identifying the proposed
approach’s requirements, which is explained in more detail in Chapter 3 and 4.
Generally, with advancement in information technology, many systems and tools have
been developed to assist and support biologists in performing their research works.
Both DAISY and SPIDA are generic-based system, which means these systems can be
used to recognize many other species. On the contrary, ABIS and DrawWing are are
restricted to insects, which operates by matching specific set of characteristics based on
wing venation. Basically, the identification system is built based on pattern recognition
approach. The species diagnostic characters are used for the identification, which are
represented by certain patterns such as color, shape and/or texture. The query image will
be compared to the images in the training set and the identification result; normally the
system will return the identified species image along with taxon species name but no
complete annotations to describe the image.

32
Table 2.2: A summary of the features and requirements of existing automated identification systems
Features / Requirements Automated identification systems
DAISY SPIDA-web ABIS DrawWing
Developer Mark O'Neill Kimberly N. Russell,
Martin T. Do
Prof. Dr. W. Drescher,
Prof. Dr. D. Wittman, Dr.
S. Schröder
Adam Tofilski
Aim A system to rapidly
identify insects and other
invertebrates (to aid
biodiversity and ecology
studies)
An automated
identification system for
biological species in the
Australasian spider family
Trochanteriidae
An automated
identification of bee
species by image analysis
of their wings
Software for analysis of
insect wing images and
extraction of some
information about the
wings. The information
can be used for insects’
identification. At the
moment DrawWing is
designed to work with
honeybee (Apis) wings
System-based Stand-alone Web Stand-alone Stand-alone
System requirements
Query method Image-based Image-based Image-based Image-based
Retrieval approach Image recognition Image recognition Image recognition Image recognition
Training set Built-in image database Built-in image database Built-in image database Built-in image database
Image pre-preprocessing Cropped image in tiff
format
Cropped square image in
51x51 pixels size,
grayscale image in jpeg or
tiff format
Yes Cropped image at
resolution 2400x2400 dpi
Relevant structures for
identification
Wings of insects Adult specimens,
epigynum and pedipalp of
spider
Wings of bee Wings of insects

33
Table 2.2, continued
Development tools
Operating system Linux or BSD UNIX - - -
Language - - - -
DBMS - - - -
System process
Input Species image uploaded
by the user
Species image uploaded
by the user
Species image uploaded
by the user
Species image uploaded
by the user
Output Identified species Identified species Identified species Identified species
Textual annotations Species name Species and genus name Species name Species name
Interfaces Yes. Simple and user
friendly
Yes. Simple and user
friendly
Yes. Simple and user
friendly
Yes. Simple and user
friendly

34
2.3.3 System requirements
There are six aspects that are important to consider when developing an identification
system, i.e. the training images, features to represent the image, similarity comparison,
the classifier, query specification and the expected output of the retrieval process.
The training images are the main input requirement in an image retrieval system,
whereby all images must be with the same standard properties. Therefore, pre-
processing an image is needed to ensure the width, height and pixel size of all images.
The image should also be cleared of any noise. Database is used to store these training
images. With regards to pattern recognition, features are needed to represent an image,
the similarity between two images are then compared using distance function and the
similar images to the query image are classified using classifier. As for query
specification, a query image is needed as input whether in query-by-example, query-by-
sketch or query-based browsing method. The last aspect is the output of the retrieval
process, which is crucial in determining whether the retrieval process works well and in
an efficient manner. Thus to achieve this, the most similar and relevance images must
be retrieved.
There are also many research groups working on species identification either for plant
or animal. Briefly, automated identifications have been developed for the identification
of plants (based on shapes, texture and colors of leaves) (Yanhua, Chun, Chun-Tak,
Hong, & Zheru, 2004; Moreno, Grana, & Veganzones, 2007; Lang et al., 2007;
Kebapci, Yanikoglu, & Unal, 2009), helminth parasites (based on eggs shape and
texture) (Yang, Park, Kim, Choi, & Chai, 2001), butterfly families (based on colour,
texture and shape of wings) (Wang et al., 2012) and marine life based on colors of the
images (Sheikh, Lye, Mansor, Fauzi, & Anuar, 2011). In this present study, the use of

35
shape is considered for a similarity-based image retrieval system for monogenean
haptoral bars. A review of the automated identification systems developed for Biology
and approaches used are summarized in Table 2.3.
2.4 Image Retrieval Methodologies
Images from the image database can be retrieved by using either text- or content- based
image retrieval approaches. Intially the text-based approach was mainly used in building
applications. When the multimedia data began to mushroom over the Internet, plus
limitations of text-based information retrieval, image-based approach started to move
forward in order to improve and enhance performance of image retrieval. Currently,
works on both approaches are still in progress. The following sections discusses these
approaches further including the techniques involved in implementing the approach,
their advantages and disadvantages and example of current existing systems for
reviewing purposes.

36
Table 2.3: A summary of the review on the image recognition systems in Biology
Shape information Reference Aim Features Classifier Similarity measure
Boundary Swain, Norremark,
Jorgensen, Midtiby,
& Green (2011)
Weed identification Mean value of
coordinates of
landmark points
derived from weed
images
Not available Mahalanobis
distance
Araabi, Kehtarnavaz,
McKinney, Hillman,
& Würsig (2000)
Dolphin
identification from
photographs of their
dorsal fins
Curvature of
dolphin’s fin
Not available Syntactic/semantic
distance measure
Ardovini, Cinque, &
Sangineto (2008)
Elephant photo
identification system
Nick curvature of
elephants’ears
Minimum distance Euclidean distance
da F. Costa, dos
Reis, Arantes, Alves,
& Mutinari (2004)
Geographic
differentiation of
rodent species
Thrichomys
apereoides based on
patterns of cranial
morphologies
Curvature of skull Not available Euclidean distance
Do et al., 1999 Spiders
identification
Wavelet
transformation of
epigynum
Artificial Neural
Network
Not available
Gope, Kehtarnavaz,
Hillman, & Würsig
(2005)
Marine mammals
identification
Affine curve of the
mammal images
Minimum distance Affine distance

37
Table 2.3, continued
Boundary Van Tienhoven, Den
Hartog, Reijns, &
Peddemors (2007)
Shark
Carcharias taurus
identification
Affine
transformation of the
natural spot marks
Minimum distance Euclidean distance
Moreno et al., 2007 Categorization of
mushroom samples
Active contour
technique (snake)
K*, Naive
Bayes,
C4.5, Ripper
Not available
Region Pauwels, de Zeeuw,
& Ranguelova
(2009)
Tree taxonomy using
image-based queries
Moment invariants K-nearest neighbors Euclidean distance
Wang et al., 2012 Butterfly families
identification
Geometric Template match Euclidean distance
Wilder, Feldman, &
Singh (2011)
Classification of
shapes into broad
natural categories for
animal and leaf of
plants
Shape skeleton
statistics using mean
of skeleton depth,
branch angle
Bayesian classifier Not available

38
2.4.1 Image retrieval basic principles
Image retrieval is the task for searching images from image database. The basic
principles involved in image retrieval are shown in Figure 2.11.
Figure 2.11: Image retrieval basic principles
These basic principles are query method, image database and retrieved results, in any
method of image retrieval. A query to the image database can be in various forms, i.e. in
text, query-by-example or query-by-sketch. All the images in the database will be
searched using retrieval algorithm based on the approach used. At the end of the
searching process, the retrieved images will be indexed and displayed to the users.
2.4.2 Image retrieval techniques
Generally, there are two approaches to image retrieval, metadata-based image retrieval
that is based on the human-annotated metadata (Avril, 2005), and content-based image
retrieval (CBIR) that analyze the actual image data, as presented in the following.
A. Metadata-based image retrieval
This approach involves two important aspects, i.e. image annotation and image
retrieval. Image annotation refers to the process in describing images; whereby image
retrieval refers to the process of finding images by using the annotated metadata.

39
Avril (2005) mentioned that metadata is a technique that uses textual strings to describe
the image. The metadata describes the image with two concerns, i.e. (i) the concepts that
give information such the image creator, tools used in the process of creating the image,
art style of the image and the price which refers to the explicit properties of the image,
and (ii) describes what is actually in the image which refers to implicit properties that
can be understood by percepting the image itself. Thus, in analyzing an image, both
must be taken into account. Figure 2.9 shows an example of interpreting an image.
Figure 2.12: Interpreting an image
At a higher conceptual level, this image will be searched and retrieved based on their
textual annotations. Basically for text retrieval, it starts with Boolean search of words in
the text using the combination of AND, OR and Not. The other method is using vector
space model, whereby the distance between search terms and documents is calculated.
I. Techniques used in metadata-based image retrieval
Most of the techniques in this approach are adapted or sometimes reinvented from text
information retrieval.

40
For image annotation, as reviewed in (Hanbury, 2008) there are three image annotation
techniques, which are:-
(i) Free text annotation is a technique where the image can be annotated using
combination of words or sentences. It makes it easy to annotate but it leads into
difficulty in image retrieval. Normally, it is used as additional annotation choice of
keywords or ontology. Some of examples are IBM VideoAnnEx software (Lin,
Tseng, & Smith, 2003) and ImageCLEF 2004 (Peters et al., 2004).
(ii) Keyword annotation is based on a list of keywords associated with the image. The
image can be annotated using arbitrary keywords as required or restricted to using a
pre-defined list of keywords or a controlled vocabulary.
(iii)Annotation based on ontologies is a technique that uses the concepts (entities) and
their relationships (predicates) and rules in ontology to annotate the image.
As for image retrieval, Müller (2010) mentioned, some of the techniques used are as
follows:-
(i) Bag of words approach or N-grams can be used for image classification in which
every word is represented in unordered index or dictionary where the grammar and
order of word are disregarded.
(ii) Stop words removal is a technique to remove very frequent words on certain
frequency, which contain little information. These words, depending on the
language, such as in English where words like ‘a’, ‘an’, ‘is’ and ‘have’ are
frequently used in sentences, so those words can be removed.
(iii)Stemming or conflation is another technique that can improve the retrieval results
that use suffix stripping based on a set of rules. For instance, words such as ‘book’,
‘books’ and ‘booked’ where the word ‘book’ is the root or stem. This technique is
also strongly dependent on the language and Porter stemmeing in English (Porter,

41
2010) is one of the well-known algorithms with a free implementation. However,
the limitation of this approach is, it may slightly change the meaning of words.
(iv) Mapping of text to a controlled vocabulary is a technique that uses certain
vocabulary or terminology in certain domain.
II. Issues in metadata-based image retrieval
As stated previously, the basis of metadata-based image retrieval is text retrieval
whereby many techniques (Müller, 2010) come from this domain approach. On one
hand, in this approach, the image can be retrieved based on human perception because
the text has more meaning than visual features (Müller, 2010). On the other hand, there
are few limitations in terms of image annotation as well as the relevancy of the retrieved
images.
Image annotation is never complete and a never-ending task because from time to time
an image might be needed to be annotated to make it more detail and easy to retrieve.
Moreover, it depends on the goal of the annotation. Furthermore, some images are very
subjective and are difficult to describe in words for examples like feelings, situations
and shape of the object. Sometimes, an object can have many alternative ways to
express it thus the synonyms, hyponyms and hypernyms (Müller, 2010) must be
considered in annotating the image. Typo error as well as the spelling differences such
as UK English and US English can happen during the annotation process.
Consequently, the annotator needs to put more effort and extra time to use the correct
words in order to avoid these circumstances.
In terms of image retrieval, this approach is lexical motivated (Avril, 2005) which is
more to relating the words rather than to understand the meaning of the words. The

42
difference of words is measured based on the weightages and not the distance of the
features (Müller, 2010). Thus, it affects the relevancy of retrieved images because the
irrelevant images might be retrieved as well. Furthermore, the retrieved images are
always listed in unranked order and it depends on the users’ judgment to determine the
relevancy of the retrieved images.
Nevertheless, the studies in this field are still in progress with new improvement and
enhancement of the traditional techniques such as an expansion and reranking approach
for annotation-based image retrieval from the web (Kilinc & Alpkocak, 2011); image
search reranking (Yang & Hanjalic, 2012); and a graph-based image annotation (Jing
Liu, Wang, Lu, & Ma, 2008).
III. Data modeling approach
The above topic broadly discussed on the techniques of image annotation and retrieval
involves in the metadata approach, which have been applied in many field such as
science library, medical and biology. Another aspect presented in this study is the data
representation or data modeling for the image annotation and retrieval. To conclude,
there are two questions that would be raised towards this approach; i.e. (i) How to
represent the annotated metadata? and (ii) What are the techniques and tools needed in
order to interpret the metadata? The scope in biodiversity field is presented in this
discussion.
a) Tabular
In traditional data modeling approaches, namely tabular, relational have been applied in
many fields, including in modeling the huge and complex biodiversity data. Tabulation
of data in spreadsheets was common as spreadsheet was simple to read and manipulate,

43
such as to store, print and edit by biologists. Besides, many examples were presented
that can be used by biologists to store their data into digital forms using these simple
methods. For example, the Global Biodiversity Information Facility – GBIF (GBIF,
2001) promotes biodiversity data entry into spreadsheets as many scientists use
spreadsheets quite regularly for data management. It is also believed that many
scientists do not have specialized tools as well as low Internet access, which prevented
them from migrating their data into better modeling approaches. While spreadsheets
also use rows and columns to model the data, like the relational model, it is still very
different in terms of structure and format. Spreadsheets are also considered as flat files
and storing images are cumbersome. An example of the Parasite Host data is shown
Table 2.4 and Table 2.5.
Table 2.4: Parasite Host data for reading purposes
Order Family Genus Parasite_Species Host_Species
Plagiorchiida Anchitrematidae Anchitrema Anchitrema
sanguineum
Glischropus
tylopus,
Hipposideros
Pomona,
Rhinolophus
luctus
Table 2.5: Parasite Host data for reading and querying purposes
Order Family Genus Parasite_Species Host_Species
Plagiorchiida Anchitrematidae Anchitrema Anchitrema
sanguineum
Glischropus
tylopus,
Plagiorchiida Anchitrematidae Anchitrema Anchitrema
sanguineum
Hipposideros
Pomona
Plagiorchiida Anchitrematidae Anchitrema Anchitrema
sanguineum
Rhinolophus
luctus
Data stored in this way has apparent limitations. In the Host_Species column in Table
2.4, three values are crammed into a single column which is acceptable for reading
purposes but not for query. In Table 2.5, although the Host_Species can be separated
into three different rows, it creates a major problem of data redundancy, especially

44
when storing huge amount of data. Redundancy takes more space, hence affects the
performance.
b) Relational model
Another common method of storing biodiversity data is the relational model. In a
relational model, data is stored in database management systems (DBMS) such as
Oracle, DB2, MySQL, and PostgreSQL as well as the simpler ones such as Microsoft
Access. Relational databases are more structured, powerful, systematic, and allows
storage of heterogeneous and large amount of data. Although data is also represented in
a tabular, the relational approach allows multiple tables to be joined and queried easily,
in a standardized manner. The Structured Query Language (SQL) is commonly used to
query a relational database. SQL is an ANSI standard computer language. It is
commonly use for accessing and manipulating data in the DBMS such as to execute
queries against a database, retrieve data from a database, insert new data into a database,
delete data from a database and update data in a database.
The flat file approach used in Table 2.4 and Table 2.5 can be represented in a relational
model as shown in Figure 2.10, which not only eliminates redundancy but also allows
more specific query results.

45
Figure 2.13: Relational model for Parasite Host data (Physical design)
The relational model is more explicit compared to the flat file approach as the entities
that form the tables, attributes or fields that form the columns of the table and tuples that
forms the rows of the table can represent schema. This schema can be represented using
the entity-relationship diagram (E-R) as shown in Figure 2.14.
Figure 2.14: Example of an Entity Relationship Diagram – ERD (Logical design)
Many huge biodiversity projects in the world uses the relational model, which involves
building the databases, querying, integration as well as data sharing. Examples, which

46
are published online, include the All Catfish Species Inventory (Sabaj et al., 2003-
2006), AntWeb (AntWeb, 2002), ASEAN Biodiversity Sharing Service (BISS)
(Biodiversity, 2005), FishBase (Froese & Pauly, 2012), HerpNET (Spencer, 2009), and
WikiSpecies (Wikispecies-Contributors, 2012).
Therefore, the relational model has been successfully used in many database projects.
Scientific research is ever evolving, thus data in this field increases very rapidly. A
database schema with fixed entities and set of fields may not be relevant for new
discoveries and entries. A new addition in a current relational model may require new
schemas to be developed and revision of existing queries has to be done. Migration to a
new schema and query can be very cumbersome and time consuming to database
administrators as well as programmers.
c) Graph data
A recent approach to data modeling is using the graph data. The application of graph
data in modeling is more commonly known as semantics technology. In this approach,
the meaning of ‘entity’ is represented in the triple statement that contains subject,
predicate and object, compared to the relational model in Figure 2.14. An example is
shown in Figure 2.15. As stated in (Toby, Colin, & Jamie, 2009), multiple triples can be
tied together by using the same subjects and objects in different triples. These chains of
relationships are then assembled and form a directed graph to present the data. The
ontology techniques (Lassila et al., 2000) and metadata languages (Hyvönen et al.,
2002) are then used to form a graph; for example, the semantic web uses the Resource
Description Framework (RDF) as a general-purpose language to form a graph on the
Web (Janev & Vranes, 2009). RDF schema (Brickley & Guha, 2012) is a technique to
define hierarchical ontology classes and RDF (Beckett, 2004) for annotating image

47
metadata according to the ontology. The ontology together with the image metadata
forms a RDF graph, a knowledge base, which can facilitate new semantic information
retrieval services (Hyvönen, Saarela, Styrman, & Viljanen, 2003). The main goal of
RDF notations is to make the content machine processable and understandable (Janev &
Vranes, 2009).
Figure 2.15: A graph of triples showing information about a specimen (S1)
Many biodiversity data modeling work have started to adopt this approach. For
example, the SERONTO framework, a product of the Network of Excellence ALTE-
Net (UK) has been used for the semantic data integration of biodiversity textual data. It
was developed to allow seamless access and querying of heterogeneous data resources
across multiple institutions and several scientific domains (Bertrand et al., 2010).
Another text-based data using semantic technology is SAPPHIRE or Situational
Awareness and Preparedness for Public Health Incidences and Reasoning Engines, a
semantic-based health information system. It has the capability of tracking and
evaluating situations and occurrences that may affect public health. The University of
Texas Health Science Center at Houston developed it in 2004 in association with the

48
Oracle Corporation and TopQuadrant, Inc (SAPPHIRE, 2012). Semantic is also used in
the development of the vocabulary for dedicated fields. One example is Gene Ontology
(GO). The objective of the Gene ontology (GO) consortium is to produce a controlled
vocabulary that can be applied to all organisms and able to accommodate new and
different information on gene and protein roles in cells. GO provides three structured
networks with defined terms to describe gene product attributes (OBO, 2012). The
above examples indicate that the current trend is to use semantic technology in database
development for effective data acquisition, organizational and information retrieval.
B. Content-based image retrieval
As a result of advances in Internet and digital image technology, the volume of digital
images produced by scientific, educational, medical, industry and other applications
available to users increased dramatically in the early 1990s (Feng, Siu, & Zhang, 2003).
Thus, it leads towards a need for efficient management of this visual information and
formed the emergence of content-based image retrieval approach. Since then, this
approach has attracted researchers in many fields such as information retrieval,
computer vision, machine learning, database management as well as human-computer
interface and research in this approach has developed rapidly. Moreover, the number of
literatures as well has increased enormously.
Figure 2.13 shows a typical architecture of CBIR system depicted from Torres & Falcao
(2006). The goal of this approach is to search and retrieve a set of similar images to the
user query. The interface layer allows user to send a query image. The images from
image database are then assigned as training set images. Both query and training set
images features (such as shape, texture and color) are extracted and formed the feature
vectors in the feature space. The similarity comparison (such as Euclidean distance and

49
Mahalanobis distance) between the query and training set images are then measured,
and the classifier (such as minimum distance, maximum distance and k-nearest
classifier) is used to classify the retrieved images. The results are then returned to the
user through user interface. As for the results, the retrieved images must be accurate,
relevant and related to the user query.
Figure 2.16: A typical architecture of CBIR system (Torres & Falcao, 2006)
I. Related works in CBIR
Rui, Huang, & Chang (1999), Smeulders, Worring, Santini, Gupta, & Jain (2000), Feng
et al. (2003) and Torres & Falcao (2006) introduce some fundamental techniques as
well as technical achievements in the field of CBIR. They review on the features aspect

50
to represent the images; distance functions for similarity comparison; classifier
algorithms for indexing and user interaction between the user and the retrieval system.
They also review on system performance evaluation and suggest future directions of
CBIR. A few examples of CBIR systems and applications together with the methods
used are introduced in these papers.
Mehtre, Kankanhalli, & Wing-Foon (1997) present a work of comparison on shape
measures for CBIR. They have tested the effectiveness of eight shape measures –
boundary- and region- based, for the purpose of content-based shape similarity retrieval
of images on advertisements. The other example (Iqbal, Odetayo, & James, 2012)
proposed a new CBIR approach for biometric security, which combined three well-
known algorithms – color histogram, Gabor filter and moment invariant. Their work
shows that combined features are better than the individual features for effective image
retrieval.
Instead of combining the features to represent the image, Arevalillo-Herráez, Domingo,
& Ferri (2008) proposed a method to combine a given set of dissimilarity functions
whereby for each similarity function, a probability distributions is built for similarity
comparison purposes.
In terms of image classification, Park, Lee, & Kim, (2004) proposed a method of
content-based image classification using a neural network for the texture feature using
the back-propagation learning algorithm. However, Wong & Hsu, (2006) presented a
scaling and rotation invariant encoding scheme for shapes. Support vector machines
(SVM) and artificial neural networks (ANN) are used for the classification of shapes

51
encoded by the proposed method. The results show that SVM achieved better
performance than ANN did.
In order to improve the relevant retrieved images, there are a few works such as (Stejić
et al., 2003; Xin & Jin, 2004; Duan et al., 2005) focus on relevance feedback that
involves user interaction with the retrieval system. Most of the works show that, the
retrieval performances get better compared to the typical CBIR system.
One of the common issues in CBIR is semantic gap (Smeulders et al., 2000), which
affected the efficiency of retrieval. As mentioned in (Liu, Zhang, Lu, & Ma, 2007), in
order to improve the retrieval accuracy of CBIR systems, research focus has been
shifted from designing sophisticated low-level feature extraction algorithms to reducing
the semantic gap between the visual features and the richness of human semantics.
As mentioned in (Deselaers, Keysers, & Ney, 2008), a common problem in image
retrieval is the performance evaluation. It is difficult to compare the available systems,
because no common performance measure for image retrieval has been established and
even constructing a performance measure is difficult since the success or failure of an
image query strongly depends on the requirements of the user. Thus, as mentioned in
(Müller, Müller, Squire, Marchand-Maillet, & Pun, 2001), performance evaluation
methods can be measured based on user comparison, single-valued measures and
graphical representation. Generally, most of the measurements are based on the
Precision and Recall values as mentioned in (Müller et al., 2001; Deselaers et al., 2008;
Manning, Raghavan, & Schütze, 2008; Davis & Goadrich, 2006; Deselaers et al., 2004;
Hua, 2009).

52
II. Techniques in CBIR approach
a) Image representations
A digital image is visual information that is represented in digital form (Hunt, 2010).
The visual content of an image or low-level image feature such as color, shape, texture
and spatial layout are used to represent the image (Feng et al., 2003).
(i) Color
A color model is an abstract mathematical system for representing colors (Hunt, 2010).
Since color is a three-dimensional entity, a color model defines three primary colors,
which correspond to three dimensions. Numerous color models are commonly in use
and well suited for a certain class of applications. These include RGB, CMY, CYMK,
HSB and NTSC color models (Rodrigues, 2001).
(ii) Shape
As stated in (Sonka, Hlavac, & Boyle, 1998), the shape descriptor is some set of
numbers to describe a given shape and the descriptors for different shapes should be
different enough so that the shapes can be discriminated. In Castañón, Fraga, Fernandez,
Gruber, & da F. Costa (2007) mentioned, the set of features (object description /
descriptor) to be used in pattern recognition (to represent the object / object
representation) is strongly dependent on the characteristic of the image domain. As
mentioned in (Mehtre et al., 1997), shape description techniques can be broadly
categorized into two types, boundary based and region based. Boundary based methods
look into the contour or border of the object shape and completely ignore its interior
whereby region based methods look into internal details inside the object shape. There
are many discussions on shape description / descriptor to represent the shape. Some
well-known boundary-based methods are chain codes (Richard, 1996) and Fourier
descriptors and their extended algorithms such as UNL Fourier (Zhang & Lu, 2003;

53
Kunttu, Lepistö, Rauhamaa, & Visa, 2006; El-ghazal, Basir, & Belkasim, 2009;
Agarwal, Venkatraghavan, Chakraborty, & Ray, 2011). Invariant moments (Belkasim,
Shridhar, & Ahmadi, 1991; Zhao & Chen, 1997; Zhu, De Silva, & Ko, 2002; Jin Liu &
Zhang, 2005; Papakostas, Karakasis, & Koulouriotis, 2010; Yuanbin, Bin, & Tianshun,
2010), profile (Ritter & Schreib, 2001; Efraty, Bilgazyev, Shah, & Kakadiaris, 2012),
and Zernike moments (Miao, 2000; Gu, Shu, Toumoulin, & Luo, 2002; Kan & Srinath,
2002; Hwang & Kim, 2006) are other examples of region-based method.
(iii)Texture
In Liu et al. (2007) mentioned, texture is not really well defined like color and shape
features. This feature is suitable for representing the content of real world images such
as tree, brick, fabric (Ben-Salem & Nasri, 2010; Wang, Georganas, & Petriu, 2011) and
fruit skin. It can be classified into two categories i.e. structural and statistical. Structural
methods such as morphological operator and adjacency graph describe texture by
identifying structural primitives and their placement. Statistical methods including
Tamura features (Islam, Zhang, & Lu, 2008; Qi, 2009), Markov random field (Gleich,
2012; Ng, Hamarneh, & Abugharbieh, 2012) and wavelet transform (Ruttimann et al.,
1998; Sun, Wang, & Yin, 2009), characterize texture by the statistical distribution of the
image intensity (Sanchez, Petkov, & Alegre, 2005).
b) Classifiers
Once the set of features is extracted and turned into features vector, next is to choose the
classifier for object matching. For object matching, there are many approaches that have
been proposed and (Mehtre et al., 1997) stated it is based upon the image representation
methods. However, as mentioned in (Bradski & Kaehler, 2008), often the choice of
classifier is dictated by computational, data or memory considerations. Generally, there

54
are two main methods of image classification, supervised and unsupervised
classification (Santos, 2009). As for supervised image classification such as Bayes
(Shastri & Mani, 1997; Abe & Kudo, 2006; Barshan, Aytaç, & Yüzbaşıoǧlu, 2007;
Chen & Peter Ho, 2008; Liu, Sun, Liu, & Zhang, 2009; Wu & Li, 2009), K-nearest
(Hattori & Takahashi, 2000; Liu & Nakagawa, 2001; Du & Chen, 2007) and distance
functions (Di Gesù & Starovoitov, 1999; D. Zhang & Lu, 2003; Zuo, Zhang, & Wang,
2006; Wang, Hu, & Chia, 2011), the sample of known classes is provided so that the
classification algorithm can differentiate one class from the other. Whereby, the
unsupervised image classification such as clustering algorithm (Kim & Oommen, 2007),
the basic information on how many classes are expected to be presented on the image is
provided in classification algorithm and the algorithm attempts to identify those classes.
This topic is further discussed in the following sections.
c) Similarity comparison
Regardless of the method used for classification, the similarity comparison between
images is then calculated which rely on some distance measurements such as Euclidean
distance (Li & Lu, 2009), Mahalanobis distance (Xiang, Nie, & Zhang, 2008),
correlation (Ma, Lao, Takikawa, & Kawade, 2007) and others. As a result of similarity
based image retrieval, a set of closely matching images is indexed based on the
classifier used.
d) User interactions
Another aspect in CBIR system is user involvement. Thus user interface is needed in
order for user to communicate with the system and as stated in (Feng et al., 2003), user
interfaces in image retrieval system typically consists of a query formulation part and a
result presentation part.

55
Feng et al. (2003) mentioned, there are few methods for query specification such as
query by example, query by sketch, query by concept, and category browsing. Again,
the method used for the query is depending on the application itself. However, the most
common methods use for querying are query by example such as in (Google, 2012; Inc.,
2012) and query by sketch such as in (Daoudi & Matusiak, 2000; la Tendresse & Kao,
2003).
In order to get more relevant retrieved images, relevance feedback method is used for
user to refine a list of ranked retrieved images according to a predefined similarity
comparison. In Xin & Jin (2004) and Duan et al. (2005) present the utilization of
relevant feedback using Bayesian network to improve the retrieval effectiveness. Wei &
Li (2006) as well applied learning algorithm in relevance feedback to improve the
retrieval performance.
III. Issues in CBIR
Many open issues have been discussed and suggested (Rui et al., 1999; Smeulders et al.,
2000; Shandilya & Singhai, 2010) to improve the typical CBIR approach such as
involving user interaction, integration of multi-disciplines approach, relevance feedback
and reducing semantic gap. The main purpose of these improvements is to enhance the
efficiency of image retrieval.
Most previous works focused on image representation (Krishnapuram et al., 2004; Wei
et al., 2006; Lamard et al., 2007; Sergyan, 2008), classifier algorithm (Xin & Jin, 2004;
Duan et al., 2005; Liu et al., 2008), the use of image database (Kak & Pavlopoulou,
2002), and relevance feedback (Stejić et al., 2003; Zhang et al., 2003; Ortega-
Binderberger & Mehrotra, 2004; Wang & Ma, 2005; Wei & Li, 2006) to enhance the

56
CBIR system. However, as mentioned in (Liu et al., 2007), research focus has been
shifted into reducing the semantic gap and had identified five major categories of the-
state-of-the-art techniques in narrowing it down i.e. (i) using object ontology to define
high-level concepts, (ii) using machine learning methods to associate low-level features
with query concepts, (iii) using relevance feedback to learn users’ intention, (iv)
generating semantic template to support high-level image retrieval, and (v) fusing the
evidences from HTML text and the visual content of images for WWW image retrieval.
On the other hand, as stated in (Torres et al., 2004), the implementation of CBIR
systems raises several research challenges such as (i) new tool for annotating need to be
developed to deal with the semantic gap presented in images and their textual
descriptions, (ii) automatic tool for extracting semantic features from images, (iii)
development of new data fusion algorithm to support text-based and content-based
retrieval when combining information of different heterogeneous formats; (iv) text
mining techniques to be combined with content-based descriptions, and (v)
investigating user interfaces for annotating, browsing and searching based on image
content.
Regarding the idea to reduce the semantic gap between the visual (low-level) features
and the richness of human semantic (high-level features), a completely new works in
this direction is in progress. These are including (Lin, Chang, & Chen, 2007) proposes
the integration of textual and visual information for cross-language image retrieval;
(Zhang, Huang, Shen, & Li, 2011) presents automatic image tagging automatically
assigns image with semantic keyword called tag, which significantly facilitates image
search and organization; (Aye & Thein, 2012) presents a retrieval framework which can
support various types of queries and can accept multimedia examples and metadata-

57
based document; and (Lee & Wang, 2012) presents a utilization of text- and photo-
types of location information with a novel approach of information fusion that exploit
effective image annotation and location based text-mining approaches to enhance
identification of geographic location and spatial cognition.
IV. Existing CBIR systems
There are many CBIR systems ranging from research or demo prototype to commercial
search engines. The use of CBIR systems in commercial line is quite a lot such as
Google Image Search (Google, 2012), Visual Image Search (pixolution, 2012), TinEye
(Inc., 2012), Macroglossa Visual Search (MACROGLOSSA, 2010), and
IMMENSELAB (LLC, 2011).
On the other hand, many CBIR systems were proposed as research or demo prototype,
and are being developed in universities and research laboratories. These are including
SIMBA (Siggelkow, 2001), CIRES (Iqbal & Aggarwal, 2002), FIRE (Deselaers, 2009),
PIBE (Ciaccia, Bartolini, & Patella, 2004), and Pixcavator (Saveliev, 2007-2010).
Furthermore, some of these CBIR systems do not only look at the content of their
images but also embedded with metadata query in order to return retrieved images that
match a particular query.
a) Google Image Search (http://images.google.com/)
Google Image Search is a Google's CBIR system. Query specification follows the query
by example using external images. However, it does not work on all images. Metadata
query function is also provided.

58
b) Visual Image Search (http://pixolution.does-
it.net/fileadmin/template/visual_web_demo.html)
Visual Image Search is a CBIR search engine by pixolution. The images are searched
and retrieved based on the color feature, which is the query specification follows the
query-based browsing using internal images. As to finding similar images, query
specification follows the query by example using external or internal images.
c) TinEye (http://www.tineye.com/)
TinEye is a CBIR site for finding variations of web images, by Idee Inc. The number of
images in the database is approximately 1800M. For image retrieval, query specification
follows the query by example using external images as well as by entering the image
address from any website.
d) Macroglossa Visual Search (http://www.macroglossa.com/)
Macroglossa is a visual search engine based on the comparison of images, coming from
an Italian Group. For image retrieval, query specification follows the query by example
using external images or query by category such animals, biological, panoramic, artistic
or botanical. Macroglossa supports all popular image extensions such jpeg, png, bmp,
gif and video formats such avi, mov, mp4, m4v, 3gp, wmv, mpeg.
e) IMMENSELAB (http://www.immenselab.com/)
IMMENSELAB is a CBIR search engine by KBKGROUP. For finding similar images,
query specification follows the query by example using external or internal images and
by entering the image address from any website. Search methods included in this system
are RGB diff, background, shape and category.

59
f) SIMBA - Search IMages By Appearance (http://simba.informatik.uni-
freiburg.de/)
SIMBA is a demo system by the Institute for Pattern Recognition and Image
Processing, Albert-Ludwigs-Universitet Freiburg (Germany). Currently, in their
database they have nearly 2500 photograph images. Query specification follows the
query by example using external or internal images. The approach used in this system is
based on invariant features (Siggelkow, Schael, & Burkhardt, 2001).
g) CIRES (http://cires.matthewriley.com)
CIRES is developed by Computer & Vision Research Center at the University of Texas
at Austin. Currently, in their database they have 57,847 images, which were extracted
from royalty free image databases and the Flickr website. Query specification follows
the query by example using external or internal images as well as query-based
browsing.
h) FIRE - Flexible Image Retrieval Engine (http://code.google.com/p/fire-cbir/)
FIRE, is an image retrieval system designed for research in this area. The main aim of
FIRE is to investigate different image descriptors and evaluate their performance
(Deselaers et al., 2008). FIRE was developed in C++ and Python and is meant to be
easily extensible.
i) PIBE - Personalizable Image Browsing Engine (http://www-
db.deis.unibo.it/PIBE/)
PIBE is an adaptive image browsing system, which aims to provide users with an
intuitive, easy-to-use, structured view of the images in a collection and complements it
with ideas from the field of adaptable content-based similarity search. In particular,
60
PIBE provides users with a hierarchical view of images (the Browsing Tree) that can be
customized according to user preferences. A key feature of PIBE is that it maintains
local similarity criteria for each portion of the Browsing Tree. This makes it possible
both to avoid costly global reorganization upon execution of user’s actions and,
combined with a persistent storage of the Browsing Tree (BT), to efficiently support
multiple browsing tasks.
j) Pixcavator image search
(http://inperc.com/wiki/index.php?title=Pixcavator_image_search)
Pixcavator image search is a similar image search based on topological image analysis.
It is an image-to-image search engine. Pixcavator finds objects in the image. They are
automatically captured inside contours and listed in a table along with their sizes,
locations, and other characteristics. Pixcavator is a desktop-based application and is
developed by a private company, Intelligent Perception.
A more complete examples and descriptions of current existing CBIR systems can be
found in Wikipedia – List of CBIR engines (Engines, 2012).
The CBIR approach has been used as well in several applications such as face
identification, digital libraries, historical research, medical and geology. It is probably
the most useful application in biology. In this study, some of these applications are
presented as follows but the scope is limited to medical and biology applications.
a) Medical applications
CBIR approach has been widely applied in medical for teaching, research and
diagnostics on diseases. The benefits and future directions have been discussed in

61
(Müller, Michoux, Bandon, & Geissbuhler, 2004). In (Kak & Pavlopoulou, 2002),
CBIR is used to automate retrieval from large medical image databases and presented
solutions to some of them in the specific context of HRCT images of lung and liver.
(Scott & Chi-Ren, 2007) presents a knowledge-driven multidimensional indexing
structure for biomedical media database retrieval. While in (El-Naqa, Yongyi,
Galatsanos, Nishikawa, & Wernick, 2004; Rosa et al., 2008), they used CBIR approach
for digital mammographic masses. In improving retrieval efficiency, some of the works
such as mentioned in (Demner-Fushman, Antani, Simpson, & Thoma, 2009; Hsu,
Antani, Long, Neve, & Thoma, 2009; You et al., 2011), they have combined the
metadata approach into CBIR approach.
b) Biology applications
As mentioned previously, biologists produce a vast number of digital images. These
images can be used for identification as well as for teaching and research. (Wang et al.,
2012) presented a work on butterfly family identification using CBIR, while (Sheikh et
al., 2011) developed CBIR system for various types of marine life images. Mallik,
Samal, & Gardner (2007) developed a content-based pattern analysis system for a
biological specimen collection and Chen, Bart, & Teng (2005) developed a CBIR
system for fish taxonomy research. As stated in Wang et al. (2012), CBIR is applied
because of its capacity for mass processing and operability.
However, because of the heterogeneous data, complexity of the biology images as well
as the images descriptions are often ignored and are attached together with the images.
There are few works such as mentioned in (EKEY, 2012; Torres et al., 2004; Murthy et
al., 2009) to enhance the CBIR capability.

62
C. Comparison of Approaches
(i) Image representation
Text-based approach typically requires proper parameters or vocabularies to describe an
image. These parameters or vocabularies can be specific based on the image domain or
broad. Conversely, in content-based, features such as shape, color, texture or spatial
domain are fixed to represent the visual information of an image in any domain.
(ii) Image matching
In text-based approach, images are retrieved based on the word comparison; where two
images are similar if they have the same text value. Compared to content-based
approach, images are retrieved based on the visual comparison. Thus, a classifier is
needed to classify the images.
(iii)Retrieved images order
The result of retrieval, in text-based approach, retrieved images is listed in unsorted
order, thus producing an unranked image list; while in the content-based, retrieved
images is listed in sorted order because the distance between the query image and
training images is calculated. This distance is then sorted in increment or decrement
order and produced a ranked image list.
(iv) Accuracy of retrieved images
The accuracy of retrieved images in content-based is much higher than text-based
approach. This is because an image is represented semantically in content-based;
compared to text-based, where usually an image is annotated with wide-ranging words.

63
(v) Data modeling
Content-based approach requires no data modeling; while in text-based approach, data
modeling must store the image annotations in structured or unstructured manner.
(vi) Application domain
Text-based approach is widely used as search engine in many applications such Google,
Yahoo and Bing, while content-based approach is mostly used in specific domain
application.
2.5 Image Classification Methodologies
A digital image is composed of pixels and is represented in numbers in a
multidimensional space. In the spectral band, each pixel, x consisted of the values of x1,
x2, .., xn, and usually refer to the brightness or the level of the gray for that pixel. On the
contrary, in the feature space for a classification task, each pixel value forms a vector or
also called the feature vector. Image classification (in the point of image processing and
analysis) can be interpreted as pixel classification, a process in which every pixel in an
image is assigned to a class or category on the image (Santos, 2009).
This section presents the available classifiers that can be used for image classification
and the methods for image classification are also discussed.
2.5.1 The classifiers
To accomplish the image classification task, given the inputs, a pattern recognition
system will require the use of an appropriate classifier. In particular, as mentioned in
(Duda, Stork, & Hart, 2001), there are various approaches and it includes parametric
techniques such as Bayesian estimation, Maximum-likelihood estimation, Hidden

64
Markov Models, Expectation-Maximization, Linear Discriminant Functions, Neural
Network and Stochastic methods; Non-parametric techniques such as K-Nearest-
Neighbor and Fuzzy Classifications; and Non-metric methods. Examples of each
technique including methods are described below:-
a) Bayesian classification (Santos, Ohashi, Yoshida, & Ejima, 1997; Duda et al.,
2001)
This approach is based on statistical approach that uses probability. The determination
to which class region the input pattern belongs to are calculated and expressed in
probabilistic measures. This approach as well is known as Naïve Bayes classifier.
The classes in a classification task can be denoted by
The probability that the correct class for is is given by
( | ) ( | )
To decide which class is the best for the pixel , the largest ( | ) should be
selected.
( | ) ( | ) Equation 1
However, the problem with these ( | ) is when to determine the class for pixel are
unknown. The probability to find a pixel from class in position
( | ) can be estimated if all the classes have enough samples. In other words, if there
are classes, there would be values for ( | ) denoting the relative probabilities
that the pixel belongs to class . This relation between ( | ) and ( | ) is given
by Bayes’ theorem:

65
( | ) ( | ) ( )
( ) Equation 2
Where ( ) is the probability that the class occurs in the image also known as a-
prior probability and ( ) is the probability of finding a pixel from any class at position
.
By removing p(x), this equation is used to change Equation 1 to
( | ) ( ) ( | ) ( ) Equation 3
This approach can be used for classification if the prior probabilities are known.
However, in the real case of applications, to have a complete knowledge about the
probabilistic structure of the problem is very exceptional.
b) Maximum-likelihood estimation (Santos et al., 1997; Duda et al., 2001)
This approach is one of the parameter estimation techniques. General knowledge about
the data and parameters are commonly known in supervised classification. However, the
limitation is how to use the provided information to train the classifier. Thus
corresponding to this limitation, the samples are used to estimate the unknown
probabilities and probability densities and the resulting estimates are used, as those are
true values.
The Maximum-likelihood assumes that the classes are unimodal and distributed. Its
discriminant function is given by:
( ) ( )
| |
( )
∑ ( ) Equation 4
Where ( ) is a-prior probability for class , and are the mean and covariance
matrix for the data of class and | | is the determinate of the covariance matrix. The
classification is done by choosing the maximum ( ) for all classes .

66
This classifier will attempt to classify a pixel regardless of its likelihood. In normal
distributions for the classes, the tails for the histograms for the classes will have very
low values and with certain conditions, the pixels could be assigned to those classes.
c) Support Vector Machine (SVM)
One of the techniques in the linear discriminant analysis is SVM, where it relies on
preprocessing the data to represent patterns in a high dimension (Duda et al., 2001).
In formal definition as mentioned in (Duda et al., 2001), within an appropriate non-
linear mapping ( ) To a sufficiently high dimension, data from two categories can
always be separated by a hyperplane. Each pattern is assumed to be transformed to
( ). For each of the patterns, , we let , according to
whether is in or . A linear discriminant in an augmented space is
( ) Equation 5
Where both the weight vector and the transformed pattern vectors are augmented (by
and , respectively. Thus, a separating hyperplane ensures
( ) Equation 6
The goal in training a SVM is to find the separating hyperplane with the largest margin
where the larger the margin, the better generalization of the classifier. The distance from
any hyperplane to a transformed pattern is | ( )| ‖ ‖⁄ , and assuming that a positive
margin exists, Equation 6 implies
( )
‖ ‖ Equation 7
Where the goal is to find the weight vector that maximizes .

67
d) Back-Propagation Neural Network
This technique is one of the multilayer neural network approaches whereby the
parameters governing the nonlinear mapping are learned at the same time as those
governing the linear discriminant. Since this approach admit fairly simple algorithms
where form of the nonlinearity can be learned from training data. Thus, the models are
extremely powerful, good theoretical properties and well applied in many real world
applications (Duda et al., 2001).
This classifier can use labeled input samples to estimate the parameters for a set of
hyperplanes that will partition the feature space in most cases. The parameters for these
hyperplances will be given by the weight of the network, which are the values that are
altered between iterations of the training steps.
In the training of the network to estimate the hyperplanes parameters involves
presenting to the network the input values, applying the weights, comparing the network
output to the expected results, and readjusting weights that correspond to the line slopes
and interceptions. It performs until the difference between the network output and
expected values is small enough or a maximum number of training steps is achieved
(Santos et al., 1997).

68
Figure 2.14 shows the summarized flow chart depicted from Lee (2008).
Figure 2.17: Back-Propagation Neural Network procedures
The steps of this procedure are as follow:-
Step 1: Initialize all weights to small random values within the range.
Step 2: Given the input vectors and output vectors.
Step 3: Compute the output values in a feed-forward direction for each unit of each
layer.
Step 4: Use the values computed by the final layer units and the corresponding target
value to compute the delta quantities.
Step 5: Compute the deltas for each of the preceding layers by back propagating the
errors.
Step 6: Update all weights.
Step 7: Return to step 2 and repeat for each pattern until the iteration has reached.
Step 8: Stop the procedure of training once the iteration is reached.

69
e) Other methods
Stochastic methods could be considered when the models become more complex
whereby the naïve approach would not be able to deal with exhausted search and
impractical for real-world problems (Duda et al., 2001). Sophisticated search for finding
suitable model parameters might be appropriate when the prior knowledge and training
data are lessen.
Duda et al. (2001) mentioned that, there are two general approaches i.e. Boltzman
learning and genetic algorithms. Boltzman learning is based on concepts and techniques
from statistical mechanic in physics; on the other hand, genetic algorithms are based on
concepts of the mathematical theory of evolution in mathematics.
Thus far, all the classifier examples are based on feature vectors of both real and
discreet numbers. The other classifiers such as decision tree-based and syntactic-based
are implemented using logical rules. This approach is also known as non-metric where it
comprises lists of nominal attributes (strings) in unordered or ordered form.
Examples of the decision-based approach include methods such as CART, ID3 and
C4.5, rely on answers to a series of questions, typically in binary for classification.
From the questions, the tree is grown, initially at the root node and dividing into more
leaf nodes. This approach is flexible and suitable for many applications.
Furthermore, syntactic-based approach such as grammatical pattern is suitable for
solving classification in structural information. In any case, the structural information is
brokendown hierarchically whereby the top most is usually abstract description for the

70
pattern and further down the hierarchy contains the sub-patterns in simpler structural
information (Duda et al., 2001).
2.5.2 The methodologies
The above section described the various forms of classifier for image classification, all
of which could be used in any methods of image classification both supervised and
unsupervised.
A. Supervised classification
Supervised classification is the approach that uses samples of known character to
classify pixels of unknown character. The classifier needs to be trained how it can
differentiate one class from another class, whereby it can be done by providing samples
of known pixels that should be assigned to a particular class. The classifier will then use
the provided information to classify the unknown pixels of the image.
Depending on the nature of the data to be classified, different methods might yield
different results. Most of the classifiers require, as input, samples of all the classes that
will be used in the classification process. The signatures from those pixels will be
calculated to represent the corresponding classes. The signatures or also called
descriptors for the classes often contain statistical information about the pixel used as
samples.
To create signatures for training the supervised classification classifier, the region on
the image needs to be identified and those pixels are used to calculate the signature.
This is involving the iterative process for each class whereby one or many sample
regions can be used.

71
B. Unsupervised classification
On the other hand, in the unsupervised classification approach, the basic information
such as a number of expected classes present on the image is given and the classifier try
to obtain the classes by analyzing the distribution of the pixels in the image. Usually, it
is based on the assumption that the pixels belongs to the same spectral classes, would be
closed in the feature space and they would form clusters that can be detected (Santos et
al., 1997).
In the clustering approach, normally, a number of clusters will be provided to the cluster
classifier. From the result, depending on the required parameters, clusters can be
merged or separated and this iterative process is repeated until the classifier decides it
has reached a stable state (Duda et al., 2001). This process resulting in clusters
represents the classes and the pixels assigned to these clusters are considered classified.
C. Comparison of the methodologies
(i) Prior knowledge for classification
There is no extensive prior knowledge of the classes that is required for unsupervised
classification. Unlike supervised classification, it requires featured knowledge of the
classes for classifying purposes.
(ii) Unique class recognizing
In supervised classification, the unique class will be put into unrecognized class and
could unintentionally be incorporated into other classes and creating error during the
classification process. On the contrary, in unsupervised classification, the unique classes
are allowed to be recognized as distinct or other objects.

72
(iii)Possibility of human error
In unsupervised classification, opportunity of human error can be minimized because
the information provided to the classifier is basic information such as expected number
of classes present on the image or there might be constraints governing the distinctness
and consistency of groups. However, in supervised classification, featured knowledge of
the classes is required and human gives this information, and in such situation human
error can be considerably high.
2.6 Summary
This chapter provides the findings of current status of biodiversity databases as well as
the automated identification systems specifically in biology. These two are the main
automated applications that can assist and support biologists in running their research
works. There are many biodiversity databases and there are not much different from one
to another. But from the findings, specifically in image retrieval information, it can be
said that, the images from the databases are retrieved using text query. Moreover, in
many automated identification systems, the systems work well in identifying the
organisms at species level for both plants and animals. However, the image description
is often ignored and it leads toward insufficient information to the users.
Furthermore, specifically in image retrieval, there are two methods of retrieval i.e. text-
and content- based image retrieval. In text-based image retrieval, it depends on how the
images are annotated with text descriptions in string so that it can be retrieved. On the
contrary, CBIR method depends on the visual information that can be derived from few
procedures such as image processing and analysis, and extracted information will be
used for image classification based on pattern recognition. Both methods have

73
advantages and disadvantages and the same problem of both may lead user to retrieve
irrelevant images.
In summary, biology data is heterogeneous, contains complex images and are normally
well described. Some of the query cannot be expressed in words. Thus, it leads user to
query the information based on image query whereby not so many biodiversity
databases can provide this function. To achieve this, CBIR method can be used to solve
this problem. Image classification in conventional CBIR approach is based on the use of
a classifier to classify the images. However, one of the CBIR limitations is the semantic
gap. To reduce this semantic gap, approach of image retrieval has been shifted into
integrating text- and content- based information.

74
CHAPTER 3:
PROBLEM DEFINITION
3.1 Introduction
From past studies, all the facts that were gathered are discussed and analysis was
performed on the data to help in identifying the problems and proposing the solution.
Firstly, this chapter defines the problems in each approach involved in image retrieval.
Secondly, based on the problems corresponding to the biodiversity image data
integration, the need for integrating ontology into CBIR approach is presented.
3.2 Problem Definitions
3.2.1 Image data
Biological data is heterogeneous. For instance, biodiversity data specifically in
taxonomy studies contain various types of images and these images are well described.
This information is very important and valuable, and is used for species identification,
teaching and educational purposes. However, these images can only be obtained from
literatures or personal communication from the experts. To make it more useful, it is
recommended to lead it towards an entirely digitized data in the form of database. Since
all the images are digitized, they can be shared and used for future taxonomic analysis
such as automatic species identification based on the diagnostic hard parts.

75
3.2.2 Image processing procedures
Based on the review done on the current existing systems, the systems’ requirements
and features are identified. A summary of the features of these systems is mentioned
and discussed in the previous chapter, Table 2.2. These review and analysis are
important in order to determine the requirements of the proposed solution.
As stated earlier, there are six aspects that are important to be considered when
developing the identification system, i.e. the training images, features to represent the
image, similarity comparison, the classifier, query specification and the expected output
of the retrieval process. Many research studies were done to enhance the recognition
and identification process by looking at a few aspects such as using many features to
represent an image (Krishnapuram et al., 2004; Wei et al., 2006; Lamard et al., 2007;
Sergyan, 2008), improving the algorithm itself (Xin & Jin, 2004; Duan et al., 2005; Liu
et al., 2008), and using a large number of training images (Kak & Pavlopoulou, 2002).
Furthermore, as stated previously, the use of shape is considered for a similarity-based
image retrieval system for monogenean haptoral bars. Generally, shapes have both
boundary-based (outline or contour) and region-based (details of the interior space
defined by the outline or contour) information that can be used in the recognition
process. There are several methods available for using boundary-based and region based
information as summarized in Table 2.3. It is necessary to decide whether to use
boundary-based information or region-based information to determine the shape for
classifying and comparative purposes. The decision whether to use boundary-based or
region-based information is dependent on the images available for developing the
similarity based system for recognition purpose. For example, in monogenean
taxonomy, illustrated images are used in describing the species and the main issue in

76
such images is the quality of the images, in particular, the thickness and thinness of the
outline, which can affect the methods to be used for defining the shapes.
In this study the effectiveness of using various techniques to represent the shapes of the
haptoral bar are investigated. Thus, the use of pixel mean value, a region-based statistics
to represent the shapes in classifying the training images and unknown query images
were proposed to avoid problems in determining whether to use the inner edge or outer
edge of contour of the illustrated images. The pixel mean value has been used in
Biology by Swain et al. (2011) to extract boundary information and by Wilder et al.
(2011) to extract region information of the basic skeleton of shape (Table 2.3).
In conclusion, based on the review done, few main points are derived:-
(i) All the current systems reviewed performed image pre-processing to ensure that all
images are normalized in terms of the same image size and without noise. The
image pre-processing is done either manually or automatically.
(ii) All systems were working on identification of species on species level using species
whole image.
(iii)Both automated identification and image retrieval systems are built based on pattern
recognition approach.
(iv) Automatic identification system will return the recognized object; while image
retrieval system will return few similar images to the query image.
In this study a supervised similarity based image retrieval system is developed which
requires that the images of the selected hard parts (sclerotisedhaptoral bars) be initially
pre-defined into classes according to their shapes. The resulting classes are validated by
comparing the images using a shape descriptor, which in this case is the shape region

77
statistics, the pixel mean value. The pixel mean values of the different shapes will be
compared within and between the resulting pre-defined classes to validate the manual
classification using Euclidean distance similarity measure, which is a widely used
similarity measure in the Biology domain (see Table 2.3).
3.2.3 Ontology
Based on the review done on ontology-based image annotation and retrieval as stated in
Literature Review chapter, the models’ requirements and features are identified. In
order to develop ontology-based image annotation and retrieval model, there are a few
important aspects to consider such as semantic representation of the image, vocabularies
to be used to describe the image, and methodologies, tools and languages for building
the ontologies.
Organizing data in a manner where the meaning of object is often referred as semantic
representation. To semantically represent the data, vocabularies are needed in order to
describe the data. Advancement in semantic web ontology and metadata languages
equips a new means to annotating and retrieving images. Ontology is the core that is
representing the information structure, thus towards the ontology development process
in specific domain, it involves a number of times refining the process until the ontology
is accepted. Tools as well are important in order to support the development process and
the languages to implement the ontology. The created ontologies are then used for
image annotation and retrieval.
The organization of image data along with textual descriptions can be achieved using
computer readable formats such as in relational database (examples such as Biota
(Colwell, 2010), InsideWood (InsideWood, 2004-2012), MonoDb (Andy & James,

78
2012)) and XML (examples such as Open Microscopy Environment (OME) Data Model
and XML File (Goldberg et al., 2005), knowledge-based grid services for high-
throughput biological imaging (Ahmed et al., 2008), PLAZi (Jesse, 2005-2012)).
However, these formats have their own limitations. Annotations of images in a
relational database are confined by the number of columns used for the descriptions of
the images. The number of characters allowed in a cell of a database table is also fixed.
Any new inclusions into existing relational model with fixed tables and set of fields may
require new schema to be developed and existing queries to be revised. Migration to a
new schema and revision of queries can be very cumbersome and time consuming.
Excessive images stored in a database take up a lot of space and create a huge database
file, affecting retrieval time. Storing images outside the database file in a directory and
linking them via identifiers in the database column was a possible solution but here
again any new inclusion of data will require a change in identifiers. XML is a
technology concerned with the description and structuring of data (Taniar & Rusu,
2010). Annotations of images in XML are not linked and hence the relationships
between objects are not expressed.
In conclusion, based on the review done, to organize data in a manner that focuses on
the meaning of objects by expressing relationships can only be done via semantics,
which provide the necessary vocabulary to link the data. In the semantics representation,
different entities are linked to their properties using appropriate vocabularies (Yu, 2007;
Toby et al., 2009). Thus in this study, the images of monogenean haptoral bars were
annotated in a structured manner with their textual information or descriptions
semantically for retrieval purposes.

79
3.2.4 Image classification
Image classification is one of the tasks in performing image retrieval. Generally, images
can be classified before, during or/and after performing image retrieval. Regardless of
any method, the classifier is needed for image classification purposes.
In a probability approach, the classifier can be optimized if the knowledge of prior
probabilities and the class-conditional densities are known. However, in real
applications, to get the complete knowledge about the probability structure of the
problem is very tricky (Duda et al., 2001). For example, how do we train a classifier
given a set of training data. Thus in order to solve this problem, the parameter
estimation technique can be used by using the samples to estimate the unknown
probabilities and probabilities density (Duda et al., 2001).
Moreover, it should be noted that the discriminant functions could be used for samples
to estimate the values of parameters of the classifier. However, this approach is too
broad and can only be extended when working with appropriate non-linear mapping. It
creates more powerful classifier for training multi-layer specifically in neural networks
architecture.
Thus far, regardless of any classifier, parametric methods of supervised classification
take a statistical approach whereby the parametric values are based on statistical
parameters such as mean, standard deviation and covariance matrix of the pixels that are
in the training sample. On the contrary, non-parametric methods use a set of non-
parametric values to assign pixels to a class based on their location, inside or outside in
the feature space. Classifiers in this method are normally more flexible, use information

80
provided by training samples, and no prior knowledge such as the number of parameters
is provided.
In summary, regarding image classification while performing image retrieval, the
classifier is needed in image matching. However, a selection of classifiers are
determined generally by the complexity of the domain problem such as features to
represent the image and number of classes for comparing in the feature space, as well as
external factors such as computing power and quality of the images also need to be
considered. As mentioned in (Bradski & Kaehler, 2008) often the choice of classifier is
dictated by computational, data or memory consideration. These factors are necessary to
consider as it effects on the classifier performance, whereby it normally can be
measured based on the accuracy of the retrieved images and the time it consumes for
matching process. Complex images may need more features and more classes in the
feature space, thus it may lead into using more powerful processors to get the results in
a short time; or if a less powerful processor is used, then it may consume a long
processing time to get the results. In any situation, the accuracy of the retrieved images
can only be determined after the process ends.
Images also can be classified before and after image retrieval process, for example pre
and post –classification respectively, with or without using classifier. These approaches
could be considered if the performance of retrieved images during image retrieval
process is unsatisfactory. Integrating text-based approach into CBIR approach is one of
the solutions in image pre-classification and relevance feedback is one of the solutions
in image post-classification by refining the retrieved images to get more relevant
images.

81
3.3 Problem of Biodiversity Image Data Integration
The previous chapter discussed generally on the Biodiversity databases. Other than
images, the descriptions of the images are also needed in digitized form so that it can be
shared, accessed and retrieved remotely. However, current biodiversity databases are
split into two types, which are image database and textual database.
Textual databases are well established. The information can be retrieved based on the
textual query such as species’ name, author’s name and others. The information such as
taxon, species distribution, and host are the kind of information that can be retrieved
from these databases. For instance, Parasit-Host database (Gibson et al., 2012) provides
host-parasite information but limited to browsing. Another example MonoDb (Andy &
James, 2012) provides information to parasitologists on the known species of
monogeneans. Information access in MonoDb is limited to textual-based searching.
Meanwhile, the WoRMS – World Register of Marine Species (Appeltans et al., 2012)
provides an authoritative and comprehensive list of names of marine organisms
including information on synonym.
While image database such as Flybase, GCD, SID, and UCD as were mentioned above
are many, however, specialized taxonomic image databases are very limited. In order to
develop a practical system, the restraints such as being cumbersome in image storing
and technical difficulties in dealing with many diagnostic hard parts have to be taken
into account. Moreover, not many people have the interest to work on this since there is
no commercial impact. Normally, the images are retrieved based on the text-based
image retrieval approach.

82
Based on these examples, it can be summarized that, both textual and image databases
exist independently whereby user has to switch between distinct systems before the
extracted information can be combined. Furthermore, specifically in image databases,
image annotations are often ignored. Thus, the information gather from this database is
not informative and not useful enough to user.
As has been noted, textual-based information retrieval has been successfully deployed
and has become easier through efficient indexing techniques. However, for image
retrieval, in many biodiversity image databases, the images are often retrieved based on
text query. Furthermore, some of the query may not be very descriptive or task-
dependent query like describing a shape, thus image query may be needed to retrieve
the similar images. Yet, in any method, most of the time it may lead to retrieving
irrelevant images to a user’s query because text-based image retrieval is lexical
motivated (Avril, 2005) and image-based image retrieval is very subjective.
Performance of the retrieval largely depends on few factors based on the approach used
such as image quality, features or vocabularies to be used to represent the image, and
image annotation techniques.
3.4 Need for Integrated Semantic CBIR Framework
Based on the reviews done in Chapter 2, several main points are derived:-
(i) None of the existing systems use ontology based image annotation and retrieval to
perform image pre-classification. The nearest are the EKEY (EKEY, 2012) and
SuperIDR (Murthy et al., 2009) whereby each image is annotated with certain
parameters such as species name. Thus, the user can customize their search
according to these parameters to find the nearest match to the query image.

83
(ii) All systems reviewed aimed at providing identification of species using species
whole image.
(iii)Biological data is heterogeneous, containing complex images and terminology to
describe the data and is always involving overtime. Thus, graph data is a suitable
approach for text data modeling.
(iv) Both text- and content-based image retrieval approaches have their own advantages.
Yet both approaches have the same limitation, which is, they may retrieve irrelevant
images.
Consequently, in order to improve the efficiency of image retrieval in CBIR approach,
one of the solutions to reduce the semantic gap limitation is by combining text-based
image retrieval into CBIR. By using this approach, it will narrow down the most
relevant images to be used for training set images. Therefore, in this study, image pre-
classification is used to create a sub-set of the training set based on ventral and dorsal of
the haptoral bar images. As a result, the size of the training set becomes smaller and
contains more relevant images. Thus, the expected output of the retrieval process is that
the retrieved image becomes more relevant to the query image.
There are however, a few aspects that are important to be considered when developing
the integrated text- and content- based image retrieval model, i.e. textual data
representation, image annotations, query specification and the expected output of the
retrieval process.
In addition, suitable and proper vocabularies are needed in order to annotate the image
because the images will be retrieved based on the vocabularies. The annotated data is
required to be represented in meaningful, dynamic and flexible manner so that any

84
inclusion of new vocabulary in the future can be done without changing the whole data
structure. As for query specification, both textual and image query are needed. The last
aspect is the output of the retrieval process, which is crucial in determining whether the
retrieval process works well and in an efficient manner. Thus to achieve this, the most
relevance images must be retrieved with their annotation.
3.5 Summary
In summary, the following problems below are identified. In the next chapter, the details
of the proposed solution in conjunction with the identified problems are discussed.
(i) Insufficient image data
- Specifically in parasites domain, most images can be obtained from literatures and
personal communication with the experts. While available images in online parasite
databases are very limited since they are focused on the species images and the species’
egg. Particularly, there are no such work on diagnostic hard parts of monogenean such
as haptoral bar, haptoral anchor, haptor hook and copulatory organ.
(ii) The same problem of both image retrieval approaches is on how to increase the
accuracy of retrieved images.
(iii)The problem of ontology-based image annotation and retrieval where
- Ontology-based approach needs proper vocabularies in order to annotate the images in
meaningful manner
- Images can only be annotated with their annotations once the vocabularies are defined

85
(iv) The problem of content-based image retrieval where
- The correct features need to be addressed to represent the images
- Inconsistency image quality may hamper the image processing and analysis
- A selection of classifier to be used for image classification depends on the complexity
of the domain problem
(v) The problem of biodiversity image retrieval where
- Images are retrieved based on text-based query
- Images annotations are often ignored thus provided insufficient information to the user

86
CHAPTER 4:
SOLUTION OVERVIEW
4.1 Introduction
In the previous chapter, the problems are identified and the details of the proposed
solution in conjunction with the identified problems are presented in this chapter. This
chapter covers the research methodology, which explains in detail how this research is
conducted in order to achieve the objectives of this study. It describes the methods and
technical processes used in order to develop the proposed architecture.
4.2 User Requirements
Based on personal communication with the experts in this field and data gathered and
analysed on the current existing systems, the user requirements were defined. In
addition, the requirements for the model are identified, which includes both functional
and non-functional requirements. The user can be a new taxonomist, non-taxonomist
and general user and the system tester are taxonomist and a specific user.
4.3 Proposed Image Retrieval Models
To achieve the aims of this study, two systems are built whereby the comparison
between these two systems will be measured in terms of the efficiency of retrieval. The
stated approaches have been applied to build the two image retrieval systems, namely
Model 1 and Model 2. Both systems use the CBIR approach for image retrieval and the

87
same images in the image database. All images are pre-processed manually to ensure
that they are in the same standards.
4.3.1 Proposed solution: Model 1
Model 1 is developed based on the typical CBIR approach as shown in Figure 4.1. In
this model, all the images from the image database are used as training set. Thus, a set
of n training images is defined as {Γ1, Γ2, Γ3, .. ,Γn}.
Figure 4.1: Procedural flow of Model 1
4.3.2 Proposed solution: Model 2
Model 2 is the system that preceded image retrieval using ontology and CBIR
approaches as shown in Figure 4.2. In this model, the OBIR layer determines the
training set for CBIR. Ontology-based image retrieval is used as technique to reduce the
training images for the CBIR layer by eliminating the irrelevant images using the text-
based query in OBIR layer. This technique is also referred as data reduction usually
used in data pre-processing to obtain a reduced representation of the dataset, which is
smaller in quantity, yet closely maintains the integrity of the original data.

88
In Model 2, a set of n images is defined as {Γ1, Γ2, Γ3, .. ,Γn}. With the OBIR layer, a set
of n’ training images are produced whereby:-
As a result, a set of n’ training images is defined as {Γ1, Γ2, Γ3, .. , Γn’}.

89
Figure 4.2: Procedural flow of Model 2

90
4.4 Data Gathering Methodology
An image database is an important element in image retrieval systems. In this study, the
images from monogenean class domain are used to build the image database. Overall,
there are a few image databases in the parasitology domain such as Parasite-Host
Database by Natural History Museum (Gibson et al., 2012) and MonoDB (Andy &
James, 2012), as described previously in the Literature Review chapter. These databases
are focuses on the images of the species as well as the species’ egg. Currently, there is
no image database on diagnostic hard parts of monogenean, in particular on such topics
such as haptoral bar, haptoral anchor, haptor hook and copulatory organ.
Monogeneans are parasitic platyhelminths and are distinguished based on both soft
reproductive anatomical features as well as shapes and sizes of sclerotised hard parts of
their haptoral bar, anchor, hook and male and female copulatory organ (see Lim, 1995,
1998; Lim & Gibson, 2007, 2010). The diagnostic features of monogeneans especially
their sclerotisedhard parts are given as illustrations in the literatures. Currently, species
are recognized and identified using morphological and morphometrical characteristics
of the sclerotisedhard parts in the form of illustrated images, and this study is looking at
developing a computerized system to automate image retrieval using these images.
4.4.1 Image digitization
Monogenean images dataset are obtained and extracted from the manuscript as shown in
Figure 4.3.
Images of Malaysian monogeneans (belonging to the order DactylogyrideaBychowsky,
1937) are digitized from the published works of Lim (for example Lim, 1995, 1998;
Lim & Gibson, 2007, 2010; Tan & Lim, 2009) using HP Scanjet 5590 to convert them

91
into digital form and store into the image database. The images of the required
structures, for example haptoral bars, are cropped from the images in the database and
saved as a new image data file.
Figure 4.3: Example of the images from manuscript (Lim & Gibson, 2009)
4.4.2 Image pre-processing
Images in the database are heterogeneous in terms of image quality due to illumination,
contrast, focus, resolution, size as well as scale, which will hamper the process of
recognition (Castañón et al., 2007). Thus, these images need to be pre-processed and
Adobe Photoshop CS is used for image normalization. It is to ensure that each

92
diagnostic hard parts image is clean and in the same standard to avoid inconsistency and
instability in image segmentation. Adobe Photoshop CS is used for this purpose, as it is
easy to use and provide many image processing functions.
Figure 4.4 shows the entire process involved in the image pre-processing. Since all the
images are heterogeneous in term of image quality, thus the manual image pre-
processing is performed to meet the image standards. Even though this manual method
of image pre-processing is more precise, but it is slow and take some time to pre-
process all the images as it involved iteration processes.
Figure 4.4: Image pre-processing flow
4.4.3 Pre-defined classes of monogenean haptoral bar images
A total of 148 haptoral bar images in the Monogenean image database forms the
training set. After a close study on the shapes of these haptoral bars, they are grouped
into six distinct classes as shown in Figure 4.5, for supervised image retrieval. These six
classes were named according to their shapes and abbreviations are used throughout the
thesis, such as the Straight-bar shape is abbreviated as S1 (40 images), U-shape as S2
(39 images), U-shape with side wings as S3 (19 images), V-shape as S4 (12 images), V-
shape with side wings as S5 (35 images), and Star-shape with five processes as S6 (3
images). Memberships of each class are assigned based on visual comparison.

93
Figure 4.5: Six distinct classes of monogenean haptoral bar
Since illustrated images are used and the outlines or contours of the images are not of
the same thickness, region-based information (pixel mean value) is used instead of
boundary-based information.
4.5 Ontology-Based Image Annotation and Retrieval
In this study, the images in the image database are annotated in the form of ontology.
The process of building the ontology is described in detail in the steps below. The
textual information attached to a monogeneanhaptoral bar images are obtained from the
literatures.

94
4.5.1 Structured vocabularies
a) Identifying concepts
Data used in this study are images of the monogenean haptoral bars along with textual
information, which consist of taxonomic classification; diagnostic part as well as image
property, found in literatures. The data is analyzed and structured into main concepts.
Defining these concepts using a standard structured vocabulary is necessary to make
sure the meaning of data is clear and explicit, thus facilitating data sharing and
maximizing reusability in a wide variety of contexts.
The Taxonomic Data Working Group - TDWG (TDWG, 2007) strongly suggests the
deployment of Life Science Identifiers (LSID), the preferred Globally Unique Identifier
technology and transitioning to RDF encoded metadata as defined by a set of simple
vocabularies. The TDWG LSID vocabulary has been widely used in biodiversity and
offers a wide coverage of concepts, which are suitable to annotate the taxonomic
information of an organism. The nomenclature used in this study is from TDWG LSID
vocabulary and where necessary, appropriate vocabularies specific to the
monogeneansare formed (see Appendix A). Specific vocabularies (for example
DiagnosticPartTerms) are needed as Monogeneans are parasitic platyhelminths and are
distinguished based on both soft reproductive anatomical features as well as shapes and
sizes of sclerotised hard parts such as the haptoral bar, anchor, hook and male and
female copulatory organ (Lim, 1995).
Seven concepts are described from the monogenean data used in this study - Specimen,
TaxonName, PublicationCitation, KindofSpecimenTerm, TaxonRankTerms,
PublicationTypeTerms are defined using the TDWG LSID controlled vocabulary,
whereas the DiagnosticPartTerm is a new concept. Specimen concept represents the

95
illustrated images of the haptoral bars of the monogeneans. TaxonName represents a
single scientific name. PublicationCitation represents a reference to the publication of
the monogenean species. KindofSpecimenTerm represents the specimen terms such as
illustration, digital object and still image. TaxonRankTerms represents the taxon rank
terms for taxonomic classification. PublicationTypeTerms represents the type of
publication for example an article in a journal or in a book. DiagnosticPartTerms
represents the name of the monogenean hard parts.
b) Defining properties and relationships
The properties and relationships to bind the concepts described above are needed to
describe them. There are two types of properties for the semantics representation and
they are object properties and datatype properties. Object properties are relationships
between two individuals (linking an individual to another individual), whereas datatype
properties describe relationships between an individual and data values. The properties
defined for the seven concepts are mentioned here and descriptions are available in
Appendix A.
(i) Properties for Specimen concept
Four object properties are defined under the Specimen concept; kindOfSpecimen,
isHaptorBar, isCitedIn, typeForName and three datatype properties; specimenId,
imgDir and imgDescription.
(ii) Properties for TaxonName concept
Eight object properties are defined under the TaxonName concept; rank, isBelong,
part, hasSpecies, hasGenus, hasFamily, hasOrder, isHostedIn and four datatype
properties; nameComplete, authorship, year and locality.

96
(iii)Properties for PublicationCitation concept
Two object properties are defined under PublicationCitation concept; pubType and
lists and five datatype properties; author, year, title, parentPublicationString, and
number.
(iv) Properties for DiagnosticPartTerms, KindofSpecimenTerms, TaxonRankTerms,
PublicationTypeTerms concepts
One datatype property is defined for DiagnosticPartTerms, KindofSpecimenTerms,
TaxonRankTerms, PublicationTypeTerms concepts, which is called definedTerm.
This property is given a generic name, as it will be used to bind multiple concepts
together.
4.5.2 Conceptual framework of the proposed ontology
Seven concepts, 27 properties, and the relationships between them represent
conceptualization of the data used in this study. This conceptual framework needs to be
converted in a machine-readable formal specification to give reason about the identified
concepts and eventually describe the data. This formal specification of shared
conceptualization is called ontology (Gruber, 1995).
The OWL Web Ontology Language is a formal language for representing ontologies in
the Semantic Web. OWL has features from several families of representation languages.
OWL (McGuinness & Harmelen, 2004) is an ontology language for the Semantic Web,
developed by the World Wide Web Consortium (W3C) Web Ontology Working Group.
OWL was primarily designed to represent information about categories of objects and
how objects are interrelated—the sort of information that is often found in ontology.
OWL can also represent information about the objects themselves—the sort of
information that is often thought of as data (Sidhu, Dillon, Chang, & Sidhu, 2005).

97
OWL facilitates greater machine interpretability of Web content than that supported by
underlying XML, RDF, and RDF Schema representations by providing additional
vocabulary along with a formal semantics. In this study, ontologies in OWL format are
utilized to represent shared structured vocabularies that describe the monogeneans
image data through the concepts, properties and relationships discussed above. Figure
4.6 depicts the whole ontology in a graph format.
Graph representation of multiple triple statements (the ovals represent the concepts, the
squares represent the data values in the specific concept and the lines represent the
properties. In like manner, the line with arrowheads and solid lines are directed from the
subject (concept) to the object (concept or data value).

98
Figure 4.6: The ontology in a graph format

99
A detailed example of how triple statements are tied together to form a graph is shown
in Figure 4.7, where the predicate nameComplete links the TaxonNameconcept (subject)
to the object concept, which in this case is the name of the monogenean species.
Figure 4.7: A detailed example of triple statements to form a graph
Since monogeneans species are parasites on fish, frogs and turtles, linking the
monogenean data to their host data will provide more information about the
monogeneans. In this study, the data used are basically of the monogenean species
found in fish, thus a simple Fish ontology with TaxonName concept is built to
demonstrate how the host ontology can be linked to the MHBI ontology. The two
ontologies are merged by redefining the datatype property (isHostedin) in the
TaxonName concept in the MHBI ontology as an object property to merge with the
TaxonName concept in the Fish ontology as shown in the graph model (Figure 4.8).

100
Figure 4.8: MHBI-Fish ontologies in a graph format

101
4.5.3 Biodiversity image data annotation
The data described by concepts is annotated in the form of instances. While there are no
fixed rules to name the instances, nevertheless the names should be reflective of the data
they represent. For example, for the Specimen concept the record of each image of the
haptoral bar or instance is given a unique label that will include its taxon name,
diagnostic part depicted by the image and its sequence number in the directory (as
shown in Table 4.1). There are 148 instances for the Specimen concept, which
represents all the haptoralbars of the monogenean images (see Table 5.2).
For example the record of the image (or instance) of the ventral haptoral bar (vb) of
Bifurcohaptorbaungi Lim & Furtado, 1983 from the fish host Mystusnemurus, which is
the first image in the directory, is labelled as bif-baungi-vb-i1. The naming of instances
and number of instances in all the classes are presented in Table 4.1.
4.5.4 Ontology based image retrieval
The image retrieval system in this study combined classical Boolean search and
SPARQL (Prud'hommeaux & Seaborne, 2008). Jena framework is used as a tool to
access and navigate the ontology. Jena ontology API, convert the ontology into a RDF
graph data format as the ontology is queried in this format, using SPARQL. The object
and datatype properties in Appendix A are used as parameters to formulate the query
and retrieve the images.

102
Table 4.1: Naming of instance and number of instances for each concept
Class Naming of instances Name of instance (in bold) Number of
instances
TaxonName Instance for species is named
according to genus and species
name
Instance of species Bifurcohaptor baungi is labelled as
BifBaungi
591
The full name of genus is used
for naming the genus instance
name
Instance of genus Bifurcohaptor is labelled as
Bifurcohaptor
122
The full name of family is used
for naming the family instance
name
Instance of family Ancylodiscoididae is labelled as
Ancylodiscoididae
35
The full name of order is used
for naming the order instance
name
Instance of order Dactylogyridea is labelled as
Dactylogyridea
10
PublicationCitation Instance for publication is
named according to author and
year
Instance of publication Lim, L. H. S. & Furtado, J. I.
(1983). Ancylodiscoidins (Monogenea: Dactylogyridae)
from two freshwater fish species of Peninsular Malaysia.
Folia Parasitologica. 30, 377 – 380 is labelled as
LimFurtado1983
57
DiagnosticPartTerms The full name of diagnostic part
is used for naming the instance
Instance of haptor sclerotised parts bar is labelled as
HaptorSclerotisedpartsBar
3
KindOfSpecimenTerms The full name is used for naming
the instance
Instance of illustration is labelled as Illustration 3
TaxonRankTerms The full name is used for naming
the instance
Instance of species is labelled as Species 4
PublicationTypeTerms The name of publication type is
used for naming the instance
Instance of journal article is labelled as JournalArticle 4

103
4.6 Image Classification using Ontologies in CBIR
Image classification is a technique to reduce the training images by eliminating
irrelevant images. This technique is also referred as data reduction usually used in data
pre-processing to obtain a reduced representation of the dataset, which is smaller in
quantity, yet closely maintains the integrity of the original data.
In typical CBIR system, all the images in the image database will be used as default
training set images. However, in this study, images to be used as training set images
will be filtered using OBIR.
Each image comes with information based on diagnostic hard part whether dorsal or
ventral of haptoral bars. A subset of the images from the image database is chosen as
the training set, based on the parameters given by the user.
4.7 Content-Based Image Retrieval Methodology
CBIR is designed mainly for visual content, which are illustrations of the monogenean
haptoral bars in this study.
In the CBIR approach, similar images are retrieved based on a user-defined
specification or pattern based on content properties (e.g. shape, color or texture), which
are usually encoded into feature vectors (Wang & Ma, 2005). In this study, the shapes
of the monogenean haptoral bars are used as the content, and since illustrated images
are used and the outlines or contours of the images are not of the same thickness,
region-based information (pixel mean value) is used instead of boundary-based
information. The process of building the image retrieval system using the CBIR
approach is presented below.

104
a) Feature extraction
A pre-classification technique, extracting region-of-interest (ROI) based on selected
polygonal coordinates is used to extract the shape of the image, which is then converted
into region containing pixels. The statistics value on the pixels on a ROI can be
calculated by using only pixels inside the ROI. The shape descriptor used here is the
mean value of all the pixels, , is calculated as follows.
∑
The shape, then represented as follow:-
The shape descriptor is then used as feature vector in the feature space.
b) Defining feature space
Corresponding to the average of all pixels in all regions for a particular class, C a single
mean features vector, meanC in feature space is created as shown in the following
steps:-
(i) Mean features vector, meanC (mean value of all the pixels in the region, ) is
calculated for each class to represent the central point for each class.
(ii) For class k, is the mean of the pixel values, x, for region, r. The mean of the pixel
value for region r, is the sum of all the pixel values, divide by number of
pixels within the region, n.
∑
(iii)The mean features vector for class k, , is represented as follows:
[ ]

105
(iv) To obtain the mean features vector for each class, r the above steps (ii and iii) are
repeated.
(v) The mean features vector, vector is used as signatures for validation of the
groups and for classification of the unknown query images.
(vi) The mean of all pixel values is also calculated for unknown class, u, where u refers
to unknown query image.
The mean features vector for each class will be used as signatures for the classes in the
next step.
c) Similarity comparison
Euclidean distance, ε between mean pixel of unknown class and the signatures of each
class are calculated and the shortest distance is considered as the nearest match to the
class as shown in the following step:-
(i) The Euclidean distance is calculated by subtracting the pixel mean value of the
unknown class, u and the signatures of each of the six classes.
√∑( )
d) Indexing and retrieval
Corresponding to the nearest signature in the feature space, Minimum distance is
preferred. Euclidean distance, ε vectors from the similarity comparison is then indexed
in ascending order.

106
4.8 Summary
This chapter summarizes the overview of the proposed solution. The materials and
methods used for the development of image retrieval system were described. The
existing image databases that can be used in this study were insufficient. Thus new
image database was developed using primary data set gathered by local expert. Prior to
building this database, the image data was collected and pre-processed using the
described methods. This image database is used for image retrieval systems.
Image retrieval methods were also described in this chapter. Generally, an image or a
set of images from image database can be retrieved using metadata or content –based
image retrieval. Yet, since both methods have their limitations, thus in this study, these
two approaches were integrated to propose a new solution towards biodiversity image
retrieval. This solution adopts the image pre-classification technique. The purpose of
this technique is to filter the images to be used for a training set before the training set
can be used in CBIR system. On top of that, ontology-based approach is used for image
annotation and retrieval to classify the images.
The proposed solution is presented in the next chapter. Two systems are built based on
these approaches and compared for efficiency of retrieval performance.

107
CHAPTER 5:
SYSTEM DESIGN,
IMPLEMENTATION
AND TESTING
5.1 Introduction
This chapter describes the system design and implementation in order to fulfill the
requirements defined. From the design phase, the design models are transformed into a
form that can be used on a computer using selected development tools during the
implementation phase. Testing procedures and experimental results are also presented
and further discussed in this chapter.
5.2 System Design
System design is the process to define the system architecture, interface and data for the
model in order to satisfy the specified requirements. In this phase, several aspects have
been taken into account. These include the interaction between the model and its
environment and the dependencies with other factors such as user interface and data to
be used in order to solve the problem statement. The outcome of this phase will then be
used during system implementation, when the system is fully developed.

108
5.2.1 System architecture
System architecture is the overall organization of a system, broken into several
components called sub-systems. A sub-system is a package of classes, association,
operation and constraint that are interrelated, reasonably well-defined and have a simple
interface that are interrelated with other sub-system (Bass, Clements, & Kazman, 2003)
As was mentioned in earlier chapters, two CBIR models were developed. Model 1 is
developed using typical CBIR approach; while Model 2 is developed using both the
ontology and CBIR approaches. Figure 5.1 and Figure 5.2 show the system architecture
for Model 1 and Model 2 respectively, in three-tier architecture.
The backend database layer for both systems contains Monogenean Image Database,
which consists of the images to be used for image retrieval and for visual display
purpose. Model 2 is different in the sense that it contains the MHBI-Fish Ontologies,
which has text annotation of the images to perform as textual data storage.
A user query is processed in the web application layer and both systems use the same
CBIR application. As mentioned earlier, in Model 2, an additional OBIR application
exists to perform image pre-classification task. In Model 1, once a user query is
processed; all the images are collected from image database are used as training set
images for CBIR. While in Model 2, a user query is processed using two layers; the
OBIR application collects the images from image database to be used as training set
images; and the collected images then are used for CBIR.

109
Figure 5.1: Image retrieval architecture for the Model 1

110
Figure 5.2: Image retrieval architecture for the Model 2

111
The architecture also includes the client-tier, which has a query interface and results. A
graphical query interface is provided for a user to communicate with the web
application. The interface collects the information from the user and displays the
retrieved results to provide interpretation of the results retrieved. In both systems, the
retrieved results contain the retrieved images in the ranked order. However, additional
information is provided in Model 2, which are the images annotations.
5.2.2 Prototype process model for ontology development
Comparing the process to the other data modeling methodology, there is no specific
methodology in ontology process development (Corcho et al., 2003; Avril, 2005).
Therefore, in this study as proposed in the Avril (2005), evolutionary prototyping model
is used as a suitable process type. Vocabularies uses in Biodiversity field are evolving
overtime. Thus, new inclusion vocabularies in this ontology might be needed in the
future. Based on this justification, Figure 5.3 shows the evolutionary prototyping model
used in this process as proposed by Avril (2005). By choosing this model, the ontology
can be enhanced from time to time without adjusting the whole data structure and
ontology testing can proceed likewise to improve the requirement in the future. The
created ontology is used for ontology-based image retrieval.
Figure 5.3: Ontology development using evolutionary prototyping model

112
5.2.3 User interface design
User interface is the medium for user to interact and communicate with a system.
Typically, a user interface should be simple and easy to understand and use. It involves
the design of screens and dialogue boxes. In developing both systems, emphasis is given
to both the input and output design. The user interface is designed based on the current
existing systems as mentioned in Table 2.1 and personal communication with the
experts in this field.
a) Input design
The inputs required depend on the system. In general, both systems require two types of
images; the images to be stored in the image database (which are then used as the
training set) and an unknown query image that need to be retrieved. Both images must
have certain standards in order to aid in the matching process.
However, for Model 2, along with the query image, an additional input is needed to
filter the images to be used as training set images. The additional input is in the form of
a parameter, which in this study the emphasis is given to dorsal or ventral haptoral bar
images.
b) Output design
Output is the information delivered to the user. For both systems, the retrieval system
will provide an output as soon as the matching process is over. The results will display
the retrieved images that are displayed in jpeg format and in the ranked order. However
for Model 2, together with the images are their annotations in text format. The outputs
of the retrieved images are important to verify whether it is similar to a query image.

113
5.3 Development Environment
Development tools deal with the hardware and software that are used to build a system.
Figure 5.4 shows the software development tools environment for building the system.
This system is constructed to run under Windows Server 2003 platform as it deals with
menu-driven interfaces.
There are two important software i.e. Eclipse Galileo IDE as the main code editor and
Protégé 4.1 for the ontology editor which is used to build a system. Eclipse Galileo IDE
is chosen because of it capabilities such as complex code completion, project support,
code navigation, versioning system, refactoring and code generation. While Protégé 4.1
is chosen because of its adoption, maturity and effectiveness, it also provides simple
interface and is easy to use. Above all most of them are free and very powerful in
supporting many additional plug-in.
Figure 5.4: The software development tools environment

114
Java is used as the main programming language because it supports object-oriented
approach in developing the system. Client scripts such as HTML and CSS were used to
create the user interface.
All the support libraries such as Apache Tomcat 6.1 for web server, Java Advanced
Imaging 1.1 for image processing, MySQL Server 5.1.55 for database, JDBC 5.1.15 for
database connection, Jena 2.5.6 and Pellet 2.0.0 were plug-in into Eclipse Galileo IDE.
Languages to implement the ontology are mentioned and discussed in previous
Literature Review chapter. The selections of language to implement the ontology are
dependent on the application needs in terms of expressiveness and inference (Corcho et
al., 2003). Thus in this research, RDF, RDFS and OWL were chosen as complementary
languages to implement the ontology. RDF is defined as a language for expressing data
models using triple statement (Toby et al., 2009). To add the semantics and more
description on the RDF data, RDFS and OWL were used. RDFS provides a specific
vocabulary for RDF that can be used to define the classes, properties and simple domain
and range specifications for properties; and OWL provides an expressive language for
defining ontologies that capture the semantics of domain knowledge (Hebeler, Fisher,
Blace, Perez-Lopez, & Dean, 2009). The ontology is then presented in RDF/XML
serialization format. As for ontology editor, Protégé is considered the most popular
ontology development tool, as it is freely available online and easy to use (Khondoker
& Mueller, 2010). Hence, Protégé was chosen in this study to build the ontology as it
supported the stated languages.
In order to manipulate the ontology programmatically, which is to access, query and
search the ontologies, semantic web programming framework is needed as a medium to

115
communicate. The selection of tool is dependant on the development language used to
develop the system and the features that are provided. Thus, Jena was chosen since Java
is used as main system development language. Furthermore, instead of the freely
available and open-source software (Hebeler et al., 2009), it provides more effective
features such as supporting a few databases like MySQL, DB2 and PostgreSQL;
memory, database and file can be used as model storage (Bizer & Westphal, 2007);
SPARQL as a query language; and reasoner.
As for image pre-processing, image processing software is needed to pre-process the
images. Adobe Photoshop CS is used for this purpose, as it is easy to use. Each image is
manually pre-processed in order to ensure that all the images are in the same standard.
In addition, for their hardware requirements, these tools are divided into Server-side and
Client-side environments as shown in Table 5.1.
Table 5.1: Server- and client- side hardware tools
Category Hardware tools
Server-side Client-side
Processor Intel ® Xeon ® CPU
5160 @ 3.00GHz
Intel ® Core™2 CPU
6420 @ 2.13GHz
RAM 4.00 GB 2.00 GB
Hard-disk space 200 GB 120 GB
Internet 100mbps 100mbps
5.4 System Implementation
System implementation deals with the technical steps taken in order to solve the
problem statement. In this study, the issue concerns the selection of the images in the
training set, depending on parameters such as dorsal or ventral haptoral bar and the
similarity based image retrieval of a given query image. As was mentioned in the
previous section, both models are built using Java in Eclipse Galileo IDE, with the

116
incorporation of Protégé 4.1 for implementing the ontology, while the content-based
image retrieval approach was used in implementing the image retrieval.
5.4.1 Pre-processing of the images
As stated previously, the images were extracted from manuscripts provided by the
experts. However, these images must first undergo a pre-processing stage before it can
be used in the retrieval process. The pre-processing is performed to eliminate
differences among the images. As was mentioned in the above section, Adobe
Photoshop CS was used as the tool for image pre-processing. The details of each
process are explained as in the followings.
a) Image rescaling
In the publication, scale is needed to represent the actual size of the species and
diagnostic hard parts. This information is very important to the taxonomist especially
for species identification. Different literatures may have different scales, thus all the
images containing species and diagnostic hard parts are rescaled and presented in a
spatial resolution of 50 pixels/10 μm or 0.5cm/10 μm.
Figure 5.5 shows the rescaling process whereby the document size is changed by
increasing or decreasing the values of the width and height. For instance, the original
scale in the publication is 0.55cm/10 μm. Thus for rescaling purpose, the values of
width and height were decreased.

117
Figure 5.5: Image rescaling process
b) Image normalization
Once all the images are in the same scale, each structure is cropped and saved as a new
individual image data file in grey scale color jpeg format. Image normalizing processes
involved several steps to erase the unnecessary objects in the image, reduce noise,
adjust the contrast and sharpen as shown in Figure 5.6.
Figure 5.6: Image normalization process

118
c) Image resizing
All the normalized images are in different image sizes. Thus, as shown in Figure 5.7,
each image is cropped again, and pasted at the center of a new image file with sizes of
300 and 150 for both width and height respectively, and with white background in gray
scale format.
Figure 5.7: Image resizing process
As a result, the images have certain standards and these standards are:-
(i) Each image is scaled to a spatial resolution of 50 pixels/10 μm or 0.5cm/10 μm
(ii) Each image is stored as 8-bit grey scale colour jpeg format
(iii)Each image has the same image size, which is a width and height of 300 and 150
pixels respectively
(iv) Only the structure is taken whereby the structure is positioned at the centre of the
image file, with white background image

119
All the pre-processed images form image database are standardized before it can be
used for image retrieval. To date, the image database contains approximately 900+
images. These images include species image and diagnostic hard parts of species which
are anchor, bar, marginal hook, male copulatory organ and female vagina. Examples of
images in the image database are shown in Figure 5.8, Figure 5.9, Figure 5.10 and
Figure 5.11.
Figure 5.8: Species images

120
Figure 5.9: Haptoral anchor images
Figure 5.10: Haptoral bar images

121
Figure 5.11: Haptoral hook images
5.4.2 Ontologization - Building the ontology
Ontologization is the process to create the ontology, which involves identifying the
concepts and their relationships and defining the vocabularies to be used to represent the
data.
a) Implementation using Protégé
The semantic representation of the data as shown in Figure 4.7 will be put into a
computer readable format known as ontology. Through this ontology, the computer will
be able to interpret the triple statements for retrieval.
Using the Wizard in Protégé an ontology file is created (MonogeneanKB1.owl) with a
unique resource identifier (URI)
http://202.185.70.191/Monogenean/Ontologies/MonogeneanKB1.owl and the
serialization format to be used in this ontology will be RDF/XML. Other formats are

122
available for examples turtle, N3. The RDF/XML format can be read by many machine
language interpreters (see Figure 5.12).
Figure 5.12: Wizard in Protégé to create an ontology
In Protégé, a concept is known as class. For example, the Specimen concept is known as
the Specimen class. Classes (see Appendix A) are created in the ontology. As shown in
Figure 5.13, ‘Class Tab’ is selected. To add a new class, a user has to press on the ‘Add
subclass’ button.

123
Figure 5.13: Creating a class in Protégé
Next, the object and datatype properties will be created which are essentially the
properties of the schema (see Appendix A). To create the object properties, switch to the
‘Object Properties’ tab. Press on the ‘Add Object Property’ button and enter the
property name. All the created object properties in the ontology are shown in the Figure
5.14.
Figure 5.14: Creating an object property in Protégé

124
To create a datatype property, switch to the ‘Datatype Properties’ tab. Press on the ‘Add
Datatype Property’ button to create a new Datatype property. All the created datatype
properties in the ontology are as shown in the Figure 5.15.
Figure 5.15: Creating a datatype property in Protégé
In this ontology, seven classes correspond to the seven concepts, 14 object properties
and 13 datatype properties in the semantic representations of the data are used in this
study (see Appendix A, for the descriptions).
b) Linking data from other ontologies
Since monogeneans species are parasites on fish, frogs and turtles, linking the
monogenean data to their host data will provide more information about the
monogeneans. In this study, a simple Fish ontology with TaxonName class is
developed and linked by importing it into the MHBI ontology in Protégé. The two
ontologies are merged by redefining the datatype property (isHostedin) in the
TaxonName class in the MHBI ontology as an object property to merge with the
TaxonName class in the Fish ontology as shown in Figure 5.16.

125
Figure 5.16: Linking MHBI and Fish ontologies
c) MHBI and MHBI-Fish ontologies
Two ontologies were built in this study; MHBI and a merged of MHBI-Fish ontologies.
These ontologies can be viewed in a graph format (see Figure 5.17 and 5.18) in Protégé
and the full codes of the owl ontology in the RDF/XML serialization format are
presented in Appendix C (i) for MHBI-Fish ontologies and Appendix C (ii) for Fish
ontology.
The main goal of the ontologization process is to create ontology suitable for
biodiversity image retrieval. The top-level classes in ontology are depicted in Figure
5.17. These classes describe the specimen, taxon, publication citations and collection
records (see Appendix A for the detail descriptions). This ontology is restricted to the
major taxon taxonomic classification of class, order, family, genus and species. To
make the ontology more informative, each class is annotated with other classes and
subclasses.

126
Figure 5.17: Top-level classes in MHBI ontology
Some of the advantages of using graphs to model the data are the reusability of using
existing schema and merging the separate graphs with consistent vocabularies for
subject and object properties. In biology, other than heterogeneous of data, the data as
well are in the inter-relations manner or related to each other such as parasites-and-
hosts, herbivores-and-plants, DNA-and-organs, and organs-and-donors. Thus in this
study, MHBI schema (for parasite) was reused to build the separate Fish ontology (for
host). Since both graph models have consistent vocabularies, both were merged by
redefining property to link and form a merged of MHBI-Fish ontologies as shown in
Figure 5.18.

127
Figure 5.18: Top-level classes in MHBI-Fish ontologies
However, there is a major difficulty in the early stage of data annotation, creating the
instances. Each instance is needed to annotate with many vocabularies, so that the
ontology is more informative. Nevertheless, it can be overcome by retrieving more
relevant and related images to the user’s query during the image retrieval.
Currently, the ontology can be manipulated for adding new instances, deleting and
updating current instances through Protégé ontology editor. In future, incorporating the
administrative modules through a simple GUI can further enhance it.
5.4.3 Image annotation
In Protégé, the data in the seven classes are annotated in the form of instances. These
instances are added and annotated with object properties and datatype properties in
Protégé (see Table 5.2). In Protégé, inclusion of new data can be done by simply
creating new classes, instances, and object and datatype properties.

128
In Protégé, switch to the ‘Individual’ tab and click on the Specimen class and click on
‘add new instance’ button (see Figure 5.19) and instances will be annotated with object
and datatype properties as shown in Figure 5.20 and Figure 5.21. An example of
annotated instance is as shown in Figure 5.22. Next instances in the TaxonName class
will be annotated with objects and datatype properties as an example as shown in Figure
5.23.
Figure 5.19: Creating a new instance for Specimen class

129
Table 5.2: Classes, instances, object or datatype properties
Class Instances Object
properties
Datatype
properties
Example of data
Specimen bif-baungi-vb-
i1
kindOfSpecimen Illustration
isHaptorBar Haptor Sclerotised parts Bar
typeForName BifBaungi
isCitedIn LimFurtado1983
specimenId j1-bif-bau-ven-bar
imgDir /images/BIF-BAUNGI-ventral-bar-single.jpg
TaxonName BifBaungi
Part bif-baungi-vb-i1
rank Species
isBelong Bifurcohaptor
isHostedIn SilBagMysHemurus
nameComplete Bifurcohaptor baungi
authorship Lim & Furtado
year 1983
locality Tasek Bera, Pahang; Bukit Merah Reservoir,
Perak
Bifurcohaptor
Rank Genus
isBelong Ancylodiscoididae
hasSpecies BifBaungi, BifIndicus
nameComplete Bifurcohaptor
authorship Jain
year 1958

130
Figure 5.20: Annotating an instance with object properties
Figure 5.21: Annotating an instance with datatype properties

131
Figure 5.22: Annotated instance for Specimen class
Figure 5.23: Annotated instance for TaxonName class
5.4.4 Implementation of the image classification using ontology -based
image retrieval (OBIR)
Once the images are annotated in the ontology, this ontology is used for image retrieval
purposes. The image retrieval system in this study combined classical Boolean search
and SPARQL (Prud'hommeaux & Seaborne, 2008). Jena framework is used as a tool to
access and navigate the ontology. Jena ontology API, convert the ontology into a RDF
graph data format as the ontology is queried in this format, using SPARQL. The object
and datatype properties in Appendix A are used as parameters to formulate the query
and retrieve the images. The processes involved are presented below.

132
Image pre-classification is an approach to group selected images based on certain
parameters. In Model 2, parameters such as dorsal or ventral haptoral bar are needed.
By using these parameters, the system will search the ontology to extract the set of
images for the training set.
Before the images could be represented, the training set images that are stored in the
image database needs to be stored in a list so that, it can be loaded and manipulated by
the program.
a) Process flow
Process flow in Figure 5.24 shows the entire process in each different layer in OBIR
layer. In presentation layer, user will select parameters on the query page and the query
processing manipulates the user query into the processing procedures in application
layer. In business layer, the MHBI-Fish ontologies will be converted into RDF graph
data. Once the RDF graph model created, it can be used for sparql query. Results of the
query are shown in image path directory along with their annotations. The images will
be collected based on the images path directory. In the application layer, again it will
pass the results (retrieved images and annotations) for displaying on the result page as
well as being used as input for CBIR web application.
Figure 5.24: OBIR process flow

133
b) Query page
The interface for a user to communicate with the system was developed using simple
interface and enough to meet the requirements of the system. The codes implemented to
create the user interface are presented in Appendix B (i). The user interface was
developed using HTML, CSS and JSP; and contained a form with a file upload button,
options to select the training set images and buttons to submit the query and reset button
to clear the form (see Figure 5.33 for the interface).
c) Query processing
The user’s query then will be manipulated in the query processing. The query image
will be uploaded into the server and the parameter given will be used to search the
ontology and extract the set of images for training. The codes implemented to perform
these processes are presented in Appendix B (ii) and were developed using Java and
Java servlet.
d) Loading the graph data
In order to query the ontology it must be converted into an RDF graph data format. The
ontology files will be called and Jena Ontology API is used to convert the MHBI
ontology and the MHBI-Fish ontologies into a RDF graph data format. The codes
implemented to perform this process are presented in Appendix B (iii). The example of
the RDF graph data is presented in Appendix C (iii).
The RDF graph data is then stored and accessed temporarily from the computer memory
as it is still in the midst of adding new data into the ontology. Eventually this RDF
graph data will be stored in a database file such as MySQL.

134
e) SPARQL query
A simple classical Boolean search query was developed using SPARQL. The codes
implemented to perform sparql query are presented in Appendix B (iv). The retrieved
data will be stored in a list so that it can be loaded and manipulated by the program in
the next step. However, before keeping the images in a list, the size of the list needs to
be counted. The codes implemented to perform this process are presented in Appendix
B (iv). The retrieved data will be used in section 5.4.5 (The codes implemented to
perform this process are presented in Appendix B (vi)) as well as for displaying in the
Result page.
f) Result page
Results of the retrieved data are passed back and will be displayed on the simple result
page for the user in HTML, CSS and JSP. The codes implemented to perform this
process are presented in Appendix B (v). It contained a list of the retrieved images as
shown in Figure 5.37.
5.4.5 Implementation of image retrieval using CBIR
The CBIR is an approach for image retrieval for a given query image. There are two
steps taken, which are defining the feature space and similarity comparison as described
in the previous chapter. In defining the feature space, two types of images are needed.
First, the images that are taken for training set and second is a query image to be
retrieved. Both type of images need to be represented in a way whereby mathematical
calculation can be performed as required in the pattern recognition algorithm. Once the
feature space is defined, it would be used in solving the similarity comparison process.

135
The implementation is shown in a psedocode below.
Require: Polygonal coordinates
Require: Training images, Ti
Require: No. of training region, n
Require: unknown query image, u
Require: No. of classes, k
1. Defining mean features vector for each class, meanC
for i=1 to i=k do
set meanCi[] with zero
get region, r[] = [r Ti]
for r=1 to r=n do
µr=getMean()
end for
meanCi[] = [µr1 .. µrn]
end for
2. Defining u
u=getMean()
3. Calculating the Euclidean distance, distN[] = Euclidean_distance(u, meanCi[])
4. Do indexing
for p1=0 to p1<y2-1 do
for p2=p1+1 to p2<y2 do
if (distN[p1] > distN[p2]) {
temptDist = distN[p1];
distN[p1] = distN[p2];
distN[p2] = temptDist;
}
end for
end for
The entire implementation processes are explained as follows.
a) Process flow
Figure 5.25 and Figure 5.26 show the entire processes flow in each different process in
CBIR layer for both systems in Model 1 and Model 2, respectively. There are two
inputs in this layer and they are the query image from user as well as the images for the
training set that is to be kept in images vector.

136
Figure 5.25: CBIR process flow for Model 1
Figure 5.26: CBIR process flow for Model 2
In Model 1, all the images from monogenean image database need to be kept in images
vector; while for Model 2, the output from OBIR layer will be used as input. There are
two outputs from OBIR layer i.e. images and their annotations. Thus, in this layer, the
output will be split into two vectors input i.e. images vector and annotations vector.
Once the images have been stored in the images vector, the program can load and
manipulate them. In presentation layer, user will upload the query image on the query
page and the query processing manipulates the user query into the processing
procedures in application layer. In business layer, the features of both input images;
query image and images vector will be extracted and represented into mathematical
model and define the feature space. The retrieval algorithm performs image similarity
comparison using Euclidean distance in the feature space. The Euclidean distance vector
is obtained as a result of the comparison between the query image and images vector.
The Euclidean distance vector is sorted in ascending order and corresponding images
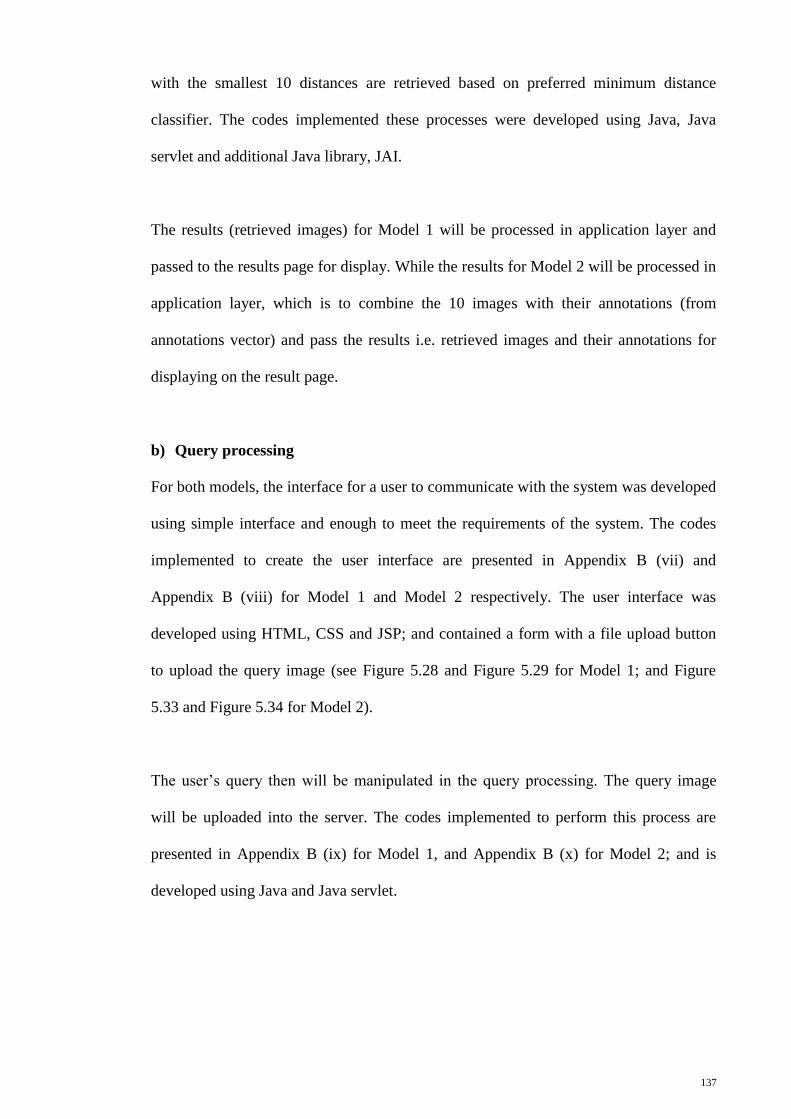
137
with the smallest 10 distances are retrieved based on preferred minimum distance
classifier. The codes implemented these processes were developed using Java, Java
servlet and additional Java library, JAI.
The results (retrieved images) for Model 1 will be processed in application layer and
passed to the results page for display. While the results for Model 2 will be processed in
application layer, which is to combine the 10 images with their annotations (from
annotations vector) and pass the results i.e. retrieved images and their annotations for
displaying on the result page.
b) Query processing
For both models, the interface for a user to communicate with the system was developed
using simple interface and enough to meet the requirements of the system. The codes
implemented to create the user interface are presented in Appendix B (vii) and
Appendix B (viii) for Model 1 and Model 2 respectively. The user interface was
developed using HTML, CSS and JSP; and contained a form with a file upload button
to upload the query image (see Figure 5.28 and Figure 5.29 for Model 1; and Figure
5.33 and Figure 5.34 for Model 2).
The user’s query then will be manipulated in the query processing. The query image
will be uploaded into the server. The codes implemented to perform this process are
presented in Appendix B (ix) for Model 1, and Appendix B (x) for Model 2; and is
developed using Java and Java servlet.

138
c) Feature extraction
As was mentioned previously, the input image is in 8-bit jpeg file format. Therefore, the
image must be represented in 8 bit per pixel. All the images for the training set need to
be kept in a list by storing the pathnames of each images in a list. The codes
implemented to perform this process in Model 1 are presented in Appendix B (xi); while
the codes implemented in Model 2 are presented in Appendix B (xii).
In Model 1, the system will collect all the images from image database and put them
into the training set named others[]. While in Model 2, the output from OBIR layer will
be split into two vectors i.e. images vector named imgDir[] and annotation vector
named imgDesc[].
Once the file pathname of the images have been stored in the list, the program can load
and manipulate them. Then, the shape of the image needs to be represented in a one
dimensional matrix format. A pre-classification technique, extracting region-of-interest
(ROI) based on selected polygonal coordinates is used to extract the shape of the image,
which is then converted into region containing pixels. The shape descriptor used here is
the mean value of all the pixels, , is calculated as follows.
∑
The codes implemented for this process are presented in Appendix B (xiii).

139
d) Defining feature space
Corresponding to the average of all pixels in all regions for a particular class, C a single
mean features vector, meanC is feature space is created as shown in the following steps.
(i) Calculate the number of points named numberOfPixels on that region, r
numberOfPixels is calculated by counting the pixel within the width, w and height, h of
the bounding box.
(ii) Calculating the mean of the pixel values using function named getMean
Once the number of point on that region, r is calculated, it will be used to calculate the
average of the pixel values for each image in the images vector using function named
getMean. The pixel mean values are calculated within the width, w and height, h of the
bounding box.
(iii) Store the calculated mean of the pixel values in a list
The calculated pixels mean values are stored temporarily in a list named ts_means for
images vector and a list named inImgMean for unknown query image.
These lists define the feature space and the codes implementing these processes are
presented in Appendix B (xiv).
e) Similarity comparison
Once the mean feature vectors have been calculated in feature space, the matching
process begins using Euclidean distance function. This is done by performing
subtraction of pixel mean values between the unknown class named inImgMean and the
images vector named ts_means. The calculated values are stored temporarily in a list
named distN.
The codes implemented for these processes are presented in Appendix B (xv).

140
f) Indexing and retrieval
The next step is finding the most similar images using minimal distance classifier. As a
result of the similarity comparison, the smallest value calculated is the nearest match.
Euclidean distance, ε vector named distN from the similarity comparison is then
indexed in ascending order.
The codes implemented for these processes are presented in Appendix B (xvi).
g) Results of retrieved images and their annotations
Finally, the results of the retrieved data are passed back and will be displayed on the
simple result page for the user in HTML, CSS and JSP. For Model 1, it contains a list of
the retrieved images in unranked order as shown in Figure 5.37; while for Model 2, it
contains a list of the retrieved images in ranked order along with their annotations as
shown in Figure 5.43.
The codes implemented to perform this process for both Model 1 and Model 2 are
presented in Appendix B (xvii) and Appendix B (xviii) respectively.
5.5 Testing
Two types of testing were implemented which are; ontology test and test of image
retrieval systems (Model 1 and Model 2).
a) Ontology testing
The ontology evaluation process may be considered either from the technical point of
view (quality of the designed ontology), or from the practical view (usability of the
designed ontology). For the purpose of evaluation of quality of the designed ontologies,
we adopted five criteria’s suggested by Gruber (1995) against which these ontologies

141
will be evaluated. The five criteria’s are clarity, coherence, extendibility, ontology
commitment and encoding bias. These criteria are discussed further in the Result
section.
b) Image retrieval testing
On the image retrieval, the testing is an integral part of model development, whereby
the model that has been coded is examined to determine whether it performs according
to the user’s requirements and is working correctly. For the purpose of this research,
four types of testing were conducted which are; unit testing, module testing, integration
testing and system testing. In order to satisfy the objective of this research, emphasize is
given on system and performance testing. System testing is performed on the whole
system to detect the presence of errors in the system. Once it is done, performance
testing can take place in order to discover how well the system performs its tasks in
order to accomplish the objective of this research.
5.5.1 Tester
Both the taxonomists and developer had conducted the system testing. However, only
the developer conducted performance testing.
5.5.2 System testing
System testing is performed on the system, whereby the areas tested include the
interface between modules, the control flows and the performance of the system. It is
the process to evaluate the system’s actual functionality in relation to expected or
intended functionality. This process is a continuous process that requires a lot of time to
complete in order to ensure that the system is free from any errors and can perform well.

142
In this study, emphasize is given on functional testing and user interface testing.
Functional testing is concerned with determining whether the functional requirement
stated in previous chapters are partially or fully satisfied, while user testing is more
towards the suitability of the interface in performing its tasks. In performing both types
of testing, a test case was developed.
A test case is a set of condition to determine that a requirement is fully satisfied. A test
case includes a description of the functionality to be tested taken from the requirement
list. Table 5.3 shows a sample of a test case conducted for the function to Upload query
image and select images for training set. Other samples of test cases are given in
Appendix D.
Once all the test cases have passed, whereby the expected results meet the actual results,
means that the system is free from any expected errors. The next step was performance
testing. This is the crucial part to determine whether the objective of this study has been
accomplished or otherwise.
Table 5.3: A test case sample
Test case – Upload query image and select images for training set
Test description – to verify the query image is uploaded and training set images
option is selected
Test execution:
Click ‘Browse’ button -> ‘Choose File to Upload’ dialog box appears
Select a file image to upload
Click ‘Open’ -> The image file path appears on the text box
Check a value for ‘Select training set’
Click ‘Upload’ button -> The entered values are sent into the application for
query processing
Click ‘Reset’ button -> To clear all the entered values
Expected results – The image file path appears on the text box and one of the
options for the training set is check
Actual results – Pass. The image file path appeared on the text box and one of
the options for the training set is checked

143
5.5.3 Performance testing
Performance testing takes place in order to discover how well the systems perform their
task under certain conditions or constraints. It can be used to compare between any
systems, to find out which one performs better in order to meet some criteria
performance. As mentioned in the Introduction chapter, one of the tasks to achieve the
objective of this research is to determine how image pre-classification using ontology
can aid in image retrieval. Thus to achieve this objective, the performance of each
system was measured and the results were compared.
The system performance is measured based on the efficiency of retrieval performance.
For both Model 1 and Model 2, the efficiency of retrieval performance were measured
according to the performance of the relevance ranking and classification error rate of the
retrieved images using R-Precision and classification Error Rate (ER) respectively; and
the efficiency of overall retrieval performance using Mean Average Precision (MAP),
Precision-Recall Graph (PR-Graph) and Receiver Operating Characteristic (ROC) and
Area Under ROC Curve (AUC). These metrics are further explained in the following
section.
a) Test plan
The test plan is drawn up during the design stage and serves as a guide in carrying out
the tests. Different systems have different test plans as stated below. The test plan
includes the description of the condition under which the test will run; the test data to be
used; and the expected results.

144
(i) A description of the condition under which the test will run
To achieve the objectives of this study, the performance results of two systems were
compared. Model 1 is run without using any parameter to classify the images in the
training set. On contrary, Model 2 is run using certain parameters to filter the images in
the training set. These two systems will use the same image database but one with
additional ontology (for Model 2 system).
(ii) A description of the test data to be used
There are two types of data needed as input:-
1. Haptoral bar image
Haptoral bar image is the main requirement for the system. In Model 1, all the images
from the image database are extracted. While in Model 2, the image is stored in the
ontology as file path that has the name of the directories in which the image is located.
The extracted image will be converted, whereby the image needs to be stored in a
vector. This process is done so that it can be manipulated and loaded by the program.
All the images are in the same standard as previously stated in section 5.4.1.
2. Parameters for image pre-classification
Besides the image, Model 2 needs the parameters such as dorsal or ventral haptoral bar
to filter a set of images for the training set from the image database, which are in text
data format.
(iii)A description of the expected result
At the end of the process, the system shall display a ranked list retrieved images in jpeg
file format, where the image is verified as relevant or irrelevant based on the visual
comparison. For Model 2, along with these images are their annotations in text data
format.

145
b) Performance metrics
The performance of these two systems was compared in terms of the efficiency of
retrieval. To evaluate the system, several performance evaluation metrics have been
proposed (Müller et al., 2001) based on the precision P and recall R (see Equation 1 and
2):-
Equation 1
Equation 2
Where is the number of retrieved images that are relevant to the query image; is
the number of retrieved images; and is the number of relevant images.
(i) F-measure
A single measure that trades off precision versus recall is the (see
Equation 3), which is the weighted harmonic mean of precision and recall (Manning et
al., 2008).
Equation 3
Where is the Precision value and is the Recall value.
The above three metrics are commonly used to measure for unranked lists of retrieved
images. To evaluate the ranked lists of retrieved images, Precision and Recall measures
are further extended as explained below. Manning et al. (2008) mentioned that, in a
ranked retrieval context, appropriate sets of retrieved documents are naturally given by
the top k retrieved documents. Thus, the evaluation for ranked retrieved images is based
on a list of top 10 retrieved images.

146
(ii) Precision-Recall Graph (P-R Graph) and Mean Average Precision (MAP)
As mentioned in (Deselaers et al., 2004), precision and recall values are usually
represented in a P-R Graph and the most common way to summarize this graph into one
value is the . The average precision for a single query q is calculated by
averaging the precision values at the points at which each relevant image is retrieved
(see Equation 4 and 5):
∑ ( ) ( ) Equation 4
Where is the number of retrieved images; ( ) is the number of precision at a cut-off
of images; and ( ) is the number change in recall that happened between
cut-off and cut-off .
The is the mean of the average precision values over all queries:
∑ ( )
Equation 5
Where in the number of queries
An advantage of the value is that it contains both precision and recall oriented
aspect and is sensitive to the entire ranking (Deselaers et al., 2004).
(iii)Receiver Operating Characteristic (ROC) and Area Under ROC Curve (AUC)
Another metric corresponding to PR Graph is ROC to show the tradeoffs between true
positive rate and false positive rate. A common aggregate to report is the value,
which is the ROC analogue of MAP (Davis & Goadrich, 2006). The AUC computes by
the trapezoidal method.

147
(iv) Error Rate ( )
The classification for all queries was also indicated. In this case, only the most
similar image according to the ranking was considered. A query image is to be
classified correctly, if the first retrieved image is relevant or equal to ( ), where
( ) is the precision after one image retrieved. Otherwise, the query is misclassified
(see Equation 6).
| |∑ {
Equation 6
Where is a set of queries.
(v) R-Precision
As for the relevance ranking in the top ten retrieved images, we measured the ranking of
relevant images in the retrieved images by calculating the precision. The R-Precision for
each query is obtained by computing precision value at the position in the ranking
of retrieved images that has relevant images (see Equation 7) and the mean of the
is obtained by averaging the values for a set of 19
queries (see Equation 8).
Equation 7
∑ ( )
Equation 8
Where is the number of relevant images retrieved in the top of 10 retrieved images;
is the number of relevant images; and is the number of query.

148
c) Experimental testing
To compute the efficiency of the retrieval, a test was designed as follows:- 19 query
images (Figure 5.27) which represent the S1, S2, S3, S4, S5, and S6 classes were
selected. In Model 1, each query image was matched against all the 148 of haptoral bar
images in the image database; whereas in Model 2, each query image was matched
against a training set which the OBIR layer filters with 16000 triple statements in the
ontology.
Figure 5.27: 19 unknown query images for testing
In the CBIR layer, for a given query image q, the feature vector is extracted and
compared to the feature vectors of the training images {Γ1, Γ2, Γ3, .. , Γx}. The retrieval
algorithm performs image similarity comparison using Euclidean distance in the feature
space. The Euclidean distance vector ε(q, Γn) is obtained as a result of the comparison
between the unknown query image and all images in the training set. The Euclidean
distance vector is sorted in ascending order (which is used to create the ranking) and the
corresponding images with the smallest 10 distances are retrieved, as we preferred
Minimum distance classifier. Given a ranked list retrieved images, the image is verified
as relevant or irrelevant based on the visual comparison.

149
5.6 Results and Discussions
This section presents the results of the image retrieval implementation on both systems.
The results are discussed further, which involve assessing the strengths and weaknesses
of the image retrieval systems based on the proposed approaches. In addition,,
suggestions are discussed for future enhancement. In order to achieve the research
objective, the evaluation emphasizes on the performance of the image retrieval. The
results and discussion on the efficiency of retrieval for both Model 1 and Model 2 are
presented based on the testing methodology that was performed as described in the
previous section. The results are then compared to show that the Model 2 image
retrieval system has performed better than Model 1 image retrieval system.
5.6.1 Ontology evaluation
This methodology was successfully used previously to evaluate the Protein Ontology
(Sidhu, Dillon, & Chang, 2007). We introduced some level of formality into this
discussion by adopting criteria suggested by Gruber (1995) against which the ontology
needs to be evaluated.
a) Clarity
Definitions within an ontology need to be stated in such a way that the number of
possible interpretations of a concept would be restricted. This will contribute to the
effectiveness of communication between agents. In the design of our MHBI Ontology,
we stated that for each concept c with property p; the pair (c, p) exactly specifies a
unique pair. During the design of MHBI Ontology this rule is enforced, and the
uniqueness of the definition of concepts is guaranteed (see Figure 4.6). Clarity of MHBI
Ontology is also checked by running eight tests listed below and making sure, all of
them return true:

150
1. No Cardinality Restriction on Transitive Properties
2. No Classes or Properties in Enumerations
3. No Import of System Ontologies
4. No Meta-Class
5. No Properties with Class as Range
6. No Sub Classes of RDF Classes
7. No Super or Sub Properties of Annotation Properties
8. Transitive Properties cannot be Functional
Example of result for Test 1 and Test 8 are as shown in Figure 5.28. Biological data is
evolving over time whereby a new data type may need to be insered into the ontology at
any time. Thus for transitive properties we have not assigned any cardinality restriction.
Besides that, it cannot be functional because it relates to more than one instance via the
property. The example is explained further in Coherence Test 11.
Figure 5.28: Results of the Clarity criteria evaluation (Test 1 and Test 8); and the
Coherence criteria evaluation (Test 6, Test 7 and Test 11)

151
As for Test 2 result, as presented in Figure 4.6, it clearly shows that are no classes or
properties in enumeration. Furthermore, for the Test 3 as illustrated in Figure 5.29, even
though we have followed TDWG LSID standard for the vocabulary, along the way, we
have created our own ontology based on our requirement study. Thus, we have not
imported any other system ontologies. For the Test 7 result, we only used the built in
Annotation property in Protégé and there are no super or sub properties of Annotation
properties as shown in Figure 5.29.
Figure 5.29: Results of the Clarity criteria test (Test 3 and Test 7). Visualization of
MHBI ontology in Protégé.
For Test 4, Test 5 and Test 6 results, as illustrated in Figure 5.17, in the MHBI
ontology, there is no Meta-class, properties with class as range and sub classes of RDF
classes.

152
b) Coherence
The definitions of concepts given in the ontology should be consistent. Only inferences
consistent with existing definitions should be allowed. The formal part of the MHBI
Ontology is checked by running the 12 consistency tests listed below and ensuring that,
for all these tests, all return true:
1. Domain of a Property should not be empty
2. Domain of a Property should not contain redundant Classes
3. Range of a Property should not contain redundant Classes
4. Domain of a Sub Property can only narrow Super Property
5. Range of a Sub Property can only narrow Super Property
6. Inverse of Functional must be Inverse Functional
7. Inverse of Inverse Functional must be Functional
8. Inverse of Sub Property must be Subproperty of Inverse of Super Property
9. Inverse of Symmetric Property must be Symmetric Property
10. Inverse of Top Level Property must be Top Level Property
11. Inverse of Transitive Property must be Transitive Property
12. Inverse Property must have matching Range and Domain
Results of the Test 1 to Test 3 are presented in Appendix A. As shown in the results,
domain and range of all the properties are assigned and do not contain redundant
classes.
The result of Test 4, Test 5, Test 8 and Test 10, are as illustrated in Figure 5.30.
ishaptorbar property is a sub property of super property named part. Thus, domain and
range of the sub property are defined by the super property. In this ontology, the
fullImage, isBar, isHaptor and isHaptorBar sub properties are classified under part

153
property. This is because, each specimen of haptoral bar image may annotate to any of
these properties.
Figure 5.30: Results of the Coherence criteria evaluation (Test 4, Test 5, Test 8 and
Test 10).
One of the results for Test 6 and Test 7 were applicable on the typeForName and part
properties. If a property is inverse functional, then it means that the inverse property is
functional (Protégé, 2004). For example, as illustrated in Figure 5.28, in this ontology,
typeForName is a functional property while part is an inverse functional property. Thus,

154
we can state that BifBaungi typeForName for bif-baungi-vb-i1, and then because of
the inverse property we can infer that bif-baungi-vb-i1 part of BifBaungi.
An example for the result of Test 11 is illustrated as well in Figure 5.28. It shows an
example of the transitive property isBelong. Since Bifbaungi isbelong to
Bifurcohaptor, and Bifurcohaptor isbelong to Ancylodicoididae, then we can infer
that Bifbaungi isbelong to Ancylodicoididae. As for inverse of transitive property
hasSpecies, we can infer that Ancylodicoididae hasSpecies Bifbaungi. Furthermore, as
presented in Appendix A, inverse property in this example had fulfilled the Test 12
whereby it matched the range and domain.
Figure 5.31 illustrates an example of a Test 9 result. It shows an example of the
symmetric property hasSynonym. The instance BycGharui is related to the instance
SiloGharui via the hasSynonym property. Then we can infer that SiloGharui must also
be related to BycGharui via the hasSynonym property. In other words, the property is
its own inverse property.
Figure 5.31: Results of the Coherence criteria evaluation (Test 9).

155
c) Extendibility
It should be possible to extend the ontology without altering the existing definitions.
The requirement of easy ontology extension is quite an important feature as new
knowledge emerges each day and may need to be added to an already existing ontology.
To make MHBI Ontology extendable, the design consists of a hierarchical classification
of concepts represented as classes, from general to specific. In MHBI ontology the
notions classification, reasoning, and consistency are applied by defining new concepts
from defined generic concepts. The concepts derived from generic concepts are placed
precisely into the class hierarchy of MHBI Ontology to completely represent
information defining a specimen.
Figure 5.32 illustrates an example of this criterion. Currently, in MHBI ontology for the
DiagnoticPartTerms concept, we have considered on the HaptorSclerotisedpartBar,
HaptorSclerotisedpartAnchor and FullImage. However, in the future we would like to
include the other diagnostic part such as HaptorSclerotisedpartMarginalHook,
HaptorSclerotisedpartPatch and HaptorSclerotisedpartOther. Thus, this ontology do
not sanction a preference for one diagnostic part only and allow for the definition of
other diagnostic parts, and a way to relate them to existing diagnostic parts.
Figure 5.32: Results of the Extendibility criteria evaluation.

156
d) Ontology Commitment
Ontology should make as few claims as possible about the domain while still supporting
the intended knowledge sharing. MHBI Ontology will have as low an ontology
commitment as domain ontology, because it reuses most of the concepts that have
already been used to represent monogenean data and knowledge, and propose fewer
new concepts. The low ontology commitment of the MHBI Ontology makes it more
extendible and reusable as shown in Figure 5.18. Also, if fewer new concepts need to be
agreed upon by the community, then this makes agreement easier.
e) Encoding Bias
Ontology representation language should be as independent as possible from the use of
the ontology. While developing MHBI Ontology, the choice of representation language
as OWL (Michael, Chris, & Deborah, 2005) will keep the encoding bias to a minimum
as MHBI ontology will be used by all stakeholders of taxonomy domain like: domain
experts, pharmaceutical companies, researchers and students.
5.6.2 Results of similarity-based image retrieval – Model 1
A Model 1 web-based image retrieval system was developed (see Figure 5.33 until
Figure 5.37). A simple query interface as shown in Figure 5.33 and Figure 5.34
illustrate the query for user to upload the preferred query image.

157
Figure 5.33: Query page for the Model 1
Figure 5.34: User has to select preferred query image
Once the preferred image is selected, user can start upload the query image into the
server as shown in Figure 5.35.

158
Figure 5.35: Upload the query image into the server
Once the query image is uploaded into the server, user has to select any option of the
given shapes. User has options for query image against individual shape or all shapes.
Once the required parameters are fulfilled, user can start to submit to the server for
performing image retrievals as shown in Figure 5.36.
Figure 5.36: Options for query image to against individual shape or all shapes
Once the query is processed, the results of ranked list images will appear as shown in
Figure 5.37.

159
Figure 5.37: Retrieval results for the Model 1
19 unknown query images were used to test the Model 1 system. The results of the 19
queries are shown in Appendix E (i). With these results, the aim to perform supervised
similarity based image retrieval for monogenean haptoral bars was achieved. The
efficiency of retrieval performance is discussed further in the following section.
To summarize, the Model 1 similarity-based image retrieval system is able (i) to retrieve
relevant images from the image database, parse it and then display it on the user’s
interface, and (ii) to retrieve the 10 most similar images in ranked order.
5.6.3 Results of similarity-based image retrieval – Model 2
A web-based image retrieval system was developed (see Figure 5.38 until Figure 5.44).
A simple query interface as shown in Figure 5.38 and Figure 5.39 illustrate that user is
required to upload the query image and select the preferred images to be used for
training set images.

160
Figure 5.38: Query page for the Model 2
Figure 5.39: User has to select preferred query image
Once the preferred query image and training set images are selected, user can start to
upload the query image into the server as shown in Figure 5.40.

161
Figure 5.40: Send the query image and preferred training set images to the server
Next, Figure 5.41 displays the uploaded query image and the retrieved images (to be
used as training set images) from the OBIR layer. User has to select any option of the
given shapes. User has options for query image against individual shape or all shapes.
Once the required parameters are fulfilled, user can start to submit to the server for
performing image retrievals.
Figure 5.41: Buttons to view retrieved images and options for query image to against
individual shape or all shapes

162
User can also view the retrieved images by clicking the view image button and the
images will appear in a new web browser window as shown in Figure 5.42.
Figure 5.42: Retrieved images display in a new web browser
Once the query has been processed, the results of ranked list images along with their
annotations will appear as shown in Figure 5.43.
Figure 5.43: Retrieval results for the Model 2

163
To view the image annotations in details, user has to click on the link to view full details
and a new browser window will pop-up and display the results as shown in Figure 5.44.
Figure 5.44: View an image with the annotations
19 unknown query images were used to test the Model 2 proposed approach. The results
of the 19 queries are shown in Appendix E (ii). With these results, the aim to perform a
supervised similarity based image retrieval for monogenean haptoral bars was also
achieved and the annotations were provided along with the images. The efficiency of
retrieval performance is discussed further in the following section.
To summarize, the Model 2 similarity-based image retrieval system is able (i) to retrieve
relevant images from the image database, parse it and then display it on the user
interface, (ii) to retrieve the 10 most similar images in ranked order and recommend it to
the user, and (iii) to allow user to view a complete annotations such as the description of
each diagnostic hard part.

164
5.6.4 Performance results and comparisons for Model 1 and Model 2
A sample of similarity-based image retrieval output for a query image is shown in Table
5.4. Same query images were used for both models. The best 10 Euclidean distance
measures, ε, are given in ascending order of differences. Based on visual comparison, a
retrieved image is considered relevant if image is from the correct or nearest group, in
which the query image belongs, is retrieved; otherwise, it is considered irrelevant. It can
be seen from this result that the retrieval output in Model 2 is better than in Model 1.
For example, there are three irrelevant images in Model 1 result rather than in Model 2,
all relevant images are retrieved.

165
Table 5.4: Sample of retrieval – Results of similarity-based retrieval of both models, Model 1 and Model 2, for the ventral bar query image
Query
image
Retrieved images
ε: Euclidean distance
Visual comparison – ∕: Relevant; ×: Irrelevant
Relevant
images
(out of 10) Rank 1 2 3 4 5 6 7 8 9 10
Model 1
7 ε 0.04 0.77 1.07 1.26 1.52 1.59 1.61 1.77 1.82 1.86
Visual comparison ∕ × × ∕ ∕ ∕ × ∕ ∕ ∕
Model 2
10 ε 0.04 1.26 1.52 1.59 1.77 1.82 1.86 2.16 2.46 3.33
Visual comparison ∕ ∕ ∕ ∕ ∕ ∕ ∕ ∕ ∕ ∕

166
The efficiency of retrieval for both models over 19 queries is shown in Table 5.5, Figure
5.45 and Figure 5.46.
Table 5.5: The efficiency of retrieval for both models
Retrieval Metrics Model 1 Model 2
R-Precision 0.53 ~ 5/10 0.71 ~ 7/10
Error Rate (ER) 0.47 ~ 9/19 0.32 ~ 6/19
Mean Average
Precision (MAP) 0.39 ~ 4/10 0.60 ~ 6/10
Area Under ROC Curve
(AUC) 0.22 0.46
For the relevance ranking measure on the best 10 retrieved images, Model 2 is able to
retrieve up to seven relevant images compared to Model 1 that only retrieved five
relevant images.
The MAP and ER show strong connection between the image retrieval and
classification as both measures are based on precision. Thus for the ER measure, it is
suggested that it is best that relevant images are retrieved early (Deselaers et al., 2008).
On the other hand, the MAP accounts for the average performance of the retrieval over
the complete PR graph. As shown in above Table 5.5, out of 19 queries, in Model 2,
only six queries were classified into the wrong group compared to Model 1 where nine
queries were classified into the incorrect group. As for the MAP, the MAP value for
both Model 1 and Model 2 is 0.60 and 0.39 respectively. It means that, on average,
Model 1 is able to return only around 4 relevant images compared to Model 2 which had
up to six relevant images among the 10 retrieved images for each query.
A PR Graph (Figure 5.45) shows the Precision-Recall curves for both models over 19
queries. Model 1 curve shows that it is able to achieve 0.10 of recall without sacrificing

167
any precision at 0.77. However, to achieve 1.00 recall, the precision drops to 0.06. In
contrast, Model 2 curve shows that, the model is able to achieve 0.10 of recall without
sacrificing any precision at 0.90. Nevertheless, to achieve 1.00 recall, the precision
drops to 0.18. Although both systems can only achieve up to 0.10 recall to maintain the
precision, it clearly shows that the precision for Model 2 is better compared to Model 1
with approximately 13% percentage increase. As well as achieving1.00 recall, Model 2
shows improvement at approximately 12% percentage increases over Model 1.
Figure 5.46 demonstrates the comparison of both models in terms of the fraction of true
positive rate over false positive rate. The areas under ROC curves are 0.22 and 0.46 for
both Model 1 and Model 2 respectively. Even though the graph climbs steeply on the
left side, the AUC for both models are less than 0.50, which means these two models do
not provide adequate discrimination. This could be due to the volume of data used in
this study. However, it clearly shows that the AUC rate in the Model 2 achieves higher
performance compared to Model 1.

168
Figure 5.45: PR-Graph for both models

169
Figure 5.46: ROC curves for both models

170
5.7 Summary
This chapter provides the whole architecture of the system based on the requirements
listed on the previous chapter. In addition, the development tools that were used in the
development are included. Besides, the detailed reports on the implementation of the
coding are provided. Both the systems are web-based system which runs on Windows
Server 2003 platform; Apache tomcat as a tool for web server; a Java language as a
main programming language; Protégé 4.1 as an ontology editor to store the structured
data; MySQL Server 5.1.55 for database; JSP, HTML and CSS as client scripts to create
the user interface; Eclipse Galileo IDE as main code editor; and Adobe Photoshop CS as
a tool for image pre-processing.
Finally, this chapter presented results of 3 types of testing; ontology testing, system
testing and performance testing that were implemented on both Model 1 and Model 2.
The quality of ontology was evaluated based on the technical point of view. System
testing performed on the entire system is to ensure that the system requirements are
fulfilled. To achieve the objective of this research, the systems’ performance testing is
the most important testing in order to ascertain the effect of image pre-classification
using OBIR layer in the CBIR approach as implemented in Model 2. Both systems
performed well and fulfilled the stated requirements.

171
CHAPTER 6:
FUTURE WORK AND
CONCLUSION
6.1 Introduction
This chapter discusses the proposed architecture for biodiversity image retrieval. The
proposed architecture’s strengths and limitations are identified. Finally, future
enhancements are proposed.
6.2 Proposed Image Retrieval
Today’s CBIR system is one of the significant applications in biology. In biodiversity
research, in particular taxonomy, in order to obtain more accurate, related and relevant
knowledge to a user’s query, both text and image data types are needed. As stated
previously, most previous work focused on enhancing the retrieval process, instead of
integrating with the text.
Hence, in this study, the emphasize is on improving the relevancy of the training set
using ontology to collect the most relevant images to be used as training set images for
content-based image retrieval. In this study, a three-tier integrated model architecture
for Biodiversity image retrieval as shown in Figure 5.2, is proposed. The backend
database tier contains two databases, namely the Monogenean Image Database, which
contains the images to be used for image retrieval and visual display purpose, and the
MHBI-Fish Ontologies that contains the text annotation of the images. The user’s query

172
is processed using two layers in the web application tier. The Ontology-based Image
Retrieval layer collects the images using the approach described in Section 4.6-OBIR.
The collected images then go through the Content-based Image Retrieval layer using the
approach as described in Section 4.7-CBIR. The architecture also includes the client-tier
that has a query interface and results. A graphical query interface is provided for user to
communicate with the web application. The interface collects the information from the
user and displays the retrieved images and information to provide interpretation of the
images retrieved. In this architecture, the results contain the retrieved image in ranked
order together with the textual annotations attached to the image (see Figure 5.43),
therefore it provides more knowledge to user compared to the conventional CBIR
system (see Figure 5.37). This is a very useful feature in the field of Biodiversity as
taxonomic information related to the image provides more understanding and
knowledge.
6.3 Reducing the Semantic Gap
Many open issues have been discussed and suggested (Rui et al., 1999; Smeulders et al.,
2000; Shandilya & Singhai, 2010) to improve the conventional CBIR approach and one
of the issues is to reduce the semantic gap between the query image and training images
to retrieve more images that are relevant. Most previous research focused on classifier
algorithms, image representations, the use of an image database, and relevance feedback
as an effort to enhance the CBIR based image retrieval. Other alternative approach is to
integrate textual image retrieval into the conventional CBIR such EKEY (EKEY, 2012),
BISs (Torres et al., 2004), SuperIDR (Murthy et al., 2009), and as teaching tool for
parasitology (Kozievitch et al., 2010) as described above. This kind of work is not only
very few but mostly rely on relational databases and XML formats. In this study, an
approach to reduce the semantic gap is proposed by adopting the ontology as a layer to

173
filter irrelevant data before we use the CBIR approach. Instead of conventional database
systems or even XML, the ontology is preferred as it allows web resources to be
semantically enriched (Nicola, Missikoff, & Navigli, 2005). Unlike databases, one of
the fundamental assets of ontology-based approach is that it is independent of platform
and applications. Thus, in this study the conventional CBIR is integrated with ontology
to give a better retrieval efficiency and performance.
6.4 Retrieval Performance
Retrieval results in the Section 5.6.4 show that the OBIR layer has an impact on the
relevancy of the retrieved images. Both models used the same image database (data
source) as a training set. However, the main difference lies in its size and relevancy,
whereby in Model 1, all the images are used as the training set; while in Model 2, only a
selected subset used it because the training set is filtered by the query in the OBIR layer.
Thus, the numbers of classes in the feature space for both models were different. From
the results, it shows that the relevancy rate of the image retrieval in Model 2 is more
relevant than in Model 1. It can be concluded that the relevancy rate increases when the
size of the training set decreases since all the images are mostly relevant to the query
image. Besides that, it shows that the size of training set effect the relevancy rate of the
retrieved images whereby the relevancy rate is inversely proportional to the size of the
training set.
6.5 Approach Applicability
The proposed architecture is designed to support the heterogeneous biological data. In
biodiversity, vast images in many colors, shapes and textures are produced. However,
because of function limitations provided by database system, the images and the
annotations along with the images are often ignored. Moreover, because of the

174
complexity of images such as how they deal with many diagnostic characteristics, the
developers may have problem in developing a practical image retrieval system. Thus,
when the CBIR approach integrates with the ontology approach, the high-level features
of the images can be utilized in ontology; whereas the low-level features can be utilized
in CBIR. Consequently, the developers can minimize the features to be used for
representing the images; yet is able to maintain the relevancy to the possible images to
be used for the training set in CBIR.
6.6 Ontology Applicability in Organizing Biology Data
Biology data is a large subject area. Some of the characteristics of biology data are
heterogeneous, in interrelation-manner, complex business logics, with data structure
constantly changing and evolving over time and has special requirements of scientific
culture. Thus, it shows there is a need to organize this data in a meaningful manner
using semantic representation in ontology, whereby the relevant and related information
can be searched and retrieved to user’s query. This approach is suitable for organizing
the data in heterogeneous, dynamic, broad domain knowledge, workflow oriented and in
information integration style.
6.7 Display Retrieved Images in Ranked Order
In the proposed architecture, all the retrieved images are displayed in a ranked order.
Thus, this makes it easier for user to closely verify whether the retrieved images are
relevant or irrelevant to a user’s query.

175
6.8 Query Image by Example
The proposed architecture provides the query image examples for user to retrieve
similar images. Thus, this method is suitable for application where the target has similar
images that the user wants to retrieve but is under different varieties as shown in Figure
5.39. By doing this, user is not required to provide any explicit description of the target
images as it is computed by the system.
6.9 Proposed Architecture Limitations
In spite of the above strengths, the proposed architecture also has some limitations:-
6.9.1 Image pre-processing
All the images must undergo a pre-processing stage before it can be used for retrieval.
The purpose of the pre-processing image is to normalize all the images to eliminate
differences among the images so that the image are in the same standard and are cleared
of any noise. In this study, the pre-processing image is performed manually and requires
a lot of time to ensure that the images are in good quality.
6.9.2 Query by example using internal image
As stated above, user can send a query image by example to retrieve similar images.
However, in this proposed architecture, the query image is limited to internal images
whereby a user has to use the provided unknown images as a query image. Thus, it
limits a user’s requests in order to perform the retrieval process.

176
6.9.3 Data annotation in ontology
The major difficulty in using ontology approach is during data annotation. To make
informative ontology, each instance must be annotated in detail. Thus in the early stage
of annotation the work requires a lot of time.
6.9.4 CBIR limitations
CBIR retrieval performance is determined by the quality of the image as described
above, as well as the feature used to represent the image. Currently, only one feature is
used for image representation. Eventhough it is able to do image recognition, it needs to
use more features such as curvature and boundary-based information. For this reason,
the relevant images in the retrieved images can be nearer to the query image. The
number of images is also a very important requirement because it is the main input for
the system. However, there is a limitation of the images in the dataset.
6.10 Future Work
As mentioned in the above section in the proposed architecture limitations, several
suggestions are recommended for future enhancement.
6.10.1 Implementation in other domain
Current proposed architecture is has only been tested with haptoral bars of the
monogeneans. In future, other diagnostic hard parts such as haptoral anchor and
copulatory organ will be included in the proposed model so that more testing and
evaluation can be conducted. Based on these results, it can be used as the proof and
eventually this architecture can be implemented in other domain involving images such
as archeology, earth sciences and geology. Currently in archeology, the images are well

177
described with their own previous historical information such as year, location and
person involved. While in earth sciences and geology, the images are well described
with the geographic information such as location, longitude, latitude and map.
6.10.2 Upgrading query image methods
Since this proposed architecture limits a user’s requests by using the provided internal
images for query image, the query image will be further enhanced with query by
example using external image and query by sketching. For query by example using
external image, a user can provide his or her own image as query image. User is free to
use any image as long as that image has a similar look in terms of shape or color or
texture with the images in the database. On the contrary, query by sketch allows user to
draw a sketch of an image as query image. Query by sketching can be done in instances
where the retrieval system provides the editing tools for user to draw or using any third
party drawing tool.
6.10.3 Automatic image quality checker
For standardizing the images, normalization function can be added in order that the
images undergo first pre-processing image computationally. As mentioned previously,
this pre-processing image requires alot of time and it is not an easy task. This task
cannot be ignored as the relevancy of the retrieved images is influenced by the quality
of the images. Therefore, this function can help in standardizing the images with certain
criteria.

178
6.10.4 Customizable search criteria with semantic query
The queries developed and used in this study are simple static queries using the
predefined vocabularies (see Appendix A). Although the retrieved results indicate that
the images are well annotated, a semantic based query might allow more versatility in
querying the data. In the future, incorporating natural query language will further
develop work on semantics query and in addition, a user can make a search using any
word or sentence related to monogeneans and their hosts.
6.10.5 Semantic search engine
Currently, a simple Boolean search is used to perform the searching in the RDF graph
data. In future, the semantic search engine will be incorporated into the current
searching methods such as graph patterns and fuzzy logics.
6.10.6 Upgrading to more informative ontology
The vocabularies currently used in the ontology are enough to accommodate the data.
However, to make it more informative and useful to user, more vocabularies will be
added in the future.
Current MHBI ontology links to Fish ontology and forming merged MHBI-Fish
ontologies. In the future, other ontology for the monogenean hosts such as amphibians
and reptiles will be created and linked with MHBI. Eventually, this study will further
develop into a monogenean knowledge base to assist researchers in retrieving
information for future analysis.

179
6.11 Conclusion
Though image retrieval sounds like a fairly simple problem, but it is not an easy task to
work on especially in biology. Biologists normaly produce a huge number of images.
Some of these images may contain simple objects and some may contain complex
objects. Besides that, each image is normally well described with their annotations
whereby these annotations are often ignored in online biology database. Furthermore,
most of the image databases do not provide image retrieval capability using CBIR
approach, whereby, the images are retrieved based on text-based query. Thus, it leads
into retrieving irrelevant images to the user’s query. In other field such as in digital
library, the image annotation is widely used to support their image retrieval purposes.
Hence, after considering the heterogeneous of biological data, complexity of the images
and a need of integrating automatic image retrieval to provide more useful information
and knowledge to the researchers, the objectives of this study is to fulfill all these
requirements in an integrated manner and are accomplished while taking into
consideration the advance in semantic web ontology, metadata languages and CBIR.
To retrieve more relevant images to the user query, ontology-based image retrieval
(OBIR) is used as approach to reduce the training set images for the CBIR layer by
eliminating the irrelevant images using the text-based query in OBIR layer. This
technique, which is also referred as data reduction usually used in data pre-processing to
obtain a reduced representation of the dataset, which is smaller in quantity, yet closely
maintains the integrity of the original data. The implication of this approach shows that
the relevancy of the retrieved images in the proposed architecture is better than the
conventional CBIR approach.

180
In conclusion, the main contributions of this study, (i) architecture for managing
heterogeneous datasets collection, (ii) reducing the semantic gap between the query
image and training set images by adopting the ontology as a layer to filter irrelevant
images before using the CBIR approach, (iii) the retrieved results contains the retrieved
images in ranked order together with the textual annotations attached to the image,
therefore providing more information and knowledge, and finally, (iv) implementing the
proposed architecture using illustration of monogeneanhaptoral bar diagnostic hard part
to demonstrate how text- and content- based information can be integrated for building
a better image retrieval system.
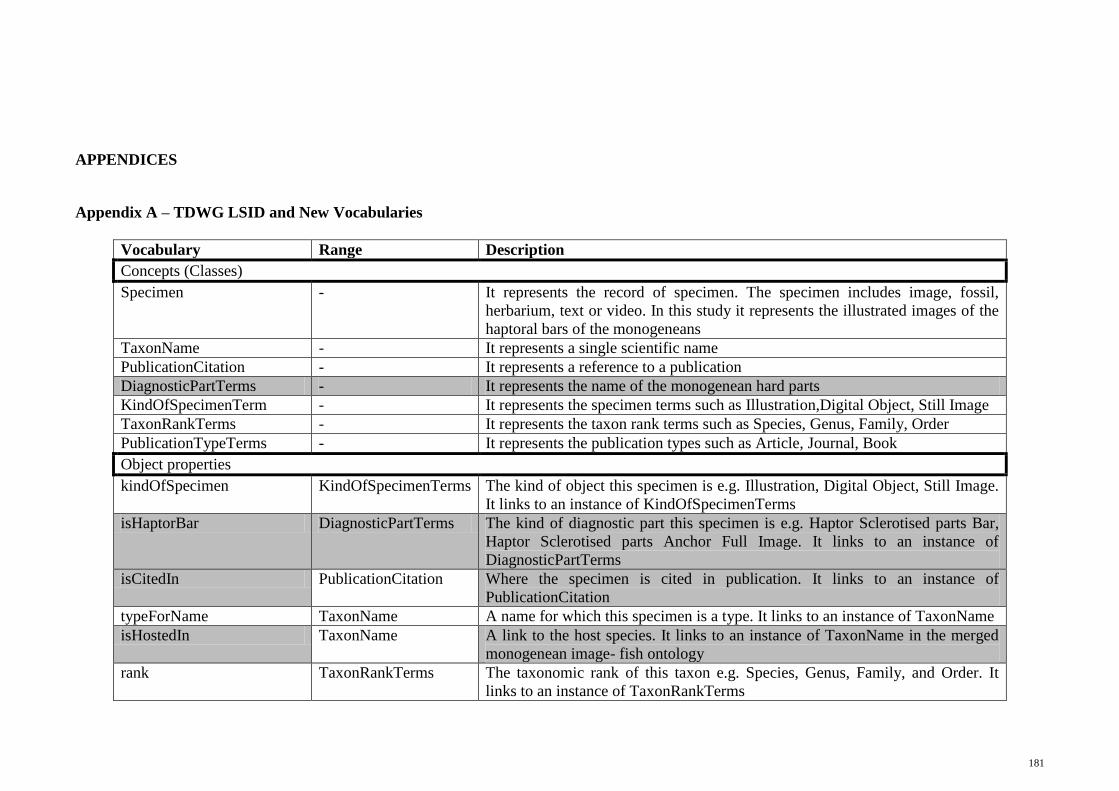
181
APPENDICES
Appendix A – TDWG LSID and New Vocabularies
Vocabulary Range Description
Concepts (Classes)
Specimen - It represents the record of specimen. The specimen includes image, fossil,
herbarium, text or video. In this study it represents the illustrated images of the
haptoral bars of the monogeneans
TaxonName - It represents a single scientific name
PublicationCitation - It represents a reference to a publication
DiagnosticPartTerms - It represents the name of the monogenean hard parts
KindOfSpecimenTerm - It represents the specimen terms such as Illustration,Digital Object, Still Image
TaxonRankTerms - It represents the taxon rank terms such as Species, Genus, Family, Order
PublicationTypeTerms - It represents the publication types such as Article, Journal, Book
Object properties
kindOfSpecimen KindOfSpecimenTerms The kind of object this specimen is e.g. Illustration, Digital Object, Still Image.
It links to an instance of KindOfSpecimenTerms
isHaptorBar DiagnosticPartTerms The kind of diagnostic part this specimen is e.g. Haptor Sclerotised parts Bar,
Haptor Sclerotised parts Anchor Full Image. It links to an instance of
DiagnosticPartTerms
isCitedIn PublicationCitation Where the specimen is cited in publication. It links to an instance of
PublicationCitation
typeForName TaxonName A name for which this specimen is a type. It links to an instance of TaxonName
isHostedIn TaxonName A link to the host species. It links to an instance of TaxonName in the merged
monogenean image- fish ontology
rank TaxonRankTerms The taxonomic rank of this taxon e.g. Species, Genus, Family, and Order. It
links to an instance of TaxonRankTerms

182
TDWG LSID and New Vocabularies, continued
isBelong TaxonName Which taxon it belongs to. It links to an instance of TaxonName
part Which monogenean diagnostics hard part it represents
hasSpecies TaxonName Species in the genus. It links to instances of TaxonName
hasGenus TaxonName Genus or genera in the Family. It links to instance(s) of TaxonName
hasFamily TaxonName Family or families in the Order. It links to instance(s) of TaxonName
hasOrder TaxonName Order or Orders in the Class. It links to instance(s) of TaxonName
publicationType PublicationTypeTerms The type of the publication e.g. Book, Journal Article, Journal. It links to an
instance of PublicationTypeTerms
lists TaxonName Types of Taxon listed in the publication. It links to an instance of TaxonName
Datatype properties
specimenId String The museum deposition number of the specimen
imgDir String The image path directory where the image is stored
imgDescription String Description of the image
locality String Location where the specimen is collected
nameComplete String The complete name of the taxon
authorship String The name of all the authors to this taxon
year String The year of publication of this taxon
authorship String The authors of the publications
year String The year of the publication
title String The title of the publication
parentPublicationString String The name of journal of the publication.
number String The part number of the publication. E.g. 12, 325-330 means volume 12, p. 325-
330
definedTerm String The complete name of the term
TDWG LSID and new vocabularies (highlighted with gray background). The range of the vocabulary refers to the type of values for the object and
datatype propertyies (Toby et al., 2009)

183
Appendix B – Sample of Source Codes
(i) Query page
queryImgKb.jsp
.. <form action="getImgKb" method="post" enctype="multipart/form-data"
name="productForm" id="productForm">
<table width="400px" align="center" border=1 style="background-color:ffeeff;">
<tr>
<td align="center" colspan=2 style="font-weight:bold;font-
size:20pt;"><p>Query for Monogenean Haptoral Bar Image Retrieval<br>(shape-based
image retrieval)</br></p></td>
</tr>
<tr>
<td>Test image: </td>
<td><input type="file" name="file" id="file"></td>
</tr>
<tr>
<td>Select training set: </td>
<td>
<input name="tset" type="radio" value="hb">Haptoral bar
images<br>
<input name="tset" type="radio" value="hbd">Haptoral bar
(Dorsal) images<br>
<input name="tset" type="radio" value="hbv">Haptoral bar
(Ventral) images<br>
</td>
</tr>
<tr>
<td align="center" colspan=2><p><input type="submit"
name="Submit" value="Upload"></p></td>
</tr>
</table>
</form>
..
(ii) Query processing I
getImgKb.java
.. //**get training set**BEGIN//
query = req.get(1);
System.out.println("query : " + query);
if (query.equals("hb")) {
try {
/**
page="/selShape.jsp";
System.out.println("tset : " + query);
List<String> imgdetail = new monogeneanKb().hbImgs();
request.setAttribute("hbimgdetail",hbimgdetail);
*/
imgdetail = new monogeneanKb().hbImgs();
} catch (IOException e) {
e.printStackTrace();
}
}//(query.equals("hb"))
else if (query.equals("hbd")) {
try {
imgdetail = new monogeneanKb().hbdImgs();
} catch (IOException e) {
e.printStackTrace();
}

184
}//(query.equals("hbd"))
else if (query.equals("hbv")) {
try {
imgdetail = new monogeneanKb().hbvImgs();
} catch (IOException e) {
e.printStackTrace();
}
}//(query.equals("hbv"))
.. else {
page="/MonoPage1.jsp";
System.out.println("query : " + query);
}
.. //**get training set**END//
page="/selShape.jsp";//for displaying results
..
(iii) Loading the graph data
monogeneanKb.java
.. public List<String> hbImgs() throws IOException {
.. String className = "com.mysql.jdbc.Driver";
IDBConnection conn = null;
Model modeltmp = null;
OntModel mKBase = null;
try {
Class.forName(className);
System.out.println("JDBC Driver found");
} catch (ClassNotFoundException e) {
System.out.println("JDBC Driver NOT found!!");
e.printStackTrace();
}
String DB_URL = new String("jdbc:mysql://localhost:3306/monokb1c");
String DB_USER = new String("root");
String DB_PASSWD = new String("p@ssw0rd");//202.185.70.191
String DB_TYPE = new String("MySQL");
conn = new DBConnection(DB_URL, DB_USER, DB_PASSWD, DB_TYPE);
try {
if(conn.getConnection() != null) // throws exception
System.out.println("Connection Successful");
} catch (SQLException e) {
e.printStackTrace();
}
ModelMaker maker = ModelFactory.createModelRDBMaker(conn);
//check to see if the model is already present in db
if(conn.containsModel("MonogeneanInstancesDB")){
modeltmp=maker.openModel("MonogeneanInstancesDB",true); //throws
exception if not present
}
else {
modeltmp = maker.createModel("MonogeneanInstanceDB");
}
OntModelSpec spec = new OntModelSpec(OntModelSpec.OWL_MEM);
mKBase = ModelFactory.createOntologyModel(spec,modeltmp);
List<String> dataList = new ArrayList<String>();
StringBuffer queryStr = new StringBuffer();
InputStream in =
FileManager.get().open("D:arpah/workspace/Monogenean//Ontologies/MonogeneanKB1.o
wl");
mKBase.read(in,"http://202.185.70.191/Monogenean/Ontologies/monogeneankb
1#");

185
InputStream in2 =
FileManager.get().open("D:arpah/workspace/Monogenean//Ontologies/FishOnt.owl");
mKBase.read(in2,"http://202.185.70.191/Monogenean/Ontologies/monogeneank
b1#");
InputStream in3 =
FileManager.get().open("D:arpah/workspace/Monogenean//Ontologies/TaxonRank.owl")
;
mKBase.read(in3,"http://202.185.70.191/Monogenean/Ontologies/monogeneank
b1#");
.. }//hbImgs()
..
(iv) Sparql query
monogeneanKb.java
.. public List<String> hbImgs() throws IOException {
.. queryStr.append("PREFIX MonogeneanKB1" + ": <" +
"http://202.185.70.191/Monogenean/Ontologies/MonogeneanKB1.owl#" + "> ");
queryStr.append("PREFIX FishOnt" + ": <" +
"http://202.185.70.191/Monogenean/Ontologies/FishOnt.owl#" + "> ");
queryStr.append("PREFIX TaxonRank" + ": <" +
"http://202.185.70.191/Monogenean/Ontologies/TaxonRank.owl#" + "> ");
queryStr.append("PREFIX rdfs" + ": <" + "http://www.w3.org/2000/01/rdf-
schema#" + "> ");
queryStr.append("PREFIX rdf" + ": <" + "http://www.w3.org/1999/02/22-
rdf-syntax-ns#" + "> ");
String queryRequest = " select * where{ " +
"?sub MonogeneanKB1:kindOfSpecimen MonogeneanKB1:DigObject . " +
"?sub MonogeneanKB1:isHaptorBar MonogeneanKB1:HaptorSclerotisedpartsBar
. " +
"?sub MonogeneanKB1:specimenId ?specimenId . " +
"?sub MonogeneanKB1:imgDir ?imgDir ." +
"?sub MonogeneanKB1:imgDescription ?imgDesc . " +
"?sub MonogeneanKB1:shapeType ?specimenShapeType . " +
"?specimenShapeType MonogeneanKB1:defineAs ?specimen_shape . " +
"?sub MonogeneanKB1:typeForName ?spname . " +
"?spname MonogeneanKB1:nameComplete ?nameComplete " +
"; MonogeneanKB1:authorship ?authorship " +
"; MonogeneanKB1:year ?year ." +
"?sub MonogeneanKB1:isCitedIn ?pub . " +
"?pub MonogeneanKB1:pub_author ?pub_author " +
"; MonogeneanKB1:pub_year ?pub_year " +
"; MonogeneanKB1:pub_number ?pub_number " +
"; MonogeneanKB1:pub_parentPublicationString ?pub_publisher " +
"; MonogeneanKB1:pub_title ?pub_title . " +
"?sub MonogeneanKB1:isHostedIn ?host . " +
"?host FishOnt:nameComplete ?host_name . " +
"?host FishOnt:authorship ?host_authors . " +
"?host FishOnt:year ?host_year " +
"} "; //add the query string
queryStr.append(queryRequest);
Query query = QueryFactory.create(queryStr.toString());
QueryExecution qexec = QueryExecutionFactory.create(query, mKBase);
try {
ResultSet response = qexec.execSelect();
while( response.hasNext()){
QuerySolution soln = response.nextSolution();
RDFNode imgdir = soln.get("?imgDir");
RDFNode imgDesc = soln.get("?imgDesc");

186
RDFNode specimen_id = soln.get("?specimenId");
RDFNode specimen_shape = soln.get("?specimen_shape");
RDFNode spname = soln.get("?nameComplete");
RDFNode authorship = soln.get("?authorship");
RDFNode year = soln.get("?year");
RDFNode host_name = soln.get("?host_name");
RDFNode host_authorship = soln.get("?host_authors");
RDFNode host_year = soln.get("?host_year");
RDFNode pub_author = soln.get("?pub_author");
RDFNode pub_year = soln.get("?pub_year");
RDFNode pub_title = soln.get("?pub_title");
RDFNode pub_publisher = soln.get("?pub_publisher");
RDFNode pub_number = soln.get("?pub_number");
if( imgdir != null ){
dataList.add(imgdir.toString());
dataList.add(imgDesc.toString());
dataList.add(specimen_id.toString());
dataList.add(spname.toString());
dataList.add(authorship.toString());
dataList.add(year.toString());
dataList.add(host_name.toString());
dataList.add(host_authorship.toString());
dataList.add(host_year.toString());
dataList.add(pub_author.toString());
dataList.add(pub_year.toString());
dataList.add(pub_title.toString());
dataList.add(pub_publisher.toString());
dataList.add(pub_number.toString());
dataList.add(specimen_shape.toString());
}
else
System.out.println("No taxon found!");
}
} finally { qexec.close();}
return dataList;
}//hbImgs()
..
(v) Result page
selShape.jsp
.. String inImg = (String)request.getAttribute("timage");
String serURLInImg =
"http://202.185.70.193:8080/Monogenean/inputImage/";
String serURLPubImg = "http://202.185.70.193:8080/Monogenean/pubImg/";
String serURLtImg =
"http://202.185.70.193:8080/Monogenean/trainingSets/trainingsetgreyL1L2L3L4L5L6/
";
Iterator i;
List<String> tset = (List)request.getAttribute("imgdetail");//result
from getImgKb.java - hb()
List<String> fnameL1 = new ArrayList<String>();//to store the file names
only for images to be displayed in selShape.jsp
.. //list 1 - 50 images - page 1
for(int x=0;x<50;x++){
String filename = (String) tset.get(i10);
fnameL1.add(filename);
System.out.println(" img dir = "+filename);
i10+=15;
}
.. <tr>
<td align="center" colspan=2 style="font-weight:bold;font-
size:20pt;"><p>Shape Recognition</p></td>

187
</tr>
<tr>
<td width="20%" align="center">Test image :</td>
<td width="80%" align="center"><p><img src="<%= serURLInImg+inImg %>"
width="200" height="100"></p></td>
</tr>
<tr>
<td align="center">Training set :</td>
<td align="center"><p><%= y %> images in the training set
<input name="viewImages" type="button"
onClick="javascript:window.open('http://202.185.70.193:8080/Monogenean/viewImgs.
jsp?param=<%=fnameL1%>','_blank','scrollbars=no,menubar=no,height=600,width=1000
,resizable=yes,toolbar=no,location=no,status=no','');" value="View Images Page
1">
.. viewImgs.jsp
.. String[] values = request.getParameterValues("param");
System.out.println("values = "+values);
Iterator i;
List<String> params1 = new ArrayList<String>();
String serURLtImg =
"http://202.185.70.193:8080/Monogenean/trainingSets/trainingsetgreyL1L2L3L4L5L6/
";
String valuesSubstr0 = values[0].substring(1,values[0].length()-1);
System.out.println("valuesSubstr0 = "+valuesSubstr0);
Pattern p1 = Pattern.compile("[,\\s]+");
String[] res1 = p1.split(valuesSubstr0);
for (int j = 0; j < res1.length; j++) {
System.out.println(res1[j]);
params1.add(res1[j]);
}
.. <td align="center"><p CLASS="nounderline"><font style="font-
weight:bold;font-size:20pt;">Images in the training set</font>
<a
href="javascript:window.open('','_parent','');window.close();">[<font>Close
Window</font>]</a>
</p></td>
.. <td><table align="center" border="0" cellspacing="0"
cellpadding="0">
<%
for (i=params1.iterator(); i.hasNext(); )
{
%>
<tr>
<td align="center"><p><img src="<%=
serURLtImg+i.next()%>" width="50" height="50"></p></td>
..
(vi) Data for CBIR
selShape.jsp
.. List<String> tset = (List)request.getAttribute("imgdetail");//result
from getImgKb.java - hb()
.. request.getSession().setAttribute("imgList",tset);//input for CBIR
..

188
(vii) Query page for image uploading (Model 1)
queryimg.jsp
.. <form action="uploadQueryImg" method="post" enctype="multipart/form-data"
name="productForm" id="productForm">
.. <tr>
<td>Test image: </td>
<td><input type="file" name="file" id="file"></td>
</tr>
<tr>
<td align="center" colspan=2><p><input type="submit"
name="Submit" value="Upload"></p></td>
</tr>
.. </form>
..
(viii) Query page for image uploading (Model 2)
queryImgKb.jsp
.. <form action="getImgKb" method="post" enctype="multipart/form-data"
name="productForm" id="productForm">
.. <td align="center" colspan=2 style="font-weight:bold;font-
size:20pt;"><p>Query for Monogenean Haptoral Bar Image Retrieval<br>(shape-based
image retrieval)</br></p></td>
.. <tr>
<td>Test image: </td>
<td><input type="file" name="file" id="file"></td>
</tr>
.. </form>
..
(ix) Query processing (Model 1)
uploadQueryImg.java
.. String page = "/optshape.jsp";
String viewImage = " "; //test image
.. String uploadImage = fname+"_"+r+domainName;
viewImage = fname+domainName;
File savedFile = new
File("D:/arpah/workspace/Monogenean/"+"userInput\\"+uploadImage);
item.write(savedFile);
.. request.setAttribute("viewImg", viewImage);
.. optShape.jsp
.. <form action="shapeRecognition" method="get" enctype="multipart/form-data"
name="productForm" id="productForm">
.. <tr>
<td colspan="3" align="center">
<div align="center">
<input name="shape" type="radio" value="s123456B">
All shapes</div></td>

189
</tr>
.. <tr>
<td align="center" colspan=2><p><input type="submit" name="Submit"
value="Start"></p></td>
</tr>
</table>
</form>
..
(x) Query processing (Model 2)
getImgKb.java
.. File savedFile = new
File("D:/arpah/workspace/Monogenean/"+"userInput\\"+uploadImage);
item.write(savedFile);
req.add(itemName);
.. page="/selShape.jsp";
.. request.setAttribute("imgdetail",imgdetail);
..
(xi) Training set list (Model 1)
shapeRecognition.java
.. //training set images
File dir1 = new
File(serverDir+"WebContent/trainingSets/ts1");
..
//get all the images from var dirX and store in others[]
array
others1 = dir1.listFiles();
..
(xii) Training set list (Model 2)
getImageShape.java .. //get from selShape.jsp
String testImg = request.getParameter("testImg");
String optshape = request.getParameter("shape");
List imgList = (List) request.getSession().getAttribute("imgList");
.. //split imgList list into 6 groups for (int indexof=14; indexof<imgListSize; indexof+=15){
String setshape = (String)imgList.get(indexof);
String imgDir = (String)imgList.get(indexof-14);
String imgDesc = (String)imgList.get(indexof-13);
String spname = (String)imgList.get(indexof-11);
String authorship= (String)imgList.get(indexof-10);
String year = (String)imgList.get(indexof-9);
String host_name = (String)imgList.get(indexof-8);
String host_authors = (String)imgList.get(indexof-7);
String host_year = (String)imgList.get(indexof-6);
String pub_author = (String)imgList.get(indexof-5);
String pub_year = (String)imgList.get(indexof-4);
String pub_title = (String)imgList.get(indexof-3);

190
String pub_publisher = (String)imgList.get(indexof-2);
String pub_number = (String)imgList.get(indexof-1);
if (setshape.equals("Shape1")){
iList1.add(imgDir);
iList1.add(imgDesc);
iList1.add(spname);
iList1.add(authorship);
iList1.add(year);
iList1.add(host_name);
iList1.add(host_authors);
iList1.add(host_year);
iList1.add(pub_author);
iList1.add(pub_year);
iList1.add(pub_title);
iList1.add(pub_publisher);
iList1.add(pub_number);
}
..
else if (setshape.equals("Shape6")){
iList6.add(imgDir);
.. }
}
..
(xiii) Feature extraction
shapeRecognition.java (Model 1) & getImageShape.java (Model 2)
.. //polygonal coordinates to extract region (aka shape on the image)
s1 = boundingBox1.readFromFile(serverDir+"extFiles/box1.txt");
..
boundingBox1.java
.. // Skip comment.
br.readLine();
// For each line...
while(true)
{
String s = br.readLine();
if (s == null) break;
String[] tokens = s.split(" ");
int x = Integer.parseInt(tokens[0]);
int y = Integer.parseInt(tokens[1]);
pol.addPoint(x,y);
}
..
(xiv) Defining feature space
shapeRecognition.java (Model 1)
.. //**TEST IMAGE**//
imageROI inROI1 = new imageROI(inImage,s1);
.. //FEATURE VECTOR FOR TEST IMAGE
//get pixel mean value for test image
inImgMean1 = inROI1.getMean();
.. //FEATURES VECTOR FOR TRAINING SET
//get pixel mean value of all pixels in each region in tsImage[] array
and store into variable ts_means[0]
double[] ts_means = r.getMean();
cts_means[o] = ts_means[0];
..

191
getImageShape.java (Model 2)
.. //**TEST IMAGE**//
imageROI inROI1 = new imageROI(inImage,s1);
.. //FEATURE VECTOR FOR TEST IMAGE
//get pixel mean value for test image
inImgMean1 = inROI1.getMean();
.. //for shape classification / shape matching (i)input image (ii)
polygonal coordinates for bounding box (iii) training set
List<String> retrievedImgs1 = new
shapeMatching().findNearest(inImgMean1[0], s1, iList1);
..
shapeMatching.java (Model 2)
.. imageROI r = new imageROI(tsImg[o],s);
//FEATURES VECTOR FOR TRAINING SET
//get pixel mean value of all pixels in each region in
tsImage[] array and store into variable ts_means[0]
double[] ts_means = r.getMean();
//System.out.format("Mean %5.2f\n",ts_means[0]);
..
imageROI.java
.. // Calculate the number of points on that region.
numberOfPixels = 0;
// Use the bounding box to speed things.
for(int h=boundingBox.y;h<boundingBox.y+boundingBox.height;h++)
{ //System.out.println("h: " + boundingBox.y);
for(int w=boundingBox.x;w<boundingBox.x+boundingBox.width;w++)
{
if (roi.contains(w,h))
numberOfPixels++;
}
}
.. public double[] getMean()
{
double[] mean = new double[numBands];
// For all pixels on the image and polygon bounds
.. // Is this point inside the polygon ?
if (roi.contains(w,h))
{
// Get the array of values for the pixel
on the w,h coordinate.
double[] pixel = new double[numBands];
raster.getPixel(w,h,pixel);
for(int b=0;b<numBands;b++) mean[b] +=
pixel[b];
}
.. for(int b=0;b<numBands;b++) mean[b] /= numberOfPixels;
return mean;
}
..

192
(xv) Similarity comparison
shapeRecognition.java (Model 1)
.. //**SIMILARITY COMPARISON**//
//findNearest(inImgMean[0], s, others);
.. List<String> retrievedImgs = findNearest(inImgMean[0], s,
others); //for shape classification / shape matching (i)input image (ii)
polygonal coordinates for bounding box (iii) training set
.. //function: to calculate the distance and find the nearest similar to
test image
private List<String> findNearest(double tImage, Shape s, File[] cList)
throws IOException {
// TODO Auto-generated method stub
//read images in training set (others[]) and store the
information of each images in tsImage[] array
//get number of images in the training set
int y = cList.length;
System.out.println("\nLength training set [y]: "+ y);
double[] cts_means = new double[y];
double[] cts_means_round = new double[y];
double[] distN = new double[y];
String [] cFname = new String [y];
List<String> dataList = new ArrayList<String>();
..
cts_means[o] = ts_means[0];
double dist = (Math.sqrt((tImage - ts_means[0])*(tImage -
ts_means[0])));
double roundDist = Math.round(dist*100)/100.0d; //decimal
format - #.##
distN[o] = roundDist;
}
..
shapeMatching.java (Model 2)
.. public List<String> findNearest(double tImage, Shape s, List cList) throws
IOException {
.. //get number of images in the training set
//int y = cList.length;
int y1 = cList.size();
int y2 = y1/13;
.. //SIMILARITY COMPARISON
cts_means[o] = ts_means[0];
double dist = (Math.sqrt((tImage - ts_means[0])*(tImage -
ts_means[0])));
//DecimalFormat df = new DecimalFormat ("#.##");
double roundDist = Math.round(dist*100)/100.0d; //decimal format
- #.##
distN[o] = roundDist;
..

193
(xvi) Indexing and retrieval
shapeRecognition.java
.. private List<String> findNearest(double tImage, Shape s, File[] cList) throws
IOException {
.. //sorting distance, distN array in descending order
for (int p1=0; p1 < y-1 ; p1++) {
for (int p2=p1 + 1; p2 < y ; p2++) {
if (distN[p1] > distN[p2]) {
double temptDist = distN[p1];
distN[p1] = distN[p2];
distN[p2] = temptDist;
String tempFname = cFname[p1];
cFname[p1] = cFname[p2];
cFname[p2] = tempFname;
double tempcts_means_round = cts_means_round[p1];
cts_means_round[p1] = cts_means_round[p2];
cts_means_round[p2] = tempcts_means_round;
}
}
}
.. shapeMatching.java
.. public List<String> findNearest(double tImage, Shape s, List cList)
throws IOException {
.. //sorting distance, distN array in descending order
for (int p1=0; p1 < y2-1 ; p1++) {
for (int p2=p1 + 1; p2 < y2 ; p2++) {
if (distN[p1] > distN[p2]) {
double temptDist = distN[p1];
distN[p1] = distN[p2];
distN[p2] = temptDist;
.. String tempPubNumber = pub_number[p1];
pub_number[p1] = pub_number[p2];
pub_number[p2] = tempPubNumber;
}
}
}
..
(xvii) Result page (Model 1)
allresultimg2.jsp
.. <tr>
<td align="center" colspan=2><table width="100%" border="1"
cellspacing="0" cellpadding="0" colspan="2">
<tr>
<td align="center" colspan=3 bgcolor="#99CCCC"><p
CLASS="nounderline"><a name="U-shape"><b>U-shape</b></a><br><a href="#b2t">[back
to top]</a></p></td>
</tr>
<tr>
<td bgcolor="#666666"><font
color="#ffffff"><b>Image</b></font></td>
<td bgcolor="#666666"><font color="#ffffff"><b>Mean
pixel</b></font></td>
<td bgcolor="#666666"><font color="#ffffff"><b>Euclidean Distance
measure</b></font></td>
</tr>
<%
for (i=imgList2.iterator(); i.hasNext(); ) {

194
%>
<tr>
<td><p><img src="<%= serURLtImg+i.next()%>" width="200"
height="100"></p></td>
<td><%= i.next() %></td>
<td><%= i.next() %></td>
</tr>
<% }
%>
</table></td>
</tr>
..
(xviii) Result page (Model 2)
getImageShape.java
.. String pageall = "/getResultAll.jsp"; //if against all the shapes
.. List<String> retrievedImgs1 = new
shapeMatching().findNearest(inImgMean1[0], s1, iList1);
.. //pass result to be displayed at 'page' jsp file
request.setAttribute("testImg", testImg);
request.setAttribute("classRank", cRank);
request.setAttribute("retrievedImgs1", retrievedImgs1);
.. getResultAll.jsp
.. <tr>
<td align="center" colspan=2><table width="100%" border="1"
cellspacing="0" cellpadding="0" colspan="2">
<tr>
<td align="center" colspan=3 bgcolor="#99CCCC"><p
CLASS="nounderline"><a name="U-shape"><b>U-shape</b></a><br><a href="#b2t">[back
to top]</a></p></td>
</tr>
<tr>
<td bgcolor="#666666"><font
color="#ffffff"><b>Image</b></font></td>
<td bgcolor="#666666"><font color="#ffffff"><b>Distance
measure</b></font></td>
<td bgcolor="#666666"><font
color="#ffffff"><b>Details</b></font></td>
</tr>
<%
for (int x=0; x < c22; x++) {
%>
<tr>
<td><p><img src="<%= serURLtImg+imgDir2[x]%>" width="200"
height="100"></p></td>
<td><%=distN2[x]%></td>
<td align="left"><p><b>Description:</b> <%=imgDesc2[x]%><br>
<b>Taxon:</b> <i><%=spname2[x]%></i> <%=authorship2[x]%>,
<%=year2[x]%><br>
<b>Host:</b> <i><%=host_name1[x]%></i> <%=host_authors2[x]%>,
<%=host_year2[x]%><br>
<b>Publication:</b> <%=pub_author2[x]%> (<%=pub_year2[x]%>).
<%=pub_title2[x]%>. <%=pub_publisher2[x]%>. <%=pub_number2[x]%><br><br>
[<a
href="http://202.185.70.193:8080/Monogenean/getDetails.jsp?param=<%=imgDir2[x]%>
¶m=<%=spname1[x]%>¶m=<%=authorship2[x]%>¶m=<%=year2[x]%>
¶m=<%=host_name2[x]%>¶m=<%=host_authors2[x]%>¶m=<%=host_year2[x]%>
¶m=<%=imgDesc2[x]%>
¶m=<%=pub_author2[x]%>¶m=<%=pub_year2[x]%>¶m=<%=pub_title2[x]%>
m=<%=pub_publisher2[x]%>¶m=<%=pub_number2[x]%>"
target="_blank">View Full Details</a>]
</p></td>

195
</tr>
..
getDetails.jsp
.. <tr>
<td align="center" colspan=2 style="font-weight:bold;font-
size:20pt;"><p>Image Full Details</p></td>
</tr>
<tr>
<td width="50%"><table width="100%" border="0" cellspacing="0"
cellpadding="0">
<%
for (i=params.iterator(); i.hasNext(); ) {
%>
<tr>
<td bgcolor="#666666"><span class="style1">Haptoral bar</span></td>
</tr>
<tr>
<td><p><img src="<%= serURLtImg+i.next()%>" width="200"
height="100"></p></td>
</tr>
<tr>
<td bgcolor="#666666"><span class="style1">Scientific classification
(Taxon) </span></td>
</tr>
.. <tr>
<td bgcolor="#666666"><span class="style1">References</span></td>
</tr>
<tr>
<td> <%= i.next() %> (<%= i.next()%>). <%= i.next()%>. <%=
i.next()%>. <%= i.next()%></td>
</tr>
</table></td>
<%
}
%>
</tr>
..

196
Appendix C – Sample of Ontology OWL Codes and RDF Graph Data Code
(i) Ontology OWL code for the MHBI-Fish Ontology (MonogeneanKb1.owl)
<?xml version="1.0"?>
<!DOCTYPE rdf:RDF [
<!ENTITY owl "http://www.w3.org/2002/07/owl#" >
<!ENTITY xsd "http://www.w3.org/2001/XMLSchema#" >
<!ENTITY rdfs "http://www.w3.org/2000/01/rdf-schema#" >
<!ENTITY rdf "http://www.w3.org/1999/02/22-rdf-syntax-ns#" >
<!ENTITY FishOnt "http://202.185.70.191/Monogenean/Ontologies/FishOnt.owl#"
>
<!ENTITY TaxonRank
"http://202.185.70.191/Monogenean/Ontologies/TaxonRank.owl#" >
]>
<rdf:RDF xmlns="http://202.185.70.191/Monogenean/Ontologies/MonogeneanKB1.owl#"
xml:base="http://202.185.70.191/Monogenean/Ontologies/MonogeneanKB1.owl"
xmlns:rdfs="http://www.w3.org/2000/01/rdf-schema#"
xmlns:owl="http://www.w3.org/2002/07/owl#"
xmlns:xsd="http://www.w3.org/2001/XMLSchema#"
xmlns:rdf="http://www.w3.org/1999/02/22-rdf-syntax-ns#"
xmlns:TaxonRank="http://202.185.70.191/Monogenean/Ontologies/TaxonRank.owl#"
xmlns:FishOnt="http://202.185.70.191/Monogenean/Ontologies/FishOnt.owl#">
<owl:Ontology
rdf:about="http://202.185.70.191/Monogenean/Ontologies/MonogeneanKB1.owl">
<owl:imports
rdf:resource="http://202.185.70.191/Monogenean/Ontologies/FishOnt.owl"/>
</owl:Ontology>
<!--
////////////////////////////////////////////////////////////////////////////////
// Object Properties
////////////////////////////////////////////////////////////////////////////////
-->
<!--
http://202.185.70.191/Monogenean/Ontologies/MonogeneanKB1.owl#basionymFor -->
<owl:ObjectProperty
rdf:about="http://202.185.70.191/Monogenean/Ontologies/MonogeneanKB1.owl#basiony
mFor"/>
..
<!--
////////////////////////////////////////////////////////////////////////////////
// Data properties
////////////////////////////////////////////////////////////////////////////////
-->
<!--
http://202.185.70.191/Monogenean/Ontologies/MonogeneanKB1.owl#authorship -->
<owl:DatatypeProperty
rdf:about="http://202.185.70.191/Monogenean/Ontologies/MonogeneanKB1.owl#authors
hip">
<rdfs:subPropertyOf rdf:resource="&owl;topDataProperty"/>
</owl:DatatypeProperty>
..
<!--
////////////////////////////////////////////////////////////////////////////////
// Classes
////////////////////////////////////////////////////////////////////////////////
-->
<!-- http://202.185.70.191/Monogenean/Ontologies/FishOnt.owl#TaxonName -->
<owl:Class rdf:about="&FishOnt;TaxonName"/>
..
<!--
////////////////////////////////////////////////////////////////////////////////
// Individuals
////////////////////////////////////////////////////////////////////////////////

197
-->
..
<!--
http://202.185.70.191/Monogenean/Ontologies/MonogeneanKB1.owl#HeteroAsymmetricus
-->
<owl:NamedIndividual
rdf:about="http://202.185.70.191/Monogenean/Ontologies/MonogeneanKB1.owl#HeteroA
symmetricus">
<rdf:type
rdf:resource="http://202.185.70.191/Monogenean/Ontologies/MonogeneanKB1.owl#Taxo
nName"/>
<year>1988</year>
<authorship>Majumdar, Ramchandrula, Trupati & Agrawal</authorship>
<nameComplete>Heteronchocleidus asymmetricus</nameComplete>
<isBelong
rdf:resource="http://202.185.70.191/Monogenean/Ontologies/MonogeneanKB1.owl#Hete
ronchocleidus"/>
<rank
rdf:resource="http://202.185.70.191/Monogenean/Ontologies/MonogeneanKB1.owl#Spec
ies"/>
</owl:NamedIndividual>
<!--
http://202.185.70.191/Monogenean/Ontologies/MonogeneanKB1.owl#HeteroAthari -->
<owl:NamedIndividual
rdf:about="http://202.185.70.191/Monogenean/Ontologies/MonogeneanKB1.owl#HeteroA
thari">
<rdf:type
rdf:resource="http://202.185.70.191/Monogenean/Ontologies/MonogeneanKB1.owl#Taxo
nName"/>
<year>1986</year>
<authorship>Pandey & Mehta</authorship>
<nameComplete>Heteronchocleidus athari</nameComplete>
<isBelong
rdf:resource="http://202.185.70.191/Monogenean/Ontologies/MonogeneanKB1.owl#Hete
ronchocleidus"/>
<rank
rdf:resource="http://202.185.70.191/Monogenean/Ontologies/MonogeneanKB1.owl#Spec
ies"/>
</owl:NamedIndividual>
..

198
Ontology OWL code for the Fish Ontology (FishOnt.owl)
<?xml version="1.0"?>
<!DOCTYPE rdf:RDF [
<!ENTITY owl "http://www.w3.org/2002/07/owl#" >
<!ENTITY xsd "http://www.w3.org/2001/XMLSchema#" >
<!ENTITY rdfs "http://www.w3.org/2000/01/rdf-schema#" >
<!ENTITY rdf "http://www.w3.org/1999/02/22-rdf-syntax-ns#" >
<!ENTITY TaxonRank
"http://202.185.70.191/Monogenean/Ontologies/TaxonRank.owl#" >
]>
<rdf:RDF xmlns="http://202.185.70.191/Monogenean/Ontologies/FishOnt.owl#"
xml:base="http://202.185.70.191/Monogenean/Ontologies/FishOnt.owl"
xmlns:rdfs="http://www.w3.org/2000/01/rdf-schema#"
xmlns:owl="http://www.w3.org/2002/07/owl#"
xmlns:xsd="http://www.w3.org/2001/XMLSchema#"
xmlns:rdf="http://www.w3.org/1999/02/22-rdf-syntax-ns#"
xmlns:TaxonRank="http://202.185.70.191/Monogenean/Ontologies/TaxonRank.owl#">
<owl:Ontology
rdf:about="http://202.185.70.191/Monogenean/Ontologies/FishOnt.owl">
<owl:imports
rdf:resource="http://202.185.70.191/Monogenean/Ontologies/TaxonRank.owl"/>
</owl:Ontology>
<!--
////////////////////////////////////////////////////////////////////////////////
// Datatypes
////////////////////////////////////////////////////////////////////////////////
-->
<!--
////////////////////////////////////////////////////////////////////////////////
// Object Properties
////////////////////////////////////////////////////////////////////////////////
-->
<!-- http://202.185.70.191/Monogenean/Ontologies/FishOnt.owl#authorTeam -->
<owl:ObjectProperty
rdf:about="http://202.185.70.191/Monogenean/Ontologies/FishOnt.owl#authorTeam"/>
..
<!--
////////////////////////////////////////////////////////////////////////////////
// Data properties
////////////////////////////////////////////////////////////////////////////////
-->
<!-- http://202.185.70.191/Monogenean/Ontologies/FishOnt.owl#authorship -->
<owl:DatatypeProperty
rdf:about="http://202.185.70.191/Monogenean/Ontologies/FishOnt.owl#authorship">
<rdfs:subPropertyOf rdf:resource="&owl;topDataProperty"/>
</owl:DatatypeProperty>
..
<!--
////////////////////////////////////////////////////////////////////////////////
// Classes
////////////////////////////////////////////////////////////////////////////////
-->
<!-- http://202.185.70.191/Monogenean/Ontologies/FishOnt.owl#TaxonName -->
<owl:Class
rdf:about="http://202.185.70.191/Monogenean/Ontologies/FishOnt.owl#TaxonName"/>
..
<!--
////////////////////////////////////////////////////////////////////////////////
// Individuals
////////////////////////////////////////////////////////////////////////////////
-->
<!-- http://202.185.70.191/Monogenean/Ontologies/FishOnt.owl#Ang -->
<owl:NamedIndividual
rdf:about="http://202.185.70.191/Monogenean/Ontologies/FishOnt.owl#Ang">

199
<rdf:type
rdf:resource="http://202.185.70.191/Monogenean/Ontologies/FishOnt.owl#TaxonName"
/>
<authorship>null</authorship>
<nameComplete>Anguilliformes</nameComplete>
<year>null</year>
<hasFamily
rdf:resource="http://202.185.70.191/Monogenean/Ontologies/FishOnt.owl#AngAng"/>
<hasFamily
rdf:resource="http://202.185.70.191/Monogenean/Ontologies/FishOnt.owl#AngMur"/>
<rank rdf:resource="&TaxonRank;Order"/>
</owl:NamedIndividual>
..

200
RDF graph data code
mKBase: <ModelCom
{http://202.185.70.191/Monogenean/Ontologies/MonogeneanKB1.owl @rdf:type
owl:Ontology; http://202.185.70.191/Monogenean/Ontologies/MonogeneanKB1.owl
@owl:imports http://202.185.70.191/Monogenean/Ontologies/FishOnt.owl;
http://202.185.70.191/Monogenean/Ontologies/MonogeneanKB1.owl#basionymFor
@rdf:type owl:ObjectProperty;
http://202.185.70.191/Monogenean/Ontologies/MonogeneanKB1.owl#fullImage
@rdf:type owl:ObjectProperty;
http://202.185.70.191/Monogenean/Ontologies/MonogeneanKB1.owl#fullImage
@rdfs:subPropertyOf
http://202.185.70.191/Monogenean/Ontologies/MonogeneanKB1.owl#part;
http://202.185.70.191/Monogenean/Ontologies/MonogeneanKB1.owl#hasBasionym
@rdf:type owl:ObjectProperty;
http://202.185.70.191/Monogenean/Ontologies/MonogeneanKB1.owl#hasFamily
@rdf:type owl:ObjectProperty;
http://202.185.70.191/Monogenean/Ontologies/MonogeneanKB1.owl#hasGenus @rdf:type
owl:ObjectProperty;
http://202.185.70.191/Monogenean/Ontologies/MonogeneanKB1.owl#hasGenus
@rdfs:range
http://202.185.70.191/Monogenean/Ontologies/MonogeneanKB1.owl#TaxonName;
http://202.185.70.191/Monogenean/Ontologies/MonogeneanKB1.owl#hasOrder @rdf:type
owl:ObjectProperty;
http://202.185.70.191/Monogenean/Ontologies/MonogeneanKB1.owl#hasSpecies
@rdf:type owl:ObjectProperty;
http://202.185.70.191/Monogenean/Ontologies/MonogeneanKB1.owl#hasSpecies
@rdfs:range
http://202.185.70.191/Monogenean/Ontologies/MonogeneanKB1.owl#TaxonName;
http://202.185.70.191/Monogenean/Ontologies/MonogeneanKB1.owl#hostCollection
@rdf:type owl:ObjectProperty;
http://202.185.70.191/Monogenean/Ontologies/MonogeneanKB1.owl#isBar @rdf:type
owl:ObjectProperty;
http://202.185.70.191/Monogenean/Ontologies/MonogeneanKB1.owl#isBar
@owl:equivalentProperty
http://202.185.70.191/Monogenean/Ontologies/MonogeneanKB1.owl#isHaptor;
http://202.185.70.191/Monogenean/Ontologies/MonogeneanKB1.owl#isBar
@owl:equivalentProperty
http://202.185.70.191/Monogenean/Ontologies/MonogeneanKB1.owl#isHaptorBar;
http://202.185.70.191/Monogenean/Ontologies/MonogeneanKB1.owl#isBar
@rdfs:subPropertyOf
http://202.185.70.191/Monogenean/Ontologies/MonogeneanKB1.owl#part;
http://202.185.70.191/Monogenean/Ontologies/MonogeneanKB1.owl#isBelong @rdf:type
owl:ObjectProperty;
http://202.185.70.191/Monogenean/Ontologies/MonogeneanKB1.owl#isCitedIn
@rdf:type owl:ObjectProperty;
http://202.185.70.191/Monogenean/Ontologies/MonogeneanKB1.owl#isCitedIn
@rdfs:subPropertyOf owl:topObjectProperty;
..
http://202.185.70.191/Monogenean/Ontologies/TaxonRank.owl @rdf:type
owl:Ontology; :TaxonRankTerm @rdf:type owl:Class; :Bio-Variety @rdf:type
owl:NamedIndividual; :Bio-Variety @rdf:type :TaxonRankTerm; :Candidate @rdf:type
owl:NamedIndividual; :Candidate @rdf:type :TaxonRankTerm; :Class @rdf:type
owl:NamedIndividual; :Class @rdf:type :TaxonRankTerm; :Convar @rdf:type
owl:NamedIndividual; :Convar @rdf:type :TaxonRankTerm; :Cultivar @rdf:type
owl:NamedIndividual; :Cultivar @rdf:type :TaxonRankTerm; :Cultivar-Group
@rdf:type owl:NamedIndividual; :Cultivar-Group @rdf:type :TaxonRankTerm;
:DenominationClass @rdf:type owl:NamedIndividual; :DenominationClass @rdf:type
:TaxonRankTerm; :Division @rdf:type owl:NamedIndividual; :Division @rdf:type
:TaxonRankTerm; :Domain @rdf:type owl:NamedIndividual; :Domain @rdf:type
:TaxonRankTerm; :Empire @rdf:type owl:NamedIndividual; :Empire @rdf:type
:TaxonRankTerm; :Family @rdf:type owl:NamedIndividual; :Family @rdf:type
:TaxonRankTerm; :Form @rdf:type owl:NamedIndividual; :Form @rdf:type
:TaxonRankTerm; :Genus @rdf:type owl:NamedIndividual; :Genus @rdf:type
:TaxonRankTerm; :Graft-Chimaera @rdf:type owl:NamedIndividual; :Graft-Chimaera
@rdf:type :TaxonRankTerm; :Grex @rdf:type owl:NamedIndividual; :Grex @rdf:type
:TaxonRankTerm; :Infraclass @rdf:type owl:NamedIndividual; :Infraclass @rdf:type
:TaxonRankTerm; :Infradivision @rdf:type owl:NamedIndividual; :Infradivision
@rdf:type :TaxonRankTerm; :Infrafamily @rdf:type owl:NamedIndividual;
:Infrafamily @rdf:type :TaxonRankTerm; :InfragenericTaxon @rdf:type
owl:NamedIndividual; :InfragenericTaxon @rdf:type :TaxonRankTerm; :Infragenus
@rdf:type owl:NamedIndividual; :Infragenus @rdf:type :TaxonRankTerm;
:Infrakingdom @rdf:type owl:NamedIndividual; :Infrakingdom @rdf:type
:TaxonRankTerm; :Infraorder @rdf:type owl:NamedIndividual; :Infraorder @rdf:type
:TaxonRankTerm; :Infraphylum @rdf:type owl:NamedIndividual; :Infraphylum
@rdf:type :TaxonRankTerm; :Infraspecies @rdf:type owl:NamedIndividual;
:Infraspecies @rdf:type :TaxonRankTerm; :InfraspecificTaxon @rdf:type

201
owl:NamedIndividual; :InfraspecificTaxon @rdf:type :TaxonRankTerm; :Infratribe
@rdf:type owl:NamedIndividual; :Infratribe @rdf:type :TaxonRankTerm; :Order
@rdf:type owl:NamedIndividual; :Order @rdf:type :TaxonRankTerm; :Patho-Variety
@rdf:type owl:NamedIndividual; :Patho-Variety @rdf:type :TaxonRankTerm; :Phylum
@rdf:type owl:NamedIndividual; :Phylum @rdf:type :TaxonRankTerm; :Section
@rdf:type owl:NamedIndividual; :Section @rdf:type :TaxonRankTerm; :Series
@rdf:type owl:NamedIndividual; :Series @rdf:type :TaxonRankTerm; :SpecialForm
@rdf:type owl:NamedIndividual; :SpecialForm @rdf:type :TaxonRankTerm; :Species
@rdf:type owl:NamedIndividual; :Species @rdf:type :TaxonRankTerm;
:SpeciesAggregate @rdf:type owl:NamedIndividual; :SpeciesAggregate @rdf:type
:TaxonRankTerm; :Sub-Sub-Variety @rdf:type owl:NamedIndividual; :Sub-Sub-Variety
@rdf:type :TaxonRankTerm; :Sub-Variety @rdf:type owl:NamedIndividual; :Sub-
Variety @rdf:type :TaxonRankTerm; :Subclass @rdf:type owl:NamedIndividual;
:Subclass @rdf:type :TaxonRankTerm; :Subdivision @rdf:type owl:NamedIndividual;
:Subdivision @rdf:type :TaxonRankTerm; :Subfamily @rdf:type owl:NamedIndividual;
:Subfamily @rdf:type :TaxonRankTerm; :Subform @rdf:type owl:NamedIndividual;
:Subform @rdf:type :TaxonRankTerm; :Subgenus @rdf:type owl:NamedIndividual;
:Subgenus @rdf:type :TaxonRankTerm; :Subkingdom @rdf:type owl:NamedIndividual;
:Subkingdom @rdf:type :TaxonRankTerm; :Suborder @rdf:type owl:NamedIndividual;
:Suborder @rdf:type :TaxonRankTerm; :Subphylum @rdf:type owl:NamedIndividual;
:Subphylum @rdf:type :TaxonRankTerm; :Subsection @rdf:type owl:NamedIndividual;
:Subsection @rdf:type :TaxonRankTerm; :Subseries @rdf:type owl:NamedIndividual;
:Subseries @rdf:type :TaxonRankTerm; :Subspecies @rdf:type owl:NamedIndividual;
:Subspecies @rdf:type :TaxonRankTerm; :SubspecificAggregate @rdf:type
owl:NamedIndividual; :SubspecificAggregate @rdf:type :TaxonRankTerm; :Subsubform
@rdf:type owl:NamedIndividual; :Subsubform @rdf:type :TaxonRankTerm; :Subtribe
@rdf:type owl:NamedIndividual; :Subtribe @rdf:type :TaxonRankTerm; :SuperKingdom
@rdf:type owl:NamedIndividual; :SuperKingdom @rdf:type :TaxonRankTerm;
:Superclass @rdf:type owl:NamedIndividual; :Superclass @rdf:type :TaxonRankTerm;
:Superdivision @rdf:type owl:NamedIndividual; :Superdivision @rdf:type
:TaxonRankTerm; :Superfamily @rdf:type owl:NamedIndividual; :Superfamily
@rdf:type :TaxonRankTerm; :Superorder @rdf:type owl:NamedIndividual; :Superorder
@rdf:type :TaxonRankTerm; :Superphylum @rdf:type owl:NamedIndividual;
:Superphylum @rdf:type :TaxonRankTerm; :Supertribe @rdf:type
owl:NamedIndividual; :Supertribe @rdf:type :TaxonRankTerm; :SupragenericTaxon
@rdf:type owl:NamedIndividual; :SupragenericTaxon @rdf:type :TaxonRankTerm;
:Tribe @rdf:type owl:NamedIndividual; :Tribe @rdf:type :TaxonRankTerm; :Varietry
@rdf:type owl:NamedIndividual; :Varietry @rdf:type :TaxonRankTerm} | >

202
Appendix D – Sample of Test Cases
Model 1
(i) Upload query image
Test case – Upload query image
Test description – to verify the query image is uploaded
Test execution:
Click ‘Browse’ button -> ‘Choose File to Upload’ dialog box appears
Select a file image to upload
Click ‘Open’ -> The image file path appears on the text box
Click ‘Upload’ button -> The entered value is sent into the application for query
processing
Click ‘Reset’ button -> To clear all the entered values
Expected results – The image file path appears on the text
Actual results – Pass. The image file path appeared on the text
(ii) Image retrieval
Test case – Image retrieval
Test description – to verify the retrieved images
Test execution:
A query image must be uploaded in the server and displayed in Query Image
Check a value for ‘Select training set’ -> against all images in the database or
against images with selected shape
Click ‘Start’ button -> The entered values are sent into the application for
performing image retrieval
Once the process is completed, the retrieved images will be displayed in ranked
order
Expected results – The retrieved images are displayed in ranked order
Actual results – Pass. The retrieved images are displayed in ranked order

203
Model 2
(i) Upload query image and select images for training set
Test case – Upload query image and select images for training set
Test description – to verify the query image is uploaded and training set images
option is selected
Test execution:
Click ‘Browse’ button -> ‘Choose File to Upload’ dialog box appears
Select a file image to upload
Click ‘Open’ -> The image file path appears on the text box
Check a value for ‘Select training set’
Click ‘Upload’ button -> The entered values are sent into the application for
query processing
Click ‘Reset’ button -> To clear all the entered values
Expected results – The image file path appears on the text box and one of the
options for the training set is checked
Actual results – Pass. The image file path appeared on the text box and one of
the options for the training set is checkeded
(ii) Image retrieval
Test case – Image retrieval
Test description – to verify the retrieved images
Test execution:
A query image must be uploaded in the server and displayed in Query Image.
The selected images to be used for training set are displayed in the Training Set.
Click ‘Start’ button -> The entered values are sent into the application for
performing image retrieval
Once the process is completed, the retrieved images will be displayed in ranked
order with their annotation
Expected results – The retrieved images are displayed in ranked order with their
annotations
Actual results – Pass. The retrieved images are displayed in ranked order with
their annotations

204
Appendix E – Retrieval Results
(i) Model 1
Query
image
Retrieved images
ε: Euclidean distance
Visual comparison – ∕: Relevant; ×: Irrelevant
Relevant
images
(out of 10) Rank 1 2 3 4 5 6 7 8 9 10
6 ε 0.05 0.05 0.09 0.16 0.19 0.24 0.26 0.27 0.37 0.42
Visual comparison ∕ ∕ × ∕ ∕ × × ∕ ∕ ×
3 ε 0.04 0.15 0.16 0.19 0.25 0.33 0.49 0.52 0.57 0.63
Visual comparison ∕ × × × ∕ ∕ × × × ×
3 ε 0.14 0.16 0.24 0.30 0.46 0.60 1.03 1.35 1.46 1.47
Visual
comparison ∕ ∕ × × ∕ × × × × ×
10 ε 0.08 0.08 0.22 0.27 0.38 0.72 0.87 1.83 2.28 2.75
Visual
comparison ∕ ∕ ∕ ∕ ∕ ∕ ∕ ∕ ∕ ∕
7 ε 0.04 0.77 1.07 1.26 1.52 1.59 1.61 1.77 1.82 1.86
Visual
comparison ∕ × × ∕ ∕ ∕ × ∕ ∕ ∕

205
Model 1, continued
Query
image
Retrieved images
ε: Euclidean distance
Visual comparison – ∕: Relevant; ×: Irrelevant
Relevant
images
(out of 10) Rank 1 2 3 4 5 6 7 8 9 10
6 ε 0.45 0.52 0.72 0.75 0.80 0.83 0.98 1.03 1.21 1.28
Visual comparison × ∕ ∕ × × × ∕ ∕ ∕ ∕
1 ε 0.43 0.54 0.79 1.51 2.01 2.38 2.55 3.95 5.83 6.48
Visual comparison × ∕ × × × × × × × ×
6 ε 0.06 0.25 0.26 0.35 0.49 0.50 0.52 061 0.96 1.62
Visual
comparison ∕ ∕ ∕ × ∕ ∕ × ∕ × ×
6 ε 1.21 1.59 1.72 2.95 3.19 3.39 3.48 3.49 3.66 3.77
Visual
comparison ∕ ∕ × ∕ × × ∕ × ∕ ∕
8 ε 0.21 0.25 0.28 0.30 0.34 0.42 0.45 0.52 0.78 0.95
Visual
comparison ∕ × ∕ ∕ ∕ ∕ ∕ × ∕ ∕

206
Model 1, continued
Query
image
Retrieved images
ε: Euclidean distance
Visual comparison – ∕: Relevant; ×: Irrelevant
Relevant
images
(out of 10) Rank 1 2 3 4 5 6 7 8 9 10
7 ε 0.11 0.18 0.32 0.34 0.37 0.50 0.55 0.56 0.61 0.66
Visual comparison ∕ ∕ ∕ × ∕ × ∕ ∕ ∕ ×
6 ε 0.01 0.05 0.16 0.18 0.44 0.67 0.67 0.86 1.01 1.10
Visual comparison ∕ ∕ ∕ × × ∕ × ∕ ∕ ×
6 ε 0.02 0.03 0.20 0.35 0.35 0.37 0.43 0.45 0.49 0.53
Visual
comparison × ∕ ∕ ∕ ∕ × ∕ ∕ × ×
4 ε 0.01 0.13 0.17 0.25 0.26 0.41 0.58 0.59 0.71 0.71
Visual
comparison × × × × × ∕ × ∕ ∕ ∕
4 ε 0.17 0.25 0.53 0.68 0.83 1.04 1.09 1.28 1.47 1.75
Visual
comparison × ∕ × ∕ ∕ × ∕ × × ×

207
Model 1, continued
Query
image
Retrieved images
ε: Euclidean distance
Visual comparison – ∕: Relevant; ×: Irrelevant
Relevant
images
(out of 10) Rank 1 2 3 4 5 6 7 8 9 10
3 ε 0.01 0.08 0.09 0.40 0.52 0.60 0.68 0.71 0.74 0.75
Visual comparison × × × × × ∕ × × ∕ ∕
0 ε 0.1 0.3 0.34 0.46 0.45 0.6 0.86 0.87 0.99 1.25
Visual comparison × × × × × × × × × ×
2 ε 0.09 0.15 0.16 0.16 0.16 0.42 0.49 0.49 0.55 0.73
Visual
comparison × × × × × × ∕ × ∕ ×
1 ε 0.68 0.87 0.87 1.23 2.45 2.82 2.91 2.99 3.92 4.39
Visual
comparison × × × × × × × × ∕ ×

208
(ii) Model 2
Query
image
Retrieved images
ε: Euclidean distance
Visual comparison – ∕: Relevant; ×: Irrelevant
Relevant
images
(out of 10) Rank 1 2 3 4 5 6 7 8 9 10
4 ε 0.19 0.24 0.42 0.72 1.17 1.25 1.26 1.30 1.33 1.36
Visual comparison ∕ × × ∕ × × × ∕ × ∕
4 ε 0.16 0.25 0.57 0.84 0.89 1.00 1.38 1.54 1.69 1.85
Visual comparison × ∕ × × ∕ × × × ∕ ∕
3 ε 0.14 0.24 0.60 1.35 1.48 1.82 1.82 2.12 2.16 2.19
Visual
comparison ∕ × × × × ∕ × ∕ × ×
10 ε 0.08 0.08 0.22 0.38 0.72 0.87 2.28 2.75 3.50 3.83
Visual
comparison ∕ ∕ ∕ ∕ ∕ ∕ ∕ ∕ ∕ ∕
10 ε 0.04 1.26 1.52 1.59 1.77 1.82 1.86 2.16 2.46 3.33
Visual
comparison ∕ ∕ ∕ ∕ ∕ ∕ ∕ ∕ ∕ ∕

209
Model 2, continued
Query
image
Retrieved images
ε: Euclidean distance
Visual comparison – ∕: Relevant; ×: Irrelevant
Relevant
images
(out of 10) Rank 1 2 3 4 5 6 7 8 9 10
9 ε 0.52 0.72 0.98 1.03 1.21 1.28 1.39 1.54 2.41 4.36
Visual comparison ∕ ∕ ∕ ∕ ∕ ∕ ∕ ∕ ∕ ×
5 ε 0.54 1.38 1.51 1.65 2.95 3.05 3.53 3.61 4.45 4.67
Visual comparison ∕ ∕ × ∕ ∕ ∕ × × × ×
7 ε 0.06 0.26 0.50 0.61 1.62 1.64 1.66 1.76 1.78 1.81
Visual
comparison ∕ ∕ ∕ ∕ ∕ × ∕ ∕ × ×
7 ε 1.12 2.95 3.19 3.49 3.77 4.98 5.22 5.25 8.5 9.32
Visual
comparison ∕ ∕ × × ∕ ∕ ∕ ∕ × ∕
7 ε 0.25 0.28 0.30 0.52 0.78 0.95 1.05 1.06 1.16 1.21
Visual
comparison × ∕ ∕ × ∕ ∕ × ∕ ∕ ∕

210
Model 2, continued
Query
image
Retrieved images
ε: Euclidean distance
Visual comparison – ∕: Relevant; ×: Irrelevant
Relevant
images
(out of 10) Rank 1 2 3 4 5 6 7 8 9 10
8 ε 0.11 0.32 0.37 0.50 0.55 0.79 0.89 1.18 1.38 1.94
Visual comparison ∕ ∕ ∕ × ∕ × ∕ ∕ ∕ ∕
8 ε 0.01 0.05 0.16 0.18 0.86 1.01 1.12 1.12 1.24 1.67
Visual comparison ∕ ∕ ∕ × ∕ ∕ × ∕ ∕ ∕
8 ε 0.03 0.35 0.35 0.43 0.45 0.88 1.47 1.47 1.54 1.61
Visual
comparison ∕ ∕ ∕ ∕ ∕ ∕ × × ∕ ∕
9 ε 0.41 0.58 0.59 0.71 0.91 1.34 1.39 1.51 1.57 1.67
Visual
comparison ∕ × ∕ ∕ ∕ ∕ ∕ ∕ ∕ ∕
9 ε 0.25 0.83 1.09 1.28 2.13 2.26 2.26 2.40 2.74 2.92
Visual
comparison ∕ ∕ ∕ × ∕ ∕ ∕ ∕ ∕ ∕

211
Model 2, continued
Query
image
Retrieved images
ε: Euclidean distance
Visual comparison – ∕: Relevant; ×: Irrelevant
Relevant
images
(out of 10) Rank 1 2 3 4 5 6 7 8 9 10
6 ε 0.09 0.52 0.60 0.71 0.74 0.75 0.91 0.94 1.15 1.35
Visual comparison × × ∕ × ∕ ∕ ∕ ∕ ∕ ×
0 ε 0.87 0.99 1.02 1.05 1.26 2.03 2.36 2.46 2.47 2.52
Visual comparison × × × × × × × × × ×
1 ε 0.09 0.15 0.16 0.16 0.49 0.55 0.79 1.06 1.09 1.43
Visual
comparison × × × × × ∕ × × × ×
1 ε 0.87 0.87 1.23 2.45 2.82 2.91 2.99 3.92 4.39 5.60
Visual
comparison × × × × × × × ∕ × ×

212
REFERENCES
Abe, N., & Kudo, M. (2006). Non-parametric classifier-independent feature selection.
Pattern Recognition, 39(5), 737-746. doi: 10.1016/j.patcog.2005.11.007.
Abu, A., L.H.S. Lim, Amandeep S. Sidhu & Sarinder K. Dhillon (2013). Biodiversity
Image Retrieval Framework for Monogeneans. Systematics and Biodiversity,
11(1),19-33.
Adam, T. (2008). Using geometric morphometrics and standard morphometry to
discriminate three honeybee subspecies. Apidologie, 39, 558–563.
Agarwal, M., Venkatraghavan, V., Chakraborty, C., & Ray, A. K. (2011). A mirror
reflection and aspect ratio invariant approach to object recognition using Fourier
descriptor. Applied Soft Computing, 11(5), 3910-3915. doi:
10.1016/j.asoc.2011.01.020.
Ahmed, W. M., Lenz, D., Jia, L., Robinson, J. P., & Ghafoor, A. (2008). XML-Based
Data Model and Architecture for a Knowledge-Based Grid-Enabled Problem-
Solving Environment for High-Throughput Biological Imaging. Information
Technology in Biomedicine, IEEE Transactions on, 12(2), 226-240. doi:
10.1109/titb.2007.904153.
Andy, S., & James, B. (2012, 2009). MonoDb Homepage Retrieved August, 2011,
from http://www.monodb.org/index.php.
AntWeb. (2002). Antweb, 2011, from http://www.antweb.org.
Appeltans, W., Bouchet, P., Boxshall, G. A., De Broyer, C., de Voogd, N. J., Gordon,
D. P., . . . Costello, M. J. (2012). World Register of Marine Species Retrieved
December, 2010, from http://www.marinespecies.org/.
Araabi, B. N., Kehtarnavaz, N., McKinney, T., Hillman, G., & Würsig, B. (2000). A
String Matching Computer-Assisted System for Dolphin Photo Identification
Annals of Biomedical Engineering, 28(10), 1269-1279.
Ardovini, A., Cinque, L., & Sangineto, E. (2008). Identifying elephant photos by multi-
curve matching. Pattern Recognition, 41(6), 1867-1877. doi:
10.1016/j.patcog.2007.11.010.

213
Arevalillo-Herráez, M., Domingo, J., & Ferri, F. J. (2008). Combining similarity
measures in content-based image retrieval. Pattern Recognition Letters, 29(16),
2174-2181. doi: 10.1016/j.patrec.2008.08.003.
Avril, S. (2005). Ontology-Based Image Annotation and Retrieval. Master of Science,
University of Helsinki. Retrieved from
http://www.cs.helsinki.fi/u/astyrman/gradu.pdf.
Aye, K. N., & Thein, N. L. (2012). Efficient Indexing and Searching Framework for
Unstructured Data. In Z. L. Y. Zeng (Ed.), Fourth International Conference on
Machine Vision (Vol. 8349).
Barshan, B., Aytaç, T., & Yüzbaşıoǧlu, Ç. (2007). Target differentiation with simple
infrared sensors using statistical pattern recognition techniques. Pattern
Recognition, 40(10), 2607-2620. doi: 10.1016/j.patcog.2007.01.007.
Bass, L., Clements, P., & Kazman, R. (2003). Software Architecture in Practice (2nd
ed.): Pearson Education, Inc.
Beckett, D. (2004, August 2010). RDF/XML Syntax Specification (Revised). W3C
Recommendation 10 February 2004, from http://www.w3.org/TR/REC-rdf-
syntax/.
Belkasim, S. O., Shridhar, M., & Ahmadi, M. (1991). Pattern recognition with moment
invariants: A comparative study and new results. Pattern Recognition, 24(12),
1117-1138. doi: 10.1016/0031-3203(91)90140-z.
Ben Salem, Y., & Nasri, S. (2010). Automatic recognition of woven fabrics based on
texture and using SVM. Signal Image and Video Processing, 4(4), 429-434. doi:
10.1007/s11760-009-0132-5.
Bertrand, N., Schentz, H., Werf, B. V. D., Magagna, B., Peterseil, J., Parr, T., & Mirtl,
M. (2010). Semantic Data Integration of Biodiversity Data with the SERONTO
Ontology. Retrieved from http://www.e-biosphere09.org/posters/Semantic-
D5.pdf.
Biodiversity, A. C. f. (2005). ASEAN Centre for Biodiversity, 2011, from
http://www.aseanbiodiversity.org/.
. Biological databases introduction. (2010) Retrieved 6 October, 2010, from
http://www.bioinformaticstoday.com/viewpage/title/Biological-databases-
introduction/.

214
Bizer, C., & Westphal, D. (2007). Developers Guide to Semantic Web Toolkits for
different Programming Languages. Retrieved from http://www4.wiwiss.fu-
berlin.de/bizer/toolkits/
Bradski, G., & Kaehler, A. (2008). Learning OpenCV Computer Vision with the
OpenCV Library: O'Reilly Media.
Brickley, D., & Guha, R. V. (2012). RDF Vocabulary Description Language 1.0: RDF
Schema Retrieved January, 2010, from http://www.w3.org/TR/2004/REC-rdf-
schema-20040210/.
Caira, J. N. (1995). Global Cestode Database, from http://tapewormdb.uconn.edu/.
Castañón, C. A. B., Fraga, J. S., Fernandez, S., Gruber, A., & da F. Costa, L. (2007).
Biological shape characterization for automatic image recognition and diagnosis
of protozoan parasites of the genus Eimeria. Pattern Recognition, 40(7), 1899-
1910. doi: 10.1016/j.patcog.2006.12.006.
Castelli, V., & Bergman, L. D. (2002). Image Databases: Search and Retrieval of
Digital Imagery. New York, USA: John Wiley & Sons, Inc.
Chatzichristofis, S. A., Zagoris, K., Boutalis, Y. S., & Papamarkos, N. (2010). Accurate
Image Retrieval Based on Compact Composite Descriptors and Relevance
Feedback Information. International Journal of Pattern Recognition and
Artificial Intelligence, 24(2), 207-244.
Chen, C. H., & Peter Ho, P.-G. (2008). Statistical pattern recognition in remote sensing.
Pattern Recognition, 41(9), 2731-2741. doi: 10.1016/j.patcog.2008.04.013
Chen, Y., Henry L. Bart, J., & Teng, F. (2005). A content-based image retrieval system
for fish taxonomy. Paper presented at the Proceedings of the 7th ACM SIGMM
international workshop on Multimedia information retrieval, Hilton, Singapore.
Ciaccia, P., Bartolini, I., & Patella, M. (2004, June 2004). The PIBE Personalizable
Image Browsing Engine. Paper presented at the First International Workshop on
Computer Vision meets Databases (CVDB 2004), Paris, France.
Colwell, R. K. (2010, 2012). Biota: The Biodiversity Database Manager Retrieved
May, 2010, from http://viceroy.eeb.uconn.edu/Biota.

215
Corcho, O., Fern\, M., \#225, ndez-L\, \#243, pez, . . . rez. (2003). Methodologies, tools
and languages for building ontologies: where is their meeting point? Data
Knowledge Engineering, 46(1), 41-64. doi: 10.1016/s0169-023x(02)00195-7.
Curry, G. B., & Humphries, C. J. (2007). Biodiversity Databases: Techniques, Politics,
and Applications. Boca Raton, Florida, USA: CRC Press, Taylor & Francis
Group.
da F. Costa, L., dos Reis, S. F., Arantes, R. A. T., Alves, A. C. R., & Mutinari, G.
(2004). Biological shape analysis by digital curvature. Pattern Recognition,
37(3), 515-524. doi: 10.1016/j.patcog.2003.07.010.
Daoudi, M., & Matusiak, S. (2000). Visual Image Retrieval by Multiscale Description
of User Sketches. Journal of Visual Languages & Computing, 11(3), 287-301.
doi: 10.1006/jvlc.2000.0159.
Davis, J., & Goadrich, M. (2006). The Relationship Between Precision-Recall and ROC
Curves. Paper presented at the 23 rd International Conference on Machine
Learning, Pittsburgh, PA.
Demner-Fushman, D., Antani, S., Simpson, M., & Thoma, G. R. (2009). Annotation
and retrieval of clinically relevant images. International Journal of Medical
Informatics, 78(12), e59-e67. doi: 10.1016/j.ijmedinf.2009.05.003.
Deselaers, T. (2009). fire-cbir -FIRE - Flexible Image Retrieval Engine - Google Project
Hosting, 2012, from http://code.google.com/p/fire-cbir/.
Deselaers, T., Keysers, D., & Ney, H. (2004). Classification Error Rate for Quantitative
Evaluation of Content-based Image Retrieval Systems.
Deselaers, T., Keysers, D., & Ney, H. (2008). Features for image retrieval: an
experimental comparison. Inf. Retr., 11(2), 77-107. doi: 10.1007/s10791-007-
9039-3.
Di Gesù, V., & Starovoitov, V. (1999). Distance-based functions for image comparison.
Pattern Recognition Letters, 20(2), 207-214. doi: 10.1016/s0167-
8655(98)00115-9.
Do, M. T., Harp, J. M., & Norris, K. C. (1999). A test of a pattern recognition system
for identification of spiders. Bulletin of Entomological Research, 89(3), 217-
224.

216
Droissart, V., Simo, M., Sonké, B., Geerinck, D., & Stévart, T. (2012). Orchidaceae of
Central Africa Retrieved August, 2011, from http://www.orchid-africa.net/.
Du, H., & Chen, Y. Q. (2007). Rectified nearest feature line segment for pattern
classification. Pattern Recognition, 40(5), 1486-1497. doi:
10.1016/j.patcog.2006.10.021.
Duan, L., Gao, W., Zeng, W., & Zhao, D. (2005). Adaptive relevance feedback based
on Bayesian inference for image retrieval. Signal Processing, 85(2), 395-399.
doi: 10.1016/j.sigpro.2004.10.006.
Duda, R. O., Stork, D. G., & Hart, P. E. (2001). Pattern Classification. Canada: John
Wiley & Sons, Inc.
Efraty, B., Bilgazyev, E., Shah, S., & Kakadiaris, I. A. (2012). Profile-based 3D-aided
face recognition. Pattern Recognition, 45(1), 43-53. doi:
10.1016/j.patcog.2011.07.010.
EKEY. (2012). EKEY - The Electronic Key for Identifying Freshwater Fishes
Retrieved July, 2009, from
http://digitalcorpora.org/corp/nps/files/govdocs1/054/054359.html.
El-ghazal, A., Basir, O., & Belkasim, S. (2009). Farthest point distance: A new shape
signature for Fourier descriptors. Signal Processing: Image Communication,
24(7), 572-586. doi: 10.1016/j.image.2009.04.001
El-Naqa, I., Yongyi, Y., Galatsanos, N. P., Nishikawa, R. M., & Wernick, M. N. (2004).
A similarity learning approach to content-based image retrieval: application to
digital mammography. Medical Imaging, IEEE Transactions on, 23(10), 1233-
1244. doi: 10.1109/tmi.2004.834601.
Engines, C. (2012). List of CBIR engines - Wikipedia, the free encyclopedia Retrieved
July, 2011, from http://en.wikipedia.org/wiki/List_of_CBIR_engines.
Feng, D., Siu, W. C., & Zhang, H. J. (2003). Multimedia Information Retrieval and
Management: Technological Fundamentals and Applications: Springer.
Forsyth, D. A., & Ponce, J. (2002). Computer Vision: A Modern Approach: Prentice
Hall Professional Technical Reference.

217
Froese, R., & Pauly, D. (2012). FishBase Retrieved August, 2011, from
http://www.fishbase.org/search.php.
Gauld, I. D., O'Neill, M. A., & Gaston, K. J. (2000). Driving miss daisy: the
performance of an automated insect identification system. In A. D. Austin & M.
Dowton (Eds.). Collingwood, Australia: CSIRO Publishing.
GBIF. (2001). Gbif.org: Home Page, 2010, from http://www.gbif.org/.
Gibson, G. I., Bray, R. A. & Harris, E. A. (Compilers) (2005). Host-Parasite Database
of the Natural History Museum, London from http://www.nhm.ac.uk/research-
curation/scientific-resources/taxonomy-syatematics/host-parasites/index.html.
Gleich, D. (2012). Markov Random Field Models for Non-Quadratic Regularization of
Complex SAR Images. IEEE Journal of Selected Topics in Applied Earth
Observations and Remote Sensing, 5(3), 952-961. doi:
10.1109/jstars.2011.2179524.
Goldberg, I. G., Allan, C., Burel, J.-M., Creager, D., Falconi, A., Hochheiser, H., . . .
Swedlow, J. R. (2005). The Open Microscopy Environment (OME) Data Model
and XML file: open tools for informatics and quantitative analysis in biological
imaging. Genome Biology, 6(5), R47. doi: 10.1186/gb-2005-6-5-r47.
Gonzalez, R. C., & Woods, R. E. (2010). Digital Image Processing (Third ed.). Upper
Saddle River, New Jersey: Pearson Education, Inc.
Google. (2012). Google Images, from http://images.google.com/.
Gope, C., Kehtarnavaz, N., Hillman, G., & Würsig, B. (2005). An affine invariant curve
matching method for photo-identification of marine mammals. Pattern
Recognition, 38(1), 125-132. doi: 10.1016/j.patcog.2004.06.005
Gregorev, N., Huber, B., Shah, M. R. a. V., Troncale, T., Ashe, D. J. S., Trombone, T.,
& Pickering, J. (2003). Plant Bug :: Planetary Biodiversity Inventory, 2011,
from https://research.amnh.org/pbi/
Gruber, T. R. (1995). Toward principles for the design of ontologies used for
knowledge sharing. International Journal of Human-Computer Studies, 43(5–6),
907-928. doi: 10.1006/ijhc.1995.1081.

218
Gu, J., Shu, H. Z., Toumoulin, C., & Luo, L. M. (2002). A novel algorithm for fast
computation of Zernike moments. Pattern Recognition, 35(12), 2905-2911. doi:
10.1016/s0031-3203(01)00194-7.
Hanbury, A. (2008). A survey of methods for image annotation. Journal of Visual
Languages & Computing, 19(5), 617-627. doi: 10.1016/j.jvlc.2008.01.002.
Hattori, K., & Takahashi, M. (2000). A new edited k-nearest neighbor rule in the pattern
classification problem. Pattern Recognition, 33(3), 521-528. doi:
10.1016/s0031-3203(99)00068-0.
Hebeler, J., Fisher, M., Blace, R., Perez-Lopez, A., & Dean, M. (2009). Semantic Web
Programming: John Wiley and Sons.
Hsu, W., Antani, S., Long, L. R., Neve, L., & Thoma, G. R. (2009). SPIRS: A Web-
based image retrieval system for large biomedical databases. International
Journal of Medical Informatics, 78, Supplement 1(0), S13-S24. doi:
10.1016/j.ijmedinf.2008.09.006.
Hua, J. (2009). Study on the Performance Measure of Information Retrieval Models.
Paper presented at the International Symposium on Intelligent Ubiquitous
Computing and Education.
Hunt, K. A. (2010). The Art of Image Processing with Java. Natick, Massachusetts: A K
Peters, Ltd.
Hwang, S.-K., & Kim, W.-Y. (2006). A novel approach to the fast computation of
Zernike moments. Pattern Recognition, 39(11), 2065-2076. doi:
10.1016/j.patcog.2006.03.004
Hyvönen, E., A Harjula, P., & A Viljanen, K. (2002). Representing Metadata about
Web Resources. In E. Hyvönen (Ed.), Semantic Web Kick-Off in Finland -
Vision, Technologies, Research, and Applications (pp.47-75). HIIT
Publications:Helsinki, Finland.
Hyvönen, E., Saarela, S., Styrman, A., & Viljanen, K. (2003, May, 2003). Ontology-
Based Image Retrieval. Paper presented at the Proceedings of WWW2003,
pp.15-27, Budapest, Hungary.
imense. (2007). Imense Image Search Portal Retrieved March, 2010, from
http://imense.com/.

219
Inc., I. (2012). TinEye Reverse Image Search, from http://www.tineye.com/.
Incogna. (2012). Incogna Image Search Retrieved August, 2011, from
http://www.incogna.com/.
InsideWood. (2004-2012). Inside Wood - Search the Inside Wood Database Retrieved
May, 2010, from http://insidewood.lib.ncsu.edu.
Iqbal, K., Odetayo, M. O., & James, A. (2012). Content-based image retrieval approach
for biometric security using colour, texture and shape features controlled by
fuzzy heuristics. Journal of Computer and System Sciences, 78(4), 1258-1277.
doi: 10.1016/j.jcss.2011.10.013.
Iqbal, Q., & Aggarwal, J. K. (2002). CIRES: A System for Content-Based Retrieval in
Digital Image Libraries. Paper presented at the International Conference on
Control, Automation, Robotics and Vision (ICARCV) 2002, Singapore.
Islam, M. M., Zhang, D., & Lu, G. (2008). A Geometric Method To Compute
Directionality Features For Texture Images. Multimedia and Expo, 2008 IEEE
International Conference on, pp.1521-1524, June 23 2008-April 26 2008. doi:
10.1109/ICME.2008.4607736.
Janev, V., & Vranes, S. (2009). Semantic Web Technologies: Ready for Adoption? IT
Professional, 11(5), 8-16. doi: 10.1109/mitp.2009.107.
Jesse, D. (2005-2012). Plazi.org | Taking care of Freedom Retrieved September, 2010,
from http://plazi.org/.
Kak, A., & Pavlopoulou, C. (2002, 2002). Content-based image retrieval from large
medical databases. Paper presented at the 3D Data Processing Visualization and
Transmission, 2002. Proceedings. First International Symposium on.
Kan, C., & Srinath, M. D. (2002). Invariant character recognition with Zernike and
orthogonal Fourier–Mellin moments. Pattern Recognition, 35(1), 143-154. doi:
10.1016/s0031-3203(00)00179-5.
Kebapci, H., Yanikoglu, B., & Unal, G. (2009, 14-16 Sept. 2009). Plant image retrieval
using color and texture features. Paper presented at the Computer and
Information Sciences, 2009. ISCIS 2009. 24th International Symposium on.

220
Khondoker, M. R., & Mueller, P. (2010, June 30 - July 2). Comparing Ontology
Development Tools Based on an Online Survey. Paper presented at the e World
Congress on Engineering 2010 Vol I WCE 2010, London, U.K.
Kilinc, D., & Alpkocak, A. (2011). An expansion and reranking approach for
annotation-based image retrieval from Web. Expert Systems with Applications,
38(10), 13121-13127. doi: 10.1016/j.eswa.2011.04.118.
Kim, S.-W., & Oommen, B. J. (2007). On using prototype reduction schemes to
optimize dissimilarity-based classification. Pattern Recognition, 40(11), 2946-
2957. doi: 10.1016/j.patcog.2007.03.006.
Kozievitch, N. P., Torres, R. D., Andrade, F., Murthy, U., Fox, E., & Hallerman, E.
(2010). A Teaching Tool for Parasitology: Enhancing Learning with Annotation
and Image Retrieval. In M. Lalmas, J. Jose, A. Rauber, F. Sebastiani & I.
Frommholz (Eds.), Research and Advanced Technology for Digital Libraries
(Vol. 6273, pp. 466-469). Berlin: Springer-Verlag Berlin.
Krishnapuram, R., Medasani, S., Sung-Hwan, J., Young-Sik, C., & Balasubramaniam,
R. (2004). Content-based image retrieval based on a fuzzy approach. Knowledge
and Data Engineering, IEEE Transactions on, 16(10), 1185-1199. doi:
10.1109/tkde.2004.53.
Kunttu, I., Lepistö, L., Rauhamaa, J., & Visa, A. (2006). Multiscale Fourier descriptors
for defect image retrieval. Pattern Recognition Letters, 27(2), 123-132. doi:
10.1016/j.patrec.2005.08.022.
la Tendresse, I., & Kao, O. (2003). Mosaic-based sketching interface for image
databases. Journal of Visual Languages & Computing, 14(3), 275-293. doi:
10.1016/s1045-926x(03)00017-x.
Lamard, M., Cazuguel, G., Quellec, G., Bekri, L., Roux, C., & Cochener, B. (2007, 22-
26 Aug. 2007). Content Based Image Retrieval based on Wavelet Transform
coefficients distribution. Paper presented at the Engineering in Medicine and
Biology Society, 2007. EMBS 2007. 29th Annual International Conference of
the IEEE.
Lang, M., Kosch, H., Stars, S., Kettner, C., Lachner, J., & Oborny, D. (2007, 6-8 June
2007). Recognition of Botanical Bloom Characteristics from Visual Features.
Paper presented at the Image Analysis for Multimedia Interactive Services,
2007. WIAMIS '07. Eighth International Workshop on.

221
Lang, R. (2007). Neural Networks in Brief Automated Taxon Identification in
Systematics: Theory, Approaches and Applications (pp. 47-68): CRC Press.
Lassila, O., van Harmelen, F., Horrocks, I., Hendler, J., & McGuinness, D. L. (2000).
The semantic Web and its languages. Intelligent Systems and their Applications,
IEEE, 15(6), 67-73. doi: 10.1109/5254.895864.
Lee, C.-H., & Wang, S.-H. (2012). An information fusion approach to integrate image
annotation and text mining methods for geographic knowledge discovery. Expert
Systems with Applications, 39(10), 8954-8967. doi: 10.1016/j.eswa.2012.02.028.
Lee, T.-L. (2008). Back-propagation neural network for the prediction of the short-term
storm surge in Taichung harbor, Taiwan. Engineering Applications of Artificial
Intelligence, 21(1), 63-72. doi: 10.1016/j.engappai.2007.03.002.
Lemieux, A., & Parizeau, M. (2003). Flexible multi-classifier architecture for face
recognition systems. Proceedings on the 16th
International Conference on Vision
Interface, pp. 1-8.
Li, J., & Lu, B.-L. (2009). An adaptive image Euclidean distance. Pattern Recognition,
42(3), 349-357. doi: 10.1016/j.patcog.2008.07.017.
Lim, L. H. S. (1995). Bravohollisia bychowsky and Nagibina, 1970 and Caballeria
bychowsky and Nagibina, 1970 (Monogenea, Ancyrocephalidae) from
Pomadasys-Hasta (Bloch) (Pomadasyidae), with the description of a new
attachment mechanism. Systematic Parasitology, 32(3), 211-224. doi:
10.1007/BF00008830.
Lim, L. H. S. (1998). Diversity of Monogeneans in Southeast Asia. International
Journal of Parasitology, 28, 1495-1515.
Lim, L. H. S., & Gibson, D. I. (2010). Species of Neohaliotrema Yamaguti, 1965
(Monogenea: Ancyrocephalidae) from the pomacentrid Abudefduf vaigensis
(Quoy & Gaimard) off Pulau Langkawi, Malaysia, with a revised diagnosis of
the genus and a key to its species. Systematic Parasitology, 77, 107–129.
Lim, L. H. S., & Gibson, D. I. (2007). Diplectanocotyla Yamaguti, 1953 (Monogenea:
Diplectanoidea) from Megalops cyprinoides (Broussonet) (Teleostei :
Megalopidae) off Peninsular Malaysia. Systematic Parasitology, 67(2), 101-117.
doi: 10.1007/s11230-006-9075-1.

222
Lim, L. H. S., & Gibson, D. I. (2009). A new monogenean genus from an ephippid fish
off Peninsular Malaysia. Systematic Parasitology, 73, 13-25. doi:
10.1007/s11230-008-9167-1.
Lim, L. H. S., & Gibson, D. I. (2010). Taxonomy, Taxonomists & Biodiversity. Paper
presented at the Biodiversity- Biotechnology: Gateway to Discoveries,
Sustainable Utilization and Wealth Creation.
Lin, C.-Y., Tseng, B. L., & Smith, J. R. (2003). Videoannex: IBM MPEG-7 annotation
tool for multimedia indexing and concept learning. Paper presented at the IEEE
International Conference on Multimedia and Expo (ICME).
Lin, W.-C., Chang, Y.-C., & Chen, H.-H. (2007). Integrating textual and visual
information for cross-language image retrieval: A trans-media dictionary
approach. Information Processing & Management, 43(2), 488-502. doi:
10.1016/j.ipm.2006.07.015.
Liu, C.-L., & Nakagawa, M. (2001). Evaluation of prototype learning algorithms for
nearest-neighbor classifier in application to handwritten character recognition.
Pattern Recognition, 34(3), 601-615. doi: 10.1016/s0031-3203(00)00018-2.
Liu, H., Sun, J., Liu, L., & Zhang, H. (2009). Feature selection with dynamic mutual
information. Pattern Recognition, 42(7), 1330-1339. doi:
10.1016/j.patcog.2008.10.028.
Liu, J., Wang, B., Lu, H., & Ma, S. (2008). A graph-based image annotation framework.
Pattern Recognition Letters, 29(4), 407-415. doi: 10.1016/j.patrec.2007.10.018.
Liu, J., & Zhang, T. (2005). Recognition of the blurred image by complex moment
invariants. Pattern Recognition Letters, 26(8), 1128-1138. doi:
10.1016/j.patrec.2004.10.007.
Liu, R., Wang, Y., Baba, T., Masumoto, D., & Nagata, S. (2008). SVM-based active
feedback in image retrieval using clustering and unlabeled data. Pattern
Recognition, 41(8), 2645-2655. doi: 10.1016/j.patcog.2008.01.023.
Liu, Y., Zhang, D., Lu, G., & Ma, W.-Y. (2007). A survey of content-based image
retrieval with high-level semantics. Pattern Recognition, 40(1), 262-282. doi:
10.1016/j.patcog.2006.04.045.
LLC, K. G. (2011). ImmenseLab, 2012, from http://www.immenselab.com/.

223
Ma, Y., Lao, S., Takikawa, E., & Kawade, M. (2007). Discriminant analysis in
correlation similarity measure space. [Conference Paper]. Proceedings of the
24th international conference on Machine learning. doi:
10.1145/1273496.1273569.
MACROGLOSSA. (2010). Macroglossa Visual Search Engine Retrieved July, 2011,
from http://www.macroglossa.com/.
Mallik, J., Samal, A., & Scott L. Gardner. (2007). A Content Based Pattern Analysis
System for a Biological Specimen Collection. [Conference Paper]. Proceedings
of the Seventh IEEE International Conference on Data Mining Workshops. IEEE
Computer Society, Washington DC, pp. 237-s44. doi: 10.1109/ICDMW.2007.3.
Manning, C., Raghavan, P., & Schütze, H. (2008). Introduction to information retrieval:
Cambridge University Press.
Mayo, M., & Watson, A. T. (2007). Automatic species identification of live moths.
Knowledge-Based Systems, 20(2), 195-202. doi: 10.1016/j.knosys.2006.11.012.
McGuinness, D. L., & Harmelen, F. v. (2004, 12 November 2009). OWL Web
Ontology Language Retrieved September, 2009, from
http://www.w3.org/TR/owl-features/.
McQuilton, P., Pierre, S. E. S., Thurmond, J., & Consortium, F. (2012). FlyBase 101 –
the basics of navigating FlyBase. Nucleic Acids Res, 40(Database issue), D706-
714. doi: 10.1093/nar/gkr1030.
Mehtre, B. M., Kankanhalli, M. S., & Wing Foon, L. (1997). Shape measures for
content based image retrieval: A comparison. Information Processing &
Management, 33(3), 319-337. doi: 10.1016/s0306-4573(96)00069-6.
Miao, Z. (2000). Zernike moment-based image shape analysis and its application.
Pattern Recognition Letters, 21(2), 169-177. doi: 10.1016/s0167-
8655(99)00144-0.
Michelle, K. S., Chris, W., & Deborah, L. M. (2005). OWL Web Ontology Language
Guide, from http://www.w3.org/TR/owl-guide/.
Moreno, R., Grana, M., & Veganzones, M. A. (2007, 6-8 Sept. 2007). A Remote
Mycological Assistant. Paper presented at the Intelligent Data Acquisition and
Advanced Computing Systems: Technology and Applications, 2007. IDAACS
2007. 4th IEEE Workshop on.

224
Müller, H. (2010). Text-based (image) retrieval, from
http://www.thomas.deselaers.de/teaching/files/tutorial_icpr08/03_textBasedRetri
eval.pdf.
Müller, H., Michoux, N., Bandon, D., & Geissbuhler, A. (2004). A review of content-
based image retrieval systems in medical applications—clinical benefits and
future directions. International Journal of Medical Informatics, 73(1), 1-23. doi:
10.1016/j.ijmedinf.2003.11.024.
Müller, H., Müller, W., Squire, D. M., Marchand-Maillet, S., & Pun, T. (2001).
Performance Evaluation in Content-Based Image Retrieval: Overview and
Proposals. Pattern Recognition Letters, 22(5), 593-601.
Murthy, U., Fox, E. A., Chen, Y., Hallerman, E., Torres, R. d. S., Ramos, E. J., &
Falcao, T. R. C. (2009). Superimposed Image Description and Retrieval for Fish
Species Identification. In M. B. J. K. S. P. C. T. G. Agnosti (Ed.), Research and
Advanced Technology for Digital Libraries, Proceedings (Vol. 5714, pp. 285-
296).
Ng, B., Hamarneh, G., & Abugharbieh, R. (2012). Modeling Brain Activation in fMRI
Using Group MRF. IEEE Transactions on Medical Imaging, 31(5), 1113-1123.
doi: 10.1109/tmi.2012.2185943.
Nicola, A. D., Missikoff, M., & Navigli, R. (2005). A proposal for a Unified Process for
Ontology building: UPON. Paper presented at the 16th International Conference
on Database and Expert Systems Applications (DEXA 2005).
Noyes, J. S. Universal Chalcidoidea Database, from http://www.nhm.ac.uk/chalcidoids.
O'Neill, M. A. (2007). DAISY: A Practical Computer-Based Tool for Semi-Automated
Species Identification Automated Taxon Identification in Systematics: Theory,
Approaches and Applications (pp. 101-114): CRC Press.
O'Neill, M. A. (2010). DAISY: A Practical Tool for Automated Species Identification.
Retrieved from Tumbling Dice website: http://www.tumblingdice.co.uk/daisy.
OBO. (2012). Open Biomedical Ontologies – Wikipedia, the free encyclopedia
Retrieved December 23, 2009, from
http://en.wikipedia.org/wiki/Open_Biomedical_Ontologies.

225
Ortega-Binderberger, M., & Mehrotra, S. (2004). Relevance feedback techniques in the
MARS image retrieval system. Multimedia Systems, 9(6), 535-547. doi:
10.1007/s00530-003-0126-z.
Pajak, M. (2000). Identification of British Bombus and Megabombus using DAISY. B.
A. 3rd Year Honours Project, University of Oxford.
Papakostas, G. A., Karakasis, E. G., & Koulouriotis, D. E. (2010). Novel moment
invariants for improved classification performance in computer vision
applications. Pattern Recognition, 43(1), 58-68. doi:
10.1016/j.patcog.2009.05.008.
Park, S. B., Lee, J. W., & Kim, S. K. (2004). Content-based image classification using a
neural network. Pattern Recognition Letters, 25(3), 287-300. doi:
10.1016/j.patrec.2003.10.015.
Parker, K. (2010). Biodiversity Research Database index. Over 200 extensive
conservation data banks and search facilities, 2011, from
http://www.biodiverselife.com/biodiversitydata.html.
Pauwels, E. J., de Zeeuw, P. M., & Ranguelova, E. B. (2009). Computer-assisted tree
taxonomy by automated image recognition. Engineering Applications of
Artificial Intelligence, 22(1), 26-31. doi: 10.1016/j.engappai.2008.04.017.
Peters, C., Clough, P., Gonzalo, J., Jones, G. J. F., Kluck, M., & Magnini, B. (2004).
Multilingual Information Access for Text, Speech and Images (Vol. 3491).
Berlin: Springer.
pixolution. (2012). pixolution - vSearch-Demo Retrieved July, 2011, from
http://pixolution.does-it.net/fileadmin/template/visual_web_demo.html.
Platnick, N. I., Russell, K. N., & Do, M. T. (2012, October 25, 2005). SPIDAhome
Retrieved January, 2011, from
http://research.amnh.org/iz/spida/common/index.htm.
Porter, M. (2010, Jan 2006). Porter Stemming Algorithm, 2010, from
http://tartarus.org/~martin/PorterStemmer/.
Protégé (2004) from http://protege.stanford.edu/.

226
Prud'hommeaux, E., & Seaborne, A. (2008, 14 June 2007). SPARQL Query Language
for RDF Retrieved September, 2009, from http://www.w3.org/TR/rdf-sparql-
query/.
Qi, Y.-L. (2009). A Relevance Feedback Retrieval Method Based on Tamura Texture.
Knowledge Acquisition and Modeling, vol. 3, pp. 174-177, 2009 Second
International Symposium on Knowledge Acquisition and Modeling, 2009.
Richard W, H. (1996). Parallel Connectivity-Preserving Thinning Algorithms. In T. Y.
Kong & R. Azriel (Eds.), Machine Intelligence and Pattern Recognition (Vol.
Volume 19, pp. 145-179): North-Holland.
Ritter, G., & Schreib, G. (2001). Using dominant points and variants for profile
extraction from chromosomes. Pattern Recognition, 34(4), 923-938. doi:
10.1016/s0031-3203(00)00035-2.
Rodrigues, L. H. (2001). Building Imaging Applications with Java(TM) Technology:
Using AWT Imaging, Java 2D(TM), and Java(TM) Advanced Imaging (JAI):
Addison-Wesley Professional.
Rosa, N. A., Felipe, J. C., Traina, A. J. M., Traina, C., Rangayyan, R. M., & Azevedo-
Marques, P. M. (2008, 20-25 Aug. 2008). Using relevance feedback to reduce
the semantic gap in content-based image retrieval of mammographic masses.
Paper presented at the Engineering in Medicine and Biology Society, 2008.
EMBS 2008. 30th Annual International Conference of the IEEE.
Rui, Y., Huang, T. S., & Chang, S.-F. (1999). Image Retrieval: Current Techniques,
Promising Directions, and Open Issues. Journal of Visual Communication and
Image Representation(10), 39-62.
Ruttimann, U. E., Unser, M., Rawlings, R. R., Rio, D., Ramsey, N. F., Mattay, V. S., . .
. Weinberger, D. R. (1998). Statistical analysis of functional MRI data in the
wavelet domain. IEEE Transactions on Medical Imaging, 17(2), 142-154. doi:
10.1109/42.700727.
Sabaj, M. H., Armbruster, J. W., C. J. Ferraris, J., Friel, J. P., Lundberg, J. G., & Page,
L. M. (2003-2006). The All Catfish Species Inventory, from
http://silurus.acnatsci.org/.
Sanchez, L., Petkov, N., & Alegre, E. (2005). Statistical approach to boar semen head
classification based on intracellular intensity distribution. In A. Gagalowicz &
W. Philips (Eds.), Computer Analysis of Images and Patterns, Proceedings (Vol.
3691, pp. 88-95). Berlin: Springer-Verlag Berlin.

227
Santos, R. (2009). Java Image Processing Cookbook Retrieved May, 2009, from
http://www.lac.inpe.br/JIPCookbook/.
Santos, R., Ohashi, T., Yoshida, T., & Ejima, T. (1997). Supervised Image Classication
with Khoros - the Classify Toolbox Manual Retrieved from
http://www.lac.inpe.br/JIPCookbook/Resources/Docs/khoros-classify-
manual.pdf.
SAPPHIRE. SAPPHIRE (Healthcare) – Wikipedia, the free encyclopedia Retrieved
December 23, 2009, from
http://en.wikipedia.org/wiki/SAPPHIRE_(Health_care).
Saveliev, P. (2007-2010). Pixcavator image search - Computer Vision and Math, from
http://inperc.com/wiki/index.php?title=Pixcavator_image_search.
Schröder, S., Drescher, W., Steinhage, V., & Kastenholz, B. (1995). An Automated
Method for the Identification of Bee Species (Hymenoptera: Apoidea). Paper
presented at the International Symposium on Conserving Europe's Bees,
London, UK.
Scott, G., & Chi-Ren, S. (2007). Knowledge-Driven Multidimensional Indexing
Structure for Biomedical Media Database Retrieval. Information Technology in
Biomedicine, IEEE Transactions on, 11(3), 320-331. doi:
10.1109/titb.2006.880551.
Sergyan, S. (2008, 21-22 Jan. 2008). Color histogram features based image
classification in content-based image retrieval systems. Paper presented at the
Applied Machine Intelligence and Informatics, 2008. SAMI 2008. 6th
International Symposium on.
Shandilya, S. K., & Singhai, N. (2010). A Survey On: Content Based Image Retrieval
Systems. International Journal of Computer Applications, 4(2), 22--26.
Shastri, L., & Mani, D. R. (1997). Massively parallel knowledge representation and
reasoning: Taking a cue from the brain. In H. K. James Geller & B. S. Christian
(Eds.), Machine Intelligence and Pattern Recognition (Vol. Volume 20, pp. 3-
40): North-Holland.
Sheikh, A. R., Lye, M. H., Mansor, S., Fauzi, M. F. A., & Anuar, F. M. (2011, 14-17
June 2011). A content based image retrieval system for marine life images.
Paper presented at the Consumer Electronics (ISCE), 2011 IEEE 15th
International Symposium on.

228
Sidhu, A. S., Dillon, T. S., Chang, E., & Sidhu, B. S. (2005, 4-7 July 2005). Protein
ontology: vocabulary for protein data. Paper presented at the Information
Technology and Applications, 2005. ICITA 2005. Third International
Conference on.
Sidhu, A. S., Dillon, T. S., & Chang, E. (2007). Protein Ontology. In Chen J. & Sidhu
A. S. (Eds.), Biological Database Modeling (pp. 63-80). New York: Artech
House.
Siggelkow, S. (2001). SIMBA, 2012, from http://simba.informatik.uni-freiburg.de/.
Siggelkow, S., Schael, M., & Burkhardt, H. (2001). SIMBA — Search Images by
Appearance Pattern Recognition. In B. Radig & S. Florczyk (Eds.), (Vol. 2191,
pp. 9-16): Springer Berlin / Heidelberg.
Simon, R., & Vince, S. (2011). SID: Specimen Image Database Retrieved August,
2011, from http://sid.zoology.gla.ac.uk/.
Smeulders, A. W. M., Worring, M., Santini, S., Gupta, A., & Jain, R. (2000). Content-
Based Image Retrieval at the End of the Early Years. IEEE Trans. Pattern
Analysis and Machine Intelligence, 22(12), 1349-1380. doi: 10.1109/34.895972.
Sonka, M., Hlavac, V., & Boyle, R. (1998). Image Processing, Analysis, and Machine
Vision: PWS.
Spencer, C. (2009). HerpNET, 2010, from http://www.herpnet.org/.
Stejić, Z., Takama, Y., & Hirota, K. (2003). Genetic algorithm-based relevance
feedback for image retrieval using local similarity patterns. Information
Processing & Management, 39(1), 1-23. doi: 10.1016/s0306-4573(02)00024-9.
Sun, J. U., Wang, Z. P., & Yin, D. (2009). Research of Image Retrieval Based on
Uniting Features. Los Alamitos: IEEE Computer Society.
Swain, K. C., Norremark, M., Jorgensen, R. N., Midtiby, H. S., & Green, O. (2011).
Weed identification using an automated active shape matching (AASM)
technique. Biosystems Engineering, 110(4), 450-457. doi:
10.1016/j.biosystemseng.2011.09.011.

229
Tan, W. B., & Lim, L. H. S. (2009). Trianchoratus longianchoratus sp. n. (Monogenea:
Ancyrocephalidae: Heteronchocleidinae) from Channa lucius (Osteichthyes:
Channidae) in Peninsular Malaysia. Folia Parasitologica, 56(3), 180–184.
Taniar, D., & Rusu, L. I. (2010). Strategic Advancements in Utilizing Data Mining and
Warehousing Technologies: New Concepts and Developments: IGI Global.
TDWG (2007). Taxonomic Data Working Group LSID Vocabularies Retrieved March,
2010, from http://tdwg.org/.
Toby, S., Colin, E., & Jamie, T. (2009). Programming the Semantic Web. USA:
O'Reilly Media, Inc.
Torres, R. d. S., Medeiros, C. B., Dividino, R. Q., Figueiredo, M. A., Goncalves, M. A.,
Fox, E. A., & Richardson, R. (2004). Using Digital Library Components for
Biodiversity Systems.
Torres, R. d. S., & Falcao, A. X. (2006). Content-Based Image Retrieval: Theory and
Applications. Revista de Informática Teórica e Aplicada, 13, 161-185.
Torres, R. d. S., Medeiros, C. B., Goncalves, M. A., & Fox, E. A. (2004). An OAI-
based Digital Library Framework for Biodiversity Information Systems.
Universities, O. R. A. (2005). How to Measure Performance: A Handbook of
Techniques and Tools. Retrieved from http://www.orau.gov/pbm/handbook/.
Van Tienhoven, A. M., Den Hartog, J. E., Reijns, R. A., & Peddemors, V. M. (2007). A
computer-aided program for pattern-matching of natural marks on the spotted
raggedtooth shark Carcharias taurus. Journal of Applied Ecology 44(2), 273-280.
Wang, D., & Ma, X. (2005). A Hybird Image Retrieval System with User's Relevance
Feedback Using Neurocomputing. Informatica, 29(3), 271-280.
Wang, J., Ji, L., Liang, A., & Yuan, D. (2012). The identification of butterfly families
using content-based image retrieval. Biosystems Engineering, 111(1), 24-32. doi:
10.1016/j.biosystemseng.2011.10.003.
Wang, X., Georganas, N. D., & Petriu, E. M. (2011). Fabric Texture Analysis Using
Computer Vision Techniques. IEEE Transactions on Instrumentation and
Measurement, 60(1), 44-56. doi: 10.1109/tim.2010.2069850.

230
Wang, Z., Hu, Y., & Chia, L.-T. (2011). Improved learning of I2C distance and
accelerating the neighborhood search for image classification. Pattern
Recognition, 44(10–11), 2384-2394. doi: 10.1016/j.patcog.2011.03.032.
Watson, A. T. (2002). Automated identification of living macrolepidoptera using image
analysis. B. Sc. 3rd Year Honours Project, University of Bangor.
Watson, A. T., O'Neill, M. A., & Kitching, I. J. (2004). Automated identification of live
moths (Macrolepidoptera) using digital automated identification System
(DAISY). Systematics and Biodiversity, 1(3), 287-300. doi:
10.1017/s1477200003001208.
Weeks, P. J. D., O'Neill, M. A., Gaston, K. J., & Gauld, I. D. (1999). Automating insect
identification: exploring the limitations of a prototype system. Journal of
Applied Entomology-Zeitschrift Fur Angewandte Entomologie, 123(1), 1-8.
Wei, C.-H., & Li, C.-T. (2006). Calcification Descriptor and Relevance Feedback
Learning Algorithms for Content-Based Mammogram Retrieval Digital
Mammography. In S. Astley, M. Brady, C. Rose & R. Zwiggelaar (Eds.), (Vol.
4046, pp. 307-314): Springer Berlin / Heidelberg.
Wei, J., Guihua, E., Qionghai, D., & Jinwei, G. (2006). Similarity-based online feature
selection in content-based image retrieval. Image Processing, IEEE
Transactions on, 15(3), 702-712. doi: 10.1109/tip.2005.863105.
Wikispecies-Contributors. (2012, 26 May 2012). Wikispecies, free species directory
1479966. Retrieved 3 August 2012, from
http://species.wikimedia.org/wiki/Main_Page.
Wilder, J., Feldman, J., & Singh, M. (2011). Superordinate shape classification using
natural shape statistics. Cognition, 119(3), 325-340. doi:
10.1016/j.cognition.2011.01.009.
Wong, W.-T., & Hsu, S.-H. (2006). Application of SVM and ANN for image retrieval.
European Journal of Operational Research, 173(3), 938-950. doi:
10.1016/j.ejor.2005.08.002.
Wu, S., & Li, Y. F. (2009). Flexible signature descriptions for adaptive motion
trajectory representation, perception and recognition. Pattern Recognition,
42(1), 194-214. doi: 10.1016/j.patcog.2008.06.023.

231
Xiang, S., Nie, F., & Zhang, C. (2008). Learning a Mahalanobis distance metric for data
clustering and classification. Pattern Recognition, 41(12), 3600-3612. doi:
10.1016/j.patcog.2008.05.018.
Xin, J., & Jin, J. S. (2004). Relevance feedback for content-based image retrieval using
Bayesian network. Paper presented at the Proceedings of the Pan-Sydney area
workshop on Visual information processing.
http://dl.acm.org/citation.cfm?id=1082137.
Yang, L., & Hanjalic, A. (2012). Prototype-Based Image Search Reranking. IEEE
Transactions on Multimedia, 14(3), 871-882. doi: 10.1109/tmm.2012.2187778.
Yang, Y. S., Park, D. K., Kim, H. C., Choi, M. H., & Chai, J. Y. (2001). Automatic
identification of human helminth eggs on microscopic fecal specimens using
digital image processing and an artificial neural network. IEEE Transactions on
Biomedical Engineering, 48(6), 718-730.
Yanhua, Y., Chun, C., Chun-Tak, L., Hong, F., & Zheru, C. (2004, 20-22 Oct. 2004). A
computerized plant species recognition system. Paper presented at the Intelligent
Multimedia, Video and Speech Processing, 2004. Proceedings of 2004
International Symposium on.
You, D., Antani, S., Demner-Fushman, D., Rahman, M. M., Govindaraju, V., & Thoma,
G. R. (2011). Automatic identification of ROI in figure images toward
improving hybrid (text and image) biomedical document retrieval. In G. Agam
& C. ViardGaudin (Eds.), Document Recognition and Retrieval Xviii (Vol.
7874). Bellingham: Spie-Int Soc Optical Engineering.
Yu, L. ( 2007). Introduction to the Semantic Web and Semantic Web Services: Chapman
and Hall/CRC.
Yuanbin, W., Bin, Z., & Tianshun, Y. (2010). Projective invariants of co-moments of
2D images. Pattern Recognition, 43(10), 3233-3242. doi:
10.1016/j.patcog.2010.05.004.
Zhang, D., & Lu, G. (2003). A comparative study of curvature scale space and Fourier
descriptors for shape-based image retrieval. Journal of Visual Communication
and Image Representation, 14(1), 39-57. doi: 10.1016/s1047-3203(03)00003-8.
Zhang, H., Chen, Z., Li, M., & Su, Z. (2003). Relevance Feedback and Learning in
Content-Based Image Search. World Wide Web, 6(2), 131-155. doi:
10.1023/a:1023618504691.

232
Zhang, X. M., Huang, Z., Shen, H. T., & Li, Z. J. (2011). Probabilistic Image Tagging
with Tags Expanded By Text-Based Search. In J. X. Yu, M. H. Kim & R.
Unland (Eds.), Database Systems for Advanced Applications, Pt I (Vol. 6587,
pp. 269-283). Berlin: Springer-Verlag Berlin.
Zhao, D., & Chen, J. (1997). Affine curve moment invariants for shape recognition.
Pattern Recognition, 30(6), 895-901. doi: 10.1016/s0031-3203(96)00126-4.
Zhu, Y., De Silva, L. C., & Ko, C. C. (2002). Using moment invariants and HMM in
facial expression recognition. Pattern Recognition Letters, 23(1–3), 83-91. doi:
10.1016/s0167-8655(01)00108-8.
Zuo, W., Zhang, D., & Wang, K. (2006). An assembled matrix distance metric for
2DPCA-based image recognition. Pattern Recognition Letters, 27(3), 210-216.
doi: 10.1016/j.patrec.2005.08.017.