architecture for the modeling and analysis of rapid transit · architecture for the modeling and...
TRANSCRIPT

Architecture for the Modeling and Analysis of Rapid Transit
Final Presentation – Backup SlidesSYST 798 / OR 680 Spring 2009
David Claypool Kim Baumgartner
Mahesh Balakrishna Yimin Zhang
Professor Thomas Speller Professor Alex Levis

Index
• Assignment 2• Assignment 3• Assignment 5• Assignments 6 & 7• Assignments 3 & 5 Revisit
• Concept of Zooming• Grammar and Neighborhoods
• Grammar Described• Basic Formal Grammars• Shape Grammars
• Neighborhoods Described• Grammar Applied to Neighborhoods
• Domain Specific Modeling Language• CPN Preliminary Work
• EA Example- Structural View of Architecture• Stakeholders, Requirements and QFD• StationSim Excel Output Descriptions• Analysis Using StationSim Outputs
• Crowding Analysis Based on TCRP Guidelines

ExampleStructural View of Architecture in EA
Index
SysML Block Definition Diagrams: Unify activities, people, data, hardware, software, flows (using FlowPorts).

Index

Index

Index

Index

Stakeholders, Requirements and QFD
Index

7/14/2009 9
Stakeholders
• Top-Down– Policy Makers
• Politicians– Administrators
• Transit Management• Transit Monitoring
Office• Schedulers and
Planners– Industry
• Train Manufacturers• Metro Construction
Contractors– GMU Faculty
• Bottom-Up– The Riders
• Commuters• Tourists• Special Event
Attendees– Operating Staff
• Ticket Counters• Station Managers• Train Drivers• Transit Security• Maintenance Staff
Index

7/14/2009 10
Stakeholders: Needs v.s. Wants
Stakeholder GMU Faculty Policy MakersType of
StakeholderProject
Evaluators Politicians Transit Management
Transit Monitoring Office
Schedulers and Planners
Project that meets the
SEOR department
expectations
Safe, efficient system
Safe, efficient system
More situational awareness
More situational awareness
Attract ridersBetter decision making tools
Reduced operating cost
Increased capacity
Maximize profitIncreased flexibility
Secondary Needs (Wants) Attract riders Reduced workload
Needs
Transit Administrators
Index

7/14/2009 11
Stakeholders: Needs v.s. Wants
StakeholderType of
StakeholderStation
Managers Train Drivers Maintenance Staff Ticket Counters Transit
Security/SafetyEfficient
OperationsSafe, efficient
systemEfficient operations More situational
awarenessMore situational
awareness
Safe OperationsReduced station
crowdingReduced
maintenance needsReduced station
crowding Safe operations
Reduced station crowding
Reduced train crowding
Reduced station crowding
Secondary Needs (Wants)
Reduced workload
Reduced workload Reduced workload
Less passenger confusion
Operations Staff
Needs
Index

7/14/2009 12
Stakeholders: Needs v.s. Wants
Stakeholder
Type of Stakeholder
Train Manufacturers
Metro Construction
StaffCommuters Tourists Special Event
Attendees
Incorporation of Train
Performance Capabilities and
limitations
Guidance on Station Layout Reduced wait time Safety Safety
Increased comfort Reduced cost Reduced delays
Safety Better information Better information
Reduced delays Reduced cost
Secondary Needs (Wants) Better information Increased comfort
Increased comfort
Needs
Industry The Riders
Index

7/14/2009 13
Stakeholder Value Mapping
Incr
ease
d ca
paci
ty
Incr
ease
d S
afet
y an
d S
ecur
ity
Red
uced
Sta
tion
Cro
wdi
ng
Red
uced
Tra
in C
row
ding
Bet
ter D
ecis
ion
Mak
ing
Tool
s
Red
uced
Mai
nten
ance
Cos
ts
Bet
ter S
tatio
n La
yout
Gui
delin
es
Mor
e R
ider
Info
rmat
ion
Incr
ease
d Fl
exib
ility
Red
uced
wor
kloa
d
Incr
ease
d P
ass.
Com
fort
Attr
act R
ider
ship
Sta
keho
lder
Impo
rtanc
e
Politicians 3 5 3 5 0 2 0 1 0 0 3 4 70%
Transit Management 5 5 5 5 5 5 5 3 5 5 5 5 100%
Transit Monitoring 2 5 5 5 5 3 5 2 2 5 2 2 80%
Schedulers and Planners 2 5 5 5 5 3 2 2 3 5 2 2 60%
Commuters 2 5 5 5 3 1 5 4 4 0 5 0 80%
Tourists 2 5 4 4 0 0 5 5 1 0 5 0 50%
Special Event Attendees 5 5 5 5 4 0 5 5 3 0 5 0 50%
Station Managers 4 5 5 5 5 3 5 5 5 5 4 3 80%
Ticket Counters 2 4 5 2 5 2 2 3 3 5 1 2 50%
Train Drivers 3 5 5 5 5 3 2 2 2 5 4 3 50%
Transit Security/Safety 2 5 5 5 4 0 4 5 5 2 3 3 95%
Maintenance Staff 1 5 5 5 4 5 2 1 2 5 1 1 20%
Train Manufacturers 2 5 2 4 0 5 0 0 0 0 5 4 40%
Construction Companies 2 5 5 3 0 3 5 0 0 0 4 4 40%
SEOR Faculty 3 3 3 3 3 3 3 3 3 3 3 3 100%
Composite Weighted Score: 27 46 43 43 33 24 34 29 28 27 34 25
Rid
ers
Sta
ffM
gmt
Indu
stry
Index

7/14/2009 14
Stakeholder Value Mapping Index

7/14/2009 15
House of Quality
1 2 3 4 5 6 7 8 99 9 9 9 9 9 9 9 3
363 232 237 107 279 240 135 342 213
16.53 10.56 10.79 4.87 12.70 10.93 6.15 15.57 9.70
5 8 5 2 2 5 2 2 5
▲ ▼ ▲ ▲ x ▼ ▼ ▼ x
TBD
Ran
ge
Han
dle
with
in T
D
Prov
ide
abilit
y to
achi
eve
90%
req
prov
ide
sum
mar
Be a
ble
to a
dd n
redu
ce p
redi
ctio
redu
ce p
redi
ctio
illust
rate
limite
d t
Quality Characteristics
(a.k.a. "Functional Requirements" or
"Hows")
Demanded Quality (a.k.a. "Customer Requirements" or
"Whats")
1 0
2 9 3.00 9 9 3 3 3 3
3 9 3.00 9 9 9 3
4 9 3.00 9 3 9 9 3
5 3 1.00 3 3 3
6 9 3.00 9 9 3
7 3 3.00 3 3
8 9 4.00 9 3 9 9 3
10 0
11 9 4.00 9 9 3 3 3
12 9 4.00 9 9 3
13 9 2.00 9 9 3 9 3 3
14 9 4.00 9 9 3 9 3 3
15 3 2.00 3 3 3 1 3 3 3 3 3
16 9 4.00 9 3
18 0
19 9 4.00 3 1 9 9 3
20 9 6.00 3 3 9
The A-MART system reduce rider w ait time by TBD%.The A-MART system shall be extendable in the future to be able to link other modes of
The A-MART system shall promote the case for increased funding and allow for better The A-MART system shall ensure compliance w ith FTA guidelines.
BOSTON MBTA
The A-MART system shall increase customer satisf ication rating from 79% to > 85%.The A-MART system shall decrease schedule distruptions due to station overcrow ding by TBD The A-MART system shall increase ability to eff iciently respond to "events" by providing The A-MART system shall reduce crime rate from 2.58% per 1000 riders to TBD.
The A-MART system shall reduce accidents and incidents at stations due to overcrow ding by The A-MART system shall lead to better rider experiences through reduced crow ding on
ATLANTA MARTA
The A-MART system shall provide London Tube management continuous information on The A-MART system shall reduce overcrow ding and queuing levels during events w hich cause a The A-MART system shall be configurable to reduce congestion at a given station due to high The A-MART system shall provide London Tube management continuous information on
The A-MART system shall provide the decision support to deal w ith station closures and
Prov
ide
pass
enge
r flo
w m
etric
s in
side
sta
tions
Rel
ativ
e W
eigh
t
Inco
rpor
ate
TCR
P gu
idel
ines
LONDON TUBE
Han
dle
unan
ticip
ated
oth
er e
vent
s (s
tatio
n cl
osur
es, t
rack
clo
sure
s)
Han
dle
smal
l to
larg
e pa
ssen
ger l
oads
at
stat
ions
Relative Weight
Row
Num
ber
Prov
ide
anal
ysis
cap
abilit
y to
stu
dy a
nd re
duce
st
atio
n cr
owdi
ng (s
ensi
tivity
ana
lysi
s)
Difficulty(0=Easy to Accomplish, 10=Extremely Diff icult)
Max
Rel
atio
nshi
p Va
lue
in R
ow
Max Relationship Value in ColumnColumn Number
Relationship Between Requirements:9 - Strong 3 - Moderate 1 - Weak
Ope
rate
with
the
Was
hing
ton
WM
ATA,
NY
MTA
, Bo
ston
MBT
A, A
tlant
a M
ARTA
and
Lon
don
Tube
Mod
ular
, ext
ensi
ble
desi
gn to
eas
ily a
dd
addi
tiona
l sta
tion
com
pone
nts,
sta
tions
and
lines
Prov
ide
info
rmat
ion
on p
asse
nger
thro
ughp
ut o
n ea
ch lin
e
Prov
ide
pass
enge
r thr
ougp
ut o
f eac
h st
atio
n
Minimize (▼), Maximize (▲), or Target (x)
Target or Limit Value
Requirement Weight
Index

7/14/2009 16
Enterprise Architect
• Sparx EA has been updated as the scope of the project has been refined.
• Updates include:– New/updated customer
requirements and functional requirements
– New/Updated actors– Updated Stakeholder-
requirements mapping– Embedded document
with information from House of Quality and Stakeholder value mappings.
Index

7/14/2009 17
Enterprise Architect - Requirements
Requirement numbers
match those in HOQ
Index

7/14/2009 18
Enterprise Architect - Stakeholders
Index

7/14/2009 19
Enterprise Architect – Stakeholder-Requirements Mapping

Enterprise Architect - Stakeholder Value Mapping
7/14/2009 20
Index

Enterprise Architect – House of Quality
7/14/2009 21
Index

Concept of Zooming
Index

Follow-Up from Feedback:Animated Zoom Level
IllustrationA-MART
Slide Subset by David ClaypoolDisclaimer:
These slides are designed to guide our final discussions, and are not currently part of the
final presentation in this form.
Index

Paradigm Zoom Levels
Level -1 : Demographic Network
Level 0 : Regional Transit Level
Level 1 : Rapid Transit SystemLevel 2 : Single System LineIntermediate Level : Station NeighborhoodIntermediate Level : Transfer Station
Level 3 : Single StationIntermediate Level : Station Region/PathIntermediate Level : Logical Station Location
Level 4 : Atomic Station Element
Level 5 : Internal Component of a Station Element
Index

Grammar and Neighborhoods
Index

Grammar Described
Index

String Grammar- Rider Experience Grammar Index
Nonterminal SymbolsN = {A,B}Where A represents the abstraction of an element that canalways accepts ridersAnd Where B represents the abstraction of an element thatcan only conditionally accepts riders
Terminal SymbolsT = {q,w,x,t,p,l,e,k}q = Queuew = Walkwayx = Escalatort = Turnstilep = Platforml = Linee = Exitk = Ticket Counter/Machine
Production RulesA → qBA → plB → AA → wAB → tAB → xAB → kAA → e
Start:S = A
A Rider entering Dupont boards Qxwqkwqtwqxpl2nd Rider transfers at Dupont Qxwqxpl3rd Rider leaves Dupont Qxwqtwqxe
Example

String Grammar- Rider Goal Grammar Index
Example
Nonterminal Symbols
N = {A}
Terminal Symbols
Σ = {a-z,0-9,|}
Grammar Rules
Start → A
A → A|A
A → [a-z,0-9]*
A Rider is placed into the system at the entrance toDupont Station and simply gets onboard a redlinewestbound train there.
Redlinewest
In a larger model, 2nd Rider takes Dupont to redlineeast|metrocenterexit3rd Rider takes Dupont, transfers to get to redlineeast|orangewest|viennaout

Shape Grammar – Station Index
exit
W
X
Q
T
C1
E
K
P
C2
C3
B
T
enterStart Start

Shape Grammar – Station Instance Index
exit
enter

Shape Grammar – Metro Center ExampleIndex

Shape Grammar – SystemIndex
P
X
Tn
Te
Tc B
[z-x]*
Ll Ls
[z-x]*
Start R

Shape Grammar – System InstanceIndex
NBSB
NBSBE
BW
BL’Enfant Plaza
Federal Center Capitol South

Neighborhoods Described
Index

Introduction
• For this example, we are considering Metro Center as a station of interest, and the various “neighborhoods” which can be defined for it.
• We present the consistencies between graph theory neighborhoods and neighborhoods of cellular automata.
Index

Foundations – Cellular Automata
• Moore Neighborhood • von Neumann Neighborhood
• Graph Theory Neighborhood
R=1R=2
R=0R=1
R=2
R=0
R=1
R=2
R=0
Index

Topology
• The Rapid Transit System Paradigm
• when:– Stations are Vertices– Tracks are Edges
• Can not be described or modeled in the form of a grid– Unless in the case where
the resulting graph is a square grid graph or kings graph.
• Instead it can be described natively as a planar graph
• And the traditional concepts of cellular neighborhoods applied to it.
Square Grid Graph
Kings Graph
Index

Metro Center
• Fortunately:– Metro Map
Diagrams tend to be readily interpreted as a station-track graph
• The illustration to the left refers to the “r=0” neighborhood of Metro CenterR=0
Index

Metro Center R=1
• The R=1 neighborhood can be defined as:– The stations and the
tracks traveled to get there which are “one station away” from Metro CenterR=1
Index

Metro Center R=2
• This neighborhood illustrates R=2, in one potential form.
• In this case, only the original lines are included: transfers to other lines are not part of the neighborhood radiusR=2
Index

Metro Center R=2
• This neighborhood illustrates R=2, in another, more potential form.
• In this case, transfers are included, at no “cost” additional compared to remaining on the same line.
R=2
Index

The Concept can continue for R=3Using either method
(Left: no transfers, Right: transfers)
Index

So Which one?
• The best approach is to use the Moore Neighborhood-like approach– Which is also most
consistent with graph theory neighborhoods.
• The left side shown here illustrates the no-transfer approach (rejected)– Specifically makes
apparent the limitation: orphaned stations entirely surrounded by a single neighborhood.
Index

And Why?
• The neighborhood concept can be used to partition the space for parallel simulation:– Passive interaction
• Output generalizations are shared and used as input during separate simulation at neighborhood interface points (the tracks which connect two adjacent neighborhoods)
– Real-time interaction• Data is passed, during
simulation, via the interface points.
N=1 partition, ~30 neighborhoods instead of ~70 individual stations.
Index

Partitioning the DC Metro
• Shown on the previous page was one possible N=1 neighborhood partitioning. 17 Neighborhoods– Many permutations exist
• Shown here is an N=2 partition.
• Why pick one N over the other?– Match the number of
partitions to the simulation resources you have available.
• Partitions can also be made via other factors
Existing operational
Index

Neighbor Interfaces
• When a rapid transit system, modeled according to out paradigm, is partitioned in this way, the interactions among neighbors can be condensed to:– Any number of common tracks, which can
• Accept incoming trains, with given riders, at a given time
• And/or push out outgoing trains, with given riders, at a given time
– Accept information from some higher orchestrating agent• Artificial: StationSim simulation
control/synchronization• Actual: Headquarters ordering all trains to stop
• This concept, inherit to our paradigm, greatly aids future implementation of parallel simulation
Index

Applying Cellular Automata to London Underground
Index

Applying Cellular Automata to London Underground
Index

Applying Cellular Automata to London Underground
Index

Example Interface Between Cells Index

Neighborhood ApplicationsPotential Parallel Processing of Simulations
Index

Grammar Applied to Neighborhoods
Index

Neighborhood Grammar for System Zoom Level Index
P
n X
nTn
n n-1
Tc B
n
[z-x]*
Ll Ls
[z-x]*
nn
n
Start
n
R Ro
For all rules, n >= 0R is set to radius of neighborhood,in graph theoretic approach.Grammar is self-range-limiting.Rotation angles, bending angles, are generic and not fixed

Neighborhood Grammar Instance Index
221
1 11
000 0
0 00 0
Showing neighborhood R=2 of THIS station

Domain Specific Modeling Language
Index

Self Defining Meta-GME with ParadigmIndex
Meta-GME Rapid Transit Paradigm Rapid Transit
System Instance
Rapid Transit System Instance
Rapid Transit System Instance
Defines thegrammar usedIn expressing
Defines thegrammar usedIn expressing
Defines thegrammar usedIn expressing
Other DSMLsOther DSMLs
Other DSMLs

Interface for Creating a New DSMLIndex

Meta-GME Example (1)Index
StreetEntrance<<Atom>>
StreetExit<<Atom>> Queue
<<Atom>>
TrackFlowingObject<<FCO>>
TrackSection<<Atom>>
TrainFlowConnection<<Connection>>
Walkway<<Atom>>
StationElement<<FCO>>
StationTrack<<Atom>>
AcceptsRidersConditionally<<FCO>>
TransitNetwork<<Model>>
Turnstile<<Atom>>
Station<<Model>>
RiderFlowConnection<<Connection>>
AcceptsRidersAlways<<FCO>>
Escalator<<Atom>>
Platform<<Atom>>

Meta-GME Example (2)Index
StreetEntrance<<Atom>>
StreetExit<<Atom>>
StationAspect<<Aspect>>
Queue<<Atom>>
NetworkAspect<<Aspect>>
TrackFlowingObject<<FCO>>
TrackSection<<Atom>>
TrainFlowConnection<<Connection>>
Walkway<<Atom>>
StationElement<<FCO>>StationTrack
<<Atom>> AcceptsRidersConditionally<<FCO>>
TransitNetwork<<Model>>
Turnstile<<Atom>>
Station<<Model>>
RiderFlowConnection<<Connection>>
AcceptsRidersAlways<<FCO>>
Escalator<<Atom>>
Platform<<Atom>>
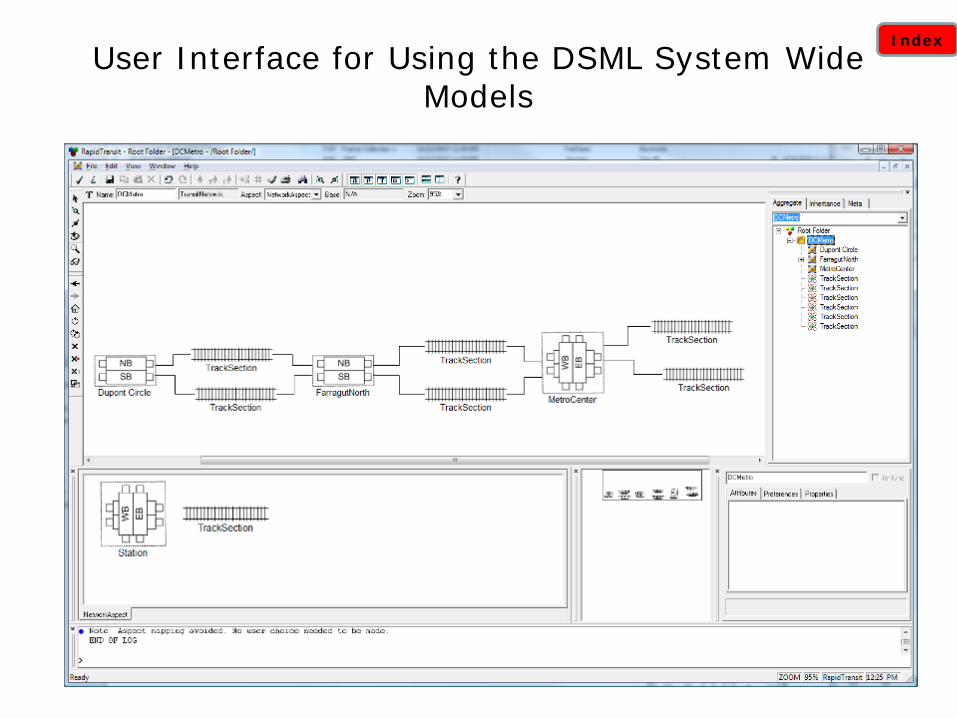
User Interface for Using the DSML System Wide Models
Index

User Interface for Using the DSML Station Models
Index

System Instance from GMEIndex

Station Instance from GMEIndex

Analysis Using StationSim Outputs
Index

Station Crowding using TCRP
Index

Rider Density
• The Transit Cooperative Research Program (TCRP) provides general guidelines on passenger densities in station design (Part 7 of the manual)
• Additionally, it provides: – Various parameters related to densities– Level of Service (LOS) measures.– Screenshots from the TCRP are provided in the next slides.
Index

Rider Density - LOS
Walkways
Queues/Waiting Areas
Index

Rider Density – Key ParametersW
alkw
ays
Que
ues/
Wai
ting
Are
asIndex

Rider Density and StationSim
• StationSim allows for the parameters listed in table 7-3 to be set/changed/measured in station simulation runs for different time durations (peak hours of a day/whole day/over weeks, months, years etc).
• In addition to these, other parameters that impact crowding in stations such as train inter-arrival times, escalator speeds, escalator directions, turnstile directions, rider characteristic (i.e. high numbers of unfamiliar riders during special events) etc can also be changed .
• StationSim thus provides the ability to identify and analyze real-world operational issues. E.g. a specific platform or region of a station (such as an escalator plus an associated platform) is identified as a “Hot-Spot” (i.e. has frequent over-crowding).
• Studies can be performed to study specific station elements , groups of elements as well as station-wide.
Index

Rider Density and StationSim
StationSim Model - Riders- Trains
- Demand Variations- Rider Characteristics
-Escalator Speeds/Directions- Number of Turnstile/Directions- Dimensions of Walkways (fornew station design)
- Train Inter-Arrival Times- Rider Familiarity (through bettersignage)
- Predicted Rider Density/LOS- At specific locations- Station-wide
- Predicted flow rates
Index

Rider Density and StationSim
• Distributions are a means to understand the level of crowdedness and can be generated from StationSimoutputs.
• Are the distribution of the rider densities normal? Skewed? If so, which way? How can they be changed?
• StationSim can be used to answer these questions.
AF Level of ServiceRider Space (ft^2/p)
Num
ber o
f Rid
ers
5 10 15 20 25 30 350
10
20
30
40
50
60
70
80
90
100
Index

CPN Preliminary Work
Index

High Level View Index

Escalator Index

Queue Index

StationSim Excel Output
Index

File Output Configuration Index

Metro Center Example Index

Example Output from Riders.csv Index
Visitation Grammar
GU
ID
Goa
lLis
t
Goa
l
Ent
ry T
ime
Entry State
Exi
t Tim
e
Exit State
Tim
e in
Sys
tem
Visitation String
Tim
e M
ovin
g
Tim
e Si
tting
Tim
e St
andi
ng
unsp
ecifi
ed
Upp
erPl
atfo
rmW
est
Upp
erPl
atfo
rmEa
st
Low
erPl
atfo
rm
3472 orangesouth orangesouth 462.8 552.5 89.7 wqxwwql $0.00 50.6 0.0 39.4 0.0 10.6 0.0 79.13322 orangesouth orangesouth 441.4 552.7 111.3 wqxwwql $0.00 39.6 0.0 72.0 0.0 0.0 13.2 98.13407 orangesouth orangesouth 449.9 552.8 102.9 qxqtwqxwwql $1.50 64.5 0.0 38.8 14.9 0.0 15.9 72.13289 orangesouth orangesouth 437.9 553.0 115.1 qxqtwqxwwql $1.50 40.9 0.0 74.6 21.3 0.0 15.7 78.13330 orangesouth orangesouth 449.4 553.1 103.7 wqxwwql $0.00 34.2 0.0 69.8 0.0 0.0 11.5 92.23253 orangesouth orangesouth 431.9 553.3 121.4 qxwtwqxwwql $2.00 86.6 0.0 35.4 13.9 27.7 0.0 79.83466 orangesouth orangesouth 463.1 553.4 90.3 wqxwwql $0.00 56.0 0.0 34.6 0.0 12.0 0.0 78.32975 orangesouth orangesouth 395.9 553.6 157.7 qxwtqxwwwqxwwql $1.25 66.1 0.0 92.2 34.2 0.0 51.4 72.13468 orangesouth orangesouth 466.4 553.7 87.3 wqxwwql $0.00 53.2 0.0 34.4 0.0 11.3 0.0 76.03431 orangesouth orangesouth 455.9 553.9 98.0 qxqtwqxwwql $1.50 63.6 0.0 34.8 15.3 0.0 15.5 67.23469 orangesouth orangesouth 467.0 554.0 87.0 wqxwwql $0.00 54.1 0.0 33.2 0.0 10.9 0.0 76.13465 orangesouth orangesouth 464.4 554.2 89.8 wqxwwql $0.00 56.8 0.0 33.3 0.0 12.2 0.0 77.63921 orangesouth orangesouth 521.4 554.3 32.9 ql $0.00 0.0 0.0 33.0 0.0 0.0 0.0 32.92607 orangesouth orangesouth 341.9 554.5 212.6 qxwtwqxwwwqxwwql $1.75 98.3 0.0 115.0 52.0 60.7 0.0 99.93069 orangesouth orangesouth 401.9 554.6 152.7 qxwtqxwwwqxwwql $1.25 121.3 0.0 32.1 28.1 48.2 0.0 76.43467 orangesouth orangesouth 462.5 554.8 92.3 wqxwwql $0.00 60.6 0.0 32.0 0.0 13.2 0.0 79.13920 orangesouth orangesouth 523.7 554.9 31.2 ql $0.00 0.0 0.0 31.3 0.0 0.0 0.0 31.22492 redwest redwest 329.9 465.0 135.1 qxwtwwql $2.00 52.8 0.0 82.7 13.4 121.7 0.0 0.02516 redwest redwest 335.9 465.2 129.3 qxwtwwql $2.00 47.0 0.0 82.7 12.7 116.6 0.0 0.02226 redwest redwest 299.9 465.3 165.4 qxwtwqxwwql $1.75 43.1 0.0 122.8 43.0 122.4 0.0 0.02258 redwest redwest 308.6 465.5 156.9 wqxwwql $0.00 36.9 0.0 120.3 0.0 144.6 0.0 12.31936 redwest redwest 257.9 465.6 207.7 qxqtwqxwwwqxwwql $1.50 128.4 0.0 79.9 13.6 123.9 15.3 54.9
204 exit exit 30.1 107.9 77.8 wqxwqtqxw $0.50 77.9 0.0 0.3 27.0 37.5 0.0 13.3143 redwest redwest 27.6 108.3 80.7 wqxwwql $0.00 40.8 0.0 40.2 0.0 67.1 0.0 13.6286 redwest redwest 43.1 109.3 66.2 wqxwwql $0.00 66.2 0.0 0.3 0.0 51.5 0.0 14.767 exit exit 5.2 109.9 104.7 wqxwqtqxw $0.50 44.8 0.0 60.3 33.8 57.0 0.0 13.964 exit exit 7.0 110.2 103.2 wqxwqtqxw $0.50 43.3 0.0 60.3 33.3 56.5 0.0 13.4
287 redwest redwest 48.2 110.6 62.4 wqxwwql $0.00 62.5 0.0 0.2 0.0 48.7 0.0 13.7348 exit exit 44.3 112.0 67.7 wqxwqtqxw $0.50 67.8 0.0 0.3 23.7 33.1 0.0 10.9209 exit exit 22.6 115.3 92.7 wqxwqtqxw $0.50 32.8 0.0 60.3 29.8 53.0 0.0 9.9353 exit exit 44.0 115.4 71.4 wqxwqtqxw $0.50 71.5 0.0 0.3 25.5 0.0 33.7 12.2182 bluenorth bluenorth 22.0 121.5 99.5 ql $0.00 0.0 0.0 99.6 0.0 0.0 0.0 99.5191 bluenorth bluenorth 22.8 121.7 98.9 ql $0.00 0.0 0.0 99.0 0.0 0.0 0.0 98.9190 bluenorth bluenorth 23.7 121.8 98.1 ql $0.00 0.0 0.0 98.2 0.0 0.0 0.0 98.1185 bluenorth bluenorth 24.0 122.0 98.0 ql $0.00 0.0 0.0 98.1 0.0 0.0 0.0 98.0114 orangenorth orangenorth 11.9 163.6 151.7 qxqtwqxwwql $1.50 35.8 0.0 116.3 20.7 0.0 14.0 117.0220 orangenorth orangenorth 23.9 163.8 139.9 qxwtwqxwwql $2.00 82.3 0.0 58.2 13.6 26.1 0.0 100.2374 orangenorth orangenorth 41.9 163.9 122.0 qxqtwqxwwql $1.50 71.9 0.0 50.5 13.6 0.0 15.4 93.0244 orangenorth orangenorth 29.9 164.1 134.2 qxwtwqxwwql $2.00 89.1 0.0 45.7 14.5 28.7 0.0 91.078 orangenorth orangenorth 5.9 164.2 158.3 qxwtwqxwwql $2.00 53.9 0.0 105.0 20.0 28.3 0.0 110.0
615 orangenorth orangenorth 81.7 164.4 82.7 wqxwwql $0.00 38.0 0.0 45.0 0.0 0.0 9.9 72.8398 orangenorth orangenorth 47.9 164.5 116.6 qxqtwqxwwql $1.50 35.5 0.0 81.5 21.3 0.0 13.9 81.4922 orangenorth orangenorth 122.0 164.7 42.7 ql $0.00 0.0 0.0 42.8 0.0 0.0 0.0 42.7232 orangenorth orangenorth 23.9 164.8 140.9 qxqtwqxwwql $1.50 45.1 0.0 96.2 20.7 0.0 17.1 103.1927 orangenorth orangenorth 123.0 165.0 42.0 ql $0.00 0.0 0.0 42.1 0.0 0.0 0.0 42.0102 orangenorth orangenorth 11.9 165.1 153.2 qxwtwqxwwql $2.00 51.9 0.0 101.9 20.6 27.3 0.0 105.3422 orangenorth orangenorth 53.9 165.3 111.4 qxqtwqxwwql $1.50 71.4 0.0 40.4 14.3 0.0 17.8 79.3
Static Information General Timing and States Time Catagories Time Groups
Exp
enda
ture

Section 1 of Riders.csv Index
GU
ID
Goa
lLis
t
Goa
l
Ent
ry T
ime
Entry State
3472 orangesouth orangesouth 462.83322 orangesouth orangesouth 441.43407 orangesouth orangesouth 449.93289 orangesouth orangesouth 437.93330 orangesouth orangesouth 449.42492 redwest redwest 329.92516 redwest redwest 335.9
204 exit exit 30.1143 redwest redwest 27.6286 redwest redwest 43.167 exit exit 5.264 exit exit 7
287 redwest redwest 48.2348 exit exit 44.3209 exit exit 22.6353 exit exit 44182 bluenorth bluenorth 22191 bluenorth bluenorth 22.8190 bluenorth bluenorth 23.7185 bluenorth bluenorth 24114 orangenorth orangenorth 11.9220 orangenorth orangenorth 23.9374 orangenorth orangenorth 41.9927 orangenorth orangenorth 123102 orangenorth orangenorth 11.9422 orangenorth orangenorth 53.9
Column Group 1
Static Information General Timing and States

Section 2 of Riders.csv Index
Exi
t Tim
e Exit State
Tim
e in
Sys
tem
552.5 89.7552.7 111.3552.8 102.9
553 115.1553.1 103.7
465 135.1465.2 129.3107.9 77.8108.3 80.7109.3 66.2109.9 104.7110.2 103.2110.6 62.4
112 67.7115.3 92.7115.4 71.4121.5 99.5121.7 98.9121.8 98.1
122 98163.6 151.7163.8 139.9163.9 122
165 42165.1 153.2165.3 111.4
Column Group 2
General Timing and States

Section 3 of Riders.csv Index
Visitation Grammar
Visitation String
Tim
e M
ovin
g
Tim
e Si
tting
Tim
e St
andi
ng
unsp
ecifi
ed
Upp
erPl
atfo
rmW
est
Upp
erPl
atfo
rmEa
st
Low
erPl
atfo
rm
wqxwwql $0.00 50.6 0 39.4 0 10.6 0 79.1wqxwwql $0.00 39.6 0 72 0 0 13.2 98.1qxqtwqxwwql $1.50 64.5 0 38.8 14.9 0 15.9 72.1qxqtwqxwwql $1.50 40.9 0 74.6 21.3 0 15.7 78.1wqxwwql $0.00 34.2 0 69.8 0 0 11.5 92.2qxwtwwql $2.00 52.8 0 82.7 13.4 121.7 0 0qxwtwwql $2.00 47 0 82.7 12.7 116.6 0 0wqxwqtqxw $0.50 77.9 0 0.3 27 37.5 0 13.3wqxwwql $0.00 40.8 0 40.2 0 67.1 0 13.6wqxwwql $0.00 66.2 0 0.3 0 51.5 0 14.7wqxwqtqxw $0.50 44.8 0 60.3 33.8 57 0 13.9wqxwqtqxw $0.50 43.3 0 60.3 33.3 56.5 0 13.4wqxwwql $0.00 62.5 0 0.2 0 48.7 0 13.7wqxwqtqxw $0.50 67.8 0 0.3 23.7 33.1 0 10.9wqxwqtqxw $0.50 32.8 0 60.3 29.8 53 0 9.9wqxwqtqxw $0.50 71.5 0 0.3 25.5 0 33.7 12.2ql $0.00 0 0 99.6 0 0 0 99.5ql $0.00 0 0 99 0 0 0 98.9ql $0.00 0 0 98.2 0 0 0 98.1ql $0.00 0 0 98.1 0 0 0 98qxqtwqxwwql $1.50 35.8 0 116.3 20.7 0 14 117qxwtwqxwwql $2.00 82.3 0 58.2 13.6 26.1 0 100.2qxqtwqxwwql $1.50 71.9 0 50.5 13.6 0 15.4 93ql $0.00 0 0 42.1 0 0 0 42qxwtwqxwwql $2.00 51.9 0 101.9 20.6 27.3 0 105.3qxqtwqxwwql $1.50 71.4 0 40.4 14.3 0 17.8 79.3
Column Group 3Time
Catagories Time Groups
Exp
enda
ture

Example Output of Status.csv Index
time unsp
ecifi
ed R
ider
s
Upp
erP
latfo
rmW
est R
ider
s
Upp
erP
latfo
rmE
ast R
ider
s
Low
erP
latfo
rm R
ider
s
0 0 0 0 01 0 0 0 02 0 0 0 53 0 0 0 114 0 0 0 185 0 0 0 256 24 0 0 327 24 0 0 398 24 0 0 459 24 0 0 52
10 24 0 0 5911 24 0 0 6012 48 0 0 6013 48 0 0 6014 48 0 2 5815 48 0 4 5616 48 0 4 5617 48 2 7 5118 72 4 7 4919 71 8 9 4420 66 13 14 3921 63 16 17 3622 63 17 20 3223 63 18 21 3124 87 18 21 3825 87 18 21 4526 83 20 23 5127 78 23 25 5828 77 24 25 6529 77 24 25 71
……586 128 223 103 438587 127 221 103 441588 148 221 104 443589 145 220 104 447590 141 221 103 451591 131 218 107 453592 129 213 107 454593 132 204 101 459594 155 192 103 463595 155 181 104 466596 153 168 105 473597 153 154 104 481598 152 142 102 489599 154 124 102 498

Trains.csv Output for Metro CenterIndex
GU
ID
Goa
l
Eve
nt T
ime
Eve
nt S
tate
Dur
atio
n Si
nce
Last
Eve
nt
Empt
y Se
ats
Occ
upie
d Se
ats
0 bluenorth 0 pulling into platform StationSim.ComplexTrainTrack-87a31 0 80 700 bluenorth 1.2 opened doors at platform StationSim.ComplexTrainTrack-87a31 1.2 80 700 bluenorth 11.3 left platform (thrown out of system)StationSim.ComplexTrainTrack-87a31 10.1 140 101 bluesouth 20 pulling into platform StationSim.ComplexTrainTrack-0beb2 20 80 701 bluesouth 21.2 opened doors at platform StationSim.ComplexTrainTrack-0beb2 1.2 80 701 bluesouth 31.3 left platform (thrown out of system)StationSim.ComplexTrainTrack-0beb2 10.1 130 202 orangenorth 40 pulling into platform StationSim.ComplexTrainTrack-87a31 40 80 702 orangenorth 41.2 opened doors at platform StationSim.ComplexTrainTrack-87a31 1.2 80 702 orangenorth 51.3 left platform (thrown out of system)StationSim.ComplexTrainTrack-87a31 10.1 120 303 orangesouth 60 pulling into platform StationSim.ComplexTrainTrack-0beb2 60 80 703 orangesouth 61.2 opened doors at platform StationSim.ComplexTrainTrack-0beb2 1.2 80 703 orangesouth 71.3 left platform (thrown out of system)StationSim.ComplexTrainTrack-0beb2 10.1 109 414 redeast 80.1 pulling into platform StationSim.ComplexTrainTrack-24bdd 80.1 80 704 redeast 81.3 opened doors at platform StationSim.ComplexTrainTrack-24bdd 1.2 80 704 redeast 91.4 left platform (thrown out of system)StationSim.ComplexTrainTrack-24bdd 10.1 114 365 redwest 100.1 pulling into platform StationSim.ComplexTrainTrack-cb0fc 100.1 80 705 redwest 101.3 opened doors at platform StationSim.ComplexTrainTrack-cb0fc 1.2 80 705 redwest 111.4 left platform (thrown out of system)StationSim.ComplexTrainTrack-cb0fc 10.1 101 496 bluenorth 120.1 pulling into platform StationSim.ComplexTrainTrack-87a31 120.1 80 706 bluenorth 121.3 opened doors at platform StationSim.ComplexTrainTrack-87a31 1.2 80 706 bluenorth 131.4 left platform (thrown out of system)StationSim.ComplexTrainTrack-87a31 10.1 93 577 bluesouth 140.1 pulling into platform StationSim.ComplexTrainTrack-0beb2 140.1 80 707 bluesouth 141.3 opened doors at platform StationSim.ComplexTrainTrack-0beb2 1.2 80 707 bluesouth 151.4 left platform (thrown out of system)StationSim.ComplexTrainTrack-0beb2 10.1 77 738 orangenorth 160.1 pulling into platform StationSim.ComplexTrainTrack-87a31 160.1 80 708 orangenorth 161.3 opened doors at platform StationSim.ComplexTrainTrack-87a31 1.2 80 708 orangenorth 174.8 left platform (thrown out of system)StationSim.ComplexTrainTrack-87a31 13.5 52 989 orangesouth 180.1 pulling into platform StationSim.ComplexTrainTrack-0beb2 180.1 80 709 orangesouth 181.3 opened doors at platform StationSim.ComplexTrainTrack-0beb2 1.2 80 709 orangesouth 197.5 left platform (thrown out of system)StationSim.ComplexTrainTrack-0beb2 16.2 34 116
10 redeast 200.1 pulling into platform StationSim.ComplexTrainTrack-24bdd 200.1 80 7010 redeast 201.3 opened doors at platform StationSim.ComplexTrainTrack-24bdd 1.2 80 7011 redwest 220.1 pulling into platform StationSim.ComplexTrainTrack-cb0fc 220.1 80 7011 redwest 221.3 opened doors at platform StationSim.ComplexTrainTrack-cb0fc 1.2 80 7010 redeast 221.5 left platform (thrown out of system)StationSim.ComplexTrainTrack-24bdd 20.2 7 14312 bluenorth 240.1 pulling into platform StationSim.ComplexTrainTrack-87a31 240.1 80 7012 bluenorth 241.3 opened doors at platform StationSim.ComplexTrainTrack-87a31 1.2 80 7011 redwest 242.6 left platform (thrown out of system)StationSim.ComplexTrainTrack-cb0fc 21.3 0 15013 bluesouth 260.1 pulling into platform StationSim.ComplexTrainTrack-0beb2 260.1 80 7013 bluesouth 261.3 opened doors at platform StationSim.ComplexTrainTrack-0beb2 1.2 80 7012 bluenorth 262.1 left platform (thrown out of system)StationSim.ComplexTrainTrack-87a31 20.8 3 14714 orangenorth 280.1 pulling into platform StationSim.ComplexTrainTrack-87a31 280.1 80 7014 orangenorth 281.3 opened doors at platform StationSim.ComplexTrainTrack-87a31 1.2 80 7013 bluesouth 281.8 left platform (thrown out of system)StationSim.ComplexTrainTrack-0beb2 20.5 5 14515 orangesouth 300.1 pulling into platform StationSim.ComplexTrainTrack-0beb2 300.1 80 7014 orangenorth 300.9 left platform (thrown out of system)StationSim.ComplexTrainTrack-87a31 19.6 11 13915 orangesouth 301.3 opened doors at platform StationSim.ComplexTrainTrack-0beb2 1.2 80 70

Example for Next Output File Index

Example Output from Trains.csv Index
GU
ID
Goa
l
Eve
nt T
ime
Eve
nt S
tate
Dur
atio
n Si
nce
Last
Eve
nt
Empt
y Se
ats
Occ
upie
d Se
ats
30 red 0 entered from a TrainLine Source : 0 60 4031 blue 0 entered from a TrainLine Source : 0 60 4031 blue 29.1 pulling into platform 1 29.1 60 4030 red 29.1 pulling into platform 1 29.1 60 4031 blue 34.3 opened doors at platform 1 5.2 60 4031 blue 44.4 left platform 1 10.1 55 4532 red 60 entered from a TrainLine Source : 60 60 4033 blue 60 entered from a TrainLine Source : 60 60 4030 red 64.5 opened doors at platform 1 35.4 60 4030 red 74.8 left platform 1 10.3 60 4033 blue 89.1 pulling into platform 1 29.1 60 4032 red 89.1 pulling into platform 1 29.1 60 4033 blue 94.3 opened doors at platform 1 5.2 60 4031 blue 97.6 pulling into platform 2 53.2 55 4531 blue 102.8 opened doors at platform 2 5.2 55 4533 blue 104.4 left platform 1 10.1 40 6031 blue 112.9 left platform 2 10.1 85 1534 red 120.1 entered from a TrainLine Source : 120.1 60 4035 blue 120.1 entered from a TrainLine Source : 120.1 60 4032 red 124.5 opened doors at platform 1 35.4 60 4030 red 128 pulling into platform 2 53.2 60 4030 red 133.2 opened doors at platform 2 5.2 60 4032 red 134.6 left platform 1 10.1 60 4030 red 143.3 left platform 2 10.1 80 2035 blue 149.2 pulling into platform 1 29.1 60 4034 red 149.2 pulling into platform 1 29.1 60 4035 blue 154.4 opened doors at platform 1 5.2 60 4033 blue 157.6 pulling into platform 2 53.2 40 6033 blue 162.8 opened doors at platform 2 5.2 40 6035 blue 164.5 left platform 1 10.1 40 6033 blue 172.9 left platform 2 10.1 80 2036 red 180.1 entered from a TrainLine Source : 180.1 60 4037 blue 180.1 entered from a TrainLine Source : 180.1 60 4034 red 184.6 opened doors at platform 1 35.4 60 4032 red 187.8 pulling into platform 2 53.2 60 4032 red 193 opened doors at platform 2 5.2 60 4034 red 194.7 left platform 1 10.1 60 4031 blue 199 pulling into platform 4 86.1 85 1532 red 203.1 left platform 2 10.1 80 2031 blue 204.2 opened doors at platform 4 5.2 85 1537 blue 209.2 pulling into platform 1 29.1 60 4036 red 209.2 pulling into platform 1 29.1 60 4031 blue 214.3 left platform (thrown out of system)4 10.1 100 037 blue 214.4 opened doors at platform 1 5.2 60 4035 blue 217.7 pulling into platform 2 53.2 40 6035 blue 222.9 opened doors at platform 2 5.2 40 6037 blue 224.5 left platform 1 10.1 40 60

Sample Plots Index
Comparison of times, based on timetables as entered
0
20
40
60
80
100
120
boar
ded
atra
in: n
orth
boar
ded
atra
in: s
outh
boar
ded
atra
in: w
est
thro
wn
off
end
ofbo
arde
d a
train
: eas
tbo
arde
d a
train
: sou
thbo
arde
d a
train
: wes
tth
row
n of
fen
d of
boar
ded
atra
in: e
ast
boar
ded
atra
in: n
orth
boar
ded
atra
in: w
est
thro
wn
off
end
ofbo
arde
d a
train
: eas
tbo
arde
d a
train
: nor
thbo
arde
d a
train
: sou
thth
row
n of
fen
d of
boar
ded
atra
in: e
ast
boar
ded
atra
in: n
orth
boar
ded
atra
in: s
outh
boar
ded
atra
in: w
est
(bla
nk)
arrived by train: east arrived by train: north arrived by train: south arrived by train: west from street entrancename=
(blank)
start and end points
time
in s
econ
ds s
pent
in s
yste
m (m
ean)
Total
Average of Time in System
Entry State Exit State
Goals vs. Time 3000 riders.csv lines to show trends

Assignment 2
Index

7/14/2009 89
Problem Statement
• Problem Statement:– Where they exist currently, rapid transit control systems lack
a standardized policy, monitoring, and automation scheme, resulting in proprietary highly-tailored systems lacking flexibility and consistency. There is a large untapped market for a common operating framework to meet this need.
• Mission Statement:– Create a common train allocation and automation architecture
that can be applied to a broad range of rail-based rapid transit systems.
– Maximize the versatility of the architecture while minimizing the amount of tailoring (adapter development) needed to support a given actual system.
– We will look at several (two or at most three) existing, differing systems, identifying a common operational architectures of each
– Develop a common systems architecture that can support all three.– We will steer clear of the technical details of the underlying
instantiations and instead focus on the higher level aspects of improvements: monitoring, scheduling, and allocation of the trains.
Index

7/14/2009 90
Problem Statement: Scope Refinement
• Questions Addressed– Given a fixed layout of tracks, and a predicted passenger loading pattern, what
is the best way to allocate and run trains?– Once allocated and running, how should trains best adapt to unforeseen
changes in demand? What about emergencies?– Are there opportunities to iteratively optimize or evolve the train schedules?– How can information regarding the position and status of trains best be
visualized and presented to the control center?– What are the common operational behaviors and attributes of rapid transit
systems that can be monitored and controlled in a common way across multiple transit systems?
– How can this system be made in such a way to function on a broad range of train operating performances and track layouts?
– How should the system handle the need for control system or local driver overriding control of a train?
– What are the minimum necessary adapter capabilities to instantiate this system on a real rapid transit system?
• Questions NOT Addressed– What communications protocol needs to be used and what control system
adapter is needed to interface with the existing sensors on a specific system.– How can tracks be laid out better or modified?– How can the train itself be controlled remotely from a technical standpoint?
Index

7/14/2009 91
Stakeholders
• Top-Down– Policy Makers
• Politicians– Administrators
• Transit Management• Transit Monitoring
Office• Schedulers and
Planners• D.C. Metro
Management– Industry
• Train Manufacturers• Automation Providers• Control Center
Integrators
• Bottom-Up– The Riders
• Commuters• Tourists• Special Event
Attendees– Operating Staff
• Ticket Counters• Train Drivers• Security• Maintenance Staff
– Training Staff
Index

7/14/2009 92
Stakeholders: Needs v.s. Wants
Stakeholder Policy MakersType of
Stakeholder Politicians Transit Management
Transit Monitoring Office
Schedulers and Planners
Safe, efficient system
Safe, efficient system
More situational awareness
More situational awareness
Attract riders Better decision making tools
Reduced operating cost
Increased capacity
Maximize profitIncreased flexibilityMinimize
upgrade costs
Secondary Needs (Wants) Attract riders Reduced workload
Reduce pollution
Needs
Transit Administrators
Index

7/14/2009 93
Stakeholders: Needs v.s. Wants
StakeholderType of
Stakeholder Training Staff Train Drivers Maintenance Staff Ticket Counters Security
Simpler operations
Safe, efficient system Efficient operations More situational
awarenessMore situational
awareness
status of rolling stock and sensors
Secondary Needs (Wants) Training tools Reduced
workloadOptimization of train
downtimeLess passenger
confusion
Common operations
Needs
Operations and Training Staff
Index

7/14/2009 94
Stakeholders: Needs v.s. Wants
StakeholderType of
StakeholderTrain
Manufacturers OEM/Vendors Commuters Tourists Special Event Attendees
Standardized interaces
Standardized Interfaces Efficient ride Safety Safety
Support for train performance capabilities
Reduced cost Reduced cost Reduced delays
Safety Better information Better information
Reduced delays Reduced cost
Secondary Needs (Wants)
Customization on train optimal parameters
Better information
Needs
Suppliers The Riders
Index

7/14/2009 95
Stakeholder Value Mapping
Rid
er W
ait T
ime
Rid
er R
ide
Tim
e
Cap
acity
Effi
cenc
y
Ener
gy C
onsu
mpt
ion
Trai
n U
tiliz
atio
n
Stat
ion
Que
ue S
ize
Trai
ning
Req
uire
men
ts
Impl
emen
tatio
n C
ost
Ope
ratio
nal S
afte
y
Ope
ratio
nal R
esilie
ncy
Situ
atio
nal A
war
enes
s
Rid
er In
form
atio
n
Stak
ehol
der I
mpo
rtanc
e
Politicians 2 1 3 5 3 4 1 5 5 3 1 4 50%
Transit Management 3 3 5 5 5 5 5 3 5 5 5 3 100%
Transit Monitoring 3 2 2 2 4 3 5 1 5 5 5 2 80%
Schedulers and Planners 5 5 3 3 5 5 3 1 3 5 5 4 60%
D.C. Metro Management 4 4 5 5 5 5 2 5 5 5 5 3 100%
Commuters 5 5 1 4 1 3 1 4 3 5 1 3 80%
Tourists 5 3 1 1 1 4 1 2 3 3 1 5 50%
Special Event Attendees 5 3 1 2 1 5 1 1 3 5 1 5 50%
Training Staff 1 1 1 1 1 1 5 3 3 2 5 3 40%
Ticket Counters 4 4 4 1 3 5 3 1 4 5 5 5 30%
Train Drivers 3 3 2 1 3 5 4 1 5 4 5 1 30%
Security 2 2 4 1 4 5 1 1 5 3 5 5 20%
Maintenance Staff 1 1 2 1 2 2 4 4 5 5 5 1 20%
Train Manufacturers 2 1 2 3 4 1 1 3 4 5 1 2 50%
Automation Providers 4 2 4 1 1 2 3 4 5 4 3 2 50%
Control Center Integrators 4 2 2 1 1 2 4 5 5 4 5 2 50%
Composite Weighted Score: 31 25 24 25 26 32 24 25 37 38 31 27
Rid
ers
Staf
fPr
ovid
ers
Mgm
t
Index

7/14/2009 96
Stakeholder Value Mapping
0
5
10
15
20
25
30
35
40
45R
ider
Wai
t Tim
e
Rid
er R
ide
Tim
e
Cap
acity
Effi
cenc
y
Ene
rgy
Con
sum
ptio
n
Trai
n U
tiliz
atio
n
Sta
tion
Que
ue S
ize
Trai
ning
Req
uire
men
ts
Impl
emen
tatio
nC
ost
Ope
ratio
nal S
afte
y
Ope
ratio
nal
Res
ilienc
y
Situ
atio
nal
Aw
aren
ess
Rid
er In
form
atio
n
1
Index

7/14/2009 97
Strategy: Tools and Resources
Software Tools• Group Facilitation
– Google Groups– FreeMind– MS Project– Blackboard and ATT
Teleconference Services• Product Generation
– Visio 2003– Sparx Enterprise Architect
• SysML Add-on
• Modeling and Visualization– Visual C# Express Edition 2008
• Prototype Development– Generic Modeling Environment
from Institute for Software Integrated Systems at Vanderbilt University
• Model Flexibility
Modeling Languages• SysML
– Dave is the only one with UML experience
– Highly applicable to our domain– Parametric and Requirement
Diagrams very useful in our modeling
– Operations-centric, versus software-centric
– Activity, Block Definition, Internal Block, Package, Parametric, Requirement, Sequence, State Machine, Use Case diagrams, plus Allocation Tables.
• Potential: Domain Specific Modeling Languages– Highly customized– Bleeding edge
Index

7/14/2009 98
Schedule Index

7/14/2009 99
Optimization Possibilities
• Maintenance Schedules/Car Inventory based on service rates (Optimization)
• Master Schedule Development (Queuing Theory)
• Flexibility (ability to respond to situations – increased ridership for events, station fire etc) (Queuing Theory)– Train routing excursions– Additional trains/cars (on-call personnel)
Index

7/14/2009 100
P-Diagram
A-MART
Index

7/14/2009 101
Functional Scope
A-MART
System-Specific Adapter
Trains& Track
Human Operators
Native commands
Standardized logical commands
Standardized status messages
Settings and pre-configurations
Overriding commands
Visual AlertsVisual Status Information
Status Query
Display, Automation, and Configuration Settings
Operating ProceduresInterface Specification
Native Status Information
Sensor Queries
Feedback
Index

7/14/2009 102
Drilling Down: Functional Decomposition
Standardized logical commands
Standardized status
messages
Settings and pre-configurations
Overriding commands
Visual Alerts
Visual Status Information
Status Query
Display, Automation, and
Configuration Settings
Train Logic Controller
VisualizationEngine
Status Monitor
Periodic Query
Events, Alerts, Requests for
Decisions
Situational Awareness
Current Logic
Actions
Operating Procedures
Operating Rules
Standardized Dashboards
Index

7/14/2009 103
Ongoing Items
– Mission• Business Strategy• Functional Strategy• Competitors• Program Plan
– Conceptual Design• Goals• Function• Alternate Concepts• Regulation• Technology• Modularity• Supplier Plan• Architecture• Commitment
Index

7/14/2009 104
Supporting Material
Background ResearchThe TeamSonsors
Index

7/14/2009 1052009-7-14 105
Background: BART
• Bay Area Rapid Transit (BART) provides heavy commuter rail service in the San Francisco Bay Area. On a typical work day it serves around 250,000 passengers. During commute hours over 50 trains, most consisting of 10 cars, will be in service. Cars are driven by electric motors powered by a 1000 VDC, "third rail." Cars use both regenerative and friction brakes. The system is controlled automatically. On-board operators have a limited role in normal operations. Operators signal the system when the platforms are clear so a train can depart a station. More importantly, operators trouble-shoot problems, and can operate trains manually (at low speeds) when there is a problem.
• Advanced Automatic Train Control (AATC) system being developed for the Bay Area Rapid Transit (BART) system.
Winter,Berg,Ringland,” BARTDistrict Advance Automated Train Control System Case Study Description”,
Index

7/14/2009 1062009-7-14 106
Background: BART
• The AATC system replaces part but not all of BART’s current control system. AATC consists of new station computers, a radio communications network that links the stations with the trains (communications currently are through the running rails, with very low bandwidth), and software modifications to the front and back controllers on-board the trains. The communications system provides ranging information (from wayside radios to train radios and back) that allows the system to track train positions. On the trains, the control computer is located in the lead car. This computer controls the operations of the brakes and motors on all the cars in the consist.
• Most of the control computation is done at the stations; the trains respond to speed and acceleration commands. Each station controls trains only in its immediate area. A station must thus communicate with its neighbors to receive and hand-off trains. BART has asked its contractors to size the system to be able to handle 20 trains in each station’s control zone. This would correspond to an extreme back-up situation. In locations where stations are closely spaced, such as in downtown Oakland or San Francisco, one computer may manage a zone that spans several stations.
Winter,Berg,Ringland,” BARTDistrict Advance Automated Train Control System Case Study Description”,
Index

7/14/2009 107
Background: MBTA
• The Massachusetts Bay Transportation Authority (MBTA) is "a body politic and corporate, and a political subdivision" of the Commonwealth of Massachusetts formed in 1964 to finance and operate most bus, subway, commuter rail and ferry systems in the greater Boston, Massachusetts, area. It replaced the Metropolitan Transit Authority (MTA), immortalized by the Kingston Trio in the popular folk-protest lament "M.T.A.". Locals call it simply "The T", after its logo, the letter T in a circle, adopted in the 1960s. In 2006, the system averaged 1.1 million passenger trips each weekday, of which the subway averaged 598,200, making it the fourth busiest subway system in the United States.
2009-7-14 107
Index

7/14/2009 1082009-7-14 108
Background: WMATA
• The Metrorail (subway) system and the Metrobus (bus) network are owned and operated by the Washington Metropolitan Area Transit Authority (WMATA) — a multijurisdictional, quasi-governmental agency.
• WMATA, via its annual repairs and rehabilitation efforts, maintains its Automatic Train Control (ATC) system at the highest safety and repair condition.
• During normal operation on revenue tracks (used for passenger services), trains are controlled by an automatic train control system (ATC) which accelerates and brakes the train automatically without operator intervention. However, all trains are manned with train operators who close the doors (they can optionally be set to open automatically), make station announcements, and supervise their train. The operator can switch a train into manual mode and operate the train manually if needed.
• Non-revenue tracks (storage tracks, tail tracks, yard tracks) are not equipped with ATC. Green signs with letters reading “START ATC” and “END ATC” mark the beginning and ending respectively of ATC territory.
Washington Metropolitan Area Transit Authority,Mar 31,2005
Index

7/14/2009 1092009-7-14 109
BART Operations Control Center
• The Operations Control Center(OCC) functions as the nerve center of BART's 95-mile system, performing supervisory control of train operations and remote control of electrification, ventilation and emergency response systems. The new display boards use computer imaging and video projection to display the entire system, combining information into two: one for track and train positions and the other for maintenance information and electrification. Because the display is software-driven, it can be updated with virtually no limit to the miles of track or number of stations depicted. Stations and wayside - Network of control devices and track circuits controlling train speeds, stops and safe spacing. Backup train protection system - Sequential Occupancy Release System (SORS): 52 mini-computers in 26 stations.
Index

7/14/2009 1102009-7-14 110
MBTA Operation Control Center
• The OCC included supervisory control and data acquisition for infrastructure and traction power control, voice communications by radio and telephone, and both centralized traffic control and automatic vehicle identification surveillance and control of rail traffic. The OCC is housed in a column-free theater-style facility with a mezzanine for an operations supervisor, emergency control, and a conference room, all with a view of the overall display board.
Index

7/14/2009 1112009-7-14 111
WMATA Operations Control Center
• The Washington Metropolitan Area Transit Authority (WMATA) operates the second largest rail transit system in the United States.
• WMATA Rail Operations Control Center (ROCC) provides train movement and wayside device monitoring and control, including third rail power. Also provides incident management.
• alert notification• emergency transit schedule information• emergency transit service request/response• transit emergency data• transit system status assessment• transit traveler information coordination
Index

7/14/2009 1122009-7-14 112
Glossary of Terms
• BART - Bay Area of Rapid Transit• MBTA - Massachusetts Bay Transportation Authority• WMATA - Washington Metropolitan Area Transit Authority• OCC - Operations Control Center• ATP - Automatic Train Protection• ATO - Automatic Train Operation • ATS - Automatic Train Supervision• ATC – Automatic Train Control• AATC- Advanced Automatic Train Control• ITS - Intelligent Transportation Systems• Cab - The compartment of a rail car where the operator
works and where the rail car's controls are located
Index

7/14/2009 1132009-7-14 113
Rapid Transit System Corporations
• Bombardier Inc. is a Canadian conglomerate, founded by Joseph-Armand Bombardier in 1942, at Valcourt in the Eastern Townships, Quebec. Over the years it has been a large manufacturer of regional aircraft, business jets, mass transportation equipment recreational equipment and a financial services provider.
• Bombardier provides complete transport systems designed for environment, platform and modular technology designed for urban and mainline operations combined with a comprehensive portfolio of rolling stock, propulsion and control
systems, and services for vehicle modernization and maintenance.
Index

7/14/2009 1142009-7-14 114
Rapid Transit System Corporations
• Siemens AG is Europe's largest engineering conglomerate and the largest electronics company in the world. was founded by Werner von Siemens on 12 October, 1847. Based on the telegraph, his invention used a needle to point to the sequence of letters, instead of using Morse code. The company – then called Telegraphen-Bauanstalt von Siemens & Halske – opened its first workshop on October 12.
• Siemens Transportation Systems (STS) is one of the business units of Siemens AG. Products produced include automation and power systems, rolling stock for mass-transit, regional and mainline services, turnkey systems and integrated services, railway signaling and control systems, and railway electrification.
Index

7/14/2009 115
Rapid Transit System Corporations
• Parsons Corporation is an engineering and construction company headquartered in Pasadena, California. Founded in 1944 by engineer Ralph M. Parsons, Parsons Corporation is currently one of the largest such companies in the United States, with revenues exceeding $3.6 billion in 2007.
• Parsons provides transportation command-and-control centers, communications, signals, power facilities, security systems, and intelligent transportation, develops economical solutions and creative project delivery methods for all forms of rail and busway projects worldwide and provides base operations and maintenance services for mission-critical facilities for federal agencies such as facilities maintenance, logistics, safety, environmental management, utilities, and transportation.
2009-7-14 115
Index

7/14/2009 116
BART Track Map
2009-7-14 116
Index

7/14/2009 117
MBTA Track Map
2009-7-14 117
Index

7/14/2009 118
WMATA Track Map
2009-7-14 118
Index

7/14/2009 119
The Team
• David Claypool– S.E. Program– Fluent in UML, SysML, Simulation– Experience in scheduling algorithms
(radio context), distributed algorithms, visualization, and graph theory
– Concentrating on the SysML modeling aspects and implementation/simulation aspects.
• Mahesh Balakrishna– S.E. Program– Systems Engineer at MITRE– Air Traffic Control background– Formal training in rapid transit in
previous coursework– Likely working on
• Yimin Zhang– O.R. Program– Currently looking at background
research– Business Case– Optimization
• Kimberly Baumgartner– O.R. Program– Air Force Logistics Officer– Strategic Planning and Operational
Efficiency– Key for Control Center Design and
operational architecture
Index

7/14/2009 120
Sponsors
• Primary Lead:– Mr. Michael Goode– Adjunct Professor, CEIE– Assisted in teaching courses at
GMU on Rapid Transit– Works at Jacobs, leading
automation engineering firm for rail systems
• Primary Lead:– Dr. Alex Levis– Professor of Systems
Engineering at GMU
• Secondary Lead:– Contacting Metro Directly
• Secondary Lead:– Adam Joseph at BAE Systems– Previous experience with D.C.
Metro Automation System
Index

7/14/2009 121
Functional Context: As Is Index

Assignment 3
Index

Weekly Status
• Problem Statement Refinement• Project Scope Definition• Project Development Process• Schedule Development
• Existing System Analysis• Stakeholder Analysis• Requirements Analysis
Index

Problem Statement Evolution
• Problem Statement– Worldwide, rapid transit control systems have been
created and modified on an ad hoc basis. Considering each system as an independent design leads to inefficiency and waste. Furthermore, failing to consider the commonality of such systems prevents finding the best control solutions for the whole and also prevents future design evolution to improve the whole.
• Mission Statement– Determine and solve the abstract control pattern that is
common to these systems. By abstracting an architectural layer, it will make it possible to investigate common throughput and efficiency concerns which after finding solutions would be generally applicable to some or all of the system architecture instantiations: improving each instantiation’s performance at lower cost, quicker to deploy, and common maintainability.
Index

Project Scoping
Index

Project Scoping
Index

Project Vision
• Deliverables– The generic dynamic optimization architecture
and supporting algorithms to – Simulation of the architecture on four actual
systems’ track layouts and attributes• Optimization Focus (tentative)
– Rider Variations– System Events– Resource Optimization
• Point of Comparison in simulations– Existing, purely static scheduling.
Index

Functional DecompositionExternal Scope
• Control Rapid Transit–Monitor system Status–Produce Optimized Schedules
• Statically Optimize Schedules– Known passenger traffic patterns– Known service expectations
• Dynamically Optimize Schedules– Handle Unanticipated passenger loads– Handle Unanticipated other events– Opportunistically Optimize Resources
–Control Trains
Index

Functional DecompositionDrilldown
• Dynamically Optimize Schedules–Handle Unanticipated passenger loads
• Handle overloaded trains• Handle influx at station
–Handle Unanticipated other events• Handle fire/terrorist/station closure event• Handle train/track breakdown
–Opportunistically Optimize Resources• Reduce energy consumption• Reduce train utilization
Index

Product Development Process
Index

Product Development Process
Index

Product Development Process
Index

Product Development Process
Index

Product Development Process
Index

Product Development Process
Index

Product Development Process
Index

Product Development Process
Index

Our Unified RepositoryEnterprise Architect:
Index

Web Page
Initial Homepage has been established
http://mason.gmu.edu/~kbaumga1
We will soon be uploading EA files and other informaiton
Index

Schedule Development
Index

New Schedule
• Completely re-accomplished schedule to directly correlate to project flow in SYSML EA
• Tied Deliverables to PDP versus PDP to Deliverables– Incorporated 4-phased approach
• Project Initiation• System Analysis• Operation Architecture• Optimization Architecture• Architecture validation
Index

Schedule Items Index

Schedule Continued Index

Current Analysis Work
Index

Current Analysis Work
BART(Bay Area Rapid Transit)
CTA(Chicago Transit Authority)
MBTA(Massachusetts Bay Transportation
Authority)
ATP Train in Separation
Overspeed Protection Route Interlocking
automatic overspeed protection,overspeed protection, and interlocking control with
advisory cab signals
Mixture of cab signals with automatic overspeed protectionwayside signals with trip stops
Mixture of cab signals with automatic overspeed protectionwayside signals with trip stops
ATO Velocity Regulation
Programmed Stopping Door Control and Train Starting
Fully automatic, with alternativeof manual operation
Fully automatic, with alternativeof manual operation
Fully automatic,with on-board operator sending departure signal to the system
Manual operation Mixture of manual operation andautomatic speed regulation
ATS Dispatching and Monitoring Performance Level Control
Centralized computer control with centralized manual control and local manual control
available as back-upmodes
Mixture of centralized andlocal manual control
Mixture of centralized andlocal manual control
COMMUNICATIONS Operator- Passengers
Central Control–Passengers operator-Central Control
One-way PA One-way PA
Two-way radio phone
One-way PA One-way PA
Two-way radio phone
One-way PA One-way PA
Two-way radio phone
Index

Current Analysis Work
PATCO(Port Authority Transit Corporation)
WMATA(Washington Metropolitan Area
Transit Authority)Mosco Metro Paris Metro
ATP Train in Separation
Overspeed Protection Route Interlocking
Mixture of cab signals with automatic overspeed protection,overspeed protection,
and interlocking control
Fully automaticFully automaticFully automatic
automatic interlocking system, signalling systems, centralized
traffic control
ATO Velocity Regulation
Programmed Stopping Door Control and Train Starting
Automatic speed regulation and programed station stopping
Fully automatic, with alternativeof manual operation
Fully automatic, with alternativeof manual operation
Fully automatic, controlled bylocal timer subject to
manual override
A centralized traffic control system enabling remote signaling, route detection and implement remote
control of track switches.
ATS Dispatching and Monitoring Performance Level Control
Centralized manual control
Centralized computer control with centralized manual control and local manual control available as back-
upmodes
Centralized computer control with centralized manual control
equipped with SCADA at each station
COMMUNICATIONS Operator- Passengers
Central Control–Passengers operator-Central Control
One-way PA One-way PA
Two-way radio phone
One-way PA and noise monitorsystem
One-way PATwo-way radio phone
One-way PA One-way PA
Two-way radio phone
One-way PA One-way PA
Two-way radio phone
Index

Current Analysis Work
MBTA(Massachusetts Bay
Transportation Authority)
Tokyo subway Mosco Metro Paris Metro CTA(Chicago Transit Authority)
BART(Bay Area Rapid Transit)
PATCO(Port Authority
Transit Corporation)
hist
oric
al s
igni
fican
ce
one of the oldest rail rapid transit systems in theUS,opened in 1901
most extensive rapid transit system in a single metropolitan area In 1995,the subway
system was attacked with sarin nerve gas
Opened in 1935, it is the world's second most heavily used
rapid-transit system the Metro was
initially (until 1955) named after
designer:Kaganovicha
opened without ceremony on 19 July 1900,The system expanded quickly
until the First World War and the core was complete by the 1920s. In the late 1990s, the automated line
14 was built
undergone in 1947, mostly manual control at the beginning
connect the East Baysuburban communities with the
Oaklandmetropolis and to link all of
these with San Francisco by means of the Transbay Tube
under San Francisco Bay.
connecting seven southern New Jersey suburban ommunities
with the city of Philadelphia,opened in
1969
Trac
k to
polo
gy
three rapid transit lines 43 stations
The T82 stations and 14 line
a loop line around the city center connecting the
outward going lines 12 lines and 177
stations
16 lines and 300 stations,384 stops in total
7 lines and 142 stations Two of the six downtown
lines are in subways, entering and leaving by
tunnels under the Chicago River.
4 lines and 34 stations routes form an X-shaped pattern the
largest geographical area of any operating rail rapid transit
system in the country.
a single route
cont
rol m
etho
dolo
gy
patially automatic patially automatic patially automatic patially automatic patially automatic fully automatic patially automatic
cultu
ral i
nflu
ence
s
age and diversity of the rolling stock.Five different
types of cars are in operation; requires a crew
of three to operate doors(safefy)
1st passenger ridership:eight million
passengers daily push riders and their belongings into train
cars extremely punctual
well known for the ornate design of
many of its stations experienced four
stage construction. Fastest worldwide
system
Paris has the most closely spaced subway stations in the world,covers a great amount of throughout the cityand it is notable for its station
architecture.
the throughput for over halfof the CTA system is determined by
the volume of traffic that can be accommodated on the tracks of the 75-year-old Loop El structure and its
associated movable bridges.
TBD TBD
gove
rnin
g bo
dy
Massachusetts Bay Transportation Authority (MBTA) is "a body politic
and corporate, and a political subdivision" of the
Commonwealth of Massachusetts
Teito Rapid Transit Authority and Tokyo Metropolitan Bureau
of Transportation
state-owned enterprise
Régie Autonome des Transports Parisiens(RATP)
an independent governmental agency created by state legislation
San Francisco Bay Area Rapid Transit District
the Delaware River Port Authority (DRPA).
Index

7/14/2009 148
Stakeholder and Requirements Analysis Using EA
Index

7/14/2009 149
Stakeholders Needs/Wants
• Stakeholder Needs/Wants have been gathered through various means including:
Analysis of detailed customer surveys performed bycurrent transit providers.Guidelines from TCRP such as A Handbook for Measuring Customer Satisfaction and Service Quality (report 47). Discussions with staff from Metro systems.
Index

7/14/2009 150
Stakeholders
Index

7/14/2009 151
Needs/Wants – Requirement Mapping
Index

7/14/2009 152
Requirements
Index

7/14/2009 153
Stakeholder – Requirement Mapping
Index

Assignment 5
Index

Weekly Status
• Problem and Mission Statement (refined)• Project Vision(refined)• Project Development Process (Adjusted)• Architecture Alternatives and Forms (new)• Optimization/Sensitivity Analysis Forms (new)
• Schedule Development (Project file updated)
Index

Problem Statement Evolution
• Problem Statement– Worldwide, rapid transit control systems have been
created, modified, analyzed, and optimized on an ad hoc basis. Considering each system as an independent design leads to inefficiency and waste.
– Failing to consider the commonality of such systems prevents finding the best control solutions for the whole and also prevents future design evolution to improve the whole.
– Crowding in rapid transit systems worldwide is a major source of crime, dissatisfaction of ridership, stress on the system, and danger to the public.
Index

Problem Statement Evolution
• Mission Statement– Model the common network flow pattern at multiple
connected layers of abstraction, concentrating on the minimization of crowds due to system parameters.
– By abstracting an architectural layer, it will make it possible to model any rapid transit system and determine common throughput and efficiency concerns which after finding solutions would be generally applicable to some or all of the system architecture instantiations
– improving each instantiation’s performance at lower cost, quicker to deploy, and common maintainability.
• Our Team– We are a systems engineering firm taking on this problem as
an internal research and development effort. We see the business opportunity as applying not only to the selected systems of focus, but also other systems worldwide as well as a broader range of network-related control problems.
Index

Project Vision
• Deliverables– The architectural paradigm of the family of rapid transit
systems modeled as a network flow at multiple levels of the system description.
– Simulation of instances of the architecture for one rapid transit system, potentially more, at each layer.
• Optimization/Sensitivity Analysis (tentative)– Reducing passenger crowding at stations due to
passenger and rail scheduling/queuing delays.– Study how passenger crowding is impacted by changes
in passenger flows, train headway times, train dwell time, etc
• Point of Comparison in simulations– Current station loading statistics, rider complaints.
Index

Adjustment to Product Development Process
A modification to the PDP is required to accommodate the spiral type development process needed to abstract the operational architecture upwards.
Study Current System
Study Current System
Study Current System
Describe Common Paradigm
Create Station Model
Create Neighborhood
Model
Create Line Model
Create System Model
Analyze Model Analyze Model Analyze Model Analyze Model
Create Optimization Techniques
Improve Models Share Input Data
Summarize Optimization
Improvements
Summarize Model Usage and Future
Justify and Validate
Index

160160
Operational Architecture Forms
• Operational Architectures Considered:– A policy-centric architecture that models the current way of running the train system and
optimizing it (by generating schedules and train control guidance). The optimality criteria could include:
• Increasing revenue (by increasing utilization of trains and reducing wasted capacity)• Increasing efficiency• Increasing safety
– A Command and Control centric architecture that provides decision support for reacting to track closures, station closures and emergencies.
• This would include the operational procedures associated with specific use cases• Optimization analysis of various courses of action for use cases
– A rider-centric architecture that concentrates on providing service to the end-user, the rider. • Increased reliability and availability of information• Clean/aesthetically pleasing stations and trains (through efficiency and reduced wait time)• Free of crime• Safety
– A network flow-centric architecture that looks to incorporate elements from above but from the perspective of flows at various levels.
• Zoom Level 1: Flows of people at one station.• Zoom Level 2: Flows of people between one station and it’s neighbors.• Zoom Level 3: Flows of people on a single line.• Zoom Level 4: Flows of people on one transit system network.•
––
Index

Zoom Level 1A Single Station
•Network nodes are the locations within the station
•Flows are passengers
•The characteristics of how long a train takes to load-unload given behaviors within the station become the inputs to the behavior model at the next level.
Index

Zoom Level 2A Network Neighborhood
•Network nodes are the stations and generic versions of the passenger flows (perhaps one per node)
•Flows are trains
•The compounding behavior between two stations becomes visible, and allows for tweaking of the model for prep for the next layer.
•Possible integration with lower-level simulation, for consistency checking.
Index

Zoom Level 3An Entire Line
•Network nodes are the stations
•Flows are trains
•The underlying layers provide the generalized behaviors for the nodes/edges at this level.
•Likewise, the train arrival times can feed into the lower-level simulation, as a feedback loop.
Index

Zoom Level 4The System
•Network nodes are the stations
•Flows are trains
•Studying the interaction among lines, in particular the congestion of trains
•Potential for fault analysis and mitigation.
Index

Optimization Architecture Forms
• Optimization architecture is primarily based on what common operation architecture is going to be used in the four systems we chose. Different objective function could be chosen based on the operational architecture chosen. Alternatives include:
– A policy-centric architecture that models the current way of running the train system and optimizes it (by generating schedules and train control guidance).
• Max throughput: – Use linear programming to optimize the schedule to get maximum
throughput based on passenger flow, number of trains, minimum dwell time, train speed, train separation, level of service, etc.
– A Command and Control centric architecture that provides decision support for reacting to track closures, station closures and emergencies.
• Max robustness of traffic planning and control with respect to uncertainty: – Use stochastic analysis (event-driven?) to take uncertainty into account
based on number of passengers at affected stations, evacuation rate, response time for control center, reroute time, etc.
– A rider-centric architecture that concentrates on providing service to the end-user, the rider. (station congestion is considered as a root cause)
• Min delays to a certain level:– Use stochastic process dealing with the waiting time at all stations
according to operational architecture to minimize delays based on passenger flow, service rate at each station, etc.
– A network flow-centric architecture that concentrates on understanding the performance of congestion.( taking perspective of flows at different levels)
• Model passenger flows at stations for different levels– Use queuing theory dealing with the queue length from a single station to
one rapid transit system according to operational architecture to understand the performance of congestion.
Index

Sensitivity Analysis
• Due to the change in scope to model rapid transit as network flows at multiple levels, it was decided that rather that optimization, we will perform sensitivity analysis.
• We intend to develop a flexible model that can be used perform sensitivity analysis on various aspects of the system by allowing a user to simulate how different courses of action will effect outcomes for example – Our model can be used to see how congestion is impacted by:– Changing the direction of certain escalators during mass exit/entrance
times– Changing the train headway times– Changing the train dwell times– Other station/metro-specific options
Index

Architecture Validation
– Multiple alternatives exist for validation of the model at various levels through simulations.
– These include tools such as Pajek®, TranSims®, RaimSim®, Arena® or custom simulations in Visual C#
– A Morphological Box can be used with helping decide which tools to use:
Level What Using
Station Pax Congestion C Sharp
Line Train flows Arena
system Nodes/stations
Index

Validation Example
Example of Basic Metro station using Arena®
Index

Validation Example (2)
Example of a model of passenger flows at a simple station.
Demo
Index

Assignments 6 & 7
Index

Agenda
• The three aspects of alternatives selection defined and revisited–Architecture Paradigm Development–Executable Architecture Development–Systems Analysis
• Our Evaluation Process• Our conclusions• Our way forward, and current
progress
Index

Physical Systems Selection
• Goal: The way in which we will describe the common language of rapid transit system design – emphasizing station layout and design.
• Set In Stone: Either Boston T, Atlanta Metro, DC Metro, London Underground, or New York Subway
• The Alternatives:– Boston T– Atlanta Metro– DC Metro– London Underground– New York Subway
Index

Boston T Atlanta Metro DC Metro London Underground
New York Subway
Complexity for Analysis 3 1 4 5 5
Existing Crowdedness 4 3 5 5 4
Accessibility of Information 2 1 5 3 2
Feasibility 4 2 5 4 2
3.25 1.75 4.75 4.25 3.25
Stations and System
Single Station, for inter-system
comparison
Crit
eria
:
Composite Score:
Selection:
Index

Architecture Paradigm Development
• Goal: The way in which we will describe the common language of rapid transit system design – emphasizing station layout and design.
• Set In Stone: Using SysML, using Enterprise Architect• The Alternatives:
– User Centric Approach– Network Flow Centric Approach– System Operations Centric Approach– Systems Evolution Approach
Index

User Centric Approach
Network Flow Centric
Approach
Systems Operations
Centric Approach
Systems Evolution Approach
Value for Platform Crowding
5 - The goal is to reduce platform
crowding for safety and security of
passengers
4 - Platforms can be seen as nodes in a flow network.
This a network flow view can be used to analyze
platform crowding.
4 - Sys Ops could take measures to reduce platform
crowding
3 - Platform crowding coule be
reduced by improving overall transit system.
Execution Possibilities
5 - Agent based modeling can be used to model
and simulate user behavior and
desires
3 - Flow models can be simulated
however abstraction is
needed to look at flows at different
levels.
2 - Limited availability of information
needed ot model and simulate accurately
1 - Such a model could be built and simulated but its
use to study platform crowding
is limited
Applicability
5 - Directly aplicable. Safety and security of
riders is paramount.
5 - A metro rail system is a
classic example of network flows
3 - Sys Ops tends to look at
big picture rather than at the
platform level.
2 - A platform is just a small part
of the overall system.
Feasibility
4 - Our own experiences as
rapid transit riders make it easier to
model.
3 - Layers of abstractio needed to get to the level
of platform crowding.
2 - Limited availability of information
needed ot model and simulate accurately
2 - Limited availability of
detailed documentation on
system architectures.
19 15 11 8
Yes, for station/platform crowding only
Yes, to the extent that platform crowding is
directly impacted by flows of people
No No
Crit
eria
:
Composite Score:
Selection:
Index

Executable Architecture Development
• Goal: To generate an interactive, configurable model of the evolving model generated by the architecture effort for data collection, visualization, and analysis.
• The Alternatives:– Transim– Arena– CPN Tools– C# Custom Development– Excel Spreadsheets– Manual Mathematical Models– MATLAB– Pajek
Index

Transim Arena CPN Tools C# Excel Matlab Manual Processing
Learning Curve
Developed for large intermodal regional
transportation systems-very complex. Requires
Training sessions.
Relatively simple with built in guides and
tutorials
4- Easy to model, simulate and analysis
Easy to learn and perform rapid prototyping.
Commonly usedRequires Familiarity,
Dave and Mahesh have it
Must develop mathematical models
and run data. Very time consuming
2 2 1 4 5 3 3Data
Collection
3- Data collection capability, unknown if
access station platform information ia available.
easy to import and anlyze data - stochastic
based
5-Easy to import and export in various forms
Easy to import and export data in various
forms
Easy to save data that is readable by Excel
Imports spreadsheetsMathematical tools
could be used to get at results.
5 3 4 5 5 5 4Liscensing free for non commercial
use
2- Student version is free, but severly limited, full version only avail in
labs
3-License is required. Free for use from Microsoft
We all have licenses Brutally expensive, even for students
Requires mathematical tools
5 2 3 5 5 2 3Integrity Sponsored by DOT
widely used for Discreet Event Sim
5- widely used in modeling and simulating
Extensively used for rapid prototying bu
corporations.
Extensively used in industry for data
analysisIndustry Standard
Depends on methods used
5 5 3 4 4 5 3
Extensibility
Complex, designed for intermodal
transportation analysis. Requires extensive work
to add capabiltiies for platform analysis
3- Arena is discreet event simulation only,
specifially models resources, with trains as resources, it is not easy to expand to the
system
3-Generic, but Easy to add additional analysis
and extend
The object oriented nature makes it easy to
build on.
Easy to add additional analysis
Only for data processing, really, for
this projectVery time consuming
2 3 3 5 4 2 3Visualization Various visualization
methods available.
decent architectural view of process, but not as tailorable as others
Horrible, ugly interface
Comes with extensive visualization functions for real-time and post
mortem analysis
Excellent graphing tools Excellent graphing tools Requires other tools for visualization
4 2 1 5 5 5 13.8 2.8 2.5 4.7 4.7 3.7 2.8
No Possible for model validation
No Yes, for modeling of the system
Yes, for data visualization
For data analysis
Crit
eria
:
Composite Score:
Selection:
Index

Station Systems Data Collection
• Goal: To collect selected data, process it into usable form, test for correlations, make hypotheses, test those hypotheses, and iterate until substantial conclusions can be made. Note we will initially test all of these for correlation and narrow focus of analysis to those with highest correlation
• The Alternatives:– Rider Time Focus (system time, component times etc)– Instantaneous Station Rider Count (at station and
platform)– Flow Rates (into/out of station, onto/off platform)– Queue Length Focus– Rider Density (on train)– Rider-Train Interaction – Dwell Time
Index

Rider Time Focus
Instantaneous Station Rider
CountFlow Rates Queue Length
Focus Rider Density Dwell Time Rider-Train Interaction
Platform Crowding Focus
3-direct correlation TBD
5-this is what we are trying to
reduce
3-direct correlation TBD
3-direct correlation TBD
3-direct correlation TBD
3-direct correlation TBD
3-direct correlation TBD
Improvement Opportunity
4 - if correllated can look for
solution fo affect flow rates
5 - the goal is to reduce this
number
4 - if correllated can look for
solution fo affect flow rates
4 - if correllated can look for
solution fo affect flow rates
4 - if correllated can look for
solution fo affect flow rates
5 - is a potential course of action
3 - may be outside of our
focus
Model Interaction 3 - model output 5-model output
5 - model inputs PLUS resultant flows at queus and changes in
flow rates
3 - output 3 - can be derived 5 - excursion5 - specific
behavior modelling
Stakeholder Applicability 3 5 3 4 5 1 1
13 20 15 14 15 14 12
If Correlated Certainly
If Correlated
If Correlated Certainly
If Correlated
Possible
Crit
eria
:
Composite Score:
Selection:
Index

Our sensitivity analyses
• Once correlations are determined we will drill down to see how sensitive the overall crowding is to changes in those parameters. (ie if flow rate in from the street is reduced by 5%, how much is station crowding reduced)
• We will then conduct operational analysis to determine possible actions to be taken that could affect changes in the correlated parameters (ie restricting flow into the station by reversing an escalator)
Index

Our modification studies
• Once potential modifications have been determined we will validate our hypothesis by rerunning the simulation with behavior changes to:–Validate/Measure the effect on the
parameter–Validate/Measure the effect of the
parameter on the overall station crowding problem
Index

Model Development Plan for A-MART
<<station model>>Dupont Circle
<<station model>>Farragut West
<<station model>>Metro Center
<<station model>>Rosslyn
<<rail model>>Metro Center’s Neighborhood
<<rail model>>The Blue Line
<<rail model>>The DC Metro
<<station model>>Piccadilly Circus
tube station
<<abstract>><<station model>>Calibration Station
<<abstract>><<component model>>
Platform Model
<<abstract>><<Rider model>>Agent Templates
<<abstract>><<station model>>Unit Testing Station
<<abstract>><<rail model>>
Unit Testing Line Network
The DC Metro Analysis
The London Underground Analysis
Foundation Models – Used in/for all above
A
B
D
C
E
F
G
1 234 5
i ii iii ivv
See following slides for information
Index

Coloring for Previous Slide
• Boxes represent models we will construct, analyze, and document– Yellow: Stations, where riders
are tokens, positions are places.
– Green: Track Models where stations are places, trains are tokens
– Blue: subset of station, internal, code-based, embedded models
– Fleshy: human model, subset of station, internal, code-based
• Red Star represents stations of focus for possible modifications in infrastructure/station design/policy as part of intra-model analysis.
• Line colors represent the analysis and model interaction that is performed– Red: Network theory
comparison between two similarly structured stations in different networks. Comparing adjacency matrix of station components.
– Blue: Sharing of input/output data between models. Can be direct summarization of outputs used then as input, or a generalized mathematical model based on recorded observations.
– Green: Quantitative comparison between stations based on collected data.
Index

Documentation for Previous SlideDeliverables for model validity and reuse
1. Calibration Station : An initial model of a station based on normalized data used to validate station model performance/algorithms among releases of the simulation, to check for consistency.
2. Platform Model : A component of the station model, not an individual simulation, which encapsulates the various types of behavior at the platform for study.
3. Agent Templates : “Cookie cutters” and the fields required to set them used to model individual behavior patterns of riders from walking speed, goals, and escalator behavior
4. Unit Testing Station : Small logical models using the station framework which explicitly test and validate behavior of each type of component available for use in the station network paradigm. An example being an endless escalator. Used for examples, documentation, and validation of model behavior.
5. Unit Testing Line Network : Small logical models using the rail framework which explicitly test and validate behavior of each type of component available for use in the rail network paradigm. An example being a loop track with just a single station. Used for examples, documentation, and validation of model behavior.
Index

Documentation for Previous SlideStation Selection Rationale
i. Metro Center : A complex station, worthy of study due to its level of interaction with the entire system, and fame.
ii. Farragut West : A smaller station with a shared middle platform
iii. Dupont Circle : A smaller station with split platforms, also one of the busiest
iv. Rosslyn : A unique in-line transfer station with a unique layout/topology
v. Piccadilly Circus : A station from the London Underground which is similar in operational purpose as Metro Center.
Index

Documentation for Previous SlideInter-Model Comparison
A. Inter-station Comparative Analysis of output dataB. Input/Output Sharing/Abstraction between station and
rail models.C. Inter-system station comparison: Analysis of
output/trends between two similar stations from two different systems.
D. Cross System Comparison: Network-theory mathematical comparison.
E. inter-station network analysis of metro center and immediately neighboring stations based on known train schedules coming into the neighborhood and lingering times from underlying station models.
F. Analysis of train/schedule/line behavior throughout the orange line on station crowding
G. Analysis of train behavior impacts on station crowding throughout entire metro system
Index

Enterprise Architect Model Ongoing Development
Index

Structural
SysML Block Definition Diagrams: Unify activities, people, data, hardware, software, flows (using FlowPorts).
Behavioral
SysML Activity Diagrams to show flows of inputs and outputs and controls
More types will be added ….
Begin defining architectural elements of common rapid transit system, their attributes and operations in SysML using EA. Use SysML diagrams to show relationships, interactions, views, etc.
Index

Index

Index

Index

Index

Rider Activity Diagram
Please see EA file
Index

Model Status
Metro Center Calibration Station~Work in Progress~
Index

Initial State - EmptyIndex

After 17 seconds or so, one train has arrived, and some are coming in from the street
Index

Yellow Riders desire to go westboundIndex

Blue… eastboundIndex

Green, south! The other colors are current disembarking to move to other trains (or exit) and the greens ones will STAY on that train, to
continue onward
Index

Just one Sample Output, based on 10 minutes of data after an hour of simulation
Comparison of times, based on timetables as entered
0
20
40
60
80
100
120
boar
ded
atra
in: n
orth
boar
ded
atra
in: s
outh
boar
ded
atra
in: w
est
thro
wn
off
end
ofbo
arde
d a
train
: eas
tbo
arde
d a
train
: sou
thbo
arde
d a
train
: wes
tth
row
n of
fen
d of
boar
ded
atra
in: e
ast
boar
ded
atra
in: n
orth
boar
ded
atra
in: w
est
thro
wn
off
end
ofbo
arde
d a
train
: eas
tbo
arde
d a
train
: nor
thbo
arde
d a
train
: sou
thth
row
n of
fen
d of
boar
ded
atra
in: e
ast
boar
ded
atra
in: n
orth
boar
ded
atra
in: s
outh
boar
ded
atra
in: w
est
(bla
nk)
arrived by train: east arrived by train: north arrived by train: south arrived by train: west from street entrancename=
(blank)
start and end points
time
in s
econ
ds s
pent
in s
yste
m (m
ean)
Total
Average of Time in System
Entry State Exit State
Index

Assignments 3 & 5 Revisit
Index

Finding our Niche:Taking advantages of our individual strengths
• Dave (SE, software developer)– How to model it, how to execute the
architecture, how to visualize it, how to produce the results to study
• Mahesh (SE, analytical)– Define diagrams formally, own the EA
repository• Kim (OR, procedures/policies)
– How to change, how to optimize, what to adjust
• Yimin (OR, optimization)– What to model, what to look at, how to use
the observations
Index

7/14/2009 203
Updates to:• Problem Statement:
• Which all were considered• How it evolved• What we chose
• Mission Statement• Sizing of our chosen problem
Index

Problem Areas Considered (1)
• Overcrowding of stations and trains (safety/customer satisfaction)• Different levels of Automatic Train Control• Lack common ability to plan for and react to major disaster• Stove-piped development – future improvements expansions must
be compatible (limits options)• Costly development since everything is system specific • C2 – control center aspect – what is monitored and how information
is flowed – allow operator from DC to pick up and go to NY with little training etc (interoperability)
• Determine the most efficient way to pass information (C2) to and from train operators to enhance safety and performance
• Passenger dissatisfaction with wait times, cost, crowding, crime directly impacts ridership and profitability of system
• Static Optimization of train schedules/configuration• Dynamic optimization – response to system anomalies (changes in
passenger flows, mechanical issues, resource availability, weather…)
Index

Problem Statement ExplorationPrevious considerations
– Red: Not Used, but insightful– Green: Incorporated– Brown: Indirectly considered, but trimmed out
• Rapid Transit Systems have been designed, deployed, and studied independently in the past without considering the commonalities, resulting in inefficiency and stove piping of solutions and evolutions of the systems.
• There is a broad concern of station crowding in rapid transit systems worldwide, in particular the DC Metro.
• Despite common language and common mathematical concepts, little has been studied on the iterative abstraction of network-types to generate generic solutions to common network-related problems. (rejected outright)
• Current rapid transit system lack a standardized approach to handle unanticipated events in the system
• Previous system modeling efforts in rapid transit systems have not considered the interaction among the adjacent range of scopes (zoom levels) in studying such a system, resulting in a lack of concordance between the models and potential inaccuracies in conclusions.
Index

Problem Statement Evolution
• Problem Statement– Worldwide, rapid transit control systems have been created,
modified, analyzed, and optimized on an ad hoc basis. Considering each system as an independent design leads to inefficiency and waste.
– Failing to consider the commonality of such systems prevents finding the best control solutions for the whole and also prevents future design evolution to improve the whole.
– Crowding in rapid transit systems worldwide is a major source of crime, dissatisfaction of ridership, stress on the system, and danger to the public. Overcrowding is indicative of inefficiencies related to:
• Station Size/Configuration• Train Schedules• Human Factors (bikes/strollers or hurrying to catch train)• Schedule/configuration flexibility (reversing escalators etc)
– Our reason for choosing the crowding problem is two-fold:
• This is a problem or concern across all transit systems• The availability of information on the parameters
Index

Problem Statement Evolution
• Mission Statement- Define individual zoom levels to describe layers of analysis.- Compare a minimum of three different systems to develop a
common language to identify network architecture (nodes, edges, flows etc) for each zoom level in addition to the relationships between the zoom levels
– Model the common network flow pattern at multiple connected layers of abstraction, concentrating on the minimization of crowds due to system parameters. Starting from the lowest level and building out.
– In addition to modeling/analyzing each level independently, the overall network will be modeled and analyzed to provide a holistic understanding of the interdependencies and links that an individual stations performance has across an entire system.
– By abstracting an architectural layer, it will make it possible to model any rapid transit system and determine common throughput and efficiency concerns across any levels while also providing a means to analyze potential solutions generally applicable to some or all of the system architecture instantiations.
Index

Sizing our Project
Type What Minimum Feasible Maximum Chosen
Scope Systems Investigated 5 200 28Scope System Studied in Detail 2 25 5Scope Study Scope Single crowding concern
under specific Comprehensive understanding of station/transit system dynamics
Platform crowding due to several causes
Modeling Zoom Levels Modeled Single Station Model (Single integer level)
12 zooming levels ranging from all the esoteric and abstract influencing network
above the collection of transit systems down to single component within a single
turnstyle
Concentrate on Station level, model and leverage neigborhood, line, and
system models.
Deliverables Structure Diagrams 3 50 15Deliverables Behavior Diagrams 3 50 15Deliverables Requirement Diagrams 1 15 5
Modeling Stations Modeled 1 78 3Modeling Time Granularity 0.001 seconds 1/2 hour 0.1 secondsModeling Lines Modeled 1 12 3Modeling Transit Systems Modeled 1 5 2
Deliverables Optimization Techniques Defined 0 20 3
Deliverables Process DescriptionOne-off Project report just focusing on our concepts
and deliverables
Full detail of process, expansion opportunities, and theoretical abstraction
of process to support other types of networks
Primary focus on expansion to additional study of rapid transit
systems in bredth (more detail to existing zoom levels) and depth
(more zoom levels in both directions), with light discussion of
potential for expansion to other types of networks
Deliverables Model/Simulation ReuseRaw Tool with little user interface and domain-
specific required knowledge
Fully extensible product, tested, packaged, and deployable for future use,
complete with documentation
Prototype stable tool with codebase available for extension and example.
Usable during final product presentation, basic walkthrough
provided
Index

7/14/2009 209
Updates to Functional Decomposition
Index

• Control a Rapid Transit System– Monitor system Status
• Long term metrics collection• Real-time Monitoring and Status
– Produce Optimized Schedules• Statically Optimize Schedules
– Known passenger traffic patterns– Known service expectations– Known reliability values for redundancy
• Dynamically Adjust Schedules– Handle Unanticipated passenger loads– Handle Unanticipated other events– Opportunistically Optimize Transit Resources
– Control Trains• Communicate Accurately• Control Effectively
Functional Decomposition External ScopeCommon for all Rapid Transit Systems
Index

Functional DecompositionDrilldown
• Dynamically Optimize Schedules– Handle Unanticipated network loads
• Handle influx at station– External Entrance influx– Train-arrival influx
• Handle train network crowding
– Handle Unanticipated other events• Handle fire/terrorist/station closure event• Handle train/track breakdown
– Opportunistically Optimize Resources• Reduce energy consumption• Reduce train utilization
Index

7/14/2009 212
Updates to Stakeholder Needs, Wants, Value Mapping, Requirements, HOQ and EA
Index

7/14/2009 213
Stakeholders
• Top-Down– Policy Makers
• Politicians– Administrators
• Transit Management• Transit Monitoring
Office• Schedulers and
Planners– Industry
• Train Manufacturers• Metro Construction
Contractors– GMU Faculty– A-MART Team
Members
• Bottom-Up– The Riders
• Commuters• Tourists• Special Event
Attendees– Operating Staff
• Ticket Counters• Station Managers• Train Drivers• Transit Security• Maintenance Staff
Index

7/14/2009 214
Stakeholders: Needs v.s. Wants
Stakeholder GMU Faculty Policy MakersType of
StakeholderProject
Evaluators Politicians Transit Management
Transit Monitoring Office
Schedulers and Planners
Project that meets the
SEOR department
expectations
Safe, efficient system
Safe, efficient system
More situational awareness
More situational awareness
Attract ridersBetter decision making tools
Reduced operating cost
Increased capacity
Maximize profitIncreased flexibility
Secondary Needs (Wants) Attract riders Reduced workload
Needs
Transit Administrators
Index

7/14/2009 215
Stakeholders: Needs v.s. Wants
StakeholderType of
StakeholderStation
Managers Train Drivers Maintenance Staff Ticket Counters Transit
Security/SafetyEfficient
OperationsSafe, efficient
systemEfficient operations More situational
awarenessMore situational
awareness
Safe OperationsReduced station
crowdingReduced
maintenance needsReduced station
crowding Safe operations
Reduced station crowding
Reduced train crowding
Reduced station crowding
Secondary Needs (Wants)
Reduced workload
Reduced workload Reduced workload
Less passenger confusion
Operations Staff
Needs
Index

7/14/2009 216
Stakeholders: Needs v.s. Wants
Stakeholder
Type of Stakeholder
Train Manufacturers
Metro Construction
StaffCommuters Tourists Special Event
Attendees
Incorporation of Train
Performance Capabilities and
limitations
Guidance on Station Layout Reduced wait time Safety Safety
Increased comfort Reduced cost Reduced delays
Safety Better information Better information
Reduced delays Reduced cost
Secondary Needs (Wants) Better information Increased comfort
Increased comfort
Needs
Industry The Riders
Index

7/14/2009 217
Stakeholder Value Mapping
Incr
ease
d ca
paci
ty
Incr
ease
d S
afet
y an
d S
ecur
ity
Red
uced
Sta
tion
Cro
wdi
ng
Red
uced
Tra
in C
row
ding
Bet
ter D
ecis
ion
Mak
ing
Tool
s
Red
uced
Mai
nten
ance
Cos
ts
Bet
ter S
tatio
n La
yout
Gui
delin
es
Mor
e R
ider
Info
rmat
ion
Incr
ease
d Fl
exib
ility
Red
uced
wor
kloa
d
Incr
ease
d P
ass.
Com
fort
Attr
act R
ider
ship
Sta
keho
lder
Impo
rtanc
e
Politicians 3 5 3 5 0 2 0 1 0 0 3 4 70%
Transit Management 5 5 5 5 5 5 5 3 5 5 5 5 100%
Transit Monitoring 2 5 5 5 5 3 5 2 2 5 2 2 80%
Schedulers and Planners 2 5 5 5 5 3 2 2 3 5 2 2 60%
Commuters 2 5 5 5 3 1 5 4 4 0 5 0 80%
Tourists 2 5 4 4 0 0 5 5 1 0 5 0 50%
Special Event Attendees 5 5 5 5 4 0 5 5 3 0 5 0 50%
Station Managers 4 5 5 5 5 3 5 5 5 5 4 3 80%
Ticket Counters 2 4 5 2 5 2 2 3 3 5 1 2 50%
Train Drivers 3 5 5 5 5 3 2 2 2 5 4 3 50%
Transit Security/Safety 2 5 5 5 4 0 4 5 5 2 3 3 95%
Maintenance Staff 1 5 5 5 4 5 2 1 2 5 1 1 20%
Train Manufacturers 2 5 2 4 0 5 0 0 0 0 5 4 40%
Construction Companies 2 5 5 3 0 3 5 0 0 0 4 4 40%
SEOR Faculty 3 3 3 3 3 3 3 3 3 3 3 3 100%
Composite Weighted Score: 27 46 43 43 33 24 34 29 28 27 34 25
Rid
ers
Sta
ffM
gmt
Indu
stry
Index

7/14/2009 218
Stakeholder Value MappingIndex

7/14/2009 219
House of Quality
• A source was found where templates of multiple types/layouts of House of Quality (HOQ) were available.• http://www.qfdonline.com/templates/
• The “Extended House of Quality” was chosen as it can accommodate larges sets of requirements.
• The stakeholders needs/wants (found through researching existing systems)were used to generate customer requirements, which then led to functional requirements.
• The TDBs will be filled in as further research is done.
• The HOQ is attached with this briefing (file name AMART_HOQ_V3.xls)
Index

7/14/2009 220
Enterprise Architect
• The Enterprise Architecture in Sparx EA has been updated and will continually be updated.
• Updates include:– Revised scope package and associated
diagrams (still under work)– Revised PDP to import PowerPoint
diagram and to incorporate changes discussed at the last presentation.
– Revised customer requirements, functional requirements and associated diagrams. NOTE: The customer requirements numbers map to the requirement numbers in the HOQ.
– Revised actors and associated diagrams
– Revised Stakeholder-requirements mapping and associated diagram.
– Embedded document with information from House of Quality and Stakeholder value mappings.
• The EA file is attached with this presentation (file name AMART_3_13.eap)
Index

7/14/2009 221
Further Definition of the Concept of Zooming
Index

222222
Zoom Level definition
1.The definition of different zoom levels is defined as a continuous number.
2.Levels with integer numbers are considered as typical scope such as single turnstile, single station, single line and rapid transit system. Levels between two integer numbers could be the extension of the former typical scope.
Index

Zoom Level definition
Zoom Level0 1 2 3 4 5 6
2. 7
Nei ghborhood
St at i ons
Si ngl e St at i on
Si ngl e pl at f or
m
Si ngl e Li ne
Rapi d Tr ansi t Syst em
Si ngl e Compone
nt
Si ngl e Tur n-st i l e
2. 3
Met r o Cent er
Index

Input
• Single turnstile:– Custom arrival rate, turnstile service rate, number of
servers, type of service.• Single Station:
– Custom arrival rate, turnstile service rate, speed of escalator, inter-arrival time for trains, dwell time, capacity of train.
• Single Line:– distribution of queue length for each station derived
from single station model, number of passengers getting of each station, inter-arrival time for trains, dwell time, capacity of train at each station.
• One rapid transit system:– Capacity of trains, total demand, probability of
passengers changing lines.
Index

Output
• Single turnstile:– Queue length at turnstile over time, waiting time for
passengers• Single Station:
– Queue length at platform over time, density of platform, system time and waiting time for passengers, crowd formation due to delays/station closer, time of crowd formation during rush hour, time needed getting alert due to special event
• Single Line:– delays due to ratio of demand and capacity, delays due
to fluctuation of schedule, delays due to rush hour, density of trains over time, distribution of running time for trains.
• rapid transit system:– Delays due to intersection of railway
Index