arctic and antarctic diurnal and seasonal variations of...
TRANSCRIPT
Arctic and Antarctic diurnal and seasonal variations of snowalbedo from multiyear Baseline Surface RadiationNetwork measurements
Xianwei Wang1,2 and Charles S. Zender2
Received 26 August 2010; revised 18 April 2011; accepted 6 May 2011; published 6 August 2011.
[1] This study analyzes diurnal and seasonal variations of snow albedo at four BaselineSurface Radiation Network stations in the Arctic and Antarctica from 2003 to 2008 toelucidate similarities and differences in snow albedo diurnal cycles across geographiczones and to assess how diurnal changes in snow albedo affect the surface energy budget.At the seasonal scale, the daily albedo for the perennial snow at stations South Pole andGeorg von Neumayer in Antarctica has a similar symmetric variation with solar zenith angle(SZA) around the austral summer; whereas the daily albedo for the seasonal snow at stationsBarrow, Alaska, and Ny‐Ålesund, Spitsbergen, in the Arctic tends to decrease with SZAdecrease from winter to spring before snow starts melting. At the hourly scale, each stationshows unique diurnal cycles due to different processes that affect snow albedo such ascloud cover, snow metamorphism, surface hoar formation, SZA, solar azimuth angle,and surface features. Cloud escalates the snow albedo at all four stations by shiftingsolar radiation to visible wavelengths and diminishes the diurnal variation by diffusingincident solar radiation. The 24 h mean snow albedo is higher on cloudy than clear days by0.02 at the South Pole (December) and Barrow (May), 0.05 at Neumayer (December), and0.07 at Ny‐Ålesund (April). Snow surface structures, for example, wind‐channeledsastrugi, appear to be a controlling factor in the diurnal variation of clear‐sky snow albedoat the South Pole and Ny‐Ålesund. The surface hoar formation cycles and snowmetamorphism are consistent with the asymmetric diurnal variation of snow albedo atNeumayer and Barrow. Near the melting point temperature, melt‐freeze cycles exceedcloud and surface structure impacts and dominate the diurnal variation of snow albedo atstations Barrow and Ny‐Ålesund. The satellite‐measured clear‐sky snow albedo usuallyunderestimates the average all‐sky snow albedo at these stations. These results illustrate thepotential biases in daily and monthly albedo products constructed from sun‐synchronoussatellite daily instantaneous observations which inevitably undersample the diurnalvariation of snow albedo.
Citation: Wang, X., and C. S. Zender (2011), Arctic and Antarctic diurnal and seasonal variations of snow albedo frommultiyear Baseline Surface Radiation Network measurements, J. Geophys. Res., 116, F03008, doi:10.1029/2010JF001864.
1. Introduction
[2] The shortwave (SW) broadband snow albedo (referredto as snow albedo hereafter) is of great interest to climatestudies in that it describes the net solar radiation flux at thesnow surface and small errors or changes in its value rep-resent large fractional changes in absorbed solar radiation(ASR) and in the overall heat budget at the snow surface[Carroll and Fitch, 1981; Pirazzini, 2004]. Although snow
albedo dominates the surface energy budget of the Arcticand Antarctica [Hall, 2004], the remote location, harshconditions, extensive cloud cover, and large solar zenithangles in these regions combine to hinder the developmentof climatological data records of snow albedo. As a result,little is known about the climatological diurnal cycle ofpolar snow albedo, and its geographic and seasonal varia-tions. Recently, the Baseline Surface Radiation Network(BSRN) has accumulated long time series of high quality,high frequency radiometric data to allow climatologicalcharacterization of the diurnal cycle of in situ snow albedo.This study analyzes diurnal and seasonal variations of snowalbedo at four BSRN stations in the Arctic and Antarcticafrom 2003 to 2008 to elucidate similarities and differencesin snow albedo cycles in polar regions, to identify physicalprocesses theoretically consistent with these differences, and
1School of Geography and Planning and Guangdong Key Laboratoryfor Urbanization and Geo‐Simulation, Sun Yat‐sen University, Guangzhou,China.
2Department of Earth System Science, University of California, Irvine,California, USA.
Copyright 2011 by the American Geophysical Union.0148‐0227/11/2010JF001864
JOURNAL OF GEOPHYSICAL RESEARCH, VOL. 116, F03008, doi:10.1029/2010JF001864, 2011
F03008 1 of 16

to assess how changes in snow albedo affect the surfaceenergy budget.[3] Snow has high reflectance in visible (VIS) and low
reflectance in infrared (IR) wavelengths. Snow bidirectionalreflectance varies strongly with solar zenith angle (SZA) andviewing geometry [Wiscombe and Warren, 1980; Salomonet al., 2006]. However, climate models typically representonly the zenith, not the azimuthal dependence of snowalbedo [Roesch, 2006]. Snow directional‐hemisphericalreflectance has a larger magnitude of increase with SZA inIR (1.03 mm) than in VIS (0.55 mm) wavelengths[Schaepman‐Strub et al., 2006]. Snow albedo integrates theangular and spectral variations of snow reflectance over theentire solar spectrum (SW) wavelengths, and has strongdiurnal and seasonal cycles depending on both atmosphericand surface conditions [Pirazzini, 2004].[4] Dry snow albedo depends on internal snow char-
acteristics such as snow grain size and shape, snowpackdepth, surface roughness, light‐absorbing impurities, and onexternal factors, including the SZA and solar azimuth angle(SAA), the spectral distribution of solar radiation, atmo-spheric conditions (clouds, water vapor and aerosol, etc.),and shadowing [Warren, 1982; Pirazzini, 2004]. Observa-tions confirm the predictions of models that, all else beingequal, snow albedo increases with decreasing snow grainsize and with increasing SZA [Warren and Wiscombe, 1980;Jin et al., 2003]. For example, increasing SZA from 0° to60° increases clear sky snow albedo of a model snowpackfrom 0.75 to 0.78 [Wang and Zender, 2010a]. Falling snowoften consists of fine and/or multifaceted snow grains andhas higher albedo immediately after snowfall [Grenfell andPerovich, 2008]. Doubling the effective radius of ice crys-tals from 100 to 200 mm, as can occur during a few days ofisothermal aging in warm conditions, may reduce albedofrom 0.85 to 0.80 [Taillandier et al., 2007].[5] Cloud cover affects both the spectral distribution of
solar irradiance and the effective SZA, resulting in anincrease of snow albedo of 0.05–0.1 from its value in clearsky in Antarctica [Wiscombe and Warren, 1980; Pirazzini,2004]. Small amounts of strongly absorbing impurities,especially soot, although dust and volcanic ash can also beeffective in larger quantities, lower snow albedo mainly inthe VIS spectral regions (l < 0.9 mm) where absorption bypure snow is weakest. Light‐absorbing impurities withinsnow cause the greatest reductions in albedo for coarse‐grained snow [Warren and Wiscombe, 1980; Warren,1982]. When the sun azimuth is perpendicular to the longaxis of the wind channeled surface features known as sas-trugi at the South Pole, snow albedo is reduced as much as4% from its value when the sun beam is parallel to thesastrugi [Carroll and Fitch, 1981].[6] Snow albedo dynamically changes because of its
changing internal properties and external environments.Under overcast skies, surface insolation is diffuse and nearlyisotropic, so the effects of SZA and SAA on albedo arenegligible, and when snow metamorphism is slow the snowalbedo remains rather constant throughout the day [e.g.,Pirazzini, 2004]. During clear days, snow albedo undergoeslarge variations due to shadowing, surface hoar, snow meta-morphism and changes in SZA and SAA. The diurnal vari-ation (maximum minus minimum) of snow albedo wasmeasured as about 0.04 at the South Pole [Carroll and Fitch,
1981], and reaches up to 0.15 on the Antarctic coast[Pirazzini, 2004; Wuttke et al., 2006] and over sea ice in theBaltic Sea [Pirazzini et al., 2006]. For a snowpack with meanalbedo of 0.8, a diurnal albedo change of 0.10 represents adiurnal ASR change of 50%. This ASR change is significantfor climate or surface processmodels, especially in seasonallysnow covered regions where changes in ASR can acceleratethe onset of snowmelt and its attendant strong snow albedofeedbacks [Flanner et al., 2007]. For comparison, the diurnalvariation of surface albedo in a natural grassland (meanalbedo of about 0.2) is 0.05 [Song, 1998], and could be up to0.1 (or a ASR change of 12%) at a given SZA due to theformation of dew and inclined canopies by prevailing winddirection [Minnis et al., 1997].[7] Despite the numerous mechanisms besides SZA which
can contribute to the diurnal cycle of snow albedo, methodsfor remote sensing of surface properties, estimation of clear‐sky surface albedo [Brooks et al., 1986], and parameterizationof surface albedo in atmospheric process and climate models[Briegleb and Ramanathan, 1982; Oleson et al., 2003] gen-erally assume that the diurnal cycle of snow albedo dependsonly on SZA. In most radiation transfer models, the diurnalvariation of surface albedo is assumed to be symmetric aboutsolar noon and forced by the diurnal variation of SZA [Song,1998]. Both regular and irregular changes in the surfacestate and atmosphere can negate this assumption [Minniset al., 1997; Pirazzini, 2004; Pirazzini et al., 2006]. Conse-quently, sun‐synchronous satellites should consider thediurnal variation of surface albedo or else risk biasing themonthly or daily mean values composed from measurementstaken instantaneously once daily [Minnis et al., 1997].[8] Several studies analyze the diurnal variation of snow
albedo, yet these studies are most short‐term or experi-mental campaign measurements that focus on a single sta-tion/region [Carroll and Fitch, 1981; Warren et al., 1998;Winther et al., 2002; Pirazzini, 2004; Pirazzini et al.,2006; Wuttke et al., 2006; Meinander et al., 2008]. To ourknowledge, no studies have yet been conducted to examineand snow albedo’s diurnal and seasonal variation in bothpolar regions at the same time. Satellites provide near globalcoverage of snow albedo, though with temporal resolutiontoo coarse and accuracy too low to capture diurnal varia-tions. Fortunately, the relatively long‐term World ClimateResearch Programme (WCRP) Baseline Surface RadiationNetwork (BSRN) in the World Radiation Monitoring Center(WRMC) provides quality‐controlled and consistent down-welling and upwelling solar irradiance measurementsthroughout the world, and thus offers us a chance to analyzethe snow albedo’s diurnal and seasonal variations in bothpolar regions with multiyear data sets. This study will, for thefirst time, systematically quantify and intercompare themultiyear mean amplitude of snow albedo’s diurnal andseasonal variations at the four Arctic and Antarctic stationswhere high quality measurements are available to elucidatesimilarities and differences in snow albedo cycles acrossgeographic zones, and to assess how diurnal changes in snowalbedo affect the surface energy budget.
2. Study Sites and Data
[9] Four BSRN stations (Table 1) reside in the Arctic orAntarctica. Two stations (Barrow (BAR) and Ny‐Ålesund
WANG AND ZENDER: SNOW ALBEDO DIURNAL CYCLES F03008F03008
2 of 16

(NYA)) are in coastal areas of Barrow, Alaska and Ny‐Ålesund Island, Spitsbergen, and are seasonally snow cov-ered over 8 months from late September to early June. Theother two stations are located on the coast (Georg vonNeumayer (GVN)) and at the South Pole (SPO) of Antarc-tica. Both are on the ice sheet and experience perennialsnow. The South Pole is 2800 m above sea level while theother three coastal stations have elevation less than 50 m.Ny‐Ålesund is located in a tundra mountain valley, whilethe other three stations are situated in flat and near uniformareas. These stations lie in areas with high surface reflec-tance, little grass (Barrow) or no vegetation, and high SZA,and snow at the coastal stations, being also much warmerthan the South Pole, are vulnerable to the warming atmo-
sphere and adjacent oceans. Hence the long‐term in situBSRN measurements at these stations will help to increaseour understanding of snow surface properties and theirchanges, and hence aid the improvement of surface albedoparameterizations and satellite albedo retrieval algorithms[McArthur, 2005].[10] The major measurements used in this study are air
temperature, shortwave (SW) broadband total downwelling(SWD) and upwelling (SWU) radiation fluxes, and thedirect (DIR) and diffuse (DIF) components of the solarinsolation. The air temperature at 2 m height is measuredcontinuously by a thermometer with uncertainty of ±0.3°C.The SW broadband solar radiation (SWD, SWU and DIF)are measured by two types of pyranometers horizontally
Table 1. Four Baseline Surface Radiation Network Stations in the Arctic and Antarctica
Station ID Area Name Sponsor Surface/Topography Type Elevation (m) Latitude Longitude
22 (BAR) Barrow, Alaska, USA United States tundra; flat, rural. 8 71.323 −156.60711 (NYA) Ny‐Ålesund, Spitsbergen Germany/Norway tundra; mountain valley 11 78.925 11.95013 (GVN) Georg von Neumayer, Antarctica Germany iceshelf; flat, rural 42 −70.650 −8.25026 (SPO) South Pole, Antarctica United States glacier, accumulation area; flat, rural 2800 −89.983 −24.799
Figure 1. (a) The monthly mean diurnal cycle of snow albedo and air temperature and (b) the shortwavebroadband total downwelling (SWD) and upwelling (SWU) solar irradiance for clear sky (26 days) andcloudy sky (5 days) at the South Pole (SPO) in December 2003. (c) The multiyear mean diurnal cycle inDecember from 2003, 2006, and 2007. (d) The seasonal (daily mean from 2003, 2006, and 2007) vari-ation of snow albedo at SPO. The SWD and SWU data in 2004, 2005, and 2008 are not used here becauseof instrumental problems.
WANG AND ZENDER: SNOW ALBEDO DIURNAL CYCLES F03008F03008
3 of 16
positioned at a 2 m high platform within ±0.1°. Barrow andSouth Pole use Eppley Precision Spectral Pyranometers(PSP). Neumayer and Ny‐Ålesund use Kipp and ZonenCM11 and CM21 pyranometers. DIR at the four stations ismeasured by Eppley Normal Incidence Pyrheliometers(NIP). The four solar radiation variables are measured sep-arately. DIR and DIF are relative quantities, and the sum ofDIR and DIF does not equal to SWD.[11] Both Kipp and Zonen CM1/21 and Eppley PSP
applied at the BSRN stations are high performance researchgrade pyranometers. Their spectral response ranges are 0.3–2.8 mm for CM1/21 and 0.285–2.8 mm for PSP, which coverapproximately 98% of the entire solar radiation at the earthsurface. Deposition of snow or frost on the dome of pyr-anometer is a possible error source for the BSRN mea-surement in both polar regions. The pyranometers (e.g., atNeumayer and Ny‐Ålesund) are ventilated with slightlypreheated air to minimize hoar frost problems and zero off-sets during cloudless and windless conditions. The instru-ments are maintained continuously several times per daythroughout the year when it is possible. After 1 year ofoperation, they are recalibrated at the German WeatherBureau according the World Radiometric Reference (WRR)[Wuttke, 2005]. According to the BSRN manual, the pyr-anometers at the South Pole and Barrow also have similarsetup to remove hoar frost on the pyranometer dome[McArthur, 2005]. The overall measurement uncertaintiesare less than 2% or ±5 W/m2 (whichever is greater) forSWD, 3% for SWU, 0.5% or ±1.5 W/m2 for DIR, and 2% or±5 W/m2 for DIF when SZA is less than 75°; measurements
with SZA larger than 80° are not used due to potential largeerrors related to the pyranometer’s cosine‐response qualityand impacts of surface topography [McArthur, 2005; Kippand Zonen, 2006]. Thus, this study restricts its focus tomeasurements with SZA less than 75°.[12] The solar irradiances are sampled once per second
and stored as 1 min averages. These 1 min mean irradianceand temperature data from 2003 to 2008 are retrieved fromthe WRMC‐BSRN website at http://www.bsrn.awi.de/en/data/data_retrieval_via_pangaea/.[13] What does the BSRN measure and what do the
measurements represent? The 2 m height platform of BSRNpyranometers lacks the necessary footprint of a more stableand robust measurement height such as ∼20 m. As Warrenet al. [1998, p. 25,792] point out, “[f]or near‐surface mea-surements to be applicable to interpretation of satellitemeasurements, it is therefore important to view a ‘footprint’of surface area sufficiently large to contain a representativedistribution of sastrugi slopes.” This means the radiationflux measurements should be made from an elevated plat-form, e.g., a 22 m walk‐up tower at the South Pole Station[Warren et al., 1998].[14] However, the 2 m height of BSRN radiation flux
measurements is commonly employed in the snow albedomeasurement community, such as in BSRN, Greenland Cli-mate network (GC‐Net) and other short‐term measurements[Seckmeyer et al., 2001; Pirazzini, 2004;Wuttke et al., 2006;Wang and Zender, 2010b]. The viewing angle of the down-facing pyranometer is 180°, and most of the upwellingshortwave/solar radiation (SWU) received by the instrument
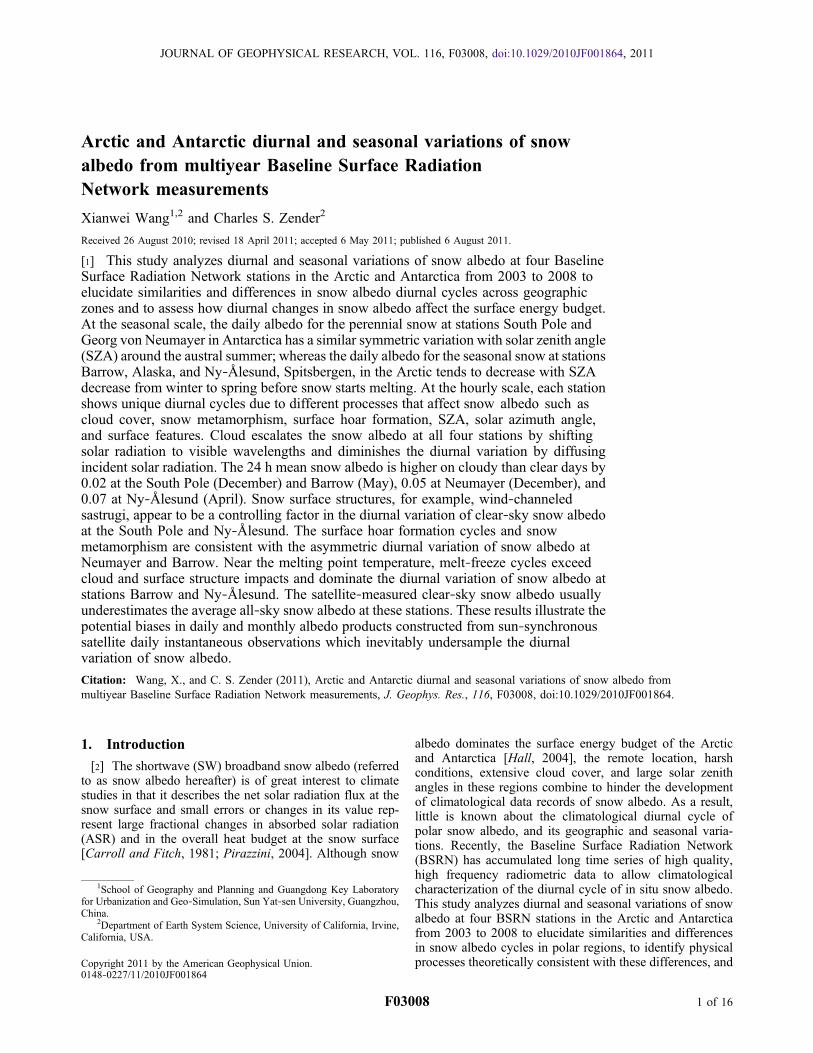
Figure 2. Diurnal cycles in the first 10 days of December 2003 at the South Pole (SPO). “Clear” is thesky clearness or cloud index (0 is overcast sky) derived from equation (1). The vertical labels for thehorizontal (X) axis represent days (the first one or two numbers from day 1 to day 10) and hours (the lastone or two numbers from 0, 3, …, 18, 21). The solar zenith angle in December at SPO is nearly constantat 67° with azimuth angles of 0°–360°. The maximum air temperature during these ten days was below−20°C.
WANG AND ZENDER: SNOW ALBEDO DIURNAL CYCLES F03008F03008
4 of 16
comes from the area immediately below it. If the SWU isisotropically distributed, a total of 50%, 90%, and 99% of theflux intercepted by the downfacing pyranometer comes fromcircular areas centered on the vertical projection of the sensorand radius respectively long 1, 3, and 10 times the height ofthe instrument above the surface [Schwerdtfeger, 1976].“For many practical purposes (cleaning and checking of theinstruments, stability of the instrument mast under strongwind conditions) the height of the downward facing pyr-anometer is usually 1–1.5 m above the surface” [Pirazzini,2004, p. 5]. According to Seckmeyer et al. [2001], albedoshould be measured with two radiometers with cosine‐weighted field of view at about 2 to 4 m height above theground. Wuttke et al. [2006] also use a pair of 2 m highpyranometers for their measurements of spectral snowalbedo at Neumayer, Antarctica. About 90% of the BSRN
(2 m high pyranometer) measured flux comes from a cir-cular area of a radius 6 m centered on the vertical projectionof the sensor. This area may enclose one or several snowdunes and sastrugi, not enough to sample a representativedistribution of surface features instantaneously [Warrenet al., 1998]. However, this study focuses on climatologi-cal averages: “[w]hen the radiation instruments are near thesurface in a sastrugi field, the sampling bias could be avoidedby collecting a large number of samples at various places, ora long record of measurements if the sastrugi change overtime [Carroll and Fitch, 1981]” [Pirazzini, 2004, p. 4].Multiyear measurements such as in this study can capture thechanging surface features of the radiometer footprint. Thispartially compensates for the limited pyranometer samplingarea and explains why there is so much variation of theinstantaneous measurements about the climatological mean.
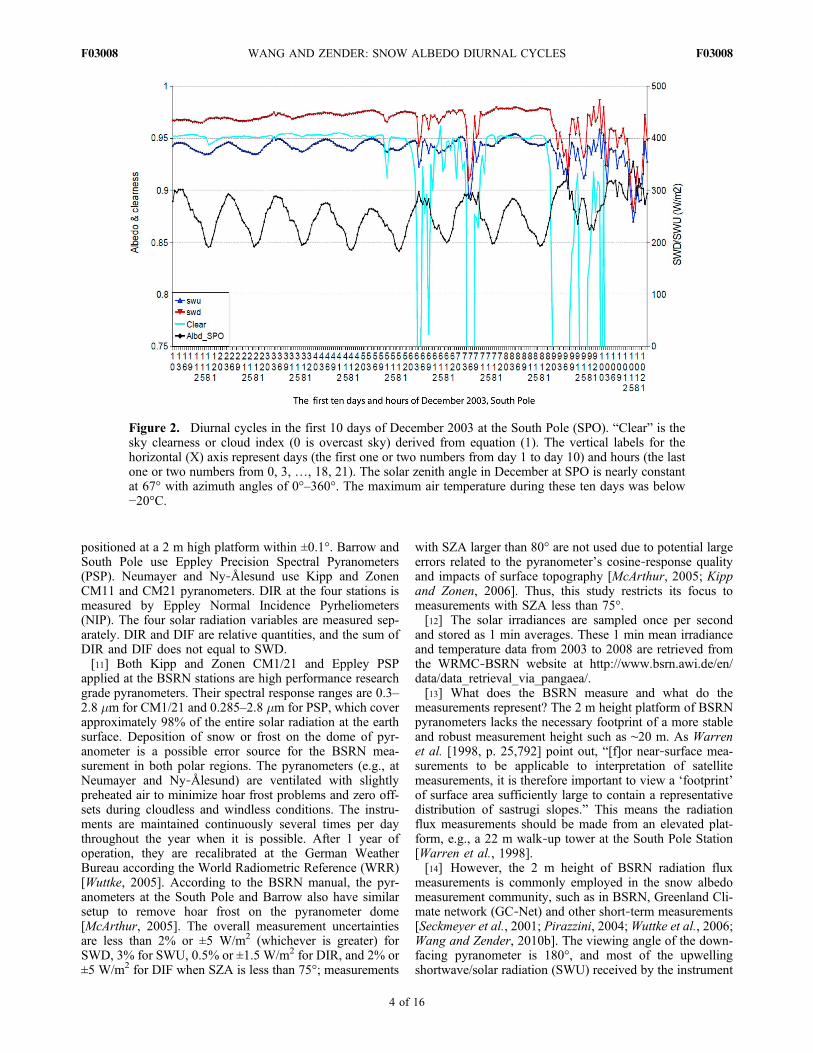
Table 2. Mean Number of Days at Each Hour for Clear and Cloudy Skies and the Daily Average in Each Month at Four BSRN Stationsa
Ny‐Ålesund, April Barrow, May Neumayer, December South Pole, December
Clear Cloud Clear Cloud Clear Cloud Clear Cloud
0 8 23 5 26 12 19 25 61 11 21 6 25 12 19 24 72 11 20 8 24 11 20 26 53 13 18 7 24 12 19 27 44 14 17 7 24 12 19 27 45 13 18 7 24 12 19 26 56 15 16 8 23 13 18 27 47 15 17 8 23 12 19 26 58 15 16 10 22 14 18 27 49 17 14 9 22 13 18 27 410 16 15 10 21 13 18 27 411 16 15 9 22 13 18 27 412 16 15 10 21 14 17 28 313 15 16 12 20 13 18 27 414 16 16 10 21 12 19 26 515 16 15 9 22 12 19 27 416 14 18 8 23 13 19 26 517 13 18 8 23 13 18 26 518 12 20 9 22 13 18 26 519 11 20 8 23 13 18 27 420 11 20 9 22 13 18 28 321 10 21 9 22 12 19 27 422 9 22 8 23 12 19 26 523 9 23 6 25 11 20 26 5Mean days 13 18 8 23 12 19 26 5Daily SWD 159 86 300 231 417 308 446 370SWD reductionb 73 W/m2 46% 69 W/m2 23% 109 W/m2 26% 76 W/m2 17%Daily Albedo1 0.75 0.82 0.78 0.80 0.8 0.85 0.86 0.88Daily Albedo2 0.78 (for all sky) 0.78 (for all sky) 0.80 0.80 0.83 0.83 0.87 0.87Daily ASR1 39 16 65 45 83 45 61 43Daily ASR2 26 26 51 51 60 60 59 59
aMean is for the years 2003–2008; daily average measured over 24 h period. The daily albedo1 and ASR1 are for clear and cloudy sky days separately,and the daily albedo2 and ASR2 are for both clear and cloudy sky days.
bSWD reduction is (Clr − Cld)/Clr.
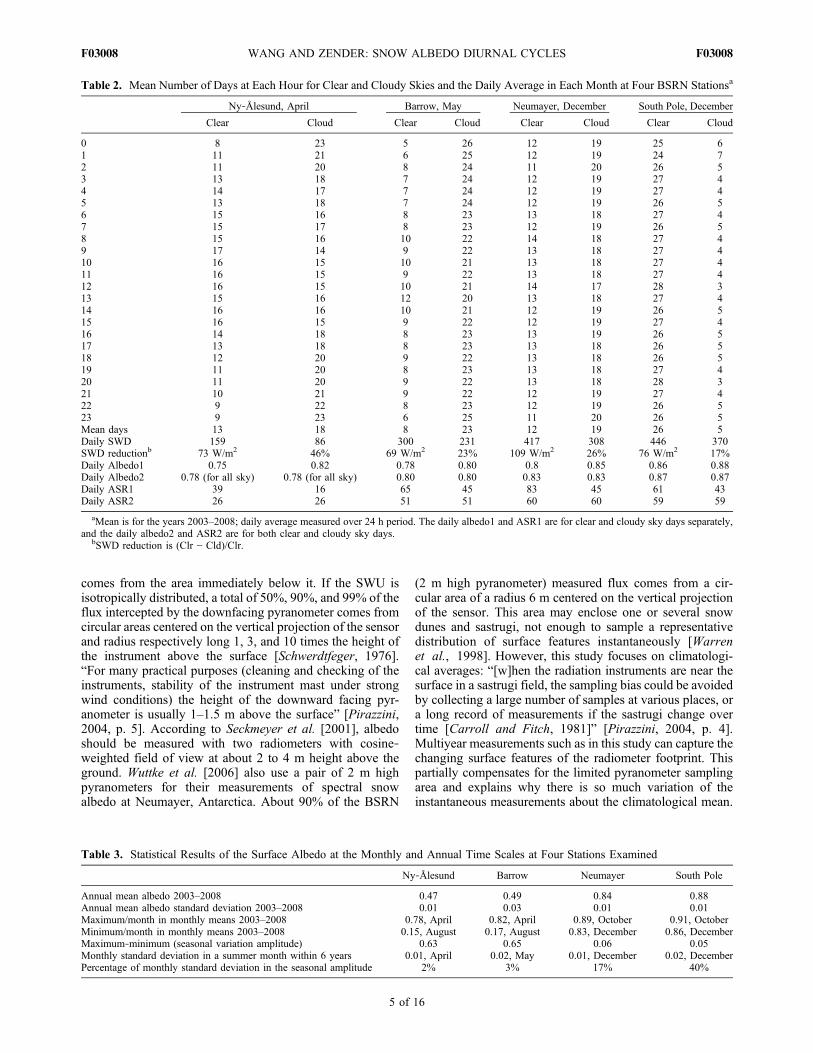
Table 3. Statistical Results of the Surface Albedo at the Monthly and Annual Time Scales at Four Stations Examined
Ny‐Ålesund Barrow Neumayer South Pole
Annual mean albedo 2003–2008 0.47 0.49 0.84 0.88Annual mean albedo standard deviation 2003–2008 0.01 0.03 0.01 0.01Maximum/month in monthly means 2003–2008 0.78, April 0.82, April 0.89, October 0.91, OctoberMinimum/month in monthly means 2003–2008 0.15, August 0.17, August 0.83, December 0.86, DecemberMaximum‐minimum (seasonal variation amplitude) 0.63 0.65 0.06 0.05Monthly standard deviation in a summer month within 6 years 0.01, April 0.02, May 0.01, December 0.02, DecemberPercentage of monthly standard deviation in the seasonal amplitude 2% 3% 17% 40%
WANG AND ZENDER: SNOW ALBEDO DIURNAL CYCLES F03008F03008
5 of 16
In this study, we did not make any direct comparison withinstantaneous or long‐term satellite measurements.We do notknow how broadly representative the 2 m height pyranometermeasurements are. That would be the subject of a worthwhilestudy in its own right. Two qualities of the BSRN measure-ments deserve restatement: First, what is measured by cli-matological means of 2 m high radiometers may not be thealbedo as measured at 20 m (or 200, or 2000 m), though, it is,because of the 6 year averaging, a well‐defined climatolog-ical index of reflectance. It may contain offsets from the“true” (high tower) albedo, yet this study is concerned withthe shape of the diurnal albedo curve, not with its absolutevalue. Second, BSRN data are the only quality controlledhigh precision radiometric in situ data available.
3. Data Processing
[15] One minute average irradiance data are first passedthrough Dixon’s Q‐Test to screen out random outliers in amoving window of five consecutive records at a 95% con-fidence level [Miller and Miller, 1993], and then processedinto hourly means by a simple arithmetic average for valueslarger than 5 W/m2, the SWD measurement uncertainty.
These hourly data are further used to analyze the meandiurnal cycle within a month, which is the mean valueduring each hour from 0:00 to 23:00 within the 30/31 daysof a month. Finally, the surface albedo is calculated usingthe mean SWU divided by the mean SWD at each hour. Theclearness (or cloud) index in equation (1) is a simplifiednormalized diffuse ratio variability test of clear sky [Longand Ackerman, 2000].
clr ¼ DIR
DIRþ DIFð1Þ
where clr is the clearness index of the sky and range from0 (overcast) to 1 (clear). Clr is normally less than 0.95 becauseof atmospheric aerosols. Hours with clr < 0.3 are defined ascloudy sky. The mean clr value on cloudy days is less than0.05, which implies that clouds, when present, are opticallythick.[16] All analysis are carried out at four time scales: (1) ten
continuous diurnal cycles (hourly interval) including cloudyand clear sky days; (2) monthly mean diurnal cycles inDecember for the South Pole and Neumayer, in May for
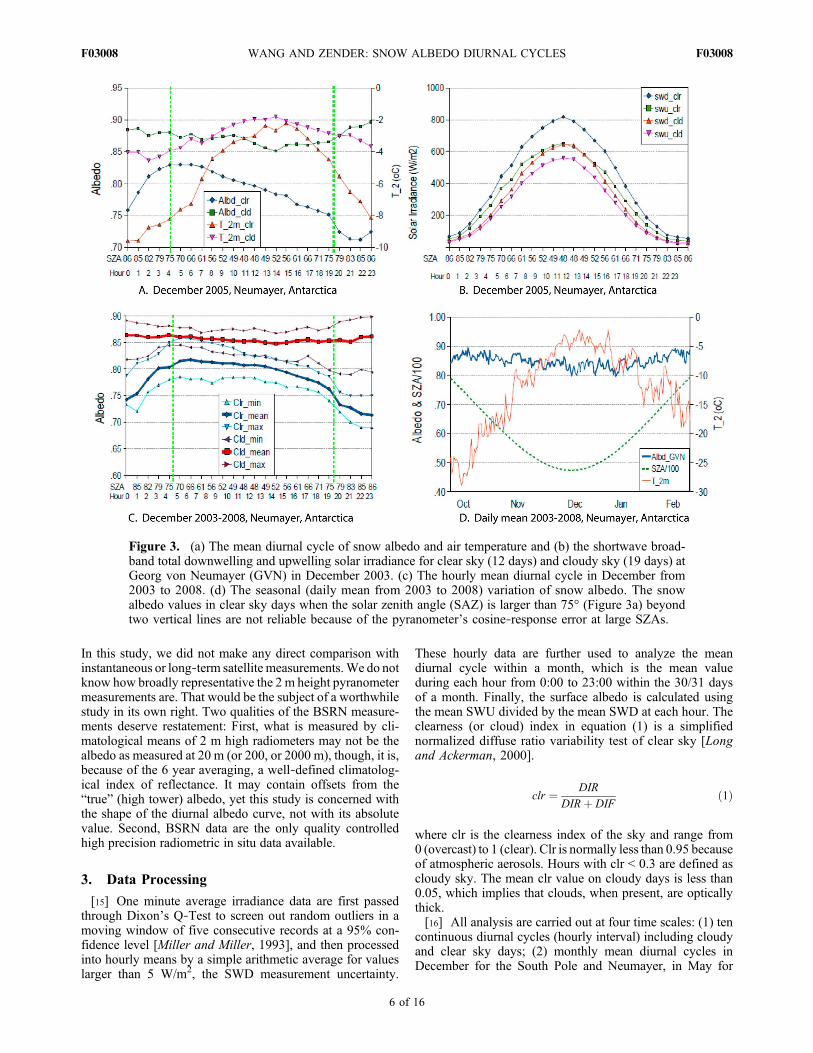
Figure 3. (a) The mean diurnal cycle of snow albedo and air temperature and (b) the shortwave broad-band total downwelling and upwelling solar irradiance for clear sky (12 days) and cloudy sky (19 days) atGeorg von Neumayer (GVN) in December 2003. (c) The hourly mean diurnal cycle in December from2003 to 2008. (d) The seasonal (daily mean from 2003 to 2008) variation of snow albedo. The snowalbedo values in clear sky days when the solar zenith angle (SAZ) is larger than 75° (Figure 3a) beyondtwo vertical lines are not reliable because of the pyranometer’s cosine‐response error at large SZAs.
WANG AND ZENDER: SNOW ALBEDO DIURNAL CYCLES F03008F03008
6 of 16

Barrow, and in April for Ny‐Ålesund when there is long/intense sunshine while snow still exists; (3) hourly mini-mum, mean and maximum based on the monthly meandiurnal variations from 2003 to 2008; and (4) the seasonalvariation, which is the daily mean on each day from 2003 to2008. The months (December, May, and April) selected formonthly mean diurnal cycles were chosen to sample themaximum forcing of snow albedo and its diurnal variation.The daily mean is the 24 h mean with SWD and SWU largerthan 5 W/m2. All average calculations are using SWD andSWU, and the mean albedo is finally derived from the meanSWD and SWU. The diurnal variation here refers to thedifference between the daily maximal values minus theminimal values.
4. Results
4.1. The South Pole
[17] It is instructive to first examine data from South Polesince the SZA there is nearly constant within a 24 h periodand, indeed, throughout December (Figure 1a). Hence theimpact of SZA on the snow albedo diurnal cycle inDecember is negligible, though significant (∼0.04 as SZAincreases from 66° to 80°) at the seasonal scale (Figure 1d).Air temperatures at South Pole are usually below −20°C,though occasionally reaches −14°C in the 6 years from 2003to 2008 (Figure 1d). Hence the snow is perennially dry, andthe snow metamorphism proceeds slowly because of theextremely low air temperature (Figures 1a and 1b). How-ever, the snow albedo at the South Pole on clear sky daysstill has a diurnal variation (of about 0.05) as shown in thefirst 10 days in December 2003 (Figure 2), which reduces toabout 0.035 in the monthly mean diurnal cycle in December2003 (Figure 1a), and to about 0.03 in the multiyear mean
diurnal cycle in December from 2003 to 2008 (Figure 1c).During clear sky days, the minimum snow albedo (Clr_min)in the diurnal cycle is around 0.85, and the maximum snowalbedo (Clr_max) has a similar diurnal pattern with butlarger variation than the mean (Clr_mean) snow albedo(Figure 1c). The mean snow albedo varies between 0.85 and0.88. The strong diurnal cycles disappear during cloudyskies. With constant SZA and solar radiation and extremelow air temperature, such strong clear sky diurnal cycles (upto 0.06 in Figure 2) must be associated with SAA and snowsurface features, such as snow dunes, ripples and sastrugi[Weller, 1969; Kuhn and Siogas, 1978; Carroll and Fitch,1981; Warren et al., 1998]. Figure S1 in the auxiliarymaterial shows a photo of snow sastrugi at the SouthPole.1 When the solar beam is parallel to the sastrugi longaxis, the sides of sastrugi facing the sun receive more irra-diance and correspondingly reflect more solar radiation backto the pyranometer than a flat surface, increasing the snowalbedo by as much as 0.06 relative to when the solar beam isparallel to the sastrugi long axis and the sun is opposite theslope of the sastrugi [Pirazzini, 2004]. The 12 h intervalsbetween the maximum and minimum snow albedo alsomatch the relationship of SAA and sastrugi’s orientation(Figure 2). The impact of sastrugi on the snow albedo isbetween the two extreme situations when SAA is between0° and 180° and between 180° and 360° to the long axis ofthe sastrugi.[18] The diffusion of incident solar radiation by clouds
reduces snow albedo at large SZA (>66°), such as at theSouth Pole, since diffuse radiation has an effective SZA of∼55° [Wiscombe and Warren, 1980; Warren, 1982]. Clouds
1Auxiliary materials are available in the HTML. doi:10.1029/2010JF001864.
Figure 4. Diurnal cycles of in situ snow albedo, air temperature, and cloud index in the last 10 days ofNovember 2005 at Georg von Neumayer (GVN). “Clear” is the sky clearness or cloud index (0 is overcastsky, 1 is cloudless sky) derived from equation (1). The vertical labels for the horizontal (X) axis representdays (the first two numbers from day 21 to day 30) and hours (the last one or two numbers from 0, 3, …,18, 21). The solar zenith angle on 25 November at GVN varies from 49° at solar noon to 88° at 0:00.
WANG AND ZENDER: SNOW ALBEDO DIURNAL CYCLES F03008F03008
7 of 16

also shift the spectral distribution of the incident solarradiation toward the visible due to the high absorption ofwater vapor and liquid water in near infrared wavelengths.The spectral shift effect exceeds the diffusion effect in mostcases, and leads to a net increase in the integrated snowalbedo [Grenfell and Maykut, 1977]. Figure 1a confirms thatsnow albedo on cloudy days has higher values than on clearsky days. Clouds also diminish the impact of SAA andsastrugi on snow albedo’s diurnal cycle by diffusing theincident solar radiation (Figures 1a and 2). This supports theinterpretation that the strong diurnal cycle of snow albedo atthe South Pole is likely caused by snow sastrugi or otherinhomogeneous surface features. Since the atmosphere atthe South Pole is nearly transparent and only 5 days havethin cloud in December (Table 2), the diurnal cycle of snowalbedo is dominated by the clear‐sky patterns. At the dailyscale, the mean snow albedo in December on cloudy days(0.88) is only 0.02 higher than on clear sky days (0.86), witha mean value of 0.87 in December for both clear and cloudydays. The annual mean and standard deviations of snowalbedo from 2003 to 2008 is 0.88 and 0.01, with a maximum(0.91) monthly mean snow albedo in October and a mini-mum (0.86) in December (Table 3).
4.2. Georg von Neumayer
[19] Neumayer is on the coast of Queen Maud Land andthe Weddell Sea, where cloudy days, snow fall and driftingsnow are frequent [Pirazzini, 2004]. The snow albedo has adiurnal asymmetry with larger values in the morning andsmaller values in the afternoon (Figures 3a and 3c). Thisdiurnal asymmetry also exists in other months fromOctober to February (Figure S2, panel A4), and is con-sistent with other observations near this station [Pirazzini,2004; Wuttke et al., 2006]. The much lower albedo valuebefore 04:00 (solar time) and after 19:00 are likely relatedto the instrument measurement errors because the pyr-anometer has poor cosine‐response quality at SZAs largerthan 75° for CM1/21 [McArthur, 2005; Kipp and Zonen,2006]. For instance, on clear sky days on 27, 28, 29,and 30 November 2005 (Figure 4), a much lower snowalbedo exists when SZAs exceed 75°. The air temperatureis lower than −8°C, thus snowmelting and liquid watercontent in snow are negligible and cannot explain the lowsnow albedo values at such large SZAs and low air tem-perature. In contrast, when clouds were present on days 23,24, 25 and 26 in the same month, the strong diurnal cyclesdisappeared, and the snow albedo increased to a near
Figure 5. (a) The mean diurnal cycle of snow albedo and air temperature and (b) the shortwave broad-band downwelling and upwelling solar irradiance for clear sky (8 days) and cloudy sky (23 days) at Bar-row, Alaska, in May 2005. (c) The hourly mean diurnal cycle in May from 2003 to 2008. (d) The seasonal(daily mean from 2003 to 2008) variation.
WANG AND ZENDER: SNOW ALBEDO DIURNAL CYCLES F03008F03008
8 of 16
constant value of ∼0.85 for SZAs larger than 75°. More-over, the asymmetry of snow albedo still exists under thelower air temperatures (<−15°C) of October and February.This suggests that the diurnal cycles of snow albedo arelikely related to snow surface features and SAA.[20] On 15 December, SZA varies from 48° at noon to 86°
at 23:00, while the snow albedo peaks at 0.83 from 04:00–06:00, then falls to 0.75 from 18:00–19:00 in a reliable SZArange of the pyranometer (Figure 3a). This is approximatelya 12 h difference between the maximum and minimumreliable albedo value. This 12 h difference coincides withthe sun azimuth cycle, indicating that the diurnal asymmetryis associated with surface features and SAA. This is con-sistent with the reported strong wind conditions (mean andmaximum wind speed of 9 m/s and 35 m/s) and frequentdrifting snow episodes at Neumayer [König‐Langlo andHerber, 1996; Pirazzini, 2004]. The larger SZA in themorning also contributes to a higher albedo. Meanwhile, theair temperature is close to zero in the daytime and dropsbelow −8°C in the early morning in clear skies; surface hoarcrystals form at “night” and early morning, and then subli-mate because of warming in the afternoon. This cyclehappens every day and could partially explain the diurnalasymmetry of snow albedo variation [McGuffie andHenderson‐Sellers, 1985; Pirazzini, 2004; Domine et al.,2009]. In contrast, at the seasonal time scale, the nearsymmetric distribution of the seasonal snow albedo is likelyrelated to the symmetric distribution of SZAs and otherSZA/time‐related factors (Figure 3d). A similar symmetricdistribution of seasonal snow albedo also occurs in Green-land [Wang and Zender, 2010a, 2010b]. The annual meanand standard deviations of snow albedo from 2003 to 2008is 0.84 and 0.01, with a maximum (0.89) monthly mean
snow albedo in October and a minimum (0.83) in December(Table 3).[21] Snow albedo at Neumayer is larger (0.06 at ∼5:00 to
0.12 at ∼18:00) on cloudy than clear sky days (Figures 3a,3c, and 4). As mentioned earlier, clouds alter snow albedoby shifting the spectral distribution of surface insolation tovisible wavelengths, where snow is more reflective. Themagnitude of spectral shifting is related to the amount andtype of cloud and column water vapor. At the South Pole,the daily SWD difference (clear‐cloud) between clear andcloudy days in December is 76 W/m2 or 17% of SWD inclear sky, leading to 0.02 higher albedo on cloudy daysthan on clear days (Figure 1c and Table 2). At Neumayer,the daily SWD difference in December is 109 W/m2 or26% of SWD in clear sky, leading to 0.05 higher albedoon cloudy days (Figure 3c and Table 2). Clouds alsodiffuse insolation and diminish the effects of surfacefeatures (sastrugi) and SZA on the diurnal cycle of snowalbedo. The nearly constant snow albedo on cloudy days(Figures 3a, 3c, and 4) further suggests that the diurnalasymmetry on clear sky days at Neumayer is related tosnow surface features.
4.3. Barrow, Alaska
[22] Snow at Barrow usually begins to melt and disappearin June, and then accumulates again beginning in lateSeptember or October (Figure 5d). The annual mean andstandard deviations of snow/surface albedo from 2003 to2008 is 0.49 and 0.03, with a maximum (0.82) monthly meansnow albedo in April and a minimum (0.17) in August whensnow melts away (Table 3). The maximum forcing of snowalbedo diurnal variations at Barrow occurs in May, whensnow still exists and receives strong insolation. During May,
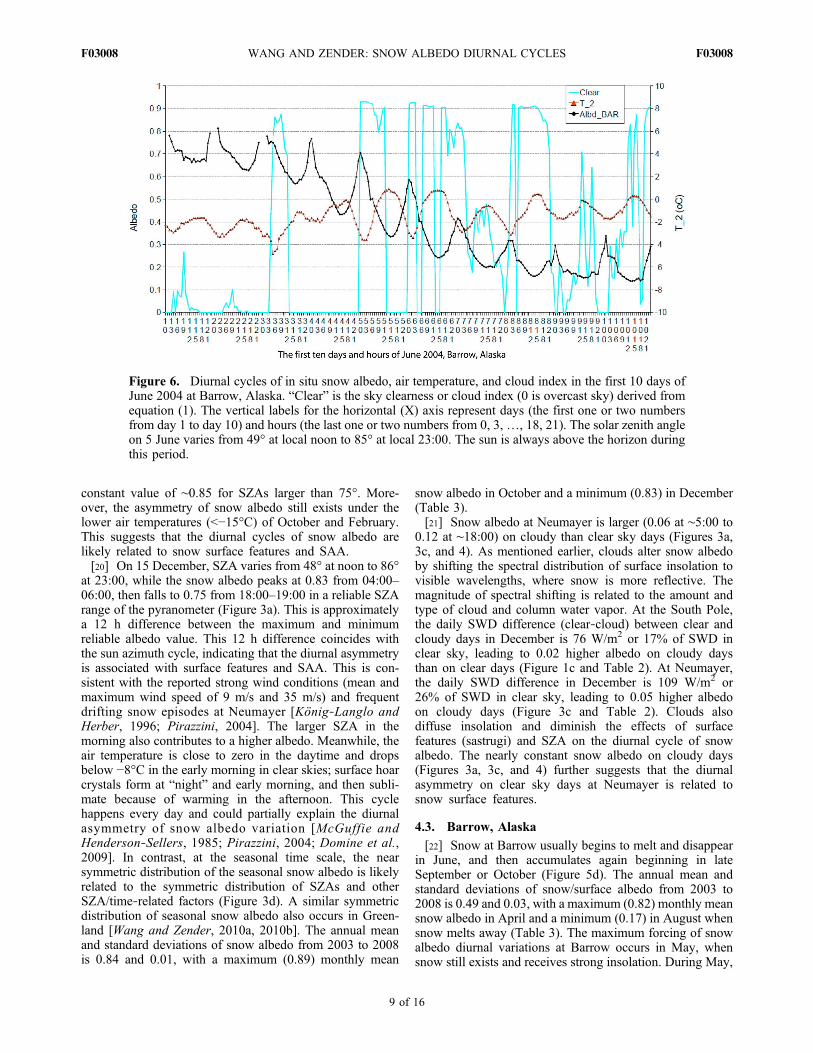
Figure 6. Diurnal cycles of in situ snow albedo, air temperature, and cloud index in the first 10 days ofJune 2004 at Barrow, Alaska. “Clear” is the sky clearness or cloud index (0 is overcast sky) derived fromequation (1). The vertical labels for the horizontal (X) axis represent days (the first one or two numbersfrom day 1 to day 10) and hours (the last one or two numbers from 0, 3,…, 18, 21). The solar zenith angleon 5 June varies from 49° at local noon to 85° at local 23:00. The sun is always above the horizon duringthis period.
WANG AND ZENDER: SNOW ALBEDO DIURNAL CYCLES F03008F03008
9 of 16

the 23 cloudy days have smaller (−23%) SWD, higher airtemperature, and also higher snow albedo than the clear skydays (Figures 5a–5c and Table 2). In contrast, the snowalbedo has strong diurnal cycles on clear sky days, and onlyweak diurnal cycles on cloudy days, when clouds diffuseinsolation and thus diminish the impact of SZA and snowsurface features on snow albedo. The asymmetry of thediurnal cycle of snow albedo, which peaks near 06:00 andreaches minimum near 15:00, coincident with maximum airtemperature (near melting point), is consistent with surfacehoar daily cycles that form in the late evening and morningand then sublimate in the afternoon. In contrast, in monthswithmuch lower air temperature such as inMarch, the diurnalcycles of snow albedo are nearly symmetric around the solarnoon (Figure S2, panel A2).[23] During the first 10 days in June 2004 (Figure 6), air
temperature varies from −4°C to 1°C and the sun contin-uously hangs above the horizon. The melt‐freeze (or wet)snow metamorphism dominates the snow albedo diurnalvariation, which shows asymmetric diurnal cycles, maxi-mal in the morning and minimal in the late afternoon(15:00–18:00). Snow albedo recovers after 18:00, pre-
sumably due to refreezing when the air temperature dropsbelow the freezing point. When snow completely meltsaway on days 8, 9 and 10, the surface albedo has asymmetric diurnal cycle with a minimum value aroundnoon, consistent with soil albedo dependence on SZA[Wang et al., 2005].
4.4. Ny‐Ålesund, Spitsbergen
[24] The annual mean and standard deviations of snow/surface albedo at Ny‐Ålesund from 2003 to 2008 is 0.47 and0.01, with a maximum (0.78) monthly mean snow albedo inApril and a minimum (0.15) in August when snow meltsaway (Table 3). Snow at Ny‐Ålesund disappears as early asin May (Figure 7d) some years, earlier than at Barrow,hence April is the month of maximum snow forcing. Themean diurnal cycle of snow albedo in April (Figures 7a–7c)has a near symmetric diurnal cycle on clear sky days,minimal at noon and maximal in both morning andafternoon. In April 2005 (Figure 7a), the clear sky snowalbedo increases from 0.69 at noon to 0.81 in the morningand afternoon when SZA is ∼80°. The low air temperature(<−5°C) and small solar radiation variation (<350 W/m2)
Figure 7. (a) The mean diurnal cycle of snow albedo and air temperature and (b) the shortwave broad-band downwelling (SWD) and upwelling (SWU) solar irradiance for clear sky (13 days) and cloudy sky(17 days) at Ny‐Ålesund, Spitsbergen, in April 2005. (c) The hourly mean diurnal cycle in April from2003 to 2008. (d) The seasonal (daily mean from 2003 to 2008) variation and the daily values are derivedfrom the 24 h period when both SWD and SWU are larger than 5 W/m2.
WANG AND ZENDER: SNOW ALBEDO DIURNAL CYCLES F03008F03008
10 of 16
indicate that the impact of snow metamorphism and surfacehoar cycles on the diurnal cycle at Ny‐Ålesund is small, andperhaps negligible since both effects would lead to theasymmetric diurnal variation of snow albedo as shown inBarrow and Neumayer. Snow albedo is nearly constant andup to 0.12 higher on cloudy than clear days, which are ∼4°Ccolder (Figure 7a). Other factors in addition to SZA, such assnow surface features (snow dunes, sastrugi, etc.) and/orshadowing, are required to explain the large clear skydiurnal variations.[25] The first ten diurnal cycles in May 2005 at Ny‐
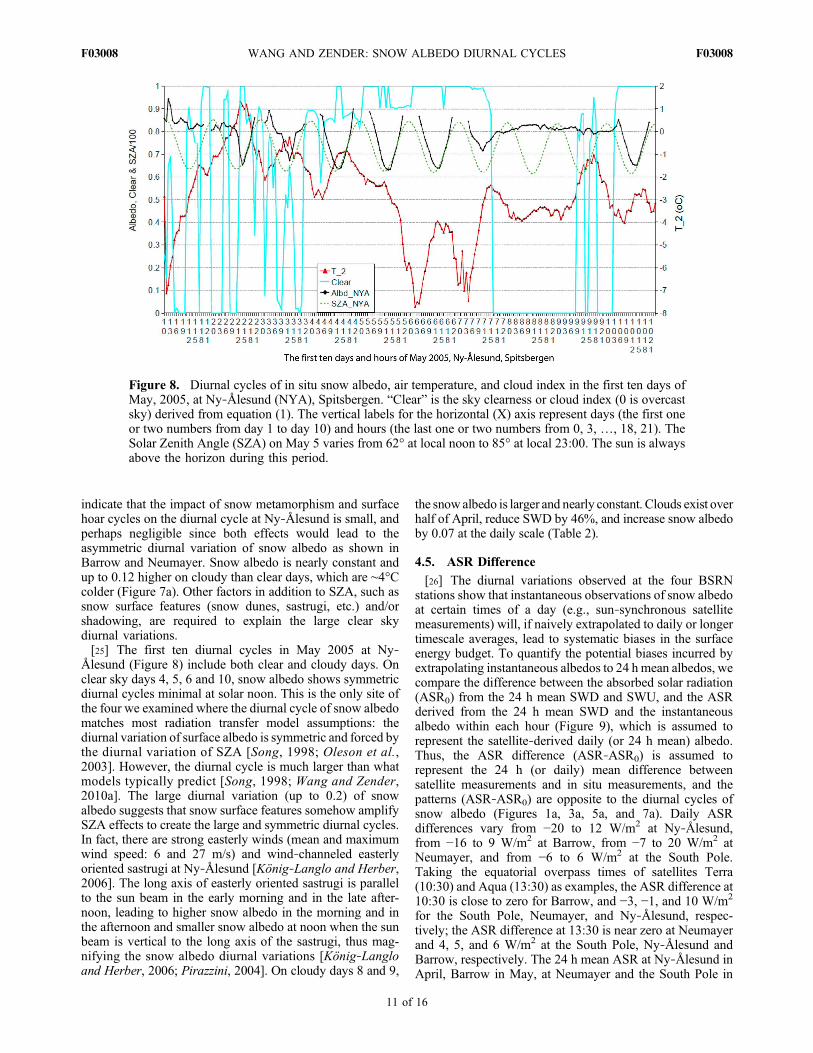
Ålesund (Figure 8) include both clear and cloudy days. Onclear sky days 4, 5, 6 and 10, snow albedo shows symmetricdiurnal cycles minimal at solar noon. This is the only site ofthe four we examined where the diurnal cycle of snow albedomatches most radiation transfer model assumptions: thediurnal variation of surface albedo is symmetric and forced bythe diurnal variation of SZA [Song, 1998; Oleson et al.,2003]. However, the diurnal cycle is much larger than whatmodels typically predict [Song, 1998; Wang and Zender,2010a]. The large diurnal variation (up to 0.2) of snowalbedo suggests that snow surface features somehow amplifySZA effects to create the large and symmetric diurnal cycles.In fact, there are strong easterly winds (mean and maximumwind speed: 6 and 27 m/s) and wind‐channeled easterlyoriented sastrugi at Ny‐Ålesund [König‐Langlo and Herber,2006]. The long axis of easterly oriented sastrugi is parallelto the sun beam in the early morning and in the late after-noon, leading to higher snow albedo in the morning and inthe afternoon and smaller snow albedo at noon when the sunbeam is vertical to the long axis of the sastrugi, thus mag-nifying the snow albedo diurnal variations [König‐Langloand Herber, 2006; Pirazzini, 2004]. On cloudy days 8 and 9,
the snowalbedo is larger and nearly constant. Clouds exist overhalf of April, reduce SWD by 46%, and increase snow albedoby 0.07 at the daily scale (Table 2).
4.5. ASR Difference
[26] The diurnal variations observed at the four BSRNstations show that instantaneous observations of snow albedoat certain times of a day (e.g., sun‐synchronous satellitemeasurements) will, if naively extrapolated to daily or longertimescale averages, lead to systematic biases in the surfaceenergy budget. To quantify the potential biases incurred byextrapolating instantaneous albedos to 24 hmean albedos, wecompare the difference between the absorbed solar radiation(ASR0) from the 24 h mean SWD and SWU, and the ASRderived from the 24 h mean SWD and the instantaneousalbedo within each hour (Figure 9), which is assumed torepresent the satellite‐derived daily (or 24 h mean) albedo.Thus, the ASR difference (ASR‐ASR0) is assumed torepresent the 24 h (or daily) mean difference betweensatellite measurements and in situ measurements, and thepatterns (ASR‐ASR0) are opposite to the diurnal cycles ofsnow albedo (Figures 1a, 3a, 5a, and 7a). Daily ASRdifferences vary from −20 to 12 W/m2 at Ny‐Ålesund,from −16 to 9 W/m2 at Barrow, from −7 to 20 W/m2 atNeumayer, and from −6 to 6 W/m2 at the South Pole.Taking the equatorial overpass times of satellites Terra(10:30) and Aqua (13:30) as examples, the ASR difference at10:30 is close to zero for Barrow, and −3, −1, and 10 W/m2
for the South Pole, Neumayer, and Ny‐Ålesund, respec-tively; the ASR difference at 13:30 is near zero at Neumayerand 4, 5, and 6 W/m2 at the South Pole, Ny‐Ålesund andBarrow, respectively. The 24 h mean ASR at Ny‐Ålesund inApril, Barrow in May, at Neumayer and the South Pole in
Figure 8. Diurnal cycles of in situ snow albedo, air temperature, and cloud index in the first ten days ofMay, 2005, at Ny‐Ålesund (NYA), Spitsbergen. “Clear” is the sky clearness or cloud index (0 is overcastsky) derived from equation (1). The vertical labels for the horizontal (X) axis represent days (the first oneor two numbers from day 1 to day 10) and hours (the last one or two numbers from 0, 3, …, 18, 21). TheSolar Zenith Angle (SZA) on May 5 varies from 62° at local noon to 85° at local 23:00. The sun is alwaysabove the horizon during this period.
WANG AND ZENDER: SNOW ALBEDO DIURNAL CYCLES F03008F03008
11 of 16
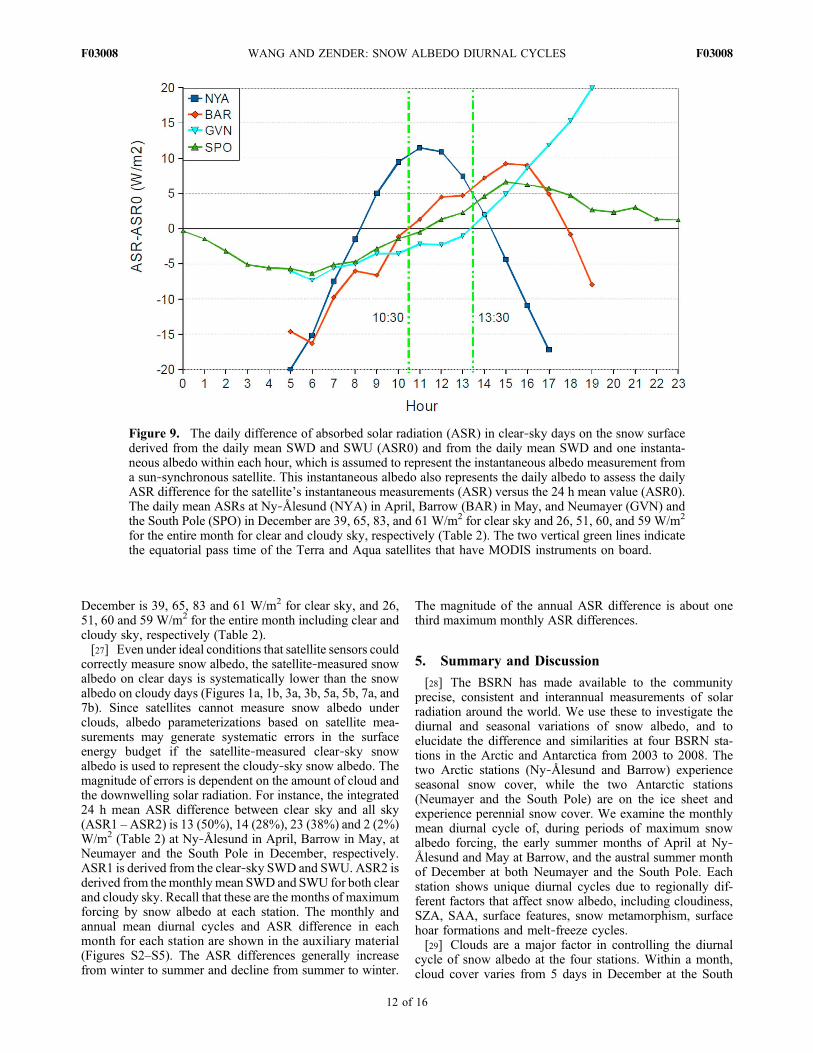
December is 39, 65, 83 and 61 W/m2 for clear sky, and 26,51, 60 and 59 W/m2 for the entire month including clear andcloudy sky, respectively (Table 2).[27] Even under ideal conditions that satellite sensors could
correctly measure snow albedo, the satellite‐measured snowalbedo on clear days is systematically lower than the snowalbedo on cloudy days (Figures 1a, 1b, 3a, 3b, 5a, 5b, 7a, and7b). Since satellites cannot measure snow albedo underclouds, albedo parameterizations based on satellite mea-surements may generate systematic errors in the surfaceenergy budget if the satellite‐measured clear‐sky snowalbedo is used to represent the cloudy‐sky snow albedo. Themagnitude of errors is dependent on the amount of cloud andthe downwelling solar radiation. For instance, the integrated24 h mean ASR difference between clear sky and all sky(ASR1 –ASR2) is 13 (50%), 14 (28%), 23 (38%) and 2 (2%)W/m2 (Table 2) at Ny‐Ålesund in April, Barrow in May, atNeumayer and the South Pole in December, respectively.ASR1 is derived from the clear‐sky SWD and SWU. ASR2 isderived from themonthlymean SWD and SWU for both clearand cloudy sky. Recall that these are the months of maximumforcing by snow albedo at each station. The monthly andannual mean diurnal cycles and ASR difference in eachmonth for each station are shown in the auxiliary material(Figures S2–S5). The ASR differences generally increasefrom winter to summer and decline from summer to winter.
The magnitude of the annual ASR difference is about onethird maximum monthly ASR differences.
5. Summary and Discussion
[28] The BSRN has made available to the communityprecise, consistent and interannual measurements of solarradiation around the world. We use these to investigate thediurnal and seasonal variations of snow albedo, and toelucidate the difference and similarities at four BSRN sta-tions in the Arctic and Antarctica from 2003 to 2008. Thetwo Arctic stations (Ny‐Ålesund and Barrow) experienceseasonal snow cover, while the two Antarctic stations(Neumayer and the South Pole) are on the ice sheet andexperience perennial snow cover. We examine the monthlymean diurnal cycle of, during periods of maximum snowalbedo forcing, the early summer months of April at Ny‐Ålesund and May at Barrow, and the austral summer monthof December at both Neumayer and the South Pole. Eachstation shows unique diurnal cycles due to regionally dif-ferent factors that affect snow albedo, including cloudiness,SZA, SAA, surface features, snow metamorphism, surfacehoar formations and melt‐freeze cycles.[29] Clouds are a major factor in controlling the diurnal
cycle of snow albedo at the four stations. Within a month,cloud cover varies from 5 days in December at the South
Figure 9. The daily difference of absorbed solar radiation (ASR) in clear‐sky days on the snow surfacederived from the daily mean SWD and SWU (ASR0) and from the daily mean SWD and one instanta-neous albedo within each hour, which is assumed to represent the instantaneous albedo measurement froma sun‐synchronous satellite. This instantaneous albedo also represents the daily albedo to assess the dailyASR difference for the satellite’s instantaneous measurements (ASR) versus the 24 h mean value (ASR0).The daily mean ASRs at Ny‐Ålesund (NYA) in April, Barrow (BAR) in May, and Neumayer (GVN) andthe South Pole (SPO) in December are 39, 65, 83, and 61 W/m2 for clear sky and 26, 51, 60, and 59 W/m2
for the entire month for clear and cloudy sky, respectively (Table 2). The two vertical green lines indicatethe equatorial pass time of the Terra and Aqua satellites that have MODIS instruments on board.
WANG AND ZENDER: SNOW ALBEDO DIURNAL CYCLES F03008F03008
12 of 16

Pole, to 23 days in May at Barrow. Clouds reduce the dailySWD from 17% at the South Pole to 46% at Ny‐Ålesund(Table 2). Clouds also have a diurnal cycle with more clear‐sky days from hours 8:00 to 14:00 than in other periods atthese stations. The diurnal cycle of cloud cover is mostpronounced at Ny‐Ålesund, where there are 16 clear‐skydays from hours 9:00 to 15:00, with up to 8 clear‐sky daysmore than at other hours (Table 2). Clouds alter the snowalbedo through several ways. Clouds shift the solar radiationspectral distribution of surface insolation by backscatteringto space more VIS than NIR radiation, which tends toreduce snow albedo, while simultaneously absorbing moreNIR than VIS radiation which acts to increase snow albedo.In addition, multiple scattering of radiation between cloudand snow surface, aka the “snow/ice blink” effect, shiftssolar insolation toward VIS wavelengths, thus increasing thesnow albedo [Grenfell and Perovich, 2008]. The net effectof cloud absorption, backscatter and multiple scattering withthe surface is to shift the surface insolation toward VISwavelengths and increase snow albedo [Gardner and Sharp,2010]. This net effect appears at all stations we examined,increasing snow albedo by 0.07, 0.02, 0.05 and 0.02 at Ny‐Ålesund, Barrow, Neumayer and the South Pole respec-tively on cloudy days relative to clear (Table 2). Meanwhile,clouds diffuse direct solar insolation, reducing or eliminat-ing the impact of snow surface features, SZA and SAA onsnow albedo, thus changing the diurnal cycle of snowalbedo [Pirazzini, 2004]. Indeed, the snow albedo remainsnearly constant on cloudy days (Figures 1a, 4a, 7a, and 8a)at the four BSRN stations, also consistent with spectralmeasurements in January 2004 at Neumayer byWuttke et al.[2006].[30] Snow metamorphism is generally classified into
equilibrium (or dry) metamorphism rounds, kinetic meta-morphism facets, and melt‐freeze (or wet) metamorphism[Colbeck, 1982]. Driving forces behind snow metamor-phism are macroscopic snow temperature gradients andmicroscopic vapor pressure gradients [e.g., Flanner andZender, 2006]. Dry metamorphism is normally classifiedinto Equi‐Temperature (ET) and Temperature Gradient(TG) metamorphism [Sommerfeld and LaChapelle, 1970].ET takes place under gradients <10°C/m and TG for gra-dients >20°C/m, with a transition zone in between. Snowmetamorphism converts snow grains from small to largecrystals, reducing the specific surface area and thus snowalbedo [e.g., Domine et al., 2006; Picard et al., 2009].Metamorphism proceeds exponentially faster in warm (e.g.,>−5°C) than cold snow (e.g., <−10°C), and comes to avirtual standstill at −40°C [Colbeck, 1983; Taillandier et al.,2007]. Consistent with this behavior, the diurnal cycle andthe snow albedo at the South Pole remain nearly constant oncloudy days (Figure 1a) which are all at extremely low airtemperature (e.g., <−20°C). During the onset of snowmelt,e.g., in the first 6 days of June 2004 at Barrow (Figure 6),melt‐freeze (wet) snow metamorphism clearly exceeds theimpact of cloud on snow albedo and dominates the snowalbedo diurnal cycles.[31] Considering the irreversible processes of snow grain
size increase in snow metamorphism [Colbeck, 1982], grainsize‐related snow metamorphism alone cannot explain theasymmetric or symmetric snow albedo diurnal cycles atNeumayer and Ny‐Ålesund. Snow surface hoar crystals that
may form at “night” and early morning, could brighten thesurface from the previous day’s low value, and then subli-mate and darken the surface during the following afternoonwarming [Pirazzini, 2004; Domine et al., 2009]. Surfacehoar may help explain the asymmetric diurnal variations ofsnow albedo at stations Neumayer and Barrow, assumingwind ventilation does not prevent the formation of surfacehoar. Meanwhile, the asymmetric diurnal variation of snowalbedo exists from austral summer to winter months atNeumayer and has larger amplitude in the winter months(Figure S2). However, surface hoar cycles cannot explainthe symmetric snow albedo diurnal variation at Ny‐Ålesund.Wind can accelerate grain size increase [Cabanes et al.,2003] in the case of fresh snow, and wind can also frag-ment and partially sublimate aged crystals, reducing grainsize [Domine et al., 2009]. However, wind effects on crystalsize distributions are unlikely to explain the snow albedodiurnal variations at Neumayer and Ny‐Ålesund because thewinds are much more variable than the albedo diurnal var-iation. Long‐term wind‐driven snow surface features, e.g.,snow dunes and sastrugi, illuminated by the diurnal cycleof sunlight, are likely to be the primary cause of snowalbedo diurnal variations at the two stations, particularly atNy‐Ålesund where the long axis of easterly oriented sas-trugi caused by the strong easterly wind is parallel to thesun beam in the early morning and in the late afternoon,leading to higher snow albedo in the morning and in theafternoon and smaller snow albedo at noon when the sunbeam is vertical to the long axis of the sastrugi, thusmagnify the snow albedo diurnal variations [König‐Langloand Herber, 2006; Pirazzini, 2004].[32] At Neumayer, “the occurrence of cyclones and east-
erly winds produced frequent snowfall and almost contin-uous drifting snow” [Pirazzini, 2004, p. 13]. According tothe report of Kupfer et al. [2006] and König‐Langlo andHerber [1996], Neumayer in Antarctic has higher windspeed than Ny‐Ålesund, with prevailing mean and maxi-mum wind speed of 9 m/s and 35 m/s at Neumayer, and 6 m/sand 27 m/s at Ny‐Ålesund. Snow drifts could happen whenwind speed exceeds 6 m/s, and snow dunes may form whenwind speed exceeds 9 m/s [Birnbaum et al., 2010]. Based onwind speeds, snow dunes or sastrugi may form at the twostations. Field pictures at Neumayer and Ny‐Ålesund showsnow dunes or snow sastrugi with different sizes exist atthe two stations, and “[t]he surface is always covered withsnow which forms occasionally sastrugies up to 1 mheight” [König‐Langlo and Herber, 2006, p. 1]. “Thenormal condition of snow in the polar regions is in theform of fields of sastrugi. Relative to a flat surface, sas-trugi usually cause only a slight reduction in albedo butcan alter the bidirectional reflectance pattern significantly,particularly at large view angles and especially in theforward‐scattering direction” [Warren et al., 1998, p. 17].However, at all stations the impact of sastrugi, SAA andSZA can be overwhelmed by the diffusing effects ofovercast cloud.[33] SZA increases snow albedo because the increased light
path over which obliquely incident photons interact withsnow grains allows more multiple scattering and less pene-tration of and absorption by the snow surface [Wiscombe andWarren, 1980; Lucht et al., 2000; Flanner and Zender, 2006].The dependence of snow albedo on SZA is most distinct in
WANG AND ZENDER: SNOW ALBEDO DIURNAL CYCLES F03008F03008
13 of 16
April and May at Neumayer (Figures 7 and 8), where snowalbedo has the same diurnal symmetry as SZA. At the sea-sonal scale, the snow albedo at Neumayer and the South Polehas a symmetric dependence on SZA,minimal in summer andhigher in spring and fall (Figures 1d and 3d). Such near‐symmetric seasonal snow albedo around summer is causedtogether by SZA and other SZA/time‐related factors (e.g., airtemperature, snow aging, etc.), and also occurs in Greenland[Wang and Zender, 2010a, 2010b]. At Ny‐Ålesund andBarrow, the seasonal snow albedo shows an increase trendwith SZA, too (Figures 5d and 7d). However, at very largeSZA (e.g., >80°) the shadowing effect of an uneven snowsurface can decrease the snow albedo [Warren et al., 1998;Pirazzini, 2004]. For example, on days 27–30 November2005 at Neumayer (Figure 4), the much lower snow albedo(<0.7) when SZA > 80° is consistent with a shadowingeffect by an uneven snow surface in addition to the pyr-anometer’s cosine‐response error, and to the reduction ofthe effective SZA by long‐path atmospheric (Rayleigh andaerosol) scattering.[34] At very large SZA (e.g., >80°), the clear sky diffusion
insolation increases due to atmospheric (Rayleigh andaerosol) scattering, thus the effective SZA becomes less thanthe real SZA, resulting in lower snow albedo [Wiscombeand Warren, 1980]. At Neumayer (Figures 3 and 4), themuch lower snow albedo in clear sky at SZA > 80° isconsistent with reduction in effective SZA by long‐pathscattering, in addition to the instruments’ cosine‐responseerror and the shadowing effects of uneven snow surfaces[Strahler et al., 1999; McArthur, 2005; Kipp and Zonen,2006].[35] In addition, other factors can affect the daily albedo
cycles, such as surface tilting, hoar frost and the presence ofthree‐dimensional features near the measurement stations.The pair of upfacing and downfacing BSRN pyranometersare horizontally positioned within ±0.1° [McArthur, 2005].The effect of surface slope and the pyranometer tilting onthe snow albedo diurnal cycle at Neumayer is very limitedif it is not negligible since our observed diurnal trend(Figures 3 and 4) is similar with literature report [Pirazzini,2004, Figure 7; Wuttke et al., 2006, Figure 7]. Accordingto Warren et al. [1998], the effect of surface tilting at theSouth Pole is negligible because the large‐scale surfaceslope is only 0.001. The three‐dimensional features onlyexist at Ny‐Ålesund that “[i]n the south of the village the554 m high Zeppelin mountain shades the place for severalweeks in spring and fall” [Kupfer et al., 2006, p. 72] and“a fan is mounted in the instrument to avoid the depositionof hoarfrost and dew as well as the heating of the dome”[Kupfer et al., 2006, p. 8]. At Neumayer, “[t]he pyr-anometers are ventilated with slightly preheated air tominimize hoar frost problems and zero offsets duringcloudless and windless conditions” [Wuttke, 2005, p. 4].According to the BSRN manual, the pyranometers at theSouth Pole and Barrow also have similar setup to removehoar frost on the pyranometer dome [McArthur, 2005].Other factors that affect snow albedo, such as snow agingand snow impurities have little effect on the diurnal vari-ation of snow albedo. Moreover, we also used a Dixon’sQ‐Test to screen out the random outlier of the averaged 1 minflux records within five consecutive minutes at the 95%confidence level [Miller and Miller, 1993].
[36] Last, are the 6 year data sufficient to derive a climaticmean, given the interannual variability of the meteorologicalconditions? According to the “long‐term” (>35 years)ground records at station SANAE (World MeteorologicalOrganization Station number: 89001; 70.10S, 357.36E), tothe east of station Neumayer, air temperature at SANAE hasa 4–6 years recurrent variations (not shown). A 5 yearmoving window is also commonly used in analyzing timeseries climatic data sets [Hansen et al., 2006; Arndt et al.,2010]. The radiation flux data records at four stations inour study are of different durations. For the cleanest inter-comparison, we chose the common data record duration of6 years. Even so, there were three 1 year gaps at the SouthPole station. The 6 year record reflects typical snow albedovariations at these stations during these 6 years. The 6 yearstandard deviation of monthly mean albedo in summer atthese stations is typically less than 0.02, whereas the sea-sonal cycle of monthly mean albedo is of amplitude 0.06at two perennial snow covered stations Neumayer and theSouth Pole in Antarctica and 0.65 at two seasonal snowcovered stations Barrow and Ny‐Alesund in the Arctic(Table 3). Since the interannual standard deviation isusually 2–40% of the seasonal variation amplitude, wethink this 6 year period merits the name “climatological”or conservatively a “multiyear” mean.
6. Conclusions
[37] The snow albedo at the four BSRN stations in both theArctic and Antarctica displays different magnitudes andpatterns of diurnal variation. These diurnal variations aredominated by different factors at each station, and depend ondynamically changing snow properties and environmentalconditions. Satellite measured clear sky snow albedos will belower (and thus, if treated naively, underestimate) the all‐skysnow albedo. One‐time instantaneous observations also leadto systematic biases if snow albedo diurnal variations areneglected. Snow albedo is, at these BSRN stations, usuallynot symmetric around solar noon, though the solar noonalbedo is most important because of the peak solar radiation.Sometimes, e.g., for the asymmetric snow albedo diurnalvariation at the South Pole and Neumayer, snow albedo nearsolar noon does best represent the 24 h mean snow albedo. Inother locations like Ny‐Ålesund, solar noon coincides withminimal snow albedo, consistent with most current climatemodel parameterizations, but has much larger variations thanthe predictions of snow and climate models. The local timesmost representative of 24 h mean snow albedo are 10:30,11:30, 13:30 and 14:30 for Barrow, the South Pole, Neu-mayer and Ny‐Ålesund, respectively. The instantaneousforcing due to the difference between instantaneous albedoand the 24 h mean albedo is up to 50% of the absorbed solarradiation. Snow‐atmosphere radiative transfer models andother snow models coupled to general circulation modelsshould also consider the diurnal variation of snow albedo inorder to better represent the consequent fast time scalefeedbacks, e.g., snowmelt‐albedo feedback.
[38] Acknowledgments. We thank all the researchers who deploy,operate, and maintain the World Climate Research Programme (WCRP)Baseline Surface Radiation Network (BSRN) stations that provide the insitu measurements on air temperature, shortwave upwelling, downwelling,
WANG AND ZENDER: SNOW ALBEDO DIURNAL CYCLES F03008F03008
14 of 16
and direct and diffuse solar radiation used here. We thank Florent Domineand two anonymous reviewers for their helpful and insightful comments.Funding for this work is provided by NASA NNX07AR23G; NationalBasic Research Program of China (973 Program) (grant 2011CB707103);Sun Yat‐sen University’s “Hundred Talents” program; NASA Interna-tional Polar Year (IPY) Program, NASA NNX07AR23G; and NSF OPPARC‐0714088.
ReferencesArndt, D. S., M. O. Baringer, and M. R. Johnson (2010), State of the cli-mate in 2009, Bull. Am. Meteorol. Soc., 91, s1–s222, doi:10.1175/BAMS-91-7-StateoftheClimate.
Birnbaum, G., et al. (2010), Strong‐wind events and their influence on theformation of snow dunes: Observations from Kohnen station, DronningMaud Land, Antarctica, J. Glaciol., 56, 891–902, doi:10.3189/002214310794457272.
Briegleb, B. P., and V. Ramanathan (1982), Spectral and diurnal variationsin clear sky planetary albedo, J. Clim. Appl. Meteorol., 21, 1160–1171,doi:10.1175/1520-0450(1982)021<1160:SADVIC>2.0.CO;2.
Brooks, D. R., E. F. Harrison, P. Minnis, J. T. Suttles, and R. S. Kandel(1986), Development of algorithms for understanding the temporal vari-ability of the Earth’s radiation balance, Rev. Geophys., 24, 422–438,doi:10.1029/RG024i002p00422.
Cabanes, A., L. Legagneux, and F. Domine (2003), Rate of evolution of thespecific surface area of surface snow layers, Environ. Sci. Technol., 37,661–666, doi:10.1021/es025880r.
Carroll, J. J., and B. W. Fitch (1981), Effects of solar elevation and cloud-iness on snow albedo at the South Pole, J. Geophys. Res., 86, 5271–5276,doi:10.1029/JC086iC06p05271.
Colbeck, S. C. (1982), An overview of seasonal snow metamorphism, Rev.Geophys., 20, 45–61, doi:10.1029/RG020i001p00045.
Colbeck, S. C. (1983), Theory of metamorphism of dry snow, J. Geophys.Res., 88, 5475–5482, doi:10.1029/JC088iC09p05475.
Domine, F., R. Salvatori, L. Legagneux, R. Salzano,M. Fily, and R. Casacchia(2006), Correlation between the specific surface area and the short waveinfrared (SWIR) reflectance of snow, Cold Reg. Sci. Technol., 46, 60–68,doi:10.1016/j.coldregions.2006.06.002.
Domine, F., A. S. Taillandier, A. Cabanes, T. A. Dougla, and M. Sturm(2009), Three examples where the specific surface area of snow increasedover time, Cryosphere, 3, 31–39, doi:10.5194/tc-3-31-2009.
Flanner, M. G., and C. S. Zender (2006), Linking snowpack microphysicsand albedo evolution, J. Geophys. Res., 111, D12208, doi:10.1029/2005JD006834.
Flanner, M. G., C. S. Zender, J. T. Randerson, and P. J. Rasch (2007),Present‐day climate forcing and response from black carbon in snow,J. Geophys. Res., 112, D11202, doi:10.1029/2006JD008003.
Gardner, A. S., and M. J. Sharp (2010), A review of snow and ice albedoand the development of a new physically based broadband albedo param-eterization, J. Geophys. Res., 115, F01009, doi:10.1029/2009JF001444.
Grenfell, T. C., and G. A. Maykut (1977), The optical properties of ice andsnow in the Arctic Basin, J. Glaciol., 18, 445–463.
Grenfell, T. C., and D. K. Perovich (2008), Incident spectral irradiance inthe Arctic Basin during the summer and fall, J. Geophys. Res., 113,D12117, doi:10.1029/2007JD009418.
Hall, A. (2004), The role of surface albedo feedback in climate, J. Clim.,17, 1550–1568, doi:10.1175/1520-0442(2004)017<1550:TROSAF>2.0.CO;2.
Hansen, J., M. Sato, R. Ruedy, K. Lo, D.W. Lea, and M. Medina‐Elizade(2006), Global temperature change, Proc. Natl. Acad. Sci. U. S. A., 103,14,288–14,293, doi:10.1073/pnas.0606291103.
Jin, Y., C. B. Schaaf, C. E. Woodcock, F. Gao, X. Li, A. H. Strahler,W. Lucht, and S. Liang (2003), Consistency of MODIS surface bidirec-tional reflectance distribution function and albedo retrievals: 2. Validation,J. Geophys. Res., 108(D5), 4159, doi:10.1029/2002JD002804.
Kipp and Zonen (2006), CMP series pyranometer instruction manual,version 0806, user guide, Delft, Netherlands. [Available at http://www.kippzonen.com/.]
König‐Langlo, G., and A. Herber (1996), The meteorological data of theNeumayer station (Antarctica) for 1992, 1993, and 1994, Rep. PolarRes. 187, Alfred Wegener Inst. for Polar and Mar. Res., Bremerhaven,Germany.
König‐Langlo, G., and A. Herber (2006), Bipolar Intercomparison oflong‐term solar radiation measurements from two BSRN stations,paper presented at the 9th Science and Review Workshop for theBSRN, Lindenberg, Germany, 29 May–02 Jun.
Kuhn, M., and L. Siogas (1978), Spectroscopic studies at McMurdo,South Pole and Siple stations during the austral summer 1977–78,Antarct, J. U. S., 13, 178–179.
Kupfer, H., A. Herber, and G. König‐Langlo (2006), Radiation Measure-ments and Synoptic Observations at Ny‐Ålesund, Svalbard, Ber. Polar-forsch. Meeresforsch., 538, 104 pp.
Long, C. N., and T. P. Ackerman (2000), Identification of clear skies frombroadband pyranometer measurements and calculation of downwellingshortwave clouds effects, J. Geophys. Res., 105, 15,609–15,626,doi:10.1029/2000JD900077.
Lucht, W., C. B. Schaaf, and A. H. Strahler (2000), An algorithm for theretrieval of albedo from space using semiempirical BRDF models, IEEETrans. Geosci. Remote Sens., 38, 977–998, doi:10.1109/36.841980.
McArthur, L. J. B. (2005), Baseline Surface Radiation Network (BSRN)operations manual version 2.1, Rep. WCRP‐121, WMO/TD‐NO.1274,World Clim. Res. Programme, Geneva, Switzerland.
McGuffie, K., and A. Henderson‐Sellers (1985), The diurnal hysteresis ofsnow albedo, J. Glaciol., 31, 188–189.
Meinander, O., A. Konku, K. Lakkala, A. Heikkilä, L. Ylianttila, andM. Toikka (2008), Diurnal variations in the UV albedo of arctic snow,Atmos. Chem. Phys., 8, 6551–6563, doi:10.5194/acp-8-6551-2008.
Miller, J. C., and J. N. Miller (1993), Statistics for Analytical Chemistry,Ellis Horwood, Chichester, U. K.
Minnis, P., S. Mayor, W. L. Smith Jr., and D. F. Young (1997), Asysmetryin the diurnal variation of surface albedo, IEEE Trans. Geosci. RemoteSens., 35(4), 879–890, doi:10.1109/36.602530.
Oleson, K. W., G. B. Bonan, C. B. Schaaf, F. Gao, Y. Jin, and A. H. Strahler(2003), Assessment of global climate model land surface albedo usingMODIS data, Geophys. Res. Lett . , 30(8), 1443, doi:10.1029/2002GL016749.
Picard, D., L. Arnaud, F. Domine, and M. Fily (2009), Determining snowspecific surface area from near‐infrared reflectance measurements:Numerical study of the influence of grain shape, Cold Reg. Sci. Technol.,56, 10–17, doi:10.1016/j.coldregions.2008.10.001.
Pirazzini, R. (2004), Surface albedo measurements over Antarctic sites insummer, J. Geophys. Res., 109, D20118, doi:10.1029/2004JD004617.
Pirazzini, R., T. Vihma, M. A. Granskog, and B. Cheng (2006), Surfacealbedomeasurements over sea ice in the Baltic Sea during the spring snow-melt period, Ann. Glaciol., 44, 7–14, doi:10.3189/172756406781811565.
Roesch, A. (2006), Evaluation of surface albedo and snow cover in AR4coupled climate models, J. Geophys. Res., 111, D15111, doi:10.1029/2005JD006473.
Salomon, J. G., C. B. Schaaf, A. H. Strahler, F. Gao, and Y. Jin (2006),Validation of the MODIS bidirectional reflectance distribution functionand albedo retrievals using combined observations from the Aqua andTerra platforms, IEEE Trans. Geosci. Remote Sens., 44, 1555–1565,doi:10.1109/TGRS.2006.871564.
Schaepman‐Strub, G., M. E. Schaepman, T. H. Painter, S. Dangel, andJ. V. Martonchik (2006), Reflectance quantities in optical remote sensing‐definitions and case studies, Remote Sens. Environ., 103, 27–42,doi:10.1016/j.rse.2006.03.002.
Schwerdtfeger, P. (1976), Physical Principles of MicrometeorologicalMeasurements, 113 pp., Elsevier Sci., New York.
Seckmeyer, G., A. Bais, G. Bernhard, M. Blumthaler, P. Eriksen, R. L.McKenzie, C. Roy, and M. Miyauchi (2001), Instruments to measuresolar ultraviolet radiation, part I: Spectral instruments, WOM‐GAWRep. 125, World Meteorol. Org., Geneva, Switzerland.
Sommerfeld, R. A., and E. LaChapelle (1970), The classification of snowmetamorphism, J. Glaciol., 9, 3–17.
Song, J. (1998), Diurnal asymmetry in surface albedo, Agric. For. Meteorol.,92, 181–189, doi:10.1016/S0168-1923(98)00095-1.
Strahler, A. H., et al. (1999), MODIS BRDF/Albedo product: Algorithmtheoretical basis document version 5.0, MODIS Prod. MOD43, NASAGoddard Space Flight Cent., Greenbelt, Md.
Taillandier, A.‐S., F. Domine, W. R. Simpson, M. Sturm, and T. A.Douglas (2007), Rate of decrease of the specific surface area of drysnow: Isothermal and temperature gradient conditions, J. Geophys.Res., 112, F03003, doi:10.1029/2006JF000514.
Wang, X., and C. S. Zender (2010a), MODIS albedo bias at high zenithangle relative to theory and to in situ observations in Greenland, RemoteSens. Environ., 114, 563–575, doi:10.1016/j.rse.2009.10.014.
Wang, X., and C. S. Zender (2010b), ConstrainingMODIS snow albedo biasat large solar zenith angles: Implications for surface energy budget inGreenland, J. Geophys. Res., 115, F04015, doi:10.1029/2009JF001436.
Wang, Z., M. Barlage, X. Zeng, R. E. Dickinson, and C. B. Schaaf (2005),The solar zenith angle dependence of desert albedo, Geophys. Res. Lett.,32, L05403, doi:10.1029/2004GL021835.
Warren, S. G. (1982), Optical properties of snow, Rev. Geophys. SpacePhys., 20, 67–89, doi:10.1029/RG020i001p00067.
Warren, S. G., and W. J. Wiscombe (1980), A model for the spectral albedoof snow. II: Snow containing atmospheric aerosols, J. Atmos. Sci., 37,2734–2745, doi:10.1175/1520-0469(1980)037<2734:AMFTSA>2.0.CO;2.
WANG AND ZENDER: SNOW ALBEDO DIURNAL CYCLES F03008F03008
15 of 16

Warren, S. G., R. E. Brandt, and P. O. Hinton (1998), Effect of surfaceroughness on bidirectional reflectance of Antarctic snow, J. Geophys.Res., 103, 25,789–25,807, doi:10.1029/98JE01898.
Weller, G. E. (1969), Radiation diffusion in Antarctic ice media, Nature,221, 355–356, doi:10.1038/221355a0.
Winther, J.‐G., F. Godtliebsen, S. Gerland, and P. E. Isachsen (2002), Sur-face albedo in Ny‐Ålesund, Svalbard: Variability and trends during1981–1997, Global Planet. Change, 32, 127–139, doi:10.1016/S0921-8181(01)00103-5.
Wiscombe, W. J., and S. G. Warren (1980), A model for the spectral albedoof snow. I: Pure snow, J. Atmos. Sci., 37, 2712–2733, doi:10.1175/1520-0469(1980)037<2712:AMFTSA>2.0.CO;2.
Wuttke, S. (2005), Radiation conditions in an Antarctic environment, Ber.Polarforsch. Meeresforsch., 514, 148 pp.
Wuttke, S., G. Seckmeyer, and G. Kőnig‐Lango (2006), Measurements ofspectral snow albedo at Neumayer, Antarctica, Ann. Geophys., 24, 7–21,doi:10.5194/angeo-24-7-2006.
X. Wang, School of Geography and Planning, Sun Yat‐sen University,135 Xingang West Rd., Guangzhou, Guangdong 510275, China.([email protected])C. S. Zender, Department of Earth System Science, University of
California, 3323 Croul Hall, Irvine, CA 92697‐3100, USA.
WANG AND ZENDER: SNOW ALBEDO DIURNAL CYCLES F03008F03008
16 of 16