are job networks localized in a developing economy? … · 2013-07-01 · evidence of displaced...
TRANSCRIPT

<アジア経済研究所学術研究リポジトリ ARRIDE> http://ir.ide.go.jp/dspace/
Title Are Job Networks Localized in a Developing Economy?Search Methods for Displaced Workers in Thailand
Author(s) Machikita, Tomohiro
Citation IDE Discussion Paper. No. 84. 2006.12
Issue Date 2006-12
URL http://hdl.handle.net/2344/336
Rights

INSTITUTE OF DEVELOPING ECONOMIES
Discussion Papers are preliminary materials circulated to stimulate discussions and critical comments
* Researcher, Regional Integration Studies Group, Inter-disciplinary Studies Center IDE ([email protected])
DISCUSSION PAPER No. 84
Are Job Networks Localized in a Developing Economy? Search Methods for Displaced Workers in Thailand Tomohiro MACHIKITA*

Keywords: Local Interactions, Job Search Methods, Referrals, Asymmetric Information, Thailand JEL classification: C21, J63, J64, O18
The Institute of Developing Economies (IDE) is a semigovernmental,
nonpartisan, nonprofit research institute, founded in 1958. The Institute merged
with the Japan External Trade Organization (JETRO) on July 1, 1998. The
Institute conducts basic and comprehensive studies on economic and related
affairs in all developing countries and regions, including Asia, the Middle East,
Africa, Latin America, Oceania, and Eastern Europe. The views expressed in this publication are those of the author(s). Publication does not imply endorsement by the Institute of Developing Economies of any of the views expressed within.
INSTITUTE OF DEVELOPING ECONOMIES (IDE), JETRO 3-2-2, WAKABA, MIHAMA-KU, CHIBA-SHI CHIBA 261-8545, JAPAN
©2006 by Institute of Developing Economies, JETRO
Abstract Effects of localized personal networks on the choice of search methods are studied in this paper using evidence of displaced workers by establishment closure in Thailand Labor Force Survey, 2001. For the blocks/villages level, there is less significant evidence of local interactions between job-seekers and referrals in developing labor markets. The effects of localized personal networks do not play an important role in the probability of unemployed job-seekers seeking assistance from friends and relatives. Convincing evidence from the data supports the proposition that both self-selection of individual background-like professions and access to large markets determine the choice of job search method.

Are Job Networks Localized in a Developing Economy?
Search Methods for Displaced Workers in Thailand∗
Tomohiro Machikita†
December 27, 2006
Abstract
Effects of localized personal networks on the choice of search methods are studied in this paper using
evidence of displaced workers by establishment closure in Thailand Labor Force Survey, 2001. For the
blocks/villages level, there is less significant evidence of local interactions between job-seekers and referrals
in developing labor markets. The effects of localized personal networks do not play an important role
in the probability of unemployed job-seekers seeking assistance from friends and relatives. Convincing
evidence from the data supports the proposition that both self-selection of individual background-like
professions and access to large markets determine the choice of job search method.
JEL Classification Numbers: C21, J63, J64, O18
Keywords: Local Interactions, Job Search Methods, Referrals, Asymmetric Information, Thailand
∗I am indebted to Kenn Ariga for his generous support, guidence, and encouragement. I would also like to express gratitude
to Yutaka Arimoto, Munetomo Ando, Hiroyuki Chuma, Masa Fujita, Jyunichi Goto, Kazumi Hori, Ryo Itoh, Ryo Kambayashi,
Daiji Kawaguchi, Tatsuya Kikutani, Yuichi Kimura, Kazuharu Kiyono, Miki Kohara, Hisaki Kono, Motonari Kurasawa, Kyosuke
Kurita, Tomoya Matsumoto, Kuramitsu Muramatsu, Sadao Nagaoka, Hisahiro Naito, Jiro Nakamura, Hiroyuki Odagiri, Yoshiaki
Ogura, Isao Ohashi, Fumio Ohtake, Ryo Okui, Chakkrit Pumpaisanchai, Kazuyasu Sakamoto, Masaru Sasaki, Daisuke Shimizu,
Masao Tsuri, Makoto Watanabe, Futoshi Yamauchi, Atsushi Yoshida, and seminar participants at Hitotsubashi University, the
Zushi Labor Conference, Kyoto University, and the Applied Regional Science Conference 2005 at Meikai University for their
discussions. This project would not have been possible without these these insightful discussions in the early stages of writing.
This research was supported by Grant-in-Aid for Young Scientist (No.18730159) of JSPS and a Grant-in-Aid for the 21st Century
COE Program “Interfaces for Advanced Economic Analysis,” Kyoto University and “Research Unit for Statistical Analysis in
Social Sciences,” Hitotsubashi University from the Ministry of Education, Culture, Sports, Science and Technology (MEXT).†Corresponding address: Institute of Developing Economies (IDE-JETRO), 3-2-2 Wakaba, Mihama Chiba 261-8545, JAPAN.
Email: [email protected]. Phone: +81-43-299-9758. Fax: +81-43-299-9763.
1
1 Introduction
Impacts of localized personal networks on individual job search method are studied in this paper. There
are many reasons for studying the role of non-market based interactions on labor market activities: First,
detailed understanding of the role of social networks on search efforts and duration for unemployed job-
seekers is necessary. Second, it is important to identify the effects that individual background and local
attributes have on local-unemployment levels. Third, the identification and estimate of the impact of local
attributes also becomes a difficult issue when workers are sorted between and within local areas. Finally,
there is the open question of what types of job search methods are used among firms and workers. There
is a large body of literatures related to determining the effects of non-market interactions on employment
outcomes. On-the-job search methods for unemployed job-seekers have been studied in work on informal
networks (strong versus weak ties) by Granovetter (1974). Studies comparing employment outcomes between
alternative search methods have been conducted by Holzer (1987), and Holzer (1988). Most recent studies on
effectiveness of internet job searches have been made by Kuhn and Skuterud (2000) and Kuhn and Skuterud
(2004). These contributions have focused on the labor supply behavior of job-seekers. Montgomery (1991)
makes arguments with regard to the screening role of job referrals for firms. Calvo-Armengol and Ioannides
(forthcoming) and Ioannides and Loury (2004) have seminal works on job networks for job-seekers and firms.
Manski (1993) and others point out the difficulties of detecting network effects (or endogenous social effects)
from exogenous effects, local common shocks, and sorting effects. Topa (2001) suggests another approach to
test social interactions on local unemployment using indirect inference methods and a block level data set
of Chicago. Bayer, Ross and Topa (2005) collected individual-level matched data between residential areas
and workplaces at the U.S. block level to test the effects of job referrals. Wahba and Zenou (2005) showed
the positive impact of population density on the probability of choosing personal networks as a job search
method.
There are two empirical issues involved in identifying and estimating local interactions. The first is
the endogenous problem between personal networks and unobserved covariates. Recent studies have sought
to overcome this difficulty by utilizing random assignment or random treatment experiments of reference-
group formation. For example, Sacerdote (2001) and Duflo and Saez (2003) conducted such studies. Another
identification strategy is to use instrumental variables or exogenous sources of variation to choose neigh-
bourhoods. Case and Katz (1991) used information of individual neighbours in neighbourhoods. Bertrand,
Luttmer and Mullainathan (2000) studied the impact of neighbourhood quality and quantity on welfare par-
ticipation using variation in local language groups, Munshi (2003) studied the effects of the old-immigrants
network on employment outcome of new entrants to a destination by using the rainfalls in the area of their.
Munshi and Rosenzweig (2006) assumed that individual ability is independent of quality of the parental
caste networks in the labor market relative to caste institutions in Bombay. They solved the endogenous
problem between unobserved covariates and type of network signal by focusing on the institutional setting
2

in Bombay, India. They found a positive impact of caste networks on schooling and occupation choice of
children.
The second empirical problem is in measuring local interactions. Ichino and Maggi (2000) analyzed the
detection of group-interactions in shirking behavior in a large Italian bank by using panel data of movers and
non-movers. Conley and Udry (2003) collected data of informational neighbourhoods to study the adoption
of new technology. Yamauchi and Tanabe (2006) found that the employment probability for migrants in
the Greater Bangkok Area is affected by the employment status of previous migrants. They controlled for
time-specific common shocks and province of origin-specific shocks that affect employment opportunities of
migrants in urban areas.
This paper provides a simple way to identify and estimate local interactions using experimental evidence
in observational data. Evidence from the choice of job search method among displaced workers is used.
Displaced workers are classified by the reason for displacement from their last job. They are broadly
classified into four types of unemployment based on the reason they entered the unemployment pool: (1)
quitting, (2) being laid-offs, (3) given mandatory retirement, and (4) establishment closure. This paper
focuses on displaced workers due to establishment closure. Abilities seem to be independent of the reason
for displacement within this sample. This is random treatment evidence for the displaced workers due
to establishment closure. The identification strategy of this paper is to utilize this evidence of random
treatment to bypass self-selectivity. Empirically, the causal effects of local interactions on the choice of
job search methods for unemployed job-seekers are examined using the Thailand Labor Force Survey, 2001.
This empirical analysis addresses four testable explanations of search method determination: (1) individual
background, (2) offer arrival rate, (3) local interactions between unemployed job-seekers and referrals, and
(4) the impact of asymmetric information on the job-seekers’ profession.
Major findings may be summarized as follows: First, there are less significant effects of local interactions
on unemployed job-seekers under controlling individual background seeking assistance from friends and
relatives. This result is in contrast to previous studies and a growing literature on the relationship between
labor market outcomes and social interactions. The effects of social interactions on individual employment
opportunity and the outcome have been examined in many labor economic fields. Second, the offer arrival
rate is important for unemployed job-seekers looking for employment through markets. These are measured
by the size of the local labor market. Finally, the effects of profession are also important in seeking assistance
from friends and relatives to save the costs of asymmetric information in markets.
Section 2 of this paper includes a simple framework to derive the following hypotheses: (1) on the condi-
tion of being unemployed, localized job networks decrease the probability of job-seeking in a formal market,
(2) improved means of seeking employment through markets and size of market-participants increases the
probability of seeking employment through markets, (3) the evaluation costs for professionals during the
3

search-matching process decreases the probability of seeking employment through markets. Section 3 con-
tains an overview of the Thailand Labor Force Survey. Section 4 has a discussion of an identification strategy.
Empirical results are presented in section 5 and 6 respectively. Conclusions are in final section.
2 A Model for the Determination of Search Methods
This section explores the search-matching process between unemployed job-seekers and vacancies. A simple
model is proposed for determining search methods in order to derive some testable implications. This model
focuses on the following search methods: (1) seeking employment through markets or (2) seeking assistance
from personal networks (friends and relatives). There are two value functions, one of seeking employment
through markets and the other of getting assistance from ones own personal network. The value of “out of the
labor force” is 0. Focus can then be placed on unemployed job-seekers. The former value of seeking through
markets is given by V Mi and the latter value of seeking assistance from personal networks is given by V N
i .
Asymmetric information regarding job-seekers’ characteristics in markets needs evaluation costs during the
search-matching process. For job-seekers, this cost is described by c. The return from seeking employment
through markets is described by w. This is the wage offered in markets. This paper does not formalize the
wage posting game in each submarket like directed search models. The value of seeking employment through
markets depends on the probability of seeking workers through markets of other vacancies M ∈ [0, 1]. As a
result, the value function of seeking employment through markets is V Mi = M(w − c).
On the other hand, the value of job-seeking assistance from personal networks is formalized by the return
to wage offer (v) and the size of personal ties to referrals (q ∈ [0, 1]). The condition of job matching through
personal networks is assumed to be satisfied with the overlap of job-seekers and vacancies. The probability
of knowing the referrals for job-seekers is q. The probability of knowing the referrals for firms is also q. Job
matching by seeking assistance from friends and relatives requires overlap of referrals for job-seekers and
firms. This overlap is shown by q2 in the model. The value of job-seeking assistance from personal networks
also depends on the probability of meeting with other vacant firms using personal networks (1 − M). The
value function of job-seeking assistance from personal networks is formalized as follows: V Ni = (1−M)q2v.
The only trade off that each job-seeker must face is in the information asymmetry and arrival rate of
offers. In each time period, a job-seeker looks for employment through markets as long as V Mi > V N
i . This
is satisfied with the following equilibrium condition of seeking employment through markets:
Condition 1 c < w − q2v(
1−MM
)= c∗.
The threshold cost of seeking employment through markets is described by c∗. Job-seekers decide to
seek for employment through markets as long as c < c∗. The cutoff point c∗ is an increasing function of
the market-offered wage w and the number of market participants M . This is a decreasing function of
the offered wage through personal networks v, the number of vacancies sought for worker assistance from
4

personal networks (1 − M), and common referrals q2 between job-seekers and firms with vacancies in local
labor markets.
Testable implications may be derived from the above equilibrium conditions. First, the size of the local
labor market (the number of market participants) M has a positive impact on the probability of seeking
employment through markets. Individuals will exhibit a greater frequency to seek for employment through
markets as their job search method of searching if they reside in urban areas where there is a high probability
of meeting other vacancies rather than if they reside in rural areas where there is a low probability of meeting
other vacancies. This may be expressed:
Pr(Nij = 1) = 1 − Pr (Mij = 1) = 1 − Mj .
Second, local interactions between job-seekers and referrals are also an important channel of job-seeking
assistance from personal networks. Individuals will exhibit greater frequency to seek assistance from friends
and relatives if they are assigned in local areas where unemployed job-seekers have higher overlap q2 between
job-seekers and vacancies than if they are assigned in local areas where there is lower overlap. This may be
written as follows:
Pr(Mij = 1) = 1 − q2j .
Finally, the evaluation cost for job-seekers through markets is assumed to be higher for professionals
(P = 1) than non-professionals (P = 0). Individuals will exhibit a greater frequency to seek assistance from
friends and relatives if they have professional occupations. The equilibrium condition of the search method
may be determined as follows: c∗P=1 < c∗P=0.
The probability of seeking employment through markets for non-professional occupations is higher than
that of professional occupation as follows:
Pr(Mij = 1|P = 1) < Pr(Mij = 1|P = 0).
5

3 The Data and Displaced Job-Seekers
3.1 The Thailand Labor Force Survey
The data source used in this paper was the Thailand Labor Force Survey (hereafter LFS) 2001 by the
The National Statistical Office (NSO) of Thailand. The Thailand Labor Force Survey 2001 covers all 76
provinces for the whole Kingdom. The Thailand Labor Force Survey 2001 was conducted on a monthly
basis using a two-stage period. First, the sample selection of blocks/villages was performed separately and
individually in each province. The total monthly sample of blocks/villages was 1,890 from 108,244. Second,
the sample selection of households was performed in each sample block/village. The total number of sample
households selected monthly enumeration was 26,121. This individual data provides rich covariates for
employed workers, unemployed-job seekers, and the out of labor force.
3.2 Reason for Displacement from the Last Job and the Choice of Search Methods
Reasons for displacement important in seeking employment through markets or seeking assistance from
friends and relatives may be seen in Table 1. Displaced workers made so by establishment closure, being fired,
reaching the end of contract, or having quit often seek employment through markets. Those unemployed
due to mandatory retirement seek assistance from personal networks. This is explained by age effects;
older workers are able to accumulate efficient personal networks. This is also explained by the asymmetric
information of job-seekers’ abilities. It is useful for the mandatory retirement sample to avoid information
costs and to seek assistance from personal networks.
6

Table 1: Number and Frequency of Search Methods by Reason for DisplacementNetworks Markets Total
Establishment Closure 77 126 203(38%) (62%)
Being Fired 46 103 149(31%) (69%)
End of Contract 58 136 194(30%) (70%)
Reduce Wage/Welfare 11 23 34(32%) (68%)
Not Satisfied with Wage 86 195 281(31%) (69%)
Mandatory Retirement 333 164 497(67%) (33%)
Other 112 184 296(38%) (62%)
Unknown 4 8 12(33%) (67%)
Total 727 939 1,666(44%) (56%)
Notes: Job search through “Networks” is seeking assistance of friends or relatives. Job search through “Markets” includes (1)newspaper and magazine, (2) radio and TV, (3) checking at a public employment agency, (4) direct application, (5) sendingapplication, and (6) others.
Source: The Thailand Labor Force Survey, 2001. The National Statistical Office, Thailand.
7
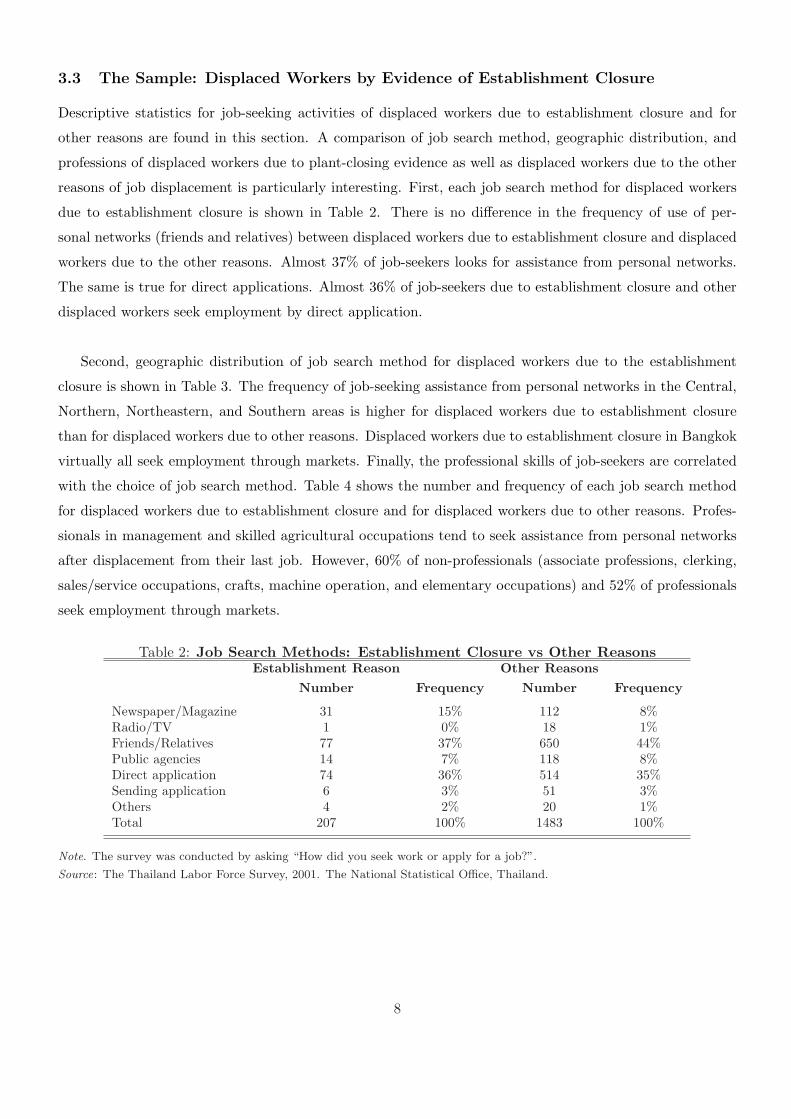
3.3 The Sample: Displaced Workers by Evidence of Establishment Closure
Descriptive statistics for job-seeking activities of displaced workers due to establishment closure and for
other reasons are found in this section. A comparison of job search method, geographic distribution, and
professions of displaced workers due to plant-closing evidence as well as displaced workers due to the other
reasons of job displacement is particularly interesting. First, each job search method for displaced workers
due to establishment closure is shown in Table 2. There is no difference in the frequency of use of per-
sonal networks (friends and relatives) between displaced workers due to establishment closure and displaced
workers due to the other reasons. Almost 37% of job-seekers looks for assistance from personal networks.
The same is true for direct applications. Almost 36% of job-seekers due to establishment closure and other
displaced workers seek employment by direct application.
Second, geographic distribution of job search method for displaced workers due to the establishment
closure is shown in Table 3. The frequency of job-seeking assistance from personal networks in the Central,
Northern, Northeastern, and Southern areas is higher for displaced workers due to establishment closure
than for displaced workers due to other reasons. Displaced workers due to establishment closure in Bangkok
virtually all seek employment through markets. Finally, the professional skills of job-seekers are correlated
with the choice of job search method. Table 4 shows the number and frequency of each job search method
for displaced workers due to establishment closure and for displaced workers due to other reasons. Profes-
sionals in management and skilled agricultural occupations tend to seek assistance from personal networks
after displacement from their last job. However, 60% of non-professionals (associate professions, clerking,
sales/service occupations, crafts, machine operation, and elementary occupations) and 52% of professionals
seek employment through markets.
Table 2: Job Search Methods: Establishment Closure vs Other ReasonsEstablishment Reason Other Reasons
Number Frequency Number Frequency
Newspaper/Magazine 31 15% 112 8%Radio/TV 1 0% 18 1%Friends/Relatives 77 37% 650 44%Public agencies 14 7% 118 8%Direct application 74 36% 514 35%Sending application 6 3% 51 3%Others 4 2% 20 1%Total 207 100% 1483 100%
Note. The survey was conducted by asking “How did you seek work or apply for a job?”.
Source: The Thailand Labor Force Survey, 2001. The National Statistical Office, Thailand.
8

Table 3: Job Search Methods by Region and Reasons for DisplacementEstablishment Reason Other Reasons
Networks Markets Total Networks Markets Total
Bangkok 14 51 65 61 149 210(22%) (78%) (29%) (71%)
Central 15 28 43 101 208 309(35%) (65%) (33%) (67%)
North 15 13 28 120 114 234(54%) (46%) (51%) (49%)
Northeast 20 18 38 264 242 506(53%) (47%) (52%) (48%)
South 13 16 29 104 100 204(45%) (55%) (51%) (49%)
Total 77 126 203 650 813 1,463(38%) (62%) (44%) (56%)
Notes: Job search through “Networks” is seeking assistance of friends or relatives. Job search through “Markets” includes (1)newspaper and magazine, (2) radio and TV, (3) checking at a public employment agency, (4) direct application, (5) sendingapplication, (6) others.
Source: The Thailand Labor Force Survey, 2001. The National Statistical Office, Thailand.
Table 4: Job Search Methods by Profession and Reasons for DisplacementEstablishment Reason Other Reasons
Networks Markets Total Networks Markets Total
Non-Professional 66 114 180 473 687 1,160(37%) (63%) 100% (41%) (59%) (100%)
Professional 11 12 23 177 126 303(48%) (52%) 100% (58%) (42%) 100%
Total 77 126 203 650 813 1,463(38%) (62%) 100% (44%) (56%) 100%
Notes: Job search through “Networks” is seeking assistance of friends or relatives. Job search through “Markets” includes (1)newspaper and magazine, (2) radio and TV, (3) checking at a public employment agency, (4) direct application, (5) sendingapplication, (6) others.
Source: The Thailand Labor Force Survey, 2001. The National Statistical Office, Thailand.
9

4 The Impact of Local Interactions on Choice of Search Methods
4.1 Estimation Methodology
This section includes a description of the estimation methodology that uses evidence of job displacement
due to establishment closure. This is a simpler and novel approach than previous studies that detect
referral effects or local interactions. This paper focuses on experimental evidence of displacement from
the last job. The reason for displacement from the last job captures the exogenous source of variation in
seeking employment in the unemployment pool. Given each level of job referral, displaced workers due to
establishment closure exogenously enter the unemployment pool and seek employment. This is the main
empirical concern of this paper.
The baseline equation is formalized as follows: An indicator of the degree of profession Pij (1 if individual
i was from the professional sample and 0 if individual i was from the non-professionals sample) is introduced
into the baseline equation. It is assumed to be a good proxy of the unobserved search costs through
markets under asymmetric information. Heterogeneity in localized personal networks effects, observable
characteristics are also changed. Focus is placed on the effects of potential size of job referrals on the choice
of search methods. The true model of the probability of seeking employment through markets is specified
as follows:
Pr(Mij = 1) = α + βNij + γXi + ηPi + δ1 (Nij ∗ Xi) + δ2 (Nij ∗ Pi) + ωi (1)
where Mij is an indicator variable for seeking employment and equal to 1 if through markets, equal to 0 if
otherwise (for example, seeking assistance from personal networks). Nij is the geographical neighbourhood
for unemployed job-seeker i. Xi represents individual characteristics, and ωi is the composite of unobserved
individual characteristics and stochastic shock.
The difficulty of estimating localized personal network effects is in the self-selection problem. The
counterfactual outcome cannot be observed. Evidence of displaced workers due to establishment closure
may be used. The average outcome of the treatment-group that has many personal networks may be
compared with the control-group that does not have many personal networks. The key point of this analysis
is that displaced workers due to establishment closure enter the unemployment pool and exogenously decide
whether to seek assistance from personal networks or to seek employment through markets. It is assumed
that the unmeasured component ωi is not correlated with treatment assignments Nij for displaced workers
due to establishment closure. Testable hypotheses may be derived on the above identification condition and
the natural experimental evidence of displaced workers.
Hypothesis 1 On the condition of being unemployed, localized job networks decrease the probability ofjob-seeking in a formal market such that β < 0.
Hypothesis 2 Improved means of seeking employment through markets and the size of market participantsincreases the probability of seeking employment through markets.
10

Hypothesis 3 Evaluation costs for professionals during the search-matching process decreases the proba-bility of seeking employment through markets such that η < 0.
4.2 Baseline Results
To predict the main choice of search method, job search methods were regressed to: (1) the job-seeker
characteristics, (2) the proxy of local interactions between job-seekers and potential referrals, and (3) regional
characteristics. The proxy of local interactions is the number of employed workers who have the same
occupation category and industrial category in the same blocks/villages where job-seekers reside. These
are called localized personal networks. These workers are considered potential referrals for job-seekers in
the same blocks/villages. This proxy should to capture: (1) the effects of information exchange on job
opportunity between employed workers and unemployed job-seekers and (2) the effects of meeting job-
referrals within neighborhood areas. The effect of the meeting rate seems to capture the labor demand in
each block/village. To control for booms or recessions in employment opportunity in each block/village, the
employment rate at the block/village level is used.
The baseline model includes only the measure of local interactions, individual characteristics (such as age,
gender, marital status, and years of education), and regional characteristics. It is estimated in specification
(1) of Table 5. The marginal effects of the independent variables are shown in each column. The proxy
of localized personal networks for unemployed job-seekers raises the probability of seeking assistance from
friends and relatives. By definition, this has negative effects on the probability of seeking employment
through markets. Actually, an increase of one percent in the proxy of localized personal networks does not
raise the probability of seeking employment through markets. When conditions are placed on the meeting
rate, such as potential referrals, labor demand, and other observed characteristics, no significant evidence
is found that localized personal networks determine each search method. A one-percent increase in the
employment rate at the block/village level also does not raise the probability of seeking employment through
markets. This means that the effect of meeting rate with employed workers in each block/village determines
the job-seeking assistance from friends and relatives. Higher levels of education also raise the probability of
seeking employment through markets. Graduating from elementary, upper secondary, and university levels
of education raises the probability of seeking employment through markets by approximately 20, 24 and
35 percent respectively more than the unemployed who have less than elementary levels of education. The
effects of economic geography are also important. Living in the Bangkok Metropolis raises the probability
of seeking employment through markets more than living in the Southern Region. Living in the North
and Northern area has a negative effect on seeking employment through markets. Urbanization of each
block/village does not seem important. These results suggest that the dispersion of search methods at
the regional level (Bangkok, Central, Northern, Northeastern, and Southern) but also at the block/village
level. Local interactions do not lead unemployed job-seekers to seek for employment through markets. A
professional dummy variable has a negative impact of 25 percent on the probability of searching through
11

markets. This suggests that the cost of information asymmetry for professionals reduces the probability of
seeking employment through markets.
The second specification in Table 5 includes more control variables of individual characteristics (size of
the establishment of the last job and the last industry for unemployed job-seekers). These characteristics
are intended to capture individual abilities and preferences for the employment opportunities. The variable
of localized personal network does not show important effects on the probability of seeking employment
through markets. A one-percent increase in employment rate in the block/village level also does not raise
the probability of seeking employment through markets. The meeting rate with other employed workers is
important in seeking assistance from friends and relatives. The main difference in the first specification of
this table is that the effect of professionals becomes less significant on the probability of seeking employment
through markets. The richer set of individual characteristics reduces the effects of the professional occupation
dummy variable. The intercept term is should capture the unobserved characteristics but is not significant
in this specification. The marginal effect of professionals is less significant when the size of establishment
and industry are controlled.
4.3 Heterogeneity
If localized personal networks play an important role in seeking assistance from friends and relatives, the
correlation between the choice of search method for job-seekers and their own localized personal networks
depends on the formation of personal networks for unemployed job-seekers. If the importance of localized
personal networks grows with years of education, profession, and geography, then the formation of private
networks is different among unemployed job-seekers. Checking whether or not this prediction is supported
by the data, the effect of the network appears to vary with job-seekers’ characteristics. These individual
characteristics reflect the sensitivity of localized personal networks to the assistance received from friends
and relatives. Specification (1) of Table 6 reports results of this hypothesis. The proxy of localized personal
networks has a positive impact on the probability of seeking employment through markets. One localized
personal network raises the probability of seeking employment through markets by 5.9 percent. On the
other hand, the employment rate in each block/village (proxy of the effect of labor demand or the effect of
meeting with employed workers) is important for seeking assistance from friends and relatives. The impact
of individual characteristics is similar to former specification (1) without the interaction term. Among
job-seekers in Bangkok, Central, and Northeastern areas, the marginal effect of localized personal networks
on seeking employment through markets is negative and less significant. The marginal effect of localized
personal networks among professional workers is also negative and less significant.
Specification (2) of Table 6 reveals results after controlling for size of last establishment and last industry
for unemployed job-seekers. The main empirical result is that the marginal effect of the employment rate
12

Table 5: Effects of Local Interactions on Seeking through Markets(1) (2)
Variable Coefficient (Std. Err.) Coefficient (Std. Err.)
Local Networks −.011 (.016) .001 (.019)Local Networks (squared) .000 (.000) −.000 (.000)Professionals −.247 (.128) −.191 (.188)Age −.005 (.005) −.007 (.006)Male .015 (.081) −.007 (.095)Married .048 (.080) −.003 (.092)Less than Secondary Level .204 (.099) .205 (.108)Upper Secondary Level .235 (.097) .198 (.116)Diploma and University Level .350 (.080) .313 (.098)Urban Residents −.047 (.095) −.017 (.110)Bangkok Metropolis .270 (.107) .368 (.114)Central .104 (.117) .212 (.125)North −.051 (.140) .043 (.154)Northeast −.112 (.132) −.001 (.154)Size of 5-9 Persons −.143 (.125)Size of over 10 Persons −.071 (.134)Mining and Textiles .233 (.220)Chemical Manufacturing .177 (.255)Electrical Manufacturing .027 (.355)Electricity, Gas, and Construction .200 (.248)Wholesale .219 (.287)Transportation and Finance .377 (.100)Education, Health, Social Work −.172 (.544)Sewage, Refuse Disposal .196 (.282)Employment Rate in Block/Village −3.18 (2.85) −3.455 (3.566)Employment Rate in Block/Village (squared) 2.425 (2.831) 2.607 (3.512)Log likelihood −114.398 −94.884Number of Obs 203 174Adjusted R2 .151 .177
Notes: The dependent variable is the dummy variable of job seeking through markets. A job search through “Networks” isseeking assistance of friends or relatives. A job search through “Markets” includes (1) newspaper/magazine, (2) radio/TV, (3)checking at a public employment agency, (4) direct application, (5) sending application, and (6) others. The lower and upperbound of age is 15 and 65 respectively.
Source: Thailand Labor Force Survey, 2001, The National Statistical Office.
13

(labor demand or meeting rate with employed workers) rises more sharply than specification (1) of Table
6. With regard to the heterogeneity in local interactions; the marginal effects of localized job networks
on seeking assistance from friends and relatives are negative and significant for Northern and Northeastern
residents. The marginal effect of localized job networks among professionals is less significant.
4.4 Robustness Checks: Alternative Measures of Localized Networks
In this section, alternatives for the measure of localized personal networks are demonstrated. There are two
types of alternative measures: (1) the number of workers are in the same occupation category and same
industrial category in a wider area than that of the block/village level, and (2) the number workers who
are in the same education category as unemployed job-seekers. Table 7 shows a clear contrast between the
Probit regression with and the Probit regression without worker characteristics, the size of establishment
for the last job and the last industry. Specification (1) of Model A considers the number of workers who
have the same occupation and industry categories as unemployed job-seekers in the wider geographical level.
The employment ratio in the wider geographical labor market, individual basic characteristics, and local
characteristics may then be added to the control. The localized personal networks in this specification
suggest no correlation between localized job networks and the probability of seeking employment through
markets. There also appears to be no correlation between the estimated employment ratio in the wider level
and seeking employment through markets for unemployed job-seekers. These effects are also captured by
other geographic variables. Specification (2) of Model A reveals that there are less statistically significant
local interactions in the wider level when controlling for the last industry and the size of establishment.
Individual backgrounds of last job and region have more explanatory power for determining the job search
method.
The same is true for Model B, that considers the number of workers who have the same education level in
each block/village as localized personal networks. The estimate of Model B, including the impact of different
levels of education on the probability of seeking employment through markets, does not change either with
or without individual characteristics. There are less significant effects for local interactions by education
level. Evidently, individual characteristics provide the main explanation for seeking employment through
markets.
5 Is This Reflected by No Search Capital for Displaced Workers of Es-tablishment Reason?
Does patience or reduction of search capital for displaced workers by establishment closure affect baseline
estimates? For displaced workers by establishment failures, baseline results indicate no significant evidence
of localization of personal network effects on seeking assistance from friends and relatives. Estimates based
on alternative models also suggest similar results. The natural experiment of displaced workers is useful for
14
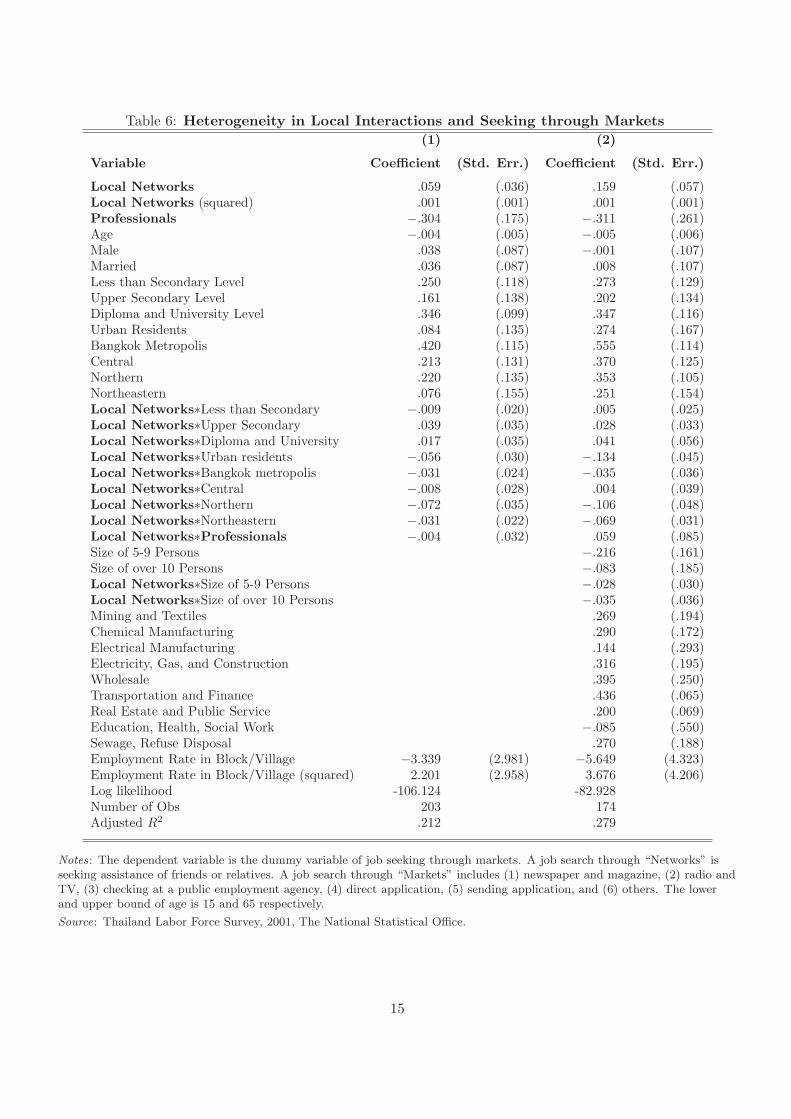
Table 6: Heterogeneity in Local Interactions and Seeking through Markets(1) (2)
Variable Coefficient (Std. Err.) Coefficient (Std. Err.)
Local Networks .059 (.036) .159 (.057)Local Networks (squared) .001 (.001) .001 (.001)Professionals −.304 (.175) −.311 (.261)Age −.004 (.005) −.005 (.006)Male .038 (.087) −.001 (.107)Married .036 (.087) .008 (.107)Less than Secondary Level .250 (.118) .273 (.129)Upper Secondary Level .161 (.138) .202 (.134)Diploma and University Level .346 (.099) .347 (.116)Urban Residents .084 (.135) .274 (.167)Bangkok Metropolis .420 (.115) .555 (.114)Central .213 (.131) .370 (.125)Northern .220 (.135) .353 (.105)Northeastern .076 (.155) .251 (.154)Local Networks∗Less than Secondary −.009 (.020) .005 (.025)Local Networks∗Upper Secondary .039 (.035) .028 (.033)Local Networks∗Diploma and University .017 (.035) .041 (.056)Local Networks∗Urban residents −.056 (.030) −.134 (.045)Local Networks∗Bangkok metropolis −.031 (.024) −.035 (.036)Local Networks∗Central −.008 (.028) .004 (.039)Local Networks∗Northern −.072 (.035) −.106 (.048)Local Networks∗Northeastern −.031 (.022) −.069 (.031)Local Networks∗Professionals −.004 (.032) .059 (.085)Size of 5-9 Persons −.216 (.161)Size of over 10 Persons −.083 (.185)Local Networks∗Size of 5-9 Persons −.028 (.030)Local Networks∗Size of over 10 Persons −.035 (.036)Mining and Textiles .269 (.194)Chemical Manufacturing .290 (.172)Electrical Manufacturing .144 (.293)Electricity, Gas, and Construction .316 (.195)Wholesale .395 (.250)Transportation and Finance .436 (.065)Real Estate and Public Service .200 (.069)Education, Health, Social Work −.085 (.550)Sewage, Refuse Disposal .270 (.188)Employment Rate in Block/Village −3.339 (2.981) −5.649 (4.323)Employment Rate in Block/Village (squared) 2.201 (2.958) 3.676 (4.206)Log likelihood -106.124 -82.928Number of Obs 203 174Adjusted R2 .212 .279
Notes: The dependent variable is the dummy variable of job seeking through markets. A job search through “Networks” isseeking assistance of friends or relatives. A job search through “Markets” includes (1) newspaper and magazine, (2) radio andTV, (3) checking at a public employment agency, (4) direct application, (5) sending application, and (6) others. The lowerand upper bound of age is 15 and 65 respectively.
Source: Thailand Labor Force Survey, 2001, The National Statistical Office.
15

Table 7: Alternative Specifications of Local Interactions and Seeking through Markets(1) (2)
Variable Coefficient (Std. Err.) Coefficient (Std. Err.)
Model A.Networks −.000 (.000) .000 (.000)Professionals −.255 (.125) −.193 (.183)Employment Rate in Area −.787 (1.085) −.620 (1.221)Controls the last industry No YesObs. 203 174Adj. R2 .136 .164
Model B.Networks .004 (.004) .003 (.005)Professionals −.248 (.127) −.165 (.188)Employment Rate in Block/Village −.848 (.432) −.861 (.490)Controls the Last Industry No YesObs. 203 174Adj. R2 .150 .176
Notes: The dependent variable is the dummy variable of job seeking through markets. A job search through “Networks” isseeking assistance of friends or relatives. A job search through “Markets” includes (1) newspaper and magazine, (2) radio andTV, (3) checking at a public employment agency, (4) direct application, (5) sending application, and (6) others. The lower andupper bound of age is 15 and 65 respectively. All models of specification (2) control for the variables of the last job held byunemployed job-seekers. All models control individual and local characteristics. Model A captures the effects of a wider levelof labor markets than the block/village level. Model B captures the effects of each education level in the block/village level.
Source: Thailand Labor Force Survey, 2001, The National Statistical Office.
16

controlling the endogenous problem that exists between the size of ones own personal networks (given by
econometricians) and the unobserved abilities used to determine choice of job search method. Unfortunately,
the experiment has a possibility of reducing search capital through markets for unemployed job-seekers that
have been displaced suddenly for exogenous reasons. If such job-seekers look for employment through
markets, they may have a high probability of meeting other vacant firms. Thus, more patient workers
without search capital, similar to displaced workers due to establishment closure tend to seek employment
through markets to obtain the scale effects of the market. This is a shortcoming in the baseline estimates. To
gain a better estimate, the following null hypothesis was tested to check the robustness of baseline estimates:
Pr(Mij = 1|Xi, Nij , Di = 1) > Pr(Mij = 1|Xi, Nij , Di = 0) (2)
where the establishment failure dummy Di equals 1 if unemployed job-seekers i are displaced by establish-
ment closure (treatment group) and 0 if they have other reasons for displacement (control group). The
whole sample is distinguished by reason for displacement from the last job. These distinctions include:
(1) establishment closure, (2) being fired, (3) quitters, (4) mandatory retirement, and (5) reaching end
of contract. This random treatment evidence is able to capture the effects of impatience in unemployed
job-seekers. They appear to lose search capital with plant-closings. On the other hand, other reasons for
displaced workers, especially voluntarily quitting and mandatory retirement, allow some expectation of the
timing for displacement from the last job. The auxiliary regression equation may be written as follows:
Pr(Mij = 1) = α + φDi + βNij + γXi + ηPi + δ1 (Nij ∗ Xi) + δ2 (Nij ∗ Pi) + ωi. (3)
No difference in the probability of seeking employment through markets due to the reason for displace-
ment from the last job was expected. The coefficient of the establishment failure dummy variable Di was
less significant. Specification (1) of table 8 shows estimates of the establishment failure dummy variable and
does not show any significant impact on the probability of seeking employment through markets any more
than other reasons for displaced workers. It is difficult to say that displaced job-seekers due to establishment
failure raises the probability of seeking employment through markets any more than another sample. This
result shows that there is no patience for the establishment failure sample with the reduction of search
capital to seek a job. Utilizing the whole sample of job-seekers, education and living in the Greater Bangkok
Area or Central Region also both increase the probability of seeking employment through markets.
The estimates of specification (2) in Table 8 also reveal less significant effects on the displaced workers
due to establishment closure (versus other reasons for displaced workers) on the probability of seeking em-
ployment through markets. There does not seem to be any significant evidence of patience for establishment
failure in this demonstration. A worker who has a large personal network and resides in a high employment
area for unemployed job-seekers has no statistically significant effect in specification (2). There is no impact
of local interactions on the possibility of meeting with other agents when individual characteristics, local
characteristics, and the effects of signaling the abilities are controlled. These results show that there is no
17

difference in seeking for employment through markets or seeking assistance from friends and relatives with
given reason of displacement from the last job. Upper education level and living in the Bangkok Metropolis
or Central Region also increase the probability of searching through markets.
Table 8: Effects of the Reason for Displacement on Seeking through Markets(1) (2)
Variable Coefficient (Std. Err.) Coefficient (Std. Err.)
Establishment Reasons .026 (.036) .010 (.042)Networks −.006 (.003) −.005 (.006)Networks (squared) .000 (.000) .000 (.000)Professionals −.110 (.041) −.011 (.062)Age −.002 (.001) −.002 (.002)Male −.023 (.020) −.001 (.032)Married .047 (.024) .072 (.032)Less than Secondary level .110 (.034) .103 (.044)Upper Secondary Level .231 (.029) .231 (.043)Diploma and University Level .362 (.027) .280 (.042)Urban Residents .035 (.023) .016 (.034)Bangkok Metropolis .121 (.033) .138 (.048)Central .131 (.114) .133 (.045)Northern .024 (.035) .048 (.049)Northeastern .041 (.032) .073 (.046)Size of 5-9 Persons −.051 (.045)Size of over 10 Persons .026 (.046)Mining and Textiles .251 (.053)Chemical Manufacturing .241 (.055)Electrical Manufacturing .213 (.061)Electricity, Gas, and Construction .111 (.057)Wholesale .233 (.054)Transportation and Finance .248 (.058)Real estate and Public Service .225 (.082)Education, Health, Social Work .290 (.069)Sewage, Refuse Disposal .158 (.076)Employment Rate in Block/Village −.152 (.578) −.888 (.925)Employment Rate in Block/Village squared .441 (.577) .963 (.911)Log likelihood -1489.7639 -795.82994Number of Obs 2583 1332Adjusted R2 .125 .119
Note: The dependent variable is the dummy variable of job seeking through markets. A job search through “Networks” isseeking assistance of friends or relatives. A job search through “Markets” includes (1) newspaper and magazine, (2) radio andTV, (3) checking at a public employment agency, (4) direct application, (5) sending application, and (6) others. The lowerand upper bound of age is 15 and 65 respectively.
Source: The Thailand Labor Force Survey, 2001. The National Statistical Office, Thailand.
6 Conclusion
Local interactions on the choice of job search method for unemployed job-seekers were tested in this pa-
per. Empirical results may be summarized as follows: First, there appear to be no significant localized
18

personal networks effect on the probability of seeking assistance from friends and relatives when individual
background of the labor market status of the last job is controlled. Background includes establishment
size the last job and the industry of the last job. The effect of the industry of the last job and the type
of profession tend to be consistently significance in the choice of search method. Thus, choice of search
method seems to be determined by individual background and geographical characteristics. It is impor-
tant to discuss the importance of social networks in job-seeking rather than local networks. Of course,
unemployed job-seekers are able to contact friends and relatives who reside in distant area thanks to rising
communication technology in Thailand. It is difficult for econometricians to obtain the values for variables
of the informational neighborhood. It is possible that information technology has the impact of reducing
the cost of communicating with the informational neighborhood. For this reason, communicating with a
localized but different type of job-network from ones own type may cost more than a geographically distant
but similar type of job-network. This has been studied by Rosenblat and Mobius (2004) in terms of rising
Economists’ cooperation between distant geographic areas and similar fields.
Second, there is no evidence of a significant relation between patience and being displaced from the
last job by establishment closure. It is possible that this study sample has no search capital by sudden-
establishment-failure. These workers seem to seek employment through markets to accumulate search capi-
tal. There seems to be no significant difference in the probability of seeking employment through markets
relative to being displaced workers by exogenous reasons or other reasons. Baseline estimates and estimates
of alternative models are confirmed by this auxiliary empirical testing.
19

References
Bayer, Patrick, Steve Ross, and Giorgio Topa, “Place of Work and Place of Residence: Informal
Hiring Networks and Labor Market Outcomes,” NBER Working Paper, 11019, 2005.
Bertrand, Marianne, Erzo Luttmer, and Sendhill Mullainathan, “Network Effects and Welfare
Cultures,” Quarterly Journal of Economics, 2000, 115, 1019–1055.
Calvo-Armengol, Antonio and Yannis Ioannides, “Social Networks in Labor Markets,” The New
Palgrave, A Dictionary of Economics, Second Edition, forthcoming.
Case, Anne C. and Lawrence F. Katz, “The Company You Keep: The Effects of Family and Neigh-
borhood on Disadvantaged Youths,” NBER Working Paper No. 3705 1991.
Conley, Timothy G. and Christopher R. Udry, “Learning about a New Technology: Pineapple in
Ghana,” mimeo 2003.
Duflo, Esther and Emmanuel Saez, “The Role of Information and Social Interactions in Retirement
Plan Decisions: Evidence from a Randomized Experiment,” Quarterly Journal of Economics, 2003, 118,
815–842.
Granovetter, Mark S., Getting a Job: A Study of Contacts and Careers, Harvard University Press,
Cambdrige, MA, 1974.
Holzer, Harry, “Job Search by Employed and Unemployed Youth,” Industrial and Labor Relations Review,
1987, 40, 601–611.
, “Search Method Use by Unemployed Youth,” Journal of Labor Economics, 1988, 6, 1–20.
Ichino, Andrea and Giovanni Maggi, “Work Environment and Individual Background: Explaining
Regional Shirking Differentials in a Large Italian Firm,” Quarterly Journal of Economics, 2000, 115,
1057–1090.
Ioannides, Yannis M. and Linda D. Loury, “Job Information Networks, Neighborhood Effects, and
Inequality,” Journal of Economic Literature, 2004, 42(4), 1056–1093.
Kuhn, Peter and Mikal Skuterud, “Job Search Methods: Internet versus Traditional,” Monthly Labor
Review, 2000, October, 3–11.
and , “Internet Job Search and Unemployment Durations,” American Economic Review, 2004, 94(1),
218–232.
Manski, Charles F., “Identification of Endogenous Social Effects: The Reflection Problem,” Review of
Economic Studies, 1993, 60, 531–542.
20

Montgomery, James D., “Social Networks and Labor-Market Outcomes,” American Economic Review,
1991, 81(5), 1408–1418.
Munshi, Kaivan, “Networks in the Modern Economy: Mexican Migrants in the U.S. Labor Market,”
Quarterly Journal of Economics, 2003, 118, 549–597.
and Mark Rosenzweig, “Traditional Institutions Meet the Modern World: Caste, Gender and School-
ing Choice in a Globalizing Economy,” American Economic Review 96(4), 2006, 96(4), 1225–1252.
Rosenblat, Tanya S. and Markus M. Mobius, “Getting Closer or Drifting Apart?,” Quarterly Journal
of Economics, 2004, pp. 971–1009.
Sacerdote, Bruce, “Peer Effects with Random Assignment: Results for Dartmouth Roommates,” Quar-
terly Journal of Economics, 2001, 116(2), 681–704.
Topa, Giorgio, “Social Interactions, Local Spillovers and Unemployment,” Review of Economic Studies,
2001, 68, 261–295.
Wahba, Jackline and Yves Zenou, “Does density affect social networks in Egypt?,” Journal of Devel-
opment Economics, 2005, 78, 443–473.
Yamauchi, Futoshi and Sekiko Tanabe, “Nonmarket Networks Among Migrants: Evidence from
Metropolitan Bangkok, Thailand,” Forthcoming Journal of Population Economics, 2006.
21

7 Data Appendix
7.1 Summary Statistics of the Whole Sample
Summary statistics for the variables used in the limited sample are presented in Table 9 and Table 10 for unemployedjob-seekers, dropping out of the labor force, and employed workers. The dependent variable in the study is the choiceof search method (network or market) for unemployed job-seekers. This is not available for employed workers. There isno information about on-the-job searches. The explanatory variables in the study are categorized by four hypotheses:(1) individual characteristics, (2) local characteristics, (3) the effects of local interactions, and (4) signaling effects ofunobserved abilities to the firm. These are non-exclusive of each other.
The sample construction of employed persons and unemployed persons is standard in this survey. The definitionof an employed person in this survey is:
• a persons 15 years of age and over who: worked at least one hour during the survey week for wages, profits,dividends, or any other kind of payment
• did not work at all but had regular job, business enterprise or farm from which they were temporarily absent,whether or not they were paid by their employers during their period of absence, provided that in the case ofa temporary closure of the work place, the expectation would be that it would reopen within 30 days from thedate of closure, and they would be recalled to their last job.
• worked for at least one hour without pay in business enterprises or on farms owned or operated by householdheads or members.
The definition of unemployed is a person 15 years of age over who:
• during the survey week did not work even one hour, had no job, business enterprise, or farm of their own, fromwhich they were temporarily absent, but were available for work.
• had been looking for work during the preceding 30 days.
• had not been looking for work because of illness or belief that no suitable work was available, waiting to takeup a new job, or waiting for an agricultural season or other reasons.
The main differences in the individual characteristics of unemployed job-seekers and employed workers are in age,marital status, level of education, and the ratio of professional occupations such as managerial occupations, skilled-agricultural occupations, and electricity industry. The main component of unemployed job-seekers includes unmarriedyouth. This generation acquires higher level of education than elder workers. This generation moves toward beingassociate professionals in white-collar work and positions as craftsman and machine operators in blue-collar work.
To create the measures of local interactions, proxies were implemented based on the employment ratio at theblock/village level and wider area level. First, the employment rate was calculated at the respondent’s block/villagelevel. Second, the employment rate in the respondent’s area level was used. This was suitable to analyze the situationin which local interactions are defined over block/village levels. Finally, the ratio of each level of education amongthe population in the block/village level was used: (1) diploma and university level, (2) upper secondary level, (3)elementary and lower secondary, and (4) less than elementary educated.
Unemployed job-seekers are concentrating in the Bangkok Metropolis. Approximately 16% of unemployed job-seekers locates here while 5.6% of employed workers locate in the Bangkok Metropolis. This difference suggests thatunemployed job-seekers migrate to highly concentrated areas to seek jobs. Table 10 implies that they also leave theagricultural neighborhood. They are also more likely than employed workers to locate in the block/village (area)where there is high income and high income dispersion.
Summary statistics for the variables of unemployed-job seekers and non-participants in the labor force are alsopresented in Table 9 and Table 10. The former shows the mean and standard deviation of individual characteristics forunemployed job-seekers and non-participants. The latter shows the mean and standard deviation of local characteristicsand the measure of local interaction in the block/village for unemployed job-seekers and non-participants. Themain differences between unemployed job-seekers and non-participants are represented in occupational structure andresidential area. Drop-outs exhibit the tendency to have skilled-agricultural positions, elementary occupations, and
22

places in the agricultural industry as their last job. Drop-outs also concentrate in the Bangkok area. Their neighborsalso work in the agricultural sector and have lower education levels. This represents cohort effects. Older displacedworkers tend to have agricultural jobs and live in rural area.
7.2 Displaced Workers by Establishment Reasons
The summary statistics of the sample used to estimate the regression equation are described following Tables 11 and12 respectively. The evidence of establishment closing is assumed to be natural field experiments in the observationaldata. The experiments provide consistent estimates of network effects on the choice of job search method in theobservational data. The assumption to estimate network effects is that evidence as plant closings is an exogenousreason for entering the unemployment pool. Displaced job-seekers due to establishment closure (treatment group)and other reasons for being displaced job-seekers (control group) were compared to find the characteristics of thesample for statistical inference. Main differences between treatment and control are in (1) age, (2) skilled-agricultureoccupations, (3) sales and service occupations, (4) machine operators occupations, (4) elementary occupations, (5)agricultural occupations, (6) transportation and finance occupations, (7) wholesale occupations, (8) residents in theBangkok Metropolis, (9) residents in Northeastern area, and regions relate to agricultural occupation. The evidenceof plant closings concentrates in more populated area like the Bangkok metropolitan areas. These closings includetransportation/finance/wholesale industry, and especially, sales/service/machine operators occupations than and aremore responsible for job displacement than other reasons.
7.3 Search Methods among Displaced Job-Seekers
In order to construct a sample for empirical study, the data of unemployed persons in the LFS, 2001 are used. Thesample is restricted to 2616 unemployed job-seekers in the survey. LFS, 2001 contained many suitable variables ofjob-seeking activities of the unemployed and the individual work history related to their last job. This paper focusedon two unique variables: (1) the job search method of unemployed job-seekers and (2) the reason for displacementfrom the last job. Table 13 shows the number and frequency of job search methods. The main methods are jobreferrals (that is, job networks of friends and relatives) and direct application. Approximately 37% of unemployedjob-seekers uses their own job-networks. Approximately 36% of unemployed job-seekers makes direct application toeach establishment. The two polar activities are based on networks and formal markets respectively. The importanceof public job agencies for unemployed job-seekers is quite low in this survey.
7.4 Geographic Distribution of Job Search Methods
The focus was placed on the Greater Bangkok Area and whole Kingdom of Thailand. Bangkok Area is where workersand job-seekers are able to come to the central area. The geographic distribution of job search methods is providedin Table 14. Using newspaper and magazine is prevalent in the Bangkok Metropolis and Central Region. This isnot true for northern, northeastern, and southern regions. The frequency of using job-networks is greater in therural regions than in urbanized regions. Searching through public job-agencies is a minor method for all regions,especially the Bangkok Metropolis. Direct application and sending applications are not too different among regions.This geographic variation of job search methods seems to determine individual job-seeking activity. A simple modelwas built to focus on the accessibility of the large market.
7.5 Aggregate Patterns of the Choice of Job Search Method
Aggregate patterns to determine job search method among unemployed job-seekers were addressed by: (1) region, (2)gender, (3) level of education, (4) age, (5) the last occupation for unemployed, (6) the last industry for unemployed,and (7) the size of the last establishment for unemployed. Table 15 demonstrates an intuitive summary of jobsearch methods by region. There is a clear contrast among the frequency of job search methods between regions.Unemployed job-seekers choosing job searches through the market concentrate in the Bangkok Metropolis and CentralArea. Over 70% of population choose market searches. On the other hand, unemployed job-seekers residing inNorthern, Northeastern, and Southern area have more tendency to choose job-searching through networks than dometropolitan residents.
The gender difference is just reflected by the difference of occupational (industry) choice between males andfemales in Table 16. Male unemployed choose network-based hiring occupation (industries), and females choosemarket-oriented hiring occupation (industries).
23

Table 9: Summary Statistics for Unemployed Job-Seekers, Drop-Outs and EmployedJob-Seekers Drop-Outs Employed
Variable Mean Std. Dev. Mean Std. Dev. Mean Std. Dev.
Age 27.774 9.15 31.58 11.853 38.265 11.616Male 0.563 0.496 0.513 0.5 0.514 0.5Married 0.345 0.475 0.51 0.5 0.72 0.449Less than Elementary Level 0.157 0.364 0.341 0.474 0.423 0.494Less than Lower Secondary Level 0.373 0.484 0.434 0.496 0.306 0.461Upper Secondary Level 0.174 0.379 0.116 0.32 0.111 0.314Diploma and University Level 0.294 0.456 0.109 0.312 0.158 0.364Size of Less than 4 Persons 0.142 0.349 0.189 0.392 0.269 0.444Size of 5-9 Persons 0.351 0.477 0.392 0.488 0.219 0.414Size of over 10 Persons 0.508 0.5 0.418 0.493 0.512 0.5Managers 0.022 0.146 0.011 0.105 0.087 0.281Professionals 0.036 0.187 0.012 0.11 0.064 0.245Associate Professionals 0.073 0.26 0.027 0.163 0.045 0.208Clerks 0.084 0.277 0.032 0.175 0.042 0.201Sales and Service 0.132 0.339 0.08 0.272 0.185 0.388Skilled-Agriculture 0.14 0.347 0.4 0.49 0.265 0.441Craftman 0.203 0.402 0.146 0.353 0.115 0.319Machine Oprators 0.124 0.33 0.073 0.261 0.076 0.265Elementary Occupations 0.187 0.39 0.218 0.413 0.121 0.326Agriculture 0.196 0.397 0.505 0.5 0.305 0.46Mining and Textiles 0.094 0.291 0.058 0.234 0.073 0.26Chemical Manufacturing 0.065 0.247 0.039 0.193 0.043 0.204Electorical Manufacturing 0.059 0.235 0.03 0.171 0.027 0.163Electricity, Gas, Water 0.18 0.384 0.139 0.346 0.055 0.228Wholesale 0.245 0.43 0.135 0.342 0.276 0.447Transportation and Finance 0.056 0.229 0.032 0.175 0.043 0.203Real estate and Public Service 0.041 0.199 0.022 0.146 0.067 0.25Education and Health Service 0.034 0.182 0.015 0.122 0.075 0.264Sewage and Refuse Diposal 0.03 0.171 0.026 0.158 0.035 0.183
Notes: Data is composed of all males and females between 15 and 65 years of age in 2001. The size of establishment,occupation, and industry for the unemployed job-seekers are coded by their last job. The definition of unemployed job-seekersis (1) persons 15 years of age and over who during the survey week did not work even for one hour, had no jobs, businessenterprises, or farms of their own, from which they were temporarily absent, but were available for work: (2) those who hadbeen looking for work, during the preceding 30 days: and (3) those who had not been looking for work because of illness orbelief that no suitable work was available, waiting to take up a new job, waiting for agricultural season or other reasons.
Source: The Thailand Labor Force Survey, 2001. The National Statistical Office, Thailand.
24

Table 10: Summary Statistics for Unemployed Job-Seekers, Drop-Outs, and EmployedJob-Seekers Drop-Outs Employed
Variable Mean Std. Dev. Mean Std. Dev. Mean Std. Dev.
Urban Residents 0.692 0.462 0.552 0.497 0.625 0.484Bangkok Metropolis 0.163 0.369 0.041 0.198 0.056 0.231Central 0.26 0.439 0.179 0.383 0.304 0.46Northern 0.153 0.36 0.185 0.388 0.22 0.414Northeastern 0.277 0.447 0.497 0.5 0.245 0.43Southern 0.147 0.354 0.098 0.297 0.174 0.379
# of Populations 121.221 27.189 126.296 25.143 119.324 27.589# of Workers 56.915 15.551 55.266 14.829 60.583 17.489# of Agricultural Workers 15.105 18.105 26.914 21.716 20.56 21.443# of Diploma and University Level 12.185 11.59 8.161 9.316 10.424 10.571# of Upper Secondary Level 12.006 9.195 8.404 7.664 10.182 8.549# of Elementary Level 29.534 10.287 30.248 10.333 28.338 11.718# of Less than Elementary Level 38.902 17.727 46.614 16.137 41.355 17.69
Employment Rate in Block/Village 0.477 0.104 0.444 0.104 0.514 0.097Employment Rate in Area∗ 0.495 0.054 0.472 0.057 0.514 0.097Employment Rate of Agriculture 0.119 0.14 0.207 0.161 0.166 0.169% of Diploma and University Level 0.105 0.098 0.069 0.081 0.093 0.096% of Upper Secondary Level 0.102 0.072 0.069 0.061 0.088 0.067% of Elementary Level 0.246 0.078 0.239 0.065 0.238 0.074% of Less than Elementary Level 0.316 0.124 0.367 0.111 0.343 0.126Average of Monthly Wages 1951.815 1635.103 1233.019 1273.334 1674.984 1550.81Average of Monthly Income 2234.999 1934.216 1384.646 1487.668 1904.377 1867.015Std. dev of Monthly Wages 3958.659 2848.159 2838.256 2272.665 3491.224 2568.966Std. dev of Monthly Income 4519.728 3652.405 3160.266 2632.854 3944.62 3372.351Average of Monthly Wages (area)∗ 1958.137 1171.104 1356.635 911.159 1631.689 937.72Average of Monthly Income (area)∗ 2238.718 1393.904 1526.297 1074.629 1848.098 1115.601Std. dev of Monthly Wages (area)∗ 4740.078 2255.052 3661.045 1699.16 4087.364 1762.831Std. dev of Monthly Income (area)∗ 5614.672 3144.29 4185.194 2287.855 4737.804 2457.952Less than 1 Months 0.17 0.376 0.174 0.3791-2.9 Months 0.268 0.443 0.366 0.4823-5.9 Months 0.254 0.436 0.257 0.4376-8.9 Months 0.076 0.265 0.047 0.2129-11.9 ¡onths 0.029 0.168 0.014 0.116More than 11.9 Months 0.195 0.396 0.137 0.344
Notes: ∗ relates to statistics at the area level. The remaining variables were calculated at the block/village level.
Source: The Thailand Labor Force Survey, 2001. The National Statistical Office, Thailand.
25

Table 11: Summary Statistics for Unemployed Job-Seekers by Reason for DisplacementEstablishment Reasons Other Reasons
Variable Mean Std. Dev. Mean Std. Dev.
Age 33.014 9.013 27.323 9.022Male 0.618 0.487 0.558 0.497Married 0.531 0.5 0.329 0.47Less than Elementary Level 0.246 0.432 0.15 0.357Less than Lower Secondary Level 0.411 0.493 0.37 0.483Upper Secondary Level 0.13 0.338 0.178 0.382Diploma and University Level 0.213 0.41 0.301 0.459Size of Less than 4 Persons 0.172 0.379 0.137 0.344Size of 5-9 Persons 0.356 0.48 0.35 0.477Size of over 10 Persons 0.472 0.501 0.513 0.5Managers 0.048 0.215 0.018 0.134Professionals 0.039 0.193 0.036 0.186Associate Professionals 0.068 0.252 0.074 0.261Clerks 0.101 0.303 0.081 0.273Sales and Service 0.217 0.413 0.12 0.325Skilled-Agriculture 0.029 0.168 0.155 0.362Craftman 0.203 0.403 0.203 0.402Machine Oprators 0.169 0.376 0.118 0.323Elementary Occupations 0.126 0.332 0.195 0.396Agriculture 0.039 0.193 0.218 0.413Mining and Textiles 0.097 0.296 0.093 0.291Chemical Manufacturing 0.082 0.275 0.063 0.243Electorical Manufacturing 0.043 0.204 0.061 0.239Electricity, Gas, Water 0.159 0.367 0.182 0.386Wholesale 0.396 0.49 0.224 0.417Transportation and Finance 0.111 0.315 0.048 0.214Real estate and Public Service 0.034 0.181 0.043 0.202Education and Health Service 0.014 0.12 0.037 0.189Sewage and Refuse Disposal 0.024 0.154 0.031 0.174
Notes: Data is composed of all males and females between 15 and 65 years of age in 2001. The size of establishment,occupation, and industry for the unemployed job-seekers are coded by their last job. The definition of unemployed job-seekersis (1) persons 15 years of age and over who during the survey week did not work even for one hour, had no jobs, businessenterprises, or farms of their own, from which they were temporarily absent, but were available for work: (2) those who hadbeen looking for work, during the preceding 30 days: and (3) those who had not been looking for work because of illness orbelief that no suitable work was available, waiting to take up a new job, waiting for agricultural season or other reasons.
Source: The Thailand Labor Force Survey, 2001. The National Statistical Office, Thailand.
26

Table 12: Summary Statistics for Unemployed Job-Seekers by Reason for DisplacementEstablishment Reasons Other Reasons
Variable Mean Std. Dev. Mean Std. Dev.
Urban Residents 0.792 0.407 0.683 0.465Bangkok Metropolis 0.329 0.471 0.148 0.355Central 0.208 0.407 0.265 0.441Northern 0.135 0.343 0.155 0.362Northeastern 0.188 0.392 0.284 0.451Southern 0.14 0.348 0.148 0.355
# of Populations 119.841 26.061 121.34 27.286# of Workers 57.884 14.328 56.832 15.652# of Agricultural Workers 9.097 14.147 15.622 18.316# of diploma and University Level 14.034 10.938 12.026 11.633# of Upper Secondary Level 13.473 7.677 11.88 9.304# of Elementary Level 29.599 10.879 29.529 10.237# of Less than Elementary Level 34.531 16.154 39.278 17.809
Employment Rate in Block/Village 0.489 0.095 0.476 0.105Employment Rate in Area∗ 0.508 0.05 0.494 0.055Employment Rate of Agriculture 0.07 0.108 0.124 0.142% of Diploma and University Level 0.123 0.1 0.103 0.098% of Upper Secondary Level 0.117 0.071 0.101 0.072% of Elementary Level 0.247 0.075 0.246 0.078% of Less than Elementary Level 0.283 0.112 0.319 0.125Average of Monthly Wages 2356.906 1766.908 1916.977 1618.934Average of Monthly Income 2694.063 2062.372 2195.52 1918.125Std. dev of Monthly Wages 4652.544 3142.608 3898.985 2814.136Std. dev of Monthly Income 5245.93 3615.408 4457.275 3649.57Average of Monthly Wages (area)∗ 2407.34 1270.95 1919.506 1154.264Average of Monthly Income (area)∗ 2764.444 1516.903 2193.507 1373.79Std. dev of Monthly Wages (area)∗ 5647.384 2537.317 4662.051 2212.384Std. dev of Monthly Income (area)∗ 6834.977 3557.184 5509.727 3084.578Less than 1 Months 0.087 0.282 0.182 0.3861-2.9 Months 0.188 0.392 0.279 0.4493-5.9 Months 0.246 0.432 0.255 0.4366-8.9 Months 0.087 0.282 0.074 0.2629-11.9 Months 0.034 0.181 0.028 0.166More than 11.9 Months 0.348 0.477 0.174 0.379
Notes: ∗ relates to statistics at the area level. The remaining variables were calculated at the block/village level.
Source: The Thailand Labor Force Survey, 2001. The National Statistical Office, Thailand.
27

Table 13: Job Search Method and FrequencyWhole Sample With Reason for Unemployment
Number Frequency Number Frequency
Newspaper/Magazine 308 12% 143 8%Radio/TV 38 1% 19 1%Friends/Relatives 957 37% 727 43%Public Agencies 243 9% 132 8%Direct Application 939 36% 588 35%Sending Application 100 4% 57 3%Others 30 1% 24 1%Unknown 1 0% 0 0%Total 2,616 100% 1690 100%
Note. The survey was conducted by asking “How did you seek work or apply for a job?”. The potential answers wereNewspaper/Magazine, Radio/TV, Seeking assistance of friends or relatives, Checking at a public employment agency, Directapplication, Sending application, and Others.
Source: The Thailand Labor Force Survey, 2001. The National Statistical Office, Thailand.
Table 14: Number and Frequency of Search Methods by RegionNewspaper Radio Friends Public Direct Sending Others Unknown Total
Bangkok 146 4 104 19 132 12 8 0 425(34%) (1%) (24%) (4%) (31%) (3%) (2%) (0%)
Central 75 3 186 71 304 34 7 1 681(11%) (0%) (27%) (10%) (45%) (5%) (1%) (0%)
North 25 6 170 42 140 17 1 0 401(6%) (1%) (42%) (10%) (35%) (4%) (0%) (0%)
Northeast 44 12 339 62 233 27 7 0 724(6%) (2%) (47%) (9%) (32%) (4%) (1%) (0%)
South 18 13 158 49 130 10 7 0 385(5%) (3%) (41%) (13%) (34%) (3%) (2%) (0%)
Total 308 38 957 243 939 100 30 1 2,616(12%) (1%) (37%) (9%) (36%) (4%) (1%) (0%)
Notes: A job search through “Networks” is seeking assistance of friends or relatives. A job search through “Markets” includes(1) newspaper and magazine, (2) radio and TV, (3) checking at a public employment agency, (4) direct application, (5)sending application, and (6) others.
Source: The Thailand Labor Force Survey, 2001. The National Statistical Office, Thailand.
28

Table 15: Number and Frequency of Search Methods by RegionNetworks Markets Total
Bangkok metropolis 104 313 417(25%) (75%)
Central 186 487 673(28%) (72%)
North 170 230 400(43%) (57%)
Northeast 339 378 717(47%) (53%)
South 158 220 378(42%) (58%)
Total 957 1,628 2,585(37%) (63%)
Notes: A job search through “Networks” is seeking assistance of friends or relatives. A job search through “Markets” includes(1) newspaper and magazine, (2) radio and TV, (3) checking at a public employment agency, (4) direct application, (5)sending application, and (6) others.
Source: The Thailand Labor Force Survey, 2001. The National Statistical Office, Thailand.
Table 16: Number and Frequency of Search Methods by GenderNetworks Markets Total
Female 378 753 1,131(33%) (67%)
Male 579 875 1,454(40%) (60%)
Total 957 1,628 2,585(37%) (63%)
Notes: A job search through “Networks” is seeking assistance of friends or relatives. A job search through “Markets” includes(1) newspaper and magazine, (2) radio and TV, (3) checking at a public employment agency, (4) direct application, (5)sending application, and (6) others.
Source: The Thailand Labor Force Survey, 2001. The National Statistical Office, Thailand.
29

Table 17 demonstrates very clear contrast between the unemployed who have less than elementary levels of edu-cation and the unemployed who have upper secondary levels of education. Over 60% of the lower educated choose tosearch through their own networks while over 70% of the higher educated go to market. Male unemployed tend toseek jobs by network. Females tend to seek jobs through market searches.
Table 17: Number and Frequency of Search Methods by EducationNetworks Markets Total
Less than Elementary Level 256 149 405(63%) (37%)
Less than Secondary Level 450 517 967(47%) (53%)
Upper Secondary Level 129 324 453(28%) (72%)
Diploma and University Level 122 634 756(16%) (84%)
Total 957 1,624 2,581(37%) (63%)
Notes: The term “Less than Elementary Level” can be defined as a person of no education or less than elementarily leveleducation. The term “Less than Secondary Level” can be defined as a person of elementary and lower secondary leveleducation. The term “Upper Secondary Level” is to refer to education levels of general and academic, vocational, and teachertraining. We use the term “Diploma and University Level” refers to education levels of academic, higher technical education,and teacher training.A job search through “Networks” is seeking assistance of friends or relatives. A job search through “Markets” includes (1)newspaper and magazine, (2) radio and TV, (3) checking at a public employment agency, (4) direct application, (5) sendingapplication, and (6) others.
Source: The Thailand Labor Force Survey, 2001. The National Statistical Office, Thailand.
Table 18 presents the number and frequency of choosing a job search method by age group in 2001. Young job-seekers tend to go to market except for the group less than 15 years of age. On the other hand, middle and old agedjob-seekers tend to use networks. Apparently, middle and old aged-job seekers accumulate their own job-networks andselect efficient networks through the length of labor market activity.
Evidence of the difference of job search method by unemployed seeker’s last occupation may be seen in Table 19.Skilled-agricultural workers and elementary workers tend to use networks. Search methods for managers, professionals,and associate professionals concentrate in the market. However, managers use more networks than professionals andassociate professionals. Clerks, service workers, and craftsmen go to the market.
Table 20 shows the pattern of search method by last industry. Unemployed job-seekers who belong to agriculture,electricity, gas and construction based industries use networks. On the other hand, unemployed searchers belonging toeducation, health, real estate; public administration, transport and financial intermediation, and electrical manufac-turing industries tend to go to market. There appears to be a large difference of firm vacancy-posting costs betweenindustries. This difference may be due to the difference of search costs among job-seekers who have different abilities.
Table 21 shows evidence of the difference of search methods by size of the establishment to which unemployedjob-seeker’s belonged. Unemployed who have been in the very small (less than 4 persons) and small (5 to 9 persons)size of establishment tend to use networks. Unemployed who belonged to firm size of more than 10 persons go tomarket. This may be interpreted by firm search activity and individual abilities. Assume that small firms tend touse networks to reduce hiring costs. If the unemployed would like to find a job in a small firm, they tend to usejob-networks that are connected to small firms. This explanation is reflected by the characteristics of firm’s searchactivity. Establishment size is also a proxy of individual abilities. If a larger size establishment posts a vacancythrough markets and gathers many applications to find a very able workers, then only very able workers enter it. Itis safe to say that there is a correlation between abilities and the size of establishment.
30
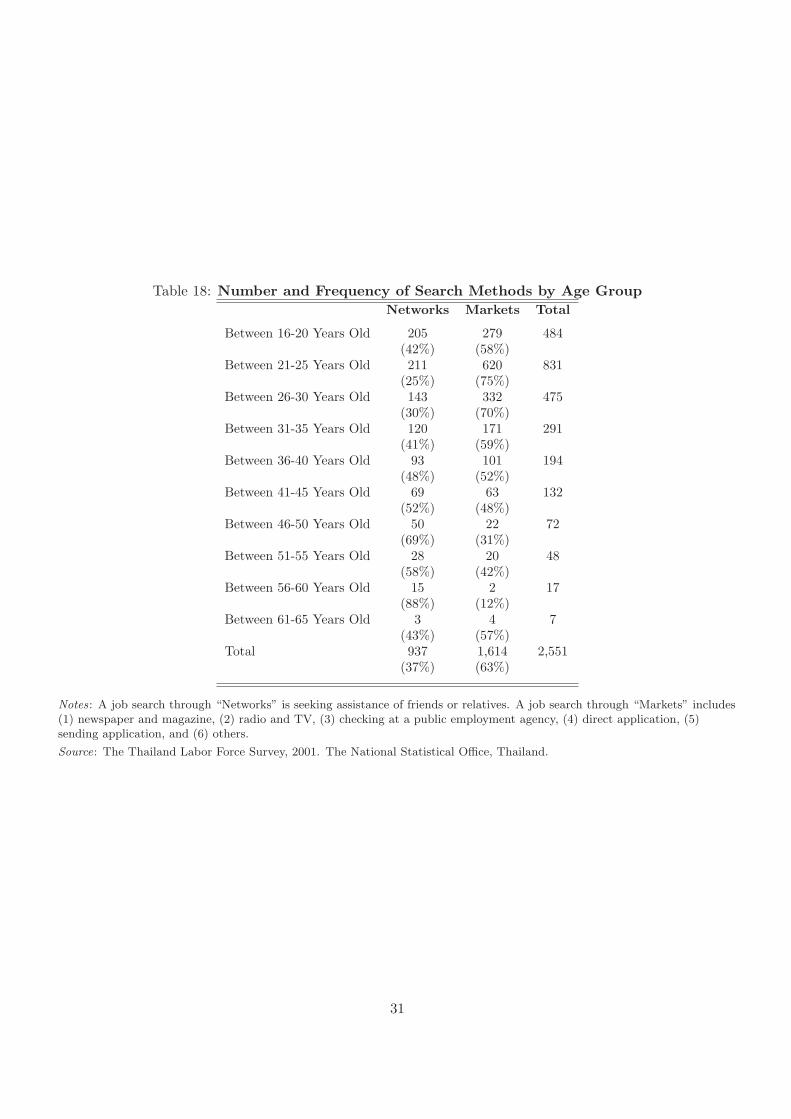
Table 18: Number and Frequency of Search Methods by Age GroupNetworks Markets Total
Between 16-20 Years Old 205 279 484(42%) (58%)
Between 21-25 Years Old 211 620 831(25%) (75%)
Between 26-30 Years Old 143 332 475(30%) (70%)
Between 31-35 Years Old 120 171 291(41%) (59%)
Between 36-40 Years Old 93 101 194(48%) (52%)
Between 41-45 Years Old 69 63 132(52%) (48%)
Between 46-50 Years Old 50 22 72(69%) (31%)
Between 51-55 Years Old 28 20 48(58%) (42%)
Between 56-60 Years Old 15 2 17(88%) (12%)
Between 61-65 Years Old 3 4 7(43%) (57%)
Total 937 1,614 2,551(37%) (63%)
Notes: A job search through “Networks” is seeking assistance of friends or relatives. A job search through “Markets” includes(1) newspaper and magazine, (2) radio and TV, (3) checking at a public employment agency, (4) direct application, (5)sending application, and (6) others.
Source: The Thailand Labor Force Survey, 2001. The National Statistical Office, Thailand.
31

Table 19: Number and Frequency of Search Methods by Last OccupationNetworks Markets Total
Managers 13 22 35(37%) (63%)
Professionals 17 42 59(29%) (71%)
Associate Professionals 24 97 121(20%) (80%)
Clerks 23 118 141(16%) (84%)
Service and Sales 93 126 219(42%) (58%)
Skilled-Agricultural Workers 158 74 232(68%) (32%)
Craftsmen 158 182 340(46%) (54%)
Machine Operators 63 146 209(30%) (70%)
Elementary Occupations 178 132 310(57%) (43%)
Total 727 939 1,666(44%) (56%)
Notes: Managers refer to (1) legislators, senior officials, (2) corporate managers, and (3) general managers. Professionals referto (1) physical, mathematical, and engineering science professionals, (2) life and health science professionals, and (3) teachingand other professionals. Associate professionals refer to associate job of Professionals. Elementary occupations refer to (1)sales and service elementary occupations, (2) agricultural, fishery, and related laborers, and (3) laborers in mining,construction, and manufacturing. A job search through “Networks” is seeking assistance of friends or relatives. A job searchthrough “Markets” includes (1) newspaper and magazine, (2) radio and TV, (3) checking at a public employment agency, (4)direct application, (5) sending application, and (6) others.
Source: The Thailand Labor Force Survey, 2001. The National Statistical Office, Thailand.
32
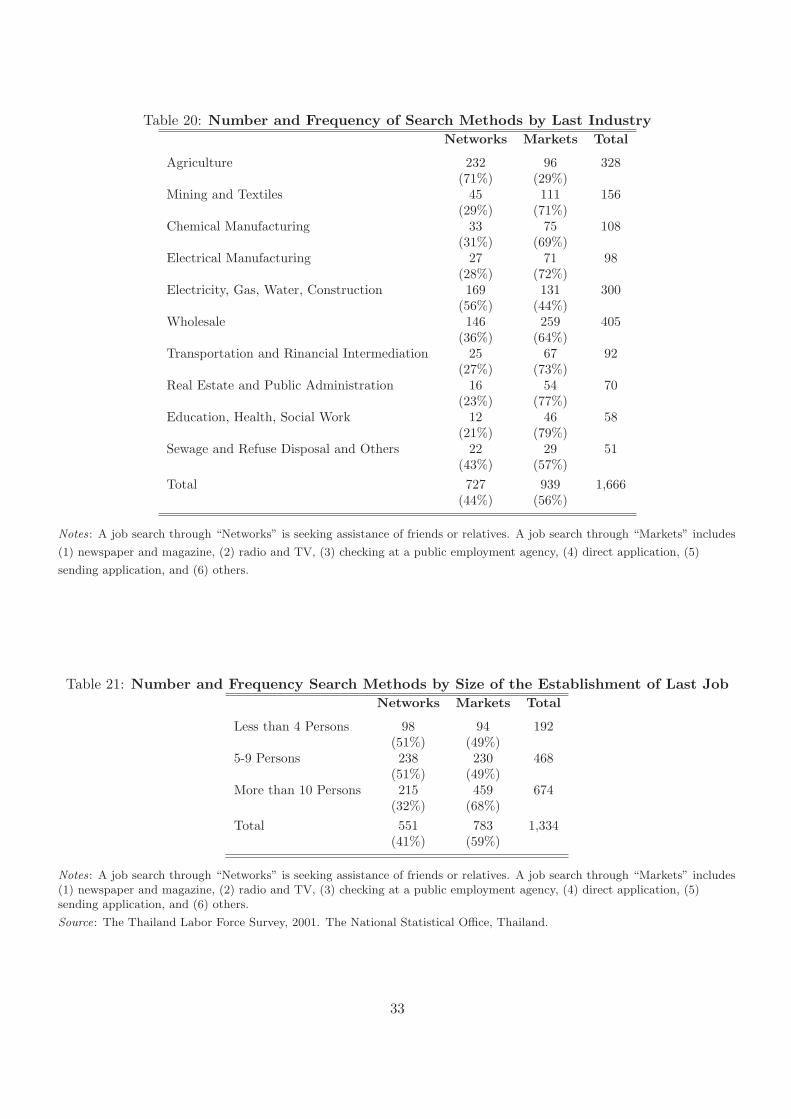
Table 20: Number and Frequency of Search Methods by Last IndustryNetworks Markets Total
Agriculture 232 96 328(71%) (29%)
Mining and Textiles 45 111 156(29%) (71%)
Chemical Manufacturing 33 75 108(31%) (69%)
Electrical Manufacturing 27 71 98(28%) (72%)
Electricity, Gas, Water, Construction 169 131 300(56%) (44%)
Wholesale 146 259 405(36%) (64%)
Transportation and Rinancial Intermediation 25 67 92(27%) (73%)
Real Estate and Public Administration 16 54 70(23%) (77%)
Education, Health, Social Work 12 46 58(21%) (79%)
Sewage and Refuse Disposal and Others 22 29 51(43%) (57%)
Total 727 939 1,666(44%) (56%)
Notes: A job search through “Networks” is seeking assistance of friends or relatives. A job search through “Markets” includes
(1) newspaper and magazine, (2) radio and TV, (3) checking at a public employment agency, (4) direct application, (5)
sending application, and (6) others.
Table 21: Number and Frequency Search Methods by Size of the Establishment of Last JobNetworks Markets Total
Less than 4 Persons 98 94 192(51%) (49%)
5-9 Persons 238 230 468(51%) (49%)
More than 10 Persons 215 459 674(32%) (68%)
Total 551 783 1,334(41%) (59%)
Notes: A job search through “Networks” is seeking assistance of friends or relatives. A job search through “Markets” includes(1) newspaper and magazine, (2) radio and TV, (3) checking at a public employment agency, (4) direct application, (5)sending application, and (6) others.
Source: The Thailand Labor Force Survey, 2001. The National Statistical Office, Thailand.
33