are nanostructured lipid carrier are better then solid lipid nanoparticles
TRANSCRIPT
Are nanostructured lipid carriers (NLCs) better than solid lipid nanoparticles(SLNs): Development, characterizations and comparative evaluations of clotrimazole-loaded SLNs and NLCs?
Presented by
Devendra singh

Contents
Introduction.
Material and methods.
Characterization.
Result and discussion.
Conclusion.
Introduction
From the recent past, biocompatible lipids have been attracting the attention of the formulation
scientists as carriers for the delivery of poorly soluble drugs (Pouton, 2006).
Among biocompatible lipids, lipid nanoparticle formulations with solid matrix have gained huge
popularity.
Generally, there are two types of lipid nanoparticles with solid matrix, solid lipid nanoparticles (SLNs)
and nanostructured lipid carriers (NLCs) (Das and Chaudhury, 2011).
Theses nanoparticles can be widely applied to deliver drugs/actives through oral, parenteral and
topical routes (Almeida and Souto, 2007; Das and Souto, 2007.
However, the current focus of the SLNs and NLCs research is more inclined towards topical
(especially dermal) application both in pharmaceutical and cosmetic purposes (Pardeike et al., 2009).

SLNs are beneficial in many aspects such as:
possess negligible toxicity.
lipophilic compounds can be easily encapsulated.
bioavailability of highly lipophilic molecules can be increased via lymphatic uptake.
degradation of chemical/moisture/light/oxidation sensitive molecules can be
prevented by their incorporation in the nanoparticle matrix.
sustained drug release from the nanoparticle matrix is possible due to solid nature of
the matrix leading to prolonged drug release.
penetration through skin or mucus barrier is possible due to nano size.
drawbacks of SLNs
polymorphic transitions of the lipid may occur with time due to the crystalline
structure of solid lipid (Müller et al., 2002).
Lipid crystallizes in high-energetic lipid modifications, α and β immediately after
preparation of SLNs.
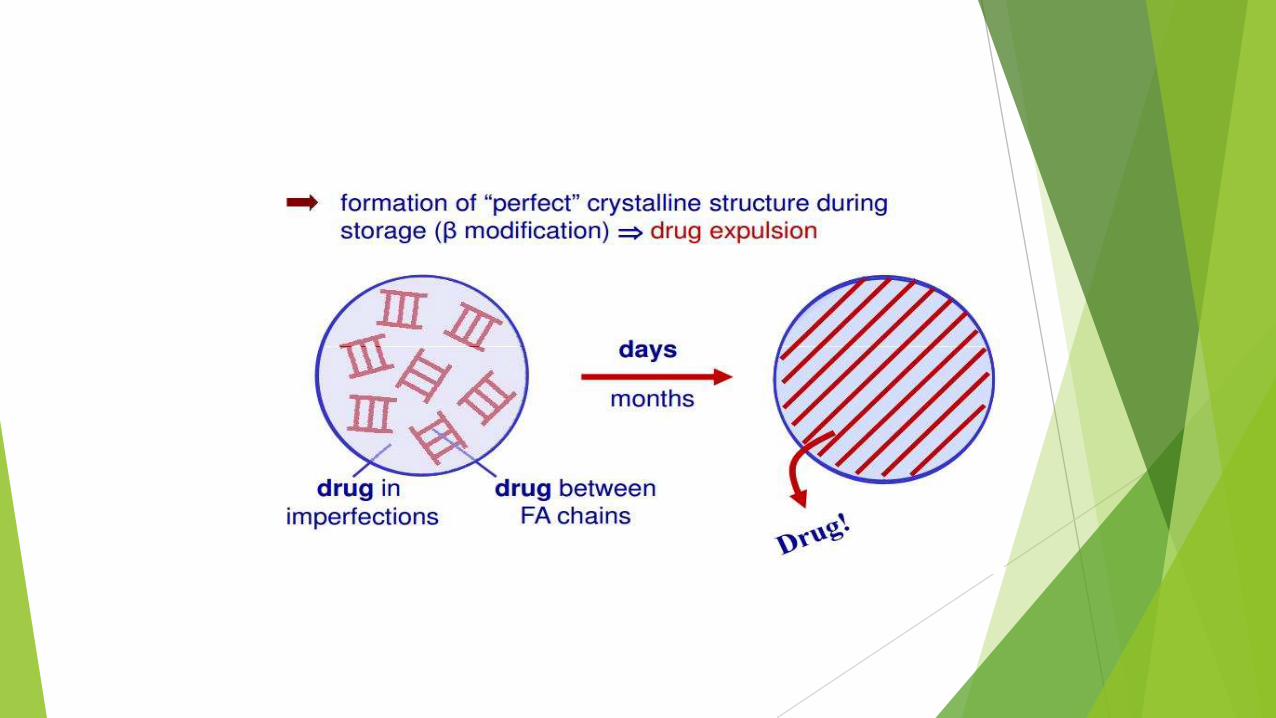
In general, drug molecules stay in between the fatty acid chains or as amorphous
clusters in crystal imperfections within SLN matrix. But, when lipid transform to low-
energetic form, it form a perfect crystalline lattice that allows very small space for the
drug molecules. Therefore, expulsion of encapsulated drug molecules may be
observed during storage which leads to limited drug-loading capacity of SLNs.
NLCs as alternate drug carrier systems over SLNs
In the process of further improvement and reduction of these drawbacks of
SLNs, NLCs have been evolved as alternative drug carrier systems.
NLC matrix is composed of mixture of spatially different lipid molecules,
normally mixture of solid and liquid lipid, which makes more imperfection in
the matrix to accommodate more drug molecules than SLN.
It is expected that the drug-loading capacity will be enhanced, drug expulsion
during storage will be minimized due to the imperfect crystal lattice and drug
release profile can be easily modulated by varying the lipid matrix
composition (Müller et al., 2002a; Radtke et al., 2005).
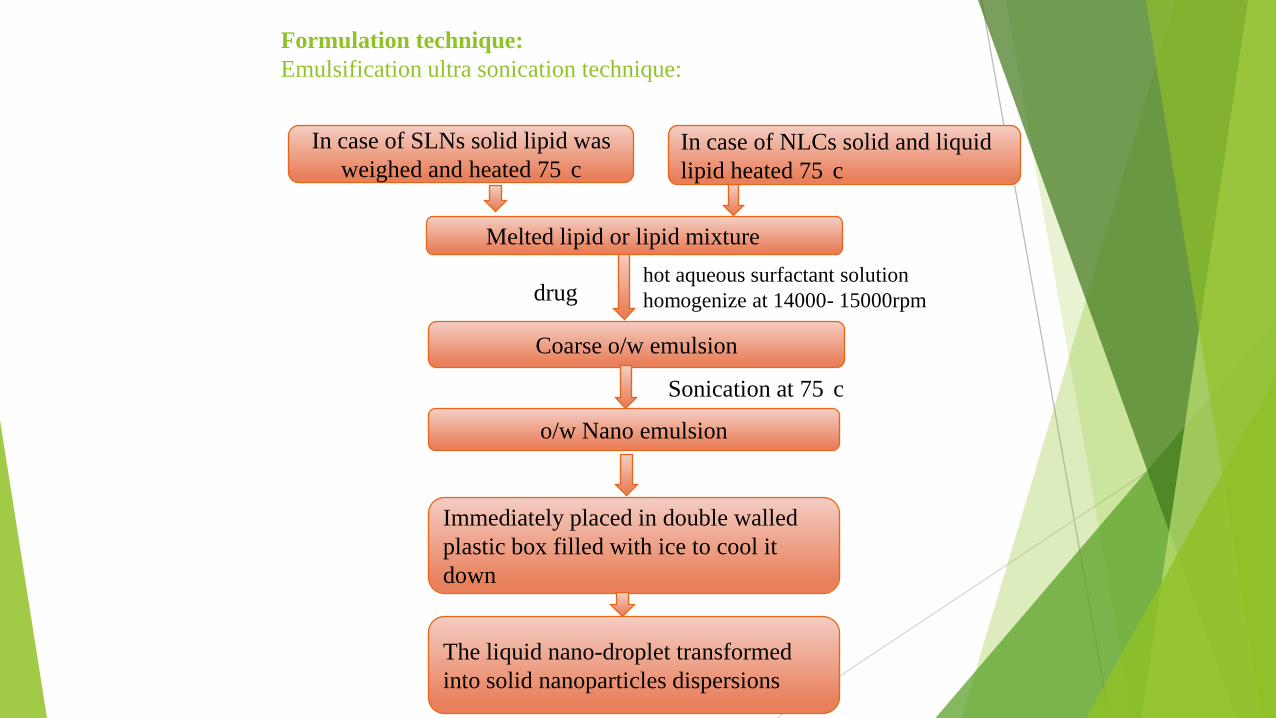
Formulation technique:
Emulsification ultra sonication technique:
Melted lipid or lipid mixture
o/w Nano emulsion
Immediately placed in double walled
plastic box filled with ice to cool it
down
The liquid nano-droplet transformed
into solid nanoparticles dispersions
Coarse o/w emulsion
drughot aqueous surfactant solution
homogenize at 14000- 15000rpm
Sonication at 75 c
In case of SLNs solid lipid was
weighed and heated 75 c
In case of NLCs solid and liquid
lipid heated 75 c
Characterization
Particle size, polydispersity index and zeta potential measurement:
For particle size and polydispersity index measurements, the diluted nanoparticle
dispersion was poured into the disposable sizing cuvette which was then placed in
the cuvette holder of the instrument and analyzed using the zetasizer software
(DTS v 6.12, Malvern Instruments, UK).
For zeta potential measurement, disposable folded capillary cuvette was used. Air
bubbles, if any, were removed from the capillary before measurement. All
measurements were performed in triplicate.
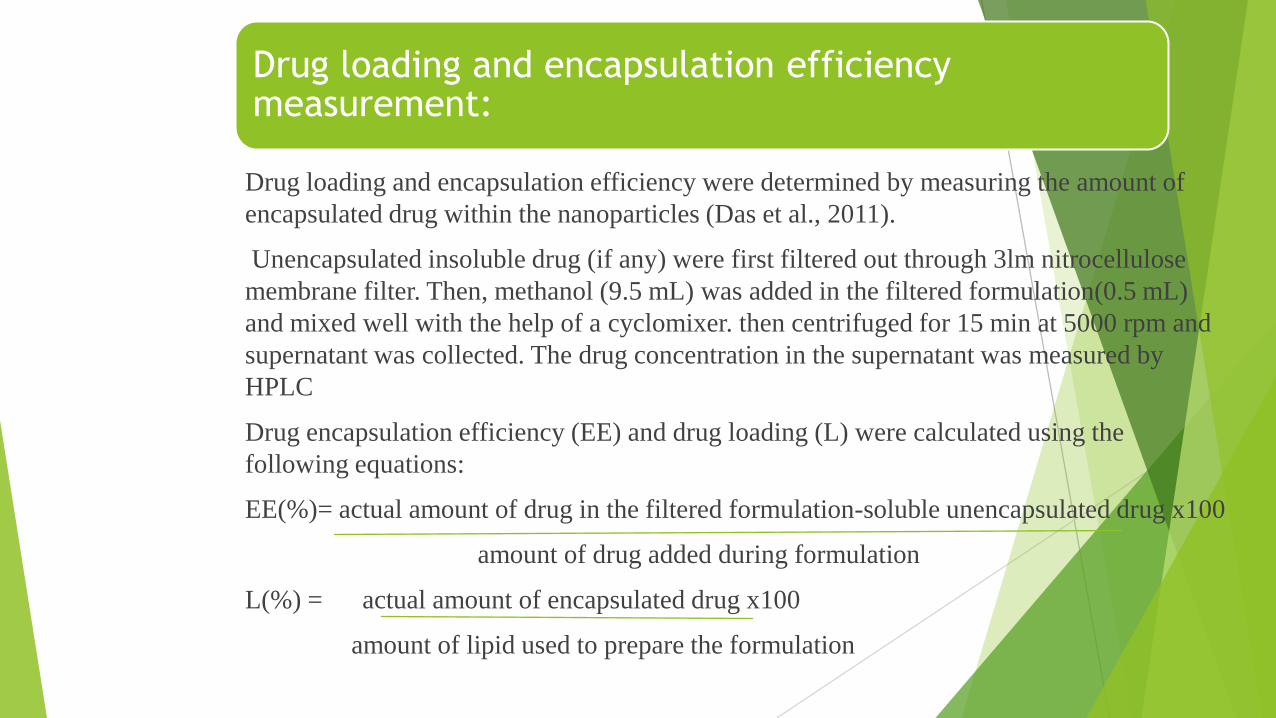
Drug loading and encapsulation efficiency measurement:
Drug loading and encapsulation efficiency were determined by measuring the amount of
encapsulated drug within the nanoparticles (Das et al., 2011).
Unencapsulated insoluble drug (if any) were first filtered out through 3lm nitrocellulose
membrane filter. Then, methanol (9.5 mL) was added in the filtered formulation(0.5 mL)
and mixed well with the help of a cyclomixer. then centrifuged for 15 min at 5000 rpm and
supernatant was collected. The drug concentration in the supernatant was measured by
HPLC
Drug encapsulation efficiency (EE) and drug loading (L) were calculated using the
following equations:
EE(%)= actual amount of drug in the filtered formulation-soluble unencapsulated drug x100
amount of drug added during formulation
L(%) = actual amount of encapsulated drug x100
amount of lipid used to prepare the formulation
Scanning electron microscopy study
Some researchers have used SEM for the morphology of SLNs (Varshosaz et al., 2010), the
nanoparticles may not maintain their integrity and solid state during SEM analysis due to
the increase in energy during measurment. Therefore, cryogenic field emission scanning
electron microscopy was used to examine shape, size and surface morphology of the
SLNs/NLCs.
few drops of the nanoparticle dispersion were placed on a copper stub and frozen in
nitrogen slush at -196 C. The frozen sample was then stored in liquid nitrogen and
transferred into the cryo preparation chamber attachedto a FESEM where the frozen
sample was freeze-fractured, sublimed for 30 s at -95 C and sputtercoated with platinum
for 120 s. Then the coated sample was placed onto the specimen stage of the FESEM
at140 C and analyzed at an excitation voltage of 5 kV.
Differential scanning calorimetry analysis
Firstly SNLs and NLCs samples are lyophilized, filled and blank NLCs and SLNs were
subjected to DSC.
samples(4–5 mg) were kept in the standard aluminum pans and sealed. Then the pans
were placed under isothermal condition at 25 C for 10 min. DSC analysis was
performed at 10 C/min from 25 to 290C under a inert environment. An empty sealed
pan was used as reference. The thermograms of the samples were recorded

Drug release study
The dialysis bag method was followed for the drug release study The day before the drug
release experiment, dialysis tube (10 kDa molecular cut off) was treated closely following the
protocol (Sigma) and soaked in the release media overnight. Phosphate buffer at pH 7.4
containing 2% Tween 80 was used as drug release media.
Accurately measured 1 mL formulation was placed in the dialysis tube and both end of the tube
was tightly tied to prevent any leakage. The tube containing formulation was then kept in an
amber colored glass bottle containing 10 mL release media. The bottle was kept on a horizontal
rotary shaker rotating at 100 rpm. Samples (5 mL release media) were withdrawn from the
bottle at the predetermined time intervals and replaced by 5 mL fresh release media. The
samples were then analyzed by HPLC to determine the amount of drug released from the
formulation at different time points.

Results and Discussion
Particle size
Particle size measurement was required to confirm the production of the particles in nano-
range.
particle size was significantly influenced by most of the formulation and process variables.
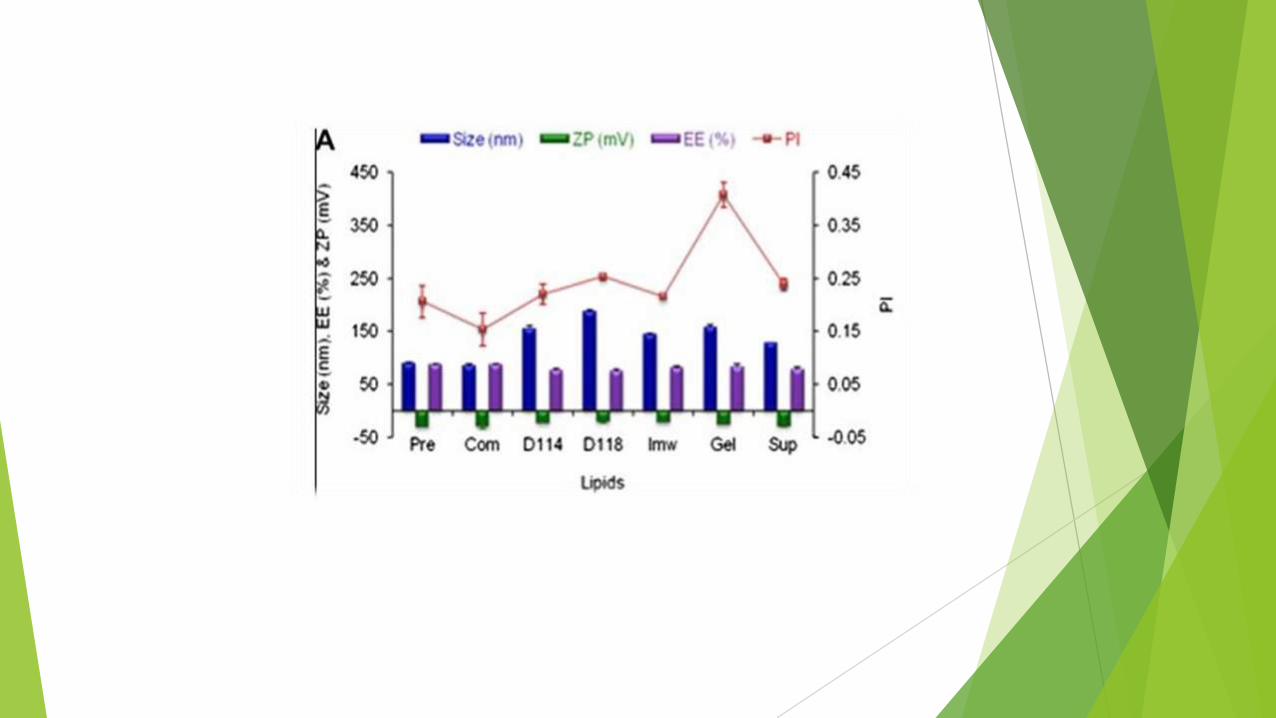
Among the different lipid tested, SLNs prepared using Compritol 888ATO were smallest
and SLNs prepared using Dynasan 118 were biggest.
However, no relationship between chemical structure of the lipids and particle size was
observed. This might be because of the complex structure of these lipids.
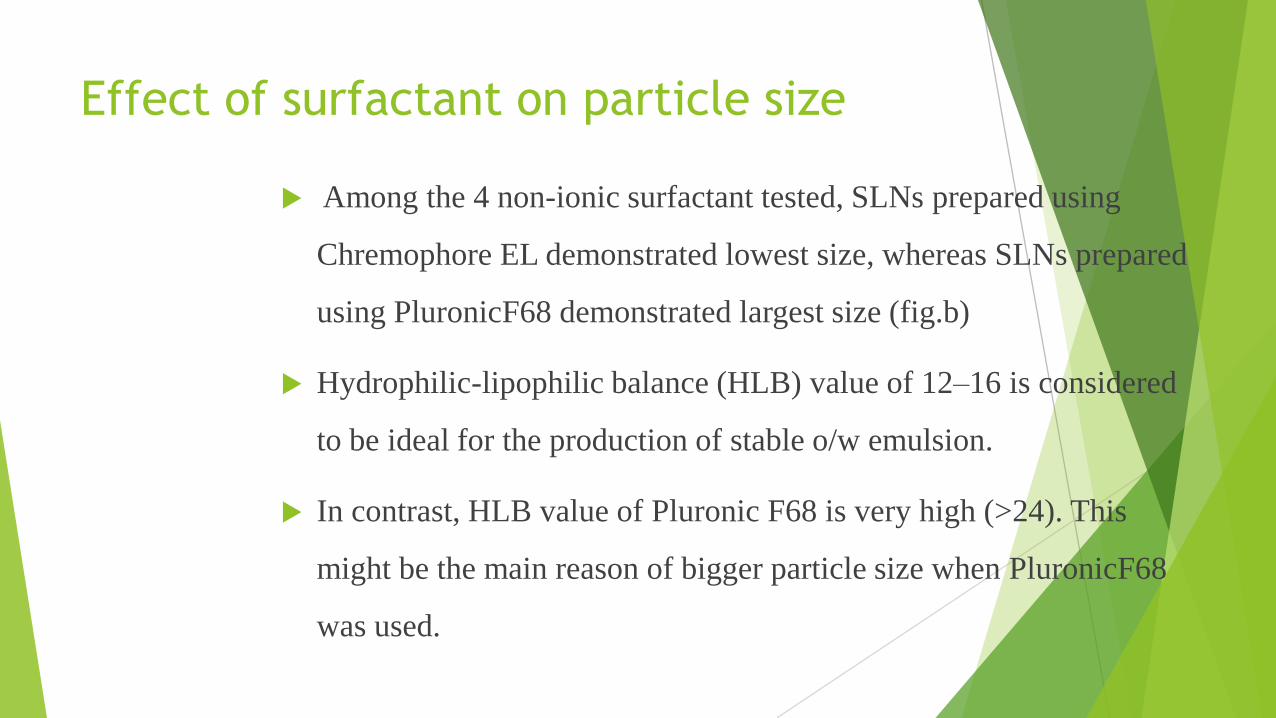
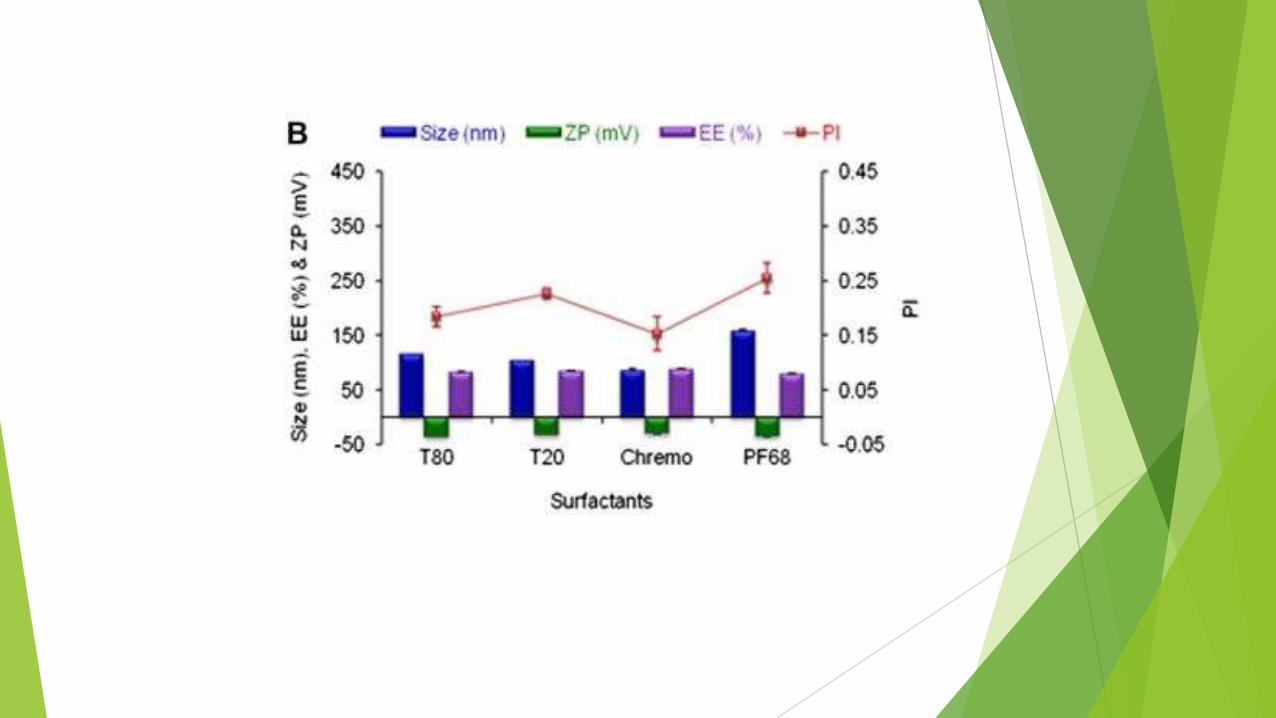
Effect of surfactant on particle size
Among the 4 non-ionic surfactant tested, SLNs prepared using
Chremophore EL demonstrated lowest size, whereas SLNs prepared
using PluronicF68 demonstrated largest size (fig.b)
Hydrophilic-lipophilic balance (HLB) value of 12–16 is considered
to be ideal for the production of stable o/w emulsion.
In contrast, HLB value of Pluronic F68 is very high (>24). This
might be the main reason of bigger particle size when PluronicF68
was used.
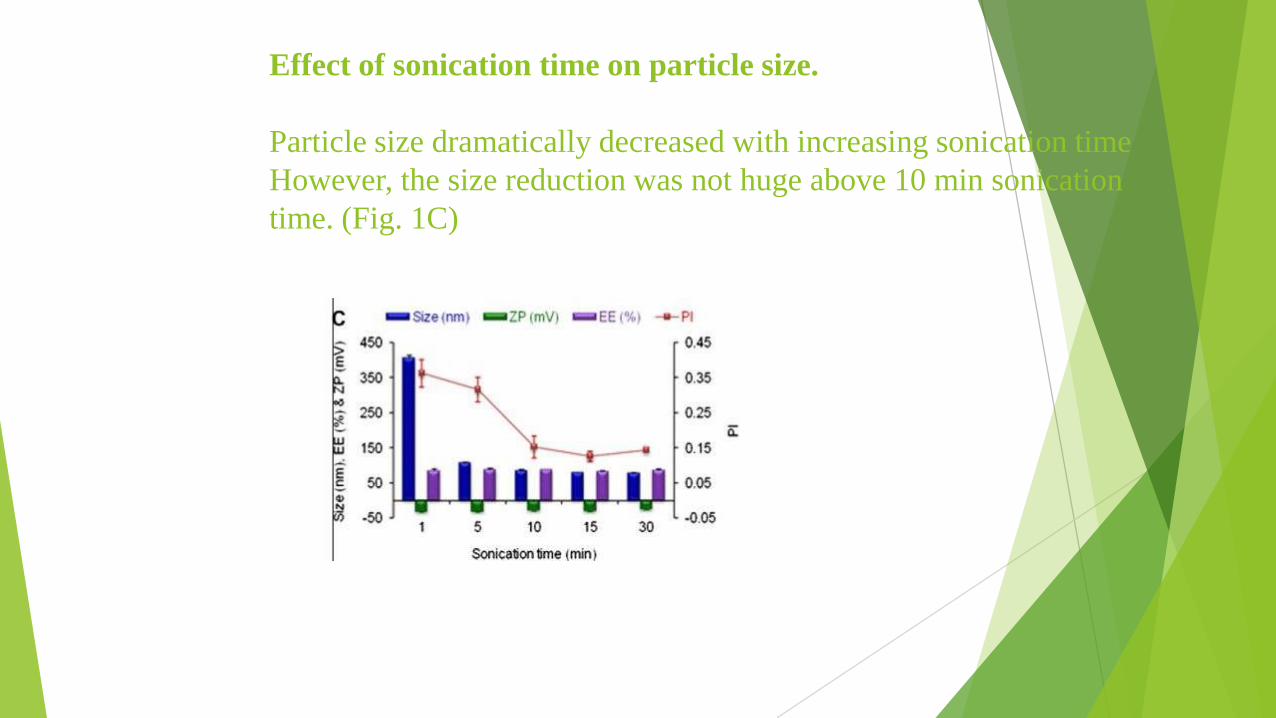
Effect of sonication time on particle size.
Particle size dramatically decreased with increasing sonication time
However, the size reduction was not huge above 10 min sonication
time. (Fig. 1C)
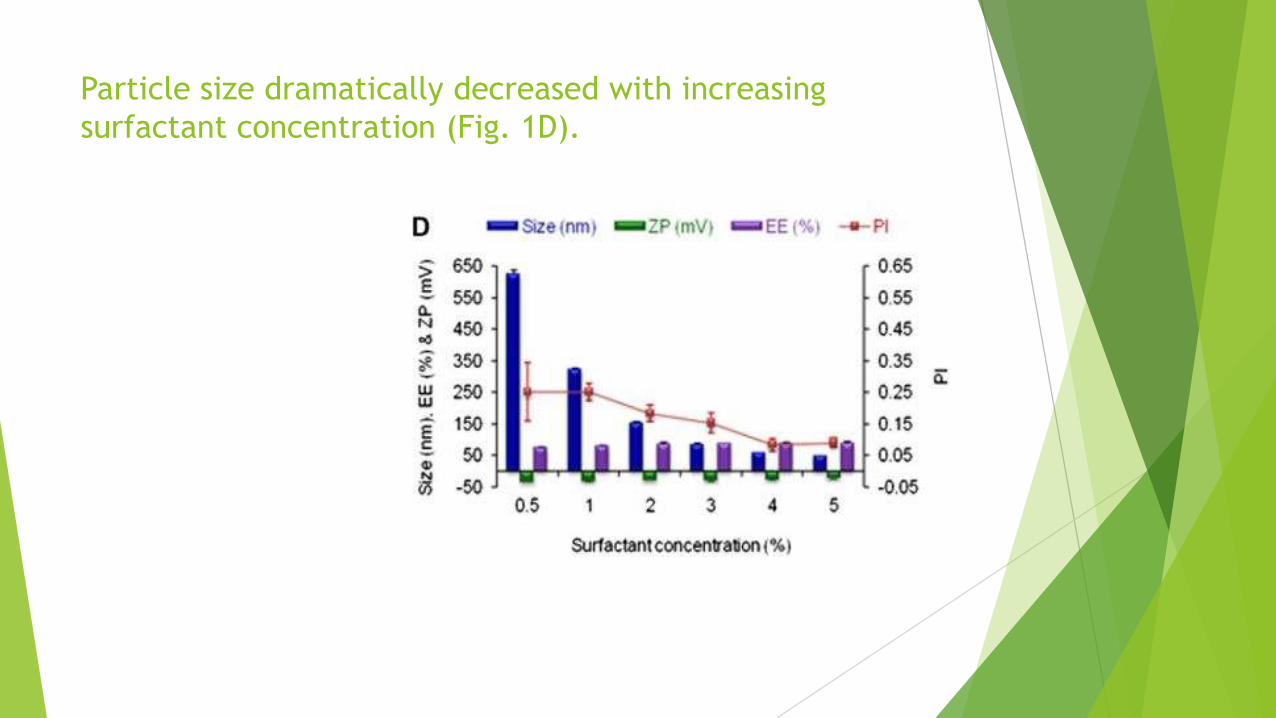
Particle size dramatically decreased with increasing
surfactant concentration (Fig. 1D).
Polydispersity index
Polydispersity index (PI) indicates the width of the particle size
distribution, which ranges from 0 to 1.
Theoretically, monodisperse populations indicates PI = 0. However, PI < 0.2 is
considered as narrow size distribution.
Among the lipids, Compritol 888ATO produced SLNs with lowest PI and
Geleol™ produced SLNs with highest PI (Fig. 1A).
Among the surfactants Chremophore EL produced SLNs with lowest PI and
Pluronic F68 produced SLNs with highest PI (Fig. 1B).
PI decreased with increasing sonication time (up to 15 min) and surfactant
concentration. PI was very high at 1–5 min sonication time and 0.5–1% surfactant
concentration.
Zeta potential
ZP refers to the surface charge of the particles. ZP ( ) indicates the degree of
repulsion between close and similarly charged particles in the dispersion.
This repulsion force prevents aggregation of the particles. Therefore, ZP is a
useful parameter to predict the physical stability of the SLN/NLC dispersions
(Das and Chaudhury, 2011; Freitas and Müller, 1998).
The results indicate that ZP values were less than -20 mV for all prepared SLNs
and NLCs, except SLNs prepared at 1% lipid concentration.
ZP of the SLNs prepared with different lipids decreased as follows: Precirol ATO5
> Compritol 888ATO > Suppocire NC > Geleol™ > Dynasan 114 > Imwitor 900
K > Dynasan118 (Fig. 1A)
There was no specific correlation between ZP and solid to liquid lipid ratio in
NLCs (Fig. 2A).
Drug encapsulation efficiency
Drug encapsulation efficiency (EE) was highest and lowest when SLNs were prepared with
Compritol 888ATO (>87%) and Dynasan 118 (<76%) as lipid, respectively (Fig. 1A).
SLNs prepared with Chromophore EL as surfactant showed highest EE (>87%) (Fig. 1B).
However, EE was > 79% when SLNs prepared with other surfactants too.
The results showed that EE of SLNs was not dependant on sonication time (Fig. 1C).
EE of SLNs significantly increased with increasing surfactant concentration.
However, insignificant increase in EE was noticed above 2% surfactant concentration. (Fig.
1D).
Scanning electron microscopy
The images indicate that both SLNs and NLCs were spherical with size between 50 and
150 nm. Although it was not common, some particle agglomerates were observed (Fig.
3C).
The particle aggregations might be due to sticky nature of the lipid.
Surface morphology of both SLNs and NLCs were smooth and there is no visible
difference between them (Fig. 3B–D).
The crystalline structures of clotrimazole were absent in the SEM images of SLNs and
NLCs, which suggests absence of unencapsulated undissolved drug crystals in the
dispersions.
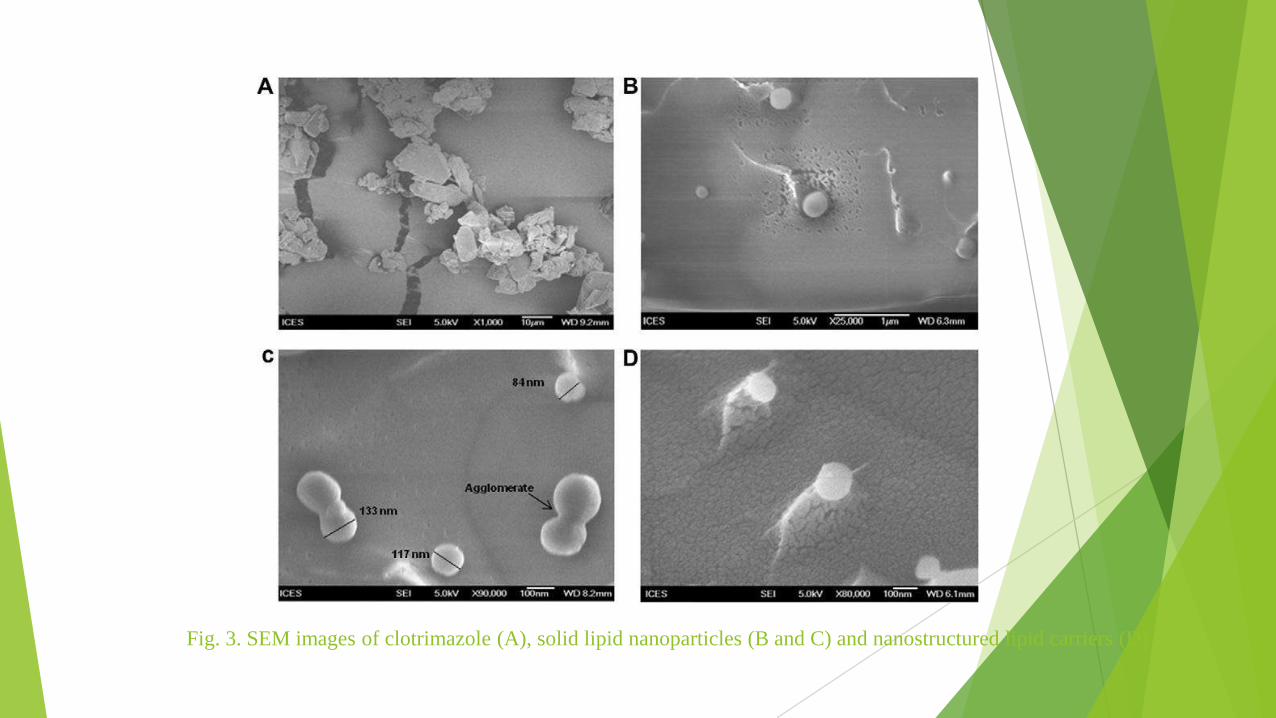
Fig. 3. SEM images of clotrimazole (A), solid lipid nanoparticles (B and C) and nanostructured lipid carriers (D)
Drug release
Cumulative drug release from the nanoparticle dispersions were plotted against
time (Fig.6).
SLNs and NLCs prepared at 4% drug to lipid ratio showed sustained and
prolonged drug release. However, drug release rate of NLCs 4% was significantly
faster than SLN-4% . (Fig. 6A)
Both SLNs and NLCs prepared at 8% drug to lipid ratio (i.e., SLN-8% and NLC-
8%) showed significantly slower drug release rate than their counterparts with 4%
drug to lipid ratio.
There was no significant difference in drug release profile or rate between SLN-8%
and NLC-8% .
There was also no significant difference in drug release profile of NLCs after 3
months storage in compare to fresh NLCs, while significant change drug release
rate was observed in case of SLNs.
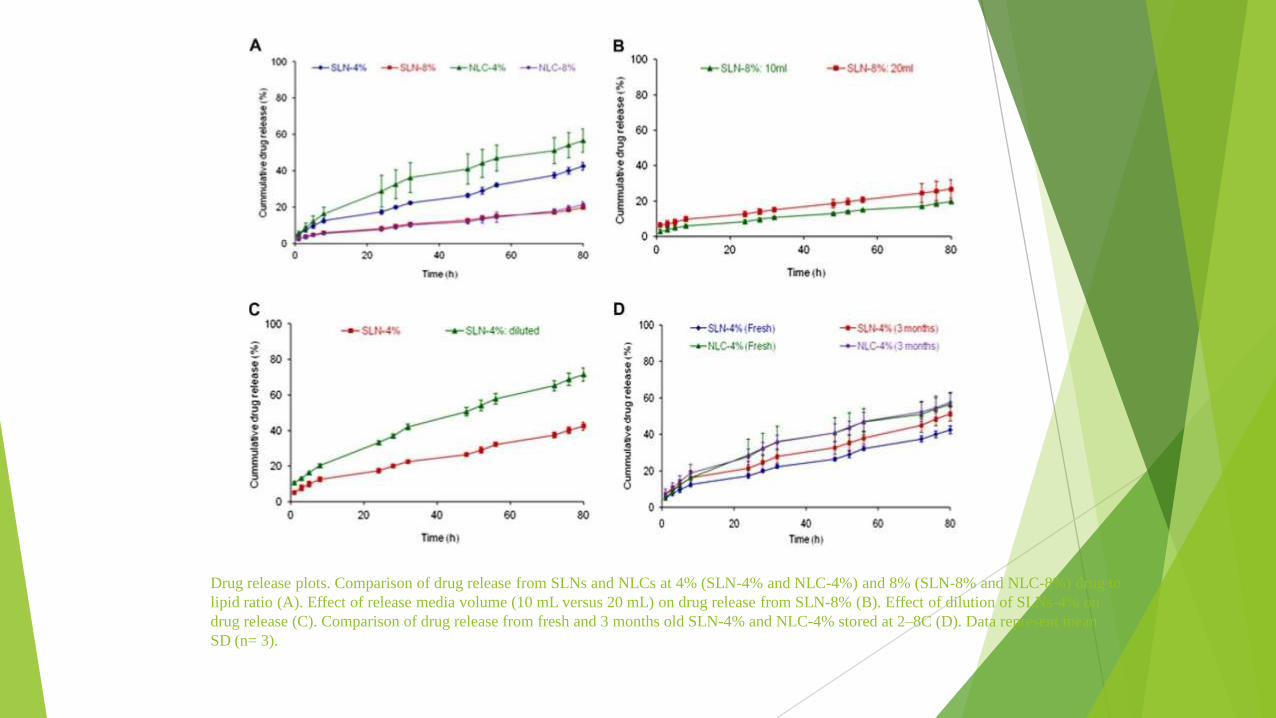
Drug release plots. Comparison of drug release from SLNs and NLCs at 4% (SLN-4% and NLC-4%) and 8% (SLN-8% and NLC-8%) drug to
lipid ratio (A). Effect of release media volume (10 mL versus 20 mL) on drug release from SLN-8% (B). Effect of dilution of SLNs-4% on
drug release (C). Comparison of drug release from fresh and 3 months old SLN-4% and NLC-4% stored at 2–8C (D). Data represent mean
SD (n= 3).
Drug release contd..
lower drug release at 8% drug to lipid ratio than 4% drug to lipid ratio might be due to
absence of proper sink condition during drug release study as drug amount was doubled but
volume of release media was same (10 mL).
Therefore, another drug release experiment was performed on SLNs prepared with 8%
drug to lipid ratio using 20 mL release media. The result indicates slightly faster drug
release when 20 mL release media was used than 10 mL release media. (Fig. 6B)
In another experiment, effect of dilution of formulation on drug release was investigated.
The experiment was performed as formulation is diluted after oral ingestion (in gastric
fluid) or intravenous injection (in blood), whereas almost no dilution occur during topical
application on skin. In this experiment, SLN dispersion was diuted 5 times with ultrapure
water and then release study was performed in 10 mL release media (Fig. 6C).

Conclusion
The study suggests the importance of controlling the critical formulation andprocess parameters during formulation as they greatly influenced the finalproduct, such as particle size, polydispersity index, zeta potential, drugencapsulation efficiency.
Chemical characterizations (DSC) demonstrated slight difference in crystalstructure between SLNs and NLCs, although crystalline peak(s) of clotrimazoledisappeared in both SLNs and NLCs.
Sustained drug release was observed from SLNs and NLCs. NLCs exhibit thesame release pattern after 3 month as fresh, while significant change was observedin case of SLNs
In the comparative study, NLCs exhibited faster drug release than SLNs at the lowdrug-loading.
Both tested SLNs and NLCs were stable at 2–8 C even at high drug-loading andalso stable at 25 c at low drug loading. therefore, NLCs have an edge over SLNs.
Although both SLN and NLCs can be used as effective carrier of lipophilic drugsdepending on desired drug release profile, NLCs might be better option thanSLNs. Nevertheless different stabilizing route need to be evaluated in near future.
Reference
Das S, Ng Wai K, Tan R. “Are nanostructured lipid carriers (NLCs) better than solid lipid
nanoparticles(SLNs): Development, characterizations and comparative evaluations of
clotrimazole-loaded SLNs and NLCs?” Euro. Jur. Of ph sci. june 1, 2012.

Thank you