are overconfident managers born or made? …shiller/behfin/2005-11/qian-billett.pdfare overconfident...
TRANSCRIPT

Are Overconfident Managers Born or Made?
Evidence of Self-Attribution Bias from Frequent Acquirers
Matthew T. Billetta and Yiming Qianb
October 2005
Abstract
We explore the source of managerial hubris in mergers and acquisitions by examining the history of deals made by individual acquirers. Our study has three main findings: (1) Compared to their first deals, acquirers of second and higher-order deals experience significantly more negative announcement effects; (2) While acquisition likelihood increases in the performance associated with previous acquisitions, previous positive performance does not curb the negative wealth effects associated with future deals; (3) Top management�s net purchase of stock is greater preceding high order deals than it is for first deals. We interpret these results as consistent with self-attribution bias leading to managerial overconfidence. We also find evidence that the market anticipates future deals based on an acquirer's acquisition history and impounds such anticipation into stock prices.
JEL Classifications: G31; G32; G34
We thank Toby Daglish, Jon Garfinkel, David Hirshleifer, Kose John, Tyler Leverty, Erik Lie, David Mauer, Hamid Mehran, Harold Mulherin, Tom Rietz, Jay Sa-Aadu, Ashish Tiwari, Xiaoyun Yu, and seminar participants at the FMA Meetings, Northern Illinois University, University of Iowa, and University of Kansas for comments and suggestions. All remaining errors are our own.
aHenry B. Tippie College of Business, University of Iowa, Iowa City, Iowa 52242-1000; (319) 335-2626; email: [email protected].
bHenry B. Tippie College of Business, University of Iowa, Iowa City, Iowa 52242-1000; (319) 335-0934; email: [email protected].

1. Introduction
Roll�s (1986) hubris hypothesis suggests managers engage in acquisitions with an overly
optimistic opinion of their ability to create value. A number of papers have documented evidence
supporting this hypothesis.1 One unanswered question, however, is how do managers become
overconfident? Managers could simply be born overconfident. Alternatively, they may develop
overconfidence through experience. The source of overconfidence has important implications
for corporate governance. If managers develop overconfidence through experience, remedies
such as monitoring and incentives should be adjusted based on managers� experience. On the
other hand, if managers have endowed overconfidence, no such adjustment is needed.
The psychology and behavioral economics literatures document one common source of
overconfidence: self-attribution bias.2 Individuals subject to self-attribution bias over credit their
role in bringing about good outcomes and over credit external factors or bad luck for bad
outcomes. Hirshleifer (2001) summarizes the link between overconfidence and self-attribution
bias: �Overconfidence and biased self-attribution are static and dynamic counterparts; self-
attribution causes individuals to learn to be overconfident rather than converging to an accurate
self-assessment.� Despite its potential importance, there is little empirical evidence documenting
that self-attribution matters to managerial decisions.
We explore managerial self-attribution bias in mergers and acquisitions by looking at the
sequence of deals made by individual acquirers. We consider a number of factors, in addition to
overconfidence, that may influence an acquirer�s sequence of deals including agency conflicts,
overvaluation, and the notion that firms may have or develop acquisition expertise. We construct
tests designed to disentangle these alternative explanations. Specifically, if managers develop
hubris through acquisition experience, the pattern of deals will exhibit three characteristics that
1 See Hietala, Kaplan and Robinson (2003) and Malmendier and Tate (2003) for direct evidence supporting the hubris hypothesis, and too many papers to list that document negative wealth effects to acquirers which is consistent with the hubris hypothesis (see Bruner (2002) for a review of these papers). 2 See Baker, Ruback, and Wurgler (2004), Gilovich, Griffin and Kahneman (2002) and Kahneman and Tverskey (2000) for reviews of the literature.

2
can not be explained by any other single factor. First, compared to their first deals, acquirers will
do worse, on average, in their subsequent acquisitions because of the developed overconfidence.
Second, experienced acquirers who become overconfident will be more likely to acquire again,
and the likelihood of future acquisitions will be increasing in the performance of their previous
acquisition. Third, acquirers who become overconfident from successful acquisition experience
will exhibit greater optimism regarding firm prospects and will exhibit such optimism in trading
their companies� stocks. We find supporting evidence for all three conjectures. While alternative
explanations may explain one or two of our findings, the only explanation consistent with all
three is the self-attribution hypothesis.
We use a sample of acquisitions from 1985-2002. Over this period, U.S. public
companies acquired $3.77 trillion worth of other U.S. public companies.3 A large portion of this
acquisition activity is concentrated in a relatively small number of acquirers. For the sample as a
whole, we find 3,702 acquisitions of publicly traded target companies by 2,124 different
acquirers, implying an average 1.74 deals per acquirer. However, the most active 5% of these
acquirers average 7.58 deals each, representing 22% of 3,702 deals by number and 30% of the
$3.77 trillion in deal value. We examine the history of these active acquirers to test the
predictions of the self-attribution and other hypotheses.
We begin by examining acquirer abnormal returns at the announcement of an acquisition.
We define deal order based on the number of mergers and acquisitions done by the acquirer in
the preceding five years. We find a significant difference between the abnormal return to first
deals ( 0.10%) and that of subsequent deals ( 1.50%). Moreover, this difference remains
significant in a multivariate setting where we control for firm and deal characteristics.
We define acquirers as frequent acquirers if they acquire at least two public targets
within a five-year period. We compare the first deals done by these frequent acquirers to first
deals done by infrequent acquirers. Interestingly, both groups exhibit insignificant average
3 Deal values adjusted to 2002 dollars using the CPI.
3
abnormal returns. Thus, the negative return associated with frequent acquirers is only found in
deals following previous acquisition experience. The evidence is consistent with the notion that
acquirers with no acquisition history show no evidence of hubris. Frequent acquirers exhibit
negative wealth effects consistent with hubris, but only after they develop acquisition experience.
The second part of the empirical tests examines the acquirer�s long-term stock
performance following the acquisition. Overconfidence stemming from self-attribution bias
predicts that value destructive deals follow successful deals, the source of the overconfidence.4
We are interested to see whether success from previous deals leads to more acquisitions.
We examine ex-post acquisition performance using three-year buy-and-hold excess
returns (BHERs). We stratify the sample by whether the acquirer goes on to acquire again to see
if ex-post performance influences future acquisition activity. We find those that go on to acquire
again (frequent acquirers) experience a mean BHER of 12.71% following first deals while those
that cease acquiring exhibit a mean BHER of 12.27%. Both of these figures are statistically
significant at the one percent level and highly economically significant. These results suggest
that success following the first deal leads to an increased likelihood of more deals. However,
these next deals are value destructive in that they are met with negative announcement reactions
and followed by insignificant BHERs. We find a similar pattern when we examine which
acquirers go on to third and fourth acquisitions.
We then test to see if performance following prior acquisitions motivates frequent
acquirers to do more deals. We examine the likelihood a firm engages in an acquisition as a
function of its previous year�s stock return, to control for the well documented run-up prior to
acquisitions, and the stock return interacted with an indicator variable of whether the firm has
engaged in another acquisition in the past five years. If the returns following an acquisition
contribute to managerial hubris, then we would expect to find a positive and significant
coefficient on this interaction of stock return and previous acquisition activity. We indeed find a
4 Alternatively, if managers develop acquisition expertise from experience we would expected the wealth effects of deal order to be the exact opposite, more positive subsequent deals relative to first deals.

4
positive coefficient on this interactive variable. Moreover, the coefficient is three times larger
than that found on previous stock return alone. This finding supports the notion that hubris may
stem from past �success� even though past �success� does not lead to success in future deals.
Finally, we examine insider trading by top mangers during the six months prior to the
acquisition announcement. If frequent acquisitions are driven by overconfidence then we would
expect to see managers accumulating more shares prior to the acquisition. We control for the
normal insider trading activities with a cross-sectional benchmark as well as a time-series
benchmark. Under both benchmarks, we find no evidence of abnormal purchasing or selling
prior to first deals. However, we do find positive abnormal purchasing prior to higher order
deals. The managerial insider trading activity suggests management is more optimistic about
firm prospects heading into higher order deals than they were heading into first deals.
Although our results support the notion that managerial hubris developed over acquisition
experience leads to more acquisitions, we also consider other hypotheses that might cause a
company to become a frequent acquirer. First, some managers may possess acquisition skill. If
this is the case, we would expect these acquisitions to exhibit more positive wealth effects.
Instead, we find the first deals made by both frequent acquirers and infrequent acquirers do not
destroy value while higher-order deals exhibit negative wealth effects. Second, managers that
frequently acquire may be driven by self-interested agency motives. However, if frequent
acquirers are motivated by agency issues, we would expect that manager�s purchasing of stock
prior to these acquisitions would be nonpositive. Instead, we find that the abnormal purchase of
stock is insignificant prior to the first deals and significantly positive for higher order deals.
Lastly, a company may frequently acquire if the stock is (frequently) overvalued. However, as in
the case of agency, overvaluation suggests manager net purchases of stock would be negative (or
at least nonpositive). Overall, the only hypothesis that explains the entirety of our results is the
self-attribution bias hypothesis.
Our study has several contributions. First, it adds to the empirical literature of behavioral
finance by documenting evidence that overconfidence in acquisitions is developed from past
5
acquisition experience. Second, it adds to the empirical literature of mergers and acquisitions by
illustrating that the well-documented negative announcement effect associated with public
acquisitions is concentrated in higher order deals. Last, we document evidence that the market
learns from an acquirer�s acquisition history. The market forms an expectation of an acquirer�s
future acquisition activity based on its acquisition history and impounds the expected wealth
effect into the stock price.
The remainder of the paper proceeds as follows. Section 2 discusses the previous
literature on frequent acquirers. Section 3 describes our data and methods. Section 4 presents
results on announcement effects. Section 5 presents results on post-acquisition performance and
its relation to the likelihood of future acquisitions. Section 6 presents results on insider trading
prior to acquisitions. Conclusions are presented in section 7.
2. Prior research on frequent acquirers
Previous studies examine the wealth effects of acquirers who make many acquisitions;
however, their purposes and methods differ from ours. Fuller, Netter, and Stegemoller (2002)
examine the wealth effects of firms that make five or more acquisitions during any three-year
period.5 By choosing a sample of only frequent acquirers, they hope to minimize firm specific
variation in their sample. They argue that by reducing firm specific variation in acquirer
abnormal returns they can better isolate the impact of target and bid characteristics on the returns
to acquirers.
In their cross-sectional tests they include a dummy variable indicating whether the deal is
the acquirers� first deal and another dummy variable indicating the deal is a fifth or higher deal.
They find little or no evidence that the acquirer�s abnormal return varies with the order of the
deal. One possibility is that differences in the wealth effects by deal order exist, but these
5 Fuller, Netter, and Stegemoller (2002) include acquisitions of public, private, and subsidiary targets in their sample. They report results for the subsample of public targets. Above, we refer to these results, given they are most relevant to our purpose.

6
differences may be evident between relatively low deal orders. The market may learn to
anticipate further acquisitions after a few deals and therefore the negative wealth effect
associated with high order deals will not be shown in the announcement effect.
Another related branch of work consists of studies documenting the wealth effects of
firms involved in acquisition programs. These firms announce their intention to acquire multiple
firms over coming months or years. Schipper and Thompson (1983b) document that
conglomerate acquirers earn positive wealth effects upon the announcement of the acquisition
programs. These acquirers �carried out aggressive acquisition programs during the late 1950s
and 1960s.� In another paper, Schipper and Thompson (1983a) document that firms with an
active acquisition history react negatively to regulatory changes that make acquisitions more
difficult. They interpret this as evidence that acquisitions create value for acquirers. Bhabra,
Bhabra, and Boyle (2001) also examine the wealth effects of acquisition programs using a more
recent sample of 65 announcements made between 1977 and 1992. They too document
significantly positive wealth effects. One way to reconcile these results with ours is that
acquisitions of private targets are often value creating. If the market expects a firm to acquire
mostly private targets, it may respond positively to the announcement of an acquisition program.
However, even for private acquisitions, we find that higher order deals exhibit significantly
lower wealth effects than the first deals (see appendix for details).
3. Data and methods
The sample of acquisitions is obtained from Securities Data Company�s (SDC) U.S.
Mergers and Acquisitions Database. We select domestic mergers and acquisitions that were
announced between 1980 and 2002. We then match the SDC data on deal characteristics with
return and market capitalization data from the CRSP database, and with accounting data from
Compustat. A deal is included if it satisfies the following criteria:
1) Both the acquirer and the target are publicly-traded U.S. companies.
2) The acquirer is covered by the CRSP database.
7
3) The deal is indicated by SDC either as a merger or acquisition of majority interest (SDC form code equal to �M� or �AM�).
4) The deal value is no less than 1 million dollars.
5) The deal value is at least 1% of the acquirer�s market value of equity, the latter measured two trading days before the announcement.
6) The deal is completed and the time between completion date and announcement date is no more than 1,000 days.
Imposing these requirements results in a sample of 4,051 mergers and acquisitions during
the period 1980-2002.6
We limit the sample to publicly traded targets for the following reason. Numerous studies
document negative wealth effects for acquirers of public targets, consistent with the hubris
hypothesis. In contrast, acquirers of private targets exhibit positive wealth effects. Thus, it does
not appear that hubris plays a key role in explaining acquisitions of private targets, on average.
One possible reason for this difference is competition. Greater competition for public targets will
decrease the gains to the winning bidder and could exacerbate the effects of overconfidence,
leading to the winner�s curse in these deals. Given our focus on whether self-attribution drives
overconfidence, we focus on public targets where previous studies document evidence consistent
with overconfidence.7
We next create a measure to distinguish frequent from infrequent acquirers. We define a
frequent acquirer as follows: a firm is defined as a frequent acquirer if it announces at least two
public deals within any five-year period. Correspondingly, we count the deal order based on the
same company�s acquisitions in the previous five years. For example, over our sample period,
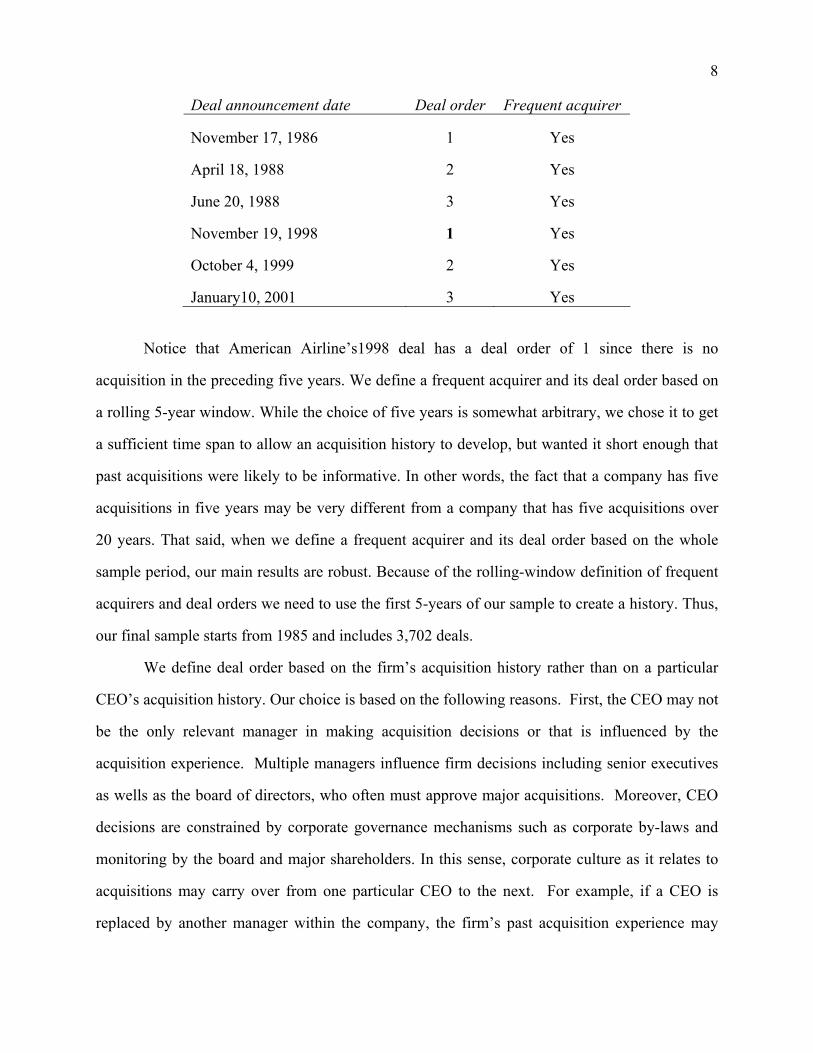
American Airlines Inc. acquired 6 public companies. We define the deal order of its acquisitions
as follows:
6 In general, we use the sample selection criteria of Moeller, Schlingemann, and Stulz (2004). 7 In contrast to this point of view, it is reasonable to argue that acquisitions of private targets play an important role in the development of acquisition expertise and/or hubris. We also conduct all of our tests using both public and private target firms and report the results in the Appendix. These tests show our results and conclusion do not depend on this sample criterion.
8
Deal announcement date Deal order Frequent acquirer
November 17, 1986 1 Yes
April 18, 1988 2 Yes
June 20, 1988 3 Yes
November 19, 1998 1 Yes
October 4, 1999 2 Yes
January10, 2001 3 Yes
Notice that American Airline�s1998 deal has a deal order of 1 since there is no
acquisition in the preceding five years. We define a frequent acquirer and its deal order based on
a rolling 5-year window. While the choice of five years is somewhat arbitrary, we chose it to get
a sufficient time span to allow an acquisition history to develop, but wanted it short enough that
past acquisitions were likely to be informative. In other words, the fact that a company has five
acquisitions in five years may be very different from a company that has five acquisitions over
20 years. That said, when we define a frequent acquirer and its deal order based on the whole
sample period, our main results are robust. Because of the rolling-window definition of frequent
acquirers and deal orders we need to use the first 5-years of our sample to create a history. Thus,
our final sample starts from 1985 and includes 3,702 deals.
We define deal order based on the firm�s acquisition history rather than on a particular
CEO�s acquisition history. Our choice is based on the following reasons. First, the CEO may not
be the only relevant manager in making acquisition decisions or that is influenced by the
acquisition experience. Multiple managers influence firm decisions including senior executives
as wells as the board of directors, who often must approve major acquisitions. Moreover, CEO
decisions are constrained by corporate governance mechanisms such as corporate by-laws and
monitoring by the board and major shareholders. In this sense, corporate culture as it relates to
acquisitions may carry over from one particular CEO to the next. For example, if a CEO is
replaced by another manager within the company, the firm�s past acquisition experience may

9
influence the behavior of the new CEO.8 Second, even if the CEO definition is correct, the
resulting bias from using a firm-based definition will work against finding differences between
past and future acquisitions. Consider two possibilities. If firm deal order simply measures CEO
deal order with error, then we would expect the relationship between first and subsequent deals
to be blurred. In other words, we would underestimate the difference simply due to noise.
Alternatively, if CEOs are replaced in a systematic way such that better CEOs replace poor
performing CEO, then we would expect the new CEO to engage in less value destructive deals.
If this tends to happen after firms� first deals then we would expect to find firms� second deals,
which are the work of the new CEO, to be less value destructive. In general, if our definition
mistakenly labels as higher order deals those deals done by new CEOs that, properly labeled,
would be first deals, then we would be less likely to find a difference. Lastly, the use of a 5-year
rolling window should help reduce the impact of CEO turnover on our results. Taken as a
whole, it is not clear that using the CEO definition is more appropriate or that it would add much
insight. Given the cost of getting complete information on the CEOs for our sample firms, which
would involve not just tracking the CEOs for our firms, but also tracking individual CEO�s prior
career history and acquisition experience, we believe it makes sense to use firm-based deal order.
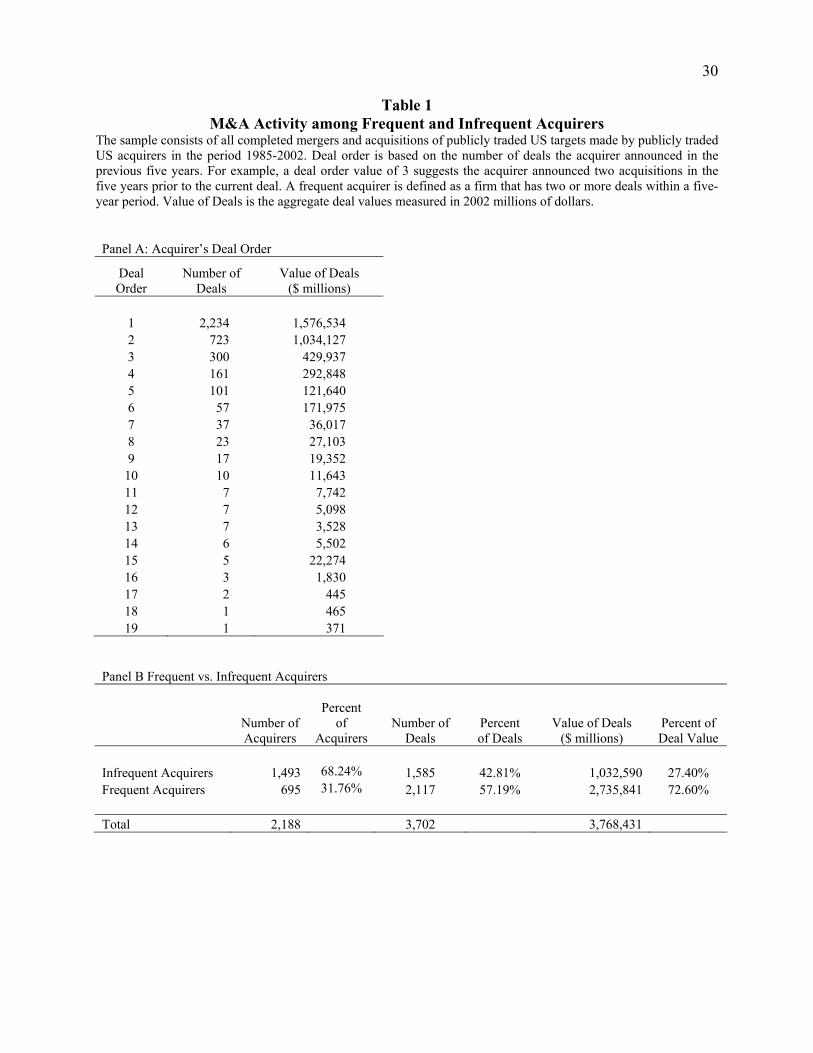
Table 1 reports the sample frequency and the value of deals stratified by deal order. We
have 2,234 first deals in our sample worth over $1.5 trillion. Panel B illustrates that 1,585 deals
are completed by 1,493 firms that never complete more than one deal in any five year period
over our sample period. In contrast 695 firms engage in at least two deals within a five year
period, accounting for 2,117 of the 3,702 deals in our sample.
We first investigate acquirers� wealth effects by examining abnormal stock returns
around the announcement date. We estimate these abnormal returns over a 3-day window ( 1,
+1) using the market model benchmark. Parameters for the market model are estimated over the
8 For example, when GE replaced Jack Welch in 2001 with GE insider Jeffrey Immelt, it was no surprise that acquisitions continued to be an integral part of the company�s growth strategy (see �How Does GE grow?� BusinessWeek, April 8, 2002, p. 28).

10
230 trading day interval ( 250, 21) by regressing the firm stock return against the CRSP
equally-weighted market index returns.
4. Announcement returns
Panel A of Table 2 reports acquirer abnormal returns by deal order.9 Self-attribution bias
suggests that overconfidence plays a larger role for higher order deals. The prediction is that
higher order deals will exhibit more negative wealth effects than first deals. For first deals, we
find the mean acquirer abnormal return over the three-day window surrounding the
announcement date is 0.10%, insignificantly different from zero. This finding contrasts with
recent studies that document negative abnormal returns to acquirers of public companies over a
similar time period (see Fuller, Netter and Stegemoller (2002) and Moeller, Schlingemann, and
Stulz (2005)). However, examination of deals that follow at least one previous deal in the last
five years exhibit negative announcement returns. Acquisitions with a deal order of 2, 3, 4, 5, 6,
and 7 all have at least 37 observations and have abnormal returns of 1.54%, 1.37%, 1.66%,
1.21%, 1.74%, and 1.96%. Moreover, all of these figures are significantly different from
zero at the one percent level. Combining all deals with a deal order of two or more results in a
mean abnormal return of 1.50% with a cross-sectional t-statistic of 9.43. These results suggest
that the value loss associated with acquisitions of public companies is concentrated in higher-
order deals by frequent acquirers.
Self-attribution also predicts this difference in first and higher order deals to exist within
the sample of frequent acquirers. This difference could be entirely due to differences between
frequent and infrequent acquirers. Panel B of Table 2 explores whether the announcement effects
of first deals differ between frequent acquirers and infrequent acquirers. While stratifying the
sample this way involves a look-ahead bias to determine if the firm engages in later acquisitions,
it allows us to see if the negative announcement effect is driven by systematically different firms.
9 The sample size in Table 1 and Table 2 differ due to the data requirements for calculating abnormal returns.

11
We find 1,566 of the 2,206 first deals are made by infrequent acquirers. The average abnormal
return for this group is 0.01%, statistically indistinguishable from zero. For frequent acquirers,
we find first deal abnormal returns average 0.31%, also statistically insignificant. The
difference between the first deal abnormal returns for frequent and infrequent acquirers is also
insignificant. The difference between frequent acquirer abnormal returns to first versus higher
order deals is significant at the one percent level. Thus, it appears that the negative abnormal
return to frequent acquirers is only found in higher-order deals, where previous acquisition
experience may lead to the development of hubris.
Another possible explanation for the different wealth effects could be differences in the
propensity to use cash or stock as the method of payment. Numerous studies argue that all cash
offers are associated with acquirers unlikely to be overvalued and all equity offers are associated
with acquirers most likely to be overvalued. Consistent with this notion, Asquith, Bruner, and
Mullins (1987) document cash offers are associated with less negative acquirer announcement
returns, and all equity offers are associated with more negative announcement returns. Fuller,
Netter, and Stegemoller (2002) show that the acquirers stock price reaction depends on whether
the method of payment is stock, cash or a mixture of the two. They report acquirers of public
targets earn significantly negative abnormal returns when the method of payment is stock, and
insignificant returns when all cash or a mixture of cash and stock is used. For our purposes, if
frequent acquirers tend to use stock more often in higher-order deals then this would provide an
alternative explanation to self-attribution bias.
Panel C of Table 2 reports the announcement returns for both first deals and higher-order
deals stratified by the method of payment. For first deals, we find cash acquisitions result in
significantly positive acquirer wealth effects. The average acquirer abnormal return for this
subsample of deals is 1.23%. In contrast, when stock is used in first deals the average acquirer
abnormal return is 1.20%, significant at the one percent level. First deals with a mixture of cash
and stock as the method of payment result in an insignificant mean abnormal return of 0.25%.
For higher-order deals we find that the average abnormal return is an insignificant 0.05% for
12
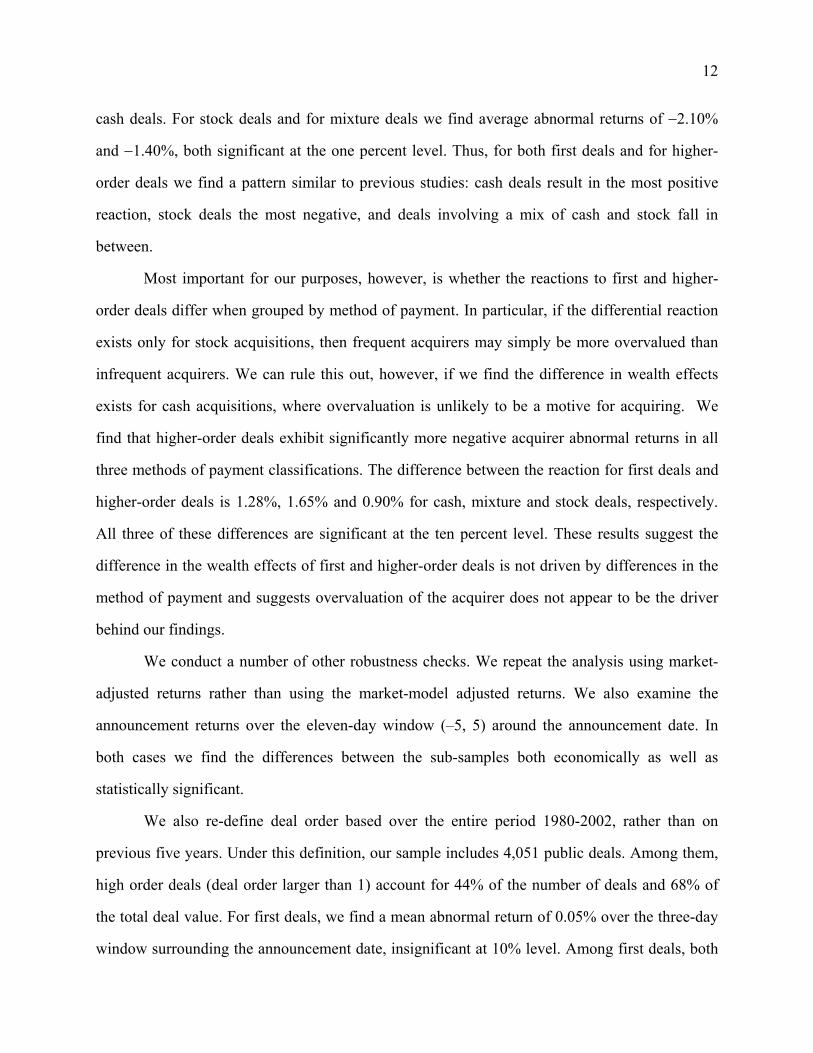
cash deals. For stock deals and for mixture deals we find average abnormal returns of 2.10%
and 1.40%, both significant at the one percent level. Thus, for both first deals and for higher-
order deals we find a pattern similar to previous studies: cash deals result in the most positive
reaction, stock deals the most negative, and deals involving a mix of cash and stock fall in
between.
Most important for our purposes, however, is whether the reactions to first and higher-
order deals differ when grouped by method of payment. In particular, if the differential reaction
exists only for stock acquisitions, then frequent acquirers may simply be more overvalued than
infrequent acquirers. We can rule this out, however, if we find the difference in wealth effects
exists for cash acquisitions, where overvaluation is unlikely to be a motive for acquiring. We
find that higher-order deals exhibit significantly more negative acquirer abnormal returns in all
three methods of payment classifications. The difference between the reaction for first deals and
higher-order deals is 1.28%, 1.65% and 0.90% for cash, mixture and stock deals, respectively.
All three of these differences are significant at the ten percent level. These results suggest the
difference in the wealth effects of first and higher-order deals is not driven by differences in the
method of payment and suggests overvaluation of the acquirer does not appear to be the driver
behind our findings.
We conduct a number of other robustness checks. We repeat the analysis using market-
adjusted returns rather than using the market-model adjusted returns. We also examine the
announcement returns over the eleven-day window (�5, 5) around the announcement date. In
both cases we find the differences between the sub-samples both economically as well as
statistically significant.
We also re-define deal order based over the entire period 1980-2002, rather than on
previous five years. Under this definition, our sample includes 4,051 public deals. Among them,
high order deals (deal order larger than 1) account for 44% of the number of deals and 68% of
the total deal value. For first deals, we find a mean abnormal return of 0.05% over the three-day
window surrounding the announcement date, insignificant at 10% level. Among first deals, both

13
frequent acquirers and infrequent acquirers have insignificant mean abnormal returns. For high
order deals, the mean abnormal return is �1.5%, significant at 1% level.
The financial sector went through enormous consolidation during our sample period
resulting in a large number of frequent acquirers. To see whether this industry effect drives our
results we eliminated all financial firms from the sample and reexamined the wealth effects. This
reduces the sample by 1,463 deals, 777 of which are high order deals. For first deals, the mean
abnormal return is 0.05% over the three-day window surrounding the announcement date, not
significantly different from zero. For high order deals, the mean abnormal return is �1.9%,
significant at the 1% level. Thus, our results are not driven solely by consolidation in the
financial industry.
To see whether our results apply to a broad spectrum of deals, we include acquisitions of
3,883 private targets and 934 subsidiaries of public firms during the period of 1985-2000. For
first deals of the enlarged sample, the mean abnormal return is 1.92% over the three-day window
surrounding the announcement date, significant at 1% level. For high order deals, the mean
abnormal return is 0.10%, insignificant at 10% level. The difference is significant at 1% level.
This relationship between first and higher order deals is also found within the sample of private
deals (See appendix for details). Overall, we interpret this as suggesting the difference between
first and higher order deals is quite robust.
4.1. Acquirer and deal characteristics
There may be other characteristics that systematically differ between first and higher-
order deals that could potentially explain the differential reaction. To check, we examine firm
and deal characteristics for the two groups of acquisitions. Table 3 reports descriptive statistics
for acquirers and deals stratified by first deals versus second and greater deals (higher-order
deals). We find that acquirers involved in higher-order deals are larger. The higher-order deal
acquirers have a mean (median) asset value that is 3.7 (7.4) times that for first deal acquirers.
Similarly, we find the investment opportunities of first deal acquirers, as proxied by the firm�s

14
Tobin�s q ratio, are much better than the investment opportunities of acquirers involved in
higher-order deals.
Table 3 also reports deal characteristics. We see the relative size of the target to the
acquirer is much larger for first deals. First deals are also more often conglomerate deals
(measured by whether the 2-digit SIC code of the target differs from that of the acquirer). These
two results are somewhat surprising given that relatively large deals and conglomerate deals
have both been shown to exhibit more negative announcement effects (see, for example, Moeller,
Schlingemann, and Stulz (2004)). We also see in Table 3 that first deals are more often done via
a tender offer, are more often made as all cash offers, and are less often made as all equity offers.
We later control for these differences in characteristics in multivariate regressions to see whether
they can account for the more negative announcement effects of higher-order deals.
4.2. Probability of acquiring and previous acquisition activity
Given the propensity to acquire exhibited by many of the frequent acquirers, one question
is whether higher order deals come as much of a surprise. If the market better anticipates higher-
order deals and incorporates some of the anticipated wealth effect, then the reaction at
announcement may be muted. We conduct a logit analysis to explore the impact of previous
acquisition activity on the likelihood a firm engages in an acquisition. We take all firms with
data from Compustat and CRSP and construct a panel dataset from 1985-2002. The dependent
variable in the logit analysis takes the value of one if SDC reports the firm acquirers a publicly
traded target firm in a given calendar year and equals zero otherwise. Our final dataset consists
of 99,807 firm-year observations.
The results are reported in Table 4. We include economy-wide, industry-wide and firm
specific characteristics as right hand side variables. We see that large firms, firms with high
ratios of free cash flow to assets, high Tobin�s q ratios, and high levels of liquid assets are more
likely to acquire. A firm�s leverage is negatively related to acquisition likelihood. We also see

15
that acquisitions are more likely to occur when the stock market as a whole has performed well
and when the firm�s stock performance has been strong.
Our main interest is whether previous acquisition activity explains future activity. Given
the well documented tendency for mergers to cluster in time and industry (see Mitchell and
Mulherin (1996), Gugler, Mueller and Yurtoglu (2004), and Rhodes-Kropf and Viswanathan
(2004)), we include controls for economy-wide and industry-wide acquisition activity, measured
as the natural log of one plus the number of deals in the previous year in the economy and
industry. Finally, to see if a firm�s past acquisition activity affects its likelihood of engaging in
additional acquisitions, we include the natural log of one plus the number of acquisitions the firm
has done in the previous five years. The coefficient on this variable is positive and significant at
the one percent level. In fact, it is the most statistically significant variable in the logit analysis.
The importance of past acquisition activity in predicting future acquisitions indicates that higher-
order deals should be less of a surprise to the market than first deals, implying the measured
announcement effects of higher-order deals may be somewhat muted. This suggests the
difference between the total wealth effects of first and higher-order deals may be understated by
announcement abnormal returns. Thus, we explore the effect of anticipation on the wealth effects
below.
4.3. Multivariate regressions of announcement returns
We conduct cross-sectional regressions of the acquirer abnormal returns to see if
differences in acquirer and deal characteristics explain the more negative abnormal return found
in higher-order deals. We include a dummy variable equal to one if the deal is preceded by one
or more deals in the previous five years. The first column of Table 5 reports the results. We find
firm size, Tobin�s q¸ and operating cash flow are all negatively related to the acquirer�s abnormal
return. We find the abnormal return increases in the relative size of the deal. Moreover we find
the acquirer�s abnormal return is larger if the form of acquisition is a tender offer, the method of
payment is all cash, and if the acquirer is in the financial industry. We find acquirer abnormal
16
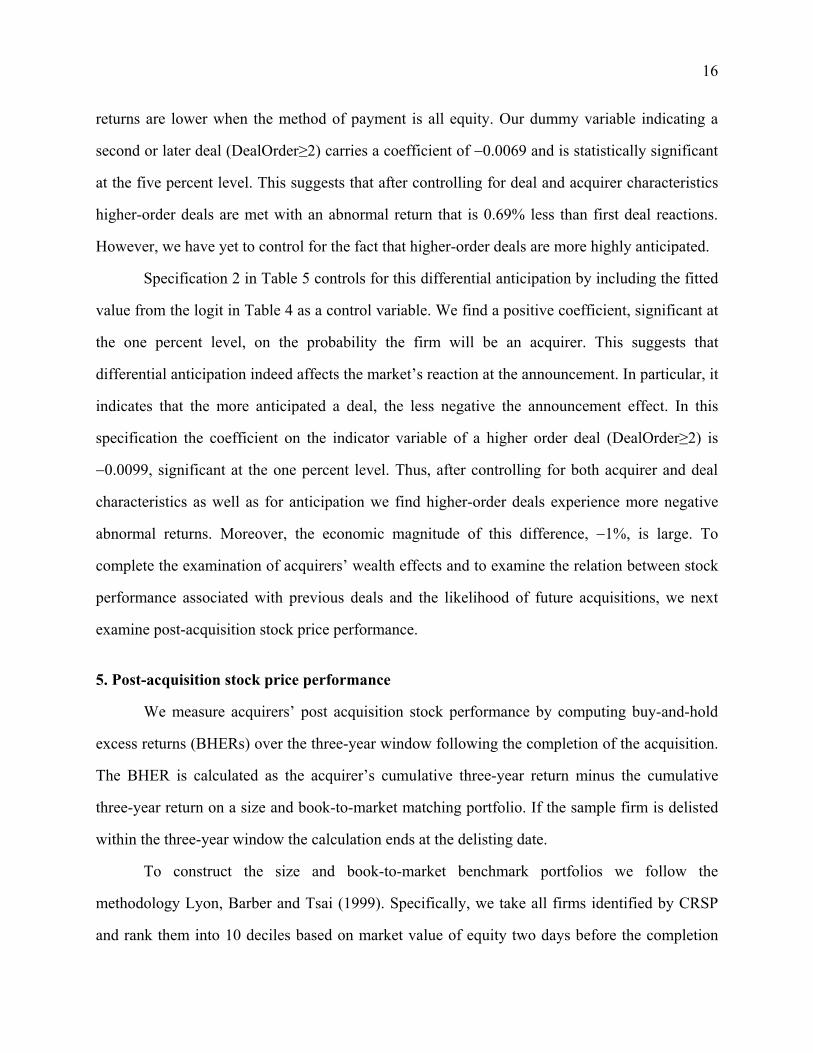
returns are lower when the method of payment is all equity. Our dummy variable indicating a
second or later deal (DealOrder 2) carries a coefficient of 0.0069 and is statistically significant
at the five percent level. This suggests that after controlling for deal and acquirer characteristics
higher-order deals are met with an abnormal return that is 0.69% less than first deal reactions.
However, we have yet to control for the fact that higher-order deals are more highly anticipated.
Specification 2 in Table 5 controls for this differential anticipation by including the fitted
value from the logit in Table 4 as a control variable. We find a positive coefficient, significant at
the one percent level, on the probability the firm will be an acquirer. This suggests that
differential anticipation indeed affects the market�s reaction at the announcement. In particular, it
indicates that the more anticipated a deal, the less negative the announcement effect. In this
specification the coefficient on the indicator variable of a higher order deal (DealOrder 2) is
0.0099, significant at the one percent level. Thus, after controlling for both acquirer and deal
characteristics as well as for anticipation we find higher-order deals experience more negative
abnormal returns. Moreover, the economic magnitude of this difference, 1%, is large. To
complete the examination of acquirers� wealth effects and to examine the relation between stock
performance associated with previous deals and the likelihood of future acquisitions, we next
examine post-acquisition stock price performance.
5. Post-acquisition stock price performance
We measure acquirers� post acquisition stock performance by computing buy-and-hold
excess returns (BHERs) over the three-year window following the completion of the acquisition.
The BHER is calculated as the acquirer�s cumulative three-year return minus the cumulative
three-year return on a size and book-to-market matching portfolio. If the sample firm is delisted
within the three-year window the calculation ends at the delisting date.
To construct the size and book-to-market benchmark portfolios we follow the
methodology Lyon, Barber and Tsai (1999). Specifically, we take all firms identified by CRSP
and rank them into 10 deciles based on market value of equity two days before the completion

17
date. We calculate a firm�s book-to-market ratio by dividing the firm�s book value of equity
(Compustat data item #60) measured the fiscal year end prior to the completion date by the
market value of equity measured two days prior to the completion date. Firms are next sorted
into five quintiles based on the book-to-market ratio. The result is a 10x5 matrix of size and
book-to-market benchmark portfolios. We then use all the firms that are in the same size deciles
and book-to-market quintile as the sample firm for the matching portfolio.
Following Lyon, Barber and Tsai (1999), we make statistical inferences based on
skewness-adjusted t-statistics, which for the mean BHER is calculated as
)6/(3/25.0 nSSntsa
where n is the sample size, S is the ratio of sample average to the standard deviation, and is the
sample skewness.
We present the results on the post acquisition stock performance in Table 6. Panel A
presents mean BHERs by deal order. We find the mean three-year buy-and-hold excess return
(BHER) to first deals by both frequent and infrequent acquirers is 4.80%, significantly different
from zero at the ten percent level. None of the mean BHERs associated with deal order values
of 2 to 7 (deal orders where we have at least 30 observations) are significant and, as a whole, the
mean BHER for higher-order deals (deal order>1) is a statistically insignificant 2.39%. While
there is weak evidence that first deals are followed by poor stock performance on average,
overall the insignificant long-term returns suggest that the announcement effects capture the
wealth effects of the acquisitions.10
Loughran and Vijh (1997) find significantly negative average long-term returns following
acquisitions where the method of payment is stock. They find positive long-term returns
following cash deals. We report the BHERs to first and higher-order deals broken out by method
10 In a slightly different sample over 1985-1997, the mean BHER following first deals is insignificantly different from zero. See Table 7.

18
of payment in panel B of Table 6. We find that the only significant BHER is for the higher-order
deals where cash is the method of payment. Interestingly, the BHERS are larger for the higher-
order deals in all three methods of payment categories. While weak, this evidence favors the
managerial skill hypothesis in that higher-order deals are associated with more positive long-
term wealth effects, at least for all cash deals. However, given the general lack of statistical
significance we hesitate to draw strong conclusions from these results.
The evidence presented so far are consistent with self-attribution bias leading to
overconfidence in that first deals (by both frequent and infrequent acquirers) are not value
destructive while high-order deals exhibit negative wealth effects (i.e., they have negative
announcement returns and insignificant post-acquisition abnormal returns). Moreover, Self-
attribution bias also predicts that successful deals are followed by more deals. Even if success,
measured by post-acquisition stock performance, is due to chance, managers will tend to credit
their own ability and therefore become overconfident and engage in more deals. We look more
closely into the sequence of deals and the relationship between past deal performance and future
deal activity.
Panel C of Table 6 examines the BHERs following first deals stratified by whether the
acquirer goes on to become a frequent acquirer. If self-attribution is present, we should see
BHERs following the first deal differ by whether the firm goes on to acquire again. The mean
BHER associated with first deals by the frequent acquirer group is 12.71%, statistically
significant at the one percent level. In contrast, the first deal mean BHER for the infrequent
group is 12.27%, also significant at the one percent level. These results are consistent with the
notion that success following first deals is likely to lead to future deals. However, these future
deals on average do not exhibit significant BHERs and are met with a negative reaction at
announcement. These results indicate frequent acquirers may suffer from managerial hubris
induced by self-attribution bias. We explore this dimension further below.
19
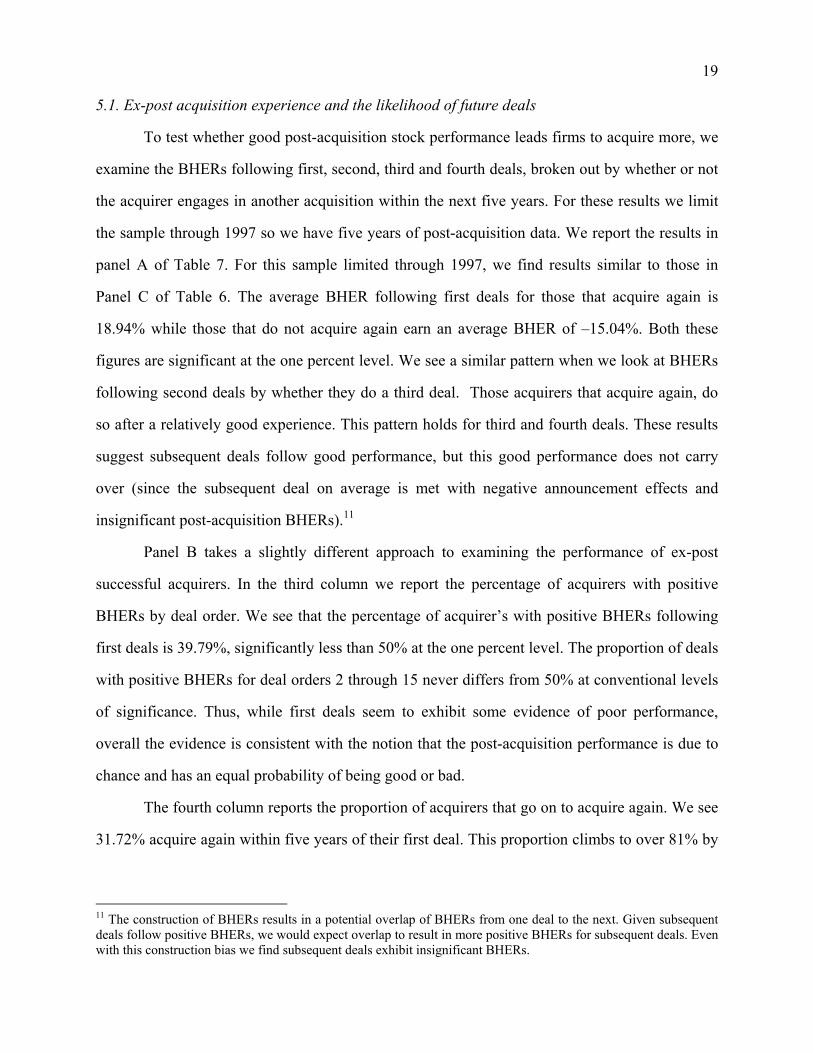
5.1. Ex-post acquisition experience and the likelihood of future deals
To test whether good post-acquisition stock performance leads firms to acquire more, we
examine the BHERs following first, second, third and fourth deals, broken out by whether or not
the acquirer engages in another acquisition within the next five years. For these results we limit
the sample through 1997 so we have five years of post-acquisition data. We report the results in
panel A of Table 7. For this sample limited through 1997, we find results similar to those in
Panel C of Table 6. The average BHER following first deals for those that acquire again is
18.94% while those that do not acquire again earn an average BHER of �15.04%. Both these
figures are significant at the one percent level. We see a similar pattern when we look at BHERs
following second deals by whether they do a third deal. Those acquirers that acquire again, do
so after a relatively good experience. This pattern holds for third and fourth deals. These results
suggest subsequent deals follow good performance, but this good performance does not carry
over (since the subsequent deal on average is met with negative announcement effects and
insignificant post-acquisition BHERs).11
Panel B takes a slightly different approach to examining the performance of ex-post
successful acquirers. In the third column we report the percentage of acquirers with positive
BHERs by deal order. We see that the percentage of acquirer�s with positive BHERs following
first deals is 39.79%, significantly less than 50% at the one percent level. The proportion of deals
with positive BHERs for deal orders 2 through 15 never differs from 50% at conventional levels
of significance. Thus, while first deals seem to exhibit some evidence of poor performance,
overall the evidence is consistent with the notion that the post-acquisition performance is due to
chance and has an equal probability of being good or bad.
The fourth column reports the proportion of acquirers that go on to acquire again. We see
31.72% acquire again within five years of their first deal. This proportion climbs to over 81% by
11 The construction of BHERs results in a potential overlap of BHERs from one deal to the next. Given subsequent deals follow positive BHERs, we would expect overlap to result in more positive BHERs for subsequent deals. Even with this construction bias we find subsequent deals exhibit insignificant BHERs.

20
the deal order 6 (the last deal order whose sample size is at least 30) and is significantly higher
than 50% for deal orders greater than 3. This is consistent with the notion that managers over
weight past positive acquisition experience and under weight poor experience. Such self-
attribution bias would lead to a higher rate of recidivism even though the rate of success (as
measured by the proportion of positive BHERs) does not similarly rise.
Another way to examine whether past acquisition experience is influencing managers to
make additional acquisitions is to conduct a logit analysis. The positive coefficient found on the
Firm Return variable (which measures the firm�s stock return in the previous year) in Table 4 is
consistent with the hubris hypothesis; however, it is also consistent with the overvaluation
hypothesis. To help distinguish these two interpretations, we estimate the logit regression
reported in Table 4 with an additional explanatory variable: the interaction of the firm�s stock
return in the previous year and a dummy variable indicating an acquisition occurred in the
previous five years, (Firm Return)x(PastDeal). A positive coefficient on this variable would
indicate that after controlling for past returns, a firm is more likely to engage in an acquisition
when they experience positive performance following a previous acquisition. The positive
coefficient also suggests negative performance following an acquisition acts as a deterrent to
future acquisitions. The results are reported in Table 8. While the results are similar to those in
Table 4, our main variable of interest, (Firm Return)x(PastDeal), has a positive and significant
coefficient. Moreover, the coefficient on this interactive variable is three times larger than the
coefficient on Firm Return. This indicates past stock performance that follows an acquisition is
much more influential on a firm�s decision to acquire than past performance in general. Taken
together, the results on the relationship between past ex-post acquisition performance and future
acquisition activity supports the hubris hypothesis.
6. Insider Trading Activity
So far our evidence is consistent with managers developing overconfidence. We now
examine their trading activity to see whether managers exhibit more optimistic trading behavior
21
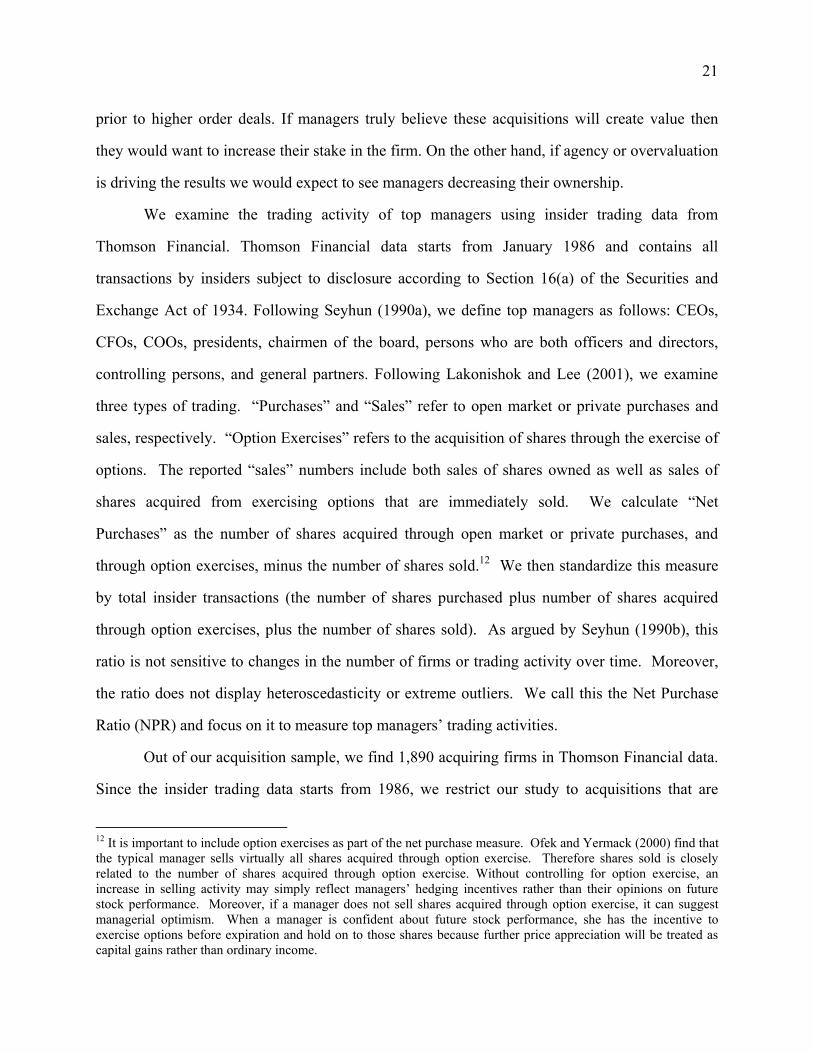
prior to higher order deals. If managers truly believe these acquisitions will create value then
they would want to increase their stake in the firm. On the other hand, if agency or overvaluation
is driving the results we would expect to see managers decreasing their ownership.
We examine the trading activity of top managers using insider trading data from
Thomson Financial. Thomson Financial data starts from January 1986 and contains all
transactions by insiders subject to disclosure according to Section 16(a) of the Securities and
Exchange Act of 1934. Following Seyhun (1990a), we define top managers as follows: CEOs,
CFOs, COOs, presidents, chairmen of the board, persons who are both officers and directors,
controlling persons, and general partners. Following Lakonishok and Lee (2001), we examine
three types of trading. �Purchases� and �Sales� refer to open market or private purchases and
sales, respectively. �Option Exercises� refers to the acquisition of shares through the exercise of
options. The reported �sales� numbers include both sales of shares owned as well as sales of
shares acquired from exercising options that are immediately sold. We calculate �Net
Purchases� as the number of shares acquired through open market or private purchases, and
through option exercises, minus the number of shares sold.12 We then standardize this measure
by total insider transactions (the number of shares purchased plus number of shares acquired
through option exercises, plus the number of shares sold). As argued by Seyhun (1990b), this
ratio is not sensitive to changes in the number of firms or trading activity over time. Moreover,
the ratio does not display heteroscedasticity or extreme outliers. We call this the Net Purchase
Ratio (NPR) and focus on it to measure top managers� trading activities.
Out of our acquisition sample, we find 1,890 acquiring firms in Thomson Financial data.
Since the insider trading data starts from 1986, we restrict our study to acquisitions that are
12 It is important to include option exercises as part of the net purchase measure. Ofek and Yermack (2000) find that the typical manager sells virtually all shares acquired through option exercise. Therefore shares sold is closely related to the number of shares acquired through option exercise. Without controlling for option exercise, an increase in selling activity may simply reflect managers� hedging incentives rather than their opinions on future stock performance. Moreover, if a manager does not sell shares acquired through option exercise, it can suggest managerial optimism. When a manager is confident about future stock performance, she has the incentive to exercise options before expiration and hold on to those shares because further price appreciation will be treated as capital gains rather than ordinary income.
22
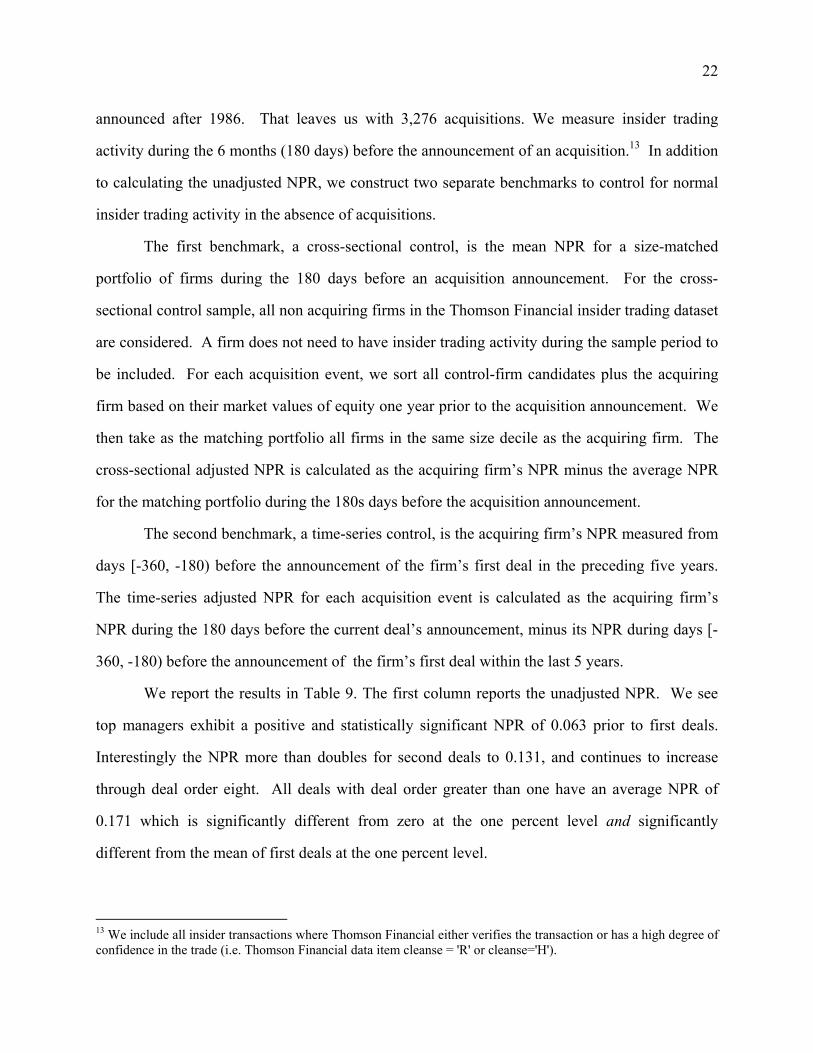
announced after 1986. That leaves us with 3,276 acquisitions. We measure insider trading
activity during the 6 months (180 days) before the announcement of an acquisition.13 In addition
to calculating the unadjusted NPR, we construct two separate benchmarks to control for normal
insider trading activity in the absence of acquisitions.
The first benchmark, a cross-sectional control, is the mean NPR for a size-matched
portfolio of firms during the 180 days before an acquisition announcement. For the cross-
sectional control sample, all non acquiring firms in the Thomson Financial insider trading dataset
are considered. A firm does not need to have insider trading activity during the sample period to
be included. For each acquisition event, we sort all control-firm candidates plus the acquiring
firm based on their market values of equity one year prior to the acquisition announcement. We
then take as the matching portfolio all firms in the same size decile as the acquiring firm. The
cross-sectional adjusted NPR is calculated as the acquiring firm�s NPR minus the average NPR
for the matching portfolio during the 180s days before the acquisition announcement.
The second benchmark, a time-series control, is the acquiring firm�s NPR measured from
days [-360, -180) before the announcement of the firm�s first deal in the preceding five years.
The time-series adjusted NPR for each acquisition event is calculated as the acquiring firm�s
NPR during the 180 days before the current deal�s announcement, minus its NPR during days [-
360, -180) before the announcement of the firm�s first deal within the last 5 years.
We report the results in Table 9. The first column reports the unadjusted NPR. We see
top managers exhibit a positive and statistically significant NPR of 0.063 prior to first deals.
Interestingly the NPR more than doubles for second deals to 0.131, and continues to increase
through deal order eight. All deals with deal order greater than one have an average NPR of
0.171 which is significantly different from zero at the one percent level and significantly
different from the mean of first deals at the one percent level.
13 We include all insider transactions where Thomson Financial either verifies the transaction or has a high degree of confidence in the trade (i.e. Thomson Financial data item cleanse = 'R' or cleanse='H').

23
The second column of results reports the mean cross-sectional adjusted NPRs. We see
first deals have a mean adjusted NPR of 0.016, statistically indistinguishable from zero, while
higher order deals have a mean adjusted NPR of 0.127. The adjusted NPR for higher order deals
is both significantly different from zero and significantly different from the mean for first order
deals at the one percent level.
Finally, the third column presents the time-series adjusted NPR results. For first deals we
see the time-series adjusted NPR is �0.011, not statistically different from the time-series
benchmark. In other words, first deals are not preceded by any abnormal insider trading when
benchmarked against the firm�s pre-acquisition NPR. For second and greater deals we find an
average NPR of 0.054, significant at the one percent level. The difference between the mean
NPR for first deals and higher order deals is also significant at the one percent level. Taken as a
whole, these results support the notion that managers are more confident going into higher order
deals than going into first deals. This is consistent with managers� developing overconfidence in
their acquisition expertise.
7. Conclusions
We explore the role of acquirers� acquisition history in mergers and acquisitions. Our
results suggest that self-attribution of past success leads to hubris in future decision making.
Investigation of the announcement effects reveals that acquisitions by frequent acquirers are
value-destructive. However this negative effect is isolated in high order deals. When we compare
the first deals done by the frequent acquirers (who go on to acquire more deals within five years)
to first deals done by infrequent acquirers, we see both groups exhibit insignificant abnormal
returns. This is consistent with the notion that hubris developed from past acquisitions leads to
value-destructive deals.
We also find that these value-destructive high-order deals are motivated by previous
acquisition experience. Acquirers who acquire another company within five years of a previous
acquisition exhibit positive long-run performance subsequent to their first deals. In contrast,

24
acquirers who stop after their first deals on average have negative long-run performance. The
same pattern holds subsequent to second, third and fourth acquisitions. A logit regression also
suggests that the likelihood of making another acquisition increases with positive experience in
past acquisitions. Yet these additional acquisitions are met with significantly negative
announcement returns and insignificant long-run returns, suggesting they are value destructive.
We also find evidence that the market forms expectations of future deals based on an
acquirer�s acquisition history and these expectations are impounded into stock prices. We
examine the likelihood a firm will engage in a public acquisition in a given year using a logit
regression. The most statistically significant variable is the acquirer�s prior acquisition activity.
We then include the predicted probability from the logit analysis as a control variable in the
multivariate regression of announcement effect. We find a positive coefficient on the probability
of an acquisition suggesting that the anticipation dampens the market reaction when a deal is
announced. Nevertheless, higher order deals continue to exhibit abnormal returns that ae
significantly more negative than those of first deals.
Finally, we examine the trading behavior of top managers leading up to the acquisition
announcement. We find top managers� net purchase of stock is greater preceding higher order
deals than it is for first deals. This suggests managers are more confident about firm prospects
heading into higher order deals, even though these higher order deals are met with significantly
negative wealth effects. Taken as a whole, we interpret our evidence as consistent with
overconfidence stemming from self-attribution bias.

25
References
Andrade, Gregor, Mark L. Mitchell, and Erik Stafford, 2001, New evidence and perspectives on mergers, Journal of Economic Perspectives 15, 103-120.
Asquith, Paul, Robert F. Bruner, and David W. Mullins, 1983, The gains to bidding firms from merger, Journal of Financial Economics 11, 121-139.
Asquith, Paul and E. Han Kim, 1982, The impact of merger bids on the participating firms� security holders, Journal of Finance 37, 1209-1228.
Baker, Malcolm, Richard Ruback, and Jeffrey Wurgler, 2004, Behavioral Corporate Finance: A Survey, NBER working paper #10863.
Berkovitch, Elazar and M.P. Narayanan, 1993, Motives for takeovers: An empirical investigation, Journal of Financial and Quantitative Analysis 28, 347-362.
Bhabra, Gurmett S., Bhabra, Harjeet S., and Glenn W. Boyle, 1999, Leverage and the wealth gains from acquisition program announcements, University of Otago working paper.
Bruner, Robert F., 2002, Does M&A pay? A survey of evidence for the decision maker, Journalof Applied Finance 12, 7-27.
Fuller, Kathleen, Jeffry Netter, and Mike Stegemoller, 2002, What do returns to acquiring firms tell us: Evidence from firms that make many acquisitions, Journal of Finance 57, 1763-1793.
Gervais, Simon and Terrance Odean, 2001, Learning to be Overconfident, Review of Financial Studies 14, 1-27.
Gilovich, Thomas, Dale Griffin, and Daniel Kahneman, eds., 2002, Heuristics and Biases: The psychology of intuitive judgment, Cambridge University Press, Cambridge, UK.
Gugler, Klaus, Mueller, Dennis C., and B. Burcin Yurtoglu, 2004, The determinants of merger waves, University of Vienna working paper.
Hietala, Pekka, Steven N. Kaplan, and David T. Robinson, 2003, What Is the Price of Hubris? Using Takeover Battles to Infer Overpayments and Synergies, Financial Management32(3), 5-31.
Hirshleifer, David, 2001, Investor Psychology and Asset Pricing, Journal of Finance 56, 1533-1597.
Holmstrom, Bengt and Steven N. Kaplan, 2001, Corporate governance and merger activity in the United States: Making sense of the 1980s and 1990s, Journal of Economic Perspectives15, 121-144.

26
Jarrell, Gregg A., James A. Brickley, and Jeffry Netter, 1988, The market for corporate control: The empirical evidence since 1980, Journal of Economic Perspectives 2, 49-68.
Jarrell, Gregg A., and Annette B. Poulsen, 1989a, Stock trading before the announcement of tender offers: Insider trading or market anticipation, Journal of Law, Economics, and Organization 5, 225-248.
Jarrell, Gregg A. and Annette B. Poulsen, 1989b, The returns to acquiring firms in tender offers: Evidence from three decades, Financial Management 18, 12-28.
Jensen, Michael C. and Richard S. Ruback, 1983, The market for corporate control: The scientific evidence, Journal of Financial Economics 11, 5-50.
Kahneman, Daniel and Amos Tversky, eds., 2000, Choices, Values, and Frames, Cambridge University Press, Cambridge,UK.
Lakonishok, Josef, and Inmoo Lee. 2001. Are insider trades informative? Review of Financial Studies 14: 79-111.
Loughran Tim and Vijh Anand, 1997, Do long-term shareholders benefit from corporate acquisitions? Journal of Finance 52, 1765-1790.
Lyon, John, Barber, Brad, Tsai, Chih-Ling, 1999, Improved methods for tests of long-run abnormal stock returns, Journal of Finance 54, 165-201.
Malmendier, Ulrike and Geoffrey Tate, 2003, Who Makes Acquisitions? CEO Overconfidence and the Market's Reaction, working paper, Stanford University.
Martin, Kenneth, 1996, The method of payment in corporate acquisitions, Investment opportunities, and management ownership, Journal of Finance 51, 1227-1246.
Mitchell, Mark L. and Harold Mulherin, 1996, The impact of industry shocks on takeover and restructuring activity, Journal of Financial Economics, 41, 193-229.
Moeller, Sara B., Frederik P. Schlingemann, and René M. Stulz, 2005, Wealth destruction on a massive scale? A study of acquiring-firm returns in the recent merger wave, Journal of Finance, 60, 757-782.
Moeller, Sara B., Frederik P. Schlingemann, and René M. Stulz, 2004, Firm size and the gains from acquisitions, Journal of Financial Economics, 73, 201-228.
Ofek, Eli, and David Yermack. 2000. Taking stock: Equity-based compensation and the evolution of managerial ownership. Journal of Finance 55, 1367�84.
Rhodes-Kropf, Matthew and S. Viswanathan, 2004, Market Valuation and Merger Waves, Journal of Finance, 59, 2685-2718.

27
Roll, Richard, 1986, The hubris hypothesis of corporate takeovers, Journal of Business 59, 197-216.
Schipper, Katherine and Rex Thompson, 1983, The impact of merger-related regulations on the shareholders of acquiring firms, Journal of Accounting Research 21, 184-221.
Schipper, Katherine and Rex Thompson, 1983, Evidence on the capitalized value of merger activity for acquiring firms, Journal Financial Economics 11, 85-119.
Schwert, G. William, 2000, Hostility in takeovers: In the eyes of the beholder? Journal of Finance 55, 2599-2640.
Seyhun, H. Nejat. 1990a. Do bidder managers knowingly pay too much for the target firms. Journal of Business 63, 439-464.
Seyhun, H. Nejat. 1990b. Overreaction or fundamentals: Some lessons from insiders' response to the market crash of 1987. Journal of Finance 45, 1363-1388.
Travlos, Nicklaos, 1987, Corporate takeover bids, method of payment, and bidding firms� stock returns. Journal of Finance 42, 943-963.

28
APPENDIX
Results for a Sample of Public and Private Targets
In the body of the paper we restrict our sample to deals involving publicly traded targets.
We now explore the sample of deals involving private, subsidiary, and public target firms. As a
whole our results are markedly similar. We briefly discuss the results for this broader sample
and present announcement effects in Table A1. A complete set of results is available from the
authors upon request.
Table A1 reports the announcement effects by deal order for this larger sample as well as
broken out for public and private target deals. We see higher order deals are met with
significantly lower announcement returns than first deals, and this 1.82% difference is both
economically as wells as statistically significant. The first deal abnormal returns for frequent
acquirers and infrequent acquirers are statistically indistinguishable. Again the difference is with
higher order deals and not characteristics of frequent acquirers.
We further break out the sample by whether the deal involves a public or private target.
However, acquisition experience in one type of deal (say, private) may effect the next acquisition
even if it is of a different type (say, public). So, we keep the deal order based on the broad
sample. We find for both public and private deals, first deals exhibit significantly more positive
announcement effect than higher order deals. The public sample results are very similar to those
in the main body of the paper. It is well documented that private deals elicit positive stock price
reactions for the acquirer. Interestingly, we find very large positive reactions to first deals,
2.78% on average. The reaction to higher order deals is a positive and significant 1.57%.
Interestingly the difference between first and higher order deals is 1.22%, significant at the one
percent level. We see in panel B that first deals announcement returns for frequent acquirers are
not statistically different from infrequent acquirers for the pooled, public, and private samples.
Panel C of Table A1 partitions the sample by the method of payment. We find the
difference between first and higher order deal mean abnormal returns is significantly positive for
mixed deals and stock deals. The difference for cash deals is also positive but not statistically

29
significant. Further breakouts by target status and method of payment show similar results for
public deals and private deals.
While not reported, we re-run all of our tests using this broad sample. We summarize the
remainder of results below:
1) Logit results: We find acquisitions are much more likely for firms with past acquisition experience. We also find results similar to those reported in Table 8: we find that stock returns following a past acquisition are an important determinant of future acquisition likelihood.
2) Cross-sectional regressions of the acquirer announcement effect: We include a dummy variable for public targets. We find the coefficient on this dummy is negative and significant in both specifications. Most importantly for our purposes, however, is that the coefficient on the indicator variable of a higher order deal is negative and significant at the five percent level in both specifications (with and without the probability of an acquisition as an explanatory variable).
3) BHERs: We find firms that go onto acquire again within five years experience positive BHERs following their first deal while those that do not acquire again experience negative BHERs. A similar pattern follows the 2nd, 3rd and 4th deals. Namely, those firms that continue to acquire experience positive BHERs and those that stop acquiring experience significantly negative BHERs.
4) Top management insider trading: Top managements� net purchase of stock prior to acquisitions show that higher order deals are associated with greater net purchases of stock by insiders than first deals. We interpret this as evidence that mangers are more confident about the prospects of these higher order deals.
30
Table 1 M&A Activity among Frequent and Infrequent Acquirers
The sample consists of all completed mergers and acquisitions of publicly traded US targets made by publicly traded US acquirers in the period 1985-2002. Deal order is based on the number of deals the acquirer announced in the previous five years. For example, a deal order value of 3 suggests the acquirer announced two acquisitions in the five years prior to the current deal. A frequent acquirer is defined as a firm that has two or more deals within a five-year period. Value of Deals is the aggregate deal values measured in 2002 millions of dollars.
Panel A: Acquirer�s Deal Order
DealOrder
Number of Deals
Value of Deals ($ millions)
1 2,234 1,576,534
2 723 1,034,127
3 300 429,937
4 161 292,848
5 101 121,640
6 57 171,975
7 37 36,017
8 23 27,103
9 17 19,352
10 10 11,643
11 7 7,742
12 7 5,098
13 7 3,528
14 6 5,502
15 5 22,274
16 3 1,830
17 2 445
18 1 465
19 1 371
Panel B Frequent vs. Infrequent Acquirers
Number of Acquirers
Percent of
Acquirers Number of
DealsPercent of Deals
Value of Deals ($ millions)
Percent of Deal Value
Infrequent Acquirers 1,493 68.24% 1,585 42.81% 1,032,590 27.40%
Frequent Acquirers 695 31.76% 2,117 57.19% 2,735,841 72.60%
Total 2,188 3,702 3,768,431

31
Table 2 Acquirer Abnormal Returns among Frequent and Infrequent Acquirers
Sample consists of all completed mergers and acquisitions of publicly traded US targets made by publicly traded US acquirers in the period 1985-2002. Deal order is based on the number of deals the acquirer announced in the previous five years. For example, a deal order value of 3 suggests the acquirer announced two acquisitions in the five years prior to the current deal. A frequent acquirer is defined as a firm that has two or more deals within a five-year period. CAR is the cumulative abnormal return measured over the event window (-1,1) where day 0 is the
announcement date. The abnormal return is calculated based on market model parameters estimated over days 250
to 21. t-statistics are calculated based on the cross-sectional standard deviation of the CARs.
Panel A: Acquirer�s Deal Order
Deal Order Number of deals CAR(-1,1) t-stat
1 2,206 -0.0010 -0.41
2 720 -0.0154 -5.93 ***
3 299 -0.0137 -3.97 ***
4 160 -0.0166 -4.53 ***
5 101 -0.0121 -2.67 ***
6 57 -0.0174 -3.12 ***
7 37 -0.0196 -3.95 ***
8 23 -0.0084 -0.90
9 17 -0.0183 -1.78 *
10 10 -0.0104 -0.71
11 7 0.0081 0.53
12 7 -0.0214 -1.20
13 7 -0.0186 -1.37
14 6 -0.0085 -0.97
15 5 -0.0201 -2.00
16 3 -0.0288 -6.72 **
17 2 -0.0043 -0.55
18 1 -0.0036 NA
19 1 -0.0036 NA
2 1463 -0.0150 -9.43 ***
Difference: 1 vs. 2 0.0140 4.86 ***

32
Table 2, continued
Panel B: Frequent vs. Infrequent Acquirers
Acquirer Type
Number of Deals CAR(-1,1) t-stat
Infrequent 1,566 -0.0001 -0.03
Frequent
1st Deals 640 -0.0031 -1.16
2nd Deals 1,463 -0.0150 -9.43***
Diff: 1st Infreq � 1st Freq 0.0030 0.72
Panel C: Method of Payment
Deal Order Cash Mixed Stock
1st Deals CAR( 1,1) 0.0123 *** 0.0025 -0.0120 ***
N 574 730 902
2nd Deals CAR( 1,1) -0.0005 -0.0140 *** -0.0210 ***
N 298 398 767
Difference CAR 0.0128 *** 0.0165 *** 0.0090 *
***, **, and * denote significance at the 1, 5, and 10 percent level.

33
Tab
le 3
A
cqui
rer
and
Dea
l Cha
ract
eris
tics
by
Dea
l Ord
er
Sam
ple
co
nsi
sts
of
all
com
ple
ted
mer
ger
s an
d a
cqu
isit
ion
s o
f p
ubli
cly t
rad
ed U
S t
arg
ets
mad
e b
y p
ubli
cly t
rad
ed U
S a
cqu
irer
s in
th
e p
erio
d 1
985
-20
02
. D
eal
ord
er i
s b
ased
on
th
e nu
mb
er o
f d
eals
th
e ac
qu
irer
an
nou
nce
d i
n t
he
pre
vio
us
fiv
e yea
rs.
For
exam
ple
, a
dea
l o
rder
val
ue
of
3 s
ug
ges
ts t
he
acqu
irer
anno
un
ced
tw
o a
cqu
isit
ion
s in
th
e fi
ve
yea
rs p
rior
to t
he
curr
ent
dea
l. A
sset
s an
d M
ark
et v
alu
e o
f eq
uit
y a
re e
xpre
ssed
in
mil
lio
ns
of
con
stan
t 1
98
0 d
oll
ars
wh
ere
asse
ts a
re
def
late
d b
y t
he
CP
I an
d t
he
mar
ket
val
ue
of
equ
ity i
s d
efla
ted
usi
ng
th
e C
RS
P v
alu
e-w
eig
hte
d m
ark
et p
ort
foli
o r
eturn
. M
ark
et v
alue
of
equ
ity i
s m
easu
red
tw
o
trad
ing
day
s p
rio
r to
the
ann
ou
nce
men
t, a
nd A
sset
s an
d o
ther
Co
mp
ust
at d
ata
are
from
th
e fi
scal
yea
r en
d p
rio
r to
th
e an
no
unce
men
t. T
ob
in�s
q i
s ca
lcula
ted a
s to
tal
asse
ts m
inu
s boo
k e
qu
ity p
lus
the
mar
ket
val
ue
of
equ
ity a
ll d
ivid
ed b
y t
ota
l as
sets
. O
per
atin
g c
ash f
low
is
cash
flo
w f
rom
op
erat
ion
s fr
om
th
e st
atem
ent
of
cash
flo
ws
(if
this
ite
m i
s u
nav
aila
ble
then
op
erat
ing
cas
h f
low
is
sale
s m
inu
s th
e su
m o
f co
sts
of
go
od
so
ld,
SG
&A
, an
d c
han
ges
in
work
ing
cap
ital
),
stan
dar
diz
ed b
y a
sset
s. R
elat
ive
size
is
the
rati
o o
f d
eal
val
ue
to t
he
acq
uir
er�s
mar
ket
val
ue
of
equ
ity. C
ong
lom
erat
e D
eal
equ
als
on
e if
th
e ac
qu
irer
an
d t
arg
et a
re
in t
he
sam
e tw
o-d
igit
SIC
co
de
and
zer
o o
ther
wis
e. T
end
er e
qu
als
one
if t
he
acq
uir
er m
akes
a t
end
er o
ffer
and z
ero
oth
erw
ise.
Ho
stil
e eq
ual
s o
ne
if S
DC
cl
assi
fies
the
acqu
isit
ion
as
host
ile
and
equal
s ze
ro o
ther
wis
e. C
ash
Dea
l eq
ual
s o
ne
if t
he
met
ho
d o
f p
aym
ent
is a
ll c
ash
an
d z
ero o
ther
wis
e. E
quit
y D
eal
equal
s o
ne
if t
he
met
hod
of
pay
men
t is
all
equ
ity a
nd
zer
o o
ther
wis
e. C
om
pet
itio
n e
qu
als
one
if o
ther
bid
der
s ex
ist
and
eq
ual
s ze
ro o
ther
wis
e. L
iqu
idit
y I
ndex
is
the
val
ue
of
all
corp
ora
te c
ontr
ol
tran
sact
ions
wit
h a
val
ue
gre
ater
th
an 1
mil
lio
n r
epo
rted
by S
DC
for
each
yea
r an
d 2
-dig
it S
IC c
od
e, d
ivid
ed b
y t
he
tota
l as
sets
of
Co
mp
ust
at f
irm
s in
th
e sa
me
yea
r an
d 2
-dig
it S
IC c
od
e. F
inan
cial
fir
m e
qu
als
on
e if
the
acq
uir
er�s
SIC
is
bet
wee
n 6
000
an
d 6
99
9 a
nd e
qu
als
zero
oth
erw
ise.
1st D
eals
2nd D
eals
Dif
fere
nce
Acq
uire
r C
hara
cter
istic
s N
M
ean
Med
ian
N
Mea
n
Med
ian
Mea
n
M
edia
n
Ass
ets
2,0
51
2
,243
2
95
1
,380
8
,326
2
,193
-6
,084
***
-1
,898*
**
Mar
ket
Val
ue
of
Equ
ity
2,2
34
2
71
4
7
1,4
68
6
27
2
17
-3
56
***
-1
70
***
Tob
in�s
q
2,0
50
4
.12
1
.45
1
,380
2
.12
1
.18
2
.01
***
0
.27
***
Lon
g-t
erm
deb
t/as
sets
2
,027
0
.17
0
.11
1
,374
0
.15
0
.09
0
.01
**
0
.02
Op
erat
ing
cas
h f
low
/ass
ets
2,0
21
0
.05
0
.06
1
,375
0
.06
0
.03
0
.00
0
.03*
**
Dea
l Cha
ract
eris
tics
Rel
ativ
e si
ze o
f ta
rget
to
acq
uir
er
2,2
34
0
.65
0
.28
1
,468
0
.35
0
.12
0
.30
***
0
.16*
**
Co
ng
lom
erat
e d
eal
2,2
34
0
.35
1,4
66
0
.29
0.0
5*
**
Ten
der
2
,234
0
.18
1,4
68
0
.14
0.0
4*
**
Ho
stil
e 2
,234
0
.02
1,4
68
0
.02
0.0
0
Cas
h D
eal
2,2
34
0
.26
1,4
68
0
.21
0.0
6*
**
Equ
ity D
eal
2,2
34
0
.41
1,4
68
0
.52
-0.1
1*
**
Co
mp
etit
ion
2
,234
0
.03
1,4
68
0
.02
0.0
0
Liq
uid
ity i
nd
ex
2,2
34
0
.60
0
.01
1
,466
0
.04
0
.01
0
.56
0
.00
***
Fin
anci
al f
irm
2
,234
0
.29
1,4
68
0
.53
-0.2
5*
**
***
,**
, an
d *
den
ote
sig
nif
ican
ce a
t th
e 1
, 5,
and
10
per
cent
lev
el.
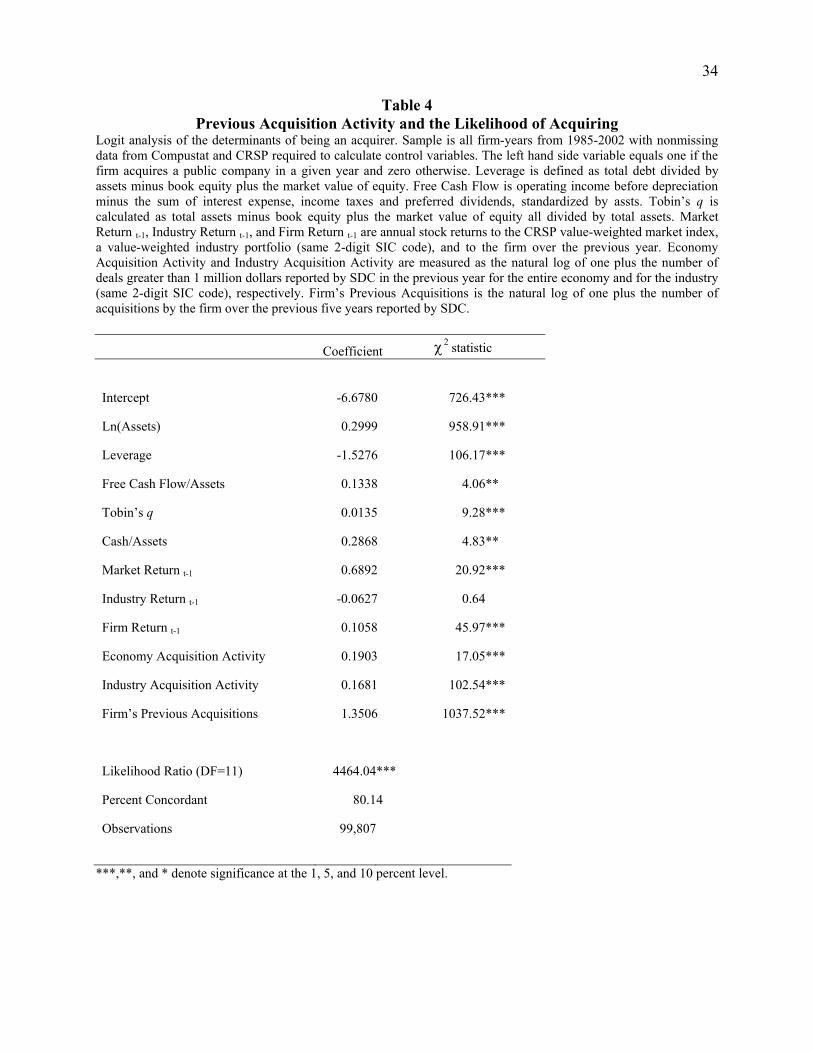
34
Table 4 Previous Acquisition Activity and the Likelihood of Acquiring
Logit analysis of the determinants of being an acquirer. Sample is all firm-years from 1985-2002 with nonmissing data from Compustat and CRSP required to calculate control variables. The left hand side variable equals one if the firm acquires a public company in a given year and zero otherwise. Leverage is defined as total debt divided by assets minus book equity plus the market value of equity. Free Cash Flow is operating income before depreciation minus the sum of interest expense, income taxes and preferred dividends, standardized by assts. Tobin�s q is calculated as total assets minus book equity plus the market value of equity all divided by total assets. Market Return t-1, Industry Return t-1, and Firm Return t-1 are annual stock returns to the CRSP value-weighted market index, a value-weighted industry portfolio (same 2-digit SIC code), and to the firm over the previous year. Economy Acquisition Activity and Industry Acquisition Activity are measured as the natural log of one plus the number of deals greater than 1 million dollars reported by SDC in the previous year for the entire economy and for the industry (same 2-digit SIC code), respectively. Firm�s Previous Acquisitions is the natural log of one plus the number of acquisitions by the firm over the previous five years reported by SDC.
Coefficient 2
statistic
Intercept -6.6780 726.43***
Ln(Assets) 0.2999 958.91***
Leverage -1.5276 106.17***
Free Cash Flow/Assets 0.1338 4.06**
Tobin�s q 0.0135 9.28***
Cash/Assets 0.2868 4.83**
Market Return t-1 0.6892 20.92***
Industry Return t-1 -0.0627 0.64
Firm Return t-1 0.1058 45.97***
Economy Acquisition Activity 0.1903 17.05***
Industry Acquisition Activity 0.1681 102.54***
Firm�s Previous Acquisitions 1.3506 1037.52***
Likelihood Ratio (DF=11) 4464.04***
Percent Concordant 80.14
Observations 99,807
***,**, and * denote significance at the 1, 5, and 10 percent level.

35Table 5
Regressions of Acquirer Abnormal Return on Deal Order Regression of acquirer abnormal return (CAR) around announcement. Sample is of all completed mergers and acquisitions of publicly traded US targets made by publicly traded US acquirers in the period 1985-2002. CAR is the cumulative abnormal return measured over the event window (-1,1) where day 0 is the
announcement date. The abnormal return is calculated based on market model parameters estimated over days 250 to 21. Assets are in constant 1980 dollars (deflated by the CPI). Relative size is the ratio of deal value to the acquirer�s market value of equity. Tobin�s q is calculated as total assets minus book equity plus the market value of equity all divided by total assets. Liquidity Index is the value of all corporate control transactions with a value greater than 1 million reported by SDC for each year and 2-digit SIC code, divided by the total assets of Compustat firms in the same year and 2-digit SIC code. Operating cash flow is cash flow from operations from the statement of cash flows. If this item is unavailable then operating cash flow is sales minus the sum of costs of good sold, SG&A, and changes in working capital. Pr(Acquisition) is the firm�s estimated probability of an acquisition based on the logit results presented in Table 4. Conglomerate Deal equals one if the acquirer and target are in the same two-digit SIC code and zero otherwise. Tender equals one if the acquirer makes a tender offer and zero otherwise. Hostile equals one if SDC classifies the acquisition as hostile and equals zero otherwise. Cash Deal equals one if the method of payment is all cash and zero otherwise. Equity Deal equals one if the method of payment is all equity and zero otherwise. Competition equals one if other bidders exist and equals zero otherwise. Financial firm equals one if the acquirer�s SIC is between 6000 and 6999 and equals zero otherwise. DealOrder 2 is a dummy variable equal to one if the deal order is larger than 1 and zero otherwise. Deal order is based on the number of deals the acquirer announced in the previous five years. For example, a deal order value of 3 suggests the acquirer announced two acquisitions in the five years prior to the current deal. t-statistics are adjusted using White�s correction for heteroskedasticity.
(1) (2)
Intercept 0.0117 0.0235
(1.40) (2.22)**
Ln(Assets) -0.0029 -0.0046
(-2.79)*** (-3.30)***
Relative size of target to acquirer 0.0032 0.0018
(2.54)** (1.09)
Tobin�s q -0.0006 -0.0015
(-2.89)*** (-1.86)*
Long-term Debt/Assets 0.0150 0.0118
(1.28) (0.84)
Liquidity Index -0.0001 -0.0001
(-15.35)*** (-13.80)***
Operating Cashflow -0.0909 -0.0949
(-2.89)*** (-2.67)***
Pr(Acquisition) 0.0277
(2.59)***
Conglomerate 0.0056 0.0036
(1.39) (0.85)
Tender 0.0102 0.0093
(2.61)*** (2.26)**
Hostile -0.0081 -0.0043
(-1.06) (-0.55)
Cash Deal 0.0154 0.0159
(4.22)*** (4.11)***
Equity Deal -0.0111 -0.0103
(-2.85)*** (-2.43)**
Competition -0.0143 -0.0101
(-1.71)* (-1.14)
Financial Firm 0.0098 0.0077
(2.36)** (1.57)
(DealOrder 2) -0.0069 -0.0099
(-2.51)** (-2.95)***
Adj R2 0.0556 0.0582
N 3,357 2,872
***,**, and * denote significance at the 1, 5, and 10 percent level.
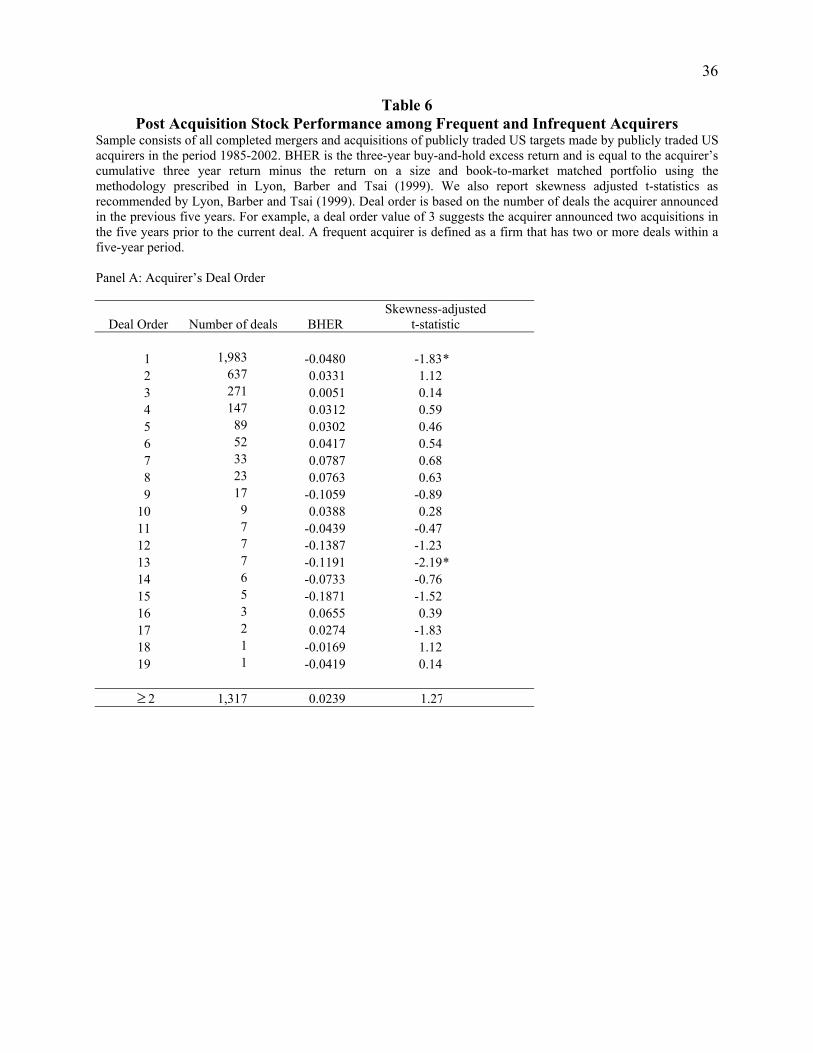
36
Table 6 Post Acquisition Stock Performance among Frequent and Infrequent Acquirers
Sample consists of all completed mergers and acquisitions of publicly traded US targets made by publicly traded US acquirers in the period 1985-2002. BHER is the three-year buy-and-hold excess return and is equal to the acquirer�s cumulative three year return minus the return on a size and book-to-market matched portfolio using the methodology prescribed in Lyon, Barber and Tsai (1999). We also report skewness adjusted t-statistics as recommended by Lyon, Barber and Tsai (1999). Deal order is based on the number of deals the acquirer announced in the previous five years. For example, a deal order value of 3 suggests the acquirer announced two acquisitions in the five years prior to the current deal. A frequent acquirer is defined as a firm that has two or more deals within a five-year period.
Panel A: Acquirer�s Deal Order
Deal Order Number of deals BHER Skewness-adjusted
t-statistic
1 1,983 -0.0480 -1.83*
2 637 0.0331 1.12
3 271 0.0051 0.14
4 147 0.0312 0.59
5 89 0.0302 0.46
6 52 0.0417 0.54
7 33 0.0787 0.68
8 23 0.0763 0.63
9 17 -0.1059 -0.89
10 9 0.0388 0.28
11 7 -0.0439 -0.47
12 7 -0.1387 -1.23
13 7 -0.1191 -2.19*
14 6 -0.0733 -0.76
15 5 -0.1871 -1.52
16 3 0.0655 0.39
17 2 0.0274 -1.83
18 1 -0.0169 1.12
19 1 -0.0419 0.14
2 1,317 0.0239 1.27

37
Table 6, continued
Panel B: Method of Payment
Deal Order Cash Mixed Stock
1st Deals BHER -0.0195 -0.0760 -0.0432
N 511 658 814
2nd Deals BHER 0.0907 ** -0.0212 0.0220
N 261 356 700
Panel C: Frequent vs. Infrequent Acquirers
Acquirer Type
Number of Deals BHER
Skewness-adjusted t-statistic
Infrequent 1,390 -0.1227 -3.36***
Frequent
1st Deals 593 0.1271 3.50***
2nd Deals 1,317 0.0239 1.27
***,**, and * denote significance at the 1, 5, and 10 percent level.
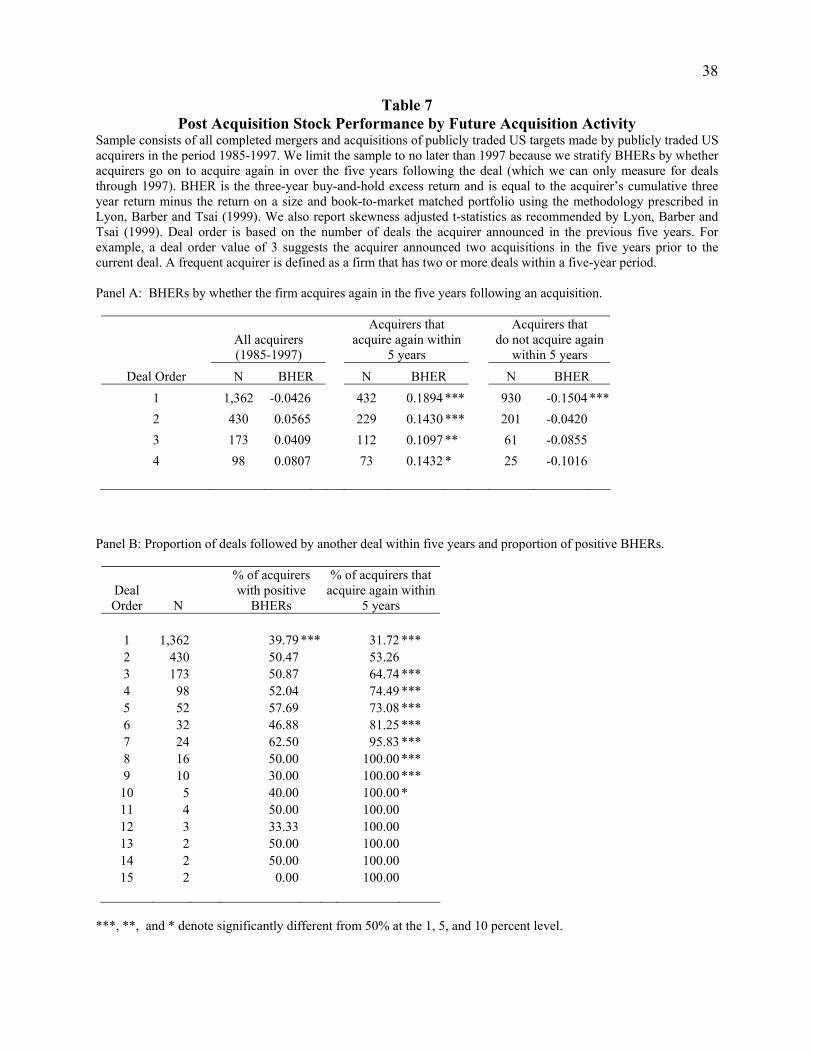
38
Table 7 Post Acquisition Stock Performance by Future Acquisition Activity
Sample consists of all completed mergers and acquisitions of publicly traded US targets made by publicly traded US acquirers in the period 1985-1997. We limit the sample to no later than 1997 because we stratify BHERs by whether acquirers go on to acquire again in over the five years following the deal (which we can only measure for deals through 1997). BHER is the three-year buy-and-hold excess return and is equal to the acquirer�s cumulative three year return minus the return on a size and book-to-market matched portfolio using the methodology prescribed in Lyon, Barber and Tsai (1999). We also report skewness adjusted t-statistics as recommended by Lyon, Barber and Tsai (1999). Deal order is based on the number of deals the acquirer announced in the previous five years. For example, a deal order value of 3 suggests the acquirer announced two acquisitions in the five years prior to the current deal. A frequent acquirer is defined as a firm that has two or more deals within a five-year period.
Panel A: BHERs by whether the firm acquires again in the five years following an acquisition.
All acquirers (1985-1997)
Acquirers that acquire again within
5 years
Acquirers that do not acquire again
within 5 years
Deal Order N BHER N BHER N BHER
1 1,362 -0.0426 432 0.1894 *** 930 -0.1504 ***
2 430 0.0565 229 0.1430 *** 201 -0.0420
3 173 0.0409 112 0.1097 ** 61 -0.0855
4 98 0.0807 73 0.1432 * 25 -0.1016
Panel B: Proportion of deals followed by another deal within five years and proportion of positive BHERs.
DealOrder N
% of acquirers with positive
BHERs
% of acquirers thatacquire again within
5 years
1 1,362 39.79 *** 31.72 ***
2 430 50.47 53.26
3 173 50.87 64.74 ***
4 98 52.04 74.49 ***
5 52 57.69 73.08 ***
6 32 46.88 81.25 ***
7 24 62.50 95.83 ***
8 16 50.00 100.00 ***
9 10 30.00 100.00 ***
10 5 40.00 100.00 *
11 4 50.00 100.00
12 3 33.33 100.00
13 2 50.00 100.00
14 2 50.00 100.00
15 2 0.00 100.00
***, **, and * denote significantly different from 50% at the 1, 5, and 10 percent level.

39
Table 8 Returns Following Previous Acquisition Experience and the Likelihood of Acquiring
Logit analysis of the determinants of being an acquirer. Sample is all firm-years from 1985-2002 with nonmissing data from Compustat and CRSP required to calculate control variables. The left hand side variable equals one if the firm acquires a public company in a given year and zero if it does not acquire in that year. Leverage is defined as total debt divided by assets minus book equity plus the market value of equity. Free Cash Flow is operating income before depreciation minus the sum of interest expense, income taxes and preferred dividends. Tobin�s q is calculated as total assets minus book equity plus the market value of equity all divided by total assets. Market Return t-1,Industry Return t-1, and Firm Return t-1 are annual stock returns to the value-weighted market portfolio, a value-weighted industry portfolio (same 2-digit SIC code), and to the firm over the previous year. PastDeal is a dummy variable equal to one if the firm engaged in an acquisition in the preceding five years and equals zero else. Economy Acquisition Activity and Industry Acquisition Activity are measured as the natural log of one plus the number deals greater than 1 million dollars reported by SDC in the previous year for the entire economy and for the industry (same 2-digit SIC code), respectively. Firm�s Previous Acquisitions is the natural log of one plus the number of acquisitions by the firm over the previous five years reported by SDC.
Coefficient 2
statistic
Intercept -6.6707 723.56***
Ln(Assets) 0.3000 958.68***
Leverage -1.5077 103.46***
Free Cash Flow/Assets 0.1353 4.13**
Tobin�s q 0.0133 8.44***
Cash/Assets 0.2922 4.97**
Market Return t-1 0.6957 21.27***
Industry Return t-1 -0.1146 2.05
Firm Return t-1 0.0739 15.30***
(Firm Return t-1)x(PastDeal) 0.2257 28.63***
Economy Acquisition Activity 0.1907 17.09***
Industry Acquisition Activity 0.1703 105.24***
Firm�s Previous Acquisitions 1.3007 912.81***
Likelihood Ratio (DF=12) 4672.96***
Percent Concordant 80.4
N Obs 99,807
***,**, and * denote significance at the 1, 5, and 10 percent level.

40
Table 9 Net Insider Purchase of Stock Prior to Acquisitions
Sample consists of 3,276 completed mergers and acquisitions of publicly traded US targets made by publicly traded US acquirers in the period 1987-2002. We limit the sample to later than 1986 since Thomson Financial insider trading data starts from 1986. Net Purchase Ratio (NPR) is calculated as the number of shares acquired through open market or private purchases and through option exercises, minus the number of shares sold, all divided by total insider transactions. Total insider transactions is the number of shares acquired through open market or private purchases and through option exercises, plus the number of shares sold. NPR is calculated based on top management�s trading during 180 days before the acquisition announcement. The cross-sectional benchmark is the average NPR for a size-matched portfolio of non-acquiring firms during 180 days before the acquisition announcement. The time-series benchmark is the acquiring firm�s NPR measured from days [-360, 180) before the announcement of the firm�s first deal in the preceding five years.
Deal Order N Net Purchase Ratio Cross-Sectional Adjusted
Net Purchase Ratio Time-Series Adjusted
Net Purchase Ratio
1 1,945 0.063*** 0.016 -0.011
2 632 0.131*** 0.089*** 0.029
3 267 0.154*** 0.106*** 0.032
4 155 0.179*** 0.138*** 0.051
5 96 0.210*** 0.157** 0.096
6 55 0.270*** 0.220*** 0.131
7 37 0.403*** 0.357*** 0.426***
8 23 0.482*** 0.447*** 0.353**
9 17 0.232 0.180 -0.119
10 10 0.226 0.166 -0.074
11 7 0.429* 0.378 0.286
12 7 0.346 0.280 0.203
13 7 -0.040 -0.105 -0.183
14 6 0.164 0.116 -0.002
15 5 0.000 -0.058 -0.400
16 3 0.333 0.288 -0.333
17 2 0.787 0.792 0.287
18 1 0.000 0.047 0.000
19 1 0.000 0.047 0.000
1 1,945 0.063*** 0.016 -0.011
>=2 1,331 0.171*** 0.127*** 0.054***
Difference -0.108*** -0.111*** -0.065***
***,**, and * denote significance at the 1, 5, and 10 percent level.

41
Appendix Table A1 Acquirer Abnormal Returns among Frequent and Infrequent Acquirers
Sample consists of all completed mergers and acquisitions of private, subsidiary, and publicly traded US targets made by publicly traded US acquirers in the period 1985-2002. Deal order is based on the number of deals the acquirer announced in the previous five years. For example, a deal order value of 3 suggests the acquirer announced two acquisitions in the five years prior to the current deal. The figures for Public Targets and Private Targets is based on Deal Order calculated for the combined sample (All Targets). A frequent acquirer is defined as a firm that has two or more deals within a five-year period. CAR is the cumulative abnormal return measured over the event window (-1,1) where day 0 is the announcement date. The abnormal return is calculated based on market model
parameters estimated over days 250 to 21. t-statistics are calculated based on the cross-sectional standard deviation of the CARs.
Panel A: Acquirer�s Deal Order
All Targets Public Targets Private Targets DealOrder
Number of deals CAR(-1,1)
Number of deals CAR(-1,1)
Number of deals CAR(-1,1)
1 4,288 0.0192 *** 1,640 0.0087 2,089 0.0278 ***
2 1,826 0.0036 * 805 -0.0110 *** 815 0.0139 ***
3 873 0.0024 438 -0.0150 *** 361 0.0096 ***
4 447 -0.0010 225 -0.0170 *** 192 0.0151 **
5 304 -0.0080 ** 178 -0.0200 *** 110 0.0077
6 206 -0.0070 * 122 -0.0180 *** 70 0.0075
7 113 0.0004 64 -0.0050 45 0.0099
8 92 -0.0140 *** 53 -0.0200 *** 35 -0.0010
9 70 -0.0110 45 -0.0200 *** 23 0.0051
10 41 0.0045 22 -0.0040 17 0.0137
11 24 0.0039 15 -0.0160 8 0.0312
12 17 0.0090 9 -0.0310 8 0.0536
13 14 0.1260 7 -0.0310 *** 5 0.0602
14 14 0.0128 9 -0.0070 14 0.0481
15 10 0.0060 6 -0.0050 3 0.0363
16 12 0.0043 8 -0.0250 ** 4 0.0639
17 12 0.0040 9 -0.011 2 0.0746
18 8 0.0180 5 -0.0080 2 0.0821
19 5 0.0149 3 -0.0330 2 0.0871
20 5 0.0460 3 0.0112 1 0.1931
21 3 0.0591 1 0.0034 2 0.0870
22 3 0.0531 1 -0.0003 2 0.0798
23 2 0.1383 1 0.08350 1 0.1931
2 4,101 0.0010 2,029 -0.0140 *** 1,713 0.0157 ***
Difference: 1 vs. 2 0.0182 *** 0.0171 *** 0.0122 ***

42
Table A2, continued
Panel B: Frequent vs. Infrequent Acquirers
All Targets Public Targets Private Targets
Acquirer Type Number of
Deals CAR(-1,1) Number of
Deals CAR(-1,1) Number of
Deals CAR(-1,1)
Infrequent 2,677 0.0214 *** 1,015 0.0061 1,318 0.0306 ***
Frequent
1st Deals 1,611 0.0157 *** 625 -0.0024 771 0.0232 ***
2nd Deals 4,101 0.0010 2,029 -0.0140 *** 1,713 0.0157 ***
Diff: 1st Infreq � 1st Freq 0.0057 0.0085 0.0074
Panel C: Method of Payment
Acquisitions of Public and Private Targets Deal Order Cash Mixed Stock
1st Deals CAR( 1,1) 0.0162 *** 0.0223 *** 0.0181 ***
N 1,029 1,633 1,626
2nd Deals CAR( 1,1) 0.0117 *** 0.0020 -0.0040 *
N 839 1,222 2,040
Difference CAR 0.0045 0.0203 *** 0.0220 ***
Acquisitions of Public Targets Deal Order Cash Mixed Stock
1st Deals CAR( 1,1) 0.0120 *** 0.0060 -0.0060
N 464 539 637
2nd Deals CAR( 1,1) 0.0034 -0.0120 *** -0.0230 ***
N 408 589 1,032
Difference CAR 0.0086 * 0.0177 *** 0.0162 **
Acquisitions of Private Targets Deal Order Cash Mixed Stock
1st Deals CAR( 1,1) 0.0174 *** 0.0279 *** 0.0319 ***
N 351 842 896
2nd Deals CAR( 1,1) 0.0222 *** 0.0137 *** 0.0148 ***
N 277 507 929
Difference CAR -0.0050 0.0142 ** 0.0171 ***
***, **, and * denote significance at the 1, 5, and 10 percent level.