are standard diagnostic test ...bhsai.org/pubs/chen_2013_are_standard_diagnostic_test...are standard...
TRANSCRIPT

Are Standard Diagnostic TestCharacteristics Sufficient for the Assessment
of Continual Patient Monitoring?
Liangyou Chen, PhD, Andrew T. Reisner, MD, Xiaoxiao Chen, PhD,Andrei Gribok, PhD, Jaques Reifman, PhD
Background. For diagnostic processes involving continualmeasurements from a single patient, conventional test char-acteristics, such as sensitivity and specificity, do not con-sider decision consistency, which might be a distinct,clinically relevant test characteristic. Objective. The authorsinvestigated the performance of a decision-support classifierfor the diagnosis of traumatic injury with blood loss, imple-mented with three different data-processing methods. Foreach method, they computed standard diagnostic test char-acteristics and novel metrics related to decision consistencyand latency. Setting. Prehospital air ambulance transport.Patients. A total of 557 trauma patients. Design. Continu-ally monitored vital-sign data from 279 patients (50%)were randomly selected for classifier development, and theremaining were used for testing. Three data-processingmethods were evaluated over 16 min of patient monitoring:a 2-min moving window, time averaging, and postprocessingwith the sequential probability ratio test (SPRT). Measure-ments. Sensitivity and specificity were computed.
Consistency was quantified through cumulative counts ofdecision changes over time and the fraction of patientsaffected by false alarms. Latency was evaluated by the frac-tion of patients without a decision. Results. All 3 methodsshowed very similar final sensitivities and specificities.Yet, there were significant differences in terms of the fractionof patients affected by false alarms, decision changesthrough time, and latency. For instance, use of the SPRTled to a 75% reduction in the number of decision changesand a 36% reduction in the number of patients affected byfalse alarms, at the expense of 3% unresolved final deci-sions. Conclusion. The proposed metrics of decision consis-tency and decision latency provided additional informationbeyond what could be obtained from test sensitivity andspecificity and are likely to be clinically relevant insome applications involving temporal decision making. Keywords: continual patient monitoring; decision-support algo-rithm; sequential probability ratio test; physiological data.(Med Decis Making 2013;33:225–234)
Continual physiological monitoring is standardpractice in many health care arenas, e.g., hospi-
tal wards and operating rooms, where vital-sign dataare measured repeatedly so that if instability occursit can be detected and treated promptly. However,false alarms are a major problem because standardalarms are triggered when certain parameter thresh-olds are reached.1–3 All too often, the abnormalitythat triggers an alarm is either a measurement arti-fact or a benign transient event. Yet, when falsealarms occur frequently, there is a deleterious effecton patients in that caregivers may be slow torespond to alarms with low positive predictivevalue.4
Received 10 August 2011 from DoD Biotechnology HPC SoftwareApplications Institute (BHSAI), Telemedicine and Advanced TechnologyResearch Center (TATRC), Fort Detrick, MD (LC, ATR, XC, AG, JR), andMassachusetts General Hospital Department of Emergency Medicine,Boston, MA (ATR). This work was performed at BHSAI, TATRC, USArmy Medical Research and Materiel Command (USAMRMC), FortDetrick, MD 21702. This work was partially supported by the CombatCasualty Care Research Area Directorate of the USAMRMC, FortDetrick, MD. The funding agreement ensured the authors’ indepen-dence in designing the study, interpreting the data, writing, and pub-lishing the report. The following author is employed by the sponsor:Jaques Reifman is a U.S. Department of the Army Senior ResearchScientist. The opinions and assertions contained herein are the pri-vate views of the authors and are not to be construed as official oras reflecting the views of the U.S. Army or of the U.S. Departmentof Defense. This article has been approved for public release withunlimited distribution. Revision accepted for publication 24 March2012.
DOI: 10.1177/0272989X12451059
Address correspondence to Jaques Reifman, BHSAI, TATRC, ATTN:MCMR-TT, 504 Scott Street, Fort Detrick, MD 21702-5012; e-mail:[email protected].
MEDICAL DECISION MAKING/FEB 2013 225
at U S U H S on March 1, 2013mdm.sagepub.comDownloaded from

In this report, we considered a set of analytic meth-ods for detecting abnormalities from continual phys-iological data and examined how the techniquescompared through time. We examined whether stan-dard test characteristics (sensitivity and specificity)were adequate for describing the resultant alarmbehaviors from one time interval to the next. Specifi-cally, we developed metrics to measure the temporalstability of test decisions, which we termed consis-tency, and examined the extent to which patientalarms were consistent through time. Our intentwas to describe whether alarms tended to reoccur inthe same patients from one time period to the next(on whom the clinical staff would be able to focusattention) or if (false) alarms were distributed through-out the entire monitored population (so that manydisparate patients would—unnecessarily—requireattention as the alarms were triggered).
We focused on several basic methods for pre- andpostprocessing of continual vital-sign data into andout of a core alarm algorithm. Analytic methods foridentifying irregularities from a set of time-seriesdata have been well established in the manufacturingquality control literature. Methods dealing with thisproblem include the sequential probability ratio test(SPRT),5,6 which evaluates the likelihood ratio of 2hypotheses based on sequentially available eviden-ces. Alternatives include the control chart method,7,8
the belief-modeling method,9 and other Bayesian-based methods.10,11 Among these methods, the SPRTis simple to calculate and, for given false-positiveand false-negative probabilities, requires the smallestnumber of samples to achieve a decision (unless thestatistical model is grossly incorrect).5
Our goal was to investigate if conventional testcharacteristics were adequate for assessing the basicperformance of an alarm or if it was also necessaryto consider its temporal consistency. In a comparativeanalysis, we employed 3 methods for pre- and post-processing of continual data into and out of our corealarm algorithm. Compared with a 2-min movingwindow, we examined if additional time averagingand the SPRT could alter the overall accuracy, thetemporal consistency, and the latency of the algo-rithm output. The core alarm algorithm was a multi-variate classifier for the diagnosis of traumaticinjury with blood loss, given data from a standardprehospital patient monitor.12 This analysis hasimplications for any diagnostic process involvingcontinual vital-sign measurements from a singlepatient.
METHODS
This is a retrospective, comparative analysis,based on a previously reported ensemble classi-fier,12 which provides automated detection of trau-matic injury with blood loss in prehospitalpatients based on basic vital signs. We simulated 3methods to process real-time data during the initial16 min of prehospital patient transportation. The mov-ing window method involved a moving 2-min analysiswindow; at every moment in time, the classifier wasapplied to the most recent 2 min of physiologicaldata. The time-averaging method analyzed all avail-able data from a given patient, from the onset of thedata record to the current time (up to a maximum of16 min). In the SPRT method, we applied the SPRTto the output of the classifier.
Trauma Patient Data
The physiological time-series data were collectedfrom 643 trauma-injured patients during their first16 min of helicopter transport to a trauma center.13
The time-series variables were measured by ProPaq206EL vital-sign monitors (Protocol Systems, Bea-verton, OR) and consisted of electrocardiogram,photoplethysmogram, and respiratory waveformsignals recorded at various frequencies and theircorresponding monitor-calculated vital signs,including heart rate (HR), respiratory rate (RR), andarterial oxygen saturation (SaO2), recorded at 1-sintervals, and systolic (SBP), mean, and diastolic(DBP) blood pressures collected intermittently atmultiminute intervals.
We performed chart reviews to determine whetherthe transported trauma patients had traumatic injurywith blood loss. Traumatic injury with blood loss wasdefined as requirement of a blood transfusion within24 h upon arrival at the trauma center and also docu-mentation of an explicitly hemorrhagic injury, eithera) laceration of solid organs, b) thoracic or abdominalhematomas, c) explicit vascular injury and operativerepair, or d) limb amputation. Patients who receivedblood but did not meet the documented injury criteria(60 cases), and patients who died before arrival at thehospital (26 cases) were excluded from the analysesbecause of uncertainty about whether they truly suf-fered traumatic injury with blood loss. Thus, weused a total of 557 patients, of which 61 were catego-rized as patients with traumatic injury and blood lossand the remaining 496 as controls.
CHEN AND OTHERS
226 � MEDICAL DECISION MAKING/FEB 2013
at U S U H S on March 1, 2013mdm.sagepub.comDownloaded from

Decision-Support Classifier: Training
The ensemble classifier aggregates 25 least-squareslinear classifiers, each trained with a different subsetof 5 input variables (HR, RR, SaO2, SBP, and DBP) andwith target values of 0.0 and 1.0, standing for controland traumatic injury with blood loss outcomes,respectively, to generate an (arithmetic) average out-put that can be used to discriminate the 2 outcomes.12
We assigned ensemble-averaged outputs of � 0.5 ascontrol outcomes and outputs of . 0.5 as traumaticinjury with blood loss. The ensemble classifier hasbeen shown to provide more consistent performancethan a single linear classifier, and importantly, itaccommodates missing data, providing an output aslong as any 1 of the 5 inputs is available.12
We randomly selected 50% of the study popula-tion (279 patients; 248 controls and 31 patients withtraumatic injury and blood loss) to train (i.e.,develop) the classifier. In prior studies,14 we foundthat prehospital vital-sign data are very noisy, andhence, we developed algorithms that automaticallyassess the reliability of each vital sign used as inputto the classifier.15–17 We also reported that reliabledata are diagnostically superior to unreliabledata.15,18 In another study,14 we found that there areno major time-series trends in these vital-sign data,and averaging the most reliable data during transportyielded the best discriminatory performance. Conse-quently, we used the average value of the most reli-able training data points from the first 16 min oftransport time as input to train the ensembleclassifier.
Evaluation of the Moving Window, Time-Averaging,and SPRT Methods
We investigated 3 methods to pre- and postprocessthe ensemble classifier data. In each method, 1) thefirst 2 min of transport vital-sign data were used asa buffer where no classifications were made; 2) every1 s we averaged the most reliable available vital-signdata (HR, RR, etc.) over a specified time window,input the averaged values to the classifier, andobtained an output; and 3) every 15 s, we averagedthe previous 15 classifier outputs to generate a deci-sion. The 3 methods differed on the length of the pre-processing time window of the classifier input data initem 2 (above) and on any additional postprocessingin the classifier outputs in item 3.
For the moving window, we averaged the classifierinputs over a 2-min time window and compared theaveraged decision every 15 s with a 0.5 threshold.
The time-averaging method differed from the firstmethod in that the length of the time window for aver-aging the vital-sign input data grew continually up tothe current decision time so that all available datawere considered for each decision. In the SPRTmethod, the classifier outputs were further processedas inputs to the SPRT to generate a SPRT decision (orno decision), as described below.
The Sequential Probability Ratio Test
We investigated the ability of Wald’s SPRT5,6 toconsider the sequential nature and postprocess theoutputs of the ensemble classifier while balancingdecision accuracy, consistency, and latency. Givena sequence of outputs Y1, Y2, . . . not necessarily inde-pendent from the ensemble classifier, so that Y =N(mY,s2
Y) is a normal Gaussian process with anunknown mean mY and a known constant variances2
Y, the SPRT classifies a patient as control or trau-matic injury with blood loss, or makes no decision,based on hypothesis testing. Note that s2
Y was esti-mated as the variance of the ensemble classifier out-puts at the end of the transport, i.e., at 16 min, andwas kept fixed throughout the analysis. The SPRTtests a null hypothesis (H0) that mY = m0 against analternative hypothesis (H1) that mY = m1, where m0 andm1 denote the arithmetic mean values of the classifieroutputs for the control and traumatic injury withblood loss cases, respectively, with m0 \ m1. If welet p0 and p1 be the probability density functions gov-erning the two hypotheses, H0 and H1, respectively,then the observed likelihood ratio at decision time J
can be represented as lJ ¼QJ
j¼1
p1ðYjÞp0ðYjÞ ; with J = 1, 2, . . . .
According to Wald’s SPRT methodology,5 we
accept H0 ðcontrolÞ; if logðlJÞ\ B; or
accept H1 ðtraumatic injury with blood lossÞ; ð1Þif logðlJÞ . A; or
continue to decision time J þ 1; if B � logðlJÞ � A;
where A and B are constants, with 0\B\A\N, cho-sen using Wald’s criteria,5 as to yield nominal false-positive probability (a; 0.0 \ a \ 0.5) and nominalfalse-negative probability (b; 0.0\b\0.5) as follows:
A ¼ log1� b
a; and
B ¼ logb
1� a:
ð2Þ
When a and b are relatively small (e.g.,\0.05), theSPRT tends to delay making a decision until
CONTINUAL PATIENT MONITORING
ORIGINAL ARTICLES 227
at U S U H S on March 1, 2013mdm.sagepub.comDownloaded from

additional corroborating classifier outputs becomeavailable. Conversely, when a and b are large (e.g.,’ 0.5), the SPRT makes quicker, albeit less accurate,decisions. Thus, by appropriately selecting these twoparameters, we can balance decision accuracy, con-sistency, and delay. To this end, we determined thenominal probabilities a and b by minimizing a costfunction ¢, which linearly combined the accuracyof the decisions, defined by its sensitivity (Se) andspecificity (Sp), at the end of the transport (i.e., at 16min); the cumulative incidences of decision changes(Dc; from control to traumatic injury with blood lossand vice versa) over the 16 min of transport time;and the fraction of patients with no decision (Nd) atthe end of the transport. Accordingly, we defined ¢as follows:
¢ ¼ 1� Se
0:051
1� Sp
0:051
Dc
101
Nd
0:01; ð3Þ
where the rescaling factors of the summands wereempirically obtained through SPRT trial simulationson the training data so to normalize the effect of eachof the four summands on ¢.
Under the Gaussian model, the log-likelihood ratiolog(lJ) in equation 1 can be recursively calculated asfollows:
logðlJ11Þ5 logðlJÞ1m1 � m0
sY2ðYJ11 �
m11m0
2Þ; J ¼ 0; 1; 2; . . . ;
ð4Þ
where the initial log-likelihood log(l0) can be selectedarbitrarily and was set to 0.0 in this study. While it hasbeen shown that the SPRT achieves a selected confi-dence in the shortest decision time,5 it may not alwaysarrive at a decision. However, when a decision wasmade, we noted the decision, stuck to it, and restartedthe SPRT process from that time point until a newdecision emerged.
Investigational Metrics
Wecompared theperformanceof the3data-processingmethods using testing data from 278 patients where weevaluated the accuracy, latency, and consistency (ina sense to be defined) of the methods in aggregate usingthe following 5 performance metrics:
1. Sensitivity: at any given time t, the fraction ofpatients with traumatic injury and blood loss whowere correctly identified by the algorithm at time t;
2. Specificity: at any given time t, the fraction of controlpatients who were correctly identified by the algo-rithm at time t;
3. No decisions: at any given time t, the fraction ofpatients without a decision out of the total numberof patients;
4. Cumulative decision changes: the cumulative countup through time t of decision changes Dc; and
5. False-alarm-affected patients: the fraction of controlpatients incorrectly identified as having traumaticinjury with blood loss, at or before time t, out of thetotal number of patients.
Every 2 min, from 2 to 16 min of transport time, weperformed statistical tests of significance with pair-wise comparisons between the investigational meth-ods (i.e., moving window, time averaging, andSPRT). For proportions (sensitivity, specificity, nodecisions, and false-alarm-affected patients), weemployed Liddell’s exact test.19 The counts of totaldecision changes throughout the population cannotbe statistically evaluated, so we also computed thetotal decision changes per subject and applied the Wil-coxon signed–rank test to the distributions. For all sta-tistical tests, we considered a P value of \ 0.05 to bestatistically significant.
RESULTS
Figure 1 illustrates the continual output of the 3data-processing methods, the moving window,time-averaging, and SPRT methods, in monitoring 4control subjects (panel A) and 3 subjects with trau-matic injury and blood loss (panel B). Each tile inthe figure represents a 15-s outcome decision, withred (or dark) representing traumatic injury with bloodloss decisions, green (or medium gray) control, andyellow (or light gray) no decisions. The selected con-trol subjects illustrate different patterns in outcomedecisions that we observed in the 248 control subjectsin the testing data. For example, for subject 364, all 3methods made correct and consistent control deci-sions over the 16-min transport time. For subject607, each method generated some false-positive(i.e., false traumatic injury with blood loss) decisions.However, the moving window method generated themost frequent number of decision changes (3 changesfrom control to traumatic injury with blood loss and 3from traumatic injury with blood loss to control, fora total of 6 decision changes), while the other 2 meth-ods generated 2 decision changes each. For the thirdsubject (640), unlike the other 2 methods, the SPRTmethod avoided making incorrect decisions (anddecision changes), but the decision was delayed bymore than 4 min. Finally, for subject 749, the SPRTwas not able to make a definite decision during the
CHEN AND OTHERS
228 � MEDICAL DECISION MAKING/FEB 2013
at U S U H S on March 1, 2013mdm.sagepub.comDownloaded from
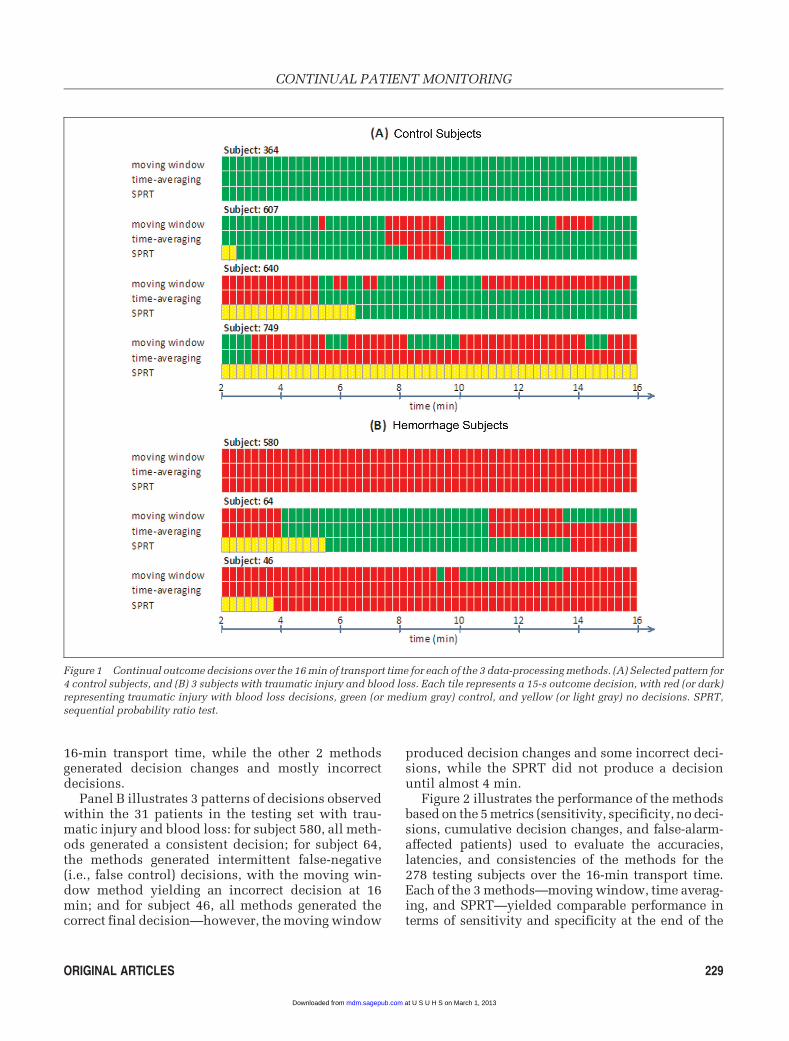
16-min transport time, while the other 2 methodsgenerated decision changes and mostly incorrectdecisions.
Panel B illustrates 3 patterns of decisions observedwithin the 31 patients in the testing set with trau-matic injury and blood loss: for subject 580, all meth-ods generated a consistent decision; for subject 64,the methods generated intermittent false-negative(i.e., false control) decisions, with the moving win-dow method yielding an incorrect decision at 16min; and for subject 46, all methods generated thecorrect final decision—however, the moving window
produced decision changes and some incorrect deci-sions, while the SPRT did not produce a decisionuntil almost 4 min.
Figure 2 illustrates the performance of the methodsbased on the 5 metrics (sensitivity, specificity, no deci-sions, cumulative decision changes, and false-alarm-affected patients) used to evaluate the accuracies,latencies, and consistencies of the methods for the278 testing subjects over the 16-min transport time.Each of the 3 methods—moving window, time averag-ing, and SPRT—yielded comparable performance interms of sensitivity and specificity at the end of the
Figure 1 Continual outcome decisions over the 16 min of transport time for each of the 3 data-processing methods. (A) Selected pattern for
4 control subjects, and (B) 3 subjects with traumatic injury and blood loss. Each tile represents a 15-s outcome decision, with red (or dark)representing traumatic injury with blood loss decisions, green (or medium gray) control, and yellow (or light gray) no decisions. SPRT,
sequential probability ratio test.
CONTINUAL PATIENT MONITORING
ORIGINAL ARTICLES 229
at U S U H S on March 1, 2013mdm.sagepub.comDownloaded from

transport time (sensitivity: 83%, 80%, and 80%,respectively; specificity: 71%, 75%, and 73%, respec-tively). Note that the SPRT method provided relativelylow sensitivity and specificity (� 60%) during the first6 min of transport because of a large fraction of patientswithout SPRT decisions (see panel C). For instance, at2 min, fewer than 25% of the patients had a decision
rendered by the SPRT, and consequently, the corre-sponding sensitivity was also less than 25%. TheSPRT method failed to make a decision at 16 min for8 subjects (or 3% of the subjects), while the other 2methods showed no decision latency (panel C).
In terms of consistency of decisions, the SPRTdemonstrated a significantly reduced fraction of
Figure 2 Comparison of 3 data-processing decision methods for the 278 testing subjects analyzed over the 16-min transport time based on
5 performance metrics: (A) sensitivity, (B) specificity, (C) fraction of patients with no decisions, (D) cumulative number of decision changes,
and (E) false-alarm-affected patients. Pairwise tests of significance were performed every 2 min. Proportions were compared by Liddell’sexact test (panels A–C, E). Panel D illustrates cumulative count of total-population decision changes, and the Wilcoxon signed–rank test
was applied to the per patient counts of decision changes.*P \ 0.05, time averaging v. moving window. yP \ 0.05, SPRT v. both moving
window and time averaging.
CHEN AND OTHERS
230 � MEDICAL DECISION MAKING/FEB 2013
at U S U H S on March 1, 2013mdm.sagepub.comDownloaded from

false-alarm-affected patients throughout and at theend of the 16-min transport, compared with bothother methods—27% of the subjects, which was36% lower than the time-averaging method (42% ofthe subjects) and 48% lower than the moving windowmethod (52% of the subjects; panel E). The SPRT alsoconsistently generated fewer numbers of decisionchanges over time (29 total decision changes v. 118for the time-averaging method and 348 for the movingwindow method; panel D).
The time-averaging method was more consistentthan the moving window method, with significantlyfewer false-alarm-affected patients and average deci-sion changes per patient. The time-averaging methoddid not demonstrate the latency of the SPRT method.
DISCUSSION
In this article, we studied the accuracy, consis-tency, and latency of a decision-support classifieremploying three different data-processing methodsfor the continual prehospital diagnosis of traumaticinjury with blood loss in 557 trauma patients. It isstriking that all methods showed very similar sensi-tivities and specificities yet very different temporalbehaviors. For instance, Wald’s SPRT was muchmore consistent, generating false alarms in signifi-cantly fewer patients, with significantly fewer deci-sion changes.
There are 2 major implications. First, for some con-tinual monitoring applications, standard test charac-teristics, e.g., sensitivity and specificity, areinsufficient for describing the performance of a classi-fier because they do not describe if false alarms occurrepeatedly in a limited subpopulation or if false alarmsare evenly distributed throughout a population. Sec-ond, as a corollary, it is apparent that pre- and postpro-cessing of time-series data can significantly altertemporal consistency, as was seen in the applicationof time averaging and of the SPRT, a classic techniqueintended for precisely this type of application.
Insufficiency of standard test characteristics fordescribing the continual performance of a classifier.For the continual monitoring of patients, standardtest characteristics do not consider the sequentialnature of the algorithm’s decisions when there arerepeated decisions being made on each subject. Forexample, while 2 binary decision classifiers mayhave similar overall sensitivity and specificity, 1may be less stable than the other, continually ‘‘flip-ping’’ its decisions through time (which is naturallyexacerbated the more that a classifier is sensitive to
transient noise in the signal). We found this exactphenomenon in our data set: After 5 to 10 min, the3 investigational methods had similar sensitivitiesand specificities, but there were significant differen-ces in the total number of patients affected by a falsealarm. Using the SPRT significantly reduced thefraction of false-alarm-affected patients by approxi-mately half, compared to the moving windowmethod.
We speculate that this effect was notable in thisanalysis because the prehospital vital signs showedconsiderable intrasubject variability through time,with sizable fluctuations in HR, blood pressure,etc., during the course of prehospital transport.14
Comparable fluctuations in the prehospital vitalsigns of trauma patients have been observed in otherprehospital studies as well,20–22 which may be phys-iological responses to episodic stimuli (e.g., pain andfear), to episodic therapies (e.g., fluids), or to underly-ing pathology, as well as some degree of routine bio-logical variability and measurement error.
In general, are standard diagnostic test characteris-tics sufficient for the assessment of continual patientmonitoring, or is it appropriate to quantify classifierconsistency? It is likely that the frequency of decisionchanges in diagnostic classification is dependent onthe classifier evaluation frequency, the temporal fluc-tuations in the diagnostic data, and the proximity ofthe classifier output to the decision boundary. Pre-sumably, there is a continuum of diagnostic applica-tions in terms of the classifier consistency throughtime. If the diagnostic data are temporally stable dur-ing intervals of disease and health, then standard testcharacteristics are likely sufficient. At the otherextreme, if the diagnostic data fluctuate throughtime, then the diagnostic classification will also fluc-tuate through time, and it may be illuminating to con-sider metrics of consistency (as we have done in thisreport) in addition to standard test characteristics. Inmany reports, continual classifiers are evaluatedwithout explicit consideration of their performanceand consistency through time, such as reports byour group12 and by others.23–25 It is likely that, at leastfor a subset of continual monitoring applications,standard diagnostic test characteristics are insuffi-cient and it would be valuable to consider consis-tency to quantify clinically relevant properties ofthe diagnostic test.
In addition, evaluating a temporal classifierthrough time can reveal if performance changesbecause of temporal disease progression. Presum-ably, it is easier to diagnose blood loss or septic shockas the pathology progresses, due to the spectrum
CONTINUAL PATIENT MONITORING
ORIGINAL ARTICLES 231
at U S U H S on March 1, 2013mdm.sagepub.comDownloaded from

effect (e.g., when a diagnostic test performs better ina study population with more severe disease. Con-sider that the sensitivity of a hypothetical dip-testfor leukocyte esterase in the diagnosis of urinary tractinfection may be higher in patients of an underservedpopulation, who tend to receive evaluation later inthe course of disease, rather than in patients of anaffluent population, who are promptly evaluatedafter the earliest symptoms). Spectrum effects alsoaffect the temporal consistency of a diagnostic classi-fier, because small fluctuations in diagnostic data fora borderline case would be more likely to affect diag-nostic classification (e.g., during early stages of bloodloss). By contrast, cases with more advanced pathol-ogy will often have more frankly abnormal diagnosticdata, and so temporal fluctuations are unlikely toalter diagnostic classification. That diagnostic classi-fication may become easier as the disease processprogresses is often well recognized. For instance,Cuthbertson26 reported test characteristics for aninvestigative early warning score over hourly inter-vals, e.g., 1 h prior to patient acute deterioration, 2 hprior, etc. However, it was not reported to what extentthe true and false alarms occurred in the same patientshour by hour, i.e., consistency. In this report, wedescribe the minute-by-minute performance of aninvestigational algorithm during the initial 16 min ofprehospital transportation, including the temporalvariation of decision changes in the same patientsand the fraction of total patients affected by some ofthese changes. At least in our application, the addi-tional statistics provide information beyond standardtest characteristics, perhaps in part because we exam-ined data measured soon after traumatic injury.
Pre- and postprocessing of time series alters per-formance of an automated continual classifier. Pre-and postprocessing of time-series data is appropriatefor removing noise that occurs over faster time scalesthan the process of interest, thus enhancing theunderlying signal. In this study, the narrow 2-minmoving window caused a large number of patientsto trigger false alarms (24% more than the time-averag-ing approach and 93% more than the SPRT approach).Failure of developers of monitoring algorithms toexplicitly consider classifier output stability, or con-sistency, through time will presumably exacerbatethe well-described problem of false alarms in medicalmonitoring systems1–4 and will likely decrease theincentive for caregivers to adopt novel decision-sup-port technologies. Conversely, excessively stable clas-sifiers are also problematic, causing unacceptablelatency when a patient’s state does change. The
challenge is to optimize the tradeoffs between classi-fier accuracy, consistency, and latency.
Consider time averaging. As long as the noise inthe time series has no major bias, this is a practicaltechnique for filtering out measurement error andtransient physiological events. For a monitoring algo-rithm, the time-averaging window should be shorterthan the onset time of the disease of interest. In otherwords, time averaging over 15 min may be usefulwhen seeking hemorrhage physiology, althoughtime averaging over 60 min might be too large a win-dow, causing unacceptable latency to the detection ofhemorrhage physiology that can progress in less thanan hour. In this report, the time-averaging methodwas able to improve decision consistency (with66% fewer decision changes) and reduce false-alarm-affected patients (with 20% fewer false-alarm-affected patients) compared with the simple2-min moving window method.
A prior report corroborates this principle: that it isoften possible to reduce false alarms at the expense ofclinically acceptable latency. In monitoring childrenat home by pulse oximetry, Gelinas and others27 sug-gested that the rate of hypoxia alarms (SpO2 \ 85%)could be reduced from 3.6 to 0.2 alarms per night with-out missing any clinically significant events, simply byrequiring a 10-s duration of hypoxia (rather than alarm-ing the instant that the hypoxia threshold was met).
The SPRT: a classic technique that can improvetemporal consistency during continual monitoring.One classic application of the SPRT is for the evalu-ation of a shipment of manufactured components.Components are measured 1 by 1 until a SPRT deci-sion is rendered that the set of components is within(or outside of) the acceptable tolerances. Our investi-gational algorithm is analogous in that measurementswere taken repeatedly from 1 trauma patient, and theSPRT was used to decide whether the patient waswithin (or outside of) the range of vital signs typicalof patients with traumatic injury and blood loss. Ofcourse, given a shipment of components, individualmeasurements are statistically independent, whilethere is temporal correlation when measurementsare repeated in the same patient. Regardless, our find-ings suggest that the SPRT is suitable for improvingthe consistency of the investigational classifier basedon continual physiological data.
In the medical area, the SPRT has been previouslyapplied to the performance monitoring of clinicalteams26–30 (to continually monitor the surgical out-come rate and ensure it does not deviate from theexpected success rate), routine surveillance of drug
CHEN AND OTHERS
232 � MEDICAL DECISION MAKING/FEB 2013
at U S U H S on March 1, 2013mdm.sagepub.comDownloaded from

safety31 (to continually monitor whether a new vac-cine is safe over a period of time), and determinationof early stopping criteria of clinical trials32,33 (to allowthe trial to be stopped as soon as the information accu-mulated is considered sufficient to reach a conclu-sion). Our results demonstrated that the SPRT maybe effective for continual physiological monitoring,in the reduction of false-alarm-affected patients (36%fewer patients than the time-averaging method) andoverall decision changes (75% fewer decisionchanges). The tradeoff was the occurrence of somedecision latency because, unlike the other investiga-tive methods, the SPRT can yield an ‘‘undecided’’ out-put (see Figure 2). Indeed, for several cases (3% of thetotal), there was never a diagnostic decision generatedwhen applying the SPRT. For applications in whichsuch a tradeoff is acceptable, the SPRT is optimal inthe sense that, mathematically, it guarantees the small-est number of samples to achieve a decision for givenfalse-positive and false-negative probabilities.5 Theperformance of the SPRT depends on the selectednominal probabilities a and b, which can be set eitherarbitrarily or by optimizing certain cost function dur-ing classifier training. Properly chosen a and b mayimprove the sensitivity and specificity, and decreasethe cumulative incidences of decision changes, withacceptable final unresolved decisions. However,improperly chosen a and b may significantly down-grade the sensitivity or the specificity. As well, whenwe first attempted to optimize the SPRT with a cost func-tion customized wholly to yield small false-positive a
and false-negative b probabilities, we improved the finalaccuracy but simultaneously increased the unresolveddecisions to 40% on the testing data. In the end, thecost function defined in equation 3 provided a simpleyet effective tool to balance accuracy, consistency, andlatency.
This tradeoff between latency and consistency maylimit the application of the SPRT in the detection of con-ditions that involve an imminent threat to life, e.g., car-diac tachyarrhythmia. However, in the monitoring ofearly disease states, when some latency is acceptable,e.g., early hemorrhage detection,12 sepsis detection,25,34
or other early warning functionality,23,24 we suggestthat the SPRT may provide a means to improve classifierstability and to reduce false alarms, without any neces-sary loss in decision accuracy.
Identification of traumatic injury with blood lossvia continual physiological monitoring. The potentialusefulness of the diagnostic classifier described in thisreport is not the focus of this study, and an assessment
of potential clinical value must be tempered by the factthat the analysis is retrospective, based on post hocclassification as to whether each subject had traumaticinjury with blood loss. Having said that, we believe thatthere is potential clinical value to the methodologicalapplication of conventional and commonsense analysistechniques to standard vital-sign data, e.g., noise rejec-tion, time averaging, and multivariate classification. Wepreviously found that automated techniques are diag-nostically equivalent to prehospital severity scoresbased on medics’ documentation.15 In this case, wefocused on the identification of hemorrhage becauseblood loss is 1 of the 2 primary reasons why traumapatients die,35,36 but in many cases it can be treatedeffectively with blood transfusion and surgical hemor-rhage control. We speculate that formal quantitativeanalysis of continual vital signs may be able to supple-ment today’s convention, which relies on informal cli-nician judgments to integrate vital-sign data with otherimportant clinical data. For instance, automated algo-rithms during prehospital care could be useful for triageand to aid the receiving hospital to efficiently mobilizeproper resources, such as surgical teams and units ofblood. Similar techniques could identify hospitalizedpatients who suffer unexpected episodes of blood lossduring convalescence, e.g., early warning systems.However, actual performance and clinical usefulnessmust be prospectively assessed, and the optimalapproach to decision support for trauma patients (e.g.,attempt to identify any patients with traumatic injuryand blood loss v. attempt to identify patients withuncontrolled, ongoing blood loss) involves open ques-tions that are not addressed in this analysis.
CONCLUSION
Over time, all 3 methods converged to demonstratevery similar diagnostic accuracy (i.e., sensitivity andspecificity). However, their consistency was signifi-cantly different. The SPRT significantly reduced thetotal number of patients affected by false alarms, butwith significantly greater latency, compared withthe moving window method and the time-averagingmethod. Time averaging showed significantly fewerpatients affected by false alarms compared with mov-ing window, and without latency. These findingshighlight how there are continual monitoring appli-cations for which the proposed test characteristicsprovide additional, useful information. Metrics ofconsistency and latency can demonstrate additionalproperties that are likely relevant to clinical practice.
CONTINUAL PATIENT MONITORING
ORIGINAL ARTICLES 233
at U S U H S on March 1, 2013mdm.sagepub.comDownloaded from

REFERENCES
1. Korniewicz DM, Clark T, David Y. A national online survey on
the effectiveness of clinical alarms. Am J Crit Care. 2008;17(1):
36–41.
2. Imhoff M, Kuhls S. Alarm algorithms in critical care monitoring.
Anesth Analg. 2006;102(5):1525–37.
3. Chambrin MC. Alarms in the intensive care unit: how can the
number of false alarms be reduced? Crit Care. 2001;5(4):184–8.
4. Lawless ST. Crying wolf: false alarms in a pediatric intensive
care unit. Crit Care Med. 1994;22:981–5.
5. Wald A. Sequential tests of statistical hypotheses. Ann Math
Statist. 1945;16(2):117–86.
6. Wald A. Sequential Analysis. New York: John Wiley and Sons;
1947.
7. Reynolds MR, Kim K. Multivariate control charts for monitoring
the process mean and variability using sequential sampling. Seq
Anal. 2007;26(3):283–315.
8. Bogowicz P, Flores-Mir C, Major PW, Heo G. Sequential analysis
applied to clinical trials in dentistry: a systematic review. Evid
Based Dent. 2008;9(2):55–60.
9. Racz A. Comments on the sequential probability ratio testing
methods. Ann Nucl Energy. 1996;23(11):919–34.
10. Carlin BP, Chaloner K, Church T, Louis TA, Matts JP. Bayesian
approaches for monitoring clinical trials with an application to
toxoplasmic encephalitis prophylaxis. Statistician. 1993;42:
355–67.
11. Brown M. Bayesian detection of changes of a Poisson process
monitored at discrete time points where the arrival rates are
unknown. Seq Anal. 2008;27(1):68–77.
12. Chen L, McKenna TM, Reisner AT, Gribok A, Reifman J. Decision
tool for the early diagnosis of trauma-patient hypovolemia. J Biomed
Inform. 2008;41:469–78.
13. Cooke WH, Salinas J, Convertino VA, et al. Heart rate variabil-
ity and its association with mortality in prehospital trauma
patients. J Trauma. 2006;60(2):363–70.
14. Chen L, Reisner AT, Gribok A, Reifman J. Exploration of pre-
hospital vital-sign trends for the prediction of trauma outcomes.
Prehosp Emerg Care. 2009;13(3):286–94.
15. Reisner AT, Chen L, McKenna TM, Reifman J. Automatically-
computed prehospital severity scores are equivalent to scores
based on medic documentation. J Trauma. 2008;65(4):915–23.
16. Yu C, Liu Z, McKenna T, Reisner AT, Reifman J. A method for
automatic identification of reliable heart rates calculated from ECG
and PPG waveforms. J Am Med Inform Assoc. 2006;13(3):309–20.
17. Chen L, McKenna TM, Reisner AT, Reifman J. Algorithms to
qualify respiratory data collected during the transport of trauma
patients. Physiol Meas. 2006;27(9):797–816.
18. Chen L, Reisner AT, Gribok A, McKenna TM, Reifman J. Can
we improve the clinical utility of respiratory rate as a monitored
vital sign? Shock. 2009;31(6):574–80.
19. Liddell FDK. Simplified exact analysis of case-referent studies:
matched pairs; dichotomous exposure. J Epidemiol Community
Health. 1983;37:82–4.
20. Rhee KJ, Willits NH, Turner JE, Ward RE. Trauma Score change
during transport: is it predictive of mortality? Am J Emerg Med.
1987;5:353–6.
21. Shapiro NI, Kociszewski C, Harrison T, Chang Y, Wedel SK,
Thomas SH. Isolated prehospital hypotension after traumatic inju-
ries: a predictor of mortality? J Emerg Med. 2003;25:175–9.
22. Lipsky AM, Gausche-Hill M, Henneman PL, et al. Prehospital
hypotension is a predictor of the need for an emergent, therapeutic
operation in trauma patients with normal systolic blood pressure
in the emergency department. J Trauma. 2006;61:1228–33.
23. Duckitt RW, Buxton-Thomas R, Walker J, et al. Worthing phys-
iological scoringsystem: derivationand validationofaphysiological
early-warning system for medical admissions. An observational,
population-based single-centre study. Br J Anaesth. 2007;98(6):
769–74.
24. Subbe CP, Slater A, Menon D, Gemmell L. Validation of phys-
iological scoring systems in the accident and emergency depart-
ment. Emerg Med J. 2006;23(11):841–5.
25. Peres Bota D, Melot C, Lopes Ferreira F, Vincent JL. Infection
Probability Score (IPS): A method to help assess the probability
of infection in critically ill patients. Crit Care Med. 2003;31(11):
2579–84.
26. Cuthbertson BH. Optimising early warning scoring systems.
Resuscitation. 2008;77(2):153–4.
27. Gelinas JF, Davis GM, Arlegui C, Cote A. Prolonged, docu-
mented home-monitoring of oxygenation in infants and children.
Pediatr Pulmonol. 2008;43(3):288–96.
28. Sibanda N, Lewsey JD, van der Meulen JH, Stringer MD. Con-
tinuous monitoring tools for pediatric surgical outcomes: an exam-
ple using biliary atresia. J Pediatr Surg. 2007;42(11):1919–25.
29. Poloniecki J, Sismanidis C, Bland M, Jones P. Retrospective
cohort study of false alarm rates associated with a series of heart
operations: the case for hospital mortality monitoring groups.
BMJ. 2004;2004:328–75.
30. Reynolds MR, Stoumbos ZG. The SPRT chart for monitoring
a proportion. IIE Trans. 1998;30(6):545–61.
31. Musonda P, Hocine MN, Andrews NJ, Tubert-Bitter P, Farrington
CP. Monitoring vaccine safety using case series cumulative sum
charts. Vaccine. 2008;26(42):5358–67.
32. Sebille V, Bellissant E. Comparison of four sequential methods
allowing for early stopping of comparative clinical trials. Clin Sci
(Lond). 2000;98(5):569–78.
33. Golhar DY, Pollock SM. Sequential analysis for diagnosing
diabetes. Med Decis Making. 1987;7(1):47–51.
34. Griffin MP, O’Shea TM, Bissonette EA, Harrell FE, Jr., Lake DE,
Moorman JR. Abnormal heart rate characteristics preceding neona-
tal sepsis and sepsis-like illness. Pediatr Res. 2003;53(6):920–6.
35. Sauaia A, Moore FA, Moore EE, Moser KS, Brennan R, Read
RA, Pons PT. Epidemiology of trauma deaths: a reassessment. J
Trauma. 1995;38:185–93.
36. Peng R, Chang C, Gilmore D, Bongard F. Epidemiology of imme-
diate and early trauma deaths at an urban level I trauma center. Am
Surg, 1998;64:950–4.
CHEN AND OTHERS
234 � MEDICAL DECISION MAKING/FEB 2013
at U S U H S on March 1, 2013mdm.sagepub.comDownloaded from