ares management corporation reports first quarter results
TRANSCRIPT
LOS ANGELES--Ares Management Corporation (NYSE:ARES) today reported its financial results for its first quarter ended March 31, 2021.
GAAP net income attributable to Ares Management Corporation was $58.4 million for the quarter ended March 31, 2021. On a basic basis, net income attributable to Ares Management Corporation per share of Class A common stock was $0.33 for the quarter ended March 31, 2021. On a diluted basis, net income attributable to Ares Management Corporation per share of Class A common stock was $0.32 for the quarter ended March 31, 2021.
After-tax realized income, net of Series A preferred stock dividends, was $127.6 million for the quarter ended March 31, 2021. After-tax realized income per share of Class A common stock, net of Series A preferred stock dividends, was $0.46 for the quarter ended March 31, 2021. Fee related earnings was $128.5 million for the quarter ended March 31, 2021.
“During the first quarter, we crossed a major milestone for our company by surpassing $200 billion in assets under management after reaching $100 billion just four years ago,” said Michael Arougheti, Chief Executive Officer and President of Ares. “Our 39% growth in assets under management was supported by continued strong momentum in both fundraising and fund performance as we generated attractive investment solutions for our investors. Looking ahead to the rest of 2021, we see a constructive market backdrop and strong fundamentals for the core drivers of our business and we continue to see favorable industry tailwinds and significant expansion opportunities for us on the longer term horizon.”
“We are off to a strong start to the year with $10 billion of new capital raised, 38% growth in our fee related earnings and record quarterly deployment,” said Michael McFerran, Chief Operating Officer and Chief Financial Officer of Ares. “With over $56 billion of available capital in flexible investment strategies, we are well positioned for continued growth as we continue to leverage the advantages of our expanding investment platform and global presence.”
Common Dividend
Ares declared a quarterly dividend of $0.47 per share of its Class A common stock, payable on June 30, 2021 to its Class A common stockholders of record at the close of business on June 16, 2021.
Dividend Reinvestment Program
Ares has a Dividend Reinvestment Program for its Class A common stockholders that will be effective for the quarterly dividend on June 30, 2021. American Stock Transfer and Trust Company is engaged to administer the plan on behalf of the Company. Additional information can be located on the Investor Resources section of our website.
Preferred Dividend
Ares declared a quarterly dividend of $0.4375 per share of its Series A preferred stock with a payment date of June 30, 2021 to its Series A preferred stockholders of record as of the close of business on June 15, 2021.
Additional Information
Ares issued a full detailed presentation of its first quarter 2021 results, which can be viewed at www.aresmgmt.com on the Investor Resources section of our home page under Events and Presentations. The presentation is titled "First Quarter 2021 Earnings Presentation."
Ares Management Corporation Reports First Quarter Results
Conference Call and Webcast Information
Ares will host a conference call on April 29, 2021 at 12:00 p.m. (Eastern Time) to discuss first quarter results. All interested parties are invited to participate via telephone or the live webcast, which will be hosted on a webcast link located on the Home page of the Investor Resources section of our website at www.aresmgmt.com. Please visit the website to test your connection before the webcast. Domestic callers can access the conference call by dialing (888) 317-6003. International callers can access the conference call by dialing +1 (412) 317-6061. All callers will need to enter the Participant Elite Entry Number 9371836 followed by the # sign and reference “Ares Management Corporation” once connected with the operator. All callers are asked to dial in 10-15 minutes prior to the call so that name and company information can be collected. For interested parties, an archived replay of the call will be available through May 27, 2021 to domestic callers by dialing (877) 344-7529 and to international callers by dialing +1 (412) 317-0088. For all replays, please reference conference number 10153153. An archived replay will also be available through May 27, 2021 on a webcast link located on the Home page of the Investor Resources section of our website.
About Ares Management Corporation
Ares Management Corporation (NYSE: ARES) is a leading global alternative investment manager operating integrated groups across Credit, Private Equity, Real Estate and Strategic Initiatives. Ares Management’s investment groups collaborate to deliver innovative investment solutions and consistent, attractive investment returns for fund investors throughout market cycles. As of March 31, 2021, Ares Management’s global platform had approximately $207 billion of assets under management with more than 1,450 employees operating across North America, Europe and Asia Pacific. For more information, please visit www.aresmgmt.com.
Forward-Looking Statements
Statements included herein contain certain “forward-looking statements” within the meaning of the Private Securities Litigation Reform Act of 1995, which relate to future events or our future performance or financial condition. Forward-looking statements can be identified by the use of forward looking words such as "outlook," "believes," "expects," "potential," "continues," "may," "will," "should," "seeks," "predicts,“ "intends," "plans," "estimates," "anticipates," "foresees" or negative versions of those words, other comparable words or other statements that do not relate to historical or factual matters. The forward looking statements are based on our beliefs, assumptions and expectations of our future performance, taking into account all information currently available to us. These statements are not guarantees of future performance, condition or results and involve a number of risks and uncertainties. Actual results may differ materially from those in the forward-looking statements as a result of a number of factors, including but not limited to the impact of the COVID-19 pandemic and the pandemic's impact on the U.S. and global economy, as well as those described from time to time in our filings with the Securities and Exchange Commission. Any forward-looking statement speaks only as of the date on which it is made. Ares Management Corporation undertakes no duty to update any forward-looking statements made herein or on the webcast/conference call, whether as a result of new information, future developments or otherwise, except as required by law. Nothing in this press release constitutes an offer to sell or solicitation of an offer to buy any securities of Ares or an investment fund managed by Ares or its affiliates.
Investor Relations Contacts
Carl Drake Greg Mason Cameron Rudd
[email protected] [email protected] [email protected]
(800) 340-6597 (800) 340-6597 (800) 340-6597
Earnings PresentationFirst Quarter 2021

0 42 65
155 112 42
4 94 109
127 127 127
0 42 65
2 87 133
71 126 163
120 163 198
Credit
Private
Equity
RealEsta
te
Strategic
Initiatives
BUSINESS
SECTORPALETTE
GENERAL
PALETTE
2
Important NoticeThis presentation is prepared for Ares Management Corporation (NYSE: ARES) for the benefit of its public stockholders. This presentation is solely for information purposes in connection with evaluating the business, operations and financial results of Ares Management Corporation (“Ares”) and certain of its affiliates. Any discussion of specific Ares entities is provided solely to demonstrate such entities’ role within the Ares organization and their contribution to the business, operations and financial results of Ares. This presentation may not be referenced, quoted or linked by website, in whole or in part, except as agreed to in writing by Ares.
This presentation contains “forward looking statements” within the meaning of Section 21E of the Securities Exchange Act of 1934, as amended, that are subject to risks and uncertainties. Forward-looking statements can be identified by the use of forward-looking words such as "outlook," "believes," "expects," "potential," "continues," "may," "will," "should," "seeks," "predicts," "intends," "plans," "estimates," "anticipates," "foresees" or negative versions of those words, other comparable words or other statements that do not relate to historical or factual matters. Actual outcomes and results could differ materially from those suggested by this presentation due to the impact of many factors beyond the control of Ares, including but not limited to the impact of the COVID-19 pandemic and the pandemic's impact on the U.S. and global economy, as well as those described in the “Risk Factors” section of our filings with the Securities and Exchange Commission (“SEC”). These factors should not be construed as exhaustive and should be read in conjunction with other cautionary statements that are included in our periodic filings. Any such forward-looking statements are made pursuant to the safe harbor provisions available under applicable securities laws and speak only as of the date of this presentation. Ares assumes no obligation to update or revise any such forward-looking statements except as required by law.
Certain information discussed in this presentation was derived from third party sources and has not been independently verified and, accordingly, Ares makes no representation or warranty in respect of this information and assumes no responsibility for independent verification of such information.
The following slides contain summaries of certain financial and statistical information about Ares. The information contained in this presentation is summary information that is intended to be considered in the context of Ares’ SEC filings and other public announcements that Ares may make, by press release or otherwise, from time to time. Ares undertakes no duty or obligation to publicly update or revise these statements or other information contained in this presentation. In addition, this presentation contains information about Ares, its affiliated funds and certain of their respective personnel and affiliates, and their respective historical performance. You should not view information related to the past performance of Ares and its affiliated funds as indicative of future results.
Certain information set forth herein includes estimates and targets and involves significant elements of subjective judgment and analysis. No representations are made as to the accuracy of such estimates or targets or that all assumptions relating to such estimates or targets have been considered or stated or that such estimates or targets will be realized. Further, certain performance information, unless otherwise stated, is before giving effect to management fees, carried interest or incentive fees and other expenses.
This presentation does not constitute, and shall not be construed as, an offer to buy or sell, or the solicitation of an offer to buy or sell, any securities, investment funds, vehicles or accounts, investment advice, or any other service by Ares of any of its affiliates or subsidiaries. Nothing in this presentation constitutes the provision of tax, accounting, financial, investment, regulatory, legal or other advice by Ares or its advisors.
Management uses certain non-GAAP financial measures, including Assets Under Management, Fee Paying Assets Under Management, Fee Related Earnings and Realized Income to evaluate Ares’ performance and that of its business segments. Management believes that these measures provide investors with a greater understanding of Ares’ business and that investors should review the same supplemental non-GAAP financial measures that management uses to analyze Ares’ performance. The measures described herein represent those non-GAAP measures used by management, in each case, before giving effect to the consolidation of certain funds within its results in accordance with GAAP. These measures should be considered in addition to, and not in lieu of, Ares’ financial statements prepared in accordance with GAAP. The definitions and reconciliations of these measures to the most directly comparable GAAP measures, as well as an explanation of why we use these measures, are included in the Appendix. Amounts and percentages may reflect rounding adjustments and consequently totals may not appear to sum.
For the definitions of certain terms used in this presentation, please refer to the "Glossary" slide in the appendix.
The statements contained in this presentation are made as of March 31, 2021, unless another time is specified in relation to them, and access to this presentation at any given time shall not give rise to any interpretation that there has been no change in the facts set forth in this presentation since that date.
0 42 65
155 112 42
4 94 109
127 127 127
0 42 65
2 87 133
71 126 163
120 163 198
Credit
Private
Equity
RealEsta
te
Strategic
Initiatives
BUSINESS
SECTORPALETTE
GENERAL
PALETTE
3
Assets Under Management
Financial Results
Corporate Actions
Recent Developments
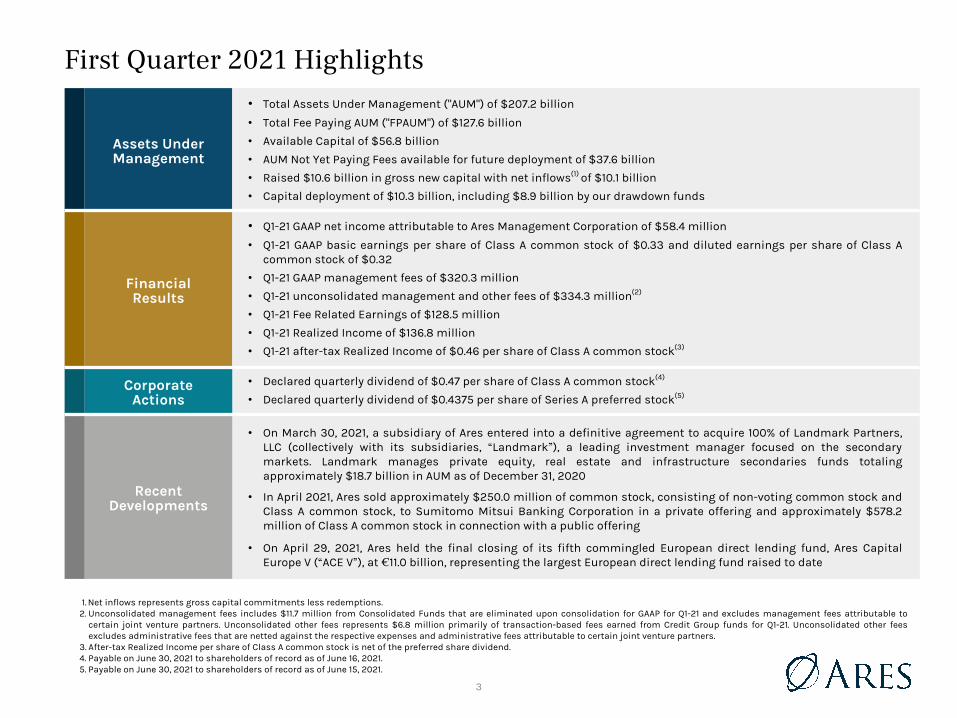
First Quarter 2021 Highlights
1. Net inflows represents gross capital commitments less redemptions.2. Unconsolidated management fees includes $11.7 million from Consolidated Funds that are eliminated upon consolidation for GAAP for Q1-21 and excludes management fees attributable to
certain joint venture partners. Unconsolidated other fees represents $6.8 million primarily of transaction-based fees earned from Credit Group funds for Q1-21. Unconsolidated other fees excludes administrative fees that are netted against the respective expenses and administrative fees attributable to certain joint venture partners.
3. After-tax Realized Income per share of Class A common stock is net of the preferred share dividend.4. Payable on June 30, 2021 to shareholders of record as of June 16, 2021.5. Payable on June 30, 2021 to shareholders of record as of June 15, 2021.
∙ Total Assets Under Management ("AUM") of $207.2 billion
∙ Total Fee Paying AUM ("FPAUM") of $127.6 billion
∙ Available Capital of $56.8 billion
∙ AUM Not Yet Paying Fees available for future deployment of $37.6 billion
∙ Raised $10.6 billion in gross new capital with net inflows(1) of $10.1 billion
∙ Capital deployment of $10.3 billion, including $8.9 billion by our drawdown funds
∙ Q1-21 GAAP net income attributable to Ares Management Corporation of $58.4 million
∙ Q1-21 GAAP basic earnings per share of Class A common stock of $0.33 and diluted earnings per share of Class A common stock of $0.32
∙ Q1-21 GAAP management fees of $320.3 million
∙ Q1-21 unconsolidated management and other fees of $334.3 million(2)
∙ Q1-21 Fee Related Earnings of $128.5 million
∙ Q1-21 Realized Income of $136.8 million
∙ Q1-21 after-tax Realized Income of $0.46 per share of Class A common stock(3)
∙ Declared quarterly dividend of $0.47 per share of Class A common stock(4)
∙ Declared quarterly dividend of $0.4375 per share of Series A preferred stock(5)
∙ On March 30, 2021, a subsidiary of Ares entered into a definitive agreement to acquire 100% of Landmark Partners, LLC (collectively with its subsidiaries, “Landmark”), a leading investment manager focused on the secondary markets. Landmark manages private equity, real estate and infrastructure secondaries funds totaling approximately $18.7 billion in AUM as of December 31, 2020
∙ In April 2021, Ares sold approximately $250.0 million of common stock, consisting of non-voting common stock and Class A common stock, to Sumitomo Mitsui Banking Corporation in a private offering and approximately $578.2 million of Class A common stock in connection with a public offering
∙ On April 29, 2021, Ares held the final closing of its fifth commingled European direct lending fund, Ares Capital Europe V (“ACE V”), at €11.0 billion, representing the largest European direct lending fund raised to date
Q2 #s
AUM - 158
FPAUM - 105
AC - 39
AUM NYPF 25
Raised 9B, net inflow 8B
Deployment 6B
NI - 56
EPS - 0.36 and 0.35
GAAP mgmt fees - 267
unconsol mgmt/other - 282
FRE - 97
RI - 115
RI per share - 0.39
4
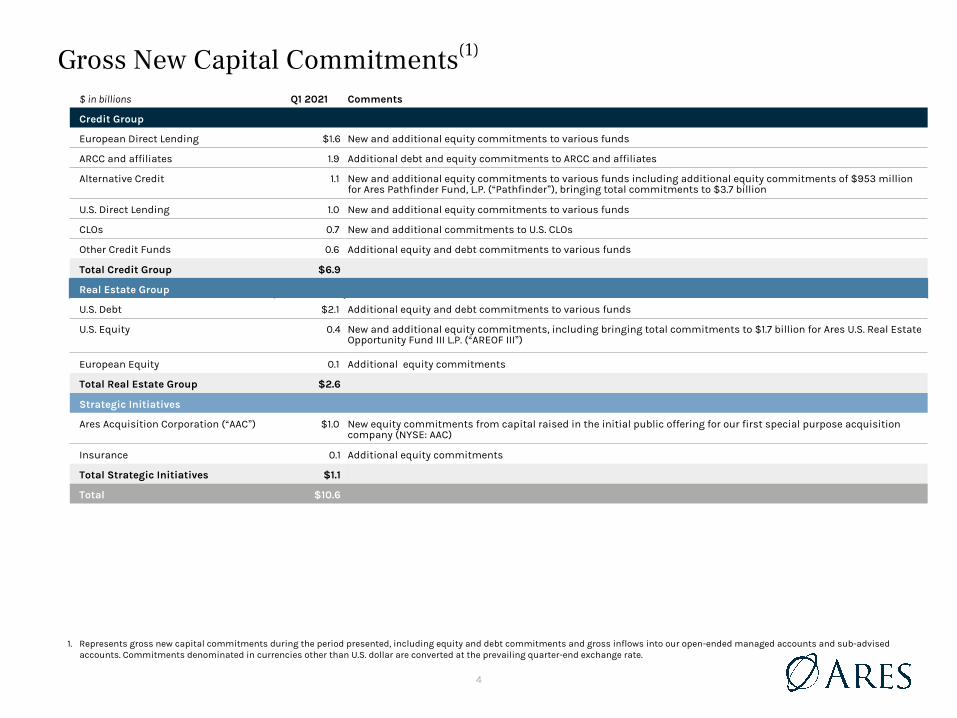
Gross New Capital Commitments(1)
1. Represents gross new capital commitments during the period presented, including equity and debt commitments and gross inflows into our open-ended managed accounts and sub-advised accounts. Commitments denominated in currencies other than U.S. dollar are converted at the prevailing quarter-end exchange rate.
$ in billions Q1 2021 Comments
Credit Group
European Direct Lending $1.6 New and additional equity commitments to various funds
ARCC and affiliates 1.9 Additional debt and equity commitments to ARCC and affiliates
Alternative Credit 1.1 New and additional equity commitments to various funds including additional equity commitments of $953 million for Ares Pathfinder Fund, L.P. (“Pathfinder”), bringing total commitments to $3.7 billion
U.S. Direct Lending 1.0 New and additional equity commitments to various funds
CLOs 0.7 New and additional commitments to U.S. CLOs
Other Credit Funds 0.6 Additional equity and debt commitments to various funds
Total Credit Group $6.9
Real Estate Group
U.S. Debt $2.1 Additional equity and debt commitments to various funds
U.S. Equity 0.4 New and additional equity commitments, including bringing total commitments to $1.7 billion for Ares U.S. Real Estate Opportunity Fund III L.P. (“AREOF III”)
European Equity 0.1 Additional equity commitments
Total Real Estate Group $2.6
Strategic Initiatives
Ares Acquisition Corporation (“AAC”) $1.0 New equity commitments from capital raised in the initial public offering for our first special purpose acquisition company (NYSE: AAC)
Insurance 0.1 Additional equity commitments
Total Strategic Initiatives $1.1
Total $10.6
CLO 56 - 0.5
Pathfinder - 0.3
2 SMA (UPS II/AFLAC) - 0.25 each
US DL - ARCC 1.15
ACE V - 8.247 (ECSF IX 0.4), ECI IV A 0.2
ACOF VI - 0.3
ACIP - 0.2
SLO III - 0.3
0 42 65
155 112 42
4 94 109
127 127 127
0 42 65
2 87 133
71 126 163
120 163 198
Credit
PrivateEquity
RealEstate
StrategicInitiatives
CHECKS:
1) is the orde of segments listed from largest to smallest by segment?
2) check for any final closes and funds that can now be named (need full legal name) - include final close amount
5
$75.8$88.0 $91.6
$17.0
$21.2 $18.6$9.2
$10.2 $10.8$6.6 $6.6
$102.0
$126.0 $127.6
Q1-20 Q4-20 Q1-21
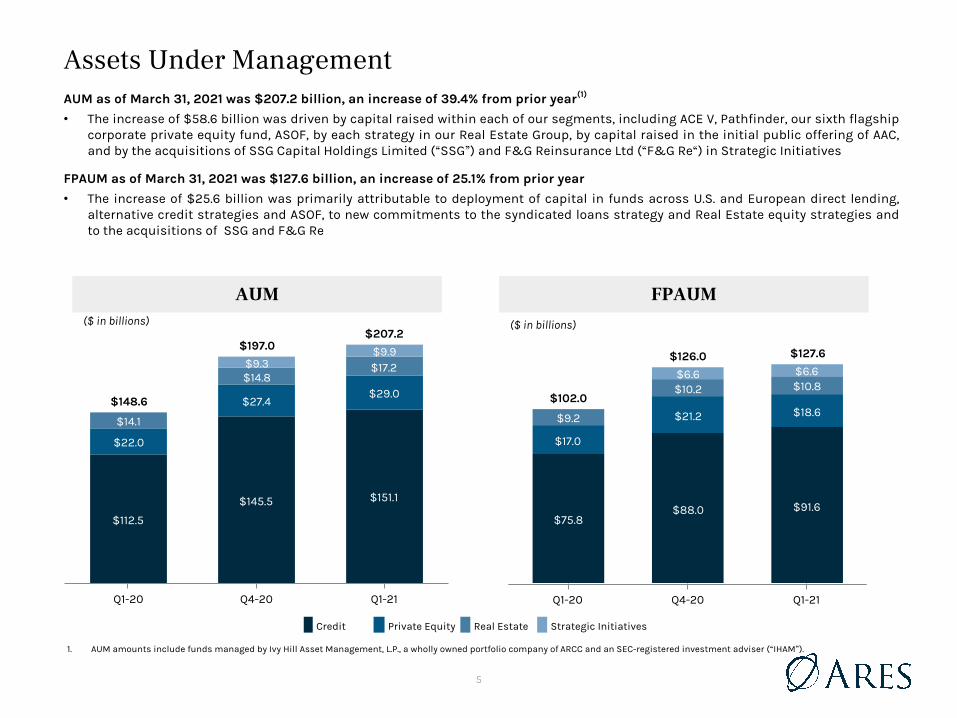
Assets Under Management
1. AUM amounts include funds managed by Ivy Hill Asset Management, L.P., a wholly owned portfolio company of ARCC and an SEC-registered investment adviser (“IHAM”).
AUM as of March 31, 2021 was $207.2 billion, an increase of 39.4% from prior year(1)
∙ The increase of $58.6 billion was driven by capital raised within each of our segments, including ACE V, Pathfinder, our sixth flagship corporate private equity fund, ASOF, by each strategy in our Real Estate Group, by capital raised in the initial public offering of AAC, and by the acquisitions of SSG Capital Holdings Limited (“SSG”) and F&G Reinsurance Ltd (“F&G Re“) in Strategic Initiatives
FPAUM as of March 31, 2021 was $127.6 billion, an increase of 25.1% from prior year
∙ The increase of $25.6 billion was primarily attributable to deployment of capital in funds across U.S. and European direct lending, alternative credit strategies and ASOF, to new commitments to the syndicated loans strategy and Real Estate equity strategies and to the acquisitions of SSG and F&G Re
AUM FPAUM
$112.5
$145.5 $151.1
$22.0
$27.4$29.0
$14.1
$14.8$17.2$9.3$9.9
$148.6
$197.0$207.2
Q1-20 Q4-20 Q1-21
Credit Private Equity Real Estate Strategic Initiatives
($ in billions) ($ in billions)
0 42 65
155 112 42
4 94 109
127 127 127
0 42 65
2 87 133
71 126 163
120 163 198
Credit
PrivateEquity
RealEstate
StrategicInitiatives
6
33%
8%
11%
25%
8%
12%
3%
49%
33%
7%
8%
2% 1%
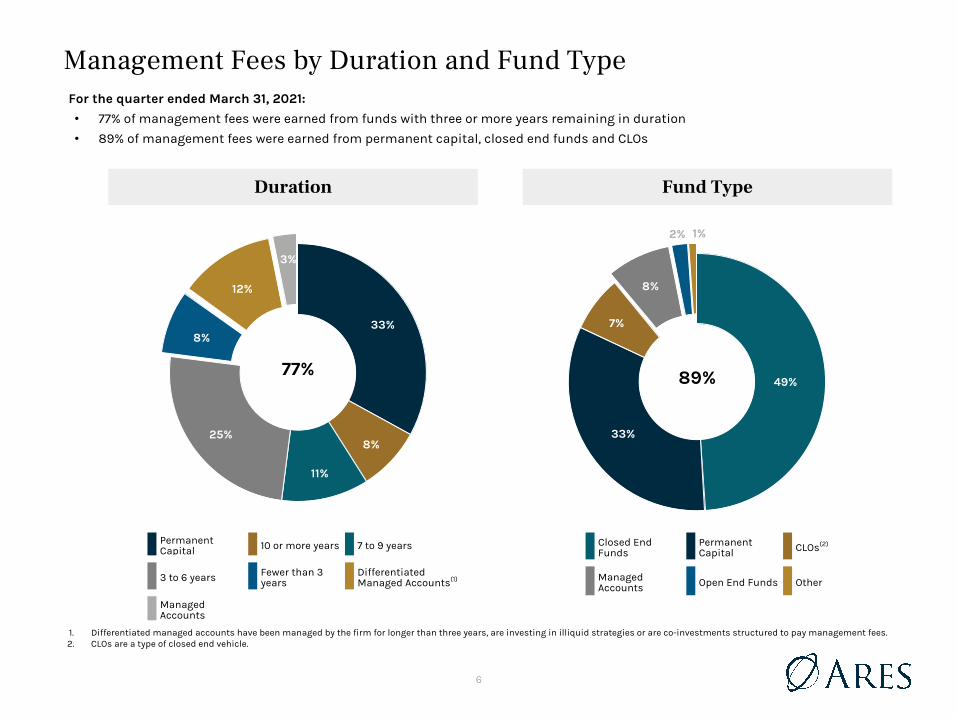
Management Fees by Duration and Fund Type
77%
1. Differentiated managed accounts have been managed by the firm for longer than three years, are investing in illiquid strategies or are co-investments structured to pay management fees.2. CLOs are a type of closed end vehicle.
For the quarter ended March 31, 2021:
∙ 77% of management fees were earned from funds with three or more years remaining in duration
∙ 89% of management fees were earned from permanent capital, closed end funds and CLOs
Duration Fund Type
89%
Permanent Capital 10 or more years 7 to 9 years
3 to 6 years Fewer than 3 years
Differentiated Managed Accounts(1)
Managed Accounts
Closed End Funds
Permanent Capital CLOs(2)
Managed Accounts Open End Funds Other
7
15%
13%
16%
24%
8%
18%
6%12%
10%
19%
26%
10%
17%
6%
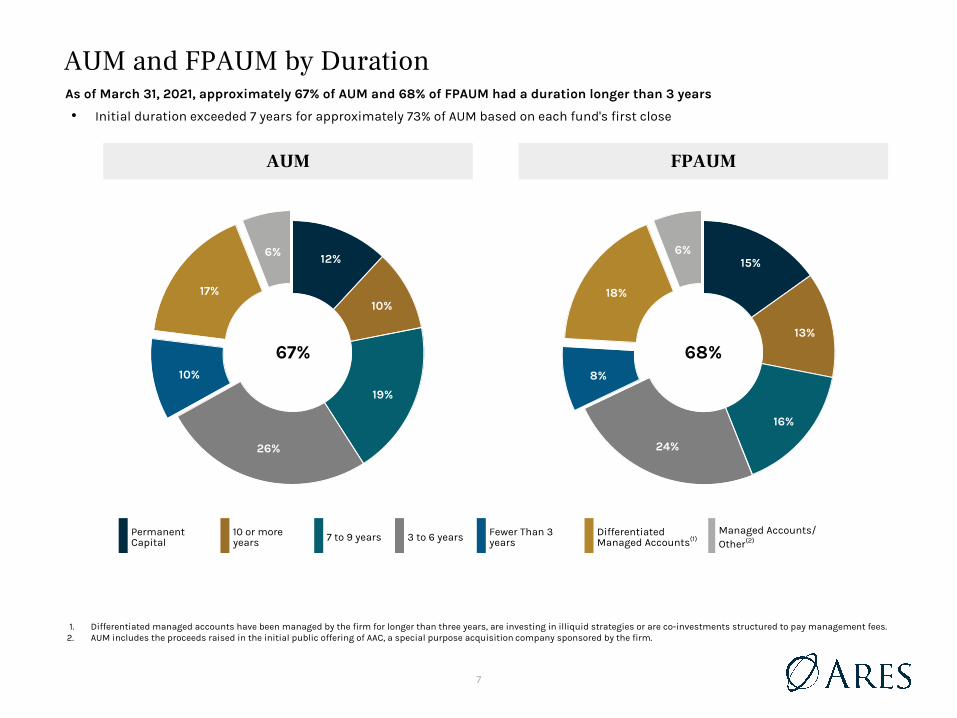
AUM and FPAUM by DurationAs of March 31, 2021, approximately 67% of AUM and 68% of FPAUM had a duration longer than 3 years
∙ Initial duration exceeded 7 years for approximately 73% of AUM based on each fund's first close
Permanent Capital
10 or more years 7 to 9 years 3 to 6 years Fewer Than 3
yearsDifferentiated Managed Accounts(1)
Managed Accounts/Other(2)
67% 68%
1. Differentiated managed accounts have been managed by the firm for longer than three years, are investing in illiquid strategies or are co-investments structured to pay management fees.2. AUM includes the proceeds raised in the initial public offering of AAC, a special purpose acquisition company sponsored by the firm.
FPAUMAUM
$207.2 billion $127.6
billion
8
$18.3
$33.4 $33.7$2.5
$2.7 $3.0
$2.3
$1.7 $1.8$2.2 $1.7
$23.1
$40.0 $40.2
Q1-20 Q4-20 Q1-21
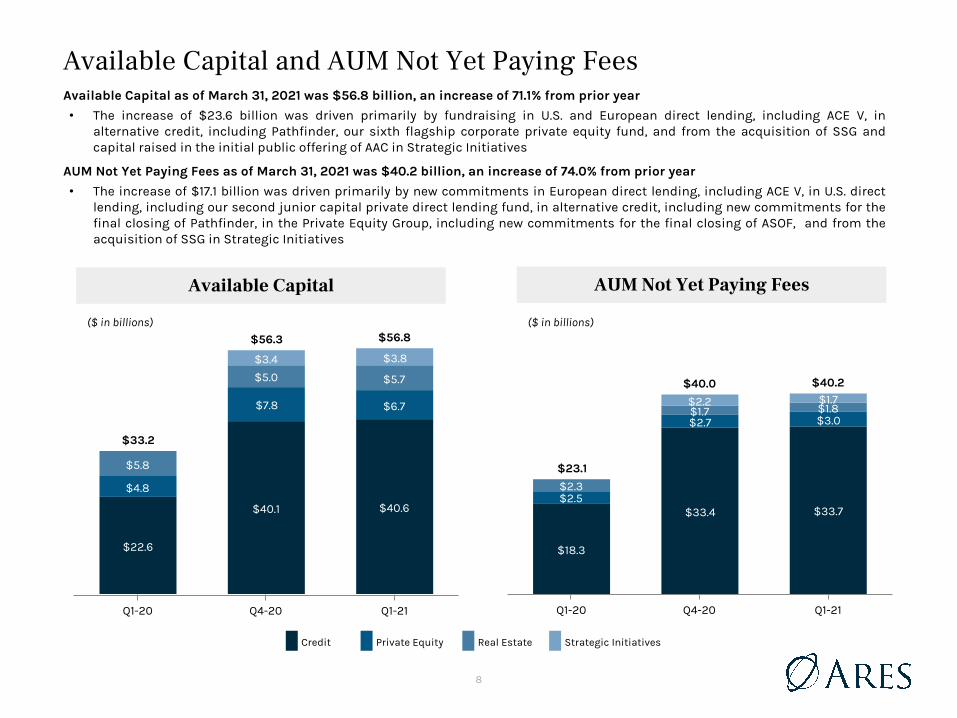
Available Capital and AUM Not Yet Paying FeesAvailable Capital as of March 31, 2021 was $56.8 billion, an increase of 71.1% from prior year
∙ The increase of $23.6 billion was driven primarily by fundraising in U.S. and European direct lending, including ACE V, in alternative credit, including Pathfinder, our sixth flagship corporate private equity fund, and from the acquisition of SSG and capital raised in the initial public offering of AAC in Strategic Initiatives
AUM Not Yet Paying Fees as of March 31, 2021 was $40.2 billion, an increase of 74.0% from prior year
∙ The increase of $17.1 billion was driven primarily by new commitments in European direct lending, including ACE V, in U.S. direct lending, including our second junior capital private direct lending fund, in alternative credit, including new commitments for the final closing of Pathfinder, in the Private Equity Group, including new commitments for the final closing of ASOF, and from the acquisition of SSG in Strategic Initiatives
Available Capital AUM Not Yet Paying Fees
$22.6
$40.1 $40.6
$4.8
$7.8 $6.7
$5.8
$5.0 $5.7
$3.4 $3.8
$33.2
$56.3 $56.8
Q1-20 Q4-20 Q1-21
($ in billions) ($ in billions)
Credit Private Equity Real Estate Strategic Initiatives
9
$2.4
$0.2
$32.7
$2.3
$1.0$1.6
AUM Not Yet Paying Fees Available for Future Deployment
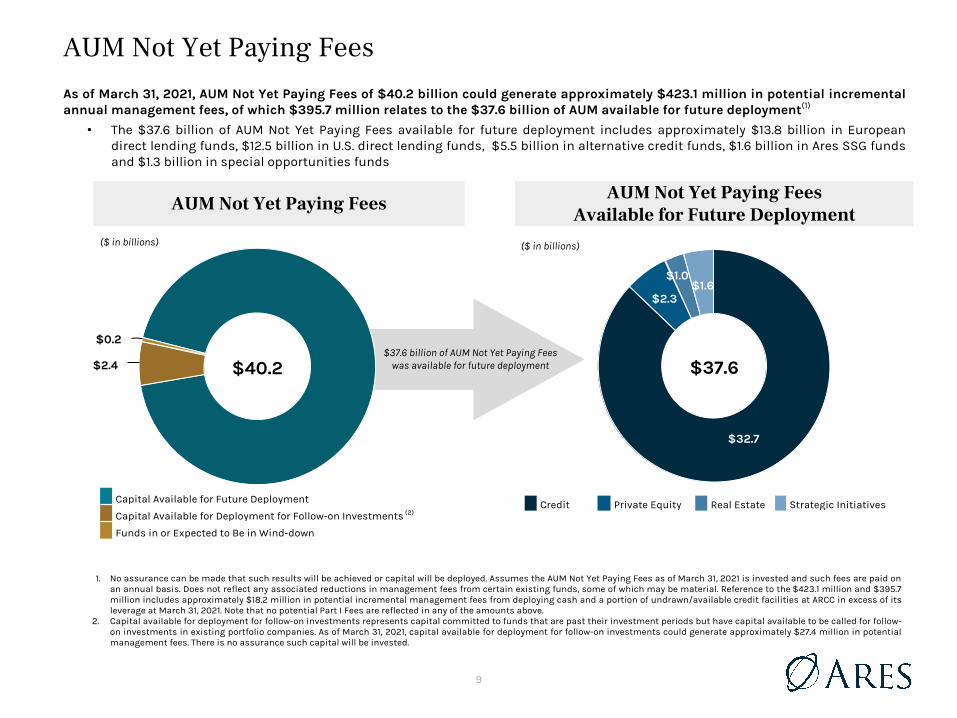
AUM Not Yet Paying FeesAs of March 31, 2021, AUM Not Yet Paying Fees of $40.2 billion could generate approximately $423.1 million in potential incremental annual management fees, of which $395.7 million relates to the $37.6 billion of AUM available for future deployment(1)
∙ The $37.6 billion of AUM Not Yet Paying Fees available for future deployment includes approximately $13.8 billion in European direct lending funds, $12.5 billion in U.S. direct lending funds, $5.5 billion in alternative credit funds, $1.6 billion in Ares SSG funds and $1.3 billion in special opportunities funds
1. No assurance can be made that such results will be achieved or capital will be deployed. Assumes the AUM Not Yet Paying Fees as of March 31, 2021 is invested and such fees are paid on an annual basis. Does not reflect any associated reductions in management fees from certain existing funds, some of which may be material. Reference to the $423.1 million and $395.7 million includes approximately $18.2 million in potential incremental management fees from deploying cash and a portion of undrawn/available credit facilities at ARCC in excess of its leverage at March 31, 2021. Note that no potential Part I Fees are reflected in any of the amounts above.
2. Capital available for deployment for follow-on investments represents capital committed to funds that are past their investment periods but have capital available to be called for follow-on investments in existing portfolio companies. As of March 31, 2021, capital available for deployment for follow-on investments could generate approximately $27.4 million in potential management fees. There is no assurance such capital will be invested.
$37.6 billion of AUM Not Yet Paying Fees was available for future deployment
($ in billions)($ in billions)
Capital Available for Future Deployment
Capital Available for Deployment for Follow-on Investments (2)
Funds in or Expected to Be in Wind-down
AUM Not Yet Paying Fees
Credit Private Equity Real Estate Strategic Initiatives
$37.6 $40.2
Footnote 1: target leverage of ARCC is 1.25x
10
Q1-20 Q4-20 Q1-21
Incentive Eligible AUM and Incentive Generating AUM
($ in billions) ($ in billions)Credit Private
EquityReal
EstateStrategic
Initiatives(3) Total
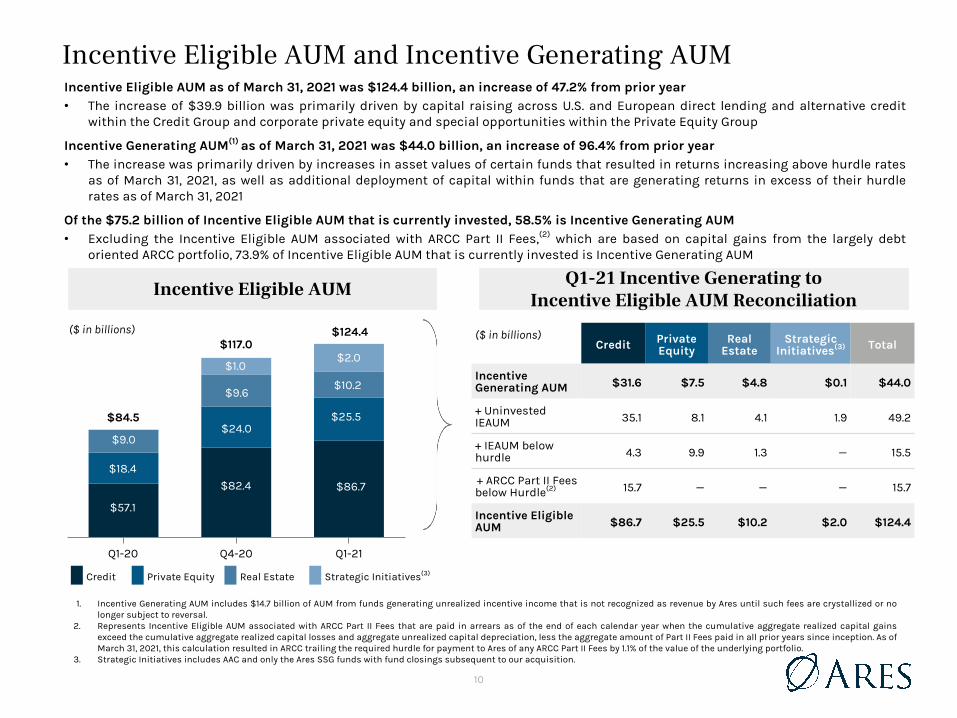
Incentive Generating AUM $31.6 $7.5 $4.8 $0.1 $44.0
+ Uninvested IEAUM 35.1 8.1 4.1 1.9 49.2
+ IEAUM below hurdle 4.3 9.9 1.3 — 15.5
‘+ ARCC Part II Fees below Hurdle(2) 15.7 — — — 15.7
Incentive Eligible AUM $86.7 $25.5 $10.2 $2.0 $124.4
Credit Private Equity Real Estate Strategic Initiatives(3)
1. Incentive Generating AUM includes $14.7 billion of AUM from funds generating unrealized incentive income that is not recognized as revenue by Ares until such fees are crystallized or no longer subject to reversal.
2. Represents Incentive Eligible AUM associated with ARCC Part II Fees that are paid in arrears as of the end of each calendar year when the cumulative aggregate realized capital gains exceed the cumulative aggregate realized capital losses and aggregate unrealized capital depreciation, less the aggregate amount of Part II Fees paid in all prior years since inception. As of March 31, 2021, this calculation resulted in ARCC trailing the required hurdle for payment to Ares of any ARCC Part II Fees by 1.1% of the value of the underlying portfolio.
3. Strategic Initiatives includes AAC and only the Ares SSG funds with fund closings subsequent to our acquisition.
Incentive Eligible AUM
Incentive Eligible AUM as of March 31, 2021 was $124.4 billion, an increase of 47.2% from prior year∙ The increase of $39.9 billion was primarily driven by capital raising across U.S. and European direct lending and alternative credit
within the Credit Group and corporate private equity and special opportunities within the Private Equity Group
Incentive Generating AUM(1) as of March 31, 2021 was $44.0 billion, an increase of 96.4% from prior year∙ The increase was primarily driven by increases in asset values of certain funds that resulted in returns increasing above hurdle rates
as of March 31, 2021, as well as additional deployment of capital within funds that are generating returns in excess of their hurdle rates as of March 31, 2021
Of the $75.2 billion of Incentive Eligible AUM that is currently invested, 58.5% is Incentive Generating AUM∙ Excluding the Incentive Eligible AUM associated with ARCC Part II Fees,(2) which are based on capital gains from the largely debt
oriented ARCC portfolio, 73.9% of Incentive Eligible AUM that is currently invested is Incentive Generating AUM
Q1-21 Incentive Generating to Incentive Eligible AUM Reconciliation
Consider hurdle rate for ARCC Part II fees in future periods. Discuss when ~2%. 5.2% for Q2 2020, removed. 4.0% for Q3 2020, 3% for Q4 2020
$10.2
$2.0
$86.7
$1.0
$25.5
$9.6
$24.0
$82.4
$57.1
$18.4
$9.0
$84.5
$117.0$124.4
11
$6.2$1.9
$1.4
$0.8
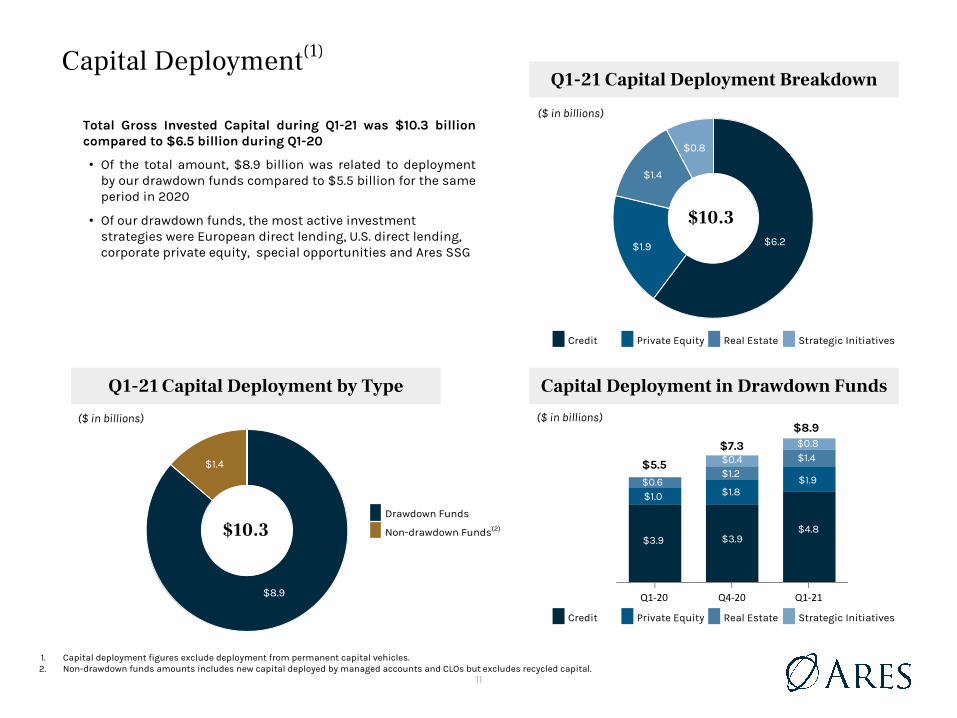
Q1-21 Capital Deployment BreakdownCapital Deployment(1)
($ in billions)
(2)
1. Capital deployment figures exclude deployment from permanent capital vehicles.2. Non-drawdown funds amounts includes new capital deployed by managed accounts and CLOs but excludes recycled capital.
$8.9
$1.4
Capital Deployment in Drawdown FundsQ1-21 Capital Deployment by Type
($ in billions) ($ in billions)
Total Gross Invested Capital during Q1-21 was $10.3 billion compared to $6.5 billion during Q1-20
∙ Of the total amount, $8.9 billion was related to deployment by our drawdown funds compared to $5.5 billion for the same period in 2020
∙ Of our drawdown funds, the most active investment strategies were European direct lending, U.S. direct lending, corporate private equity, special opportunities and Ares SSG
Credit Private Equity Real Estate Strategic Initiatives
Credit Private Equity Real Estate Strategic Initiatives
Drawdown Funds
Non-drawdown Funds(2)$10.3
$10.3
Q1-20 Q4-20 Q1-21
$3.9
$1.0$0.6
$5.5
$3.9
$1.8
$1.2
$7.3
$8.9
$1.4
$4.8
$1.9
$0.4
$0.8
12
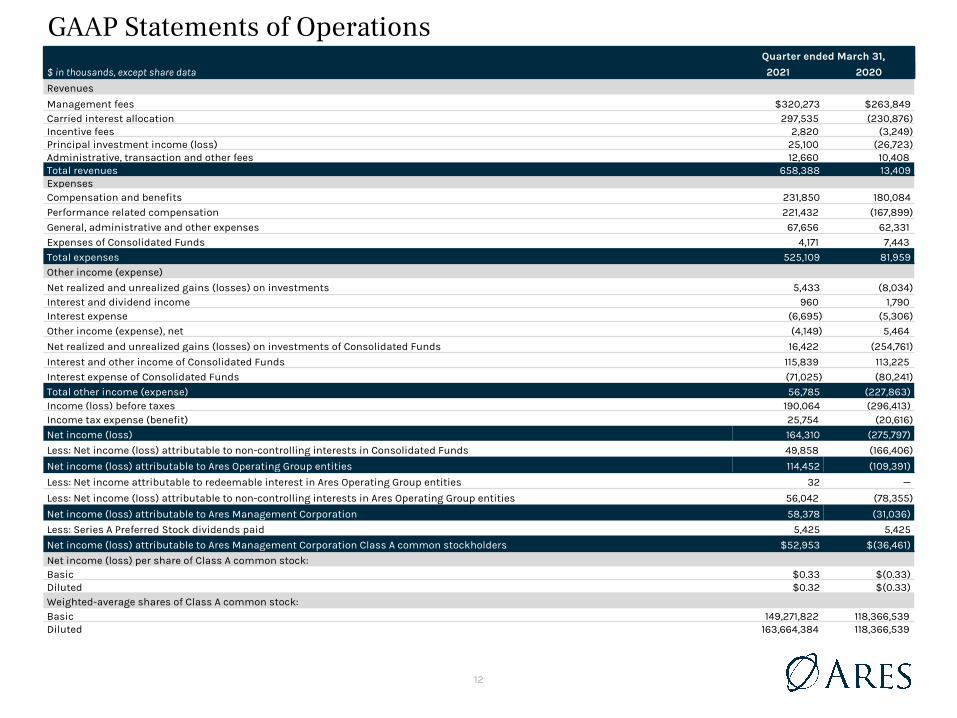
Quarter ended March 31,
$ in thousands, except share data 2021 2020
Revenues
Management fees $320,273 $263,849Carried interest allocation 297,535 (230,876) Incentive fees 2,820 (3,249) Principal investment income (loss) 25,100 (26,723) Administrative, transaction and other fees 12,660 10,408 Total revenues 658,388 13,409ExpensesCompensation and benefits 231,850 180,084Performance related compensation 221,432 (167,899) General, administrative and other expenses 67,656 62,331 Expenses of Consolidated Funds 4,171 7,443 Total expenses 525,109 81,959Other income (expense)
Net realized and unrealized gains (losses) on investments 5,433 (8,034) Interest and dividend income 960 1,790 Interest expense (6,695) (5,306) Other income (expense), net (4,149) 5,464
Net realized and unrealized gains (losses) on investments of Consolidated Funds 16,422 (254,761)
Interest and other income of Consolidated Funds 115,839 113,225 Interest expense of Consolidated Funds (71,025) (80,241) Total other income (expense) 56,785 (227,863)Income (loss) before taxes 190,064 (296,413)Income tax expense (benefit) 25,754 (20,616) Net income (loss) 164,310 (275,797)
Less: Net income (loss) attributable to non-controlling interests in Consolidated Funds 49,858 (166,406)
Net income (loss) attributable to Ares Operating Group entities 114,452 (109,391)
Less: Net income attributable to redeemable interest in Ares Operating Group entities 32 —
Less: Net income (loss) attributable to non-controlling interests in Ares Operating Group entities 56,042 (78,355)
Net income (loss) attributable to Ares Management Corporation 58,378 (31,036)
Less: Series A Preferred Stock dividends paid 5,425 5,425
Net income (loss) attributable to Ares Management Corporation Class A common stockholders $52,953 $(36,461)
Net income (loss) per share of Class A common stock:Basic $0.33 $(0.33)Diluted $0.32 $(0.33)Weighted-average shares of Class A common stock:Basic 149,271,822 118,366,539 Diluted 163,664,384 118,366,539
GAAP Statements of Operations
13
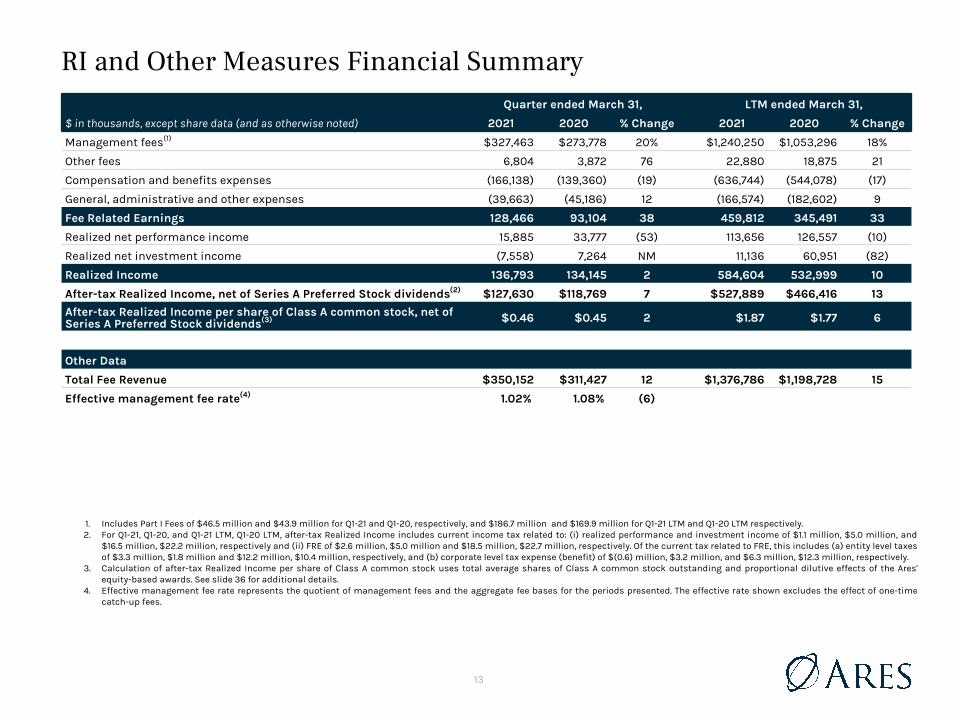
RI and Other Measures Financial Summary
1. Includes Part I Fees of $46.5 million and $43.9 million for Q1-21 and Q1-20, respectively, and $186.7 million and $169.9 million for Q1-21 LTM and Q1-20 LTM respectively. 2. For Q1-21, Q1-20, and Q1-21 LTM, Q1-20 LTM, after-tax Realized Income includes current income tax related to: (i) realized performance and investment income of $1.1 million, $5.0 million, and
$16.5 million, $22.2 million, respectively and (ii) FRE of $2.6 million, $5.0 million and $18.5 million, $22.7 million, respectively. Of the current tax related to FRE, this includes (a) entity level taxes of $3.3 million, $1.8 million and $12.2 million, $10.4 million, respectively, and (b) corporate level tax expense (benefit) of $(0.6) million, $3.2 million, and $6.3 million, $12.3 million, respectively.
3. Calculation of after-tax Realized Income per share of Class A common stock uses total average shares of Class A common stock outstanding and proportional dilutive effects of the Ares' equity-based awards. See slide 36 for additional details.
4. Effective management fee rate represents the quotient of management fees and the aggregate fee bases for the periods presented. The effective rate shown excludes the effect of one-time catch-up fees.
Quarter ended March 31, LTM ended March 31,
$ in thousands, except share data (and as otherwise noted) 2021 2020 % Change 2021 2020 % Change
Management fees(1) $327,463 $273,778 20% $1,240,250 $1,053,296 18%
Other fees 6,804 3,872 76 22,880 18,875 21
Compensation and benefits expenses (166,138) (139,360) (19) (636,744) (544,078) (17)
General, administrative and other expenses (39,663) (45,186) 12 (166,574) (182,602) 9
Fee Related Earnings 128,466 93,104 38 459,812 345,491 33
Realized net performance income 15,885 33,777 (53) 113,656 126,557 (10)
Realized net investment income (7,558) 7,264 NM 11,136 60,951 (82)
Realized Income 136,793 134,145 2 584,604 532,999 10
After-tax Realized Income, net of Series A Preferred Stock dividends(2) $127,630 $118,769 7 $527,889 $466,416 13
After-tax Realized Income per share of Class A common stock, net of Series A Preferred Stock dividends(3) $0.46 $0.45 2 $1.87 $1.77 6
Other Data
Total Fee Revenue $350,152 $311,427 12 $1,376,786 $1,198,728 15
Effective management fee rate(4) 1.02% 1.08% (6)
14
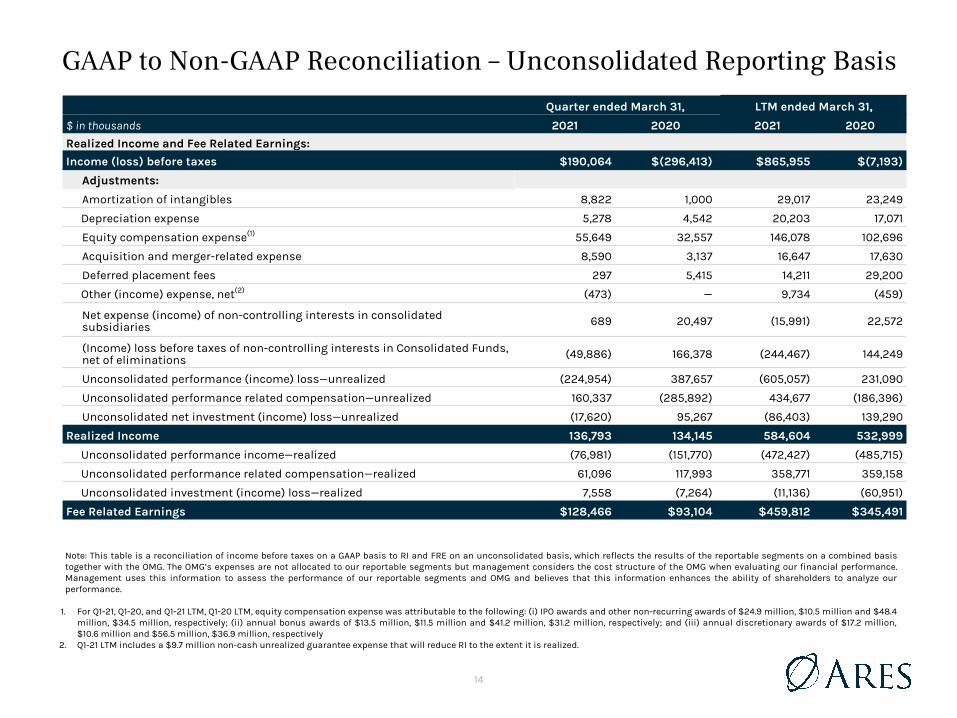
GAAP to Non-GAAP Reconciliation – Unconsolidated Reporting BasisQuarter ended March 31, LTM ended March 31,
$ in thousands 2021 2020 2021 2020
Realized Income and Fee Related Earnings:
Income (loss) before taxes $190,064 $(296,413) $865,955 $(7,193)
Adjustments:
Amortization of intangibles 8,822 1,000 29,017 23,249
Depreciation expense 5,278 4,542 20,203 17,071
Equity compensation expense(1) 55,649 32,557 146,078 102,696
Acquisition and merger-related expense 8,590 3,137 16,647 17,630
Deferred placement fees 297 5,415 14,211 29,200
Other (income) expense, net(2) (473) — 9,734 (459)
Net expense (income) of non-controlling interests in consolidated subsidiaries 689 20,497 (15,991) 22,572
(Income) loss before taxes of non-controlling interests in Consolidated Funds, net of eliminations (49,886) 166,378 (244,467) 144,249
Unconsolidated performance (income) loss—unrealized (224,954) 387,657 (605,057) 231,090
Unconsolidated performance related compensation—unrealized 160,337 (285,892) 434,677 (186,396)
Unconsolidated net investment (income) loss—unrealized (17,620) 95,267 (86,403) 139,290
Realized Income 136,793 134,145 584,604 532,999
Unconsolidated performance income—realized (76,981) (151,770) (472,427) (485,715)
Unconsolidated performance related compensation—realized 61,096 117,993 358,771 359,158
Unconsolidated investment (income) loss—realized 7,558 (7,264) (11,136) (60,951)
Fee Related Earnings $128,466 $93,104 $459,812 $345,491
Note: This table is a reconciliation of income before taxes on a GAAP basis to RI and FRE on an unconsolidated basis, which reflects the results of the reportable segments on a combined basis together with the OMG. The OMG’s expenses are not allocated to our reportable segments but management considers the cost structure of the OMG when evaluating our financial performance. Management uses this information to assess the performance of our reportable segments and OMG and believes that this information enhances the ability of shareholders to analyze our performance.
1. For Q1-21, Q1-20, and Q1-21 LTM, Q1-20 LTM, equity compensation expense was attributable to the following: (i) IPO awards and other non-recurring awards of $24.9 million, $10.5 million and $48.4 million, $34.5 million, respectively; (ii) annual bonus awards of $13.5 million, $11.5 million and $41.2 million, $31.2 million, respectively; and (iii) annual discretionary awards of $17.2 million, $10.6 million and $56.5 million, $36.9 million, respectively
2. Q1-21 LTM includes a $9.7 million non-cash unrealized guarantee expense that will reduce RI to the extent it is realized.
15
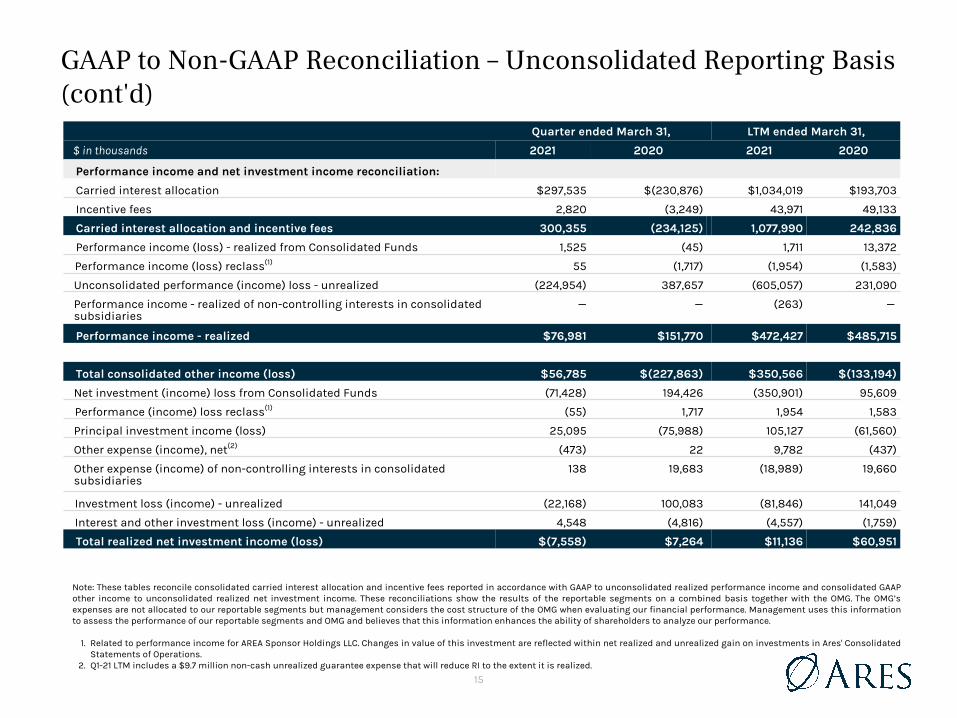
GAAP to Non-GAAP Reconciliation – Unconsolidated Reporting Basis (cont'd)
Note: These tables reconcile consolidated carried interest allocation and incentive fees reported in accordance with GAAP to unconsolidated realized performance income and consolidated GAAP other income to unconsolidated realized net investment income. These reconciliations show the results of the reportable segments on a combined basis together with the OMG. The OMG’s expenses are not allocated to our reportable segments but management considers the cost structure of the OMG when evaluating our financial performance. Management uses this information to assess the performance of our reportable segments and OMG and believes that this information enhances the ability of shareholders to analyze our performance.
1. Related to performance income for AREA Sponsor Holdings LLC. Changes in value of this investment are reflected within net realized and unrealized gain on investments in Ares' Consolidated Statements of Operations.
2. Q1-21 LTM includes a $9.7 million non-cash unrealized guarantee expense that will reduce RI to the extent it is realized.
Quarter ended March 31, LTM ended March 31,
$ in thousands 2021 2020 2021 2020
Performance income and net investment income reconciliation:
Carried interest allocation $297,535 $(230,876) $1,034,019 $193,703
Incentive fees 2,820 (3,249) 43,971 49,133
Carried interest allocation and incentive fees 300,355 (234,125) 1,077,990 242,836
Performance income (loss) - realized from Consolidated Funds 1,525 (45) 1,711 13,372
Performance income (loss) reclass(1) 55 (1,717) (1,954) (1,583)
Unconsolidated performance (income) loss - unrealized (224,954) 387,657 (605,057) 231,090
Performance income - realized of non-controlling interests in consolidated subsidiaries
— — (263) —
Performance income - realized $76,981 $151,770 $472,427 $485,715
Total consolidated other income (loss) $56,785 $(227,863) $350,566 $(133,194)
Net investment (income) loss from Consolidated Funds (71,428) 194,426 (350,901) 95,609
Performance (income) loss reclass(1) (55) 1,717 1,954 1,583
Principal investment income (loss) 25,095 (75,988) 105,127 (61,560)
Other expense (income), net(2) (473) 22 9,782 (437)
Other expense (income) of non-controlling interests in consolidated subsidiaries
138 19,683 (18,989) 19,660
Investment loss (income) - unrealized (22,168) 100,083 (81,846) 141,049
Interest and other investment loss (income) - unrealized 4,548 (4,816) (4,557) (1,759)
Total realized net investment income (loss) $(7,558) $7,264 $11,136 $60,951
16
Credit Group(1)
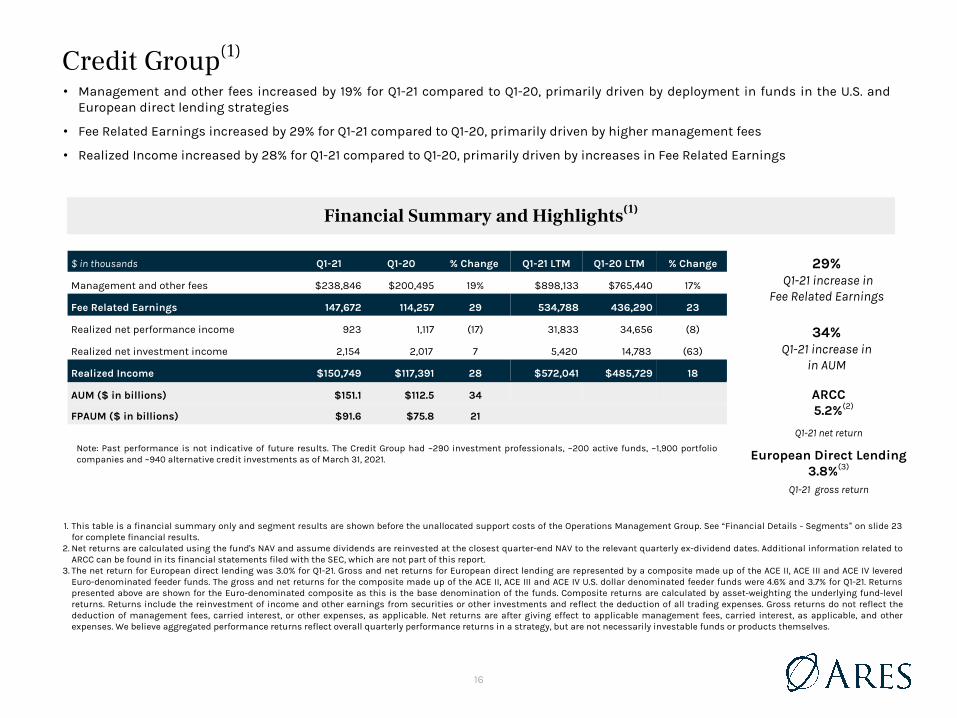
1. This table is a financial summary only and segment results are shown before the unallocated support costs of the Operations Management Group. See “Financial Details - Segments” on slide 23 for complete financial results.
2. Net returns are calculated using the fund's NAV and assume dividends are reinvested at the closest quarter-end NAV to the relevant quarterly ex-dividend dates. Additional information related to ARCC can be found in its financial statements filed with the SEC, which are not part of this report.
3. The net return for European direct lending was 3.0% for Q1-21. Gross and net returns for European direct lending are represented by a composite made up of the ACE II, ACE III and ACE IV levered Euro-denominated feeder funds. The gross and net returns for the composite made up of the ACE II, ACE III and ACE IV U.S. dollar denominated feeder funds were 4.6% and 3.7% for Q1-21. Returns presented above are shown for the Euro-denominated composite as this is the base denomination of the funds. Composite returns are calculated by asset-weighting the underlying fund-level returns. Returns include the reinvestment of income and other earnings from securities or other investments and reflect the deduction of all trading expenses. Gross returns do not reflect the deduction of management fees, carried interest, or other expenses, as applicable. Net returns are after giving effect to applicable management fees, carried interest, as applicable, and other expenses. We believe aggregated performance returns reflect overall quarterly performance returns in a strategy, but are not necessarily investable funds or products themselves.
∙ Management and other fees increased by 19% for Q1-21 compared to Q1-20, primarily driven by deployment in funds in the U.S. and European direct lending strategies
∙ Fee Related Earnings increased by 29% for Q1-21 compared to Q1-20, primarily driven by higher management fees
∙ Realized Income increased by 28% for Q1-21 compared to Q1-20, primarily driven by increases in Fee Related Earnings
34%Q1-21 increase in
in AUM
29% Q1-21 increase in
Fee Related Earnings
ARCC 5.2%(2)
Q1-21 net return
European Direct Lending 3.8%(3)
Q1-21 gross return
$ in thousands Q1-21 Q1-20 % Change Q1-21 LTM Q1-20 LTM % Change
Management and other fees $238,846 $200,495 19% $898,133 $765,440 17%
Fee Related Earnings 147,672 114,257 29 534,788 436,290 23
Realized net performance income 923 1,117 (17) 31,833 34,656 (8)
Realized net investment income 2,154 2,017 7 5,420 14,783 (63)
Realized Income $150,749 $117,391 28 $572,041 $485,729 18
AUM ($ in billions) $151.1 $112.5 34
FPAUM ($ in billions) $91.6 $75.8 21
Financial Summary and Highlights(1)
Note: Past performance is not indicative of future results. The Credit Group had ~290 investment professionals, ~200 active funds, ~1,900 portfolio companies and ~940 alternative credit investments as of March 31, 2021.
1. This table is a financial summary only and segment results are shown before the unallocated support costs of the Operations Management Group. See “Financial Details - Segments” on slides 23-0 for complete financial results.
2. Includes ARCC Part I Fees of $46.5 million and $43.9 million for Q1-21 and Q1-20, respectively, and $46.5 million and $43.9 million for FY-20 and FY-19, respectively. The $10 million quarterly ARCC-ACAS transaction fee waiver was effective through Q3-19. Fees have increased in subsequent periods due to the expiration of the fee waiver.
3. The net returns for European direct lending was 3.0% and 8.0% for Q1-21 and FY-20, respectively. Gross and net returns for European direct lending are represented by a composite made up of the ACE II, ACE III and ACE IV levered Euro-denominated feeder funds. The gross and net returns for the composite made up of the ACE II, ACE III and ACE IV U.S. dollar denominated feeder funds were 4.6% and 3.7% for Q1-21 and 12.5% and 9.2% for FY-20. Returns presented above are shown for the Euro-denominated composite as this is the base denomination of the funds. Composite returns are calculated by asset-weighting the underlying fund-level returns. Returns include the reinvestment of income and other earnings from securities or other investments and reflect the deduction of all trading expenses. Gross returns do not reflect the deduction of management fees, carried interest, or other expenses, as applicable. Net returns are after giving effect to applicable management fees, carried interest, as applicable, and other expenses. We believe aggregated performance returns reflect overall quarterly performance returns in a strategy, but are not necessarily investable funds or products themselves.
4. Net performance returns: 2.1% and 19.5% for U.S. syndicated loan funds for Q1-21 and FY-20 and 2.1% and 23.6% for U.S. high yield funds for Q1-21 and FY-20. Performance for syndicated loans is represented by the U.S. Bank Loan Aggregate Composite which includes all actual, fully discretionary, fee-paying, funds that are benchmarked to the Credit Suisse Leveraged Loan Index and primarily invested in USD denominated banks loans. Such funds may have limited allocations to high yield and structured securities. Performance for high yield is represented by the U.S. high yield Composite which includes all actual, fully discretionary, fee-paying, separately managed funds that primarily invest in U.S. high yield fixed income securities and are benchmarked to the BofA Merrill Lynch U.S. High Yield Master II Constrained Index, or a similar index. We believe aggregated performance returns reflect overall quarterly performance returns in a strategy, but are not necessarily investable funds or products themselves.
∙ Realized Income increased by 28% for Q1-21 compared to Q1-20
High Yield 2.2%(3)
Syndicated Loans 2.3%(3)
1. Net performance returns: 2.1% for U.S. syndicated loan funds for Q1-21 and 2.1% for U.S. high yield funds for Q1-21. Performance for syndicated loans is represented by the U.S. Bank Loan Aggregate Composite which includes all actual, fully discretionary, fee-paying, funds that are benchmarked to the Credit Suisse Leveraged Loan Index and primarily invested in USD denominated banks loans. Such funds may have limited allocations to high yield and structured securities. Performance for high yield is represented by the U.S. high yield Composite which includes all actual, fully discretionary, fee-paying, separately managed funds that primarily invest in U.S. high yield fixed income securities and are benchmarked to the BofA Merrill Lynch U.S. High Yield Master II Constrained Index, or a similar index. We believe aggregated performance returns reflect overall quarterly performance returns in a strategy, but are not necessarily investable funds or products themselves.
17
Corporate Private Equity16.3%
Special Opportunities9.9%
Q1-21 gross returns(2)
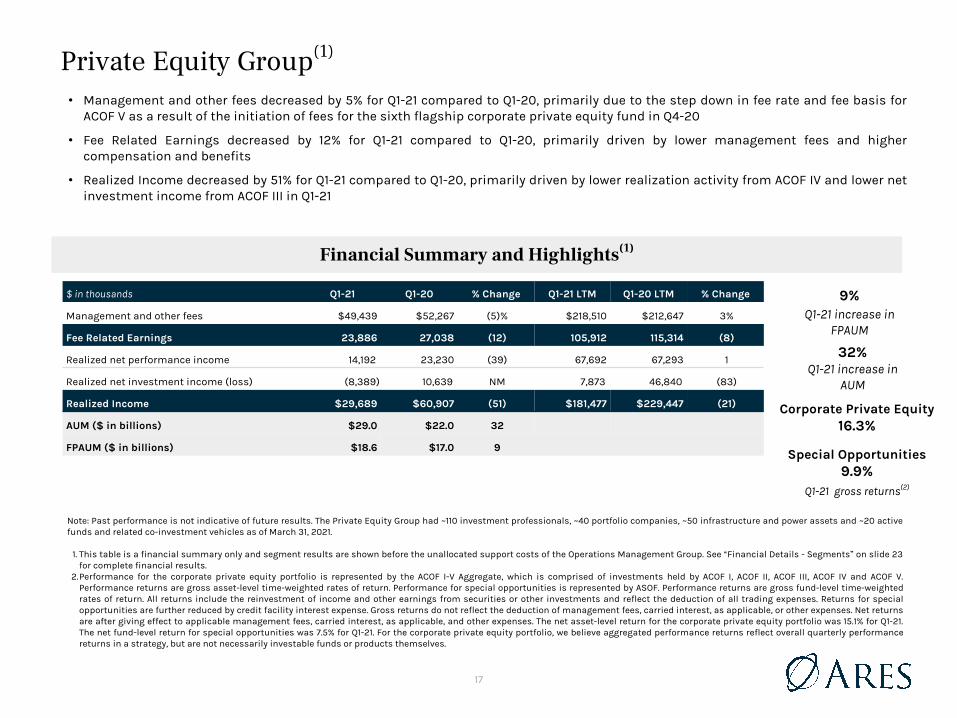
Private Equity Group(1)
Note: Past performance is not indicative of future results. The Private Equity Group had ~110 investment professionals, ~40 portfolio companies, ~50 infrastructure and power assets and ~20 active funds and related co-investment vehicles as of March 31, 2021.
1. This table is a financial summary only and segment results are shown before the unallocated support costs of the Operations Management Group. See “Financial Details - Segments” on slide 23 for complete financial results.
2.Performance for the corporate private equity portfolio is represented by the ACOF I-V Aggregate, which is comprised of investments held by ACOF I, ACOF II, ACOF III, ACOF IV and ACOF V. Performance returns are gross asset-level time-weighted rates of return. Performance for special opportunities is represented by ASOF. Performance returns are gross fund-level time-weighted rates of return. All returns include the reinvestment of income and other earnings from securities or other investments and reflect the deduction of all trading expenses. Returns for special opportunities are further reduced by credit facility interest expense. Gross returns do not reflect the deduction of management fees, carried interest, as applicable, or other expenses. Net returns are after giving effect to applicable management fees, carried interest, as applicable, and other expenses. The net asset-level return for the corporate private equity portfolio was 15.1% for Q1-21. The net fund-level return for special opportunities was 7.5% for Q1-21. For the corporate private equity portfolio, we believe aggregated performance returns reflect overall quarterly performance returns in a strategy, but are not necessarily investable funds or products themselves.
(8)% Q1-21 LTM decrease
in Fee Related Earnings
∙ Management and other fees decreased by 5% for Q1-21 compared to Q1-20, primarily due to the step down in fee rate and fee basis for ACOF V as a result of the initiation of fees for the sixth flagship corporate private equity fund in Q4-20
∙ Fee Related Earnings decreased by 12% for Q1-21 compared to Q1-20, primarily driven by lower management fees and higher compensation and benefits
∙ Realized Income decreased by 51% for Q1-21 compared to Q1-20, primarily driven by lower realization activity from ACOF IV and lower net investment income from ACOF III in Q1-21
$ in thousands Q1-21 Q1-20 % Change Q1-21 LTM Q1-20 LTM % Change
Management and other fees $49,439 $52,267 (5)% $218,510 $212,647 3%
Fee Related Earnings 23,886 27,038 (12) 105,912 115,314 (8)
Realized net performance income 14,192 23,230 (39) 67,692 67,293 1
Realized net investment income (loss) (8,389) 10,639 NM 7,873 46,840 (83)
Realized Income $29,689 $60,907 (51) $181,477 $229,447 (21)
AUM ($ in billions) $29.0 $22.0 32
FPAUM ($ in billions) $18.6 $17.0 9
32%Q1-21 increase in
AUM
Financial Summary and Highlights(1)45%
FY-20 increase in realized net performance income
∙ Realized Income decreased by 51% for Q1-21 compared to Q1-20
9% Q1-21 increase in
FPAUM
18
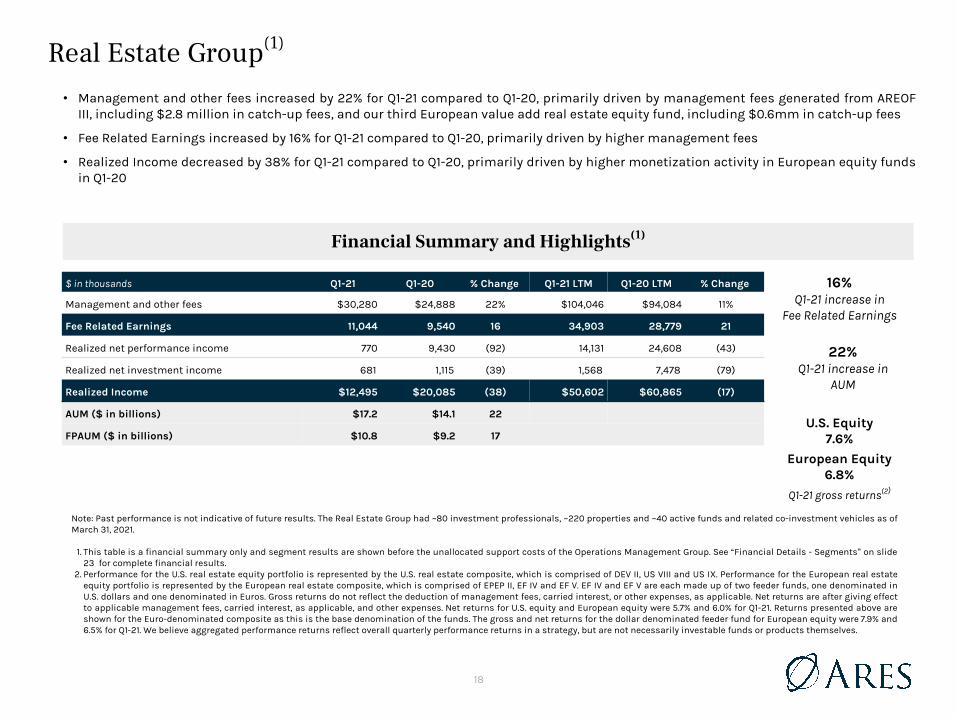
Real Estate Group(1)
Note: Past performance is not indicative of future results. The Real Estate Group had ~80 investment professionals, ~220 properties and ~40 active funds and related co-investment vehicles as of March 31, 2021.
1. This table is a financial summary only and segment results are shown before the unallocated support costs of the Operations Management Group. See “Financial Details - Segments” on slide 23 for complete financial results.
2. Performance for the U.S. real estate equity portfolio is represented by the U.S. real estate composite, which is comprised of DEV II, US VIII and US IX. Performance for the European real estate equity portfolio is represented by the European real estate composite, which is comprised of EPEP II, EF IV and EF V. EF IV and EF V are each made up of two feeder funds, one denominated in U.S. dollars and one denominated in Euros. Gross returns do not reflect the deduction of management fees, carried interest, or other expenses, as applicable. Net returns are after giving effect to applicable management fees, carried interest, as applicable, and other expenses. Net returns for U.S. equity and European equity were 5.7% and 6.0% for Q1-21. Returns presented above are shown for the Euro-denominated composite as this is the base denomination of the funds. The gross and net returns for the dollar denominated feeder fund for European equity were 7.9% and 6.5% for Q1-21. We believe aggregated performance returns reflect overall quarterly performance returns in a strategy, but are not necessarily investable funds or products themselves.
∙ Management and other fees increased by 22% for Q1-21 compared to Q1-20, primarily driven by management fees generated from AREOF III, including $2.8 million in catch-up fees, and our third European value add real estate equity fund, including $0.6mm in catch-up fees
∙ Fee Related Earnings increased by 16% for Q1-21 compared to Q1-20, primarily driven by higher management fees
∙ Realized Income decreased by 38% for Q1-21 compared to Q1-20, primarily driven by higher monetization activity in European equity funds in Q1-20
22% Q1-21 increase in
AUM
16%Q1-21 increase in
Fee Related Earnings
U.S. Equity 7.6%
European Equity 6.8%
Q1-21 gross returns(2)
$ in thousands Q1-21 Q1-20 % Change Q1-21 LTM Q1-20 LTM % Change
Management and other fees $30,280 $24,888 22% $104,046 $94,084 11%
Fee Related Earnings 11,044 9,540 16 34,903 28,779 21
Realized net performance income 770 9,430 (92) 14,131 24,608 (43)
Realized net investment income 681 1,115 (39) 1,568 7,478 (79)
Realized Income $12,495 $20,085 (38) $50,602 $60,865 (17)
AUM ($ in billions) $17.2 $14.1 22
FPAUM ($ in billions) $10.8 $9.2 17
Financial Summary and Highlights(1)∙ Realized Income
decreased by 38% for Q1-21 compared to Q1-20
19
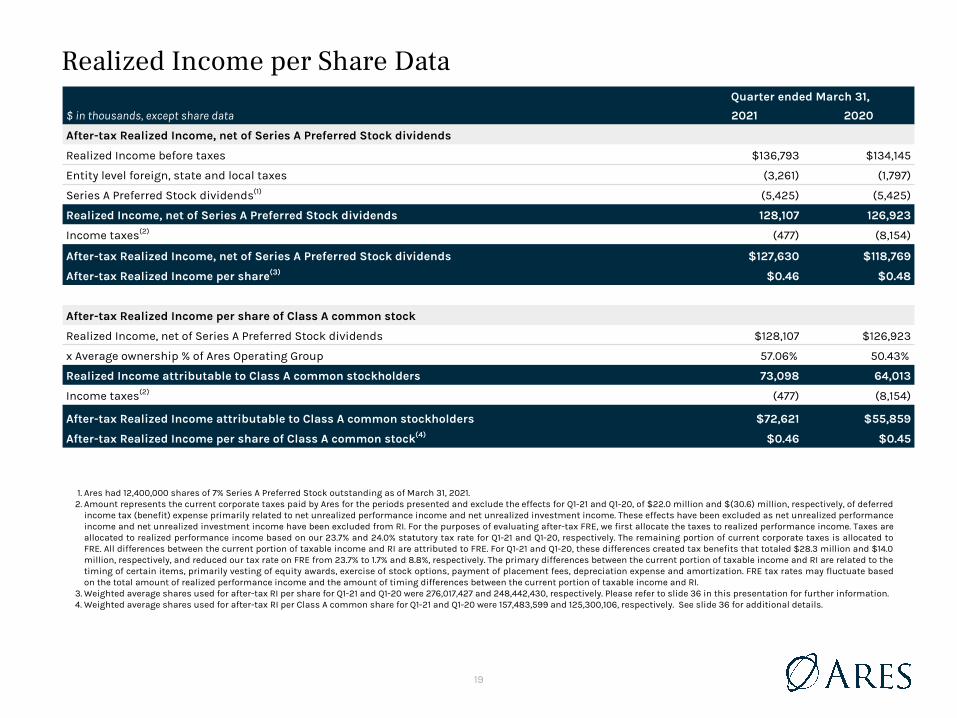
Realized Income per Share Data
1. Ares had 12,400,000 shares of 7% Series A Preferred Stock outstanding as of March 31, 2021.2. Amount represents the current corporate taxes paid by Ares for the periods presented and exclude the effects for Q1-21 and Q1-20, of $22.0 million and $(30.6) million, respectively, of deferred
income tax (benefit) expense primarily related to net unrealized performance income and net unrealized investment income. These effects have been excluded as net unrealized performance income and net unrealized investment income have been excluded from RI. For the purposes of evaluating after-tax FRE, we first allocate the taxes to realized performance income. Taxes are allocated to realized performance income based on our 23.7% and 24.0% statutory tax rate for Q1-21 and Q1-20, respectively. The remaining portion of current corporate taxes is allocated to FRE. All differences between the current portion of taxable income and RI are attributed to FRE. For Q1-21 and Q1-20, these differences created tax benefits that totaled $28.3 million and $14.0 million, respectively, and reduced our tax rate on FRE from 23.7% to 1.7% and 8.8%, respectively. The primary differences between the current portion of taxable income and RI are related to the timing of certain items, primarily vesting of equity awards, exercise of stock options, payment of placement fees, depreciation expense and amortization. FRE tax rates may fluctuate based on the total amount of realized performance income and the amount of timing differences between the current portion of taxable income and RI.
3. Weighted average shares used for after-tax RI per share for Q1-21 and Q1-20 were 276,017,427 and 248,442,430, respectively. Please refer to slide 36 in this presentation for further information.4. Weighted average shares used for after-tax RI per Class A common share for Q1-21 and Q1-20 were 157,483,599 and 125,300,106, respectively. See slide 36 for additional details.
Quarter ended March 31,
$ in thousands, except share data 2021 2020
After-tax Realized Income, net of Series A Preferred Stock dividends
Realized Income before taxes $136,793 $134,145
Entity level foreign, state and local taxes (3,261) (1,797)
Series A Preferred Stock dividends(1) (5,425) (5,425)
Realized Income, net of Series A Preferred Stock dividends 128,107 126,923
Income taxes(2) (477) (8,154)
After-tax Realized Income, net of Series A Preferred Stock dividends $127,630 $118,769
After-tax Realized Income per share(3) $0.46 $0.48
After-tax Realized Income per share of Class A common stock
Realized Income, net of Series A Preferred Stock dividends $128,107 $126,923
x Average ownership % of Ares Operating Group 57.06% 50.43%
Realized Income attributable to Class A common stockholders 73,098 64,013
Income taxes(2) (477) (8,154)
After-tax Realized Income attributable to Class A common stockholders $72,621 $55,859
After-tax Realized Income per share of Class A common stock(4) $0.46 $0.45
20
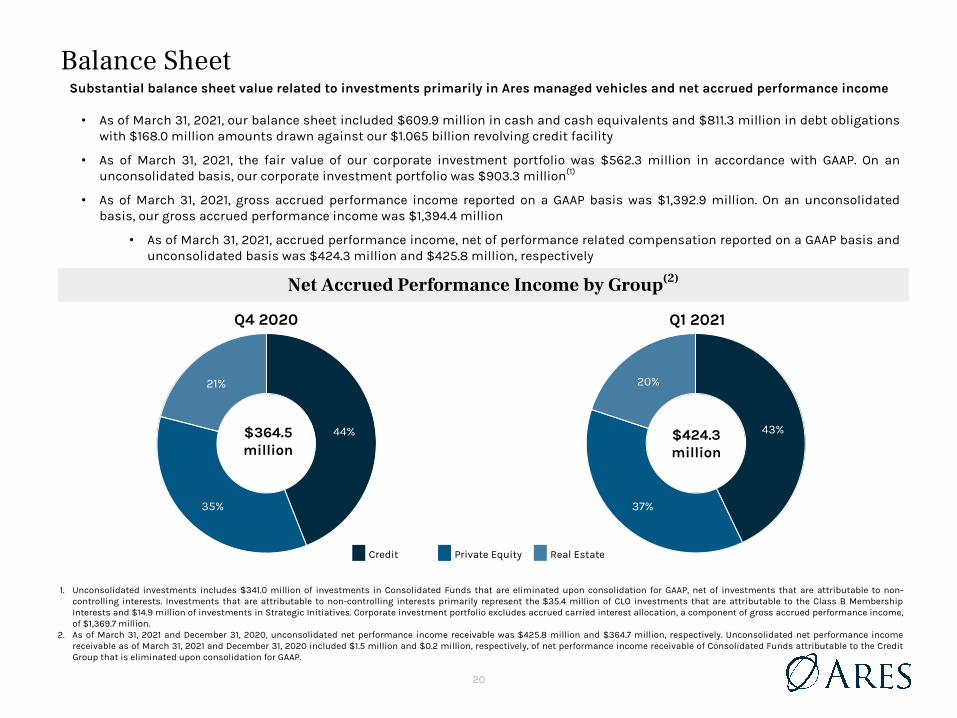
43%
37%
20%
Substantial balance sheet value related to investments primarily in Ares managed vehicles and net accrued performance income
∙ As of March 31, 2021, our balance sheet included $609.9 million in cash and cash equivalents and $811.3 million in debt obligations with $168.0 million amounts drawn against our $1.065 billion revolving credit facility
∙ As of March 31, 2021, the fair value of our corporate investment portfolio was $562.3 million in accordance with GAAP. On an unconsolidated basis, our corporate investment portfolio was $903.3 million(1)
∙ As of March 31, 2021, gross accrued performance income reported on a GAAP basis was $1,392.9 million. On an unconsolidated basis, our gross accrued performance income was $1,394.4 million
∙ As of March 31, 2021, accrued performance income, net of performance related compensation reported on a GAAP basis and unconsolidated basis was $424.3 million and $425.8 million, respectively
Balance Sheet
1. Unconsolidated investments includes $341.0 million of investments in Consolidated Funds that are eliminated upon consolidation for GAAP, net of investments that are attributable to non-controlling interests. Investments that are attributable to non-controlling interests primarily represent the $35.4 million of CLO investments that are attributable to the Class B Membership Interests and $14.9 million of investments in Strategic Initiatives. Corporate investment portfolio excludes accrued carried interest allocation, a component of gross accrued performance income, of $1,369.7 million.
2. As of March 31, 2021 and December 31, 2020, unconsolidated net performance income receivable was $425.8 million and $364.7 million, respectively. Unconsolidated net performance income receivable as of March 31, 2021 and December 31, 2020 included $1.5 million and $0.2 million, respectively, of net performance income receivable of Consolidated Funds attributable to the Credit Group that is eliminated upon consolidation for GAAP.
Q1 2021
44%
35%
21%
Q4 2020
Credit Private Equity Real Estate
$364.5 million
$424.3 million
Net Accrued Performance Income by Group(2)
21
Corporate DataBoard of Directors
Michael AroughetiCo-Founder, Chief Executive Officer and President of AresAntoinette BushExecutive Vice President and Global Head of Government Affairs of News Corp Kipp deVeer Head of Credit GroupPaul G. JoubertFounding Partner of EdgeAdvisors and Investing Partner in Converge Venture PartnersDavid KaplanCo-Founder and Co-Chairman of Private Equity Group
Michael LyntonChairman of Snap Inc.
Dr. Judy D. OlianPresident of Quinnipiac University
Antony P. ResslerCo-Founder and Executive Chairman of Ares
Bennett RosenthalCo-Founder and Co-Chairman of Private Equity Group
Executive Officers
Michael AroughetiCo-Founder, Chief Executive Officer and PresidentRyan BerryChief Marketing and Strategy OfficerKipp deVeerHead of Credit GroupDavid KaplanCo-Founder and Co-Chairman of Private Equity GroupMichael McFerranChief Operating Officer and Chief Financial OfficerAntony P. ResslerCo-Founder and Executive ChairmanBennett RosenthalCo-Founder and Co-Chairman of Private Equity GroupNaseem Sagati AghiliGeneral Counsel and Secretary
Corporate Headquarters
2000 Avenue of the Stars12th FloorLos Angeles, CA 90067Tel: (310) 201-4100Fax: (310) 201-4170
Corporate Counsel
Kirkland & Ellis LLPLos Angeles, CA
Independent Registered Public Accounting Firm
Ernst & Young LLPLos Angeles, CA
Research Coverage
Bank of America Merrill LynchMichael Carrier(646) 855-5004
Bank of MontrealJames Fotheringham(212) 885-4180
BarclaysJeremy Campbell(212) 526-9750
Credit SuisseCraig Siegenthaler(212) 325-3104
Goldman Sachs Alexander Blostein(212) 357-9976
JefferiesGerald O'Hara(415) 229-1510
JP MorganKenneth Worthington(212) 622-6613
Keefe, Bruyette & WoodsRobert Lee (212) 887-7732
Morgan StanleyMichael Cyprys(212) 761-7619
OppenheimerChris Kotowski(212) 667-6699
RBC Capital MarketsKenneth Lee(212) 905-5995
UBS Investment BankAdam Beatty(212) 713-2481
Wells Fargo SecuritiesChristopher Harris(212) 214-5009
Investor Relations Contacts
Carl DrakePartner/Head of Ares Management, LLC Public Investor Relations and Communications Tel: (678) [email protected]
Greg MasonManaging DirectorTel: (314) 282-2533 [email protected]
Cameron RuddVice President Tel: (678) [email protected]
General IR Contact Tel (U.S.): (800) 340-6597Tel (International): (212) [email protected]
Please visit our website at: www.aresmgmt.com
Transfer Agent
American Stock Transfer & Trust Company, LLC6201 15th AvenueBrooklyn, NY 11210Tel: (877) 681-8121Fax: (718) [email protected]
Securities Listing
NYSE: ARES NYSE: ARES.PRA
0 42 65
155 112 42
4 94 109
127 127 127
0 42 65
2 87 133
71 126 163
120 163 198
Credit
PrivateEquity
RealEstate
StrategicInitiative
s
BUSINESSSECTORPALETTE
GENERALPALETTE
Appendix
5
23
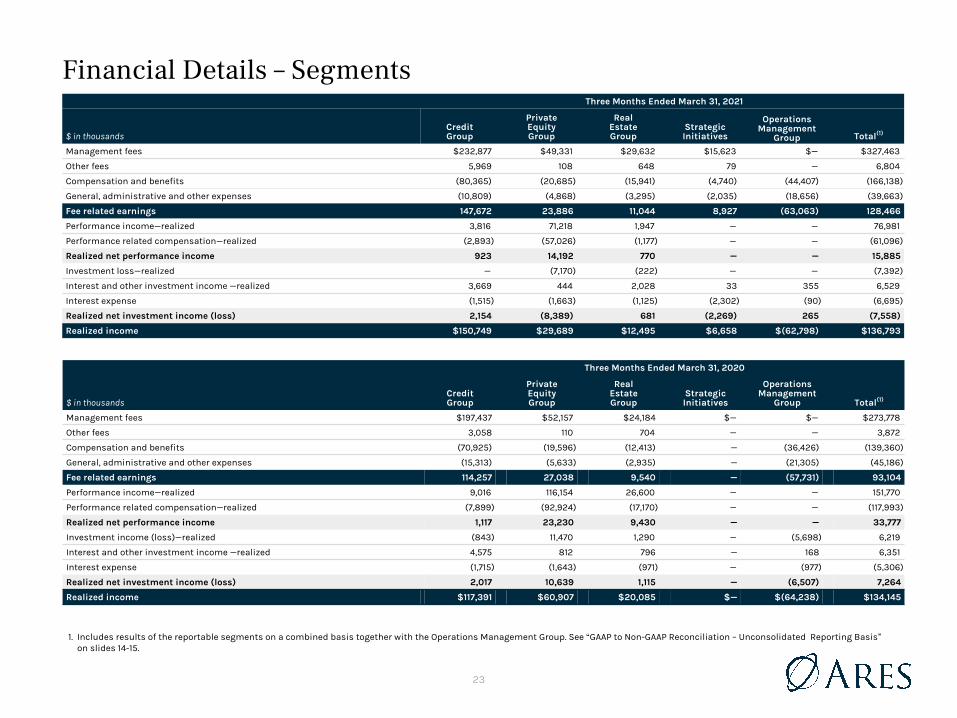
Financial Details – Segments
1. Includes results of the reportable segments on a combined basis together with the Operations Management Group. See “GAAP to Non-GAAP Reconciliation – Unconsolidated Reporting Basis” on slides 14-15.
Three Months Ended March 31, 2021
$ in thousandsCredit Group
Private Equity Group
Real Estate Group
Strategic Initiatives
Operations Management
Group Total(1)
Management fees $232,877 $49,331 $29,632 $15,623 $— $327,463
Other fees 5,969 108 648 79 — 6,804
Compensation and benefits (80,365) (20,685) (15,941) (4,740) (44,407) (166,138)
General, administrative and other expenses (10,809) (4,868) (3,295) (2,035) (18,656) (39,663)
Fee related earnings 147,672 23,886 11,044 8,927 (63,063) 128,466
Performance income—realized 3,816 71,218 1,947 — — 76,981
Performance related compensation—realized (2,893) (57,026) (1,177) — — (61,096)
Realized net performance income 923 14,192 770 — — 15,885
Investment loss—realized — (7,170) (222) — — (7,392)
Interest and other investment income —realized 3,669 444 2,028 33 355 6,529
Interest expense (1,515) (1,663) (1,125) (2,302) (90) (6,695)
Realized net investment income (loss) 2,154 (8,389) 681 (2,269) 265 (7,558)
Realized income $150,749 $29,689 $12,495 $6,658 $(62,798) $136,793
Three Months Ended March 31, 2020
$ in thousandsCredit Group
Private Equity Group
Real Estate Group
Strategic Initiatives
Operations Management
Group Total(1)
Management fees $197,437 $52,157 $24,184 $— $— $273,778
Other fees 3,058 110 704 — — 3,872
Compensation and benefits (70,925) (19,596) (12,413) — (36,426) (139,360)
General, administrative and other expenses (15,313) (5,633) (2,935) — (21,305) (45,186)
Fee related earnings 114,257 27,038 9,540 — (57,731) 93,104
Performance income—realized 9,016 116,154 26,600 — — 151,770
Performance related compensation—realized (7,899) (92,924) (17,170) — — (117,993)
Realized net performance income 1,117 23,230 9,430 — — 33,777
Investment income (loss)—realized (843) 11,470 1,290 — (5,698) 6,219
Interest and other investment income —realized 4,575 812 796 — 168 6,351
Interest expense (1,715) (1,643) (971) — (977) (5,306)
Realized net investment income (loss) 2,017 10,639 1,115 — (6,507) 7,264
Realized income $117,391 $60,907 $20,085 $— $(64,238) $134,145
24
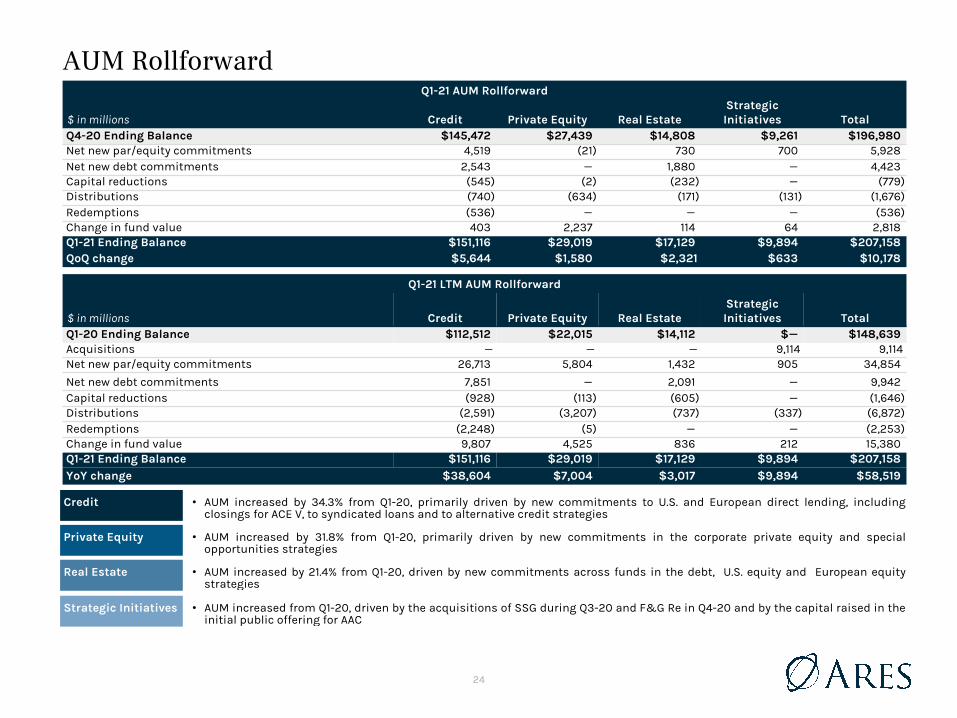
AUM Rollforward
Credit ∙ AUM increased by 34.3% from Q1-20, primarily driven by new commitments to U.S. and European direct lending, including closings for ACE V, to syndicated loans and to alternative credit strategies
Private Equity ∙ AUM increased by 31.8% from Q1-20, primarily driven by new commitments in the corporate private equity and special opportunities strategies
Real Estate ∙ AUM increased by 21.4% from Q1-20, driven by new commitments across funds in the debt, U.S. equity and European equity strategies
Strategic Initiatives ∙ AUM increased from Q1-20, driven by the acquisitions of SSG during Q3-20 and F&G Re in Q4-20 and by the capital raised in the initial public offering for AAC
Q1-21 AUM Rollforward
$ in millions Credit Private Equity Real EstateStrategic Initiatives Total
Q4-20 Ending Balance $145,472 $27,439 $14,808 $9,261 $196,980 Net new par/equity commitments 4,519 (21) 730 700 5,928 Net new debt commitments 2,543 — 1,880 — 4,423 Capital reductions (545) (2) (232) — (779) Distributions (740) (634) (171) (131) (1,676) Redemptions (536) — — — (536) Change in fund value 403 2,237 114 64 2,818 Q1-21 Ending Balance $151,116 $29,019 $17,129 $9,894 $207,158 QoQ change $5,644 $1,580 $2,321 $633 $10,178
Q1-21 LTM AUM Rollforward
$ in millions Credit Private Equity Real EstateStrategic Initiatives Total
Q1-20 Ending Balance $112,512 $22,015 $14,112 $— $148,639 Acquisitions — — — 9,114 9,114Net new par/equity commitments 26,713 5,804 1,432 905 34,854
Net new debt commitments 7,851 — 2,091 — 9,942 Capital reductions (928) (113) (605) — (1,646) Distributions (2,591) (3,207) (737) (337) (6,872) Redemptions (2,248) (5) — — (2,253) Change in fund value 9,807 4,525 836 212 15,380 Q1-21 Ending Balance $151,116 $29,019 $17,129 $9,894 $207,158 YoY change $38,604 $7,004 $3,017 $9,894 $58,519
25
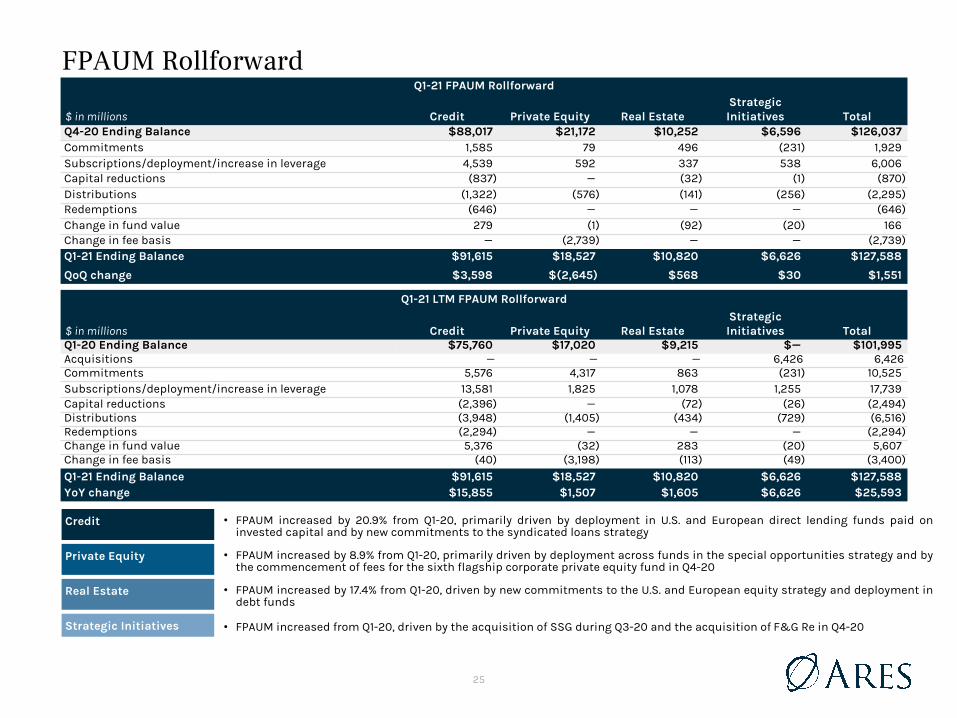
FPAUM Rollforward
Credit ∙ FPAUM increased by 20.9% from Q1-20, primarily driven by deployment in U.S. and European direct lending funds paid on invested capital and by new commitments to the syndicated loans strategy
Private Equity ∙ FPAUM increased by 8.9% from Q1-20, primarily driven by deployment across funds in the special opportunities strategy and by the commencement of fees for the sixth flagship corporate private equity fund in Q4-20
Real Estate ∙ FPAUM increased by 17.4% from Q1-20, driven by new commitments to the U.S. and European equity strategy and deployment in debt funds
Strategic Initiatives ∙ FPAUM increased from Q1-20, driven by the acquisition of SSG during Q3-20 and the acquisition of F&G Re in Q4-20
Q1-21 FPAUM Rollforward
$ in millions Credit Private Equity Real EstateStrategic Initiatives Total
Q4-20 Ending Balance $88,017 $21,172 $10,252 $6,596 $126,037 Commitments 1,585 79 496 (231) 1,929 Subscriptions/deployment/increase in leverage 4,539 592 337 538 6,006 Capital reductions (837) — (32) (1) (870) Distributions (1,322) (576) (141) (256) (2,295) Redemptions (646) — — — (646) Change in fund value 279 (1) (92) (20) 166 Change in fee basis — (2,739) — — (2,739) Q1-21 Ending Balance $91,615 $18,527 $10,820 $6,626 $127,588
QoQ change $3,598 $(2,645) $568 $30 $1,551
Q1-21 LTM FPAUM Rollforward
$ in millions Credit Private Equity Real EstateStrategic Initiatives Total
Q1-20 Ending Balance $75,760 $17,020 $9,215 $— $101,995 Acquisitions — — — 6,426 6,426Commitments 5,576 4,317 863 (231) 10,525 Subscriptions/deployment/increase in leverage 13,581 1,825 1,078 1,255 17,739 Capital reductions (2,396) — (72) (26) (2,494) Distributions (3,948) (1,405) (434) (729) (6,516) Redemptions (2,294) — — — (2,294) Change in fund value 5,376 (32) 283 (20) 5,607 Change in fee basis (40) (3,198) (113) (49) (3,400)
Q1-21 Ending Balance $91,615 $18,527 $10,820 $6,626 $127,588 YoY change $15,855 $1,507 $1,605 $6,626 $25,593
26
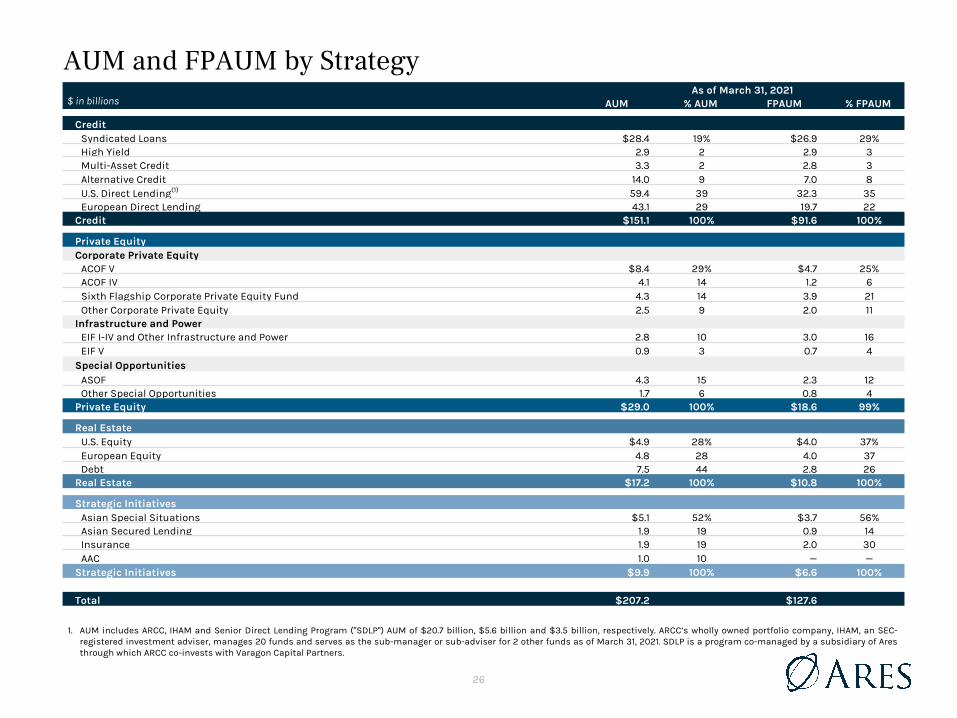
AUM and FPAUM by Strategy
1. AUM includes ARCC, IHAM and Senior Direct Lending Program ("SDLP") AUM of $20.7 billion, $5.6 billion and $3.5 billion, respectively. ARCC’s wholly owned portfolio company, IHAM, an SEC-registered investment adviser, manages 20 funds and serves as the sub-manager or sub-adviser for 2 other funds as of March 31, 2021. SDLP is a program co-managed by a subsidiary of Ares through which ARCC co-invests with Varagon Capital Partners.
As of March 31, 2021$ in billions AUM % AUM FPAUM % FPAUM
CreditSyndicated Loans $28.4 19% $26.9 29%High Yield 2.9 2 2.9 3Multi-Asset Credit 3.3 2 2.8 3Alternative Credit 14.0 9 7.0 8U.S. Direct Lending(1) 59.4 39 32.3 35European Direct Lending 43.1 29 19.7 22
Credit $151.1 100% $91.6 100%
Private EquityCorporate Private Equity
ACOF V $8.4 29% $4.7 25%ACOF IV 4.1 14 1.2 6Sixth Flagship Corporate Private Equity Fund 4.3 14 3.9 21Other Corporate Private Equity 2.5 9 2.0 11
Infrastructure and Power EIF I-IV and Other Infrastructure and Power 2.8 10 3.0 16EIF V 0.9 3 0.7 4
Special OpportunitiesASOF 4.3 15 2.3 12Other Special Opportunities 1.7 6 0.8 4
Private Equity $29.0 100% $18.6 99%
Real EstateU.S. Equity $4.9 28% $4.0 37%European Equity 4.8 28 4.0 37Debt 7.5 44 2.8 26
Real Estate $17.2 100% $10.8 100%
Strategic InitiativesAsian Special Situations $5.1 52% $3.7 56%Asian Secured Lending 1.9 19 0.9 14Insurance 1.9 19 2.0 30AAC 1.0 10 — —
Strategic Initiatives $9.9 100% $6.6 100%
Total $207.2 $127.6
Insurance - FPAUM could be higher. AIS credit funds have fee basis on invested capital, so the reduction in AUM for Aspida in Insurance could be higher than FPAUM reduction
27
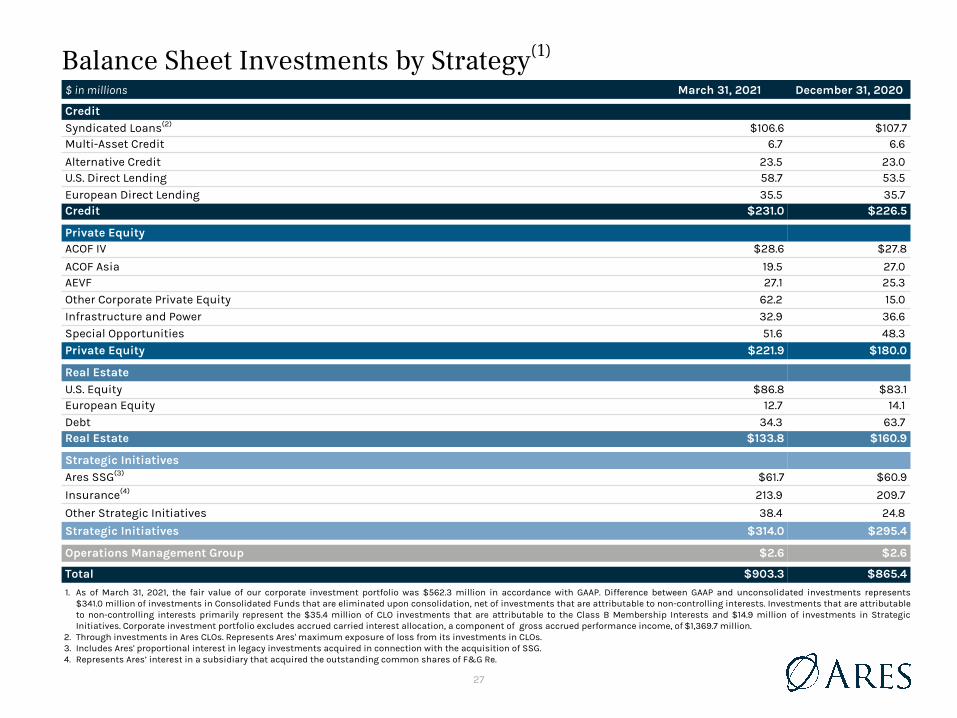
Balance Sheet Investments by Strategy(1)
$ in millions March 31, 2021 December 31, 2020
CreditSyndicated Loans(2) $106.6 $107.7Multi-Asset Credit 6.7 6.6
Alternative Credit 23.5 23.0 U.S. Direct Lending 58.7 53.5
European Direct Lending 35.5 35.7 Credit $231.0 $226.5
Private EquityACOF IV $28.6 $27.8
ACOF Asia 19.5 27.0 AEVF 27.1 25.3
Other Corporate Private Equity 62.2 15.0
Infrastructure and Power 32.9 36.6
Special Opportunities 51.6 48.3
Private Equity $221.9 $180.0
Real EstateU.S. Equity $86.8 $83.1European Equity 12.7 14.1
Debt 34.3 63.7 Real Estate $133.8 $160.9
Strategic InitiativesAres SSG(3) $61.7 $60.9
Insurance(4) 213.9 209.7
Other Strategic Initiatives 38.4 24.8
Strategic Initiatives $314.0 $295.4
Operations Management Group $2.6 $2.6
Total $903.3 $865.4
1. As of March 31, 2021, the fair value of our corporate investment portfolio was $562.3 million in accordance with GAAP. Difference between GAAP and unconsolidated investments represents $341.0 million of investments in Consolidated Funds that are eliminated upon consolidation, net of investments that are attributable to non-controlling interests. Investments that are attributable to non-controlling interests primarily represent the $35.4 million of CLO investments that are attributable to the Class B Membership Interests and $14.9 million of investments in Strategic Initiatives. Corporate investment portfolio excludes accrued carried interest allocation, a component of gross accrued performance income, of $1,369.7 million.
2. Through investments in Ares CLOs. Represents Ares' maximum exposure of loss from its investments in CLOs.3. Includes Ares' proportional interest in legacy investments acquired in connection with the acquisition of SSG. 4. Represents Ares’ interest in a subsidiary that acquired the outstanding common shares of F&G Re.
28
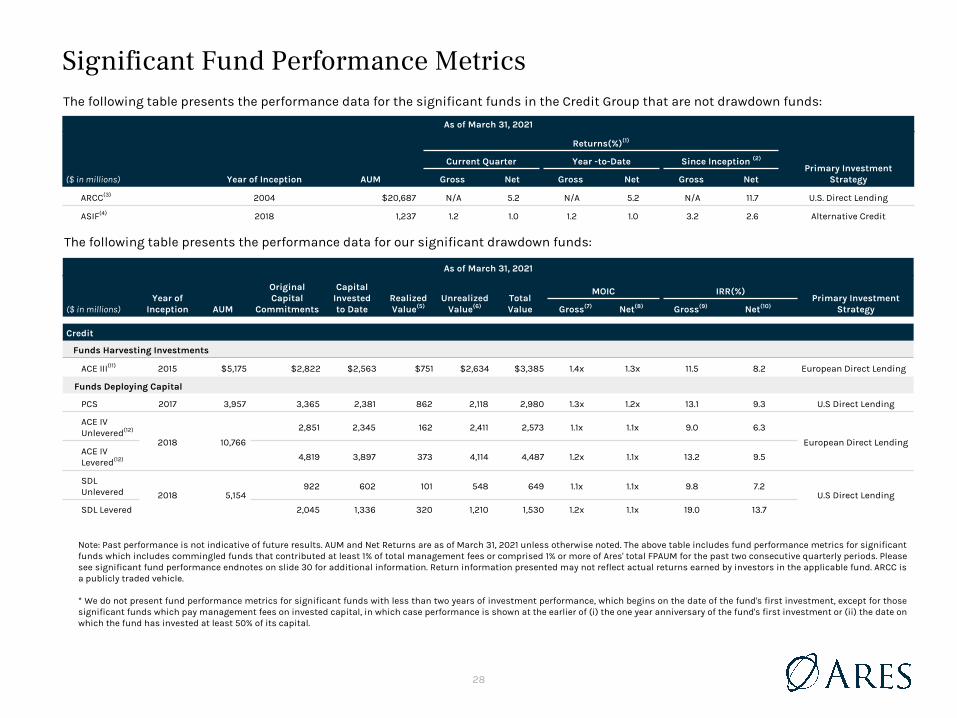
Significant Fund Performance MetricsThe following table presents the performance data for the significant funds in the Credit Group that are not drawdown funds:
Note: Past performance is not indicative of future results. AUM and Net Returns are as of March 31, 2021 unless otherwise noted. The above table includes fund performance metrics for significant funds which includes commingled funds that contributed at least 1% of total management fees or comprised 1% or more of Ares' total FPAUM for the past two consecutive quarterly periods. Please see significant fund performance endnotes on slide 30 for additional information. Return information presented may not reflect actual returns earned by investors in the applicable fund. ARCC is a publicly traded vehicle.
* We do not present fund performance metrics for significant funds with less than two years of investment performance, which begins on the date of the fund's first investment, except for those significant funds which pay management fees on invested capital, in which case performance is shown at the earlier of (i) the one year anniversary of the fund's first investment or (ii) the date on which the fund has invested at least 50% of its capital.
As of March 31, 2021
Returns(%)(1)
Current Quarter Year -to-Date Since Inception (2)
Primary Investment Strategy($ in millions) Year of Inception AUM Gross Net Gross Net Gross Net
ARCC(3) 2004 $20,687 N/A 5.2 N/A 5.2 N/A 11.7 U.S. Direct Lending
ASIF(4) 2018 1,237 1.2 1.0 1.2 1.0 3.2 2.6 Alternative Credit
The following table presents the performance data for our significant drawdown funds:
As of March 31, 2021
Year ofInception
Original Capital
Commitments
Capital Invested to Date
Realized Value(5)
UnrealizedValue(6)
Total Value
MOIC IRR(%)Primary Investment
Strategy($ in millions) AUM Gross(7) Net(8) Gross(9) Net(10)
Credit
Funds Harvesting Investments
ACE III(11) 2015 $5,175 $2,822 $2,563 $751 $2,634 $3,385 1.4x 1.3x 11.5 8.2 European Direct Lending
Funds Deploying Capital
PCS 2017 3,957 3,365 2,381 862 2,118 2,980 1.3x 1.2x 13.1 9.3 U.S Direct Lending
ACE IV Unlevered(12)
2018 10,766
2,851 2,345 162 2,411 2,573 1.1x 1.1x 9.0 6.3
European Direct LendingACE IV Levered(12) 4,819 3,897 373 4,114 4,487 1.2x 1.1x 13.2 9.5
SDL Unlevered 2018 5,154
922 602 101 548 649 1.1x 1.1x 9.8 7.2U.S Direct Lending
SDL Levered 2,045 1,336 320 1,210 1,530 1.2x 1.1x 19.0 13.7
29
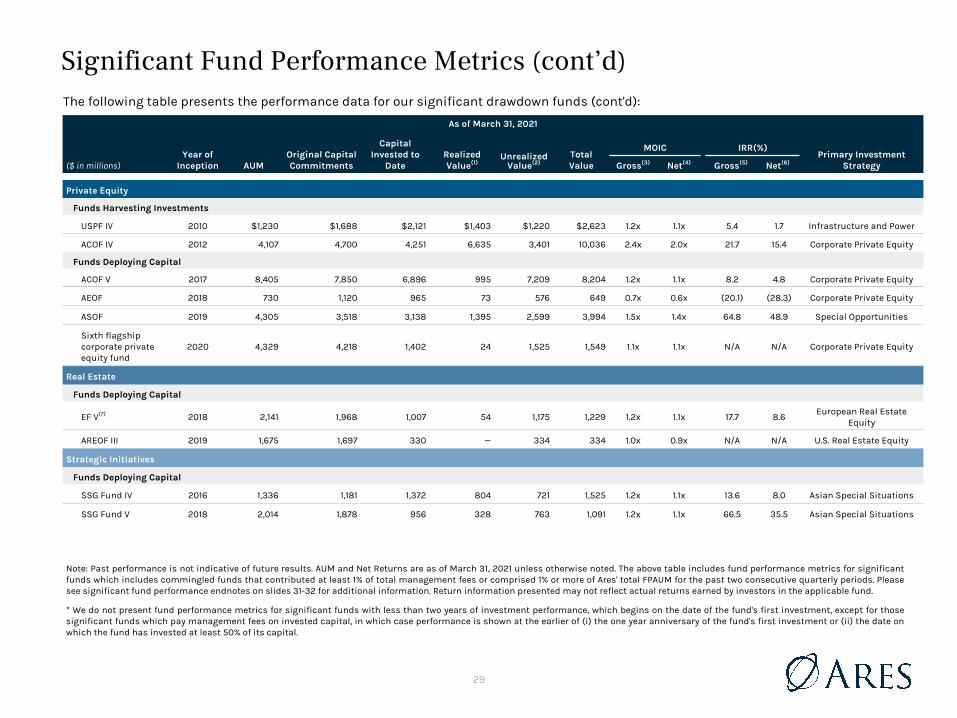
Note: Past performance is not indicative of future results. AUM and Net Returns are as of March 31, 2021 unless otherwise noted. The above table includes fund performance metrics for significant funds which includes commingled funds that contributed at least 1% of total management fees or comprised 1% or more of Ares' total FPAUM for the past two consecutive quarterly periods. Please see significant fund performance endnotes on slides 31-32 for additional information. Return information presented may not reflect actual returns earned by investors in the applicable fund.
* We do not present fund performance metrics for significant funds with less than two years of investment performance, which begins on the date of the fund's first investment, except for those significant funds which pay management fees on invested capital, in which case performance is shown at the earlier of (i) the one year anniversary of the fund's first investment or (ii) the date on which the fund has invested at least 50% of its capital.
Significant Fund Performance Metrics (cont’d)The following table presents the performance data for our significant drawdown funds (cont'd):
As of March 31, 2021
Year ofInception
Original CapitalCommitments
Capital Invested to
DateRealized Value(1)
Unrealized Value(2)
Total Value
MOIC IRR(%)Primary Investment
Strategy($ in millions) AUM Gross(3) Net(4) Gross(5) Net(6)
Private Equity
Funds Harvesting Investments
USPF IV 2010 $1,230 $1,688 $2,121 $1,403 $1,220 $2,623 1.2x 1.1x 5.4 1.7 Infrastructure and Power
ACOF IV 2012 4,107 4,700 4,251 6,635 3,401 10,036 2.4x 2.0x 21.7 15.4 Corporate Private Equity
Funds Deploying Capital
ACOF V 2017 8,405 7,850 6,896 995 7,209 8,204 1.2x 1.1x 8.2 4.8 Corporate Private Equity
AEOF 2018 730 1,120 965 73 576 649 0.7x 0.6x (20.1) (28.3) Corporate Private Equity
ASOF 2019 4,305 3,518 3,138 1,395 2,599 3,994 1.5x 1.4x 64.8 48.9 Special Opportunities
Sixth flagship corporate private equity fund
2020 4,329 4,218 1,402 24 1,525 1,549 1.1x 1.1x N/A N/A Corporate Private Equity
Real Estate
Funds Deploying Capital
EF V(7) 2018 2,141 1,968 1,007 54 1,175 1,229 1.2x 1.1x 17.7 8.6European Real Estate
Equity
AREOF III 2019 1,675 1,697 330 — 334 334 1.0x 0.9x N/A N/A U.S. Real Estate Equity
Strategic Initiatives
Funds Deploying Capital
SSG Fund IV 2016 1,336 1,181 1,372 804 721 1,525 1.2x 1.1x 13.6 8.0 Asian Special Situations
SSG Fund V 2018 2,014 1,878 956 328 763 1,091 1.2x 1.1x 66.5 35.5 Asian Special Situations
30
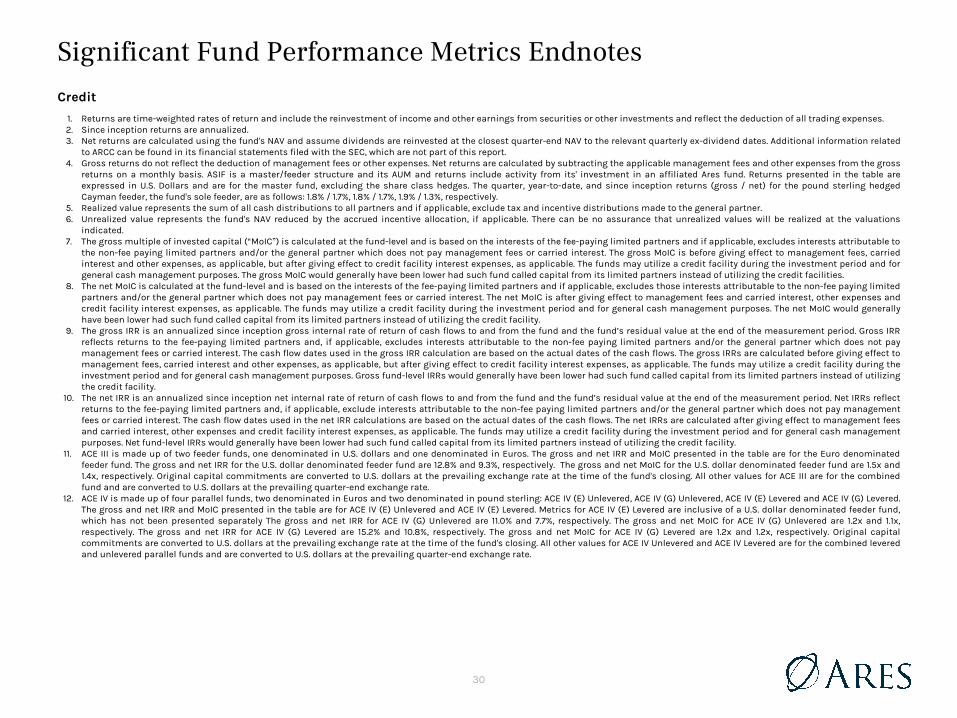
Credit
1. Returns are time-weighted rates of return and include the reinvestment of income and other earnings from securities or other investments and reflect the deduction of all trading expenses.2. Since inception returns are annualized. 3. Net returns are calculated using the fund's NAV and assume dividends are reinvested at the closest quarter-end NAV to the relevant quarterly ex-dividend dates. Additional information related
to ARCC can be found in its financial statements filed with the SEC, which are not part of this report.4. Gross returns do not reflect the deduction of management fees or other expenses. Net returns are calculated by subtracting the applicable management fees and other expenses from the gross
returns on a monthly basis. ASIF is a master/feeder structure and its AUM and returns include activity from its' investment in an affiliated Ares fund. Returns presented in the table are expressed in U.S. Dollars and are for the master fund, excluding the share class hedges. The quarter, year-to-date, and since inception returns (gross / net) for the pound sterling hedged Cayman feeder, the fund's sole feeder, are as follows: 1.8% / 1.7%, 1.8% / 1.7%, 1.9% / 1.3%, respectively.
5. Realized value represents the sum of all cash distributions to all partners and if applicable, exclude tax and incentive distributions made to the general partner. 6. Unrealized value represents the fund's NAV reduced by the accrued incentive allocation, if applicable. There can be no assurance that unrealized values will be realized at the valuations
indicated.7. The gross multiple of invested capital (“MoIC”) is calculated at the fund-level and is based on the interests of the fee-paying limited partners and if applicable, excludes interests attributable to
the non-fee paying limited partners and/or the general partner which does not pay management fees or carried interest. The gross MoIC is before giving effect to management fees, carried interest and other expenses, as applicable, but after giving effect to credit facility interest expenses, as applicable. The funds may utilize a credit facility during the investment period and for general cash management purposes. The gross MoIC would generally have been lower had such fund called capital from its limited partners instead of utilizing the credit facilities.
8. The net MoIC is calculated at the fund-level and is based on the interests of the fee-paying limited partners and if applicable, excludes those interests attributable to the non-fee paying limited partners and/or the general partner which does not pay management fees or carried interest. The net MoIC is after giving effect to management fees and carried interest, other expenses and credit facility interest expenses, as applicable. The funds may utilize a credit facility during the investment period and for general cash management purposes. The net MoIC would generally have been lower had such fund called capital from its limited partners instead of utilizing the credit facility.
9. The gross IRR is an annualized since inception gross internal rate of return of cash flows to and from the fund and the fund’s residual value at the end of the measurement period. Gross IRR reflects returns to the fee-paying limited partners and, if applicable, excludes interests attributable to the non-fee paying limited partners and/or the general partner which does not pay management fees or carried interest. The cash flow dates used in the gross IRR calculation are based on the actual dates of the cash flows. The gross IRRs are calculated before giving effect to management fees, carried interest and other expenses, as applicable, but after giving effect to credit facility interest expenses, as applicable. The funds may utilize a credit facility during the investment period and for general cash management purposes. Gross fund-level IRRs would generally have been lower had such fund called capital from its limited partners instead of utilizing the credit facility.
10. The net IRR is an annualized since inception net internal rate of return of cash flows to and from the fund and the fund’s residual value at the end of the measurement period. Net IRRs reflect returns to the fee-paying limited partners and, if applicable, exclude interests attributable to the non-fee paying limited partners and/or the general partner which does not pay management fees or carried interest. The cash flow dates used in the net IRR calculations are based on the actual dates of the cash flows. The net IRRs are calculated after giving effect to management fees and carried interest, other expenses and credit facility interest expenses, as applicable. The funds may utilize a credit facility during the investment period and for general cash management purposes. Net fund-level IRRs would generally have been lower had such fund called capital from its limited partners instead of utilizing the credit facility.
11. ACE III is made up of two feeder funds, one denominated in U.S. dollars and one denominated in Euros. The gross and net IRR and MoIC presented in the table are for the Euro denominated feeder fund. The gross and net IRR for the U.S. dollar denominated feeder fund are 12.8% and 9.3%, respectively. The gross and net MoIC for the U.S. dollar denominated feeder fund are 1.5x and 1.4x, respectively. Original capital commitments are converted to U.S. dollars at the prevailing exchange rate at the time of the fund's closing. All other values for ACE III are for the combined fund and are converted to U.S. dollars at the prevailing quarter-end exchange rate.
12. ACE IV is made up of four parallel funds, two denominated in Euros and two denominated in pound sterling: ACE IV (E) Unlevered, ACE IV (G) Unlevered, ACE IV (E) Levered and ACE IV (G) Levered. The gross and net IRR and MoIC presented in the table are for ACE IV (E) Unlevered and ACE IV (E) Levered. Metrics for ACE IV (E) Levered are inclusive of a U.S. dollar denominated feeder fund, which has not been presented separately The gross and net IRR for ACE IV (G) Unlevered are 11.0% and 7.7%, respectively. The gross and net MoIC for ACE IV (G) Unlevered are 1.2x and 1.1x, respectively. The gross and net IRR for ACE IV (G) Levered are 15.2% and 10.8%, respectively. The gross and net MoIC for ACE IV (G) Levered are 1.2x and 1.2x, respectively. Original capital commitments are converted to U.S. dollars at the prevailing exchange rate at the time of the fund's closing. All other values for ACE IV Unlevered and ACE IV Levered are for the combined levered and unlevered parallel funds and are converted to U.S. dollars at the prevailing quarter-end exchange rate.
Significant Fund Performance Metrics Endnotes
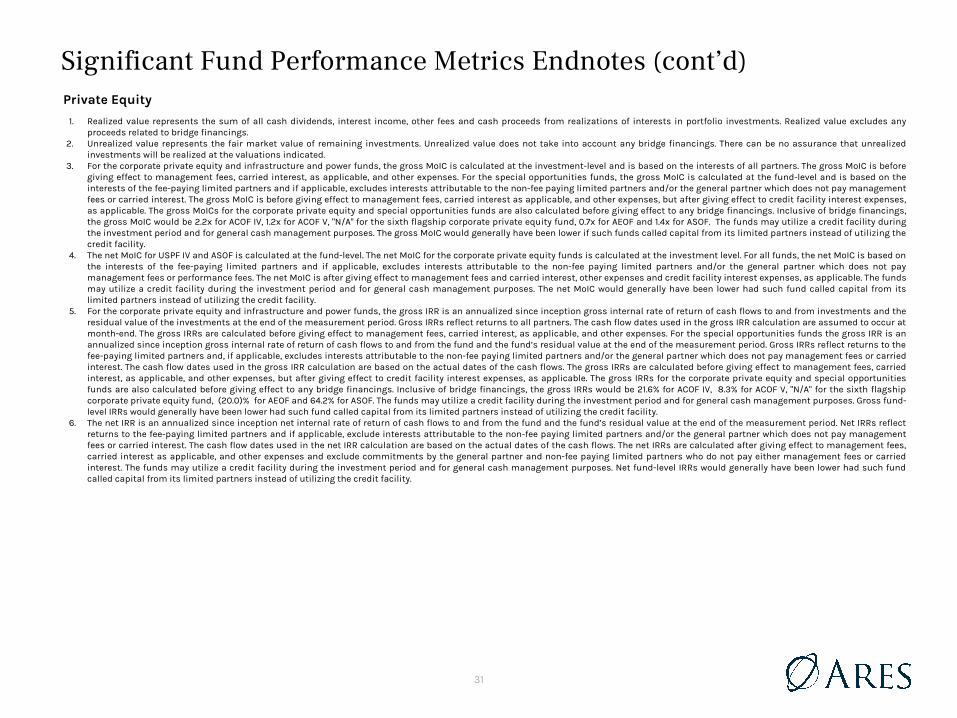
31
Significant Fund Performance Metrics Endnotes (cont’d)Private Equity
1. Realized value represents the sum of all cash dividends, interest income, other fees and cash proceeds from realizations of interests in portfolio investments. Realized value excludes any proceeds related to bridge financings.
2. Unrealized value represents the fair market value of remaining investments. Unrealized value does not take into account any bridge financings. There can be no assurance that unrealized investments will be realized at the valuations indicated.
3. For the corporate private equity and infrastructure and power funds, the gross MoIC is calculated at the investment-level and is based on the interests of all partners. The gross MoIC is before giving effect to management fees, carried interest, as applicable, and other expenses. For the special opportunities funds, the gross MoIC is calculated at the fund-level and is based on the interests of the fee-paying limited partners and if applicable, excludes interests attributable to the non-fee paying limited partners and/or the general partner which does not pay management fees or carried interest. The gross MoIC is before giving effect to management fees, carried interest as applicable, and other expenses, but after giving effect to credit facility interest expenses, as applicable. The gross MoICs for the corporate private equity and special opportunities funds are also calculated before giving effect to any bridge financings. Inclusive of bridge financings, the gross MoIC would be 2.2x for ACOF IV, 1.2x for ACOF V, "N/A" for the sixth flagship corporate private equity fund, 0.7x for AEOF and 1.4x for ASOF. The funds may utilize a credit facility during the investment period and for general cash management purposes. The gross MoIC would generally have been lower if such funds called capital from its limited partners instead of utilizing the credit facility.
4. The net MoIC for USPF IV and ASOF is calculated at the fund-level. The net MoIC for the corporate private equity funds is calculated at the investment level. For all funds, the net MoIC is based on the interests of the fee-paying limited partners and if applicable, excludes interests attributable to the non-fee paying limited partners and/or the general partner which does not pay management fees or performance fees. The net MoIC is after giving effect to management fees and carried interest, other expenses and credit facility interest expenses, as applicable. The funds may utilize a credit facility during the investment period and for general cash management purposes. The net MoIC would generally have been lower had such fund called capital from its limited partners instead of utilizing the credit facility.
5. For the corporate private equity and infrastructure and power funds, the gross IRR is an annualized since inception gross internal rate of return of cash flows to and from investments and the residual value of the investments at the end of the measurement period. Gross IRRs reflect returns to all partners. The cash flow dates used in the gross IRR calculation are assumed to occur at month-end. The gross IRRs are calculated before giving effect to management fees, carried interest, as applicable, and other expenses. For the special opportunities funds the gross IRR is an annualized since inception gross internal rate of return of cash flows to and from the fund and the fund’s residual value at the end of the measurement period. Gross IRRs reflect returns to the fee-paying limited partners and, if applicable, excludes interests attributable to the non-fee paying limited partners and/or the general partner which does not pay management fees or carried interest. The cash flow dates used in the gross IRR calculation are based on the actual dates of the cash flows. The gross IRRs are calculated before giving effect to management fees, carried interest, as applicable, and other expenses, but after giving effect to credit facility interest expenses, as applicable. The gross IRRs for the corporate private equity and special opportunities funds are also calculated before giving effect to any bridge financings. Inclusive of bridge financings, the gross IRRs would be 21.6% for ACOF IV, 8.3% for ACOF V, "N/A" for the sixth flagship corporate private equity fund, (20.0)% for AEOF and 64.2% for ASOF. The funds may utilize a credit facility during the investment period and for general cash management purposes. Gross fund-level IRRs would generally have been lower had such fund called capital from its limited partners instead of utilizing the credit facility.
6. The net IRR is an annualized since inception net internal rate of return of cash flows to and from the fund and the fund’s residual value at the end of the measurement period. Net IRRs reflect returns to the fee-paying limited partners and if applicable, exclude interests attributable to the non-fee paying limited partners and/or the general partner which does not pay management fees or carried interest. The cash flow dates used in the net IRR calculation are based on the actual dates of the cash flows. The net IRRs are calculated after giving effect to management fees, carried interest as applicable, and other expenses and exclude commitments by the general partner and non-fee paying limited partners who do not pay either management fees or carried interest. The funds may utilize a credit facility during the investment period and for general cash management purposes. Net fund-level IRRs would generally have been lower had such fund called capital from its limited partners instead of utilizing the credit facility.
32
Real Estate
1. Realized value includes distributions of operating income, sales and financing proceeds received. 2. Unrealized value represents the fair market value of remaining investments. Unrealized value does not take into account any bridge financings. There can be no assurance that unrealized
investments will be realized at the valuations indicated.3. The gross MoIC is calculated at the investment level and is based on the interests of all partners. The gross MoIC for all funds is before giving effect to management fees, carried interest and
other expenses, as applicable. 4. The net MoIC is calculated at the fund-level and is based on the interests of the fee-paying partners and, if applicable, excludes interests attributable to the non fee-paying partners and/or the
general partner which does not pay management fees, carried interest or has such fees rebated outside of the fund. The net MoIC is after giving effect to management fees, carried interest as applicable and other expenses. Net fund-level MoICs would generally have been lower had such fund called capital from its limited partners instead of utilizing the credit facility.
5. The gross IRR is an annualized since inception gross internal rate of return of cash flows to and from investments and the residual value of the investments at the end of the measurement period. Gross IRRs reflect returns to all partners. Cash flows used in the gross IRR calculation are assumed to occur at quarter-end. The gross IRRs are calculated before giving effect to management fees, carried interest and other expenses, as applicable.
6. The net IRR is an annualized since inception net internal rate of return of cash flows to and from the fund and the fund’s residual value at the end of the measurement period. Net IRRs reflect returns to the fee-paying partners and, if applicable, exclude interests attributable to the non fee-paying partners and/or the general partner which does not pay management fees or carried interest or has such fees rebated outside of the fund. The cash flow dates used in the net IRR calculation are based on the actual dates of the cash flows. The net IRRs are calculated after giving effect to management fees, carried interest as applicable, and other expenses. The funds may utilize a credit facility during the investment period and for general cash management purposes. Net fund-level IRRs would generally have been lower had such fund called capital from its limited partners instead of utilizing the credit facility.
7. EF V is made up of two parallel funds, one denominated in U.S. dollars and one denominated in Euros. The gross and net IRR and MoIC presented in the table are for the Euro denominated parallel fund. The gross and net MoIC and IRR presented in the chart is for the Euro denominated parallel fund. The gross and net MoIC for the U.S. Dollar denominated parallel fund are 1.2x and 1.1x, respectively. The gross and net IRR for the U.S. Dollar denominated parallel fund are 18.8% and 9.6%, respectively. Original capital commitments are converted to U.S. dollars at the prevailing exchange rate at the time of fund's closing. All other values for EF V are for the combined fund and are converted to U.S. dollars at the prevailing quarter-end exchange rate.
Strategic Initiatives 1. Realized value represents the sum of all cash distributions to all partners and if applicable, exclude tax and incentive distributions made to the general partner.2. Unrealized value represents the fund's NAV reduced by the accrued incentive allocation, if applicable. There can be no assurance that unrealized values will be realized at the valuations
indicated.3. The gross MoIC is calculated at the fund-level and is based on the interests of the fee-paying limited partners and if applicable, excludes interests attributable to the non-fee paying limited
partners and/or the general partner which does not pay management fees or carried interest. The gross MoIC is before giving effect to management fees, carried interest as applicable and other expenses, but after giving effect to credit facility interest expenses, as applicable. The funds may utilize a credit facility during the investment period and for general cash management purposes. The gross MoIC would generally have been lower had such fund called capital from its limited partners instead of utilizing the credit facility.
4. The net MoIC is calculated at the fund-level and is based on the interests of the fee-paying limited partners and if applicable, excludes those interests attributable to the non-fee paying limited partners and/or the general partner which does not pay management fees or carried interest. The net MoIC is after giving effect to management fees and other expenses, carried interest and credit facility interest expense, as applicable. The funds may utilize a credit facility during the investment period and for general cash management purposes. The net MoIC would generally have been lower had such fund called capital from its limited partners instead of utilizing the credit facility.
5. The gross IRR is an annualized since inception gross internal rate of return of cash flows to and from the fund and the fund’s residual value at the end of the measurement period. Gross IRR reflects returns to the fee-paying limited partners and, if applicable, excludes interests attributable to the non-fee paying limited partners and/or the general partner which does not pay management fees or carried interest. The cash flow dates used in the gross IRR calculation are based on the actual dates of the cash flows. The gross IRRs are calculated before giving effect to management fees, carried interest, as applicable, and other expenses, but after giving effect to credit facility interest expenses, as applicable. The funds may utilize a credit facility during the investment period and for general cash management purposes. The gross fund-level IRR would generally have been lower had such fund called capital from its limited partners instead of utilizing the credit facility.
6. The net IRR is an annualized since inception net internal rate of return of cash flows to and from the fund and the fund’s residual value at the end of the measurement period. Net IRRs reflect returns to the fee-paying limited partners and, if applicable, exclude interests attributable to the non-fee paying limited partners and/or the general partner who does not pay management fees or carried interest. The cash flow dates used in the net IRR calculations are based on the actual dates of the cash flows. The net IRRs are calculated after giving effect to management fees and other expenses, carried interest and credit facility interest expenses, as applicable. The funds may utilize a credit facility during the investment period and for general cash management purposes. Net fund-level IRRs would generally have been lower had such fund called capital from its limited partners instead of utilizing the credit facility.
Significant Fund Performance Metrics Endnotes (cont’d)
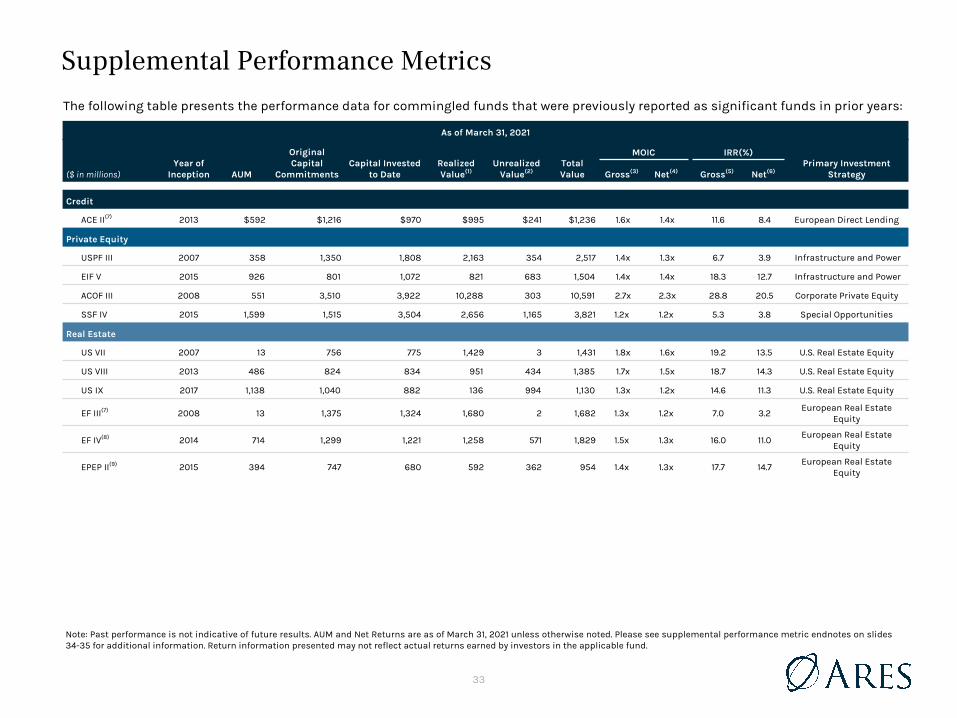
33
Supplemental Performance MetricsThe following table presents the performance data for commingled funds that were previously reported as significant funds in prior years:
As of March 31, 2021
Year ofInception
Original Capital
CommitmentsCapital Invested
to DateRealized Value(1)
UnrealizedValue(2)
Total Value
MOIC IRR(%)Primary Investment
Strategy($ in millions) AUM Gross(3) Net(4) Gross(5) Net(6)
Credit
ACE II(7) 2013 $592 $1,216 $970 $995 $241 $1,236 1.6x 1.4x 11.6 8.4 European Direct Lending
Private Equity
USPF III 2007 358 1,350 1,808 2,163 354 2,517 1.4x 1.3x 6.7 3.9 Infrastructure and Power
EIF V 2015 926 801 1,072 821 683 1,504 1.4x 1.4x 18.3 12.7 Infrastructure and Power
ACOF III 2008 551 3,510 3,922 10,288 303 10,591 2.7x 2.3x 28.8 20.5 Corporate Private Equity
SSF IV 2015 1,599 1,515 3,504 2,656 1,165 3,821 1.2x 1.2x 5.3 3.8 Special Opportunities
Real Estate
US VII 2007 13 756 775 1,429 3 1,431 1.8x 1.6x 19.2 13.5 U.S. Real Estate Equity
US VIII 2013 486 824 834 951 434 1,385 1.7x 1.5x 18.7 14.3 U.S. Real Estate Equity
US IX 2017 1,138 1,040 882 136 994 1,130 1.3x 1.2x 14.6 11.3 U.S. Real Estate Equity
EF III(7) 2008 13 1,375 1,324 1,680 2 1,682 1.3x 1.2x 7.0 3.2European Real Estate
Equity
EF IV(8) 2014 714 1,299 1,221 1,258 571 1,829 1.5x 1.3x 16.0 11.0European Real Estate
Equity
EPEP II(9) 2015 394 747 680 592 362 954 1.4x 1.3x 17.7 14.7European Real Estate
Equity
Note: Past performance is not indicative of future results. AUM and Net Returns are as of March 31, 2021 unless otherwise noted. Please see supplemental performance metric endnotes on slides 34-35 for additional information. Return information presented may not reflect actual returns earned by investors in the applicable fund.
34
Supplemental Performance Metrics EndnotesCredit
1. Realized proceeds represent the sum of all cash distributions to all partners and if applicable, exclude tax and incentive distributions made to the general partner.2. Unrealized value represents the fund's NAV reduced by the accrued incentive allocation, if applicable. There can be no assurance that unrealized values will be realized at the valuations
indicated. 3. The gross multiple of invested capital (“MoIC”) is calculated at the fund-level and is based on the interests of the fee-paying limited partners and if applicable, excludes interests attributable to
the non-fee paying limited partners and/or the general partner which does not pay management fees or carried interest. The gross MoIC is before giving effect to management fees, carried interest as applicable and other expenses. The funds may utilize a credit facility during the investment period and for general cash management purposes. The gross MoIC would generally have been lower had such fund called capital from its limited partners instead of utilizing the credit facility.
4. The net MoIC is calculated at the fund-level and is based on the interests of the fee-paying limited partners and if applicable, excludes those interests attributable to the non-fee paying limited partners and/or the general partner which does not pay management fees or carried interest. The net MoIC is after giving effect to management fees, carried interest, as applicable and other expenses. The funds may utilize a credit facility during the investment period and for general cash management purposes. The net MoIC would generally have been lower had such fund called capital from its limited partners instead of utilizing the credit facility.
5. The gross IRR is an annualized since inception gross internal rate of return of cash flows to and from the fund and the fund’s residual value at the end of the measurement period. Gross IRR reflects returns to the fee-paying limited partners and, if applicable, excludes interests attributable to the non-fee paying limited partners and/or the general partner which does not pay management fees or carried interest. The cash flow dates used in the gross IRR calculation are based on the actual dates of the cash flows. The gross IRRs are calculated before giving effect to management fees, carried interest, as applicable, and other expenses. The funds may utilize a credit facility during the investment period and for general cash management purposes. Gross fund-level IRRs would generally have been lower had such fund called capital from its limited partners instead of utilizing the credit facility
6. The net IRR is an annualized since inception net internal rate of return of cash flows to and from the fund and the fund’s residual value at the end of the measurement period. Net IRRs reflect returns to the fee-paying limited partners and, if applicable, exclude interests attributable to the non-fee paying limited partners and/or the general partner who does not pay management fees or carried interest. The cash flow dates used in the net IRR calculations are based on the actual dates of the cash flows. The net IRRs are calculated after giving effect to management fees, carried interest, as applicable, and other expenses. The funds may utilize a credit facility during the investment period and for general cash management purposes. Net fund-level IRRs would generally have been lower had such fund called capital from its limited partners instead of utilizing the credit facility.
7. ACE II is made up of two feeder funds, one denominated in U.S. dollars and one denominated in Euros. The gross and net IRR and MoIC presented in the chart are for the Euro denominated feeder fund. The gross and net IRR for the U.S. dollar denominated feeder fund are 10.5% and 7.6%, respectively. The gross and net MoIC for the U.S. dollar denominated feeder fund are 1.5x and 1.4x, respectively. Original capital commitments are converted to U.S. dollars at the prevailing exchange rate at the time of the fund's closing. All other values for ACE II are for the combined fund and are converted to U.S. dollars at the prevailing quarter-end exchange rate.
Private Equity
1. Realized proceeds represent the sum of all cash dividends, interest income, other fees and cash proceeds from realizations of interests in portfolio investments. Realized proceeds excludes any proceeds related to bridge financings.
2. Unrealized value represents the fair market value of remaining investments. Unrealized value does not take into account any bridge financings. There can be no assurance that unrealized investments will be realized at the valuations indicated.
3. For the corporate private equity and infrastructure and power funds, the gross MoIC is calculated at the investment-level and is based on the interests of all partners. The gross MoIC is before giving effect to management fees, carried interest, as applicable, and other expenses. The gross MoICs for the corporate private equity funds are also calculated before giving effect to any bridge financings. Inclusive of bridge financings, the gross MoIC would be 2.7x for ACOF III. For the special opportunities funds, the gross MoIC is calculated at the fund-level and is based on the interests of the fee-paying limited partners and if applicable, excludes interests attributable to the non-fee paying limited partners and/or the general partner which does not pay management fees or carried interest. The gross MoIC is before giving effect to management fees, carried interest as applicable, and other expenses, but after giving effect to credit facility interest expenses, as applicable. The funds may utilize a credit facility during the investment period and for general cash management purposes.
4. The net MoIC for USPF III, EIF V and SSF IV is calculated at the fund-level. The net MoIC for ACOF III is calculated at the investment level. For all funds, the net MoIC is based on the interests of the fee-paying limited partners and if applicable, excludes interests attributable to the non-fee paying limited partners and/or the general partner who does not pay management fees or performance fees. The net MoIC is after giving effect to management fees, carried interest, as applicable, and other expenses. The funds may utilize a credit facility during the investment period and for general cash management purposes.
35
Supplemental Performance Metrics Endnotes (cont’d)Private Equity (cont’d)
5. For the corporate private equity and infrastructure and power funds, the gross IRR is an annualized since inception gross internal rate of return of cash flows to and from investments and the residual value of the investments at the end of the measurement period. Gross IRRs reflect returns to all partners. The cash flow dates used in the gross IRR calculation are assumed to occur at month-end. The gross IRRs are calculated before giving effect to management fees, carried interest, as applicable, and other expenses. The gross IRRs for the corporate private equity funds are also calculated before giving effect to any bridge financings. Inclusive of bridge financings, the gross IRR would be 28.8% for ACOF III. For the special opportunities funds the gross IRR is an annualized since inception gross internal rate of return of cash flows to and from the fund and the fund’s residual value at the end of the measurement period. Gross IRRs reflect returns to the fee-paying limited partners and, if applicable, excludes interests attributable to the non-fee paying limited partners and/or the general partner which does not pay management fees or carried interest. The cash flow dates used in the gross IRR calculation are based on the actual dates of the cash flows. The gross IRRs are calculated before giving effect to management fees, carried interest, as applicable, and other expenses, but after giving effect to credit facility interest expenses, as applicable. The funds may utilize a credit facility during the investment period and for general cash management purposes. Gross fund-level IRRs would generally have been lower had such fund called capital from its limited partners instead of utilizing the credit facility.
6. The net IRR is an annualized since inception net internal rate of return of cash flows to and from the fund and the fund’s residual value at the end of the measurement period. Net IRRs reflect returns to the fee-paying limited partners and if applicable, exclude interests attributable to the non-fee paying limited partners and/or the general partner who does not pay management fees or carried interest. The cash flow dates used in the net IRR calculation are based on the actual dates of the cash flows. The net IRRs are calculated after giving effect to management fees, carried interest as applicable, and other expenses and exclude commitments by the general partner and Schedule I investors who do not pay either management fees or carried interest. The funds may utilize a credit facility during the investment period and for general cash management purposes. Net fund-level IRRs would generally have been lower had such fund called capital from its limited partners instead of utilizing the credit facility.
Real Estate
1. Realized proceeds include distributions of operating income, sales and financing proceeds received.2. Unrealized value represents the fair value of remaining investments. There can be no assurance that unrealized investments will be realized at the valuations indicated.3. The gross MoIC is calculated at the investment level and is based on the interests of all partners. The gross MoIC for all funds is before giving effect to management fees, carried interest as applicable
and other expenses. 4. The net MoIC is calculated at the fund-level and is based on the interests of the fee-paying partners and, if applicable, excludes interests attributable to the non fee-paying partners and/or the general
partner who does not pay management fees or carried interest or has such fees rebated outside of the fund. The net MoIC is after giving effect to management fees, carried interest as applicable and other expenses. Net fund-level MoICs would generally have been lower had such fund called capital from its limited partners instead of utilizing the credit facility.
5. The gross IRR is an annualized since inception gross internal rate of return of cash flows to and from investments and the residual value of the investments at the end of the measurement period. Gross IRRs reflect returns to all partners. Cash flows used in the gross IRR calculation are assumed to occur at quarter-end. The gross IRRs are calculated before giving effect to management fees, carried interest as applicable, and other expenses.
6. The net IRR is an annualized since inception net internal rate of return of cash flows to and from the fund and the fund’s residual value at the end of the measurement period. Net IRRs reflect returns to the fee-paying partners and, if applicable, excludes interests attributable to the non fee-paying partners and/or the general partner who does not pay management fees or carried interest or has such fees rebated outside of the fund. The cash flow dates used in the net IRR calculation are based on the actual dates of the cash flows. The net IRRs are calculated after giving effect to management fees, carried interest as applicable, and other expenses. The funds may utilize a credit facility during the investment period and for general cash management purposes. Net fund-level IRRs would generally have been lower had such fund called capital from its limited partners instead of utilizing the credit facility.
7. EF III is made up of two parallel funds, one denominated in U.S. Dollars and one denominated in Euros. The gross and net MoIC presented in the chart is for the Euro denominated parallel fund. The gross and net MoIC for the U.S. Dollar denominated parallel fund are 1.3x and 1.1x, respectively. The gross and net IRR for the U.S. Dollar denominated parallel fund are 6.6% and 2.6%, respectively. Original capital commitments are converted to U.S. Dollars at the prevailing exchange rate at the time of fund's closing. The Realised Proceeds from the Euro denominated parallel fund are converted at the prevailing exchange rate at the time of fund's closing. All other values for our third flagship European real estate fund are for the combined fund and are converted to U.S. Dollars at the prevailing quarter-end exchange rate.
8. EF IV is made up of two parallel funds, one denominated in U.S. Dollars and one denominated in Euros. The gross and net MoIC presented in the chart is for the Euro denominated parallel fund. The gross and net MoIC for the U.S. Dollar denominated parallel fund are 1.5x and 1.3x, respectively. The gross and net IRR for the U.S. Dollar denominated parallel fund are 15.8% and 11.4%, respectively. Original capital commitments are converted to U.S. Dollars at the prevailing exchange rate at the time of fund's closing. All other values for our fourth flagship European real estate fund are for the combined fund and are converted to U.S. Dollars at the prevailing quarter-end exchange rate.
9. EPEP II is made up of dual currency investors and Euro currency investors. The gross and net MoIC and gross and net IRR presented in the chart are for dual currency investors as dual currency investors represent the largest group of investors in the fund. Multiples exclude foreign currency gains and losses since dual currency investors fund capital contributions and receive distributions in local deal currency (GBP or EUR) and therefore, do not realize foreign currency gains or losses. The gross and net IRRs for the euro currency investors, which include foreign currency gains and losses, are 17.9% and 14.8%, respectively. The gross and net MoIC for the euro currency investors are 1.4x and 1.3x, respectively. Original capital commitments are converted to U.S. Dollars at the prevailing exchange rate at the time of fund's closing. All other values for EPEP II are for the combined fund and are converted to U.S. Dollars at the prevailing quarter-end exchange rate.
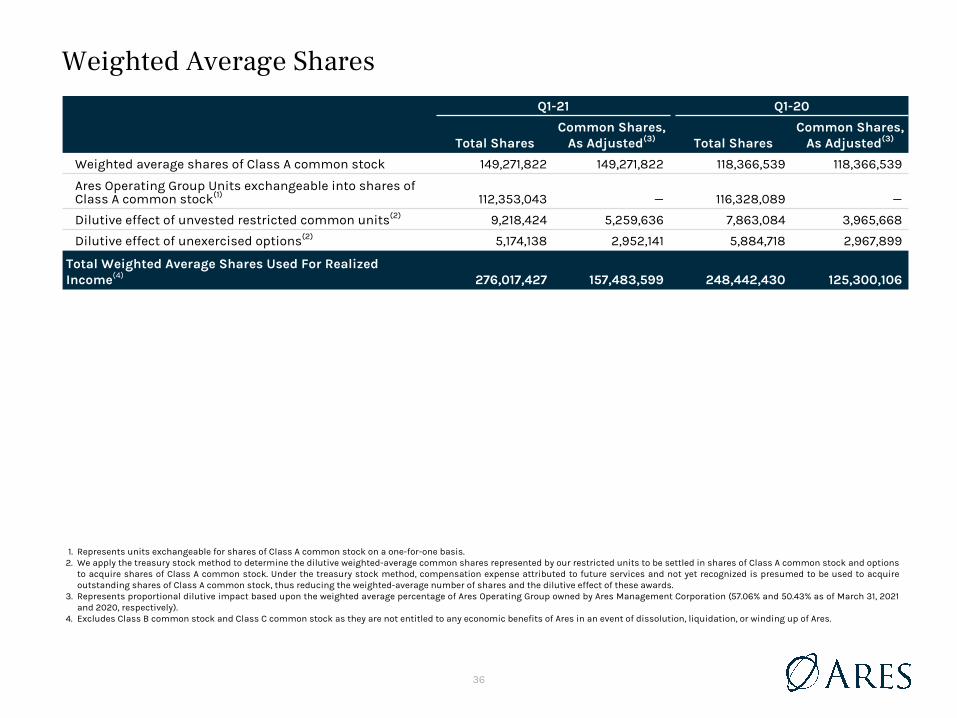
36
Weighted Average Shares
1. Represents units exchangeable for shares of Class A common stock on a one-for-one basis.2. We apply the treasury stock method to determine the dilutive weighted-average common shares represented by our restricted units to be settled in shares of Class A common stock and options
to acquire shares of Class A common stock. Under the treasury stock method, compensation expense attributed to future services and not yet recognized is presumed to be used to acquire outstanding shares of Class A common stock, thus reducing the weighted-average number of shares and the dilutive effect of these awards.
3. Represents proportional dilutive impact based upon the weighted average percentage of Ares Operating Group owned by Ares Management Corporation (57.06% and 50.43% as of March 31, 2021 and 2020, respectively).
4. Excludes Class B common stock and Class C common stock as they are not entitled to any economic benefits of Ares in an event of dissolution, liquidation, or winding up of Ares.
Q1-21 Q1-20
Total SharesCommon Shares,
As Adjusted(3) Total SharesCommon Shares,
As Adjusted(3)
Weighted average shares of Class A common stock 149,271,822 149,271,822 118,366,539 118,366,539
Ares Operating Group Units exchangeable into shares of Class A common stock(1) 112,353,043 — 116,328,089 —
Dilutive effect of unvested restricted common units(2) 9,218,424 5,259,636 7,863,084 3,965,668
Dilutive effect of unexercised options(2) 5,174,138 2,952,141 5,884,718 2,967,899
Total Weighted Average Shares Used For Realized Income(4) 276,017,427 157,483,599 248,442,430 125,300,106
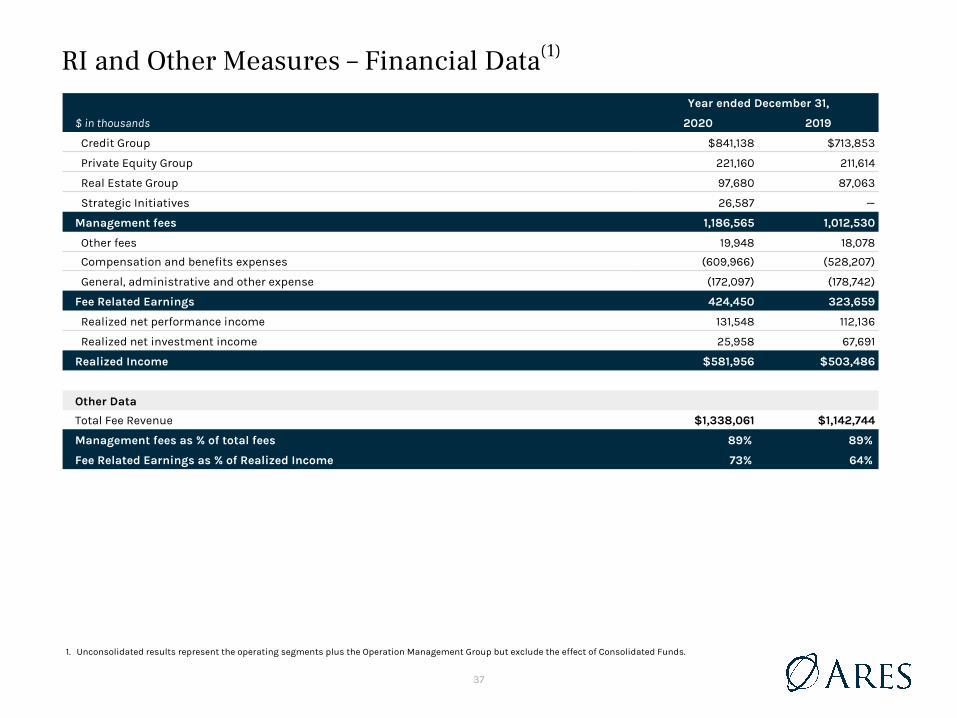
37
RI and Other Measures – Financial Data(1)
Year ended December 31,
$ in thousands 2020 2019
Credit Group $841,138 $713,853
Private Equity Group 221,160 211,614
Real Estate Group 97,680 87,063
Strategic Initiatives 26,587 —
Management fees 1,186,565 1,012,530
Other fees 19,948 18,078
Compensation and benefits expenses (609,966) (528,207)
General, administrative and other expense (172,097) (178,742)
Fee Related Earnings 424,450 323,659
Realized net performance income 131,548 112,136
Realized net investment income 25,958 67,691
Realized Income $581,956 $503,486
Other Data
Total Fee Revenue $1,338,061 $1,142,744
Management fees as % of total fees 89% 89%
Fee Related Earnings as % of Realized Income 73% 64%
1. Unconsolidated results represent the operating segments plus the Operation Management Group but exclude the effect of Consolidated Funds.
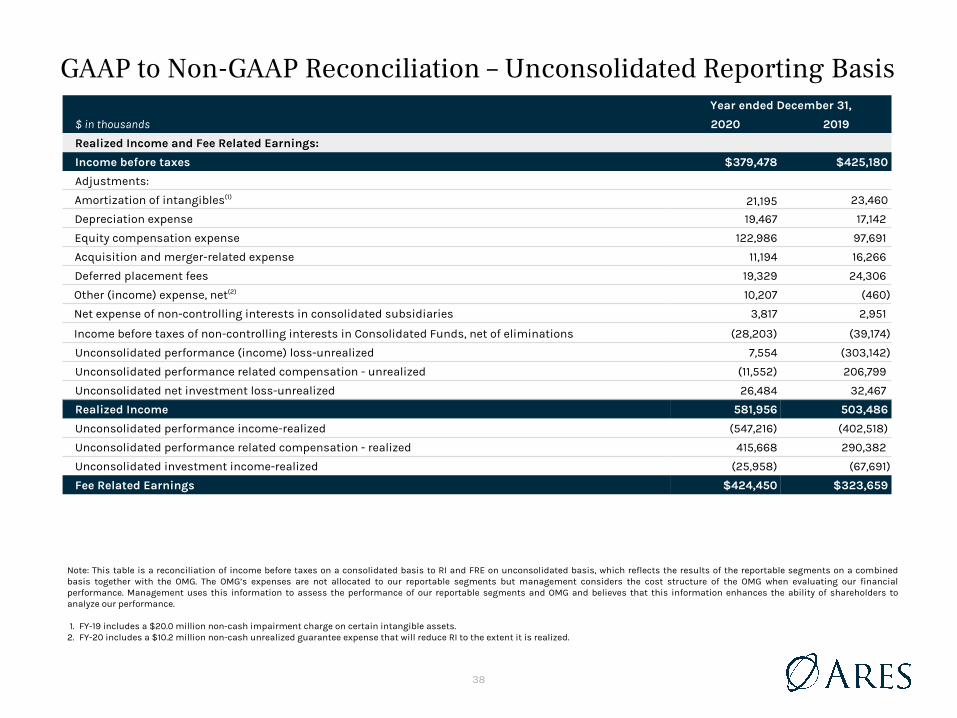
38
GAAP to Non-GAAP Reconciliation – Unconsolidated Reporting BasisYear ended December 31,
$ in thousands 2020 2019
Realized Income and Fee Related Earnings:
Income before taxes $379,478 $425,180
Adjustments:
Amortization of intangibles(1) 21,195 23,460
Depreciation expense 19,467 17,142
Equity compensation expense 122,986 97,691
Acquisition and merger-related expense 11,194 16,266
Deferred placement fees 19,329 24,306
Other (income) expense, net(2) 10,207 (460)
Net expense of non-controlling interests in consolidated subsidiaries 3,817 2,951
Income before taxes of non-controlling interests in Consolidated Funds, net of eliminations (28,203) (39,174)
Unconsolidated performance (income) loss-unrealized 7,554 (303,142)
Unconsolidated performance related compensation - unrealized (11,552) 206,799
Unconsolidated net investment loss-unrealized 26,484 32,467
Realized Income 581,956 503,486
Unconsolidated performance income-realized (547,216) (402,518)
Unconsolidated performance related compensation - realized 415,668 290,382
Unconsolidated investment income-realized (25,958) (67,691)
Fee Related Earnings $424,450 $323,659
Note: This table is a reconciliation of income before taxes on a consolidated basis to RI and FRE on unconsolidated basis, which reflects the results of the reportable segments on a combined basis together with the OMG. The OMG’s expenses are not allocated to our reportable segments but management considers the cost structure of the OMG when evaluating our financial performance. Management uses this information to assess the performance of our reportable segments and OMG and believes that this information enhances the ability of shareholders to analyze our performance.
1. FY-19 includes a $20.0 million non-cash impairment charge on certain intangible assets.2. FY-20 includes a $10.2 million non-cash unrealized guarantee expense that will reduce RI to the extent it is realized.
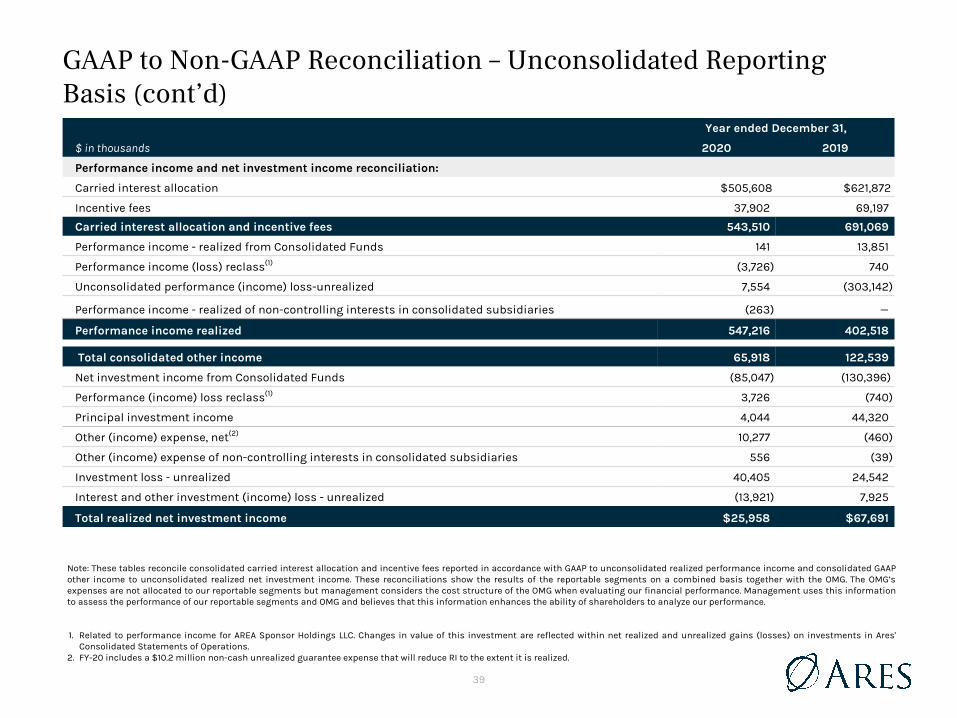
39
GAAP to Non-GAAP Reconciliation – Unconsolidated Reporting Basis (cont’d)
Note: These tables reconcile consolidated carried interest allocation and incentive fees reported in accordance with GAAP to unconsolidated realized performance income and consolidated GAAP other income to unconsolidated realized net investment income. These reconciliations show the results of the reportable segments on a combined basis together with the OMG. The OMG’s expenses are not allocated to our reportable segments but management considers the cost structure of the OMG when evaluating our financial performance. Management uses this information to assess the performance of our reportable segments and OMG and believes that this information enhances the ability of shareholders to analyze our performance.
1. Related to performance income for AREA Sponsor Holdings LLC. Changes in value of this investment are reflected within net realized and unrealized gains (losses) on investments in Ares' Consolidated Statements of Operations.
2. FY-20 includes a $10.2 million non-cash unrealized guarantee expense that will reduce RI to the extent it is realized.
Year ended December 31,
$ in thousands 2020 2019
Performance income and net investment income reconciliation:
Carried interest allocation $505,608 $621,872
Incentive fees 37,902 69,197
Carried interest allocation and incentive fees 543,510 691,069
Performance income - realized from Consolidated Funds 141 13,851
Performance income (loss) reclass(1) (3,726) 740
Unconsolidated performance (income) loss-unrealized 7,554 (303,142)
Performance income - realized of non-controlling interests in consolidated subsidiaries (263) —
Performance income realized 547,216 402,518
Total consolidated other income 65,918 122,539
Net investment income from Consolidated Funds (85,047) (130,396)
Performance (income) loss reclass(1) 3,726 (740)
Principal investment income 4,044 44,320
Other (income) expense, net(2) 10,277 (460)
Other (income) expense of non-controlling interests in consolidated subsidiaries 556 (39)
Investment loss - unrealized 40,405 24,542
Interest and other investment (income) loss - unrealized (13,921) 7,925
Total realized net investment income $25,958 $67,691
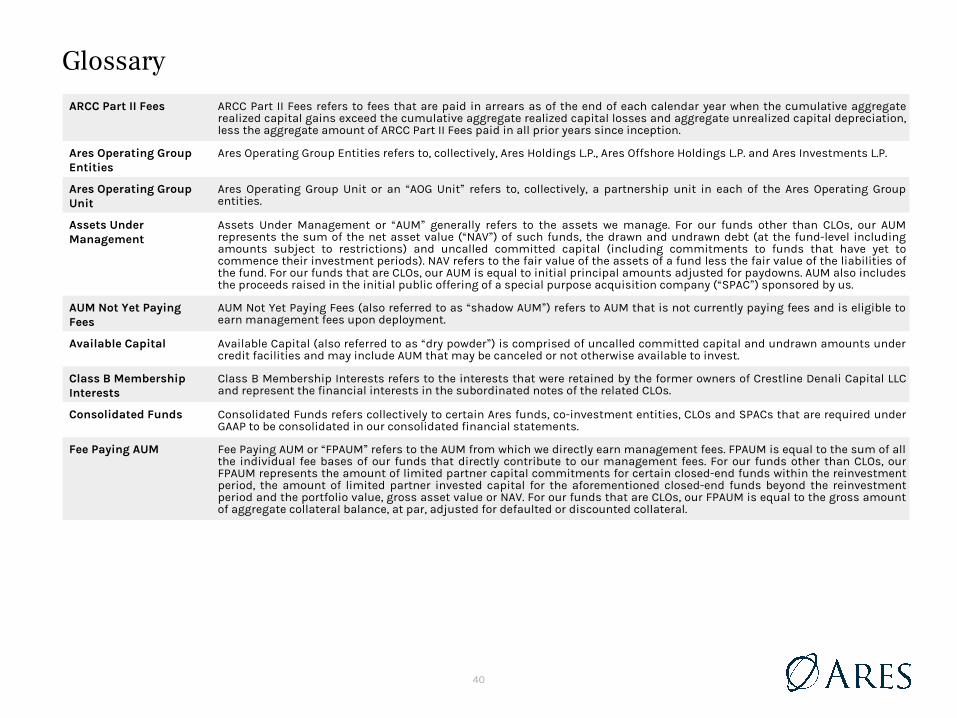
40
GlossaryARCC Part II Fees ARCC Part II Fees refers to fees that are paid in arrears as of the end of each calendar year when the cumulative aggregate
realized capital gains exceed the cumulative aggregate realized capital losses and aggregate unrealized capital depreciation, less the aggregate amount of ARCC Part II Fees paid in all prior years since inception.
Ares Operating Group Entities
Ares Operating Group Entities refers to, collectively, Ares Holdings L.P., Ares Offshore Holdings L.P. and Ares Investments L.P.
Ares Operating Group Unit
Ares Operating Group Unit or an “AOG Unit” refers to, collectively, a partnership unit in each of the Ares Operating Group entities.
Assets Under Management
Assets Under Management or “AUM” generally refers to the assets we manage. For our funds other than CLOs, our AUM represents the sum of the net asset value (“NAV”) of such funds, the drawn and undrawn debt (at the fund-level including amounts subject to restrictions) and uncalled committed capital (including commitments to funds that have yet to commence their investment periods). NAV refers to the fair value of the assets of a fund less the fair value of the liabilities of the fund. For our funds that are CLOs, our AUM is equal to initial principal amounts adjusted for paydowns. AUM also includes the proceeds raised in the initial public offering of a special purpose acquisition company (“SPAC”) sponsored by us.
AUM Not Yet Paying Fees
AUM Not Yet Paying Fees (also referred to as “shadow AUM”) refers to AUM that is not currently paying fees and is eligible to earn management fees upon deployment.
Available Capital Available Capital (also referred to as “dry powder”) is comprised of uncalled committed capital and undrawn amounts under credit facilities and may include AUM that may be canceled or not otherwise available to invest.
Class B Membership Interests
Class B Membership Interests refers to the interests that were retained by the former owners of Crestline Denali Capital LLC and represent the financial interests in the subordinated notes of the related CLOs.
Consolidated Funds Consolidated Funds refers collectively to certain Ares funds, co-investment entities, CLOs and SPACs that are required under GAAP to be consolidated in our consolidated financial statements.
Fee Paying AUM Fee Paying AUM or “FPAUM” refers to the AUM from which we directly earn management fees. FPAUM is equal to the sum of all the individual fee bases of our funds that directly contribute to our management fees. For our funds other than CLOs, our FPAUM represents the amount of limited partner capital commitments for certain closed-end funds within the reinvestment period, the amount of limited partner invested capital for the aforementioned closed-end funds beyond the reinvestment period and the portfolio value, gross asset value or NAV. For our funds that are CLOs, our FPAUM is equal to the gross amount of aggregate collateral balance, at par, adjusted for defaulted or discounted collateral.
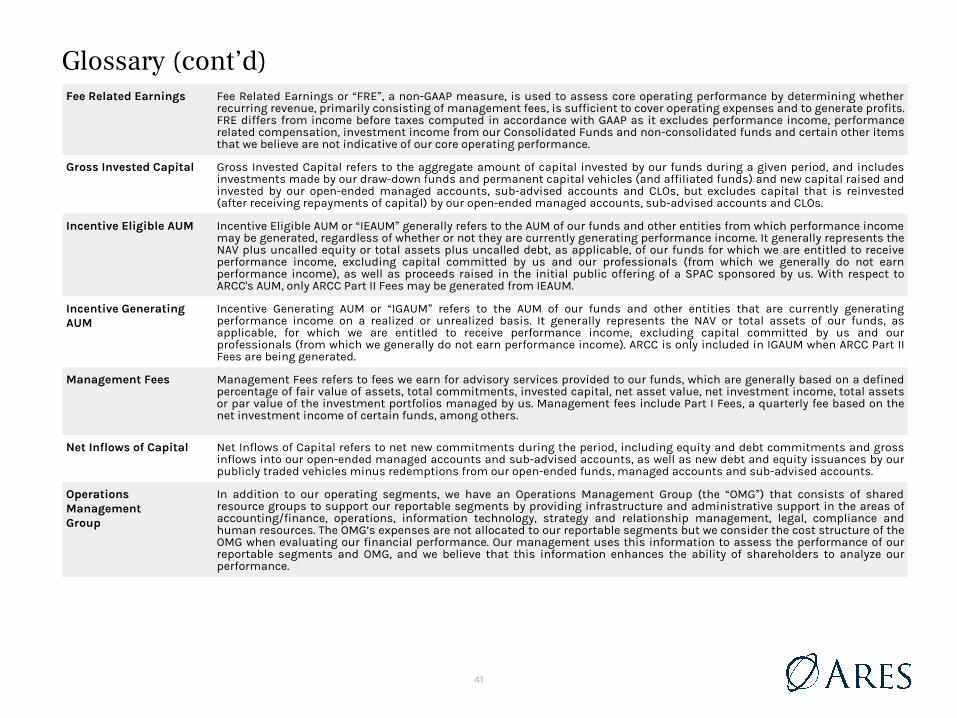
41
Glossary (cont’d)Fee Related Earnings Fee Related Earnings or “FRE”, a non-GAAP measure, is used to assess core operating performance by determining whether
recurring revenue, primarily consisting of management fees, is sufficient to cover operating expenses and to generate profits. FRE differs from income before taxes computed in accordance with GAAP as it excludes performance income, performance related compensation, investment income from our Consolidated Funds and non-consolidated funds and certain other items that we believe are not indicative of our core operating performance.
Gross Invested Capital Gross Invested Capital refers to the aggregate amount of capital invested by our funds during a given period, and includes investments made by our draw-down funds and permanent capital vehicles (and affiliated funds) and new capital raised and invested by our open-ended managed accounts, sub-advised accounts and CLOs, but excludes capital that is reinvested (after receiving repayments of capital) by our open-ended managed accounts, sub-advised accounts and CLOs.
Incentive Eligible AUM Incentive Eligible AUM or “IEAUM” generally refers to the AUM of our funds and other entities from which performance income may be generated, regardless of whether or not they are currently generating performance income. It generally represents the NAV plus uncalled equity or total assets plus uncalled debt, as applicable, of our funds for which we are entitled to receive performance income, excluding capital committed by us and our professionals (from which we generally do not earn performance income), as well as proceeds raised in the initial public offering of a SPAC sponsored by us. With respect to ARCC's AUM, only ARCC Part II Fees may be generated from IEAUM.
Incentive Generating AUM
Incentive Generating AUM or “IGAUM” refers to the AUM of our funds and other entities that are currently generating performance income on a realized or unrealized basis. It generally represents the NAV or total assets of our funds, as applicable, for which we are entitled to receive performance income, excluding capital committed by us and our professionals (from which we generally do not earn performance income). ARCC is only included in IGAUM when ARCC Part II Fees are being generated.
Management Fees Management Fees refers to fees we earn for advisory services provided to our funds, which are generally based on a defined percentage of fair value of assets, total commitments, invested capital, net asset value, net investment income, total assets or par value of the investment portfolios managed by us. Management fees include Part I Fees, a quarterly fee based on the net investment income of certain funds, among others.
Net Inflows of Capital Net Inflows of Capital refers to net new commitments during the period, including equity and debt commitments and gross inflows into our open-ended managed accounts and sub-advised accounts, as well as new debt and equity issuances by our publicly traded vehicles minus redemptions from our open-ended funds, managed accounts and sub-advised accounts.
Operations ManagementGroup
In addition to our operating segments, we have an Operations Management Group (the “OMG”) that consists of shared resource groups to support our reportable segments by providing infrastructure and administrative support in the areas of accounting/finance, operations, information technology, strategy and relationship management, legal, compliance and human resources. The OMG’s expenses are not allocated to our reportable segments but we consider the cost structure of the OMG when evaluating our financial performance. Our management uses this information to assess the performance of our reportable segments and OMG, and we believe that this information enhances the ability of shareholders to analyze our performance.
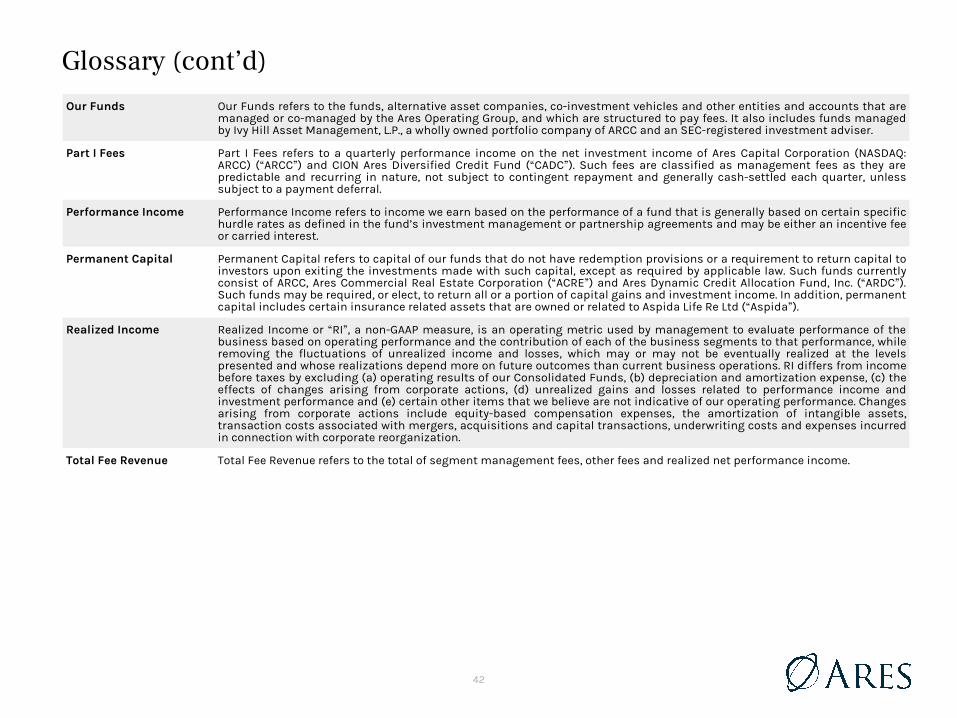
42
Glossary (cont’d)Our Funds Our Funds refers to the funds, alternative asset companies, co-investment vehicles and other entities and accounts that are
managed or co-managed by the Ares Operating Group, and which are structured to pay fees. It also includes funds managed by Ivy Hill Asset Management, L.P., a wholly owned portfolio company of ARCC and an SEC-registered investment adviser.
Part I Fees Part I Fees refers to a quarterly performance income on the net investment income of Ares Capital Corporation (NASDAQ: ARCC) (“ARCC”) and CION Ares Diversified Credit Fund (“CADC”). Such fees are classified as management fees as they are predictable and recurring in nature, not subject to contingent repayment and generally cash-settled each quarter, unless subject to a payment deferral.
Performance Income Performance Income refers to income we earn based on the performance of a fund that is generally based on certain specific hurdle rates as defined in the fund’s investment management or partnership agreements and may be either an incentive fee or carried interest.
Permanent Capital Permanent Capital refers to capital of our funds that do not have redemption provisions or a requirement to return capital to investors upon exiting the investments made with such capital, except as required by applicable law. Such funds currently consist of ARCC, Ares Commercial Real Estate Corporation (“ACRE”) and Ares Dynamic Credit Allocation Fund, Inc. (“ARDC”). Such funds may be required, or elect, to return all or a portion of capital gains and investment income. In addition, permanent capital includes certain insurance related assets that are owned or related to Aspida Life Re Ltd (“Aspida”).
Realized Income Realized Income or “RI”, a non-GAAP measure, is an operating metric used by management to evaluate performance of the business based on operating performance and the contribution of each of the business segments to that performance, while removing the fluctuations of unrealized income and losses, which may or may not be eventually realized at the levels presented and whose realizations depend more on future outcomes than current business operations. RI differs from income before taxes by excluding (a) operating results of our Consolidated Funds, (b) depreciation and amortization expense, (c) the effects of changes arising from corporate actions, (d) unrealized gains and losses related to performance income and investment performance and (e) certain other items that we believe are not indicative of our operating performance. Changes arising from corporate actions include equity-based compensation expenses, the amortization of intangible assets, transaction costs associated with mergers, acquisitions and capital transactions, underwriting costs and expenses incurred in connection with corporate reorganization.
Total Fee Revenue Total Fee Revenue refers to the total of segment management fees, other fees and realized net performance income.