argo – a decade of progress - atlantic oceanographic
TRANSCRIPT

ARGO – A DECADE OF PROGRESS
Howard J. Freeland (1), Dean Roemmich (2), Silvia L. Garzoli (3), Pierre-Yves Le Traon (4), Muthalagu Ravichandran (5), Stephen Riser (6), Virginie Thierry (7), Susan Wijffels (8), Mathieu Belbéoch (9), John Gould (10), Fiona Grant (11), Mark Ignazewski (12), Brian King (13), Birgit Klein (14), Kjell Arne Mork (15),
Breck Owens (16), Sylvie Pouliquen (17), Andreas Sterl (18), Toshio Suga (19), Moon-Sik Suk (20), Philip Sutton (21), Ariel Troisi (22), Pedro Joaquin Vélez-Belchi (23), and Jianping Xu (24)
(1) Fisheries and Oceans Canada, Institute of Ocean Sciences, Sidney, BC, V8L 4B2, Canada, Email: [email protected]
(2) Scripps Institution of Oceanography, University of California San Diego, 9500 Gilman Drive, La Jolla, CA 92093-0230 U.S.A., Email: [email protected]
(3) NOAA/AOML, 4301 Rickenbacker Causeway, Miami, FL 33149-1026, U.S.A., Email: [email protected] (4) IFREMER, Centre de Brest, Technopôle de Brest Iroise, B.P. 70, 29280, Plouzané, France,
Email: [email protected] (5) INCOIS, P.B. No. 21, Gajularamaram, IDA Jeedimetla, Hyderabad 500 055, India, Email: [email protected]
(6) School of Oceanography, University of Washington, Box 357940, Seattle, WA 98195-7940, U.S.A., Email: [email protected]
(7) Laboratoire de Physique des Océans, UMR6523 IFREMER/CNRS/IRD/UBO, IFREMER, BP 70, 29280, Plouzané, France, Email: [email protected]
(8) Centre for Australian Weather and Climate Research, CSIRO Marine Laboratories, GPO Box 1538, Hobart TAS 7000, Australia, Email: [email protected]
(9) JCOMMOPS, 8-10, rue Hermès, Parc technologique du Canal, 31526, Ramonville, France, Email: [email protected]
(10) National Oceanography Centre, Empress Dock, Southampton, SO14 3ZH, U.K., Email: [email protected] (11) Marine Institute, Rinville, Oranmore, Co. Galway, Ireland, Email: [email protected]
(12) FNMOC, 7 Grace Hopper Ave., Monterey, CA 93943, U.S.A., Email: [email protected] (13) Southampton Oceanography Centre, Empress Dock, Southampton SO14 3ZH, U.K.,
Email: [email protected] (14) Bundesamt für Seeschifffahrt und Hydrographie, Bernhard-Nocht Straße 78, Hamburg, 20359, Germany,
Email: [email protected] (15) Institute of Marine Research, Nordnesgaten 50, 5817 Bergen, Norway, Email: [email protected]
(16) Woods Hole Oceanographic Institution, Clark 207A, MS#29, Woods Hole, MA 02543, U.S.A., Email: [email protected]
(17) IFREMER, Centre de Brest, B.P. 70, 29280, Plouzané, France, Email: [email protected] (18) KNMI, P.O. Box 201, 3730 AE De Bilt, The Netherlands, Email: [email protected]
(19) Graduate School of Science, Tohoku University, Aramaki Aza-Aoba 6-3, Sendai, Miyagi, 980-8578, Japan, Email: [email protected]
(20) KORDI, 1270 Sa-dong, Ansan, Gyonggi, Republic of Korea 426-744, Email: [email protected] (21) NIWA, Greta Point, P.O. Box 14-901, Wellington, New Zealand, Email: [email protected]
(22) Servicio de Hidrografía Naval, Ministerio de Defensa, Av. Montes de Oca 2124, C1270ABV Buenos Aires, Argentina, Email: [email protected]
(23) Instituto Español de Oceanografia, Centro Oceanográfico de Canarias, Avda Tres de Mayo, N°73, 38006, Santa Cruz de Tenenerife, España, Email: [email protected]
(22) SIO/SOA, 36 Baochubei Road, Hangzhou, Zhejiang, 310012, China, Email: [email protected]
1. ARGO’S PROGRESS TOWARDS ACCOMPLISHING ITS PRIMARY GOALS
The primary goal of Argo, as enunciated in the original prospectus ([1], page 5), was to create a global network of instruments integrated with other elements of the climate observing system:
• to detect climate variability on seasonal to decadal time-scales. The targeted variability includes changes in the large-scale distribution of temperature and salinity and in the transport of
these properties by large-scale ocean circulation. • to deliver information needed for calibration of
satellite measurements, and • to provide data for initialization and constraint of
climate models. To accomplish this it was proposed to deploy a large array of profiling floats measuring temperature and salinity to 2000 metres and reporting in real-time every 10 days. The proposal suggested a global spacing of 3° × 3° which was based on (i) previous design studies
from the global XBT networks, (ii) spatial statistics from satellite altimetry, and (iii) sampling experiments using WOCE hydrographic sections. The 3° × 3° network would yield a formal error of estimation for near surface temperature of less than 0.5°C, which was equivalent to an error in bimonthly surface heat fluxes of 15 W/m2. Such spacing required an array of 3300 instruments between 60°S and 60°N. The instruments were planned to sample every 10 days, a choice informed by a need for many independent samples on seasonal and longer time-scales, knowledge of ocean variability and the existence of a satellite altimeter already sampling at 10-day intervals. A decade later, how well have these initial objectives been met?
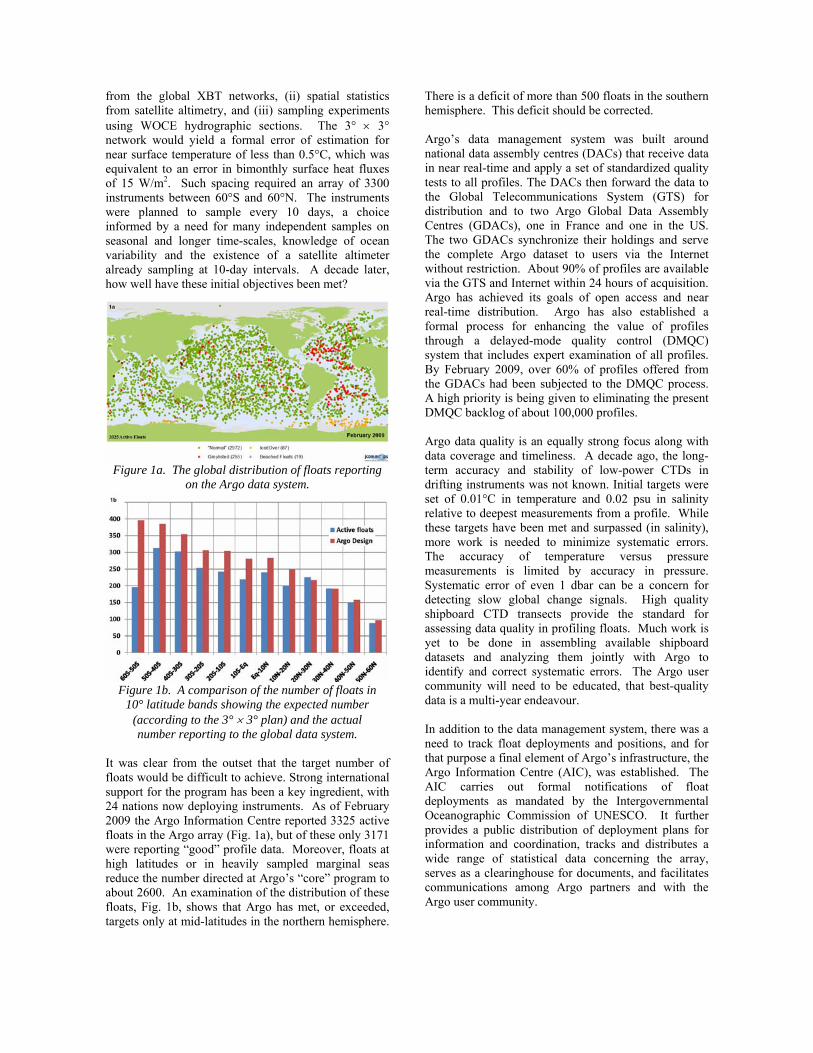
Figure 1a. The global distribution of floats reporting on the Argo data system.
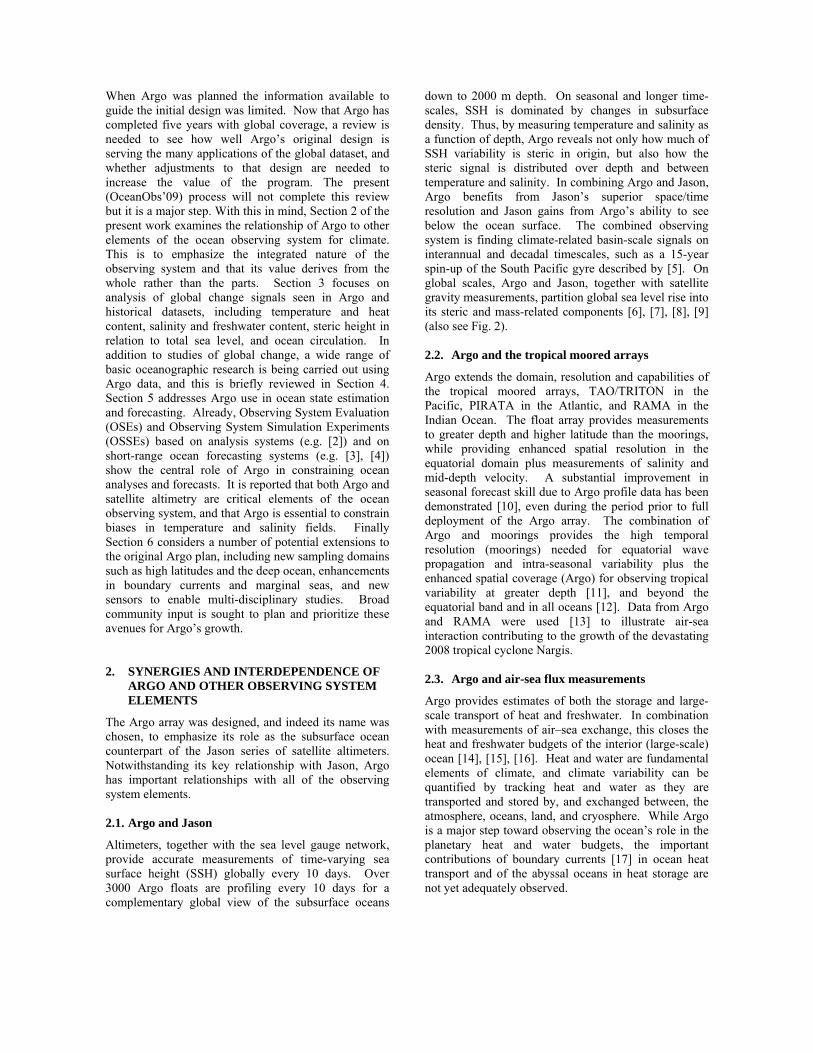
Figure 1b. A comparison of the number of floats in
10° latitude bands showing the expected number (according to the 3° × 3° plan) and the actual number reporting to the global data system.
It was clear from the outset that the target number of floats would be difficult to achieve. Strong international support for the program has been a key ingredient, with 24 nations now deploying instruments. As of February 2009 the Argo Information Centre reported 3325 active floats in the Argo array (Fig. 1a), but of these only 3171 were reporting “good” profile data. Moreover, floats at high latitudes or in heavily sampled marginal seas reduce the number directed at Argo’s “core” program to about 2600. An examination of the distribution of these floats, Fig. 1b, shows that Argo has met, or exceeded, targets only at mid-latitudes in the northern hemisphere.
There is a deficit of more than 500 floats in the southern hemisphere. This deficit should be corrected. Argo’s data management system was built around national data assembly centres (DACs) that receive data in near real-time and apply a set of standardized quality tests to all profiles. The DACs then forward the data to the Global Telecommunications System (GTS) for distribution and to two Argo Global Data Assembly Centres (GDACs), one in France and one in the US. The two GDACs synchronize their holdings and serve the complete Argo dataset to users via the Internet without restriction. About 90% of profiles are available via the GTS and Internet within 24 hours of acquisition. Argo has achieved its goals of open access and near real-time distribution. Argo has also established a formal process for enhancing the value of profiles through a delayed-mode quality control (DMQC) system that includes expert examination of all profiles. By February 2009, over 60% of profiles offered from the GDACs had been subjected to the DMQC process. A high priority is being given to eliminating the present DMQC backlog of about 100,000 profiles. Argo data quality is an equally strong focus along with data coverage and timeliness. A decade ago, the long-term accuracy and stability of low-power CTDs in drifting instruments was not known. Initial targets were set of 0.01°C in temperature and 0.02 psu in salinity relative to deepest measurements from a profile. While these targets have been met and surpassed (in salinity), more work is needed to minimize systematic errors. The accuracy of temperature versus pressure measurements is limited by accuracy in pressure. Systematic error of even 1 dbar can be a concern for detecting slow global change signals. High quality shipboard CTD transects provide the standard for assessing data quality in profiling floats. Much work is yet to be done in assembling available shipboard datasets and analyzing them jointly with Argo to identify and correct systematic errors. The Argo user community will need to be educated, that best-quality data is a multi-year endeavour. In addition to the data management system, there was a need to track float deployments and positions, and for that purpose a final element of Argo’s infrastructure, the Argo Information Centre (AIC), was established. The AIC carries out formal notifications of float deployments as mandated by the Intergovernmental Oceanographic Commission of UNESCO. It further provides a public distribution of deployment plans for information and coordination, tracks and distributes a wide range of statistical data concerning the array, serves as a clearinghouse for documents, and facilitates communications among Argo partners and with the Argo user community.
When Argo was planned the information available to guide the initial design was limited. Now that Argo has completed five years with global coverage, a review is needed to see how well Argo’s original design is serving the many applications of the global dataset, and whether adjustments to that design are needed to increase the value of the program. The present (OceanObs’09) process will not complete this review but it is a major step. With this in mind, Section 2 of the present work examines the relationship of Argo to other elements of the ocean observing system for climate. This is to emphasize the integrated nature of the observing system and that its value derives from the whole rather than the parts. Section 3 focuses on analysis of global change signals seen in Argo and historical datasets, including temperature and heat content, salinity and freshwater content, steric height in relation to total sea level, and ocean circulation. In addition to studies of global change, a wide range of basic oceanographic research is being carried out using Argo data, and this is briefly reviewed in Section 4. Section 5 addresses Argo use in ocean state estimation and forecasting. Already, Observing System Evaluation (OSEs) and Observing System Simulation Experiments (OSSEs) based on analysis systems (e.g. [2]) and on short-range ocean forecasting systems (e.g. [3], [4]) show the central role of Argo in constraining ocean analyses and forecasts. It is reported that both Argo and satellite altimetry are critical elements of the ocean observing system, and that Argo is essential to constrain biases in temperature and salinity fields. Finally Section 6 considers a number of potential extensions to the original Argo plan, including new sampling domains such as high latitudes and the deep ocean, enhancements in boundary currents and marginal seas, and new sensors to enable multi-disciplinary studies. Broad community input is sought to plan and prioritize these avenues for Argo’s growth. 2. SYNERGIES AND INTERDEPENDENCE OF
ARGO AND OTHER OBSERVING SYSTEM ELEMENTS
The Argo array was designed, and indeed its name was chosen, to emphasize its role as the subsurface ocean counterpart of the Jason series of satellite altimeters. Notwithstanding its key relationship with Jason, Argo has important relationships with all of the observing system elements. 2.1. Argo and Jason
Altimeters, together with the sea level gauge network, provide accurate measurements of time-varying sea surface height (SSH) globally every 10 days. Over 3000 Argo floats are profiling every 10 days for a complementary global view of the subsurface oceans
down to 2000 m depth. On seasonal and longer time-scales, SSH is dominated by changes in subsurface density. Thus, by measuring temperature and salinity as a function of depth, Argo reveals not only how much of SSH variability is steric in origin, but also how the steric signal is distributed over depth and between temperature and salinity. In combining Argo and Jason, Argo benefits from Jason’s superior space/time resolution and Jason gains from Argo’s ability to see below the ocean surface. The combined observing system is finding climate-related basin-scale signals on interannual and decadal timescales, such as a 15-year spin-up of the South Pacific gyre described by [5]. On global scales, Argo and Jason, together with satellite gravity measurements, partition global sea level rise into its steric and mass-related components [6], [7], [8], [9] (also see Fig. 2). 2.2. Argo and the tropical moored arrays
Argo extends the domain, resolution and capabilities of the tropical moored arrays, TAO/TRITON in the Pacific, PIRATA in the Atlantic, and RAMA in the Indian Ocean. The float array provides measurements to greater depth and higher latitude than the moorings, while providing enhanced spatial resolution in the equatorial domain plus measurements of salinity and mid-depth velocity. A substantial improvement in seasonal forecast skill due to Argo profile data has been demonstrated [10], even during the period prior to full deployment of the Argo array. The combination of Argo and moorings provides the high temporal resolution (moorings) needed for equatorial wave propagation and intra-seasonal variability plus the enhanced spatial coverage (Argo) for observing tropical variability at greater depth [11], and beyond the equatorial band and in all oceans [12]. Data from Argo and RAMA were used [13] to illustrate air-sea interaction contributing to the growth of the devastating 2008 tropical cyclone Nargis. 2.3. Argo and air-sea flux measurements
Argo provides estimates of both the storage and large-scale transport of heat and freshwater. In combination with measurements of air–sea exchange, this closes the heat and freshwater budgets of the interior (large-scale) ocean [14], [15], [16]. Heat and water are fundamental elements of climate, and climate variability can be quantified by tracking heat and water as they are transported and stored by, and exchanged between, the atmosphere, oceans, land, and cryosphere. While Argo is a major step toward observing the ocean’s role in the planetary heat and water budgets, the important contributions of boundary currents [17] in ocean heat transport and of the abyssal oceans in heat storage are not yet adequately observed.
2.4. Argo, repeat hydrography and high resolution XBT transects
Argo is intrinsically a broad scale array with measurements to 2000 m. For boundary currents, fronts, and eddies finer resolution is required. One strategy is to use Argo to assess the interior ocean’s storage of heat and freshwater in regions that are enclosed by repeat hydrographic or high resolution XBT transects. The high resolution transect data are required to estimate geostrophic velocity and transport, and hence heat and freshwater transport into the closed regions or across basin-spanning transects [18], [19]. A second means of combining these data is to use Argo to observe seasonal-to-interannual variability along decadally repeated hydrographic transects [20], [21]. Finally, repeat hydrography is needed for adjusting salinity drift [22] and for assessing the overall quality of Argo data. Since most Argo floats cannot be recovered for re-calibration, in situ assessment of data quality and detection of systematic errors are critical functions. 2.5. Argo and SST/SSS
Satellites provide global views of sea surface temperature and, in future, sea surface salinity. These data require in situ measurements for calibration purposes, and for their interpretation. Argo can help satisfy both of these requirements. For understanding the evolution of the ocean’s surface mixed layer, including air-sea interactions, one must observe not only sea surface properties, but also surface layer structure, including the thickness of the vertically-uniform temperature and salinity layers. Argo’s observation of surface layer structure globally is a major contribution to studies of atmosphere-ocean interactions and Argo data are being used in many studies of ocean mixed layers (e.g. [14], [23], [24]) and barrier layers (e.g. [25], [26], [27], [28]). Argo is not a stand-alone system. Indeed, it has major interdependencies with all of the satellite and in situ networks that make up the ocean observing system. But Argo occupies a special role in the system as the only global subsurface network. Arguably, without Argo the integrated global ocean observing system would not be global and could not be integrated. 3. DETECTION AND ANALYSIS OF CLIMATE
CHANGE SIGNALS
A key objective of Argo is to observe oceanic signals related to climate change. This includes regional and global changes in ocean temperature and heat content, salinity and freshwater content, the steric height of the sea surface in relation to total sea level, and large-scale ocean circulation. The global Argo dataset is not yet of sufficient duration to observe global change signals.
Seasonal and interannual variability dominate the present 5-year globally-averaged time-series (Fig. 2). Thus, analyses of decadal changes presently focus on comparison of Argo to sparse and sometimes inaccurate historical data. If the trends seen in these analyses continue through a sustained Argo era, they will begin to emerge above the level of interannual fluctuations after about 10 years of sampling. Argo’s greatest contributions to observing the global oceans are still in the future, but its global span is clearly transforming the capability to observe climate-related changes. Global coverage is essential, but for global change applications Argo data must also have high accuracy and minimal systematic errors. A highest priority for Argo is to continue work aimed at identifying and correcting pressure measurement errors, especially those with systematic impacts. High quality shipboard CTD transects are critical for assessing data quality in nearby profiling floats. Technology development aimed at more accurate and stable measurement of pressure is another promising avenue. Work on minimizing systematic errors in the Argo dataset is not yet completed, and the globally-averaged time series (Fig. 2), while illustrative, is not final. 3.1. Ocean temperature and heat content
Over the past 50 years, the oceans have absorbed more than 80% of the total heat added to the air/sea/land/cryosphere climate system [29]. As the dominant reservoir for heat, the oceans are critical for measuring the radiation imbalance of the planet (in a time-integral sense), and the surface layer of the oceans plays the role of thermostat and heat source/sink for the lower atmosphere. References [30] and [31] have recently estimated multi-decadal upper ocean heat content using best-known corrections to systematic errors in expendable bathythermograph fall-rate [32]. For the upper 700 m, the increase in heat content was about 16 × 1022 J since 1961. This is consistent with the comparison by [33] of Argo data with the global temperature time-series of [29], finding a warming of the 0–2000 m ocean by 0.06°C since the (pre-XBT) early 1960’s. 3.2. Ocean salinity and freshwater content
Among the major societal impacts of climate change are those that could result from an increase in the global cycle of evaporation and rainfall caused by a warmer ocean surface layer. Changes in the patterns and magnitude of rainfall and storms affect nearly every facet of society, from agriculture and urban water supplies to disease and health, to housing, transportation and insurance impacts of severe weather. While the impacts are local and regional, the causes and patterns are global.

Regionally, ocean salinity accumulates the imbalances of evaporation minus rainfall, becoming fresher or saltier where the balance tips in one direction or the other over time. As an integrating measurement made with high accuracy, freshwater content (salinity anomaly over a layer) is the most sensitive yardstick available for observing the global fingerprint of a changing hydrological cycle. A second application of salinity is to diagnose the global volume of ice. Melting of either floating ice or glaciers and ice sheets lowers ocean salinity. Recent analyses of Argo data in relation to the historical record show an increase in salinity in evaporative mid-latitude regions and a freshening at high latitudes and tropical convergence zones. This pattern may imply an increase in the global hydrological cycle by several percent [34], [35]. 3.3. Steric sea level
As noted in Section 2.1, Argo provides the capability to understand sea level change by measuring its
component due to subsurface temperature and salinity. The steric component is dominant over the mass component in regional sea level variability and on a global basis it accounts for about 1/3 of total sea level increase in the past half century [30]. Accurate projections of future sea level require an understanding of the causes of sea level change in the modern record. 3.4. Ocean circulation
The oceans are not only reservoirs for heat and water in the climate system. They are dynamically active, redistributing them by means of an ocean circulation that responds to changes in wind and thermohaline forcing. Argo presently observes only the interior upper-ocean circulation, so a complete observing system that includes boundary currents and deep measurements is essential in this regard. Argo contributions to estimating changes in gyre-scale circulation [5], the Antarctic Circumpolar Current [36], and the Atlantic meridional overturning circulation [21] are all discussed elsewhere in this paper.
Figure 2. Time-series of globally-averaged temperature, 0–800 dbar, using data from [31] (black line) and from [33]
(red line). The former uses all available data; the latter is Argo only. Both datasets are masked to a common domain for spatial averaging [33]. The middle and bottom panels show the respective time-series of
temperature anomaly versus pressure, both relative to the Levitus et al. [31] climatology.
4. OTHER RESEARCH ACHIEVEMENTS OF THE ARGO PROGRAM
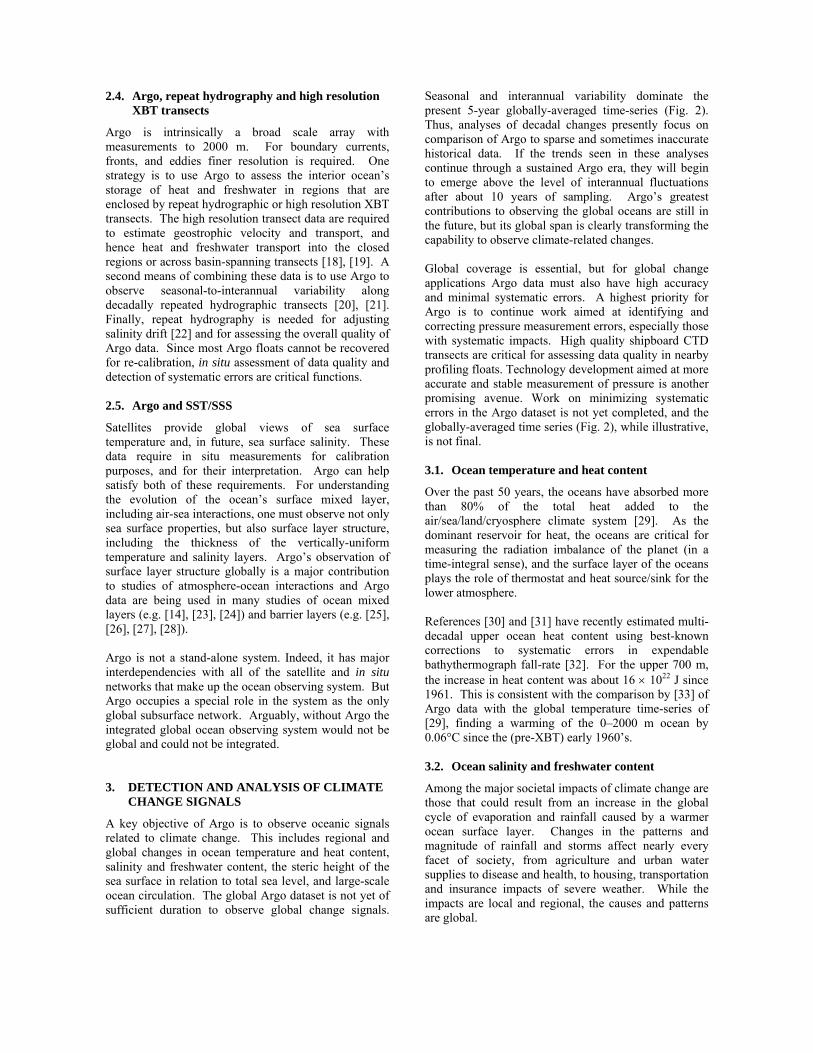
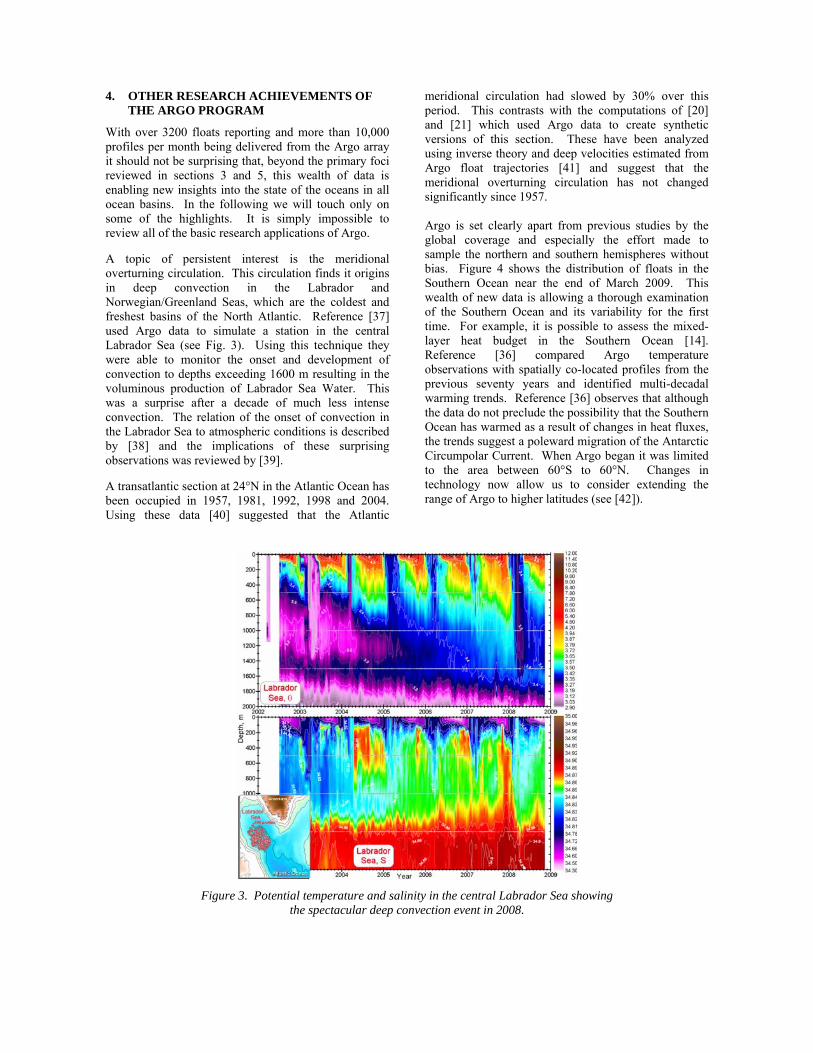
With over 3200 floats reporting and more than 10,000 profiles per month being delivered from the Argo array it should not be surprising that, beyond the primary foci reviewed in sections 3 and 5, this wealth of data is enabling new insights into the state of the oceans in all ocean basins. In the following we will touch only on some of the highlights. It is simply impossible to review all of the basic research applications of Argo. A topic of persistent interest is the meridional overturning circulation. This circulation finds it origins in deep convection in the Labrador and Norwegian/Greenland Seas, which are the coldest and freshest basins of the North Atlantic. Reference [37] used Argo data to simulate a station in the central Labrador Sea (see Fig. 3). Using this technique they were able to monitor the onset and development of convection to depths exceeding 1600 m resulting in the voluminous production of Labrador Sea Water. This was a surprise after a decade of much less intense convection. The relation of the onset of convection in the Labrador Sea to atmospheric conditions is described by [38] and the implications of these surprising observations was reviewed by [39]. A transatlantic section at 24°N in the Atlantic Ocean has been occupied in 1957, 1981, 1992, 1998 and 2004. Using these data [40] suggested that the Atlantic
meridional circulation had slowed by 30% over this period. This contrasts with the computations of [20] and [21] which used Argo data to create synthetic versions of this section. These have been analyzed using inverse theory and deep velocities estimated from Argo float trajectories [41] and suggest that the meridional overturning circulation has not changed significantly since 1957. Argo is set clearly apart from previous studies by the global coverage and especially the effort made to sample the northern and southern hemispheres without bias. Figure 4 shows the distribution of floats in the Southern Ocean near the end of March 2009. This wealth of new data is allowing a thorough examination of the Southern Ocean and its variability for the first time. For example, it is possible to assess the mixed-layer heat budget in the Southern Ocean [14]. Reference [36] compared Argo temperature observations with spatially co-located profiles from the previous seventy years and identified multi-decadal warming trends. Reference [36] observes that although the data do not preclude the possibility that the Southern Ocean has warmed as a result of changes in heat fluxes, the trends suggest a poleward migration of the Antarctic Circumpolar Current. When Argo began it was limited to the area between 60°S to 60°N. Changes in technology now allow us to consider extending the range of Argo to higher latitudes (see [42]).
Figure 3. Potential temperature and salinity in the central Labrador Sea showing
the spectacular deep convection event in 2008.
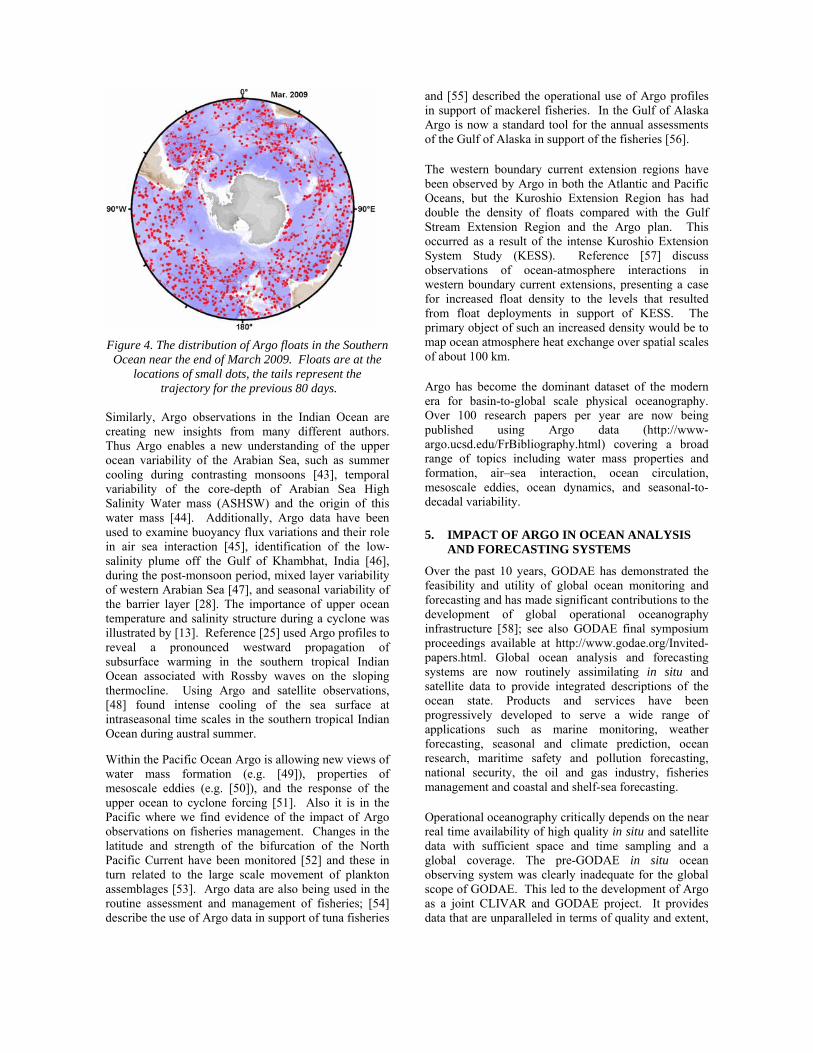
Figure 4. The distribution of Argo floats in the Southern
Ocean near the end of March 2009. Floats are at the locations of small dots, the tails represent the
trajectory for the previous 80 days. Similarly, Argo observations in the Indian Ocean are creating new insights from many different authors. Thus Argo enables a new understanding of the upper ocean variability of the Arabian Sea, such as summer cooling during contrasting monsoons [43], temporal variability of the core-depth of Arabian Sea High Salinity Water mass (ASHSW) and the origin of this water mass [44]. Additionally, Argo data have been used to examine buoyancy flux variations and their role in air sea interaction [45], identification of the low-salinity plume off the Gulf of Khambhat, India [46], during the post-monsoon period, mixed layer variability of western Arabian Sea [47], and seasonal variability of the barrier layer [28]. The importance of upper ocean temperature and salinity structure during a cyclone was illustrated by [13]. Reference [25] used Argo profiles to reveal a pronounced westward propagation of subsurface warming in the southern tropical Indian Ocean associated with Rossby waves on the sloping thermocline. Using Argo and satellite observations, [48] found intense cooling of the sea surface at intraseasonal time scales in the southern tropical Indian Ocean during austral summer.
Within the Pacific Ocean Argo is allowing new views of water mass formation (e.g. [49]), properties of mesoscale eddies (e.g. [50]), and the response of the upper ocean to cyclone forcing [51]. Also it is in the Pacific where we find evidence of the impact of Argo observations on fisheries management. Changes in the latitude and strength of the bifurcation of the North Pacific Current have been monitored [52] and these in turn related to the large scale movement of plankton assemblages [53]. Argo data are also being used in the routine assessment and management of fisheries; [54] describe the use of Argo data in support of tuna fisheries
and [55] described the operational use of Argo profiles in support of mackerel fisheries. In the Gulf of Alaska Argo is now a standard tool for the annual assessments of the Gulf of Alaska in support of the fisheries [56].
The western boundary current extension regions have been observed by Argo in both the Atlantic and Pacific Oceans, but the Kuroshio Extension Region has had double the density of floats compared with the Gulf Stream Extension Region and the Argo plan. This occurred as a result of the intense Kuroshio Extension System Study (KESS). Reference [57] discuss observations of ocean-atmosphere interactions in western boundary current extensions, presenting a case for increased float density to the levels that resulted from float deployments in support of KESS. The primary object of such an increased density would be to map ocean atmosphere heat exchange over spatial scales of about 100 km. Argo has become the dominant dataset of the modern era for basin-to-global scale physical oceanography. Over 100 research papers per year are now being published using Argo data (http://www-argo.ucsd.edu/FrBibliography.html) covering a broad range of topics including water mass properties and formation, air–sea interaction, ocean circulation, mesoscale eddies, ocean dynamics, and seasonal-to-decadal variability. 5. IMPACT OF ARGO IN OCEAN ANALYSIS
AND FORECASTING SYSTEMS
Over the past 10 years, GODAE has demonstrated the feasibility and utility of global ocean monitoring and forecasting and has made significant contributions to the development of global operational oceanography infrastructure [58]; see also GODAE final symposium proceedings available at http://www.godae.org/Invited-papers.html. Global ocean analysis and forecasting systems are now routinely assimilating in situ and satellite data to provide integrated descriptions of the ocean state. Products and services have been progressively developed to serve a wide range of applications such as marine monitoring, weather forecasting, seasonal and climate prediction, ocean research, maritime safety and pollution forecasting, national security, the oil and gas industry, fisheries management and coastal and shelf-sea forecasting.
Operational oceanography critically depends on the near real time availability of high quality in situ and satellite data with sufficient space and time sampling and a global coverage. The pre-GODAE in situ ocean observing system was clearly inadequate for the global scope of GODAE. This led to the development of Argo as a joint CLIVAR and GODAE project. It provides data that are unparalleled in terms of quality and extent,

particularly in relation to salinity and it has also revolutionized the way in situ data are processed, quality controlled and distributed to the research and operational communities.
Argo has had a major impact for GODAE and is now the single most important in situ observing system for operational oceanography. Most global and regional modeling and data assimilation systems are using Argo data. Argo is strongly complementary with satellite measurements (in particular satellite altimetry) to constrain models through data assimilation. Without Argo, data assimilation systems are insufficiently constrained and cannot serve several key applications (e.g. weather, seasonal and decadal forecasting, climate monitoring). While Argo data cannot resolve the mesoscale, they provide very useful statistics on the temperature and salinity vertical structure that are needed to assimilate altimeter and sea surface temperature data in high resolution (eddy resolving) models. Argo also provides outstanding data for model validation both at low (climate) and high (eddy resolving) resolutions. Thanks to Argo, it is now possible to assess regional model deficiencies and their time dependencies. Climatologies and the large scale temperature and salinity signals derived from Argo are also very useful for model validation. There have been major improvements in data assimilation techniques to develop effective joint assimilation of Argo with altimetry and the other elements of the global ocean observing system. Most systems now assimilate temperature, salinity and sea level via multivariate schemes, imposing physical and dynamical constraints among different variables. As a result, Argo data now have a strong impact in most systems. Several studies have demonstrated the importance of Argo observations (see [59] for a review). These include several Observing System Evaluation (OSEs) and Observing System simulation Experiments (OSSEs) based on analysis systems (e.g. [2]) and on short-range ocean forecasting systems (e.g. [3], [4]). Without Argo data assimilation, large scale biases in temperature and salinity fields develop over time in most data assimilation systems. Salinity data are also very important as salinity fields are only very poorly constrained with the assimilation of altimeter and sea surface temperature data. In addition, salinity data are very useful to optimally project altimeter sea level increments in temperature, salinity and barotropic components.
Several attempts have also been carried out to analyze the impact of Argo data for seasonal forecasting. Seasonal forecasts produced with coupled ocean-atmosphere models require real-time knowledge of the state of the global ocean. The assimilation of ocean data in the ocean initialization is required to improve
seasonal forecast skill. Argo has a large impact on the ocean state initialization and a significant impact on the sea surface temperature forecasting skill (e.g. [60], [61]). There is also increasing interest in the use of decadal climate prediction to provide information enabling better adaptation to climate change. Idealized predictability studies carried out by the Met Office Hadley Centre suggest that current Argo temperature and salinity profiles potentially provide sufficient information to enable variations of the MOC to be predicted on decadal timescales. It is also noted that additional measurements below 2000 m would potentially increase the skill in predicting global patterns of ocean heat anomalies, especially at longer lead times.
During the new sustained phase of GODAE, so called GODAE OceanView, more effort will be invested in evaluation of the global ocean observing system. This is an area where international coordination and cooperation is a very high priority and calls for an active collaboration between Argo and GODAE OceanView communities. This is very much needed to guide the long term evolution of Argo. As of today, the main recommendations for the future of Argo from GODAE OceanView can be summarized as follows: 1. The first priority should be to sustain Argo as it is
now. This is needed to consolidate the different components of Argo (float technology, float deployment, real time and delayed mode data systems). Improvements in the data system (e.g. new products such as deep velocities, new climatologies, improved QC) will benefit to data assimilation systems.
2. There are a few short-term minor improvements that should also be considered. Higher vertical sampling near the surface for both temperature and salinity would be highly beneficial for an improved synergy with satellite measurements. While this is almost straightforward for temperature, this is more difficult for salinity (see Section 6). An increased vertical sampling in the upper layers would also be useful for seasonal predictions. Improvement to data timeliness would also benefit some of the daily operational systems.
3. Sampling of marginal seas and high latitudes is also needed as most of operational oceanography systems cover these regions. There are key applications (e.g. coastal) that require, in particular, a sampling of marginal seas.
4. Deeper measurements will be needed to constrain the deep temperature and salinity fields for climate monitoring and long-term prediction.
5. There is also a need to move towards biogeochemical measurements. Dissolved oxygen would be very useful for validation of (and assimilation in) coupled physical-biological models.
This should be the first priority when technology and feasibility have been fully demonstrated. Chl-a measurements would also be very useful for coupled physical-biological models and to complement measurements from ocean colour satellites
Requirements for 4 and 5 should now be precisely defined. Design and feasibility studies (e.g. regional pilot projects) need to be carried out. 6. THE FUTURE EVOLUTION OF ARGO
As the next decade of Argo begins, it is reasonable to revisit the core mission prescription and to assess any changes that should be made in order to improve the program and strengthen its contributions to other programs such as CLIVAR and GODAE. For example, it is suggested that Argo expand its sampling domain to include the seasonal ice zone, where climate signals are possibly large. While a decade ago this was not feasible, today it is possible to sample under the ice in winter, store the profiles, and transmit them during the summer months [62]. Recent multi-year tests employing such floats and Iridium communications have been carried out, with instrument mortality comparable to that in ice-free regions. It is also suggested that Argo expand its coverage into marginal seas. This has already been done on an ad hoc basis by groups in some seas without direct Argo involvement [63]. Since faster cycling (5 days) may be desirable in these seas, and instrument losses will likely be higher than in the open ocean due to increased grounding, stranding, and fishing, having regional groups with targeted interests might be a more prudent approach to surveying marginal seas with profiling
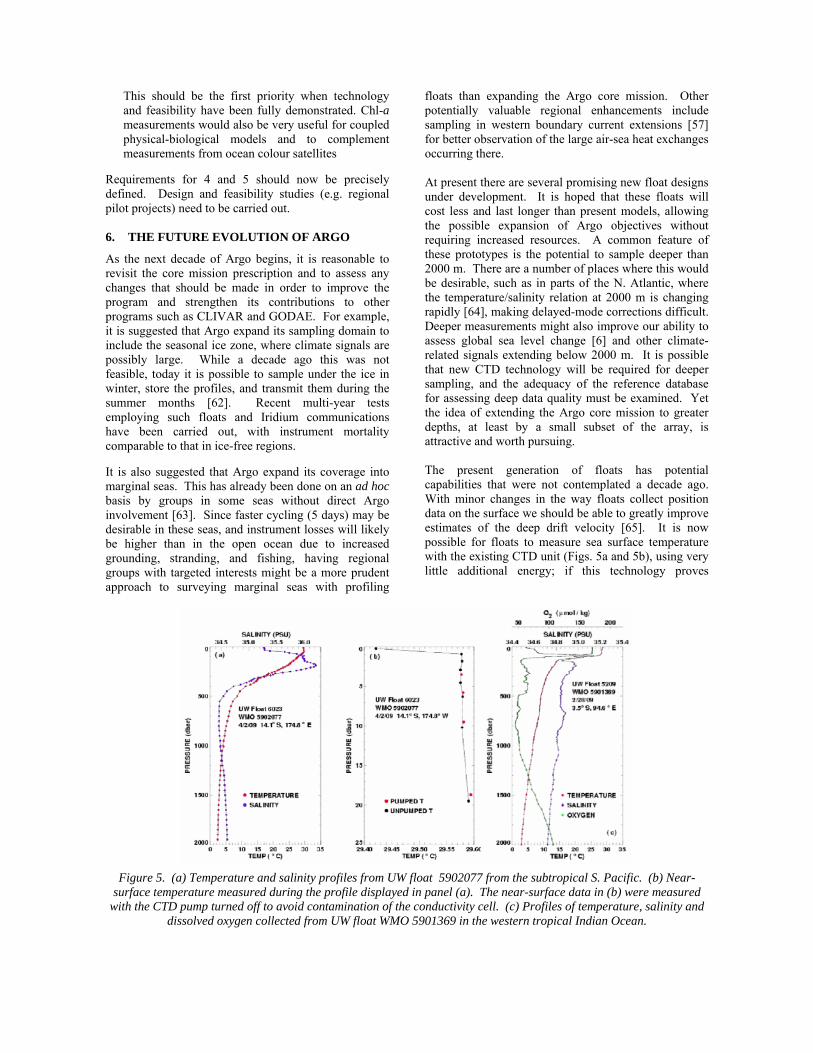
floats than expanding the Argo core mission. Other potentially valuable regional enhancements include sampling in western boundary current extensions [57] for better observation of the large air-sea heat exchanges occurring there. At present there are several promising new float designs under development. It is hoped that these floats will cost less and last longer than present models, allowing the possible expansion of Argo objectives without requiring increased resources. A common feature of these prototypes is the potential to sample deeper than 2000 m. There are a number of places where this would be desirable, such as in parts of the N. Atlantic, where the temperature/salinity relation at 2000 m is changing rapidly [64], making delayed-mode corrections difficult. Deeper measurements might also improve our ability to assess global sea level change [6] and other climate-related signals extending below 2000 m. It is possible that new CTD technology will be required for deeper sampling, and the adequacy of the reference database for assessing deep data quality must be examined. Yet the idea of extending the Argo core mission to greater depths, at least by a small subset of the array, is attractive and worth pursuing. The present generation of floats has potential capabilities that were not contemplated a decade ago. With minor changes in the way floats collect position data on the surface we should be able to greatly improve estimates of the deep drift velocity [65]. It is now possible for floats to measure sea surface temperature with the existing CTD unit (Figs. 5a and 5b), using very little additional energy; if this technology proves
Figure 5. (a) Temperature and salinity profiles from UW float 5902077 from the subtropical S. Pacific. (b) Near-
surface temperature measured during the profile displayed in panel (a). The near-surface data in (b) were measured with the CTD pump turned off to avoid contamination of the conductivity cell. (c) Profiles of temperature, salinity and
dissolved oxygen collected from UW float WMO 5901369 in the western tropical Indian Ocean.
reliable, it should be installed on all floats in the future. Over 200 floats have been deployed with oxygen sensors (Fig. 5c), resulting in new insights into the interaction of chemistry, physics, and biology [66]. As oxygen sensor technology continues to improve, it might be desirable for the Argo core mission to be expanded to include oxygen sensors on most floats. Other sensors that have been tested include chlorophyll [67], nitrate, wind, and rainfall [68]. These additions are exciting but may be prohibitively expensive, and the associated marginal energy costs will severely affect float lifetimes. While Argo should encourage the development of such sensors, careful consideration is needed of whether to deploy them as part of Argo or as separate ancillary arrays with different sampling characteristics. In conjunction with these advances, a parallel evolution the Argo data management system must occur in order to be able handle the ever-increasing variety of measurements.
As Argo enters its second decade, its future evolution will be fuelled in part by its success during its first 10 years. The leading priority for Argo must be to complete and sustain the program with respect to its original objectives for coverage and data quality. However, it is also clear that the objectives of the sustained ocean observing system (especially climate change) require global ocean observations and multidisciplinary sensors. Reference [42], make a convincing case for the expansion of Argo to latitudes higher than those in the original plan and this, along with the inclusion of marginal seas is now technically feasible. There are many additional sensors being developed that show promise, but are not yet technically appropriate. Hence, it is recommended that, as the required technical modifications mature, the core Argo mission should be expanded to include the high latitude oceans, marginal seas, and the deep ocean, with sampling characteristics and additional sensors to further broaden Argo applications including surface layer sampling, ocean mixing, and biogeochemical impacts of climate variability and change. 7. REFERENCES
1. Argo Science Team, 1998: On the design and
Implementation of Argo – An initial Plan for a global array of Profiling Floats. International CLIVAR project Office ICPO Report No.21. GODAE Report No 5. Published by the GODAE International Project office, c/o Bureau of Meteorology, Melbourne, Australia, 32pp.
2. Guinehut, S., Le Traon, P.-Y., Larnicol, G. & Phillips, S.
(2004). Combining Argo and remote-sensing data to estimate the ocean three-dimensional temperature
fields – a first approach based on simulated observations. J. Mar. Systems 46(1–4), 85–98.
3. Martin, M.J., Hines, A. & Bell, M.J. (2007). Data
assimilation in the FOAM operational short-range ocean forecasting system: a description of the scheme and its impact. Quart. J. Roy. Meteorol. Soc. 133, 981–995.
4. Oke, P.R. & Schiller, A. (2007). Impact of Argo, SST
and altimeter data on an eddy-resolving ocean reanalysis. Geophys. Res. Lett. 34, L19601, doi:10.1029/2007GL031549.
5. Roemmich, D., Gilson, J., Davis, R., Sutton, P.,
Wijffels, S. & Riser, S. (2007). Decadal spinup of the South Pacific subtropical gyre. J. Phys. Oceanogr. 37(2), 162–173.
6. Willis, J., Chambers, D. & Nerem, R. (2008). Assessing
the globally-averaged sea level budget on seasonal to interannual time scales. J. Geophys. Res. 113, C06015, DOI 10.1029/2007JC004517.
7. Cazenave A., Dominh, K. & Guinehut, S. (2009). Sea
level budget over 2003-2008: A re-evaluation from GRACE space gravimetry, satellite altimetry and Argo. Global Planet. Change 65(1–2), 83–88.
8. Leuliette, E.W. & Miller, L. (2009). Closing the sea
level rise budget with altimetry, Argo, and GRACE. Geophys. Res. Lett. 36, L04608.
9. Wunsch, C., Ponte, R.M. & Heimbach, P. (2007).
Decadal trends in sea level patterns: 1993–2004. J. Climate 20(24): 5889–5911.
10. Balmaseda, M. & Anderson, D. (2009). Impact of
initialization strategies and observations on seasonal forecast skill, Geophys. Res. Lett. 36, L01701, doi:10.1029/2008GL035561.
11. Matthews, A., Singhruck, P. & Heywood, K. (2007).
Deep ocean impact of a Madden-Julian Oscillation observed by Argo floats. Science 318(5857), 1765–1769.
12. Cai, W., Pan, A., Roemmich, D., Cowan, T. & Guo, X.
(2009). Argo profiles a rare occurrence of three consecutive positive Indian Ocean Dipole events 2006–2008. Geophys. Res. Lett., in press.
13. McPhaden M.J., Foltz, G.R., Lee, Murty, T.V.S.N.,
Ravichandran, M., Vecchi, G.A., Vialard, J., Wiggert, J.D., & Yu, L. (2009). Ocean-atmosphere interactions during cyclone Nargis. EOS: Trans. Am. Geophys. Union: 90(7); 53-60.
14. Dong, S., Gille, S.T. & Sprintall, J. (2007). An
assessment of the Southern Ocean mixed layer heat budget. J. Climate 20(17): 4425–4442.

15. Hadfield, R.E., Wells, N.C., Josey, S.A. & Hirschi,
J.J.M. (2007). On the accuracy of North Atlantic temperature and heat storage fields from Argo. J. Geophys. Res. 112(C1), C01009.
16. Wells N.C., Josey, S.A. & Hadfield, R.E. (2009).
Towards closure of regional heat budget in North Atlantic using Argo floats and surface flux datasets. Ocean Sci. Discuss. 6(1), 95–128.
17. Send, U., Davis, R., Roemmich, D., Lee, C., Kessler,
W., Owens, B., & Rudnick, D. (2009). A global boundary current circulation observing network. OceanObs09 Community White Paper.
18. Douglass, E., Roemmich, D. & Stammer, D. (2009).
Interannual variability of North Pacific heat and freshwater budgets. Deep-Sea Res., submitted.
19. Wunsch, C. & Heimbach, P. (2006). Estimated decadal
changes in the North Atlantic meridional overturning circulation and heat flux 1993–2004. J. Phys. Oceanogr. 36(11) 2012–2024.
20. Vélez-Belchí, P., Hernández-Guerra, A. & Fraile-Nuez,
E. (2008). Changes in the temperature and salinity tendencies of the upper subtropical North Atlantic Ocean. Geophys. Res. Lett., sub judice.
21. Hernández-Guerra, A., Joyce, T. M., Fraile-Nuez, E. &
Vélez-Belchi, P. (2009). Using Argo data to investigate the meridional overturning circulation in the North Atlantic. Deep-Sea Res. (in press).
22. Owens, W.B. & Wong, A. (2009). An improved
calibration method for the drift of the conductivity sensor on autonomous CTD profiling floats by θ–S climatology. Deep-Sea Res. I: 56(3), 450–457.
23. Ohno, Y., Iwasaka, N., Kobashi, F. & Sato, Y. (2009).
Mixed Layer Depth Climatology of the North Pacific Based on Argo Observations. J. Oceanogr. 65(1), 1–16.
24. Sreenivas, P., Patnaik, K.V.K.R.K. & Prasad, K.V.S.R.
(2008). Monthly variability of mixed layer over Arabian Sea using Argo data. Mar. Geodesy 31(1), 17–38.
25. Chowdary J.S., Gnanaseelan, C., Xie, S.P. (2009).
Westward propagation of barrier layer formation in the 2006-07 Rossby wave event over the tropical southwest Indian Ocean. Geophys. Res. Lett. 36, L04607.
26. Maes, C., Ando, K., Delcroix, T., Kessler, W.S.,
McPhaden, M.J. & Roemmich, D. (2006). Observed correlation of surface salinity, temperature and barrier layer at the eastern edge of the western Pacific warm pool, Geophys. Res. Lett. 33, L06601, doi:10.1029/2005GL024772.
27. Sato, K., Suga, T. & Hanawa, K. (2006). Barrier layers
in the subtropical gyres of the world’s oceans. Geophys. Res. Lett. 33, L08603, doi:10.1029/ 2005gl025631,2006.
28. Thadathil, P., Thoppil, P., Rao, R.R., Muraleedharan,
P.M., Somayajulu, Y.K., Gopalakrishna, V.V., Murthugudde, R., Reddy, G.V., Revichandran, C. (2008). Seasonal variability of the observed Barrier Layer in the Arabian Sea. J. Phys. Oceanogr. 38, 624–638.
29. Levitus, S., Antonov, J. & Boyer, T. (2005). Warming of
the world ocean, 1955–2003, Geophys. Res. Lett. 32, L02604, doi:10.1029/2004GL021592. Online data at http://www.nodc.noaa.gov/OC5/DATA_ANALYSIS/heat_intro.html
30. Domingues C.M., Church, J.A., White, N.J., Gleckler,
P.J., Wijffels, S.E., Barker, P.M. & Dunn, J.R. (2008). Improved estimates of upper-ocean warming and multi-decadal sea-level rise. Nature 453, 1090–1093.
31. Levitus, S., Antonov, J.I., Boyer, T.P., Locarnini, R.A.,
Garcia, H.E. & Mishonov, A.V. (2009). Global ocean heat content 1955–2008 in light of recently revealed instrumentation problems. Geophys. Res. Lett. 36, L07608, doi:10.1029/2008GL037155.
32. Wijffels, S., Willis, J., Domingues, C., Barker, P.,
White, N., Gronell, A., Ridgway, K., & Church, J. (2008). Changing expendable bathythermograph fall-rates and their impact on estimates of thermosteric sea level rise. J. Climate, 21(12), 5657-5672.
33. Roemmich, D. & Gilson, J. (2009). The 2004–2008
mean and annual cycle of temperature, salinity and steric height in the global ocean from the Argo Program. Progr. Oceanogr. doi:10.1016/j.pocean. 2009.03.004.
34. Hosoda, S., Suga, T., Shikama, N. & Mizuno, K. (2009).
Global surface layer salinity change and its implication for Hydrological Cycle Intensification. J. Oceanogr. 65(4), 579–586.
35. Johnson, G.C. & Lyman, J.M. (2008). Global oceans:
Sea surface salinity. In State of the Climate in 2007, D.H. Levinson and J.H. Lawrimore, eds., Bull. Amer. Meteorol. Soc. 89(7), S45–S47.
36. Gille, S. (2008). Decadal-scale temperature trends in the
southern hemisphere ocean. J. Climate 21(18), 4749–4765.
37. Yashayaev, I & Loder, J.W. (2008). Enhanced
production of Labrador Sea Water in 2008. Geophys. Res. Lett. 36, LO1606, doi:10.1029/2008 GL026162.
38. Sproson, D.A.J., Renfrew, I.A. & Heywood, K.J.
(2008). Atmospheric conditions associated with oceanic convection in the south-east Labrador Sea. Geophys. Res. Lett. 35(6), L06601, doi: 10.1029/2007GL032971.
39. Våge, K., Pickart, R.S., Thierry, V., Reverdin, G., Lee,
C.M., Petrie, B., Agnew, T.A., Wong, A., & Ribergaard, M.H. (2009). Surprising return of deep convection to the subpolar North Atlantic Ocean in winter 2007–2008. Nature Geosci. 2, 67–72, doi: 10.1038/NGEO382.
40. Bryden, H.L., Longworth, R. & Cunningham, S.A.
(2005). Slowing of the Atlantic meridional overturning circulation at 25°N. Nature 438, 655–657, doi:10.1038/nature04385.
41. Lebedev, K.V., Yoshinari, H., Maximenko, N.A. &
Hacker, P.W. (2007). YoMaHa’07: Velocity data assessed from trajectories of Argo floats at parking level and at the sea surface, IPRC Technical Note No.4(2), June 12, 2007, 16 p.
42. van Wijk, E., Riser, S., Rintoul, S., Speer, K., Klatt, O.,
Boebel, O., Owens, B., Gascard, J.-C., Freeland, H., Wijffels, S., Roemmich, D. (2009). Observing High Latitudes: extending the core Argo array. Poster display at OceanObs’09.
43. Vinayachandran, P.N. (2004). Summer cooling of the
Arabian Sea during contrasting monsoons. Geophys. Res. Lett. 31, L13306, doi:10.1029/2004GL019961.
44. Joseph, S. & Freeland, H.J. (2005). Salinity variability in
the Arabian Sea. Geophys. Res. Lett. 32(9), L09607 10.1029/2005GL022972.
45. Anitha, G., Ravichandran, M. & Sayanna, R. (2008).
Surface buoyancy flux in the Bay of Bengal and Arabian Sea. Ann. Geophysicae 26(3), 395–400.
46. Rao A.D., Joshi, M. & Ravichandran, M. (2009).
Observed low-salinity plume off Gulf of Khambhat, India, during post-monsoon period. Geophys. Res. Lett. 36, L03605.
47. Bhaskar, T.V.S.U., Swain, D. & Ravichandran, M.
(2006). Inferring mixed-layer depth variability from Argo observations in the western Indian Ocean. J. Mar. Res. 64(3): 393–406.
48. Vinayachandran, P.N. & Saji, N.H. (2008). Mechanisms
of South Indian Ocean intraseasonal cooling. Geophys. Res. Lett. 35(23), L23607.
49. Oka, E. (2009). Seasonal and interannual variation of
North Pacific Subtropical Mode Water in 2003–2006. J. Oceanogr. 65(2), 151–164.
50. Qiu, B. & Chen, S. (2005). Eddy-induced heat transport
in the subtropical North Pacific from Argo, TMI,
and altimetry measurements. J. Phys. Oceanogr. 35(4): 458–473.
51. Liu, Z., Xu, J.P., Zhu, B.K., Sun, C.H. & Zhang, L.F.
(2006). Upper ocean response to the tropical cyclones in the northwestern Pacific by Argo data. Chinese J. Oceanol. Limnol. 25(2), 123–131.
52. Cummins, P.F. & Freeland, H.J. (2007). Variability of
the North Pacific Current and its bifurcation. Prog. Oceanogr. 75, 253–265.
53. Batten, S.D. & Freeland, H.J. (2007). Plankton
populations at the bifurcation of the North Pacific Current. Fish. Oceanogr. 16(6), 536–546.
54. She, X.Q., Fan, W., Chen, X.D., Cui, X.S. & Zhang, J.
(2006). Application of Argo floats datum to analysis longline bigeye tuna fishing grounds in the eastern and central Pacific Ocean. Collection of Argo Application papers, China Ocean Press, Beijing, pp. 215–223 (in Chinese, abstract in English).
55. Yang, S.L., Zhou, S.F., Wu, Y.M. & Cui, X.S. (2009). The relationship between jack mackerel fishing grounds and subsurface temperature and surface salinity outside Chile, based on Argo data. A paper presented at the Third Argo Science Workshop, Hangzhou, China.
56. Irvine, J. & Crawford, B. (2008). State of physical,
biological, and selected fishery resources of Pacific Canadian marine ecosystems. Canadian Science Advisory Secretariat, Res. Doc. 2008-013, http://www.dfo-mpo.gc.ca/csas/Csas/Publications/ ResDocs-DocRech/2008/2008_013_e.htm
57. Cronin, M., Bond, N., Booth, J., Ichikawa, H., Joyce, T.,
Kelly, K., Kubota, M., Qiu, B., Reason, C., Sabine, C., Suga, T., Talley, L., Thompson, L. & Weller, R. (2009). Monitoring ocean–atmosphere interactions in western boundary current extensions. Community white paper at OceanObs’09.
58. Bell, M., Le Traon, P.Y., Smith, N., Lefèbvre, M. &
Wilmer-Becker, K. (2009). GODAE, The Global Ocean Data Assimilation Experiment. Oceanogr. Magazine 22(3), 22-33.
59. Oke, P., Balmaseda, M.A., Benkiran, M., Cummings,
J.A., Dombrowsky, E., Fujii, Y., Guinehut, S., Larnicol, G., Le Traon, P.-Y. & Martin, M.J. (2009). Observing system evaluations using GODAE systems. Oceanogr. Magazine 22(3), 144-153.
60. Balmaseda, M.A., Anderson, D. & Vidard, A. (2007).
Impact of Argo on analyses of the global ocean. Geophys. Res. Lett. 34, L16605, doi:10.1029/2007 GL030452.
61. Fujii, Y., Yasuda, T., Matsumoto, S., Kamachi, M. &
Ando, K. (2008). Observing System Evaluation
(OSE) using the El Niño forecasting system in Japan Meteorological Agency. Proceedings of the Oceanographic Society of Japan fall meeting (in Japanese).
62. Klatt, O., Boebel, O. & Fahrbach, E. (2007). A
profiling float’s sense of ice. J. Atmos. Ocean. Technol. 24(7), 1301–1308.
63. Poulain, P., Barbanti, R., Font, J., Cruzado, A., Millot,
C., Gertman, I., Griffa, A. Molcard, A., Rupolo, V., LeBras, S. & Petit de la Villeon, L. (2007). MedArgo: a drifing profiler program in the Mediterranean Sea. Ocean Sci. 3, 379–395.
64. Yashayaev, I. (2007). Hydrographic changes in the
Labrador Sea, 1960–2005. Prog. Oceanogr. 73, 242–276.
65. Park, J., Kim, K., King, B. & Riser, S. (2005). An
advanced method to estimate deep currents from profiling floats. J. Atmos. Ocean. Technol. 22, 1294–1304.
66. Riser, S. & Johnson, K. (2008). Net production of
oxygen in the subtropical ocean. Nature 451, 323–325.
67. Boss, E., Swift, D., Taylor, L., Brickley, P., Zaneveld,
R., Riser, S., Perry, M. & Strutton, P. (2008). Observations of pigment and particle distributions in the western N. Atlantic from an autonomous float and ocean color satellite. Limnology and Oceanography, 53(5), 2112–2122.
68. Riser, S., Ren, L. & Wong, A. (2008). Salinity in Argo:
a modern view of a changing ocean. Oceanography 21(1), 56–67.