argumentation manganese ore prices export 2012
TRANSCRIPT

Argumentation Mn ore prices
export 2012 [ Leniuc Vasile : [email protected]]
1.= USGS (U.S. Geological Survey ) USA
a.= Mineral Industry Surveys U.S. Department of the Interior July2012 www.minerals.usgs.gov/minerals
b.= Mineral Commodity Summaries, January 2012Prepared byLisa A.Corathers, [email protected]
2007 2008 2009 2010 2011
8Cost and freight (CNF) represents the costs paid by a seller to ship manganese ore by sea to a Chinese port; excludes insurance

c.= Mineral Industry Surveys MANGANESE IN APRIL 2012 http://minerals.usgs.gov/minerals
2.= RAYAN’S NOTES USA Ferrous and Nonferrous News and Prices Vol.18 Nr.31 august 6,2012
Price SpecificationsManganese: RN NA transaction, electrolytic metal—99.9% Mn, flake, f.o.b. producing point or Chicago/Pittsburgh warehouse, ¢per lb.
Manganese Ore, RN 44% and 46% Mn, US $ per 1% Mn unit, CNF China, max. 0.1%P. RN 36-39% Mn ore—$ per 1% Mn, c&f China.
RYAN’S NOTES August 06.2012 Prices E-Mail: [email protected]
ITEM Units Tuesday
Jul.31
Friday
Aug.3
Week
Avg
4-Week
Avg
6-Week
Avg
Electrolitic Metal c/lb 150 158 150 155 150.000 150.000 150.000
RN 44% Mn Ore $/MnU 4.9 5.10 4.90 5.10 4.900 4.900 4.904
RN 48% Mn Ore $/MnU 5.00 5.15 5.00 5.15 5.000 5.000 5.013
RN 36-39% Mn Ore $/MnU 4.50 4.60 4.50 4.60 4.500 4.500 4.508

RYAN’S NOTES July-2012 Prices
Units Low Mid High
RYAN’S NOTES June-2012 Prices
Units Low Mid High
3.= MOIL (MANGANESE ORE (INDIA) LIMTED) INDIA
a.= moil.nic.in/Marketing.html Ferro Grade Ore, SM Grade Ore (Mn 30%), SM Grade Ore (Mn 25%), SM Grade Ore (Mn 20%), Chemical Grade Ore and Fines
1USD = 55.3653Rs
b.= MOIL jumps on hiking prices of manganese ore by 12.5% to 15%
Date: 03-07-2012
MOIL, country’s largest manganese miner, has increased prices of different grades of manganese ore in the range of 12.5% to 15% for the quarter July-September 2012 period. This hike is in line with the company’s business practice of quarterly revising the prices of manganese ore.

Recently, the company had received letters from Government of India, Ministry of Mines, informing, grant of prospecting license for 597.44 hectors land out of reserved area of 814.71 hectors, for the purpose of exploring, locating or proving ore reserve.
MOIL is the largest iron ore company in India and fifth largest in world. It currently operates seven underground mines (Kandri, Munsar, Beldongri, Gumgaon, Chikla, Balaghat and Ukwa mines) and three opencast mines (Dongri Buzurg, Sitapatore/Sukli, and Tirodi). The company is actively involved in exploration and development activities with a view to increase its proven manganese ore reserves.
4.= THE REPORT OF THE “EXPERT GROUP” FOR IRON ORE, MANGANESE ORE AND CHROME ORE Ministry of Steel INDIA
In view of the occurrence and accumulation of large proportions of low grade Manganese ore in the Eastern sector, more effective measures need to be implemented to undertake beneficiation to improve Mn grade. The State Department of Mining & Geology, in consultation with IBM and RRL should promote commercial scale beneficiationprojects, taking advantage of pilot plant ore dressing tests conducted by IBM & RRL over the years.

5.= Macquarie Research Commodities Compendium 2012 www.macquarie.com.au/disclosures
Mn ore prices fall heavily and remain under pressureHowever, there are a number of new projects and expansions currently under development in Western and South Africa. It should be acknowledged that lack of infrastructure will act as a constraint on the amount of new supply that can be brought to market, probably for several years yet. Nonetheless, we think the market for Mn ore as a whole will remain well supplied in the coming years, moderating upside price potential, although within this the market for medium-to-high grade ore (of which only three companies control ~85%) could become quite tight, potentially supporting a rising premium for this material.
6.= FERROALLOYNET.com CHINA
a.= China's import manganese ore CIF price in Jan-May 2012 Fri, 01 Jun 2012
URL: http://www.ferroalloynet.com/article/chinas_import_manganese_ore_cif_price_in_janmay_2012.html

b.= China: manganese ore spot price in Jan-May 2012 Fri, 01 Jun 2012
URL: http://www.ferroalloynet.com/article/china_manganese_ore_spot_price_in_janmay_2012.html
c.= International manganese ore market price by origin on 7 July 2011 (not diff.2012)
URL: http://www.ferroalloynet.com/price/international_manganese_ore_market_price_by_origin_on_7_july_2011.html
Item Specification Price (USD/dmtu) Remark
Brazil lumpy manganese ore Mn=45% Fe<5% P<0.1 5.4-5.5 CIF China
Brazil lumpy manganese ore Mn=38-40% P<0.1 4.8-4.9 CIF China
Australia lumpy manganese ore Mn=44-45% Fe<5% P<0.1 5.3-5.4 CIF China
Australia lumpy manganese ore Mn=45.5-46% 5.5-5.6 CIF China
Australia particle manganese ore Mn4=8-49% Fe<5% P<0.1 5.4-5.5 CIF China
Australia lumpy manganese oreMn=37-38% Fe<5% SiO2>20% P<0.1
4.9-5.0 CIF China
South Africa lumpy manganese ore Mn=42% Fe=10% 4.85-4.9 CIF China

South Africa lumpy manganese ore Mn=38% Fe=5% P<0.1 5.0-5.1 CIF China
South Africa lumpy manganese ore Mn=44% Fe=5% P<0.1 5.5-5.6 CIF China
South Africa lumpy manganese ore Mn=32-33% Fe=20-22% 5.0-5.1 CIF China
Gabon manganese ore particle Mn=43% 5.0-5.1 CIF China
Gabon lumpy manganese ore Mn=44% Fe<5% 5.3-5.4 CIF China
Gabon lumpy manganese ore Mn=48% Fe<5% 5.6-5.7 CIF China
Indonesia lumpy manganese ore Mn=44-45% Fe<5% P<0.1 5.5-5.6 CIF China
Indonesia lumpy manganese ore Mn>50% Fe<5% P<0.1 6.1-6.3 CIF China
Philippine lumpy manganese ore Mn=42-44% 4.7-4.8 CIF China
Zambia lumpy manganese ore Mn>50% Fe<3% P<0.1 6.2-6.4 CIF China
Malaysia lumpy manganese oreMn=35-36% Fe=10-12%P=0.15-0.18%
4.1-4.2 CIF China
Turkey lumpy manganese ore Mn=40-42% Fe<5% 5.0-5.1 CIF China
Turkey lumpy manganese ore Mn=42-44% Fe<5% 5.3-5.4 CIF China
7= STEELGURU.com CHINA www.steelguru.com
Manganese ore prices for January 2012 shipments to China
According to an informed source of the industry in China, prices for manganese ore to be shipped to China during January 2012 by one of the big ore suppliers were revised as follows (all on CIF basis):
GEMCO Lumps (Mn 46%): USD 4.75 per dmtu, down by USD 0.75 per dmtu from USD 5.50 per dmtu
Metallurgical Fines (Mn 48%): USD 4.30/dmtu, down from USD 5.40/dmtu
Mamatwan Lumps (Mn 38%): USD 4.10/dmtu down from USD 4.80 per dmtu.
The prices had been unchanged since July 2011, for six months until December 2011.
(Sourced from TEX Report Limited)
8.= METAL PAGES.com CHINA: trend of prices 2012

9.= The Third Manganese Products Summit(2012) May 30-31st 2012, Longchamp Garden Hotel ,Changsha, China
10.= Asian Metal Ltd. CHINA

Chinese manganese ore market imported prices by origin 2011
Origin Item Spec Price Unit Basis
Brazil Mn Lump 45%min 5.5-5.6 USD/dmtu CIF China
Australia Mn Lump 44%min 5.3-5.4 USD/dmtu CIF China
Australia Mn Lump 48%min 5.4-5.5 USD/dmtu CIF China
Gabon Mn Lump 48%min 5.6-5.7 USD/dmtu CIF China
South Africa Mn Lump 45%min (Fe 10%max) 5.9-6.1 USD/dmtu CIF China
South Africa Mn Size 38%min (Fe 5%max) 4.8-5.0 USD/dmtu CIF China
South Africa Mn Lump 30-35% (Fe 15-20%) 170-180 USD/mt CIF China
Turkey Mn lump 45%min 5.5-5.7 USD/dmtu CIF China
Zambia Mn lump 50% 6.2-6.4 USD/dmtu CIF China
Indonesia Mn lump 45%min 5.2-5.4 USD/dmtu CIF China
Malaysia Mn Lump 35% 140-150 USD/mt CIF China
Item Specification Unit Price Update

Manganese Ore Australian 43-44% China RMB/mtu 44.0-45.0 2011-07-06
Manganese Ore 40% EXW India INR/mt 11600-12000 2011-07-06
Manganese Ore 44% FOB Brazil USD/mt 205-215 2011-07-06
11.= Phillip Securities Research Ltd Hong Kong : CITIC Damen-Rating Speculative Buy for Unoptimistic Industrial Outlook2010 www.poems.com.hk
CITIC Dameng is the largest manganese manufacturer in China and mainly engaged in exploration, extraction and processing of manganese. The Company has abundant reserve of manganese ore,accounting for over 20% of domestic market and has also manganese mines in Gabon (Africa)
The grade of Gabon manganese ore is 50% maybe to blended ore with manganese low ore of China . High-grade manganese ores are extracted mainly in Australia, South Africa and Gabon; low-grade manganese ores are extracted mainly in China, Ukraine and India, that in China is even lower.

12.= SMM- Shanghai Metals Market Website: http://en.smm.cn
a.=China Domestic Manganese Ore— How does it impact China manganese industry?June 2010
SMM publishes the "Shanghai Nonferrous Metals Price Index (SMMI)"everyday, which is the benchmark price on the spot market, and reflects the overall situation of the industry.


b.= China Manganese Ore Industry Report 2011

Supply of manganese ore grading above 30% is scarce in China, as reserves of rich manganese ore meeting international standards is very limited. It is reported that poor manganese ore reserves account for 94.6% of China's total manganese ore reserves.
CNY Base Rate
100 units of foreign currencies in CNY (2012-06-01)
USD 633.08 HKD 81.55100JPY 806.86 EUR 781.51GBP 974.18
Manganese Prices in Major Markets
Regions Prices Average DateGuangxi 14,700 - 14,900 14,800 Jun 01Hunan 14,700 - 14,800 14,750 Jun 01Guizhou 14,700 - 14,800 14,750 Jun 01Chongqing 14,700 - 14,900 14,800 Jun 01Export Price(FOB) 3,000 - 3,050 3,025 Jun 01Shanghai 15,300 - 15,400 15,350 Jun 01

Offers from Domestic Major Producing Regions 14,700 - 14,800 14,750 Jun 0113.= SteelOrbis www.steelorbis.com
Manganese ore prices in local Chinese market Thursday, 17 March 2011 12:04:33 (GMT+2)
Specification Place of Origin Free on Truck atPrice
(RMB/mt)Price($/mt)
Mn>44% (lump) Australia Zhanjiang Port 2,288 348
Mn>46% (lump) Gabon Zhanjiang Port 2,392 364
Mn>45% (medium-sized)
Brazil Lianyungang Port2,295 349
- Average - 2,325 354
Mn>25% Chaoyang, Liaoning Province
-1,220 186
Mn>30%Guiling, Guangxi Province
-1,000 152
Mn>30%Xiangtan, Hunan Province
- 960146
Average - 1,060 161
13 percent VAT is included in all prices. $1 = RMB 6.57
14.= CPM Group USA Manganese Market Outlook February 2012 www.cpmgroup.com


15.= International Manganese Institute (IMnI)
a.= Global Manganese 2011 Mark CamajMarket Analyst, IMnI April 2011 IMnI’s 8thEPD Conference
b.= Manganese Industry: Scenarios for 2025 IMnI Conference Jun/2006 Presented byLuis Carlos Nepomuceno –CVRD Brazilia

c.= Annual Market Research Report 2010 public report


16.= The classification of manganese ore 28 Dec 2010 Alibaba.com
A.= Ore are many ways divided
1.= by type of ore genesis : sedimentary, metamorphic, weathering type and other ores
2.= by the iron ore : manganese ore and ferromanganese
3.= by industrial uses : metallurgical manganese and chemical manganese
B.= In recent years, domestic and industrial mineral properties in order to propose a new classification based on. In addition, there is a natural mineral type and by associated elements contained into :
1.= carbonate manganese ore ore is contained manganese carbonate material in a variety of forms exist Mn
2.= manganese ore oxide ore refers to the existence of various form of manganese oxide minerals of Mn
3.= mixed refers to a variety of carbonate manganese ore or manganese oxide minerals of Mn present form
4.= multi-metal ore minerals manganese mineral from the same type in terms of its manganese ore in the first three types, the main features of physical things, except Mn containing other metals and non-metallic minerals
17.= LAPLACE CONSEIL www.laplaceconseil.com
Manganese specific consumption is stabilizing at 8 kg/ton of steel

18.= Xrossbridge Ventures Inc.Mining Analyst Q&A for Manganese Gavin Treanor, Mining Researcher
The key principal properties of manganese are its abilities to:i. Control the morphology of sulphides in steelii. Act as a deoxidizeriii. Combine with and remove sulfur from ironiv. Toughness and hardness as an alloying elementv. Act as a depolarizer
Are we really moving to an environment where low-grade ore bodies can be economic?i. With the price of other previous substitute metals (Nickel, Chrome etc.)which have driven the cost of manganese flake to over USD$4,500/ton these historic uneconomic manganese ore bodies are now economical viable for production.
Pricinga) How is manganese priced?i. Through brokers and quarterly contracts there is no London Metal Exchange type index for manganese

b) What are the market sources of pricing information for all forms of manganese final saleable products including ferro?ii. Direct, Internet or metal broker.
19.= Metallurgical and Mining Industry, 2010, Vol. 2, No. 1 Quality export manganese ore

20.= AFRICAN DEVELOPMENT BANK GROUP www.afdb.org
MANGANESE INDUSTRY ANALYSIS: IMPLICATIONS FOR PROJECT FINANCE 2011
Figure 10 shows that correlation between manganese ore prices and the prices of steel productshas been equally strong historically

The outlook of the steel industry is critical for manganese for three reasons : First, at least 90% of manganese produced is used in steel production. Second, there is no suitable substitute for manganese in steel production. Third, the presence of vertical integration in the manganese value chain means that the leading steel firms are directly involved in manganese production.
Consequently, world demand for manganese and ferroalloy products depends directly on the
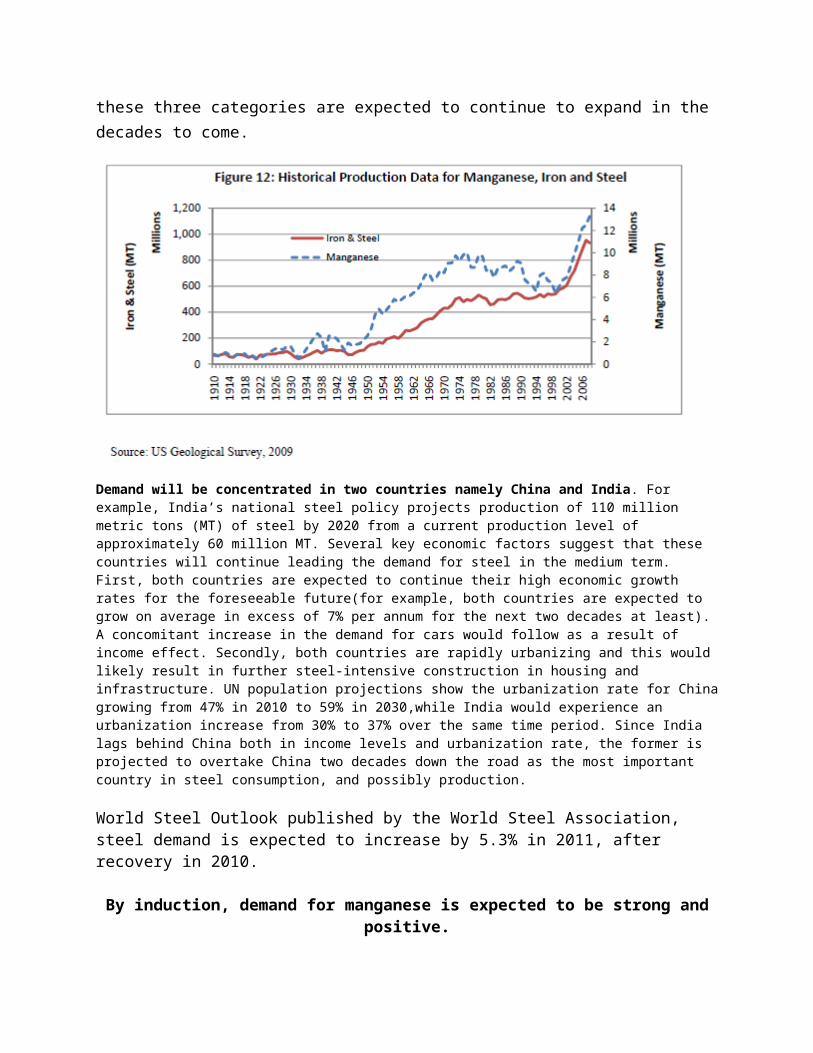
outlook of the steel industry.As discussed above, and in figure 12 below, growth in the production of steel should have apositive effect on demand (hence prices) of manganese. Global demand for steel is driven in turnby housing construction, the automobile industry and general infrastructural constructions. Due to the positive average annual economic growth and increasing industrialization globally, allthese three categories are expected to continue to expand in the decades to come.

Demand will be concentrated in two countries namely China and India. For example, India’s national steel policy projects production of 110 million metric tons (MT) of steel by 2020 from a current production level of approximately 60 million MT. Several key economic factors suggest that these countries will continue leading the demand for steel in the medium term. First, both countries are expected to continue their high economic growth rates for the foreseeable future(for example, both countries are expected to grow on average in excess of 7% per annum for the next two decades at least). A concomitant increase in the demand for cars would follow as a result of income effect. Secondly, both countries are rapidly urbanizing and this would likely result in further steel-intensive construction in housing and infrastructure. UN population projections show the urbanization rate for China growing from 47% in 2010 to 59% in 2030,while India would experience an urbanization increase from 30% to 37% over the same time period. Since India lags behind China both in income levels and urbanization rate, the former isprojected to overtake China two decades down the road as the most important country in steel consumption, and possibly production.
World Steel Outlook published by the World Steel Association, steel demand is expected to increase by 5.3% in 2011, after recovery in 2010.
By induction, demand for manganese is expected to be strong and positive.

Iron ore prices are expected to fall over time (figure14), due partly to supply side factors including over-production, and demand side factors such as the expected pressure from Chinese steel companies on major iron ore producers to lower prices.The lower prices should support the production growth projected for steel.
Funding for :

The two manganese mining projects in the sample reviewed include the Cupixi manganeseproject, a USD 1.3 billion transaction sponsored by International Gold Resources Inc (IGR) in2007 in Brazil. The datasets reviewed unfortunately do not reveal the sources of the bulk of thefinancing, other than the USD 1.3 million sourced through a private placement. The secondmanganese mining transaction, Bootu Creek project in Australia (2005), was a USD 37.6 millionwhose financiers were also not disclosed.
Whereas iron ore is a traded metal for which a futures market and hedging instruments exist,

manganese is neither publicly traded nor does it have a similar range of hedging instruments. Tothe extent that companies can hedge their risk in manganese transactions, this is mostly limited toforeign currency hedging for transnational transactions. The need for hedging against price riskis substantial given the high price volatility of manganese products . Prices of different types of manganese ore are observed to be cyclical, with a fairly large coefficient of variation.
Specifically,the coefficient of variation (the ratio of standard deviation over mean) of manganese prices between 1998 and 2008 was 100%.
For these reasons, market risk for manganese mining projects is considered high.
Four out of the top five alloy producing companies are also the world’s largest producers of manganese ore. These companies account for about half of the World’s output of manganese alloys. This phenomenon persists, albeit less strongly, as we go downstream. Nippon Steel, one of the world’s largest steel producing companies, was createdthrough a merger of an iron ore company and a steel company. The world’s current largest steel producer, Arcelormittal has acquired iron ore companies such as Baffinland Iron of Canada in 2010 and has acquired a 50% stake in Kalagadi Manganese of South Africa. Tata Steel, another major steel company, owns several mines in India that produce both iron and manganese ores.
Although these corporate consolidations help mitigate risk for producers, they also have theadded effect of reducing transparency and competition in the pricing of inputs into steelproduction. The result is that while consolidation may have reduced the production risk for steelcompanies, it has made financing riskier for commercial lenders. Commercial lenders need sufficient information to help forecast prices and reduce uncertainty through hedging instruments to provide them with comfort to take part in financing transactions.

And this perceived risk by commercial lenders is unlikely to be mitigated by the correlation between steel and manganese prices. For one reason, the extent of the correlation tends to be weaker
over short time horizons.Furthermore, the price correlation is not some manifestation of an immutable economic law, anddivergences from the long term trend have been observed introducing uncertainty with regards to when a weakening of the correlation might arise.
The implications for manganese project finance may be, quite plausibly, lower levels of interest from risk-averse commercial
lenders relative to the high private finance appetite observed for the iron ore sector.
Five manganese producers operate in the South African market: Samancor Manganese (BHP Billiton), Assmang Limited, Kalagadi Manganese, Tshipi Manganese and United Manganese of Kalahari (UMK). Samancor Manganese and Assmang Limited are the major players. BHP Billiton4 is the world’s largest manganese producer while Assmang Limited is fourth. Until recently, these two companies accounted for 100% of South Africa manganese production. Samancor’s production feed mostly its parents company’s alloy production in Australia while the largest markets for Assmang Limited are steel and alloy producers in the US, Europe and Asia. Both have traditionally used on-balance sheet financing to cover production and capital expansion costs.
The other three companies are poised to enter the market, and have either recently closed, or are in the process of closing, their financing plans. All three companies are majority-owned by historically disadvantaged South Africans, and qualify as BBBEE firms. The owners with major stakes in Kalagadi Manganese, Tshipi Manganese and UMK are Kalahari Resources,Ntsimbintle Mining Limited and Chancellor House respectively. As of early 2011, both Kalagadi Manganese and Tshipi Manganese were at advanced stages of mine development, but yet to start to manganese production. Understanding the characteristics of these firms and their interaction with the financial market would provide some insight into the need for DFI funding.
In conclusion, the manganese market can best be understood in the context of its broader valuechain, which included elements from the iron group of metals and steel. The assessment showsstrong long term correlations in production and price trends for these industries, as well assubstantial vertical integration of the value chain, especially in the upstream ores and alloysindustries.
Specific differences between the iron ore or steel markets relative to the manganese market areworth noting.

First, whereas both iron ore and steel are publicly traded metals for which hedging instruments exist, manganese is not. Second, price volatility is higher for high-value manganese products than for either iron ore or steel.
For these reasons, market risk for manganese mining projects is considered higher
Manganese prices have shifted lower slightly, yet have remained stable alongside other metals used in steel alloys. The price of manganese is a good barometer for the health of an economy primarily because of its use in steel, a prime component of infrastructure projects and other consumer products such as automobiles. Tensions remain high about the direction of the global economy, and the demand for steel going forward, explaining in part why the market seems to be in a holding pattern. While manganese prices have moved lower as a whole, prices have improved for high-grade manganese primarily from Australia and South Africa imported into China.
Increasing use of Li-ion and NiMh batteries for consumer, electric vehicle and storage battery applications will see manganese consumption in this area rise to approximately 60kt by 2020.
In response to rising demand, manganese production will increase in the coming years, having recovered from the market downturn in 2009. New capacity in traditional producing countries, such as South Africa, Australia and China will see output of manganese ore, ferroalloys and EMM rise in the coming years as new projects enter the market to meet growing requirements.Although supply is expected to increase in the coming years, power restrictions and industry restructuring will add some upward pressure to prices. Manganese ore prices are expected to

remain stable, with some occasional spikes. Ferromanganese prices are likely to increase slightly faster than silicomanganese, reflecting faster expansion of the flat steel products market.
Reflecting these conditions, manganese prices could be 20-30% higher in five years time from end-2011 levels.
21.= Ideas Research 1st Manganese may 2010 www.ideasfirst.in
a.=
b.=
“The Global Manganese Market Will Exceed 21.9 Million Tons By 2015.The overall manganese ore industry is growing at about 8% per year and electrolytic manganese demand has been growing at 26%
each year for the last five—that shows the huge growing demand for it”.
Ken Reser, a research and investments consultant,independent
Conclusions :
Prices for manganese ores :
a.=Manganese carbonate (selected) with min.25%Mn : 3$ /1%Mn when RN36-39% prices is 4.50 $/1%
Mn,that means : FCA 75 USD/wmt [ +/- 0.75 USD for each 1% Mn (+/-)],at this basis to recalculated unitary value to average RN month delivery

b.=Manganese ore,oxide type with min.20%Mn : 2$ /1%Mn when RN 36-39% prices is 4.50 $/1% Mn,that
means : FCA 40 USD/wmt [+/- 0.40 USD for each 1% Mn (+/-)],at this basis to recalculated unitary value to average RN month delivery
* This is Summary of a market study for low manganese ore and a technical documentation for Mn uses
Contact :
eng.Leniuc Vasile
tf.mobil : 040375100626
725700 Vatra Dornei
Podul Verde street No.5A
Romania