arguments for measuring a unique and … · arguments for measuring a unique and complex food -...
TRANSCRIPT

1
Dr Julie P SmithAssociate Professor, ARC Future Fellow, Australian National Universityhttps://researchers.anu.edu.au/researchers/[email protected]
ARGUMENTS FOR MEASURING A
UNIQUE AND COMPLEX FOOD -
HUMAN MILK - IN GDP
IARIW-Bank of Korea Conference “Beyond GDP: Experiences and Challenges in the
measurement of Economic Well-being,” Westin Hotel, Seoul, Korea, April 26-28, 2017.Session 3A National Accounts and Well Being 26 April 2017 15.30-15.45

S-S-F Commission review
“There is a serious omission in the valuation of home-
produced goods – the value of breast milk. This is
clearly within the System of National Accounts
production boundary, is quantitatively non-trivial and
also has important implications for public policy and
child and maternal health.”
Stiglitz, J.E., Sen, A., and Fitoussi, J.-P. (2009) The measurement of economic performance and social
progress revisited; Reflections and overview, Centre de recherche en économie de Sciences Po (OFCE).


Time inputs to non-market production
Copyright: UN Women/Neelabh Banerjee

Non-market food production

Non market production of health care and nurture
Infectious illness in child
Later life chronic disease risk
Child development – physical and mental
Maternal reproductive health and mental health and later life
chronic disease risk

Defensive expenditures of breastmilk substitutes
Environmental
remediation expenditures• Pollution
• Waste
Health care expenditures• Child
• Mother
Attributable costs of dairy production
and milk formula product use
Tamara Kenneally

Human capital stock and breastfeeding
Higher cost of time inputs
Higher rate of return
• Lifetime health and chronic disease & obesity risk reduction
for child
• Reproductive health and chronic disease risk reduction for
mother
• Child development, educational attainment and later life
earnings and labour force productivity

Philippines artist Jonahmar Salvosa
Environmental asset depletion and
breastmilk substitutes

Global breastfeeding trends
Victora, C. G., R. Bahl, A. J. D. Barros, et al., 2016, Breastfeeding in the 21st century: epidemiology, mechanisms, and lifelong effect.
The Lancet 387 January 30, 2016: 475–90.
Stagnation in exclusive
breastfeeding < 6 months
Declines in continued
breastfeeding to 12-15
months
Growing social inequality in
breastfeeding access

Global sales trends of breastmilk substitutes
Baker P, Smith J, Salmon L, Friel S, Kent G, Iellamo A, JP Dadhich, Renfrew MJ. Global trends and patterns in commercial milk-
based formula consumption: is an unprecedented infant and young child feeding transition underway? Public Health Nutrition
2016.
Rollins NC, Bhandari N, Hajeebhoy N, Horton S, Lutter CK, Martines JC, et al. Why invest, and what it will take to improve
breastfeeding practices? The Lancet 2016;387(10017):491-504

Time inputs into production
Mothers time investments in infant nutrition and
care
Smith, J. P., & Forrester, R. (2013). Who pays for the health benefits of exclusive breastfeeding? An analysis of
maternal time costs Journal of Human Lactation, 29(4), 547 - 555.
Smith JP, Forrester R. Maternal time use and nurturing; Analysis of the association between breastfeeding practice
and time spent interacting with baby ,Breast Feeding Medicine 2017 forthcoming.
mean weekly hours EBF Not EBF
Milk feeding* 18.2 11.6
Solids feeding** 0.1 2.5
Preparing feeds* 0.4 1.4
Total 18.7 15.4

Markets and prices
Market Price ($US per oz.) Location Comment/source
Human milk banks
HMBANA $3-$4.5(1) USA Currently there are 12 HMBANA member milk banks providing donor human milk in the United States and
Canada. HMBANA milk banks charge no fee for the actual milk, but charge a processing fee to offset the milk
bank‟s overhead costs. This fee ranges from US$3 to US$4.50 per ounce, plus shipping costs. Each milk bank
has the authority to determine the processing fee for its facility, which is the reason for the wide variation in price.
Norwegian milk banks $3.42 (US$100 per litre)(2) Norway 13 milk banks were operating in Norway in 2009, all located in hospitals with level 111 NICUs. All preterm infants
are offered donor milk if mothers' milk is unavailable or insufficient, and all infants who need milk from the milk
bank are offered it. Donors are given a free hospital grade breast pump, and US$20 per litre to cover electricity
and travel expenses, and donate for 6 months. At the main Oslo hospital where 2000 of the country‟s 60,000
annual births occur, the milk bank collects around 1000-1100 litres of human milk p.a. There is a charge of
US$100 for milk transferred to other hospitals.
Standardised human
milk formulations
US$35 (US$1183 per litre)(3) Prolacta products are for in hospital use only and the company does not supply or charge directly to parents for
Prolacta products. The cost is absorbed by the hospital or covered by medical insurance, where the infant is
prescribed human milk products. (4) The company‟s website explains its „co-promotion‟ arrangement with a major
formula manufacturer, Abbott Ross, which is involved in promoting and distributing these human milk products to
hospitals.
Human milk fortifier US$6.25/mL (US$6250 per
litre)(3)
USA
Internet milk exchange
Only the Breast US$1-$3(5)
UK$2-8(5)
Online Milk can be bought and sold, as well as shared (donated). Exchange is organised into various categories,
including by age of the infant, fresh (rather than shipped frozen), milk bank certified mother, milk bank screened
mother, bulk sales, local sales, fat babies, special diet (vegan etc). Site offers donor blood testing at US$219.45.
Also has trading from Canada, United Kingdom and elsewhere
Wet-nurse employment
Wet-nursing Daily rate between US$50 and
US$200 (2012 prices).(5)
US$1,000/week (2007 prices) (6)
USA Offered at between US$50 and US$200 per day. Also has trading from Canada, United Kingdom and elsewhere.
Equivalent to US$71-286 per litre at 700 ml daily intake.
Wet-nursing US$2585/month(7) China Chinese wet nurses earned up to 18,000 Yuan/month in 2008. Exchange to USD is based on 2008 exchange
rates. Equivalent to US$121 per litre at 700 ml daily intake
Smith, JP (2013 ) '"Lost Milk?" Counting the Economic Value of Breast Milk in Gross Domestic Product', J of Human Lactation 29(4): 537 -
546.
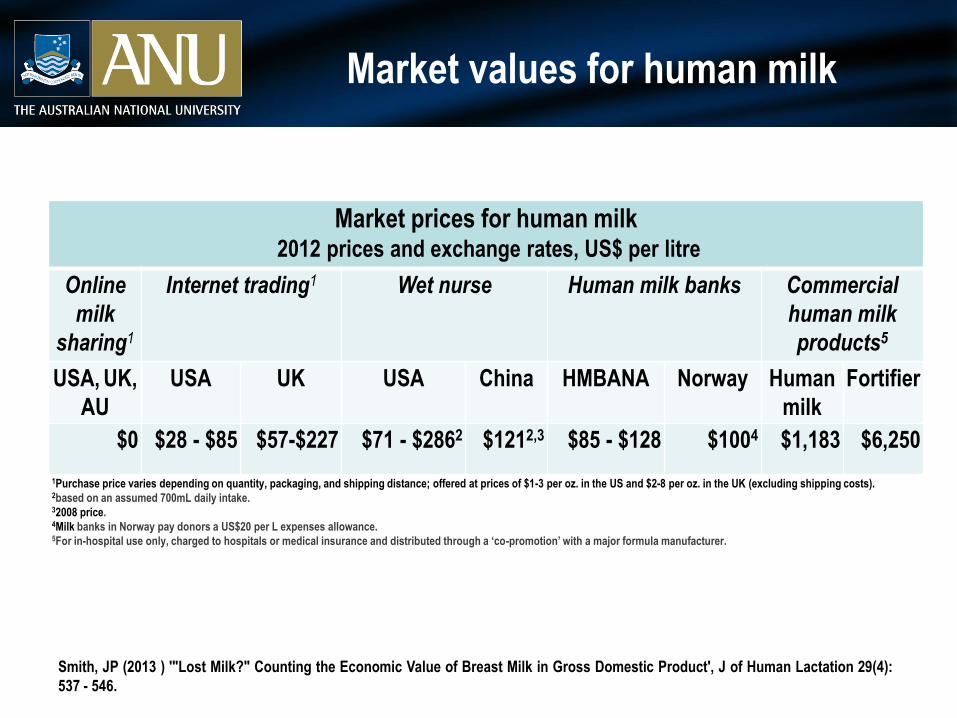
Market prices for human milk2012 prices and exchange rates, US$ per litre
Online
milk
sharing1
Internet trading1 Wet nurse Human milk banks Commercial
human milk
products5
USA, UK,
AU
USA UK USA China HMBANA Norway Human
milk
Fortifier
$0 $28 - $85 $57-$227 $71 - $2862 $1212,3 $85 - $128 $1004 $1,183 $6,250
1Purchase price varies depending on quantity, packaging, and shipping distance; offered at prices of $1-3 per oz. in the US and $2-8 per oz. in the UK (excluding shipping costs). 2based on an assumed 700mL daily intake. 32008 price.4Milk banks in Norway pay donors a US$20 per L expenses allowance. 5For in-hospital use only, charged to hospitals or medical insurance and distributed through a ‘co-promotion’ with a major formula manufacturer.
Market values for human milk
Smith, JP (2013 ) '"Lost Milk?" Counting the Economic Value of Breast Milk in Gross Domestic Product', J of Human Lactation 29(4):
537 - 546.

Emerging global trade and markets

Non-market food production
Smith JP, ‘Including household production in the System of National Accounts (SNA) – exploring the implications of breastfeeding
and human milk provision’ International Association for Research on Income and Wealth General Conference - August 5-11, 2012
2012; Boston, U.S.A.
Annual production of human milk, 2006-2010
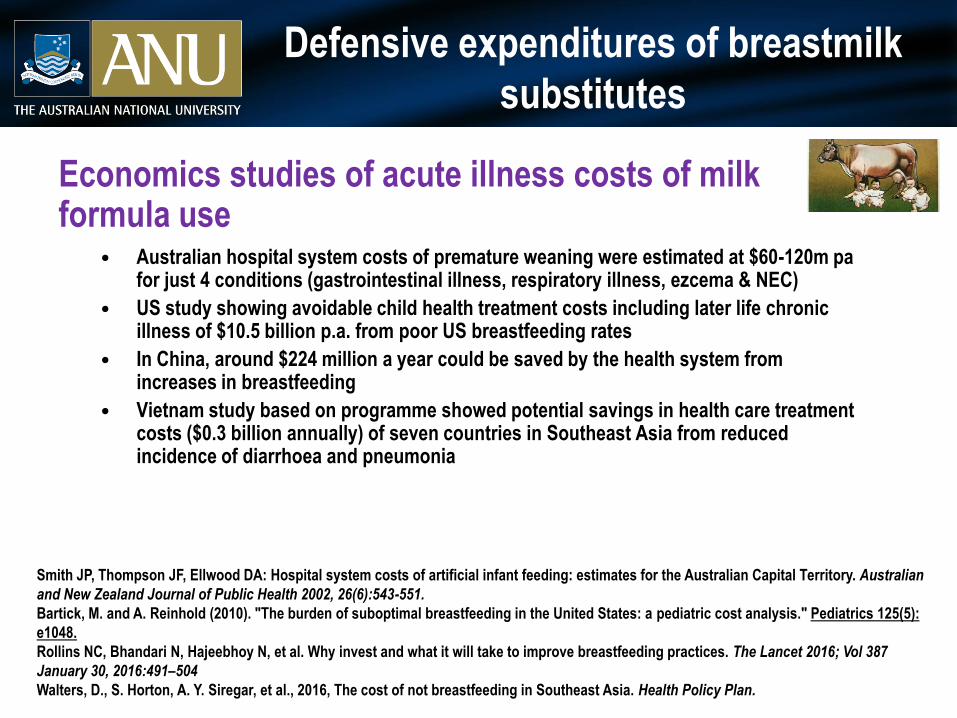
Defensive expenditures of breastmilk
substitutes
• Australian hospital system costs of premature weaning were estimated at $60-120m pa for just 4 conditions (gastrointestinal illness, respiratory illness, ezcema & NEC)
• US study showing avoidable child health treatment costs including later life chronic illness of $10.5 billion p.a. from poor US breastfeeding rates
• In China, around $224 million a year could be saved by the health system from increases in breastfeeding
• Vietnam study based on programme showed potential savings in health care treatment costs ($0.3 billion annually) of seven countries in Southeast Asia from reduced incidence of diarrhoea and pneumonia
Smith JP, Thompson JF, Ellwood DA: Hospital system costs of artificial infant feeding: estimates for the Australian Capital Territory. Australian
and New Zealand Journal of Public Health 2002, 26(6):543-551.
Bartick, M. and A. Reinhold (2010). "The burden of suboptimal breastfeeding in the United States: a pediatric cost analysis." Pediatrics 125(5):
e1048.
Rollins NC, Bhandari N, Hajeebhoy N, et al. Why invest and what it will take to improve breastfeeding practices. The Lancet 2016; Vol 387
January 30, 2016:491–504
Walters, D., S. Horton, A. Y. Siregar, et al., 2016, The cost of not breastfeeding in Southeast Asia. Health Policy Plan.
Economics studies of acute illness costs of milk formula use

Economic studies of chronic disease costs of milk
formula use Around 8-24% of current chronic disease cases in Australia are estimated to be
attributable to high formula feeding of infants in previous generations
US studies calculate the maternal health, morbidity and mortality costs of suboptimal breastfeeding to be more than $17 billion (78% maternal, medical $3 billion, premature death (myocardial infarction , breast cancer, diabetes; SIDS, necrotizing enterocolitis ) $14 billion, n = 3,340
UK study estimates health care system saving from increasing breastfeeding of £40 million per year including reductions in the costs of maternal breast cancer
Worldwide, at least 20,000 avoidable deaths from maternal breast-cancer
Smith JP, Harvey PJ: Chronic disease and infant nutrition: is it significant to public health? Public Health Nutrition 2011, 14(02):279-289.
Bartick MC, Schwarz EB, Green BD, Jegier BJ, Reinhold AG, Colaizy TT, Bogen DL, Schaefer AJ, Stuebe AM. Suboptimal breastfeeding in
the United States: Maternal and pediatric health outcomes and costs. Matern Child Nutr 2016. doi:10.1111/mcn.12366.
Renfrew MJ, Pokhrel S, Quigley M, McCormick F, Fox-Rushby J, Dodds R, Duffy S, Trueman P, Williams A: Preventing disease and saving
resources; the potential contribution of increasing breastfeeding rates in the UK: UNICEF UK; 2012.
Victora CG, Bahl R, Barros AJ, Franca GV, Horton S, Krasevec J, et al. Breastfeeding in the 21st century: epidemiology, mechanisms, and
lifelong effect. Lancet 2016;387(10017):475-90.
Defensive expenditures of breastmilk
substitutes

Breastfeeding as an economic investment
Hansen, K., 2015, The power of nutrition and the power of breastfeeding. Breastfeeding Medicine 10(8): 385-388.
Hansen, K., 2016, Breastfeeding: a smart investment in people and in economies. The Lancet Vol 387 January 30, 2016: 416.
Human capital stock and breastfeeding

Economic loss from cognitive deficits associated
with current infant feeding practicesa)
Country Economic loss, US$ billion, 2012 Economic loss as % of GNI b)
Norway 0.57 0.42
Australia 6.3 0.46
Philippines 0.73 0.31
United States 84.24 0.53
China 26.04 0.33
India 0.63 0.03
Rollins NC, Bhandari N, Hajeebhoy N, et al. Why invest and what it will take to improve breastfeeding practices. The
Lancet 2016; Vol 387 January 30, 2016:491–504
a) compared to all children receiving some breastmilk to up to age 6 months b) Gross National Income 2012

Environmental asset depletion
Dadhich J, Smith J, Iellemo A, Suleiman A. Report on Carbon Footprints Due to Milk Formula: A study
from select countries of Asia-Pacific region. New Delhi: BPNI/IBFAN Asia2015.
Greenhouse gas emissions (kg CO2 eq) associated with
milk formula, 2012, tonnes p.a.
Australia China India Malaysia Philippines South Korea Total
Milk formula - Total 31,742 2,249,287 111,227 218,149 204,304 78,321 2,893,030
Milk formula (0-6
months) 18,281 575,515 44,621 35,945 58,460 39,166 771,987
Follow up formula
(7-36 months) 13,461 1,673,772 66,606 182,204 145,844 39,155 2,121,042

Conclusion SNA is a social institutional framework which
contributes to globalizing cultural norms, policies and practices
The important reform agenda laid out by Waring’s critique of national accounting as ‘applied patriarchy’ remains largely unimplemented (175).
Current SNA provides for inclusion of human milk but only commercial milk formula is presently counted (122).
The invisibility of such household food production seriously distorts public policy priorities.
To make GDP more relevant and useful to collective human decisionmaking, use measures which include human milk, the care economy, defensive expenditure adjustments, and creation and depletion of human and environmental capital. • Use breastfeeding and human milk to exemplify
issues and links, and implications for gender equity and policy
Countries to develop experimental estimates within the System of National Accounts (SNA) using breastfeeding and human milk in GDP and wider SNA framework

Acknowlegements
Australian Research Council, Discovery Project
(2004-07) (DP0451117)
Australian Research Council, Future Fellowship
(2014-18) (FT140101260)
Lindy Ingham, Australian Bureau of Statistics
Mark Dunstone